Embed Size (px)
Citation preview

Can fluctuating
asymmetry in Talitrus
saltator (Montagu, 1808)
(Crustacea, Amphipoda)
populations be used as
a bioindicator of stress on
sandy beach ecosystems?
OCEANOLOGIA, 52 (2), 2010.pp. 259–280.
©C 2010, by Institute of
Oceanology PAS.
KEYWORDS
AmphipodaTalitrus saltatorDevelopment
Fluctuating asymmetrySandy beaches
Ottavio Ottaviano
Felicita Scapini
Department of Evolutionary Biology ‘Leo Pardi’,University of Florence,Via Romana 17, IT–50125 Florence, Italy;
e-mail: [email protected], [email protected]
Received 21 December 2009, revised 6 May 2010, accepted 11 May 2010.
Abstract
This study focused on verifying the fluctuating asymmetry hypothesis in thecrustacean Talitrus saltator, which lives in sandy beaches. We analysed threepopulations, one from an unpolluted Tuscan beach relatively free of tourism,and two from Sicilian beaches, which have been increasingly used for tourismand have been exposed to hydrocarbon/pesticide pollution. Results confirmedthe sexual dimorphism in the second antennae flagella, which in the Tuscanpopulation presented directional asymmetry. This population had a significantlevel of fluctuating asymmetry in the P6 and P3 meri. The results showed theimportance of the developmental stage during which environmental mechanicalstresses act.
1. Introduction
The aim of our research was to verify the fluctuating asymmetry hypo-thesis (Møller & Swaddle 1997) in the supralittoral amphipod Talitrus salta-tor (Montagu 1808) in order to postulate this population characteristic (inthe case of a verification of the hypothesis) as an indicator of environmentalstress on sandy beach ecosystems. Fluctuating asymmetry is defined atpopulation level as a random slight deviation of a morphological character
The complete text of the paper is available at http://www.iopan.gda.pl/oceanologia/

260 O. Ottaviano, F. Scapini
from perfect bilateral symmetry. Body asymmetry is measured through thedifferences between the right and left elements of bilateral characters of anorganism in a population sample. It is usually the result of the differentdevelopment of the two body sides of an individual. From a statisticalpoint of view, fluctuating asymmetry follows two rules: the values of thedifferences between the right (R) and left (L) body sides are (1) normallydistributed, and (2) have the mean around zero (as a certain number ofindividuals have a character more developed on one side of the body andthe same number of individuals have the same character more developedon the other side). The variance of the frequency distribution characterisesthe asymmetry level of each character. The analysis of statistical propertiesmakes it possible to distinguish fluctuating asymmetry from other kinds ofasymmetry, that is, directional asymmetry and antisymmetry (Figure 1,Palmer 1994). Directional asymmetry is observed when one side tendsto be more developed than the other one. In this case it is possible topredict which side of the character will be greater before its development.In directional asymmetry the values of the differences between the rightand left sides of the body are normally distributed, but with the meansignificantly different from zero. In directional asymmetry development pathdeviations are oriented towards a specific direction and genetically coded.Antisymmetry occurs when one side of a character is larger than the otherone, but there is no preference for one side. Therefore, it is not possible topredict which side will be larger. An example in crustaceans is the malefiddler crab (the genus Uca). These crabs begin their life with two largesignal claws, similarly developed. Developmental asymmetry is determinedby which of the two claws will first be damaged or lost. The damaged orlost claw will grow again, but will be small, like those of females. This willhappen in a random way, with 50% occurring on the right side and 50% onthe left; then there is a typical bimodal distribution (in the same samplethere are two groups of individuals which tend to develop claws in oppositeways) or a platycurtic (broad-peaked) distribution of the R-L difference
f
R-L
a
f
R-L
b0 0
f
R-L
c0
Figure 1. Three common frequency distributions of R-L (difference valuesbetween right and left body sides) in bilateral organisms: a) fluctuating asymmetry;b) directional asymmetry; c) antisymmetry (from Palmer 1994, modified)

Can fluctuating asymmetry in Talitrus saltator (Montagu, 1808) . . . 261
values around a mean of zero (Palmer & Strobeck 1986, Møller & Swaddle
1997). Møller & Swaddle’s (1997) hypothesis asserts that whenever, during
development, there are genetic or environmental stresses, asymmetries ofthe bilateral structure of an organism will occur. Among genetic stresses we
count mutations, a high degree of homozygosity, hybridisation that divides
coadapted gene sets, inbreeding, intense periods of directional selection; all
these phenomena interfere with the organism’s genomic balance, reducing its
ability to buffer random developmental mistakes that will eventually result
in body asymmetries. Environmental stresses, e.g. adverse temperatures,chemical pollution or food shortage, can further destabilise organisms during
sensitive phases of their development. Therefore, populations showing
different levels of fluctuating asymmetry are very likely subjected to different
degrees of stress. The bilateral characters of an individual are distinguished
in: 1) meristic characters, which are in a discrete quantity and can be
counted; asymmetry of these characters is usually suggestive of extremelyhigh levels of stress; 2) metric characters, i.e. distance measures between
two points of the body; metric characters are more sensitive indicators of
the developmental stability of an organism (Møller & Swaddle 1997).
We used the supralittoral amphipod Talitrus saltator, a common species
of sandy beach communities in the north-eastern Atlantic, southern Balticand Mediterranean, to test for the possible relation between fluctuat-
ing asymmetry and the degree of environmental stress acting on beach
ecosystems. The species has a number of characteristics that make it
a reliable model organism for this kind of research. First, its morphology
(bilateral symmetry and metameric organisation) is particularly well suited
to morphometric analyses (Barca-Bravo et al. 2008). Second, the species isrelatively widespread with abundant populations (Scapini & Morgan 2002).
Third, this species is robust enough to be found also in relatively polluted
and/or disturbed beach ecosystems; for this reason it cannot be considered
an indicator species of impact for its presence/absence, but differences
between local populations may reflect differences between beaches (Scapini
& Morgan 2002). Nevertheless, a reduction and/or disappearance ofT. saltator populations was documented from beaches where tourist pressure
was high (Węsławski et al. 2000). It was suggested that the dynamics of
T. saltator populations could be used as a bioindicator of environmental
stress caused by activities linked to tourism (Jędrzejczak 2004, Fanini
et al. 2005). More importantly, T. saltator has been the subject of
extensive studies, which has led to a detailed knowledge of the species’population dynamics (Marques et al. 2003), behavioural adaptations
(a review in Scapini 2006) and population genetic structure (De Matthaeis
et al. 2000, Ketmaier et al. 2005). The genetic homeostasis hypothesis

262 O. Ottaviano, F. Scapini
(Lerner 1954) received support from interdisciplinary researches based onthe simultaneous analysis of molecular markers and orientation behaviour
related to shoreline stability (Scapini et al. 1995, Ketmaier et al. 2010).
The present study focused on morphometry. For each individual, weexamined one meristic bilateral character (the number of articles of the
second antennae flagellum) and three metric bilateral characters, which areassociated with different periods of the development of individuals (length ofthe merus of the P3, P6 and P7 pereiopods). In addition, we measured the
length of the cephalic capsule as a proxy of body size (Marques et al. 2003).We studied three populations: two from south-eastern Sicily and one from
Tuscany. The Sicilian populations have been exposed to hydrocarbon (thisis a zone of marine oil drilling) and pesticide pollution (from greenhouses).
Furthermore, in recent years these beaches have been increasingly used fortourism. The Tuscan population came from a natural park, the MaremmaRegional Park, an unpolluted location relatively free from tourism (Fanini
et al. 2005). We evaluated the degree of fluctuating asymmetry in the threepopulations to study possible relations with the impacts of activities linked
to tourism and oil or pesticide pollution of water and sediments.
2. Material and methods
2.1. Study site description and sampling
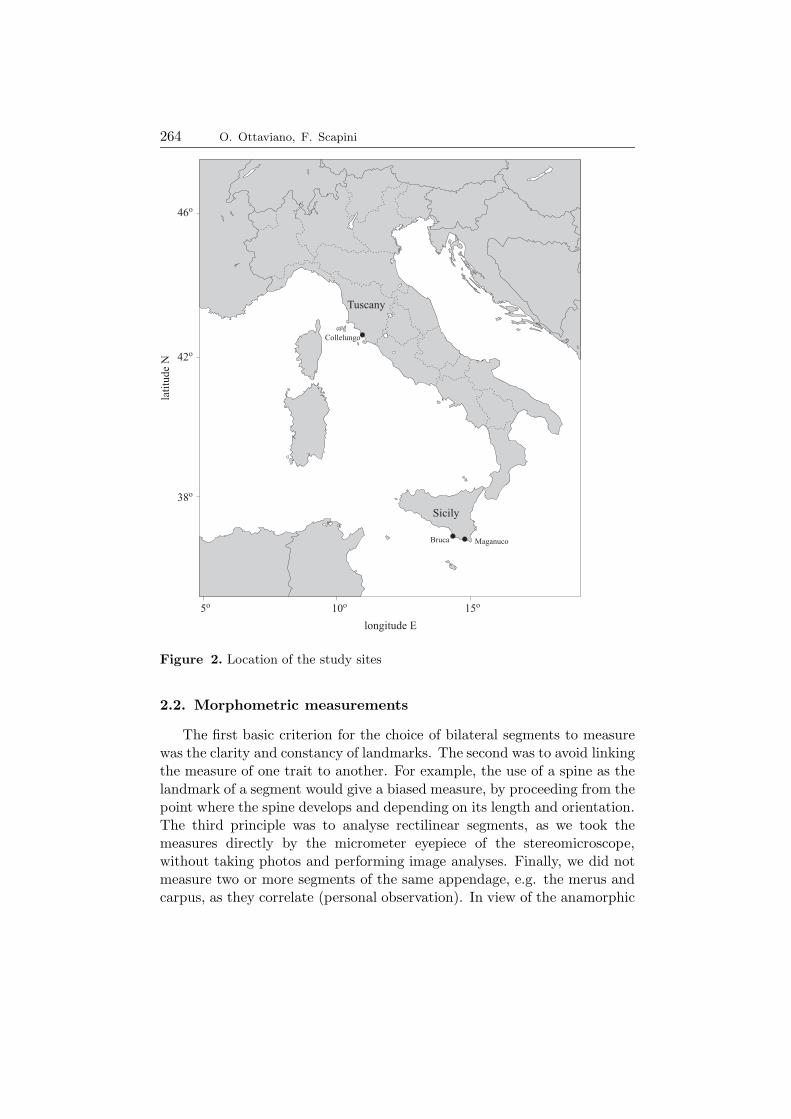
We sampled three populations from the following sandy beaches (Fig-ure 2 and Table 1):
1. Italy – southern Tuscany – Maremma Regional Park (province ofGrosseto) – Collelungo (42◦38′10.14′′N – 11◦04′07.95′′E).
2. Italy – south-eastern Sicily – Malta Channel (province of Ragusa) –
Maganuco (36◦43′01.00′′N – 14◦49′ 13.62′′E).
3. Italy – south-eastern Sicily – Malta Channel (province of Ragusa) –
Bruca (36◦44′07.65′′N – 14◦40′41.75′′E).
After moving the superficial layer of sand, we captured talitrids using an
entomological aspirator. We collected only adult talitrids and the samplesconsisted of about 50 individuals for each population. Then we measuredthe sampling area. Talitrids were then transferred to a glass container
containing moist sand from the same beach and with perforations to ensureaeration. On the same day of the sampling, or on the following day, the
talitrids were placed singly into Eppendorf tubes filled with absolute ethanol(99.9%), and thereafter stored at −20◦C.

Can fluctuating asymmetry in Talitrus saltator (Montagu, 1808) . . . 263
Table 1. Characteristics of the study sites
Beach Collelungo Maganuco Bruca(Tuscany) (Sicily) (Sicily)
length 4400 m 890 m 1630 m
maximum width 32.73 m 80 m 27.50 m(diurnal low tide)
width at the 32.73 m 45.90 m 27.50 mcapture point(diurnal low tide)
mean orientation 211◦ 174◦ 234◦
(perpendicularto the shoreline)
dune vegetation yes yes yes (small cottagesbehind the dunes)
lateral boundaries rocks on one side, rocks on both sides rocks on one side,gravel and rocks gravel and rockson the other side on the other side
access points 2 6, of which 3 3, of which 2frequently used are adjoining and
frequently used
stream or drain yes, left bank of no yes, a drain fromthe Ombrone River, greenhouses located5051 m from the behind flows into thesampling point sea, 678 m from the
sampling point
protected area yes no no
tourist presence yes, especially in yes, especially in yes, especially inApril and May August August
sand cleaning no yes, mechanical, noin August
presence of tali- everywhere on the in the eastern part of everywhere, except intrids beach the beach (not very the 380 m around the
frequented by tourists) main access points
sampling dates 3 October 2008 21–23 August 2008 25 August 2008
area in which we 10 m2 17 m2 21 m2
collected about50 talitrids
number of collect- 54 50 50ed talitrids
density 5.4 2.9 2.4(individuals m−2)
presence of tali- yes, more abundant yes yes, but with lowertrids after one density, the beach wasyear slightly narrower
264 O. Ottaviano, F. Scapini
5 10 15o o o
longitude E
46
42
38
o
o
o
lati
tude
N
Maganuco
Sicily
Bruca
Collelungo
Tuscany
Figure 2. Location of the study sites
2.2. Morphometric measurements
The first basic criterion for the choice of bilateral segments to measurewas the clarity and constancy of landmarks. The second was to avoid linkingthe measure of one trait to another. For example, the use of a spine as the
landmark of a segment would give a biased measure, by proceeding from thepoint where the spine develops and depending on its length and orientation.The third principle was to analyse rectilinear segments, as we took themeasures directly by the micrometer eyepiece of the stereomicroscope,without taking photos and performing image analyses. Finally, we did notmeasure two or more segments of the same appendage, e.g. the merus andcarpus, as they correlate (personal observation). In view of the anamorphic

Can fluctuating asymmetry in Talitrus saltator (Montagu, 1808) . . . 265
a b c
9
101
2
3 4
5 6 7
8
Figure 3. Diagram illustrating: a) Talitrus saltator. In black – the appendagesthat will be used for genetic analyses, in grey – the segments used for morphometricanalyses, 1. distal landmark of the cephalic capsule, base of the first antenna,2. proximal landmark, posterior end of the cephalic capsule, 3. merus of the P3pereiopod, 4. P4 pereiopod, 5. P5 pereiopod, 6. merus of the P6 pereiopod, 7. merusof the P7 pereiopod; b) The second antenna, 8. articles of the flagellum (in grey);c) P6 pereiopod, the merus is shown in grey, 9. proximal landmark, light notch withthe ischiopodite, 10. distal landmark, apex of the knee (disregarding the spine)
Table 2. Segments measured and landmarks used
Cephalic Right and left Right and left Right and leftcapsule second anten- P3 pereiopods P6 pereiopods
nae (A2)
segment flagellum merus merus
face outer inner
side right anterior posterior
proximal posterior end light notch with light notch withlandmark of the capsule ischiopodite ischiopodite
distal base of the apex of the knee apex of the kneelandmark first antenna (disregarding the (disregarding the
spine) spine)
Right and leftP7 pereiopods
segment merus
face inner
side posterior
proximal light notch withlandmark ischiopodite
distal apex of the kneelandmark (disregarding the
spine)
development of crustaceans (first the anterior part of the body, then theposterior), the P3, P4, P5, P6 and P7 pereiopods were suitable for ouraims. We decided to use the right and left P4 and P5 pereiopods for genetic

266 O. Ottaviano, F. Scapini
analyses, as it is possible to extract a sufficient quantity of DNA from them
(study in progress), while the right and left P3, P6 and P7 pereiopods were
shown to be the best candidates for the morphometric analyses. In theseappendages the merus is the best segment with regard to landmarks and
ease of measuring at the magnification of 50x. When studying fluctuating
asymmetry it is important that the units used are not too large in relation
to the actual asymmetry. According to our observations, the posterior side
was the most suitable for the P6 and P7 meri; for both segments, the
distal landmark was the apex of the knee (disregarding the spine), whilethe proximal one was the light notch with the ischiopodite, best observed
looking from the inner face of the segment. For the P3 merus, the anterior
side was the most suitable, with the same landmarks as for the P6 and P7
meri, but best observed from the external face of the segment. Figure 3 and
Table 2 summarise the segments and appendages chosen for the genetic and
morphometric analyses and the landmarks.
Below we give the protocol we prepared to ensure the best conditions
for the morphometric and genetic analyses of each individual, to avoid
breakage or confusion of appendages, and finally, to reduce the impact of
human measurement error. Each individual was placed in a little glass sink
filled with absolute ethanol and was observed under a stereomicroscope.From each sandhopper we took the right and left P4 and P5 pereiopods
by means of sterilised dissecting forceps and transferred these appendages
into an Eppendorf tube filled with absolute ethanol for subsequent genetic
analyses. For each individual we prepared two histology slides, one for
the right appendages and the other for the left. On the short sides of the
slides we wrote ‘Head’ and ‘Telson’, on the longer ones we wrote ‘Proximal’and ‘Distal’ as reference points to ensure all the segments were properly
placed and to reduce the risk of confusion. Then we took the right P7,
P6 and P3 pereiopods and placed them on the ‘Right’ histology slide;
we did the same for the left appendages. Using 50x magnification, we
counted the number of flagella articles of the right and left second antennae.
Then, using morphological keys (Karaman 1993, Ruffo (ed.) 1993) weidentified the species the sandhopper under observation belonged to. All
the individuals captured were Talitrus saltator, but two, both from Bruca
beach, had broken third uropods, so they could not be definitively identified
as T. saltator. Therefore the total number of individuals for Bruca decreased
to 48. For each sandhopper we defined the sex by recording, in males, the
two penes, which appear as two small opposite tubes in the ventral face ofthe individual at the seventh mesosomite level. We recognised females from
the oostegites, two controlateral lines of thin foils visible in the ventral
face of the sandhoppers from the second to the fifth mesosomite. For

Can fluctuating asymmetry in Talitrus saltator (Montagu, 1808) . . . 267
each female, we determined whether it was immature (small oostegites),fully developed (small setae on the oostegites, which, interlacing with theopposite ones, create a bag, the marsupium) or with eggs/hatched juvenilesin the marsupium; in the last case we counted the number of eggs or hatchedjuveniles. Using 25x magnification, we detached the cephalic capsule andplaced it to show its right side; then we measured its length from the baseof the right first antenna to the posterior end of the capsule. We storedthe remains of the sandhopper in its original Eppendorf tube. Successively,putting the ‘Right’ and ‘Left’ histology slides under the stereomicroscopeone at a time, we disarticulated the meri of the P7, P6 and P3 pereiopodsfrom the rest of each appendage. This procedure allowed for a betteridentification of the landmarks. The P7 and P6 meri showed their innerface, while the P3 merus showed the outer one. To achieve a better contrastwe used a black background under the slides. Using 50x magnification, weperformed two measurements of the posterior sides of the P7 and P6 meriand of the anterior side of the P3 meri. We carried out two measurementsof the same merus of each sandhopper on the same day, with a time lapseof at least three hours. Between the two measurements of the same merus,we analysed other samples, so that the observer was not conditioned by theprevious outcomes.
The metric measures obtained by the stereomicroscope were convertedto micrometers by suitable conversion calculations. The samplings andmeasurements of sandhoppers were both performed by the same personto reduce the error due to different observers.
2.3. Statistical analysis
The analysis of fluctuating asymmetry (FA) was performed as recom-mended by Palmer & Strobeck (1986) and Palmer (1994) using Excel andS-Plus 6 for Windows. The significance level was 5%.
Outliers are a common source of skew or leptokurtosis in studies offluctuating asymmetry. The difference values between the right and leftsides of the body (R-L) in a few individuals in a large and otherwise normallydistributed sample, may deviate unusually far from zero. Sandhoppers thatwere lacking in one of the bilateral appendages were outliers, as this strongdifference between the values of the two sides of their body would haveseriously affected the fluctuating asymmetry index. We excluded outliersfrom the analyses also because their values may be related to physicaldamage or severe deformities, and these events are not developmental noise(Palmer 1994). Thus, before performing the tests for measurement error,box plots of the right and left sides and of the cephalic capsule were madeand screened for outliers. If one sandhopper was an outlier, e.g. for the

268 O. Ottaviano, F. Scapini
second antennae, we excluded it only from the statistical analysis of thesecond antennae, but not from that of other traits. If one sandhopper was anoutlier for any of the pereiopods we excluded it from the statistical analysisof all pereiopods. Table 3 reports the numbers of sandhoppers collected andthose actually subjected to further statistical analyses for each trait.
Table 3. Number of sandhoppers collected and statistically analysed for each traitin each population after the exclusion of outliers by box plots
Population Collected Cephalic Number of articles P7, P6 andsandhoppers capsule of the second P3 merus
antenna flagellum
Collelungo 54 52 46 46Maganuco 50 49 41 43Bruca 48 48 43 46
The chi-square test was used to test the sex ratio of the sample of eachpopulation. For metric traits we used the F and t tests to compare thefirst and the second measures of a segment. Having ruled out significantcontributions of human measurement error, the two replica measurements
were averaged for further analysis. For each trait, we divided the populationsamples according to sex to check whether there was sexual dimorphism.When this was absent, males and females were put together for furtheranalysis. For each bilateral trait the presence of directional asymmetrywas tested by one-sample t-test. Normality was tested using graphicaltechniques. The fluctuating asymmetry levels were analysed with the indexFA1 = Mean |R-L| (as defined by Palmer 1994). One-way ANOVAs wereused to test differences among populations for each of the traits and forfluctuating asymmetry levels.
3. Results
The sex ratios (males/females) of the samples were significantly femalebiased in the Collelungo population (0.50, χ2-test: p < 0.05), but signif-icantly male biased in the Bruca population (2.69, χ2-test: p < 0.01); inthe Maganuco population females were more abundant than males but thesex ratio was not significantly different from the expected balance of 1:1(Table 4).
Comparing the three samples we observed that in Collelungo andMaganuco there were the highest percentages of outliers for all the traitsmeasured, while the Bruca population had the lowest ones (Figure 4).

Can fluctuating asymmetry in Talitrus saltator (Montagu, 1808) . . . 269
Table 4. Sex ratio in the three populations
Population Collelungo Maganuco Bruca
n 54 50 48n males 18 19 35n females 36 31 13sex ratio 0.50 0.61 2.69χ
2-test p < 0.05 n. s. p < 0.01
0.0
2.0
4.0
6.0
8.0
10.0
12.0
14.0
16.0
18.0
20.0
Collelungon = 54
Maganucon = 50
Brucan = 48
[%]
antenna outliers
pereiopod outliers
cephalic capsule outliers
Figure 4. Percentage of outliers for the traits measured in the three populations
1050
1100
1150
1200
1250
1300
1350
Collelungon = 52
Maganucon = 49
Brucan = 48
mea
n ±
SE
[m
]µ
Figure 5. Mean length± SE [µm] of the cephalic capsule in the three populations

270 O. Ottaviano, F. Scapini
Collelungo - left antenna
0
2
4
6
8
10
12
18 20 22 24 26 28 30 32
number of articles
num
ber
of
indiv
idual
s
males
females
Collelungo - right antenna
0
2
4
6
8
10
12
18 20 22 24 26 28 30 32
number of articles
num
ber
of
indiv
idual
s
males
females
Maganuco - left antenna
0
2
4
6
8
10
12
18 20 22 24 26 28 30 32
number of articles
num
ber
of
indiv
idual
s
males
females
Maganuco - right antenna
0
2
4
6
8
10
12
18 20 22 24 26 28 30 32
number of articles
num
ber
of
indiv
idual
s
males
females
Bruca - left antenna
0
2
4
6
8
10
12
18 20 22 24 26 28 30 32
number of articles
num
ber
of
indiv
idual
s
males
females
Bruca - right antenna
0
2
4
6
8
10
12
18 20 22 24 26 28 30 32
number of articles
num
ber
of
indiv
idual
s
males
females
Figure 6. Sexual dimorphism of the number of articles of the second antennaeflagella
Table 5. Cephalic capsule length [µm]: comparison between sexes by F and t tests
Population Collelungo Maganuco Bruca
male mean±SE 1302.35 ± 19.07 1181.47 ± 17.40 1157.94 ± 10.56
female mean± SE 1314.86 ± 10.36 1160.00 ± 11.05 1178.46 ± 19.47
F-test n. s. n. s. n. s.t-test n. s. n. s. n. s.
Sandhoppers from Collelungo had significantly (ANOVA: p < 0.001)larger cephalic capsules than those of the two Sicilian populations, whichdid not differ from each other (Figure 5). We checked whether there was any
Can fluctuating asymmetry in Talitrus saltator (Montagu, 1808) . . . 271
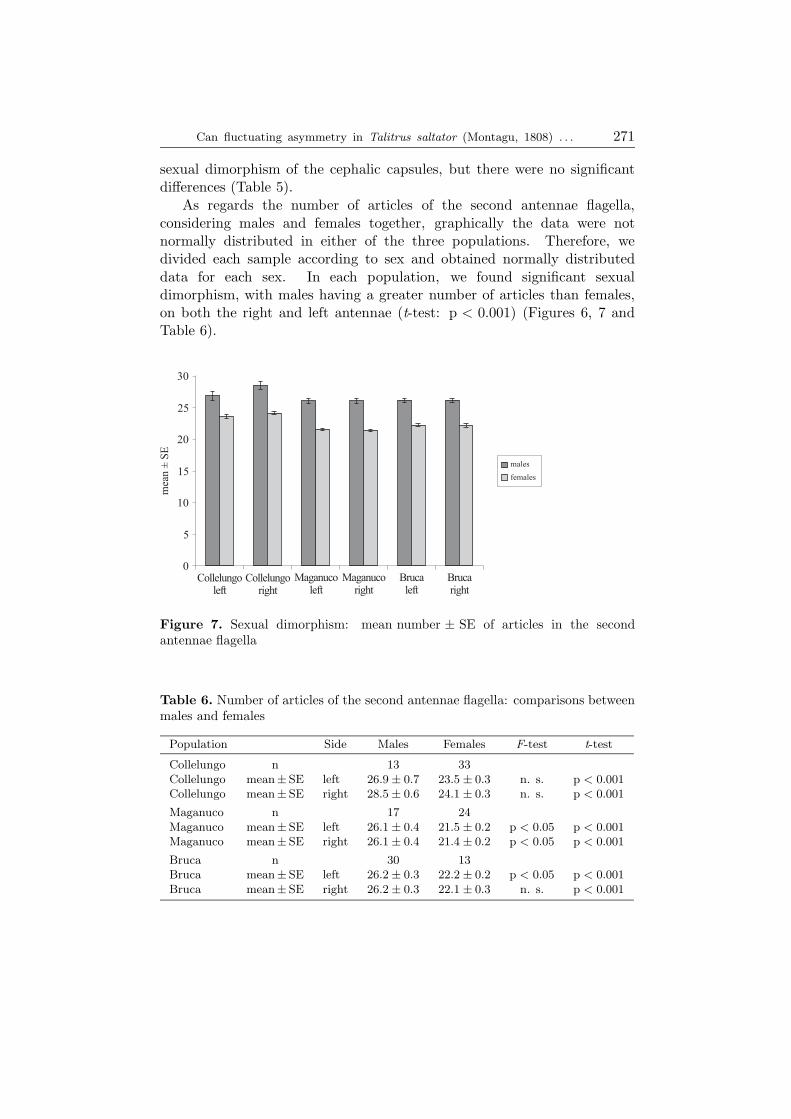
sexual dimorphism of the cephalic capsules, but there were no significantdifferences (Table 5).As regards the number of articles of the second antennae flagella,
considering males and females together, graphically the data were notnormally distributed in either of the three populations. Therefore, wedivided each sample according to sex and obtained normally distributeddata for each sex. In each population, we found significant sexualdimorphism, with males having a greater number of articles than females,on both the right and left antennae (t-test: p < 0.001) (Figures 6, 7 andTable 6).
0
5
10
15
20
25
30
mea
n±
SE
males
females
Collelungoleft
Maganucoleft
Brucaleft
Brucaright
Maganucoright
Collelungoright
Figure 7. Sexual dimorphism: mean number ± SE of articles in the secondantennae flagella
Table 6. Number of articles of the second antennae flagella: comparisons betweenmales and females
Population Side Males Females F-test t-test
Collelungo n 13 33Collelungo mean± SE left 26.9 ± 0.7 23.5 ± 0.3 n. s. p < 0.001
Collelungo mean± SE right 28.5 ± 0.6 24.1 ± 0.3 n. s. p < 0.001
Maganuco n 17 24Maganuco mean± SE left 26.1 ± 0.4 21.5 ± 0.2 p < 0.05 p < 0.001
Maganuco mean± SE right 26.1 ± 0.4 21.4 ± 0.2 p < 0.05 p < 0.001
Bruca n 30 13Bruca mean± SE left 26.2 ± 0.3 22.2 ± 0.2 p < 0.05 p < 0.001
Bruca mean± SE right 26.2 ± 0.3 22.1 ± 0.3 n. s. p < 0.001

272 O. Ottaviano, F. Scapini
In each sex, we tested the right and left antennae for the presence ofdirectional asymmetry, analysing the values of the differences between theright and left sides (R-L). In the Collelungo population both males andfemales had a significantly (one-sample t-test: p < 0.05) greater number ofarticles in the right antenna flagellum than in the left one. In the Maganucoand Bruca sandhoppers, there was no significant difference between the rightand left antennae in either sex. Therefore, right directional asymmetry maybe present in the Collelungo population (Figures 8 and 9).
For each of the P7, P6 and P3 pereiopod meri, we compared the first andsecond measures of the same side of a segment using F and t tests. We did
males females
0
5
10
15
20
25
30
-8 -6 -4 -2 0 2 4 6 8
[R-L]
num
ber
of
indiv
idual
s Col M Col F
Mag M Mag F
Bru M Bru F
0
5
10
15
20
25
30
-8 -6 -4 -2 0 2 4 6 8
[R-L]
num
ber
of
indiv
idual
s
0
5
10
15
20
25
30
-8 -6 -4 -2 0 2 4 6 8
[R-L]
num
ber
of
indiv
idual
s
0
5
10
15
20
25
30
-8 -6 -4 -2 0 2 4 6 8
[R-L]
num
ber
of
indiv
idual
s
0
5
10
15
20
25
30
-8 -6 -4 -2 0 2 4 6 8
[R-L]
num
ber
of
indiv
idual
s
0
5
10
15
20
25
30
-8 -6 -4 -2 0 2 4 6 8
[R-L]
num
ber
of
indiv
idual
s
Figure 8. Distributions of the difference values between the number of articlesof the right and left second antennae flagella (R-L) in each sex in the threepopulations. Col = Collelungo; Mag = Maganuco; Bru = Bruca; M = Males;F = Females

Can fluctuating asymmetry in Talitrus saltator (Montagu, 1808) . . . 273
-0.5
0.0
0.5
1.0
1.5
2.0
2.5
Collelungo Maganuco Bruca
males (R-L)
females (R-L)
mea
n±
SE
Figure 9. Means (±SE) of the differences between the number of articles of theright and left second antennae flagella (R-L) in each sex in the three populations
not find any significant difference between the first and the second measuresin any populations for any meri, for either the right or left sides. Therefore,having ruled out any significant contribution of human measurement errors,the two replica measurements of each side were averaged for further analysis.To check whether there was any sexual dimorphism of the meri, we dividedeach population according to sex. In the Collelungo and Bruca populationsno significant difference between sexes was found in any pereiopods. In theMaganuco population the F-test showed a significant difference (p < 0.05)when males and females were compared for the left merus of the P3
0
200
400
600
800
1000
1200
1400
P7right
P6right
P3right
P7left
P6left
P3left
mer
us
mea
nle
ngth
±S
E[
m]
µ
Collelungo
Maganuco
Bruca
Figure 10. Mean length ± SE [µm] of the right and left meri of the P7, P6 andP3 pereiopods in the Collelungo, Maganuco and Bruca populations
274O.Ottaviano,F.Scapini
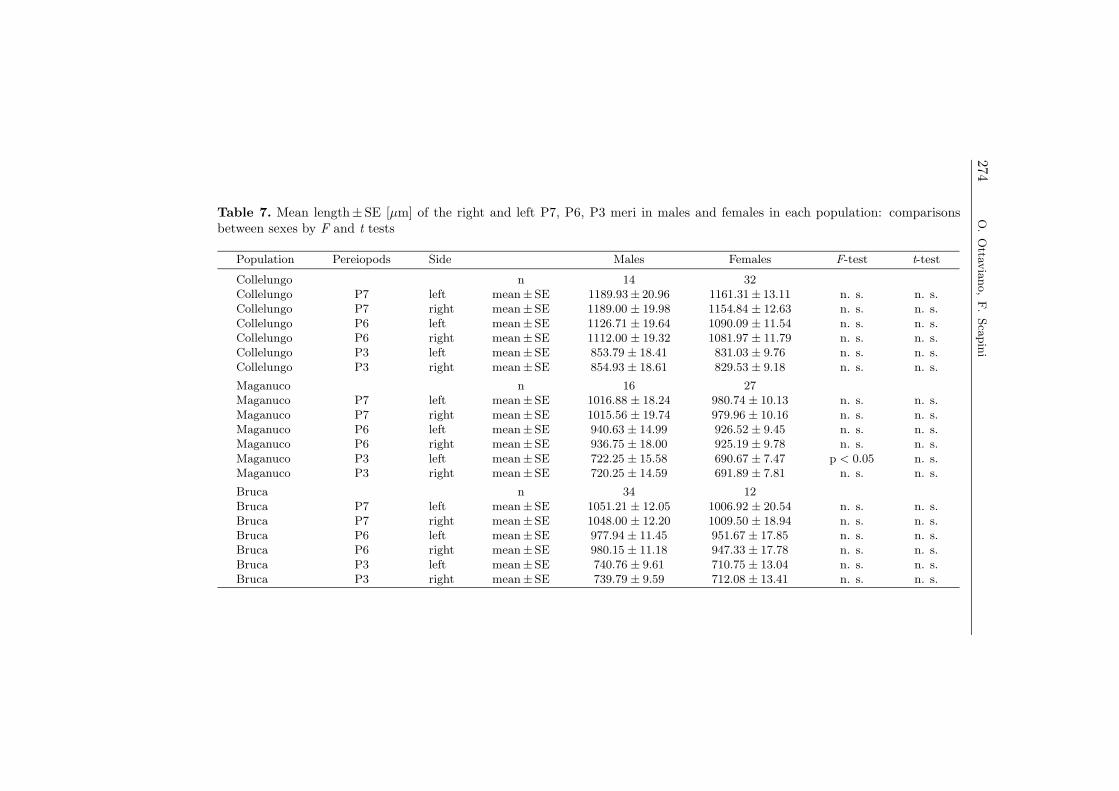
Table 7. Mean length±SE [µm] of the right and left P7, P6, P3 meri in males and females in each population: comparisonsbetween sexes by F and t tests
Population Pereiopods Side Males Females F-test t-test
Collelungo n 14 32Collelungo P7 left mean±SE 1189.93± 20.96 1161.31± 13.11 n. s. n. s.Collelungo P7 right mean±SE 1189.00 ± 19.98 1154.84 ± 12.63 n. s. n. s.Collelungo P6 left mean±SE 1126.71 ± 19.64 1090.09 ± 11.54 n. s. n. s.Collelungo P6 right mean±SE 1112.00 ± 19.32 1081.97 ± 11.79 n. s. n. s.Collelungo P3 left mean±SE 853.79 ± 18.41 831.03 ± 9.76 n. s. n. s.Collelungo P3 right mean±SE 854.93 ± 18.61 829.53 ± 9.18 n. s. n. s.
Maganuco n 16 27Maganuco P7 left mean±SE 1016.88 ± 18.24 980.74 ± 10.13 n. s. n. s.Maganuco P7 right mean±SE 1015.56 ± 19.74 979.96 ± 10.16 n. s. n. s.Maganuco P6 left mean±SE 940.63 ± 14.99 926.52 ± 9.45 n. s. n. s.Maganuco P6 right mean±SE 936.75 ± 18.00 925.19 ± 9.78 n. s. n. s.Maganuco P3 left mean±SE 722.25 ± 15.58 690.67 ± 7.47 p < 0.05 n. s.Maganuco P3 right mean±SE 720.25 ± 14.59 691.89 ± 7.81 n. s. n. s.
Bruca n 34 12Bruca P7 left mean±SE 1051.21 ± 12.05 1006.92 ± 20.54 n. s. n. s.Bruca P7 right mean±SE 1048.00 ± 12.20 1009.50 ± 18.94 n. s. n. s.Bruca P6 left mean±SE 977.94 ± 11.45 951.67 ± 17.85 n. s. n. s.Bruca P6 right mean±SE 980.15 ± 11.18 947.33 ± 17.78 n. s. n. s.Bruca P3 left mean±SE 740.76 ± 9.61 710.75 ± 13.04 n. s. n. s.Bruca P3 right mean±SE 739.79 ± 9.59 712.08 ± 13.41 n. s. n. s.

Can fluctuating asymmetry in Talitrus saltator (Montagu, 1808) . . . 275
pereiopods; yet, as in all other comparisons, the t-test was not significant(Table 7). Thus, we considered the two sexes together.
Using one-way ANOVA, we compared the length of the meri of eachpereiopod in the three populations. In the Collelungo sandhoppers the meriof the right and left P7, P6 and P3 pereiopods were significantly longer thanin the Sicilian populations (p < 0.001). Moreover, in the Bruca talitrids themeri of the right and left P7, P6 and P3 pereiopods were significantly longerthan in the Maganuco population (p < 0.01) (Figure 10).
In all populations and in all meri the values of the differences betweenthe right and left sides (R-L) were normally distributed and their meanswere not significantly different from zero (one-sample t-test), so we excluded
20
16
12
8
4
0
[R-L]
-180
-150
-12 0 - 90
-60
-30 0 30 6 0 90 120
150
180
20
16
12
8
4
0
[R-L]
-180
-150
-120 -90
-60
- 30 0 30 60 90 120
1 50
180
20
16
12
8
4
0
[R-L]
-180
-150
-12 0 -90
-60
-30 0 3 0 60 90 120
150
180
20
16
12
8
4
0
[R-L]
-180
-150
-120 -90
-60
-30 0 30 60 90 120
150
1 80
20
16
12
8
4
0
[R-L]
-180
-150
-12 0 -90
-60
-30 0 3 0 60 90 120
150
180
20
16
12
8
4
0
[R-L]
-180
-150
-120 -90
-60
-30 0 30 60 90 120
150
1 80
20
16
12
8
4
0
[R-L]
num
ber
ofin
divi
dual
s
-180
-150
- 120 -90
-60
-30 0 30 60 90 120
150
180
20
16
12
8
4
0
[R-L]
num
ber
ofin
divi
dual
s
-180
-150
-12 0 - 90
-60
-30 0 30 6 0 90 120
150
180
20
16
12
8
4
0
[R-L]
num
ber
ofin
divi
dual
s
Col P7 Col P6 Col P3
Mag P7 Mag P6 Mag P3
Bru P6 Bru P3
-18 0
-150
-120 -90
-60
-30 0 30 60 90 120
150
1 80
P7 (R-L) P6 (R-L) P3 (R-L)
Bru P7
Figure 11. Distributions of the difference values (R-L) between the right (R)and left (L) meri of the P7, P6 and P3 pereiopods in the three populations.Col = Collelungo; Mag = Maganuco; Bru = Bruca

276 O. Ottaviano, F. Scapini
directional asymmetry (Figure 11). The plots showed normality, thusantisymmetry was discarded.The fluctuating asymmetry levels of the three populations were anal-
ysed by the FA1 = Mean |R-L| index (Palmer 1994), and the differencesamong the populations were tested by one-way ANOVA. The Collelungosandhoppers had a significantly greater level of fluctuating asymmetry inthe P6 meri and in the P3 meri than the Sicilian populations (p < 0.05).The fluctuating asymmetry levels of the Maganuco and Bruca populationsdid not significantly differ from each other. No significant difference amongthe three populations was found for the P7 merus, which is the longest ofthe three meri measured and develops later (Figure 12).
0
5
10
15
20
25
30
P7 P6 P3
mea
n |R
-L| ±
SE
[µ
m]
Collelungo
Maganuco
Bruca
Figure 12. Fluctuating asymmetry values (FA1 index = Mean |R-L| ± SE) for themeri of the P7, P6 and P3 pereiopods in the three populations
4. Discussion
We may assume that the three samples analysed were representative ofthe respective populations, which were abundant and contained ovigerousfemales and juveniles (personal observations); for the purposes of this studywe sampled only adults. As the sandhoppers were captured by the sameperson using the same method, we assumed that the sex ratios recordedin the samples reflected those actually existing in the populations at themoment of sampling. As regards outliers for the measured traits, we inferredthat those percentages were real and not to be ascribed to the method ofcapture. The use of entomological aspirators to capture small arthropods isgenerally assumed to be a non-invasive method.The study confirmed the sexual dimorphism of the second antennae
flagella in Talitrus saltator (Ruffo (ed.) 1993). Sexual dimorphism in this

Can fluctuating asymmetry in Talitrus saltator (Montagu, 1808) . . . 277
species seems to be limited to this trait and does not extend to the cephalic
capsule or to the meri of the P3, P6 and P7 pereiopods. Yet we think thisresult, especially for the meri, merits further analysis.
Right directional asymmetry was observed in the second antennaflagellum in the Collelungo population. The sensory function of the
antennae and their role in closing the burrow in the sand are known
(Schellenberg 1942, pp. 139–140, and personal observations). Directionalasymmetry is more likely in bilateral sensory organs (Møller & Swaddle
1997). However, the right directional asymmetry in the Collelungo
sandhoppers, but not in the Maganuco and Bruca sandhoppers, remainsto be explained.
In the merus of the P3 and P6 pereiopods, the Collelungo sandhoppers
showed a higher fluctuating asymmetry level than the Sicilian populations.The absence of fluctuating asymmetry in the merus of the P7 pereiopod,
the longest one, may be linked to its functional importance for the balance
of a laterally compressed body (Schellenberg 1942, pp. 139–140). Accordingto the same line of thinking, we suggest that the merus of the P3 pereiopod
has the highest level of fluctuating asymmetry because it is not used for
balancing, but for crawling on the sand. Even though it is located withina nature reserve, the Collelungo beach has a relatively high presence of
visitors (sometimes on horseback, personal observations) during April and
May, which is the period of sandhopper development; during the summermonths, for fire prevention, the nature reserve is closed to visitors, so it is
possible to reach the beach only on foot from an entrance 5 km away (Fanini
et al. 2005). In contrast, the two Sicilian beaches are not frequented duringthe period of sandhopper development, whereas there is a relatively high
presence of tourists during August. In this month, in Maganuco we noticed
the disappearance of sandhoppers from the western part of the beach, in thevicinity of a holiday village and the main access points, where the tourist
flow is greatest. Similarly, sandhoppers were found everywhere on the Bruca
beach, except in the 380 m around the two main access points. It must bestressed that in southern Sicily in August the sandhoppers born in spring are
already developed and a new generation develops in the following autumnmonths (personal observations). Taking into account the developmental
stage in which environmental stresses act, fluctuating asymmetry levels
of the meri of the P6 pereiopod and especially the P3 pereiopod may bepostulated as a bioindicator of mechanical stress (e.g. direct trampling) on
sandy beach ecosystems. The use of T. saltator populations as bioindicators
has the advantage that comparisons can be drawn over a wide geographicalarea (the species distribution) and throughout the year (mean life cycle of
the species). This has been suggested by several authors for different traits:

278 O. Ottaviano, F. Scapini
population structure (Fanini et al. 2005), genetic variability (Ugolini et al.2004), abundance and orientation behaviour (Fanini et al. 2007). Here wesuggest the fluctuating asymmetry level, which is a quantitative trait ofdevelopment.
Another possible explanation of the higher fluctuating asymmetry levelobserved in the Collelungo sandhoppers as compared with the Sicilianpopulations analysed could be the latitudinal difference. Weather stress,e.g. storms during spring and early summer, may negatively influencesandhopper development. This hypothesis could be tested by evaluatingthe fluctuating asymmetry level in populations from higher latitudes (thisstudy is under preparation).
A further use of the fluctuating asymmetry level as a bioindicator ofenvironmental stress could be its relation with pollution levels. In south-eastern Sicily oil drilling occurs in the coastal sea, and it is common to findtarry residues from oil wells or the illegal flushing of oil tankers in the sandof beaches (included those we examined, personal observations). Besides,at Bruca beach drainage waters containing pesticides from greenhousesbacking the beach are discharged into the sea. However, we did notfind any difference between the two Sicilian populations analysed, andtheir fluctuating asymmetry levels were lower than those of the Collelungopopulation. Also Barca-Bravo et al. (2008) obtained a negative resultregarding the possible use of the fluctuating asymmetry level in T. saltatorpopulations as a bioindicator of environmental stress due to oil pollution.These authors compared three populations from Spanish beaches differentlyimpacted by the Prestige oil spill in 2002. They found a higher level offluctuating asymmetry in the population from the beach most subject toactivities linked to tourism and industry than in the populations from oilpolluted beaches. The absence of a significant level of fluctuating asymmetryin the T. saltator populations exposed to oil (Spain and Sicily) and pesticide(Sicily) pollution of water and sediments may reflect high levels of tolerance.
Acknowledgements
We thank the staff of the Maremma Regional Park (Grosseto, Italy) forallowing us to perform the sampling.
References
Barca-Bravo S., Servia M. J., Cobo F., Gonzalez M.A., 2008, The effect of humanuse of sandy beaches on developmental stability of Talitrus saltator (Montagu,1808) (Crustacea, Amphipoda). A study on fluctuating asymmetry, Mar. Ecol.,29 (1), 91–98.

Can fluctuating asymmetry in Talitrus saltator (Montagu, 1808) . . . 279
De Matthaeis E., Davolos D., Cobolli M., Ketmaier V., 2000, Isolation by distancein equilibrium and non-equilibrium populations of four talitrid species in theMediterranean Sea, Evolution, 54 (5), 1606–1613.
Fanini L., Martın Cantarino C., Scapini F., 2005, Relationships between thedynamics of two Talitrus saltator populations and the impacts of activitieslinked to tourism, Oceanologia, 47 (1), 93–112.
Fanini L., Marchetti G.M., Scapini F., Defeo O., 2007, Abundance and orientationresponses of the sandhopper Talitrus saltator to beach nourishment and groynesbuilding at San Rossore natural park, Tuscany, Italy, Mar. Biol., 152 (5),1169–1179.
Jędrzejczak M.F., 2004, Sandy coastline ecosystem management – Bridgingsustainability and productivity of sandy beaches, The 3rd IUCN WorldConservation Congr., Bangkok, Thailand, 17–25 November 2004, KnowledgeMarketplace Rep., 9 pp.
Karaman G. S., 1993, Crustacea Amphipoda of freshwaters (in Italian). Faunad’Italia, Ediz. Calderoni, Bologna, XXXI, 337 pp.
Ketmaier V., De Matthaeis E., Fanini L., Rossano C., Scapini F., 2010, Variation ofgenetic and behavioural traits in the sandhopper Talitrus saltator (Crustacea,Amphipoda) along a dynamic sand beach, Ethol. Ecol. Evol., 22 (1), 17–35.
Ketmaier V., Iuri V., De Matthaeis E., 2005, Genetic resources and molecularmarkers in Talitrus saltator (Amphipoda, Talitridae) from the beach of Smir,Trav. Inst. Scient., Rabat Ser. Gen. 4, 55–59.
Lerner I.M., 1954, Genetic homeostasis, Oliver and Boyd, Edinburgh, 134 pp.
Marques J. C., Goncalves S. C., Pardal M. A., Chelazzi L., Colombini I., FallaciM., Bouslama M.F., El Gtari M., Charfi-Cheikhrouha F., Scapini F., 2003,Comparison of Talitrus saltator (Amphipoda, Talitridae) biology, dynamics,and secondary production in Atlantic (Portugal) and Mediterranean (Italy andTunisia) populations, Estuar. Coast. Shelf Sci., 58 (S), 127–148.
Møller A. P., Swaddle J. P., 1997, Asymmetry, development stability and evolution,Oxford Univ. Press, Oxford, 291 pp.
Palmer A.R., 1994, Fluctuating asymmetry analyses: a primer, [in:] Developmentalinstability: its origins and evolutionary implications, T.A. Markow (ed.),Kluwer Acad. Publ., Dordrecht, 335–364.
Palmer A. R., Strobeck C., 1986, Fluctuating asymmetry: measurements, analysis,patterns, Ann. Rev. Ecol. Syst., 17, 391–421.
Ruffo S. (ed.), 1993, The Amphipoda of the Mediterranean. Part 3, Mem. Inst.Oceanogr., Monaco, 577–813.
Scapini F., 2006, Keynote papers on sandhoppers orientation and navigation, Mar.Freshw. Behav. Phy., 39 (1), 73–85.
Scapini F., Buiatti M., De Matthaeis E., Mattoccia M., 1995, Orientation behaviourand heterozygosity of sandhopper populations in relation to stability of beachenvironments, J. Evolution. Biol., 8 (1), 43–52.

280 O. Ottaviano, F. Scapini
Scapini F., Morgan E., 2002, Bioassays for estimation of beach stability and eco-
system quality, [in:] Baseline research for the integrated sustainable manage-
ment of Mediterranean sensitive coastal ecosystems. A manual for coastal
managers, scientists and all those studying coastal processes and managementin the Mediterranean, F. Scapini (ed.), Inst. Agronom. Oltremare, Florence,120–122.
Schellenberg A., 1942, Flohkrebse oder Amphipoda, Tierw. Deutschlands, 40 (I–IV),252 pp.
Ugolini A., Borghini F., Calosi P., Bazzicalupo M., Chelazzi G., Focardi S., 2004,Mediterranean Talitrus saltator (Crustacea, Amphipoda) as a biomonitor ofheavy metals contamination, Mar. Pollut. Bull., 48 (5–6), 526–532.
Węsławski J.M., Stanek A., Siewert A., Beer N., 2000, The sandhopper (Talitrussaltator, Montagu 1808) on the Polish Baltic coast. Is it a victim of increasedtourism?, Oceanol. Stud., 29 (1), 77–87.