Embed Size (px)
Citation preview

Canadian Equity Fund (SRA) SF274
Annual audited financial statements and unaudited supplementary
financial information FOR THE YEAR ENDING DECEMBER 31, 2017

This page has been intentionally left blank.
50
30
CA
N
Canadian Equity Fund (SRA) SF274 | Annual audited 1 financial statements and unaudited supplementary financial information | The Canada Life Assurance Company 5
03
0 C
AN
Canadian Equity Fund (SRA) SF274
Year in review 2017 – CCIFA Equity markets around the world performed beyond initial expectations set out at the beginning of 2017, reflecting the continuing synchronized global economic recovery. This helped to propel robust earnings growth and corporate earnings. The year both began and finished with excitement about U.S. tax reform and enthusiasm over the pro-business agenda emphasized by the new Trump administration. In between that, we witnessed failed attempts at travel bans, health-care reform, a war of words with North Korea and President Trump and media outfits and the frequent White House personnel turnover. Outside of North America, strong economic growth and continued easy monetary policy supported European and Japanese stock markets. The European political climate was supportive of markets, highlighted by the failure of anti-eurozone parties to achieve political success in elections in The Netherlands and France. Emmanuel Macron presidential election win (with a pro-euro, centrist agenda) attests to this fact. In Japan, signs of more consistent and sustainable growth emerged after the numerous false starts of recent years and economic growth in China remained strong throughout 2017. In the UK, despite continuing uncertainty about Britain’s withdrawal from the European Union (‘Brexit’) and its impact on the economy, the FTSE 100 Index provided a return of 11.9%. The mechanics of their withdrawal process were complicated by the ruling Conservative Party losing its majority in the mid-year general election. The Canadian economy delivered surprisingly strong growth, prompting the Bank of Canada to raise interest rates twice; driving 2-year bond yields to more than double their start of year levels, and boosting the loonie by 5 cents.
For the year ending December 31, 2017, the SRA Canadian Equity Fund outperformed its benchmark for the year, generating a total return of 11.1%, vs the benchmark S&P/TSX Composite Index, which returned

2 Canadian Equity Fund (SRA) SF274 | Annual audited financial statements and unaudited supplementary financial information | The Canada Life Assurance Company 5
03
0 C
AN
50
30
CA
N
9.1%. The Index’s performance was led by strength in Health Care, Consumer Discretionary and Industrials, while Energy was the only sector in negative territory. The SRA Canadian Equity Fund outperformed its benchmark as the fund (invested on a bottom-up value approach) added value from underweights in Consumer Staples and Pipelines, an overweight in Financials and from security selection gains in Pipelines, Materials, Financials and Gold and Precious Metals.
The underweight position in the Consumer Staples sector, based on our view that companies in that sector are quite expensive. The Fund’s only position in the sector (Maple Leaf Foods +29%) was sold in the second quarter after rising strongly. Within the Energy sector, our underweight position in pipeline stocks (an expensive sub-sector) contributed to performance. These stocks underperformed the broad-based benchmark by more than 10% as interest rates continued to rise, putting pressure on the sub-sector. The Fund’s Financials sector holdings, in particular its overweight position in Canadian banks, did well on the back of continuing strong earnings posted by the banks held in the fund.
Further individual contributors to performance included Dominion Diamond Corp. and Methanex Corp. Dominion Diamond’s share price increased as The Washington Companies announced a takeover offer of US$14.25 per share. Methanex’s share price rose as methanol prices increased as a result of stronger demand from China, a general increase in economic activity and higher oil prices.
The Fund’s underweight position in the Health Care sector detracted from performance as the sector outperformed the broader market by about 35% as a result of an increase in Valeant Pharmaceuticals International Inc.’s share price. An underweight position in the Information Technology sector also detracted from performance, as the sector outperformed the broader market by about 8%, as valuations across the sector increased. We continue to believe individual stocks in the sector are expensive.

Canadian Equity Fund (SRA) SF274 | Annual audited 3 financial statements and unaudited supplementary financial information | The Canada Life Assurance Company 5
03
0 C
AN
50
30
CA
N
During the period, we added Boardwalk Real Estate Investment Trust and Crescent Point Energy Corp. to the Fund, as both companies were priced at attractive valuation levels at the time of purchase. We added to the Fund’s positions in Methanex and Power Corp. of Canada, both of which were priced at attractive valuation levels when added to our positions. We also reduced our positions in Suncor Energy Inc. and Canadian Natural Resources Ltd., as their stock prices rose.
We also exited Dream Office Real Estate Investment Trust, as that stock appreciated and reached our target value.
2018 Outlook With the new Fed Chair Powell, there has been a continuation of views that the U.S. economy is growing and that the Fed will likely continue to raise interest rates through the year (post +0.25% in March). As mentioned in prior commentaries, our portfolio remains underweight the expensive, interest-rate sensitive areas of the market (pipelines, utilities, REITs), which will be hurt as interest rates rise. Fundamentally our portfolio (overweight basic materials, integrated energy, banks and consumer discretionary) remains very attractively priced. With a forward multiple of 13.3X, this implies a forward earnings yield of 7.5%. Compared to the 10 year Government of Canada Bond at 2.1%, the Equity Risk Premium of 5.4% is still at the higher end of the historical range, suggesting that investors are being well compensated for the risks of investing in equities.
Lloyd E. Rowlett, CFA President Scheer, Rowlett and Associates Investment Management Ltd.

4 Canadian Equity Fund (SRA) SF274 | Annual audited financial statements and unaudited supplementary financial information | The Canada Life Assurance Company 5
03
0 C
AN
50
30
CA
N
INDEPENDENT AUDITOR’S REPORT
To the Contractholders of Canadian Equity Fund (SRA) SF274
We have audited the accompanying financial statements of Canadian Equity Fund (SRA) SF274, which comprise the statements of financial position as at December 31, 2017 and December 31, 2016, and the statements of comprehensive income, statements of changes in net assets attributable to contractholders and the statements of cash flows for the years then ended, and a summary of significant accounting policies and other explanatory information.
Management’s Responsibility for the Financial Statements Management is responsible for the preparation and fair presentation of these financial statements in accordance with International Financial Reporting Standards and the requirements of Part XII of the Canadian Life and Health Insurance Association Guideline G2, and for such internal control as management determines is necessary to enable the preparation of financial statements that are free from material misstatement, whether due to fraud or error.
Auditor’s Responsibility Our responsibility is to express an opinion on these financial statements based on our audits. We conducted our audits in accordance with Canadian generally accepted auditing standards. Those standards require that we comply with ethical requirements and plan and perform the audits to obtain reasonable assurance about whether the financial statements are free from material misstatement.

Canadian Equity Fund (SRA) SF274 | Annual audited 5 financial statements and unaudited supplementary financial information | The Canada Life Assurance Company 5
03
0 C
AN
50
30
CA
N
An audit involves performing procedures to obtain audit evidence about the amounts and disclosures in the financial statements. The procedures selected depend on the auditor’s judgment, including the assessment of the risks of material misstatement of the financial statements, whether due to fraud or error. In making those risk assessments, the auditor considers internal control relevant to the entity’s preparation and fair presentation of the financial statements in order to design audit procedures that are appropriate in the circumstances, but not for the purpose of expressing an opinion on the effectiveness of the entity’s internal control. An audit also includes evaluating the appropriateness of accounting policies used and the reasonableness of accounting estimates made by management, as well as evaluating the overall presentation of the financial statements.
We believe that the audit evidence we have obtained in our audits is sufficient and appropriate to provide a basis for our audit opinion.
Opinion In our opinion, the financial statements present fairly, in all material respects, the financial position of Canadian Equity Fund (SRA) SF274 as at December 31, 2017 and December 31, 2016, and its financial performance and its cash flows for the years then ended in accordance with International Financial Reporting Standards and the requirements of Part XII of the Canadian Life and Health Insurance Association Guideline G2.
/s/ Deloitte LLP
Chartered Professional Accountants March 9, 2018 Winnipeg, Manitoba

6 Canadian Equity Fund (SRA) SF274 | Annual audited financial statements and unaudited supplementary financial information | The Canada Life Assurance Company 5
03
0 C
AN
50
30
CA
N
Canadian Equity Fund (SRA) SF274
Schedule of Investment Portfolio As at December 31, 2017
(in Canadian $ thousands, except number of units)
No. of units
Average cost
Fair value
Investment Fund Units
Scheer Rowlett Canadian Equity Fund Pooled 5,443,142 70,438 76,231
Total Investments 70,438 76,231

Canadian Equity Fund (SRA) SF274 | Annual audited 7 financial statements and unaudited supplementary financial information | The Canada Life Assurance Company 5
03
0 C
AN
50
30
CA
N
Fund manager: Scheer Rowlett & Associates Investment Management Ltd. Statement of Financial Position
(in Canadian $ thousands) December 31, 2017
December 31, 2016
Assets
Cash and short-term deposits – –
Investment income due and accrued – –
Due from The Canada Life Assurance Company (note 8) – –
Due from brokers – –
Due from outside parties – –
Investments
Investment fund units (note 3) 76,231 73,679
Total investments 76,231 73,679
Total assets 76,231 73,679
Liabilities
Overdrafts 216 35
Due to The Canada Life Assurance Company (note 8) 80 11
Due to brokers – –
Due to outside parties – –
Total liabilities excluding net assets attributable to contractholders 296 46
Net assets attributable to contractholders 75,935 73,633

8 Canadian Equity Fund (SRA) SF274 | Annual audited financial statements and unaudited supplementary financial information | The Canada Life Assurance Company 5
03
0 C
AN
50
30
CA
N
Statement of Comprehensive Income
(in Canadian $ thousands) For the years ended
December 31, 2017
December 31, 2016
Income
Net gain (loss) on investments
7,765 16,839
Miscellaneous income (loss)
– –
Total income 7,765 16,839
Expenses
Management fees (note 8) 626 573
Other 66 62
Total expenses 692 635
Net increase (decrease) in net assets from operations attributable to contractholders 7,073 16,204
Net Assets Attributable to Contractholders Per Unit (note 7)
(in Canadian $, except number of units outstanding) For the years ended December 31
2017 2016
Number of units outstanding 93,632 99,927
Net asset value per unit 811.00 736.97
Increase (decrease) per unit 74.03 149.79

Canadian Equity Fund (SRA) SF274 | Annual audited 9 financial statements and unaudited supplementary financial information | The Canada Life Assurance Company 5
03
0 C
AN
50
30
CA
N
Statement of Cash Flows
(in Canadian $ thousands) For the years ended December 31 2017 2016
Net Inflow (Outflow) of Cash Related to the Following Activities Operating Activities Increase (decrease) in net assets from operations attributable to contractholders 7,073 16,204 Adjustments
Realized (gains) losses (729) (478) Unrealized (gains) losses 2,106 (10,909) Gross proceeds of disposition of investments 5,420 5,904 Gross payments for the purchase of investments (208) – Change in distribution income of underlying mutual fund (9,141) (5,453) Change in due from/to The Canada Life Assurance Company 69 (13)
4,590 5,255 Financing Activities Contractholder deposits 394 483
Contractholder withdrawals (5,165) (5,613) (4,771) (5,130)
Net increase (decrease) in cash, short-term deposits and overdrafts (181) 125
Cash, short-term deposits and overdrafts, beginning of year (35) (160)
Cash, short-term deposits and overdrafts, end of year (216) (35)
Statement of Changes in Net Assets Attributable to Contractholders
(in Canadian $ thousands) For the years ended
December 31, 2017
December 31, 2016
Net assets attributable to contractholders - beginning of year 73,633 62,559
Contractholder deposits 394 483
Contractholder withdrawals (5,165) (5,613)
Increase (decrease) in net assets from operations attributable to contractholders 7,073 16,204
Change in net assets attributable to contractholders 2,302 11,074
Net assets attributable to contractholders - end of year 75,935 73,633

10 Canadian Equity Fund (SRA) SF274 | Annual audited financial statements and unaudited supplementary financial information | The Canada Life Assurance Company 5
03
0 C
AN
50
30
CA
N
Top 25 Holdings
Security Description % of Total
Royal Bank of Canada 9.84%
The Toronto-Dominion Bank 9.54%
Canadian Imperial Bank of Commerce
6.42%
Canadian National Railway Co. 4.87%
The Bank of Nova Scotia 4.82%
Agrium Inc. 4.35%
Bank of Montreal 4.23%
Suncor Energy Inc. 4.16%
Manulife Financial Corp. 4.11%
Magna International Inc. Class A 3.84%
Power Corp. of Canada* 3.54%
Westjet Airlines Ltd. 3.18%
Canadian Natural Resources Ltd. 3.12%
Goldcorp Inc. 3.05%
Canadian Pacific Railway Ltd. 2.72%
Methanex Corp. 2.67%
Rogers Communications Inc. Class B 2.59%
TELUS Corp. 2.37%
Enbridge Inc. 2.04%
Cenovus Energy Inc. 1.90%
Crescent Point Energy Corp. 1.81%
CI Financial Corp. 1.62%
Lundin Mining 1.40%
Gildan Activewear Class A 1.33%
Element Fleet Management Corp. 1.24%
*The issuer of this security is a related company to the issuer of the fund.

Canadian Equity Fund (SRA) SF274 | Annual audited 11 financial statements and unaudited supplementary financial information | The Canada Life Assurance Company 5
03
0 C
AN
50
30
CA
N
Notes to the Financial Statements (in Canadian $ thousands)
1. THE FUND The Canadian Equity Fund (SRA) SF274 (the Fund) is offered by The Canada Life Assurance Company.
The Canada Life Assurance Company (the Company) is the sole issuer of the insurance contracts providing for investment in the Fund. The assets of the Fund are owned by the Company and are segregated from the other assets of the Company. The Fund is not a separate legal entity. The Fund invests in a portfolio of assets to generate returns in the form of investment income and capital appreciation for the contractholders, who are the ultimate beneficiaries of the Fund. The Fund’s investment activities are overseen by the Company.
The Company is an indirect wholly owned subsidiary of Great-West Lifeco Inc. (Lifeco), a publicly listed company incorporated and domiciled in Canada. Lifeco is a member of the Power Financial Corporation (Power Financial) group of companies and its direct parent is Power Financial.
The Fund’s registered office is at 330 University Avenue, Toronto, Ontario, Canada, M5G 1R8.
The Financial Statements of the Fund as at and for the year ended December 31, 2017 were approved for issue by the Company on March 9, 2018.
2. SUMMARY OF SIGNIFICANT ACCOUNTING POLICIES
The financial statements of the Fund have been prepared in compliance with International Financial Reporting Standards (IFRS), as issued by the International Accounting Standards Board (IASB). Uniform accounting policies were applied in the preparation of the Fund’s financial statements. These accounting policies are based on the IFRS and IFRS Interpretations Committee (IFRIC) interpretations issued and effective at December 31, 2017. The financial statements of the Fund have also been prepared in accordance with the requirements of Part XII of the Canadian Life and Health Insurance Association Guideline G2.

12 Canadian Equity Fund (SRA) SF274 | Annual audited financial statements and unaudited supplementary financial information | The Canada Life Assurance Company 5
03
0 C
AN
50
30
CA
N
SUMMARY OF SIGNIFICANT ACCOUNTING POLICIES (Continued)
a) Use of Estimates, Significant Accounting Judgements and Assumptions The preparation of the Fund’s financial statements in accordance with IFRS requires management to make estimates, judgments and assumptions that affect the reported amount of assets and liabilities at the reporting date and the reported amount of revenues and expenses during the reporting period. The valuation of investments is the most significant component of the financial statements subject to estimates. Although some variability is inherent in these judgments and assumptions, the Fund believes that the amounts recorded are reasonable.
When the fair values of financial assets and financial liabilities recorded in the Statement of Financial Position cannot be derived from active markets, the fair value is determined using a variety of valuation techniques that include the use of valuation models. The inputs to these models are taken from observable markets where possible, but where this information is not available, estimation is required in establishing fair values. The estimates include consideration of liquidity and model inputs related to items such as credit risk (both own and counterparty’s), correlation and volatility. Changes in assumptions about these factors could affect the reported fair value of financial instruments in the Statement of Financial Position and the level where the financial instruments are disclosed in the fair value hierarchy. Actual results could differ from these estimates.

Canadian Equity Fund (SRA) SF274 | Annual audited 13 financial statements and unaudited supplementary financial information | The Canada Life Assurance Company 5
03
0 C
AN
50
30
CA
N
SUMMARY OF SIGNIFICANT ACCOUNTING POLICIES (Continued)
Entities that meet the definition of an investment entity within IFRS 10, Consolidated Financial Statements are required to measure their subsidiaries at fair value through profit or loss rather than consolidate them. The criteria which define an investment entity are, as follows:
• An entity that obtains funds from one or more investors for the purpose of providing those investors with investment services;
• An entity that commits to its investors that its business purpose is to invest funds solely for returns from capital appreciation, investment income or both; and
• An entity that measures and evaluates the performance of substantially all of its investments on a fair value basis.
In the judgment of management, the Fund meets the definition of an investment entity. This conclusion will be reassessed on a periodic basis, if any changes in criteria or circumstances exist.
b) Fair Value Measurement and Classification The fair value of financial assets and liabilities have been categorized based upon the following fair value hierarchy:
Level 1: Fair value measurements utilize observable, quoted prices (unadjusted) in active markets for identical assets or liabilities that the Fund has the ability to access. Assets and liabilities utilizing Level 1 inputs include equity securities that are actively traded on an exchange and underlying mutual funds which have available prices in an active market with no redemption restrictions.
Level 2: Fair value measurements utilize inputs other than quoted prices included in Level 1 that are observable for the asset or liability, either directly or indirectly. Level 2 inputs include quoted prices for similar assets and liabilities in active markets, and inputs other than quoted prices that are observable for the asset or liability, such as interest rates and yield curves that are observable at commonly quoted intervals. The fair values for some Level 2 securities were obtained from a pricing service. The pricing service inputs include, but are not limited to, benchmark yields, reported trades, broker/ dealer quotes, issuer spreads, two-sided markets, benchmark securities, offers and reference data.

14 Canadian Equity Fund (SRA) SF274 | Annual audited financial statements and unaudited supplementary financial information | The Canada Life Assurance Company 5
03
0 C
AN
50
30
CA
N
SUMMARY OF SIGNIFICANT ACCOUNTING POLICIES (Continued)
Level 2 assets and liabilities include those priced using a matrix which is based on credit quality and average life, and include some private bonds and equities, most investment-grade and high-yield corporate bonds, most asset-backed securities, most over-the-counter derivatives, and mortgage loans.
Level 3: Fair value measurements utilize one or more significant inputs that are not based on observable market inputs and include situations where there is little, if any, market activity for the asset or liability. The values of the majority of Level 3 securities were obtained from single broker quotes, internal pricing models, or external appraisers. Assets and liabilities utilizing Level 3 inputs generally include certain bonds and private investments.
For assets and liabilities that are recognized in the financial statements on a recurring basis, the Fund determines whether transfers have occurred between levels in the hierarchy by re-assessing the categorization (based on the lowest level input that is significant to the fair value measurement as a whole) at the end of each reporting period.
Fair values of financial instruments are classified as Level 1 when the related security or derivative is actively traded and a quoted price is available. If an instrument classified as Level 1 subsequently ceases to be actively traded, it is transferred out of Level 1. In such cases, instruments are reclassified into Level 2, unless the measurement of its fair value requires the use of significant unobservable inputs, in which case it is classified as Level 3. Additional disclosures relating to transfers between levels and a reconciliation of beginning and ending balances in Level 3 are included in the notes to the Schedule of Investment Portfolio, where applicable.
Level 3 financial instruments are reviewed on a periodic basis by the Fund’s Administrator. The Fund’s Administrator considers the appropriateness of the valuation model inputs, as well as the valuation result using various valuation methods and techniques generally recognized as standard within the industry.

Canadian Equity Fund (SRA) SF274 | Annual audited 15 financial statements and unaudited supplementary financial information | The Canada Life Assurance Company 5
03
0 C
AN
50
30
CA
N
SUMMARY OF SIGNIFICANT ACCOUNTING POLICIES (Continued)
The Company estimates the fair value of bonds not traded in active markets by referring to actively traded securities with similar attributes, dealer quotations, matrix pricing methodology, discounted cash flow analyses and/or internal valuation models. This methodology considers such factors as the issuer’s industry, the security’s rating, term, coupon rate and position in the capital structure of the issuer, as well as, yield curves, credit curves, prepayment rates and other relevant factors. For bonds that are not traded in active markets, valuations are adjusted to reflect illiquidity, and such adjustments generally are based on available market evidence. In the absence of such evidence, management’s best estimate is used.
Transfers into Level 3 are due primarily to decreased observability of inputs in valuation methodologies. Transfers out of Level 3 are due primarily to increased observability of inputs in valuation methodologies as evidenced by corroboration of market prices with multiple pricing vendors.
The Fund’s fair value hierarchy classification of its assets and liabilities is included in note 9 on Financial Instrument Risk Management.
The Fund classifies its financial assets and financial liabilities at initial recognition at fair value through profit or loss into the following:
Financial assets and liabilities held-for-trading: financial assets are classified as held-for-trading if they are acquired for the purpose of selling and/ or repurchasing in the near term. Derivatives are classified as held-for-trading unless they are designated as effective hedging instruments as defined by IAS 39, Financial Instruments: Recognition and Measurement. The Fund’s policy is not to apply hedge accounting.
Financial instruments designated as fair value through profit or loss upon initial recognition: these include stocks, bonds, and other interest-bearing investments. These financial assets are designated upon initial recognition on the basis that they are part of a group of financial assets that are managed and have their performance evaluated on a fair value basis, in accordance with risk management and investment strategies of the Fund, as set out in the Fund’s offering document.

16 Canadian Equity Fund (SRA) SF274 | Annual audited financial statements and unaudited supplementary financial information | The Canada Life Assurance Company 5
03
0 C
AN
50
30
CA
N
SUMMARY OF SIGNIFICANT ACCOUNTING POLICIES (Continued)
The following is a summary of the classification of financial instruments in accordance with IAS 39, Financial Instruments: Recognition and Measurement:
Financial Instrument Classification
Cash, short-term deposits and overdrafts
Loans and receivables
Investment income due and accrued
Loans and receivables
Due to/from The Canada Life Assurance Company
Loans and receivables
Due to/from brokers Loans and receivables
Due to/from outside parties
Loans and receivables
Bonds Fair value through profit or loss
Stocks Fair value through profit or loss
Investment fund units Fair value through profit or loss
Derivatives Held-for-trading
Net assets attributable to contractholders
Fair value through profit or loss
All financial instruments classified as loans and receivables are held at cost, which approximates their fair value.
c) Investment Fund Units Investment fund units are recorded at fair value, which is the closing net asset value (NAV) per unit of the underlying fund.
d) Cash, Short-term Deposits and Overdrafts Cash, short-term deposits and overdrafts are comprised of cash on deposit, short-term deposits and overdrafts with terms to maturity of less than three months at acquisition. Cash, short-term deposits and overdrafts are held at cost, which approximates fair value.
e) Classification of Units Issued by the Fund The units of the Fund are classified as financial liabilities under IFRS as the Fund is contractually obligated to repurchase or redeem them for cash or another financial asset when the units are disposed. The net assets attributable to contractholders are classified as fair value through profit or loss.

Canadian Equity Fund (SRA) SF274 | Annual audited 17 financial statements and unaudited supplementary financial information | The Canada Life Assurance Company 5
03
0 C
AN
50
30
CA
N
SUMMARY OF SIGNIFICANT ACCOUNTING POLICIES (Continued)
f) Recognition of Investments and Income Financial investment purchases and sales are recorded when the Fund becomes a party to the contractual provisions of the instrument on a trade date basis.
Financial assets and financial liabilities at fair value through profit or loss are recorded in the Statement of Financial Position at fair value.
The accrual basis of accounting is used to record all types of investment income earned and expenses incurred by the Fund.
The following are included in net gain (loss) on investments on the Statement of Comprehensive Income:
Realized gains (losses) on investments - recorded upon the sale or maturity of an asset and determined using the average cost basis.
Unrealized gains (losses) on investments - calculated as the in-year change in fair value of the investment and determined using the average cost basis.
After initial measurement, the Fund measures financial instruments which are classified as fair value through profit or loss, at fair value at the reporting date. Changes in the fair value of those financial instruments are recorded in net gain (loss) on investments in the Statement of Comprehensive Income.
Foreign currency Foreign currency translations are calculated using the exchange rate in effect when the transaction occurred. Monetary assets and liabilities denominated in foreign currencies are re-translated at the functional currency rate of exchange at the reporting date. Non-monetary items that are measured in terms of historical cost in a foreign currency are translated using the exchange rates as at the dates of the initial transactions. Non-monetary items measured at fair value in a foreign currency are translated using the exchange rates at the date when the fair value was determined. The gains or losses generated by foreign exchange are recorded in the Statement of Comprehensive Income within net gain (loss) on investments.

18 Canadian Equity Fund (SRA) SF274 | Annual audited financial statements and unaudited supplementary financial information | The Canada Life Assurance Company 5
03
0 C
AN
50
30
CA
N
SUMMARY OF SIGNIFICANT ACCOUNTING POLICIES (Continued)
g) Offsetting of Financial Instruments Financial assets and financial liabilities are offset and the net amount reported in the Statement of Financial Position if there is a currently enforceable legal right to offset the recognized amounts and there is an intention to settle on a net basis, or to realize the asset and settle the liability simultaneously.
h) Amounts Due to/from Broker Amounts due to brokers are payables for securities purchased (in a regular way transaction) that have been contracted for, but not yet delivered, on the reporting date.
Amounts due from brokers include margin accounts and receivables for securities sold (in a regular way transaction) that have been contracted for, but not yet delivered, on the reporting date.
Amounts due to/from brokers are held at cost, classified as loans and receivables, and their cost approximates their fair value.
Amounts due to/from brokers are settled within a few business days of the reporting date.
i) Amounts Due to/from Outside Parties Amounts due to outside parties are payables to parties other than related parties of the Fund.
Amounts due from outside parties are receivables due from parties other than related parties of the Fund.
Amounts due to/from outside parties are held at cost, classified as loans and receivables, and their cost approximates their fair value.
j) Other Expenses Other expenses consist primarily of securities handling charges. All these expenses are paid to third parties. The accrual basis of accounting is used to record all types of expenses incurred by the Fund.
k) Income Allocation Net gain (loss) on investments, which includes realized gains and losses and unrealized gains and losses, accrues to each contractholder through the increase (decrease) of the net asset value (NAV) per unit.
l) Issue and Redemption of Units Units attributable to contractholders are redeemable at the contractholders’ option at prices based on the Fund’s NAV per unit at the time of redemption and are therefore classified as financial liabilities.
Canadian Equity Fund (SRA) SF274 | Annual audited 19 financial statements and unaudited supplementary financial information | The Canada Life Assurance Company 5
03
0 C
AN
50
30
CA
N
SUMMARY OF SIGNIFICANT ACCOUNTING POLICIES (Continued)
Units are issued and redeemed at their NAV per unit established as noted in the information folder of the Fund. The Fund’s obligation for net assets attributable to contractholders is presented at the redemption amount at the reporting date. The deposits and withdrawals of contractholders are adjusted for inter-fund transfers.
m) Presentation Currency The financial statements have been presented in Canadian dollars, which is the currency of the primary economic environment in which the Fund is domiciled and is the Fund’s functional currency.
n) Future Accounting Policies IFRS 9, Financial Instruments
In July 2014, the IASB issued a final version of IFRS 9, Financial Instruments to replace IAS 39, Financial Instruments: Recognition and Measurement. The standard provides changes to financial instruments accounting for the following: • Classification and measurement of financial
instruments based on a business model approach for managing financial assets and the contractual cash flow characteristics of the financial asset;
• Impairment based on an expected loss model; and • Hedge accounting that incorporates the risk
management practices of an entity. The standard is effective January 1, 2018. Adoption of this standard is not expected to have a significant impact on the Fund’s financial statements.
IFRS 15, Revenue from Contracts with Customers
In May 2014, the IASB issued IFRS 15, Revenue from Contracts with Customers (IFRS 15), which replaces IAS 11, Construction Contracts and IAS 18, Revenue. This standard provides a single revenue recognition standard to align the financial reporting of revenue from contracts with customers and related costs. The revenue arising from leases and financial instruments are out of scope of IFRS 15. A fund would recognize revenue when it transfers goods or services to a customer in the amount of consideration the fund expects to receive from the customer.
The Fund will be adopting the standard on its effective date of Jan. 1, 2018. Adoption of this standard will have no impact on the Fund’s financial statements.

20 Canadian Equity Fund (SRA) SF274 | Annual audited financial statements and unaudited supplementary financial information | The Canada Life Assurance Company 5
03
0 C
AN
50
30
CA
N
3. INVESTMENT FUND UNITS Investment fund units of the Fund invest solely in underlying mutual funds.
As the Fund’s assets are invested in underlying investment funds, the Fund indirectly pays management fees and operating expenses of the underlying funds. All such charges are included in the management expense ratio of the segregated funds.
Distributions of income from the underlying investment funds are shown as net gain (loss) on investments on the Statement of Comprehensive Income.
Investment activity of the underlying fund indirectly exposes the Fund to financial risk. See note 9 on Financial Instrument Risk Management.
Investments in unconsolidated structured entities The Company has determined that the Fund meets the definition of an investment entity and as such, accounts for its holdings in unlisted open-ended investment funds, at fair value through profit or loss. The Company has concluded that the underlying funds in which the Fund invests, but do not consolidate, meet the definition of structured entities because: (i) the voting rights in the underlying funds are not dominant rights in deciding who controls them; (ii) each underlying fund’s activities are restricted by its prospectus; and (iii) the underlying funds have narrow and well-defined objectives to provide investment opportunities to investors.
Canadian Equity Fund (SRA) SF274 | Annual audited 21 financial statements and unaudited supplementary financial information | The Canada Life Assurance Company 5
03
0 C
AN
50
30
CA
N
4. DESCRIPTION OF UNITS The capital of the Fund is divided into a category of units.
Individual units are available to individuals for investment in:
• Registered Retirement Savings Plans,
• Registered Savings Plans,
• Tax Free Savings Accounts, and
• Non-Registered Savings Plans through the purchase of an Individual Savings Contract or a Retirement Income Fund.
Individual units are available under this option:
• Ingenium
The category of units is accounted for separately and any increases or decreases in net assets attributable to contractholders during the year are allocated to the category.
5. CAPITAL MANAGEMENT The Fund is not subject to externally imposed capital requirement and has no legal restrictions on the issue, repurchase or resale of redeemable units beyond those included in the Fund’s offering document. Units are redeemed at the NAV per unit of a Fund on the redemption date. The capital received by a Fund is utilized within the respective investment mandate of the Fund.

22 Canadian Equity Fund (SRA) SF274 | Annual audited financial statements and unaudited supplementary financial information | The Canada Life Assurance Company 5
03
0 C
AN
50
30
CA
N
6. INCOME TAXES The Fund is deemed to be a Trust under the provisions of the Income Tax Act (Canada). Income of a segregated fund is deemed to be payable to the contractholders and therefore the segregated fund will not have taxable income. In addition, capital gains and losses are deemed to be those of the contractholders and not of the trusts. Realized gains or losses may be reduced by the amount of gains or losses realized by contractholders on the redemption of their investment. As a result, no provision of income tax is required in the financial statements of the Fund.
Foreign investment income is subject to withholding tax deducted at the source of the income in some jurisdictions. Withholding tax is a generic term used for the amount of withholding tax deducted at the source of the income. The Fund presents the withholding tax separately from the net gain (loss) on investments in the Statement of Comprehensive Income.
7. NET ASSETS ATTRIBUTABLE TO CONTRACTHOLDERS PER UNIT
The presentation of unit values is broken down by contractholder category.
Net increase (decrease) in net assets from operations attributable to contractholders per unit per category is calculated by dividing the net increase (decrease) in net assets attributable to contractholders from operations as disclosed in the Statement of Comprehensive Income, by the weighted average number of units of each category outstanding during the year.
The NAV per unit for group contractholders has not been shown because it will vary for each sub-class within the group contractholder class based on negotiated expense levels and other factors.

Canadian Equity Fund (SRA) SF274 | Annual audited 23 financial statements and unaudited supplementary financial information | The Canada Life Assurance Company 5
03
0 C
AN
50
30
CA
N
8. RELATED PARTY TRANSACTIONS Lifeco controls The Great-West Life Assurance Company (GWL) which is the parent of Canada Life Financial Corporation, the direct parent of the Company. As such, the Company is related to Lifeco and its other major operating subsidiaries. In addition, Lifeco is a member of the Power Financial group of companies. Through this relationship, the Company is related to IGM Financial Inc., a company in the financial services sector along with its subsidiaries Investors Group Inc. and Mackenzie Inc.
The financial statements of the Fund may include transactions with the following related parties to the Company:
Related party Relationship Incorporated in
The Great-West Life Assurance Company
Indirect parent of the Company
Canada
GLC Asset Management Group Ltd.
Wholly owned subsidiary of GWL
Canada
Setanta Asset Management Limited
Indirect wholly owned subsidiary of GWL
Ireland
Putnam Investments, LLC
Wholly owned subsidiary of Lifeco
United States
IGM Financial Inc. Subsidiary of Power Financial
Canada
Canada Life Investments
Indirect wholly owned subsidiary of the Company
United Kingdom
a. The Company provides management, advisory and administrative services to the Fund which includes the services of key management personnel. In respect of these services, the Fund is charged management and other fees which are at market terms and conditions. Management fees and other fees charged to other categories are calculated at set rates applied against the net assets of the specific category at each valuation date.
b. The amounts shown as “Due from (to) The Canada Life Assurance Company” represents outstanding management fees, un-cleared deposits/withdrawals and investment activity from the December 31, 2017 valuation date of the fund.

24 Canadian Equity Fund (SRA) SF274 | Annual audited financial statements and unaudited supplementary financial information | The Canada Life Assurance Company 5
03
0 C
AN
50
30
CA
N
9. FINANCIAL INSTRUMENT RISK MANAGEMENT
a) Risk Management The Fund’s investment activities expose it to a variety of financial risks. The Schedule of Investment Portfolio presents the securities held by the Fund as at December 31, 2017. The following sections describe the significant risks that are relevant to the Fund.
To assist with managing risk, the Fund Manager maintains a governance structure that oversees the Fund’s investment activities and monitors compliance with the Fund’s stated investment strategy and securities regulations. Financial Statements for the underlying funds, which include discussions about their respective risk exposure, are available upon request.
b) Liquidity Risk Liquidity risk arises when a Fund encounters difficulty in meeting its financial obligations as they come due. The Fund is exposed to liquidity risk due to potential daily cash redemptions of redeemable units. As the Fund primarily invests all of its net assets in the underlying funds, liquidity risk is mitigated by the underlying funds’ ability to meet the obligation to fund daily cash redemptions of their redeemable units/shares. In addition, the underlying funds retain sufficient cash and cash equivalent positions to maintain adequate liquidity.
c) Currency Risk Currency risk is the risk that financial instruments which are denominated or exchanged in a currency other than the Canadian dollar, which is the Fund’s reporting currency, will fluctuate due to changes in exchange rates. The Fund’s investments in all underlying funds are denominated in Canadian dollars. However, the Fund is indirectly exposed to currency risk to the extent that the investments of the underlying funds are denominated or traded in a foreign currency.

Canadian Equity Fund (SRA) SF274 | Annual audited 25 financial statements and unaudited supplementary financial information | The Canada Life Assurance Company 5
03
0 C
AN
50
30
CA
N
d) Interest Rate Risk Interest rate risk arises on interest-bearing financial instruments such as bonds. The Fund does not directly hold any interest-bearing financial instruments. The Fund is indirectly exposed to the risk that the value of interest-bearing financial instruments held by the underlying funds will fluctuate due to changes in the prevailing levels of market interest rates.
e) Credit Risk Credit risk is the risk that a counterparty to a financial instrument will fail to discharge an obligation or commitment that it has entered into with the Fund. The Fund has no direct exposure to credit risk. The greatest indirect concentration of credit risk is in debt securities, such as bonds, held by underlying funds. The fair value of debt securities includes consideration of the credit worthiness of the debt issuer.
f) Other Price Risk Other price risk is the risk that the value of financial instruments will fluctuate as a result of changes in market prices (other than those arising from interest rate, currency or credit risk), whether caused by factors specific to an individual investment, its issuer, or all factors affecting all instruments traded in a market or market segment. All securities present a risk of loss of capital. For the instruments held by the Fund, maximum risk of loss is equivalent to their fair value. The Fund Manager moderates this risk through a careful selection of underlying funds within the parameters of the investment strategy.
g) Fair Value Classification Investment Fund Units are recorded at fair value, which is the closing NAV per unit of the underlying fund. This valuation is considered to be a Level 1 classification.

26 Canadian Equity Fund (SRA) SF274 | Annual audited financial statements and unaudited supplementary financial information | The Canada Life Assurance Company 5
03
0 C
AN
50
30
CA
N
Supplemental Information (unaudited)
The following tables show selected key financial information about the Fund and are intended to help users of the financial statements understand the Fund’s financial performance.
Management expense ratio The management expense ratio has been calculated as the aggregate of all fees, taxes, charges and other expenses incurred during the year divided by the average daily net asset value of the segregated fund attributable to the particular fee option. All ratios shown are on an annual basis. In circumstances where the particular fund or fee option did not have twelve months’ exposure the ratios have been annualized. Management expense ratios are calculated for Individual Retirement and Investment Services clients only. No management expense ratio is calculated for the Preferred Series 2 guarantee policy option as such fees are charged directly to the contractholder.
Canadian Equity Fund (SRA) SF274 Management Expense Ratio (%) For the years ended December 31
2017 2016 2015 2014 2013
0.95 0.95 0.95 0.89 0.95

Canadian Equity Fund (SRA) SF274 | Annual audited 27 financial statements and unaudited supplementary financial information | The Canada Life Assurance Company 5
03
0 C
AN
50
30
CA
N
Portfolio turnover rate The portfolio turnover rates presented in the financial statements reflects the Canadian Life and Health Insurance Association Inc. (CLHIA) Guideline G2, Individual Variable Insurance Contracts Relating to Segregated Funds 12.3(a)(iii). The portfolio turnover rates indicate how actively the portfolio investments have been bought or sold throughout the year. A portfolio turnover rate of 100% is equivalent to the Fund buying and selling all of the securities in its portfolio once in the course of the year.
Canadian Equity Fund (SRA) SF274 Portfolio Turnover Rate (%) For the years ended December 31
2017 2016 2015 2014 2013
0.28 8.76 0.03 0.18 5.31

28 Canadian Equity Fund (SRA) SF274 | Annual audited financial statements and unaudited supplementary financial information | The Canada Life Assurance Company 5
03
0 C
AN
50
30
CA
N
Month end unit values for the period ending Dec. 31, 2017
Supplemental Information (unaudited)
Month end unit values for the period ending December 31, 2017
88-215
1C
Month end Month end unit
values ($)
December 31, 2017 811.00
November 24, 2017 800.61
October 27, 2017 792.24
September 29, 2017 770.86
August 25, 2017 734.41
July 28, 2017 737.05
June 30, 2017 729.36
May 26, 2017 740.98
April 28, 2017 747.93
March 31, 2017 752.79
February 24, 2017 755.40
January 27, 2017 758.67
December 31, 2016 736.97
$700
$800
$750
$850
Dec.2016
Jan. Feb. March April May June July Aug. Sept. Oct. Nov. Dec.2017

Canadian Equity Fund (SRA) SF274 | Annual audited 29 financial statements and unaudited supplementary financial information | The Canada Life Assurance Company 5
03
0 C
AN
50
30
CA
N
Ten-year history of the fund and the number of policies outstanding (unaudited)
Period-end Period-end unit values ($)
Net asset value at period-end ($ thousands)
Number of policies at period-end
December 31, 2008 357.77 66,010 5,285
December 31, 2009 489.79 84,595 5,069
December 31, 2010 563.03 90,819 4,789
December 31, 2011 492.03 72,617 4,533
December 31, 2012 544.60 74,056 4,259
December 31, 2013 615.65 77,605 4,010
December 31, 2014 635.85 73,427 3,821
December 31, 2015 587.18 62,559 3,625
December 31, 2016 736.97 73,633 3,428
December 31, 2017 811.00 75,935 3,257
30 Canadian Equity Fund (SRA) SF274 | Annual audited financial statements and unaudited supplementary financial information | The Canada Life Assurance Company 5
03
0 C
AN
50
30
CA
N
TOTAL COST MARKET VALUE % OF TOTAL
$7,216,222.96 $6,477,219.00 0.83%
$16,646,026.94 $21,907,034.80 2.80%
$26,822,040.08 $14,261,718.80 1.82%
$13,067,844.62 $13,129,390.00 1.68%
$15,238,622.22 $15,033,128.00 1.92%
$20,655,483.17 $29,840,682.30 3.81%
$21,814,718.45 $26,405,288.00 3.37%
$6,101,586.53 $4,465,723.20 0.57%
$9,299,296.61 $5,896,110.00 0.75%
$136,861,841.58 $137,416,294.10 17.55%
$19,679,160.98 $32,299,172.00 4.12%
$24,203,786.63 $11,267,818.56 1.44%
$25,838,557.81 $21,658,133.00 2.76%
$6,912,465.80 $10,848,772.00 1.38%
$9,700,900.15 $9,029,740.00 1.15%
$11,033,188.09 $18,902,912.00 2.41%
$31,543,431.58 $8,317,421.20 1.06%
$7,537,539.68 $7,566,674.00 0.97%
$136,449,030.72 $119,890,642.76 15.29%
$14,293,419.78 $35,853,571.50 4.58%
$15,673,025.64 $20,095,250.00 2.56%
$19,294,306.87 $23,378,684.00 2.98%
$49,260,752.29 $79,327,505.50 10.12%
$4,993,027.24 $9,665,180.00 1.23%
$13,018,584.28 $28,446,132.00 3.63%
$18,011,611.52 $38,111,312.00 4.86%
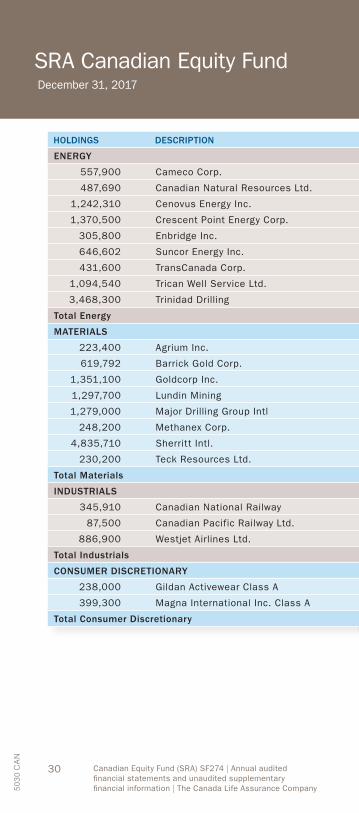
SRA Canadian Equity Fund December 31, 2017
HOLDINGS DESCRIPTION
ENERGY
557,900 Cameco Corp.
487,690 Canadian Natural Resources Ltd.
1,242,310 Cenovus Energy Inc.
1,370,500 Crescent Point Energy Corp.
305,800 Enbridge Inc.
646,602 Suncor Energy Inc.
431,600 TransCanada Corp.
1,094,540 Trican Well Service Ltd.
3,468,300 Trinidad Drilling
Total Energy
MATERIALS
223,400 Agrium Inc.
619,792 Barrick Gold Corp.
1,351,100 Goldcorp Inc.
1,297,700 Lundin Mining
1,279,000 Major Drilling Group Intl
248,200 Methanex Corp.
4,835,710 Sherritt Intl.
230,200 Teck Resources Ltd.
Total Materials
INDUSTRIALS
345,910 Canadian National Railway
87,500 Canadian Pacific Railway Ltd.
886,900 Westjet Airlines Ltd.
Total Industrials
CONSUMER DISCRETIONARY
238,000 Gildan Activewear Class A
399,300 Magna International Inc. Class A
Total Consumer Discretionary

Canadian Equity Fund (SRA) SF274 | Annual audited 31 financial statements and unaudited supplementary financial information | The Canada Life Assurance Company 5
03
0 C
AN
50
30
CA
N
HOLDINGS DESCRIPTION
ENERGY
557,900 Cameco Corp.
487,690 Canadian Natural Resources Ltd.
1,242,310 Cenovus Energy Inc.
1,370,500 Crescent Point Energy Corp.
305,800 Enbridge Inc.
646,602 Suncor Energy Inc.
431,600 TransCanada Corp.
1,094,540 Trican Well Service Ltd.
3,468,300 Trinidad Drilling
Total Energy
MATERIALS
223,400 Agrium Inc.
619,792 Barrick Gold Corp.
1,351,100 Goldcorp Inc.
1,297,700 Lundin Mining
1,279,000 Major Drilling Group Intl
248,200 Methanex Corp.
4,835,710 Sherritt Intl.
230,200 Teck Resources Ltd.
Total Materials
INDUSTRIALS
345,910 Canadian National Railway
87,500 Canadian Pacific Railway Ltd.
886,900 Westjet Airlines Ltd.
Total Industrials
CONSUMER DISCRETIONARY
238,000 Gildan Activewear Class A
399,300 Magna International Inc. Class A
Total Consumer Discretionary
The unaudited portfolio of investments of the Canadian Equity fund (SRA), as provided by the Fund Manager, is as follows.
TOTAL COST MARKET VALUE % OF TOTAL
$7,216,222.96 $6,477,219.00 0.83%
$16,646,026.94 $21,907,034.80 2.80%
$26,822,040.08 $14,261,718.80 1.82%
$13,067,844.62 $13,129,390.00 1.68%
$15,238,622.22 $15,033,128.00 1.92%
$20,655,483.17 $29,840,682.30 3.81%
$21,814,718.45 $26,405,288.00 3.37%
$6,101,586.53 $4,465,723.20 0.57%
$9,299,296.61 $5,896,110.00 0.75%
$136,861,841.58 $137,416,294.10 17.55%
$19,679,160.98 $32,299,172.00 4.12%
$24,203,786.63 $11,267,818.56 1.44%
$25,838,557.81 $21,658,133.00 2.76%
$6,912,465.80 $10,848,772.00 1.38%
$9,700,900.15 $9,029,740.00 1.15%
$11,033,188.09 $18,902,912.00 2.41%
$31,543,431.58 $8,317,421.20 1.06%
$7,537,539.68 $7,566,674.00 0.97%
$136,449,030.72 $119,890,642.76 15.29%
$14,293,419.78 $35,853,571.50 4.58%
$15,673,025.64 $20,095,250.00 2.56%
$19,294,306.87 $23,378,684.00 2.98%
$49,260,752.29 $79,327,505.50 10.12%
$4,993,027.24 $9,665,180.00 1.23%
$13,018,584.28 $28,446,132.00 3.63%
$18,011,611.52 $38,111,312.00 4.86%
32 Canadian Equity Fund (SRA) SF274 | Annual audited financial statements and unaudited supplementary financial information | The Canada Life Assurance Company 5
03
0 C
AN
50
30
CA
N
SRA Canadian Equity FundDecember 31, 2017
HOLDINGS DESCRIPTION TOTAL COST MARKET VALUE % OF TOTAL
$28,825,230.70 $30,428,475.00 3.88%
$21,163,265.72 $34,719,360.00 4.43%
$12,598,424.13 $12,036,011.00 1.54%
$23,841,209.34 $42,781,164.80 5.46%
$5,521,770.25 $6,686,109.00 0.85%
$11,865,391.53 $9,093,400.00 1.16%
$21,909,706.82 $28,750,754.40 3.67%
$24,855,397.64 $25,954,266.00 3.31%
$42,950,795.21 $76,012,325.00 9.70%
$39,128,202.24 $71,773,839.90 9.16%
$232,659,393.58 $338,235,705.10 43.16%
$5,793,390.60 $5,708,258.00 0.73%
$5,793,390.60 $5,708,258.00 0.73%
$3,221,294.93 $5,327,206.64 0.68%
$10,737,003.64 $19,064,162.25 2.43%
$8,395,576.29 $17,276,536.00 2.20%
$22,353,874.86 $41,667,904.89 5.32%
$1,831,410.00 $1,873,485.00 0.24%
$8,579,573.81 $9,216,395.00 1.18%
$10,410,983.81 $11,089,880.00 1.42%
$4,095,144.14 $4,481,360.00 0.57%
$4,095,144.14 $4,481,360.00 0.57%
$2,394,866.74 $2,394,866.74 0.31%
$23,089,197.31 $23,089,197.31 2.95%
($25,985,594.85) ($25,985,594.85) -3.32%
$199,874.00 $199,950.70 0.03%
$948,884.14 $949,343.36 0.12%
$6,941,443.00 $6,942,318.86 0.89%
$7,588,670.34 $7,590,082.12 0.98%
$623,484,693.44 $783,518,944.47 100.00%
FINANCIALS
302,500 Bank of Montreal
428,000 Bank of Nova Scotia
404,300 CI Financial Corp.
349,120 Canadian Imperial Bank of Commerce
1,701,300 ECN Capital Corp
957,200 Element Fleet Management Corp
1,096,520 Manulife Financial Corp.
801,800 Power Corp. of Canada
740,500 Royal Bank of Canada
974,526 Toronto-Dominion Bank
Total Financials
INFORMATION TECHNOLOGY
433,100 Celestica Inc.
Total Information Technology
TELECOMMUNICATION SERVICES
88,228 BCE Inc.
297,645 Rogers Comm Inc. Class B
362,800 Telus Corp.
Total Telecommunication Services
UTILITIES
76,500 Capital Power Corp
1,237,100 Transalta Corp.
Total Utilities
REAL ESTATE
104,000 Boardwalk Real Estate Investment Trust
Total Real Estate
CASH AND EQUIVALENT
2,394,866.74 Dividend Accrual
23,089,197.31 Due From Broker (CAD)
-25,985,594.85 Canadian Cash Account
200,000 Canada Tbills
950,000 Canada Tbills
6,950,000 Canada Tbills
Total Cash and Equivalent
TOTAL PORTFOLIO

Canadian Equity Fund (SRA) SF274 | Annual audited 33 financial statements and unaudited supplementary financial information | The Canada Life Assurance Company 5
03
0 C
AN
50
30
CA
N
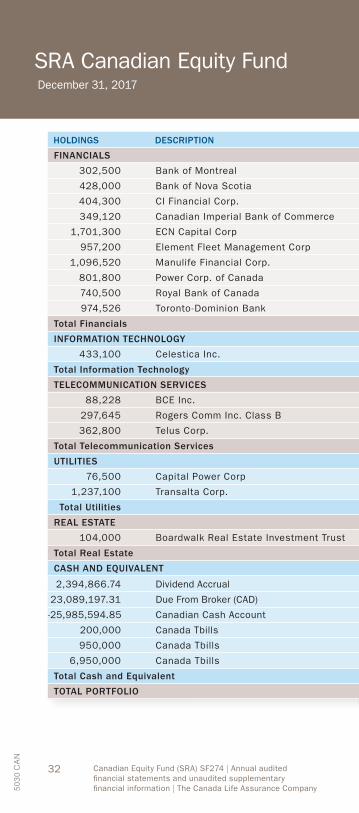
The unaudited portfolio of investments of the Canadian Equity fund (SRA), as provided by the Fund Manager, is as follows.
HOLDINGS DESCRIPTION TOTAL COST MARKET VALUE % OF TOTAL
FINANCIALS
302,500 Bank of Montreal
428,000 Bank of Nova Scotia
404,300 CI Financial Corp.
349,120 Canadian Imperial Bank of Commerce
1,701,300 ECN Capital Corp
957,200 Element Fleet Management Corp
1,096,520 Manulife Financial Corp.
801,800 Power Corp. of Canada
740,500 Royal Bank of Canada
974,526 Toronto-Dominion Bank
Total Financials
INFORMATION TECHNOLOGY
433,100 Celestica Inc.
Total Information Technology
TELECOMMUNICATION SERVICES
88,228 BCE Inc.
297,645 Rogers Comm Inc. Class B
362,800 Telus Corp.
Total Telecommunication Services
UTILITIES
76,500 Capital Power Corp
1,237,100 Transalta Corp.
Total Utilities
REAL ESTATE
104,000 Boardwalk Real Estate Investment Trust
Total Real Estate
CASH AND EQUIVALENT
2,394,866.74 Dividend Accrual
23,089,197.31 Due From Broker (CAD)
-25,985,594.85 Canadian Cash Account
200,000 Canada Tbills
950,000 Canada Tbills
6,950,000 Canada Tbills
Total Cash and Equivalent
TOTAL PORTFOLIO
$28,825,230.70 $30,428,475.00 3.88%
$21,163,265.72 $34,719,360.00 4.43%
$12,598,424.13 $12,036,011.00 1.54%
$23,841,209.34 $42,781,164.80 5.46%
$5,521,770.25 $6,686,109.00 0.85%
$11,865,391.53 $9,093,400.00 1.16%
$21,909,706.82 $28,750,754.40 3.67%
$24,855,397.64 $25,954,266.00 3.31%
$42,950,795.21 $76,012,325.00 9.70%
$39,128,202.24 $71,773,839.90 9.16%
$232,659,393.58 $338,235,705.10 43.16%
$5,793,390.60 $5,708,258.00 0.73%
$5,793,390.60 $5,708,258.00 0.73%
$3,221,294.93 $5,327,206.64 0.68%
$10,737,003.64 $19,064,162.25 2.43%
$8,395,576.29 $17,276,536.00 2.20%
$22,353,874.86 $41,667,904.89 5.32%
$1,831,410.00 $1,873,485.00 0.24%
$8,579,573.81 $9,216,395.00 1.18%
$10,410,983.81 $11,089,880.00 1.42%
$4,095,144.14 $4,481,360.00 0.57%
$4,095,144.14 $4,481,360.00 0.57%
$2,394,866.74 $2,394,866.74 0.31%
$23,089,197.31 $23,089,197.31 2.95%
($25,985,594.85) ($25,985,594.85) -3.32%
$199,874.00 $199,950.70 0.03%
$948,884.14 $949,343.36 0.12%
$6,941,443.00 $6,942,318.86 0.89%
$7,588,670.34 $7,590,082.12 0.98%
$623,484,693.44 $783,518,944.47 100.00%

Founded in 1847, Canada Life™ was Canada’s first domestic life insurance company. In Canada, Canada Life offers a broad range of insurance and wealth management products and services for individuals, families and business owners from coast to coast. Canada Life is a subsidiary of The Great-West Life Assurance Company and a member of the Power Financial Corporation group of companies.
Canada Life has received strong ratings on our claims paying ability and financial strength from the major rating agencies.* For current information on Canada Life’s rating and financial strength, see our website www.canadalife.com.
*As rated by A.M. Best, Dominion Bond Rating Service, Fitch Ratings, Moody’s Investors Service and Standard & Poor’s Corporation at time of publication. Ratings are subject to change without notice.
For more information on Canada Life and its products visit www.canadalife.com or talk to your advisor.
In Quebec, advisor refers to a financial security advisor for individual insurance and segregated fund policies, and to an advisor in group insurance/annuity plans for group products.
The Canada Life Assurance Company 1901 Scarth Street, Regina, SK S4P 4L4
Telephone: (306) 751-7300 Facsimile: (306) 751-6580 Toll free: 1 (888) 252-1847
www.canadalife.com
Helping people achieve more™
Canada Life and design and “Helping people achieve more” are trademarks of The Canada Life Assurance Company.
5030 CAN-6/18
FSC/FPO