Embed Size (px)
Citation preview

CANCER IN TEXAS 2021
1 | C a n c e r i n T e x a s 2 0 2 1
The Texas Cancer Registry (TCR) thanks all cancer reporters for their dedication, hard work, and collaboration. Their efforts help us meet national high quality and timeliness standards. They play a significant role in contributing towards TCR’s mission and the fight against cancer.
About the Texas Cancer Registry TCR is a statewide, population-based registry. It is the primary source for cancer data in Texas.
TCR serves as the foundation for measuring the cancer burden in Texas; comprehensive cancer control efforts; health disparities; and the progress in cancer prevention, diagnosis, treatment, and survivorship. It also supports a wide variety of cancer-related research. Public health, academic institutions, and the private sector cannot address these priorities without timely, complete, and accurate cancer data.
TCR is one of the largest cancer registries in the United States. It is one of twelve state registries funded by both the National Cancer Institute’s Surveillance, Epidemiology and End Results (SEER) Program and Centers for Disease Control and Prevention’s National Program of Cancer Registries (NPCR).
TCR currently meets the NPCR high quality data standards, and is Gold Certified by the North American Association of Central Cancer Registries (NAACCR). TCR joined the SEER program in 2021.
TCR’s goal is to collect, maintain, and disseminate the highest quality cancer data that will contribute towards improving diagnoses, treatments, survival, and quality of life for all cancer patients.
TCR Funding TCR is funded by the Cancer Prevention and Research Institute of Texas and the Texas Department of State Health Services. TCR also acknowledges funding from the following federal agencies.
• The Centers for Disease Control and Prevention provides financial support under Cooperative Agreement#1NU58DP006308. The contents of the TCR website are solely the responsibility of the authors and donot necessarily represent the official views of the CDC or US Department of Health and Human Services.
• The National Cancer Institute’s Surveillance, Epidemiology and End Results (SEER) Program providesfinancial support under Contract #75N91021D00011.
Suggested Citation Texas Cancer Registry, Cancer Epidemiology and Surveillance Branch. Cancer in Texas 2021. Austin, TX. Texas Department of State Health Services, 2021.
Acknowledgments

2 | C a n c e r i n T e x a s 2 0 2 1
Estimated New Cancer Cases by Public Health Region, 2021 In 2021, an estimated 131,610 new cancer cases are expected to be diagnosed in Texas (63,807 in females, and 67,803 in males).
The most common cancers are breast, lung & bronchus, prostate, and colon & rectum. These four cancers make up about 47 percent of all cancer diagnoses.
An estimated 1,319 new cancer cases will be diagnosed in children (ages 0 to 14 years). An additional 580 new cases are estimated in adolescents (ages 15 to 19 years).
Estimated New Cancer Cases by Sex for Leading Sites, Texas, 2021
Female
Cancer Site Estimated New Cases
% of Total
Breast 18,968 29.7 Lung & Bronchus 7,140 11.2 Colon & Rectum 5,313 8.3 Uterus Corpus 4,002 6.3 Thyroid 2,728 4.3 Non-Hodgkin Lymphoma 2,416 3.8 Kidney & Renal Pelvis 2,366 3.7 Pancreas 1,931 3.0 Leukemia 1,849 2.9 Ovary 1,789 2.8
Male
Cancer Site Estimated New Cases
% of Total
Prostate 15,459 22.8 Lung & Bronchus 8,528 12.6 Colon & Rectum 6,725 9.9 Kidney & Renal Pelvis 3,883 5.7 Urinary Bladder 3,612 5.3 Non-Hodgkin Lymphoma 3,055 4.5 Liver & Intrahepatic Bile Duct 2,962 4.4 Melanoma of the Skin 2,672 3.9 Oral Cavity & Pharynx 2,616 3.9 Leukemia 2,550 3.8
Estimates for New Cancer Cases
For more information, visit dshs.texas.gov/tcr/data/estimates.aspx.

3 | C a n c e r i n T e x a s 2 0 2 1
The age-adjusted cancer incidence rate in Texas has declined in recent years, but the number of new cancer cases continues to increase. The age-adjusted incidence rate is the number of new cancer cases out of 100,000 people. This rise in new cancer cases is mostly because of an aging and growing Texas population.
In 1995, 74,481 Texans were diagnosed with cancer, and the age-adjusted cancer incidence rate was 474.9 per 100,000. In 2018, 120,033 Texans had a cancer diagnosis, an increase of 61.2 percent. Yet, the age-adjusted cancer incidence rate had fallen to 408.6 per 100,000.
Some cancers associated with excess body weight and infections are expected to increase.1
Overweight and obesity raise risk for colon &
rectum, esophagus, uterus, pancreas, kidney, and female breast cancers. Except for breast and colon & rectum cancers, the number of overweight and obesity-related cancers is expected to increase 30–40 percent by 2020.1 The CDC estimates that 34 percent of Texas adults are obese. Another 36 percent are overweight.2
Cancers associated with infections, including hepatitis and human papillomavirus (HPV), are also expected to increase. New liver cancer cases are expected to increase more than 50 percent in the US. This is likely due to the increase in hepatitis infection, especially among those born between 1945 and 1965. Oral cancers in white men are expected to increase by about 30 percent, likely the result of more HPV infections.1
Trends in Total Number of Cancer Cases and Incidence Rates, Texas, 1995-2018
474.9
408.6
74,481
120,033
0
22,000
44,000
66,000
88,000
110,000
132,000
350
400
450
500
550
600
650
1995 2000 2005 2010 2015
Incidence Rate Case Count
Trends in New Cancer Cases and Cancer Incidence Rates

4 | C a n c e r i n T e x a s 2 0 2 1
Cancer Survivors by Public Health Region as of January 1, 2018
The number of Texas cancer survivors is increasing for many reasons. More people are being diagnosed with cancer, treatment is improving, and cancers are being caught earlier. Also, the number of people living with cancer increases as the population grows.
An estimated 866,712 Texans are cancer survivors (453,962 females and 412,750 males). These are Texans diagnosed with cancer between 1995–2017 who were alive as of January 1, 2018. Some of these people were cancer free, while others were receiving treatment.
Prostate and female breast cancer survivors make up about 42 percent of survivors.
Cancer Survivors by Sex for Select Sites, Texas, as of January 1, 2018
Female
Cancer Site Survivors Breast 196,783 Colon & Rectum 39,067 Corpus Uterus 34,749 Thyroid 34,647 Non-Hodgkin Lymphoma 19,928 Lung & Bronchus 18,817 Melanoma of the Skin 18,302 Kidney & Renal Pelvis 17,669 Cervix 15,647 Leukemia 12,444
Male
Cancer Site Survivors Prostate 169,206 Colon & Rectum 43,630 Kidney & Renal Pelvis 25,958 Urinary Bladder 25,246 Melanoma of the Skin 22,636 Non-Hodgkin Lymphoma 21,917 Lung & Bronchus 17,120 Oral Cavity & Pharynx 16,284 Leukemia 16,158 Testis 12,079
Living with Cancer
For more information, visit dshs.texas.gov/tcr/data/prevalence.aspx.

5 | C a n c e r i n T e x a s 2 0 2 1
Estimated Cancer Deaths by Public Health Region, 2021 In 2021, an estimated 46,353 Texans are expected to die of cancer (21,314 females and 25,039 males). Some of these people were diagnosed with cancer in previous years.
Lung & bronchus cancer is the most common cause of cancer death in Texas, followed by colon & rectum, breast, and pancreas cancers. These four cancers account for about 46 percent of all cancer deaths.
An estimated 160 Texas children will die of cancer in 2021. An additional 77 adolescents are expected to die of the disease. Cancer remains the leading cause of death from disease for children and adolescents in both Texas and the US.
Estimated Cancer Deaths by Sex for Leading Sites, Texas, 2021
Female
Cancer Site Estimated Deaths
% of Total
Lung & Bronchus 4,594 21.6 Breast 3,325 15.6 Colon & Rectum 1,880 8.8 Pancreas 1,545 7.2 Ovary 1,044 4.9 Liver & Intrahepatic Bile Duct 881 4.1 Corpus Uterus 760 3.6 Leukemia 748 3.5 Non-Hodgkin Lymphoma 665 3.1 Brain & Other Nervous System 590 2.8
Male
Cancer Site Estimated Deaths
% of Total
Lung & Bronchus 6,008 24.0 Colon & Rectum 2,461 9.8 Prostate 2,215 8.8 Liver & Intrahepatic Bile Duct 1,902 7.6 Pancreas 1,667 6.7 Leukemia 1,105 4.4 Non-Hodgkin Lymphoma 908 3.6 Kidney & Renal Pelvis 860 3.4 Esophagus 821 3.3 Urinary Bladder 801 3.2
Estimates for Cancer Deaths
For more information, visit dshs.texas.gov/tcr/data/estimates.aspx.

6 | C a n c e r i n T e x a s 2 0 2 1
The age-adjusted mortality rate in Texas continues to decline, but the number of cancer deaths is increasing each year. This increase is mostly attributed to an aging and growing Texas population.
In 1995, 31,573 Texans died of cancer, and the age-adjusted cancer mortality rate was 207.5 per 100,000. In 2018, 40,599 Texans died of cancer, an increase of 28.6 percent. Yet, the age-adjusted
cancer incidence rate declined to 142.3 per 100,000.
The decline in mortality rates is attributed to the decrease in smoking and advances in cancer screening and treatment. According to the CDC, cancer mortality rates will continue to decline most for the following cancers: prostate, colon & rectum, lung, female breast, oral cavity & pharynx, cervical and melanoma of the skin.1
Trends in Total Number of Cancer Deaths and Mortality Rates, Texas, 1995-2018
207.5
142.3
31,573
40,599
0
9,000
18,000
27,000
36,000
45,000
100
140
180
220
260
300
1995 2000 2005 2010 2015
Mortality Rate Cancer Deaths
Trends in Cancer Deaths and Cancer Mortality Rates

7 | C a n c e r i n T e x a s 2 0 2 1
Changes in mortality rates over time are described using the annual average percent change. A negative AAPC shows a decline in rates, while a positive AAPC reveals an increase in rates. In these charts and graphs, the AAPC for mortality rates are presented by sex for leading causes of cancer death in Texas compared to the nation between 2014 and 2018.
In Texas, the mortality rate for most leading causes of cancer death decreased. The largest decrease in
males and females was for lung & bronchus cancer. In Texas, the rates for breast and prostate cancer were unchanged, but decreased in the U.S. overall.
The mortality rate for some leading causes of cancer death increased. The rate for liver and intrahepatic bile duct cancer increased in both sexes. In males, the rate for esophagus cancer increased. The rate of uterus cancer increased in females. However, these trends were not statistically significant in Texas.
Mortality Rate AAPC for Leading Cancer Sites, Texas and U.S., 2014-2018
Female
Cancer Site Texas U.S. Lung & Bronchus -4.4 -4.3 Non-Hodgkin Lymphoma -2.6 -3.3 Colon & Rectum -1.4 -2.1 Brain & Other Nervous System -1.3 -0.3 Leukemia -1.2 -2.0 Pancreas -0.9 0.2 Ovary -0.8 -2.6 Breast 0.0 -1.1 Liver & Intrahepatic Bile Duct 0.5 0.9 Corpus Uterus 1.3 1.6
Male
Cancer Site Texas U.S. Lung & Bronchus -5.5 -5.3 Leukemia -3.0 -2.1 Urinary Bladder -2.5 -1.3 Kidney & Renal Pelvis -2.2 -2.6 Colon & Rectum -0.7 -1.7 Non-Hodgkin Lymphoma -0.2 -1.6 Pancreas -0.1 0.3 Prostate 0.0 -0.3 Esophagus 0.1 -1.9 Liver & Intrahepatic Bile Duct 0.9 0.4
Cancer Mortality Rate Trends for Leading Sites
-6 -4 -2 0 2
Lung & Bronchus
Leukemia
Urinary Bladder
Kidney & Renal Pelvis
Colon & Rectum
Non-Hodgkin Lymphoma
Pancreas
Prostate
Esophagus
Liver & IHBD
TX
U.S.
-6 -4 -2 0 2
Lung & Bronchus
Non-Hodgkin Lymphoma
Colon & Rectum
Brain & ONS
Leukemia
Pancreas
Ovary
Breast
Liver & IHBD
Corpus Uterus
TX
U.S.

8 | C a n c e r i n T e x a s 2 0 2 1
Leading Cause of Death by County, 2015-2019 For more than a century, heart disease has been the leading cause of death in the US. Cancer has consistently been the second leading cause since 1938. The age-adjusted mortality rate for cancer has been decreasing in Texas since the 1990s, but the rate for heart disease has been decreasing more steeply. This means the gap between the mortality rates of heart disease and cancer has decreased.
From 2015 to 2019, cancer was the leading cause of death in 40 Texas counties.3
Age-Adjusted Mortality Rates for Cancer and Heart Disease, Texas, 1999-2019
100
150
200
250
300
350
1999 2004 2009 2014 2019
Cancer Heart Disease
Leading Causes of Death
Source: Centers for Disease Control and Prevention, National Center for Health Statistics. Underlying Cause of Death 1999-2019 on CDC WONDER Online Database, released in 2020.
Data are suppressed for counties that had less than 21 deaths reported from cancer or heart disease.

9 | C a n c e r i n T e x a s 2 0 2 1
Potential years of life lost estimates the number of years a person could have lived had they not died prematurely of cancer. It helps measure the impact of specific cancers, and the overall burden of cancer in a population. It also gives more weight to cancers that occur in young people.
Some cancer sites have a large overall number of years of life lost due to the relatively large number of people who die from that cancer.
For example, lung cancer led to a total of 674,493 years of life lost, averaging 15.2 years of life lost for each case.
Cancers with a relatively high average number of potential years of life lost per cancer death are likely those that are diagnosed at younger ages. For example, cervical cancer led to an average of 29.7 years of life lost for each case, with a total 58,595 years of life lost.
Potential Years of Life Lost Due to Cancer, Texas, 2014-2018
Cancer Site Deaths Total Person-Years
of Life Lost Average Years of Life
Lost per Cancer Death All Sites 192,315 3,245,867.2 16.9 Brain & Other Nervous System 5,586 128,494.4 23.0 Female Breast 14,045 284,668.8 20.3 Cervix 1,976 58,595.0 29.7 Colon & Rectum 18,119 317,617.6 17.5 Corpus Uterus 3,110 60,143.0 19.3 Esophagus 4,280 71,581.3 16.7 Hodgkin Lymphoma 417 8,909.8 21.4 Kidney & Renal Pelvis 5,468 92,444.3 16.9 Leukemia 7,620 135,170.0 17.7 Liver & Intrahepatic Bile Duct 11,119 203,463.6 18.3 Lung & Bronchus 44,282 674,493.4 15.2 Melanoma of the Skin 2,495 43,191.6 17.3 Myeloma 4,022 56,990.6 14.2 Non-Hodgkin 6,452 96,857.8 15.0 Oral 3,321 59,638.8 18.0 Ovary 4,375 83,499.3 19.1 Pancreas 13,243 212,098.0 16.0 Prostate 8,997 97,062.2 10.8 Stomach 4,308 79,802.5 18.5 Urinary Bladder 4,569 54,293.1 11.9
Potential Years of Life Lost
For more information, visit dshs.texas.gov/tcr/data/years-life-lost.aspx.

10| C a n c e r i n T e x a s 2 0 2 1
Rural counties in Texas can have different population characteristics, exposure to risk factors, and access to healthcare (including screening and treatment) compared to urban counties. This can create variations in cancer incidence and mortality rates.
Understanding these differences can help medical and public health professionals reduce cancer health disparities between rural and urban areas. Comprehensive cancer control strategies might include using evidence-based interventions to reduce modifiable risk factors, promoting cancer screenings in areas with higher rates, and expanding access to treatment.
Rural-Urban Levels Defined The Centers for Disease Control and Prevention uses the 2013 Urban-Rural Classification Scheme for Counties which groups counties into urban (or metro) or rural (or non-metropolitan) designations (Figure 1). This scheme has four urban and two rural levels. All urban counties are part of a metropolitan statistical area (MSAs) defined by the Office of Management and Budget. The first rural classification is Micropolitan which cover counties with an urban cluster population of 10,000–49,999. The other is Noncore, which include counties have a smaller population that doesn’t meet the micropolitan criteria. They are the most rural areas.4
Rural Texas The majority of Texas counties are rural (Figure 1). There are 172 rural counties and about 11% of Texans live in these counties.5 Texas has 25 MSAs, which cover 82 counties that are designated as urban, or metro. Like the U.S., most
Texans live in urban areas. 89% of the Texas population lives in an urban county.
There are many differences in the demographics for urban and rural counties (Figure 2). Urban counties have a higher per-capita income and a higher percent of adults who have completed college. Rural counties have a higher percent of residents
Rural Urban
Population (2019) 3,075,261 25,920,620
Per-capita income (2019) $42,214 $54,070
Below poverty level (2019) 17.1% 13.3%
Unemployment (2019) 7.2% 7.7%
Adults ages 25 and older without a high school diploma (2015-2019)
20.0% 15.9%
Adults ages 25 and older who completed college (2015-2019)
16.9% 31.5%
Special Section: Cancer in Rural Texas
Figure 1: Map of Texas Using 2013 Urban-Rural Classification Scheme4
Figure 2: Demographics for Texas Urban and Rural Counties5

11| C a n c e r i n T e x a s 2 0 2 1
below poverty level as well as a higher unemployment rate.5
Residents of rural communities are more likely to have certain risk factors for cancer than urban residents. For example, the prevalence of obesity among adults is higher in rural counties than urban, and overweight children are more likely to reside in rural areas. According to data from the 2018 Behavioral Risk Factor Surveillance System survey, 77% of residents in non-metro areas were overweight or obese compared to 70% for metro residents.
Also, residents of rural communities may face challenges in accessing health care for cancer screenings and treatment due to specialist shortages and distance traveled to receive care. One study estimated that less than 6% of oncologists service rural areas for the approximate 11% of rural residents in the nation.6 In Texas, 26 rural hospitals have closed since 2010.7 Because cancer treatment often involved frequent visits accessing the services may be even more challenges
for patients who must travel great distances to receive care.
To examine differences in the cancer burden in rural and urban in Texas, this special section looks at cancer incidence and deaths for leading cancer sites in Texas counties.
Leading Cancer Sites For females in rural Texas, the most common cancers are breast, lung & bronchus, and colon & rectum. The most common cancers in rural Texas males are prostate, lung & bronchus, and colon & rectum. The 10 most common cancers in females and males in rural Texas (Figure 3) are similar to those in Texans living in urban areas. However, there are significant differences between the incidence rates of some cancer types in rural and urban areas.
Cancer Incidence Rates From 2014 to 2018, the cancer incidence rate for rural Texas counties was 422.1 cases per 100,000
Cancer Site, Female Rural Urban Breast 104.5 115.4 Lung & Bronchus 48.8 40.7 Colon & Rectum 35.3 31.0 Corpus Uterus 22.7 23.3 Thyroid 15.7 17.7 Kidney & Renal Pelvis 15.3 13.7 Non-Hodgkin Lymphoma 13.7 14.3 Leukemia 11.4 11.1 Ovary 11.1 10.7 Pancreas 11.1 11.2
Cancer Site, Male Rural Urban Prostate 92.3 98.3 Lung & Bronchus 69.2 57.6 Colon & Rectum 50.9 44.1 Kidney & Renal Pelvis 27.0 25.6 Bladder 26.8 26.2 Non-Hodgkin Lymphoma 19.6 21.2 Oral Cavity & Pharynx 19.0 17.0 Melanoma 18.3 18.3 Leukemia 18.1 17.8 Liver & Intrahepatic Bile Duct 18.0 18.2
Figure 3: Leading Cancer Sites by Sex and Urban-Rural Status, Texas, 2014–2018
Age-Adjusted Incidence Rates per 100,000

12| C a n c e r i n T e x a s 2 0 2 1
people. This is significantly higher than the incidence rate for urban counties (408.9 per 100,000). This was also true when comparing rates by sex. The incidence rate for females living in rural counties was 386.9 per 100,000 females. In urban areas, it was 380.1 per 100,000 females. For males, the overall cancer incidence rate for males in rural counties was 468.8 per 100,000 males. It was 451.3 per 100,000 males in urban areas.
There are also several differences in incidence rates when comparing rural and urban areas by cancer site (Figure 3). For both females and males, the incidence rates of lung & bronchus and colon & rectal cancers were significantly higher in rural counties compared to urban areas.
In females, the incidence rate for kidney & renal pelvis cancer was significantly higher in rural counties. The rate for breast cancer was significantly lower in rural areas. For males, rates for kidney & renal pelvis and oral cavity & pharynx cancers were significantly higher in rural counties. Rates were significantly lower for prostate and thyroid cancer in rural areas. For other leading cancer sites, the incidence rates were similar in rural and urban counties.
Incidence rates also vary by race/ethnicity (Figure 4). Hispanic males and females living in rural counties had higher incidence rates compared to those living in urban areas. For females in rural areas, rates were lower for non-Hispanic (NH) white and NH American Indian/Alaska Native (AI/AN)
403.6
397.2
266.3
237.4
339.4
417.4
394.9
420.3
255.0
324.2
NH White NH Black NH AI/AN NH A/PI Hispanic
Female
Rural Urban
Figure 4: Incidence Rates by Sex, Race/Ethnicity, and Urban-Rural Status, Texas, 2014–2018
Age-Adjusted Incidence Rates per 100,000
496.2
510.5
272.6
255.3
378.8
490.5
525.5
315.9 263.2
366.9
NH White NH Black NH AI/AN NH A/PI Hispanic
Male
Rural Urban
13| C a n c e r i n T e x a s 2 0 2 1
compared to those living in urban counties. For all other sex and race/ethnicity groups, cancer incidence rates were similar between rural and urban counties.
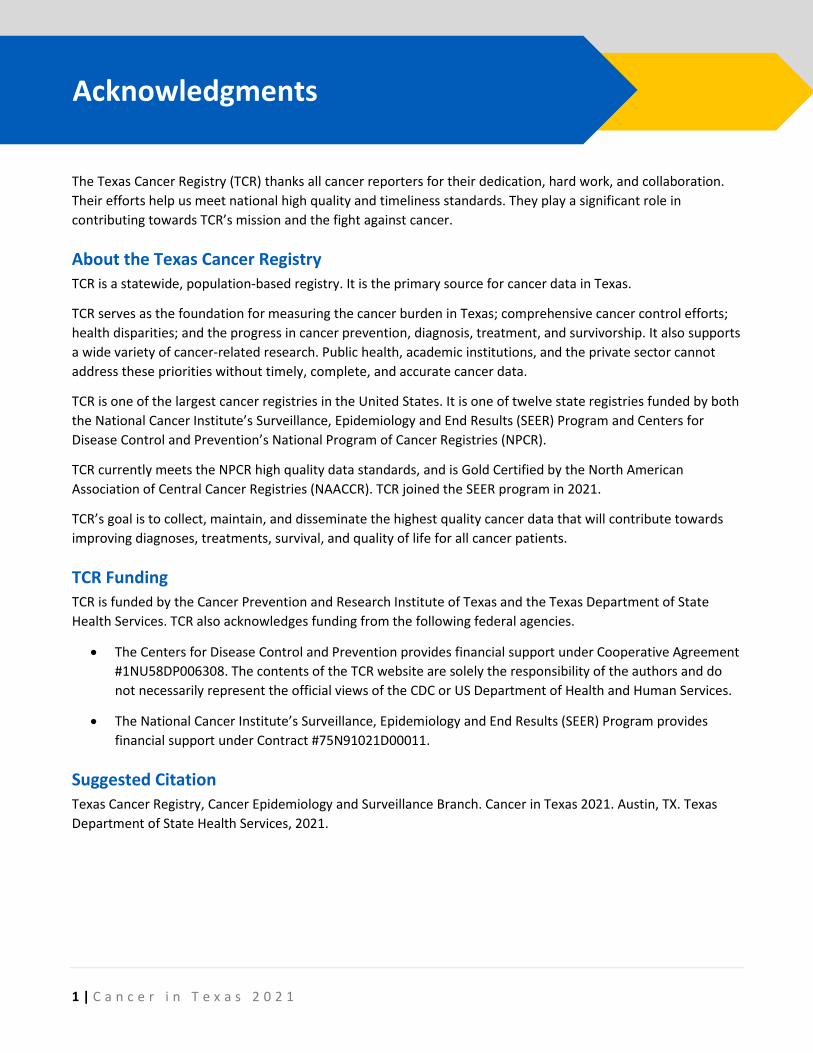
In general, the overall cancer incidence rate increases with age. When comparing rates for adults living in rural and urban Texas (Figure 5), rates were higher in rural counties for two age groups: ages 50–64 years and ages 65–74 years. Rates for ages 20–49 years and ages 75 years and older were similar in rural and urban areas.
Incidence Rate Trends Between 2009 and 2018, the overall cancer incidence rate declined in Texas. However, the incidence rate was stable in rural counties. It decreased in urban counties by 1.0 percent each year.
The rate declined for males in rural and urban counties, although the decrease was slower in rural areas (0.7 percent each year) than urban areas (1.4 percent). For females, the rate was stable in rural counties and declined in urban areas by 0.6 percent each year.
Also, rates declined for only two race/ethnicity groups in rural areas: NH blacks (0.7 percent per year) and NH Asian/Pacific Islanders (3.5 percent).
Cancer Site, Male Rural Urban Lung & Bronchus -3.0 -3.3 Prostate -1.9 -2.4 Urinary Bladder -1.7 -1.6 Non-Hodgkin Lymphoma -0.7 -1.2 Melanoma 0.1 -0.1 Leukemia 0.1 -0.9 Colon & Rectum 0.3 -1.3 Oral Cavity & Pharynx 1.4 0.8 Thyroid 1.7 -1.1 Pancreas 2.1 1.3 Kidney & Renal Pelvis 2.5 0.9 Liver & Intrahepatic Bile Duct 3.9 1.5
Cancer Site, Female Rural Urban Non-Hodgkin Lymphoma -1.7 -1.8 Lung & Bronchus -0.9 -2.0 Melanoma -0.5 -0.2 Ovary 0.0 -1.3 Urinary Bladder 0.0 -1.5 Colon & Rectum 0.4 -1.1 Breast 0.7 -0.4 Thyroid 0.9 -1.0 Oral Cavity & Pharynx 1.2 -0.3 Kidney & Renal Pelvis 2.5 0.5 Uterus Corpus 3.1 2.1 Liver & Intrahepatic Bile Duct 3.6 1.9
Figure 5: Incidence Rates by Age and Urban-Rural Status, Texas, 2014–2018
Age-Adjusted Incidence Rates per 100,000
147.0 789.0
1701.82014.3
144.5 732.8
1643.92019.2
20-49 yrs 50-64 yrs 65-74 yrs 75 yrs+Rural Urban
Figure 6: Average Annual Percent Change in Incidence Rates for Select Cancers, Texas, 2009–2018

14| C a n c e r i n T e x a s 2 0 2 1
In comparison, rates declined for all race/ethnicity groups in urban counties except NH Asian/Pacific (A/PI) Islanders.
Incidence rate trends for individual cancer sites were generally less favorable in rural counties (Figure 6).
In females, incidence rates for three cancer sites increased in rural counties: kidney & renal pelvis, uterus corpus, and liver & intrahepatic bile duct. In urban areas, rates increased for only uterus corpus and liver & intrahepatic bile duct. Also, the increase was faster in rural counties than in urban. The only cancer site with decreased rates in rural counties was non-Hodgkin lymphoma. In contrast, rates
decreased for five cancers in urban counties: non-Hodgkin lymphoma, lung & bronchus, ovary, urinary bladder, colon & rectum. Rates for other leading cancer sites were stable in rural areas.
In males, incidence rates for three cancer sites increased in rural counties: pancreas, kidney & renal pelvis, and liver & intrahepatic bile duct.
In urban areas, rates also increased for these three cancers, but the increase was faster in rural counties than in urban. Three cancer sites had decreased rates in rural and urban counties: lung & bronchus, prostate, and urinary bladder. Rates also decreased for four additional cancers in urban counties: non-Hodgkin lymphoma, colon & rectum, oral cavity & pharynx, and thyroid. Rates for other leading cancer sites were stable in rural areas.
Stage at Diagnosis Stage at diagnosis provides information on the extent the cancer has grown and spread. Generally, localized cancers that have not spread to other tissue are easier to treat. This means patients who are diagnosed with a localized cancer have a better prognosis than whose cancers have spread regionally or to distant organs. For all cancer cases combined, a smaller proportion of cases were diagnosed at the localized stage in rural counties for four race/ethnicity groups (Figure 7): NH white, NH black, NH A/PI and Hispanic.
Cancers Associated with Modifiable Risk Factors Several types of cancer are associated with four modifiable risk factors: alcohol use, human papillomavirus infection, overweight/obesity, and tobacco use. According to the Centers for Disease
Metro Status Localized Regional Distant Unknown
NH White Rural 38.5% 19.9% 26.0% 15.6%
Urban 42.2% 19.7% 23.9% 14.1%
NH Black Rural 35.5% 20.3% 27.2% 17.0%
Urban 39.2% 20.6% 26.3% 13.9%
NH AI/AN Rural 44.8% 18.5% 22.8% 13.9%
Urban 39.3% 20.0% 25.9% 14.8%
NH A/PI Rural 32.6% 21.6% 23.4% 22.3%
Urban 39.0% 22.3% 25.3% 13.5%
Hispanic Rural 35.9% 20.1% 26.8% 17.3%
Urban 40.6% 21.1% 24.8% 13.6%
Figure 7: Stage at Diagnosis by Race/Ethnicity and Urban-Rural Status, Texas, 2009–2018

15| C a n c e r i n T e x a s 2 0 2 1
Control and Prevention, only one in four rural adults practice at least four of five health-related behaviors: not smoking, maintaining a normal body weight, being active, nondrinking or moderate drinking, and getting enough sleep.8
Alcohol Use
Alcohol use is associated with an increased risk of six cancer sites. In Texas, the incidence rate of all alcohol-related cancers combined was similar in rural and urban counties from 2014 to 2018 (Figure 8). The incidence rate of all alcohol-associated cancers combined (excluding colorectal cancer ) increased by 0.9 percent each year in rural counties between 2009 to 2018. During the same period, rates remained stable in urban counties.
HPV Infection
HPV infection is associated with an increased risk of six cancer sites. In the U.S., teens living in urban
areas are most likely to be completely vaccinated against HPV, while those living in rural areas were the least likely. This variation is also seen in the Texas, although the difference is not statistically significant.9 The overall incidence rates for cancers associated with HPV were higher in rural Texas counties in 2014–2018 (Figure 8). The incidence rate of all HPV-associated cancers increased by 2.7 percent each year in rural counties between 2009 to 2018. During the same period, rates remained stable in urban counties.
Overweight/Obesity
Overweight/obesity is associated with an increased risk of 13 cancer sites. In 2014–2018, the incidence rate of all overweight/obesity-associated cancers combined was lower in rural Texas than urban areas (Figure 8). During 2009–2018, the incidence rate of all overweight/obesity-associated cancers combined (excluding colorectal cancer*) increased
Figure 8: Incidence Rates of Cancers Associated with Modifiable Risk Factors by Urban-Rural Status, Texas, 2014–2018
Age-Adjusted Incidence Rates per 100,000
126.0
13.2
166.5
197.6
125.2
11.6
167.6 174.8
Alcohol Use HPV Infection Overweight/Obesity Tobacco Use
Rural Urban

16| C a n c e r i n T e x a s 2 0 2 1
in rural counties by 1.4 percent each year. It remained stable in urban counties.
Tobacco
Tobacco use is associated with increased risk of 12 cancer sites. In the U.S., rural areas have higher rates of tobacco use.10 During 2014-2018, the overall incidence rate for cancers associated with tobacco was higher in rural counties compared to urban areas (Figure 8). The incidence rate of all tobacco-associated cancers combined (excluding colorectal cancer*) remained stable in rural counties from 2009 to 2018. In urban areas, it decreased by 1.0 percent each year.
TCR publishes biennial reports on cancers associated with modifiable risk factors. To view the reports, visit dshs.texas.gov/tcr/data/modifiable.aspx.
Cancers with Screening Recommendations The U.S. Preventive Services Task Force currently recommends screenings for breast, cervical and colorectal cancers for the general public based on age and sex. Screening for colorectal and cervical cancers can reduce the incidence rate of these cancers by identifying and removing precancerous cells. For all three cancers, screening can help detect cancer at a localized stage.
Breast Cancer
For female breast cancer, the incidence rate was lower in rural counties compared to urban areas (Figure 9). However, a smaller proportion of cases were diagnosed at a localized stage in rural counties (58%) compared to urban areas (61%).
Cervical Cancer
From 2014–2018, cervical cancer incidence rates were higher in rural counties compared to urban areas (Figure 9). Also, a smaller proportion of cervical cases were diagnosed at a localized stage in rural areas (37%) compared to urban counties
(41%).
Colorectal Cancer
From 2014–2018, colorectal cancer incidence rates were higher in rural counties compared to urban areas (Figure 9). In both rural and urban areas, the proportion of colorectal cases were diagnosed at a localized stage was 32 percent.
TCR publishes biennial reports on screening-amenable cancers. To view these reports, visit dshs.texas.gov/tcr/data/screening.aspx.
Leading Cause of Cancer Death The leading causes of cancer deaths were similar in rural and urban areas from 2014–2018 (Figure
Figure 9: Incidence Rates of Screening-Amenable Cancers by Urban-Rural Status, Texas, 2014–2018
Age-Adjusted Incidence Rates per 100,000
11.9
42.7
104.5
9.0
37.0
115.4
Cervix Colon & Rectum Female Breast
Rural Urban

17| C a n c e r i n T e x a s 2 0 2 1
10). For females in rural Texas, the leading causes of cancer death are lung & bronchus, breast, and colon & rectum. The leading causes of cancer death in rural Texas males are lung & bronchus, colon & rectum, and prostate. This is slightly different than in urban counties, where death from prostate cancer is more common than colorectal cancer.
However, there are significant differences between the mortality rates of some cancer types in rural and urban areas.
Cancer Mortality Rates From 2014 to 2018, the cancer mortality rate for rural Texas counties was 163.0 deaths per 100,000 people. This is significantly higher than the mortality rate for urban counties (145.8 per 100,000). This was also true when comparing rates by sex. The mortality rate for females living in rural counties was 134.6 per 100,000 females. In urban areas, it was 12.1 per 100,000 females. For males, the overall cancer mortality rate for males in rural
counties was 197.6 per 100,000 males. It was 175.6 per 100,000 males in urban areas.
The mortality rates for some leading sites were significantly higher in rural areas (Figure 10). In females and males, the rates for lung & bronchus and colorectal cancers were higher in rural counties compared to urban areas. In males, the mortality rates of bladder, kidney, esophageal and liver & intrahepatic bile duct cancers were also higher in rural counties. The rates for other cancer sites were similar in rural and urban counties.
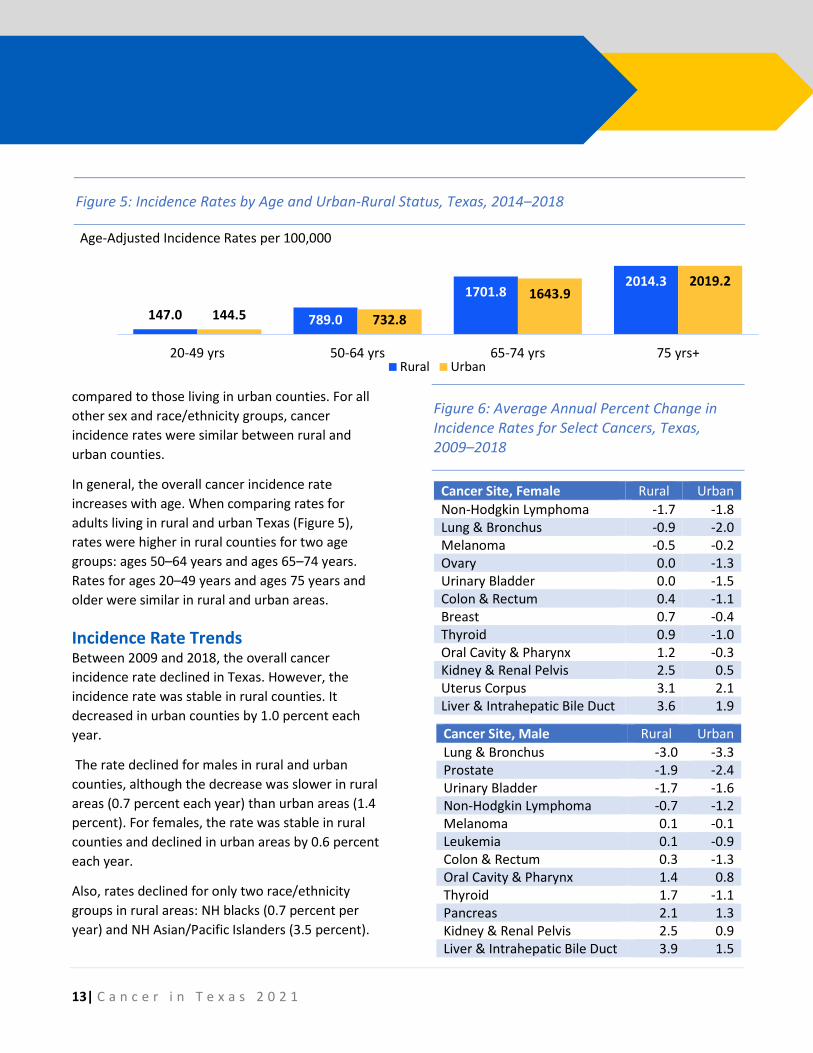
Mortality rates also varied by race/ethnicity (Figure 11). In females, the mortality rate for NH whites was higher in rural counties compared to urban counties even though incidence rates were lower in rural counties than in urban areas. Hispanic females living in rural areas also had higher mortality rates compared to those in urban areas. (The incidence rate for Hispanic females was also higher for those living in rural counties compared to urban areas.)
Cancer Site, Female Rural Urban Lung & Bronchus 33.0 26.2 Breast 19.4 19.8 Colon & Rectal 11.8 10.9 Pancreas 8.7 9.0 Ovary 6.1 6.1 Liver & Intrahepatic Bile Duct 4.7 5.0 Leukemia 4.5 4.5 Non-Hodgkin Lymphoma 4.3 3.9 Corpus Uterus 4.0 4.3 Brain & Other Nervous System 3.7 3.5
Cancer Site, Male Rural Urban Lung & Bronchus 51.4 41.2 Colon & Rectal 20.2 16.8 Prostate 17.3 17.6 Liver & Intrahepatic Bile Duct 12.8 12.0 Pancreas 11.5 11.7 Leukemia 8.8 8.2 Bladder 6.9 6.3 Kidney & Renal Pelvis 6.8 5.9 Esophagus 6.6 5.5 Non-Hodgkin Lymphoma 6.3 6.7
Figure 10: Leading Causes of Cancer Death by Sex and Urban-Rural Status, Texas, 2014–2018
Age-Adjusted Mortality Rates per 100,000
18| C a n c e r i n T e x a s 2 0 2 1
For males, mortality rates were higher in rural counties for three race/ethnicity groups: NH white, NH black and Hispanic. These differences in mortality rates occurred even though the overall cancer incidence rates in rural and urban counties were similar for NH white and NH black males. (The incidence rate for Hispanic males was also higher for those living in rural counties.)
For all other sex and race/ethnicity groups, cancer mortality rates were similar between rural and urban counties.
Cancer Mortality Rate Trends Between 2009 and 2018, overall cancer mortality rates decreased in Texas. In females, the rate decreased by 1.0 percent each year in rural areas and 1.5 percent each year in urban counties. In
males, the rate decreased by 1.6 percent each year in rural counties and 2.0 percent each year in urban areas.
Rates decreased in rural NH whites (0.9 percent each year), NH blacks (2.7 percent each year), and Hispanics (1.2 percent each year). In urban areas, rates decreased for NH whites (1.4 percent each year), NH blacks (2.6 percent each year), NH A/PI (1.6 percent each year), and Hispanics (1.5 percent each year). Rates for other race/ethnicity groups remained stable during this period.
The mortality rate trends were different in rural and urban counties for some leading cancer sites in females and males.
Figure 11: Incidence Rates by Sex, Race/Ethnicity, and Urban-Rural Status, Texas, 2014–2018
Age-Adjusted Incidence Rates per 100,000
207.8
242.2
47.0
101.3
153.5
185.1
223.7
53.6
98.4
143.0
NH White NH Black NH AI/AN NH A/PI Hispanic
Male
Rural Urban
141.1
148.9
50.3
60.3
111.1
131.9
152.5
48.0
77.0 98.3
NH White NH Black NH AI/AN NH A/PI Hispanic
Female
Rural Urban

19| C a n c e r i n T e x a s 2 0 2 1
For females in rural counties, mortality rates decreased significantly for four cancer sites: colon & rectal, lung & bronchus, non-Hodgkin lymphoma, and breast. In urban areas, the rates decreased for these four cancers as well as leukemia and ovary. The mortality rate for uterine cancer increased significantly in both rural and urban areas. The rate for liver and intrahepatic saw a similar increase in both areas, but the trend was statistically significant only for urban areas.
For males in rural and counties, mortality rates decreased significantly for two cancer sites: lung & bronchus and prostate. In urban areas, the rates decreased for these two cancers as well as non-Hodgkin lymphoma, leukemia, colon & rectal, and esophagus. The mortality rate for liver & intrahepatic bile duct cancer increased significantly in both rural and urban areas.
Cancer Site, Female Rural Urban Leukemia -3.4 -2.1 Ovary -2.4 -2.4 Colon & Rectum -2.3 -1.8 Lung & Bronchus -2.3 -3.8 Non-Hodgkin Lymphoma -2.3 -2.4 Pancreas -1.4 0.0 Breast -1.2 -0.8 Brain & Other Nervous System 0.1 0.5 Liver & Intrahepatic Bile Duct 1.3 1.3 Corpus Uterus 2.4 2.5
Cancer Site, Male Rural Urban Lung & Bronchus -4.2 -4.7 Prostate -2.5 -1.3 Non-Hodgkin Lymphoma -2.5 -2.0 Leukemia -1.0 -1.9 Pancreas -0.7 0.0 Bladder 0.1 -1.0 Colorectal 0.2 -1.6 Esophagus 0.6 -1.2 Kidney and Renal Pelvis 0.7 -0.9 Liver & Intrahepatic Bile Duct 2.0 0.8
Figure 12: Average Annual Percent Change in Mortality Rates for Select Cancers, Texas, 2009–2018

1 | C a n c e r i n T e x a s 2 0 2 1
TCR strives to make data available
and accessible to anyone with an
interest in Texas cancer data. The
following online resources use
TCR data to provide information
on cancer in Texas and the U.S.
TCR Website dshs.texas.gov/tcr/
The TCR website offers a wide
variety of statistical products,
including data tables, topical
reports, and fact sheets. It also
includes information for
researchers interested in
obtaining limited-use and
confidential data sets.
TCR Web Query Tool cancer-rates.info/tx
The TCR web query tool allows
users to customize cancer
incidence and mortality rate
tables and maps by cancer site,
sex, time frame and race/
ethnicity.
CDC/NCI State Cancer Profiles statecancerprofiles.cancer.gov
State Cancer Profiles
characterizes the cancer burden
in a standardized manner to
motivate action, integrate
surveillance into cancer control
planning, characterize areas and
demographic groups, and expose
health disparities.
Cancer Control P.L.A.N.E.T. cancercontrolplanet.cancer.gov/planet/
Cancer Control P.L.A.N.E.T. portal
provides access to data and
resources that can help planners,
program staff, and researchers
design, implement and evaluate
evidence-based cancer control
programs.
US Cancer Statistics: Data Visualizations gis.cdc.gov/Cancer/USCS/ DataViz.html
The Data Visualizations tool
provides information on the
numbers and rates of new cancer
cases and deaths at the national,
state, and county levels. You can
see the numbers by sex, age, race
and ethnicity, trends over time,
survival, and prevalence.
Cancer Statistics Website cancerstatisticscenter.cancer.org
The Cancer Statistics Center
website is primarily based on the
data and analysis provided in the
American Cancer Society’s annual
Cancer Statistics paper, published
in CA: A Cancer Journal for
Clinicians, and its consumer-
friendly companion report,
Cancer Facts & Figures.
NAACCR Fast Stats faststats.naaccr.org
NAACCR Fast Stats is an
interactive tool for quick access to
key NAACCR and US cancer
statistics for major cancer sites by
age, sex, race/ ethnicity, registry,
stage, and population standard.
Statistics are presented as graphs
and tables.
Online Statistics and Data Visualization Tools

2 | C a n c e r i n T e x a s 2 0 2 1
The Texas Cancer Registry provides data to support
research on the impact of cancer in Texas and across
the nation. The TCR Epidemiology Group averages
over 400 requests for cancer data from researchers,
medical professionals, students, and the public each
year. In 2020, the group received 423 requests.
In the past five years, 388 published research journal
articles used TCR data.
Approximately 72 current studies use TCR data. These
studies are approved by the Texas Department of
State Health Services Institutional Review Board and
Research Executive Steering Committee. TCR data
support $127 million in grant funding.
Here are brief descriptions of select studies.
TCR-Medicare healthcaredelivery.cancer.gov/seermedicare/
TCR cancer incidence data are linked to Medicare
claims data every 2 years. This linkage uses the same
methodology as the linkage between the
Surveillance, Epidemiology, and End Results Program
and Medicare data,and is a collaborative effort
between the National Cancer
Institute, cancer registries, and the
Centers for Medicare and Medicaid
Services. The TCR-Medicare linked
data provide detailed information
about Medicare beneficiaries with
cancer in Texas.
Approximately 95% of Texans ages
65 and older in TCR are matched with
Medicare files. The TCR data provide
information on participant
demographics, cancer incidence,
stage of disease, first course of
therapy, and survival, while the
Medicare claims data include
information on hospital stays,
physician services, and hospital outpatient visits.
These data are used for epidemiologic and health
services research related to the diagnosis and
treatment procedures, costs, and survival of cancer
patients.
TCR has provided data for this linkage since 2009.
Virtual Pooled Registry – Cancer Linkage System naaccr.org/about-vpr-cls/
The North American Association of Central Cancer
Registries Virtual Pooled Registry Cancer Linkage
System (VPR-CLS) is a national system designed to
facilitate data linkages between existing study
cohorts and central cancer registries such as TCR. This
is a secure, web-based system designed for minimal
risk linkages, with the goal of providing timely access
to cancer outcome data and a secure and
standardized linkage process. TCR has participated in
pilot work with the VPR-CLS and has supported
several IRB-approved studies that are using this
system.
Research Using TCR Data

3 | C a n c e r i n T e x a s 2 0 2 1
Transplant Cancer Match Study transplantmatch.cancer.gov
Solid organ transplantation is a life-saving procedure
for individuals with end-stage organ disease, but the
need for long-term immunosuppressive medications
following the procedure substantially increases
cancer risk. Investigators at the NCI and the Health
Resources and Services Administration are examining
cancer risk, treatment, and outcomes among
transplant recipients. For this study, US transplant
registry data are linked with data from multiple US
cancer registries, including TCR, to determine which
individuals in the US transplant registry develop
cancer.
TCR has participated in data linkages for this study
since 2008.
World Trade Center Health Registry www1.nyc.gov/site/911health/index.page
The World Trade Center (WTC) Health Registry was
established to evaluate long-term health
consequences, including cancer, of the 9/11 disaster
among rescue and recovery workers and those who
lived, worked or went to school in the World Trade
Center area. The WTC Health Registry registrants are
linked with multiple US cancer registries, including
TCR, to verify any self-reported cancer and identify
unreported incident cancer.
TCR has conducted data linkages for this study since
2008.
NIH-AARP Diet and Health Study dietandhealth.cancer.gov
The NCI developed the NIH-AARP Diet and Health
Study to examine the relationship between diet,
lifestyle, and health among adults who were AARP
members when the study began in 1995–1996.
Questionnaires that asked information about diet,
lifestyle, and other health-related behaviors were
returned by over 500,000 people, making this one of
the largest, long-term studies of diet and health ever
conducted. NIH-AARP cohort data are linked
to multiple US cancer registries, including
TCR, to provide the NCI researchers with
information on cancer outcomes for
participants in their cohort.
TCR has conducted data linkages for this
study since 2006.
Black Women’s Health Study bu.edu/bwhs/
The Black Women’s Health Study (BWHS) is
the largest long-term study of Black women
to date. This NCI-funded study aims to
identify risk factors of cancer and other
disease in Black women. To achieve these
aims, the BWHS cohort data are linked to multiple US
cancer registries, including TCR, to provide important
cancer diagnostic, prognostic, and treatment
information. About every two years, the study’s
cohort data are linked to TCR.
TCR has conducted data linkages for this study since
2008.

4 | C a n c e r i n T e x a s 2 0 2 1
American Cancer Society’s Cancer Prevention Study-3 cancer.org/research/cps3-cancer-prevention-study-3.html
The American Cancer Society’s Cancer
Prevention Study-3 (CPS-3) is a long-term study
of more than 300,000 participants. The study
aims to examine the relationship between
lifestyle, nutritional, medical, environmental,
genetic and other factors that may cause or
prevent cancer. Since 2013, TCR links the CPS-3
cohort data every 3 years to identify new
cancer cases and obtain important information
about the cancer.
HIV/AIDS Cancer Registry Match Study hivmatch.cancer.gov
People who are living with the human
immunodeficiency virus (HIV) or who have acquired
immunodeficiency syndrome (AIDS) are at increased
risk for certain cancers. The HIV/AIDS Cancer Match
Study, led by the NCI, aims to better understand the
patterns of cancer risk among people living with HIV
in the US. The study involves data linkages between
multiple US state HIV and cancer registries, including
those in Texas.
TCR has participated in data linkages for this study
since 2011.
Mexican American (Mano a Mano) Cohort Study mdanderson.org/research/departments-labs-institutes/departments-divisions/epidemiology/research/mano-a-mano.html
The Mexican American (Mano a Mano) Cohort Study
led by investigators at the MD Anderson Cancer
Center is investigating behavioral and genetic risk
factors for cancer among people of Mexican descent.
TCR has conducted a data linkage each year for the
researchers since 2011.
Parkland-UT Southwestern PROSPR Research Center: Colon Cancer and Cervical Cancer Screening healthcaredelivery.cancer.gov/prospr/
Population-based Research Optimizing Screening
through Personalized Regimens (PROSPR) is a NCI-
funded network of centers conducting research to
improve cancer screening. At the Parkland-UT
Southwestern PROSPR Center, investigators focus on
improving screening on people in Dallas County who
lack insurance or are underinsured. Initially focused
on colorectal cancer, the PROSPR Center expanded its
mission to include cervical cancer screening. Since
2013, TCR links with the Parkland-UT PROSPR’s data
to help investigators determine whether cancer
patients receive recommended tests and treatment.

5 | C a n c e r i n T e x a s 2 0 2 1
Data Sources All data are from TCR unless otherwise noted.
Incidence Data: Texas Cancer Registry SEER*Stat Database, 1995–2018 Incidence, Texas statewide, 2020 NPCR-
CSS Submission, cut-off 11/08/2020, created March 2021.
Mortality Data: Texas Cancer Registry SEER*Stat Database, 1990–2018 Mortality, Texas statewide, created
January 2021.
References 1. Weir HK, Thompson TD, Soman A, Møller B, Leadbetter S. The Past, Present, and Future of Cancer Incidence
in the United States: 1975 through 2020. Cancer. 2015;121(11):1827-1837.
2. Centers for Disease Control and Prevention. Nutrition, Physical Activity, and Obesity: Data, Trend and Maps. Accessed Aug 11, 2020. cdc.gov/nccdphp/dnpao/data-trends-maps/index.html.
3. Centers for Disease Control and Prevention, National Center for Health Statistics. Underlying Cause of Death 1999-2019 on CDC WONDER Online Database. Accessed May 20, 2021. wonder.cdc.gov/ucd-icd10.html.
4. National Center for Health Statistics, Centers for Disease Control and Prevention. 2013 Urban-Rural Classification Scheme for Counties. Accessed Aug 24, 2021. cdc.gov/nchs/data_access/urban_rural.htm
5. United States Department of Agriculture Economic Research Service. State Fact Sheets: Texas. Accessed Aug 24, 2021. data.ers.usda.gov/reports.aspx?StateFIPS=48&StateName=Texas&ID=17854
6. American Society of Clinical Oncology. The State of Cancer Care in America, 2016: A Report by the American Society of Clinical Oncology. J Oncol Pract. 2016;12(4):339-383.
7. Texas Organization of Rural and Community Hospitals. Rural Hospital Closures. Accessed September 10, 2021. torchnet.org/advocacy--rural-hospital-closure.html.
8. Centers for Disease Control and Prevention. Health Behaviors in Rural America. Accessed September 10, 2021. cdc.gov/ruralhealth/Health-Behaviors.html.
9. Nehme E, Patel D, Oppenheimer D, Karimifar M, Elerian N, Lakey D. Missed Opportunity: Human Papillomavirus in Texas. Austin, TX: University of Texas Health Science Center at Tyler/University of Texas System. 2017.
10. Rural Health Information Hub. Tobacco Use in Rural Areas. Accessed September 10, 2021.
ruralhealthinfo.org/toolkits/tobacco/1/use-in-rural.
Data Sources and References

6 | C a n c e r i n T e x a s 2 0 2 1
The following organizations provide additional
information on cancer that might be helpful to the
general public, patients, caregivers, and survivors.
The TCR’s referral to these organizations is
informational and does not imply endorsement by
TCR or the Texas Department of State Health
Services.
American Cancer Society 800-227-2345, cancer.org
The American Cancer Society can answer questions
to empower you with accurate, up-to-date
information to help you make educated health
decisions.
CancerCare 800-813-4673, cancercare.org
CancerCare provides professional support services
and information to help people manage the
emotional, practical, and financial challenges of
cancer.
HealthCare.gov 800-318-2596, healthcare.gov
HealthCare.gov provides information on health
insurance options, including insurance exchanges,
Medicaid and Medicare.
LIVESTRONG 855-220-7777, livestrong.org
LIVESTRONG provides direct services to anyone
affected by cancer and connects people and
communities with the services they need.
National Cancer Institute 800-422-6237, cancer.gov
The National Cancer Institute leads, conducts, and
supports cancer research to advance scientific
knowledge and help all people live longer, healthier
lives.
Texas County Indigent Health Care Programs 800-222-3986, Ext 6467
The County Indigent Health Care Program helps
low-income Texans who don’t qualify for other
state or federal health care programs have access to
health care services.
2-1-1 Texas 211 or 877-541-7905, 211texas.org
2-1-1 Texas provides accurate, well-organized and
easy-to-find information from state and local health
and human services programs, including Medicaid,
Children’s Health Insurance Program (CHIP), Breast
and Cervical Cancer Services, and Temporary
Assistance for Needy Families (TANF).
Additional Resources for Cancer Information

Texas Cancer Registry
dshs.texas.gov/TCR