Embed Size (px)
Citation preview
Cancer statistics Availability and location March 2020 update
Cancer statistics: availability and location - March 2020 update
2
About Public Health England
Public Health England exists to protect and improve the nation’s health and wellbeing
and reduce health inequalities. We do this through world-leading science, research,
knowledge and intelligence, advocacy, partnerships and the delivery of specialist public
health services. We are an executive agency of the Department of Health and Social
Care, and a distinct delivery organisation with operational autonomy. We provide
government, local government, the NHS, Parliament, industry and the public with
evidence-based professional, scientific and delivery expertise and support.
Public Health England
Wellington House
133-155 Waterloo Road
London SE1 8UG
Tel: 020 7654 8000
www.gov.uk/phe
Twitter: @PHE_uk
Facebook: www.facebook.com/PublicHealthEngland
This document is available in other formats on request. Please call 020 76548158 or email [email protected]
© Crown copyright 2020
You may re-use this information (excluding logos) free of charge in any format or
medium, under the terms of the Open Government Licence v3.0. To view this licence,
visit OGL. Where we have identified any third-party copyright information you will need
to obtain permission from the copyright holders concerned.
Published March 2020
PHE publications PHE supports the UN
gateway number: GW-1170 Sustainable Development Goals
Cancer statistics: availability and location - March 2020 update
3
Contents
About Public Health England 2
Executive summary 4
Geographies 5
Headline statistics: incidence, prevalence, survival and mortality 6
Incidence 6 Prevalence 8 Mortality 9 Survival 11
Prevention: reducing risk factors 13
Smoking 14
Obesity 14 Alcohol 14
General risk factor 14
Diagnosing earlier and faster 15
Awareness 15 Screening 17
Cancer statistics: availability and location - March 2020 update
4
Executive summary
This document aims to provide an overview about cancer statistics, including
information on the latest statistics publicly available and where to find them.
This is intended to be a useful reference guide for users of cancer statistics or
audiences that may not be familiar with this information. This document is structured
using key topics in the ‘Achieving World Class Cancer Outcomes: Strategy for England
2015 - 2020’ report (www.england.nhs.uk/wp-content/uploads/2017/10/national-cancer-
transformation-programme-2016-17-progress.pdf), and with geographical breakdowns
of data sources.
Cancer statistics: availability and location - March 2020 update
5
Geographies
NHS regions support local systems and are responsible for the quality, financial and
operational performance of all NHS organisations in their region. They support the
identity and development of Sustainability and Transformation Partnerships
Sustainability and Transformation Partnerships (STPs - see below) and integrated care
systems. There are 7 NHS regions in England.
Cancer Alliances bring together key organisations in an area to coordinate cancer care.
There are 20 cancer alliances in England.
Sustainability and Transformation Partnerships (STPs) are partnerships between NHS
organisations and local councils. Some have evolved to become Integrated Care
Systems (ICSs). The Long Term Plan aims that every part of England will be covered
by an ICS by 2021, replacing STPs. There are 42 STPs in England.
Clinical Commissioning Groups (CCGs) commission most of the hospital and
community NHS services in the local areas for which they are responsible. There are
191 CCGs in England.
NHS trusts are organisations that provide goods and services for the purposes of the
health service. There are approximately 200 trusts in England. Acute non-specialist
trusts make up the majority, but there are also acute specialist trusts and mental health
trusts.
Local authorities are responsible for a variety of local services, including social care.
There are different types of local authority with different structures. There are 343 local
authorities in England.
Middle Layer Super Output Areas (MSOAs) are geographic areas with a minimum
population of 5,000 and a mean of 7,200. They are made up of contiguous Lower Layer
Super Output Areas and are defined by ONS for the census. There are 6,791 MSOAs
in England and 410 in Wales.
Cancer statistics: availability and location - March 2020 update
6
Headline statistics: incidence, prevalence,
survival and mortality
Incidence
Incidence is the number of new cases of cancer diagnosed for a given period, usually a
year. The statistics are provided as the total number of cases or as rates (number of
cases per 100,000 population).
Incidence rates can be ‘crude’ or age-standardised. The crude rate is calculated by
dividing the number of patients who live in a given area by the population of that area.
The age-standardised rate (ASR) accounts for the variations in age structures of
populations. ASRs are most commonly standardised using the European standard
population or world standard population statistics.
ASR is more commonly used because overall incidence of cancer increases with age.
Therefore, age standardised rates allow for comparisons between areas/time periods
with different age distributions.
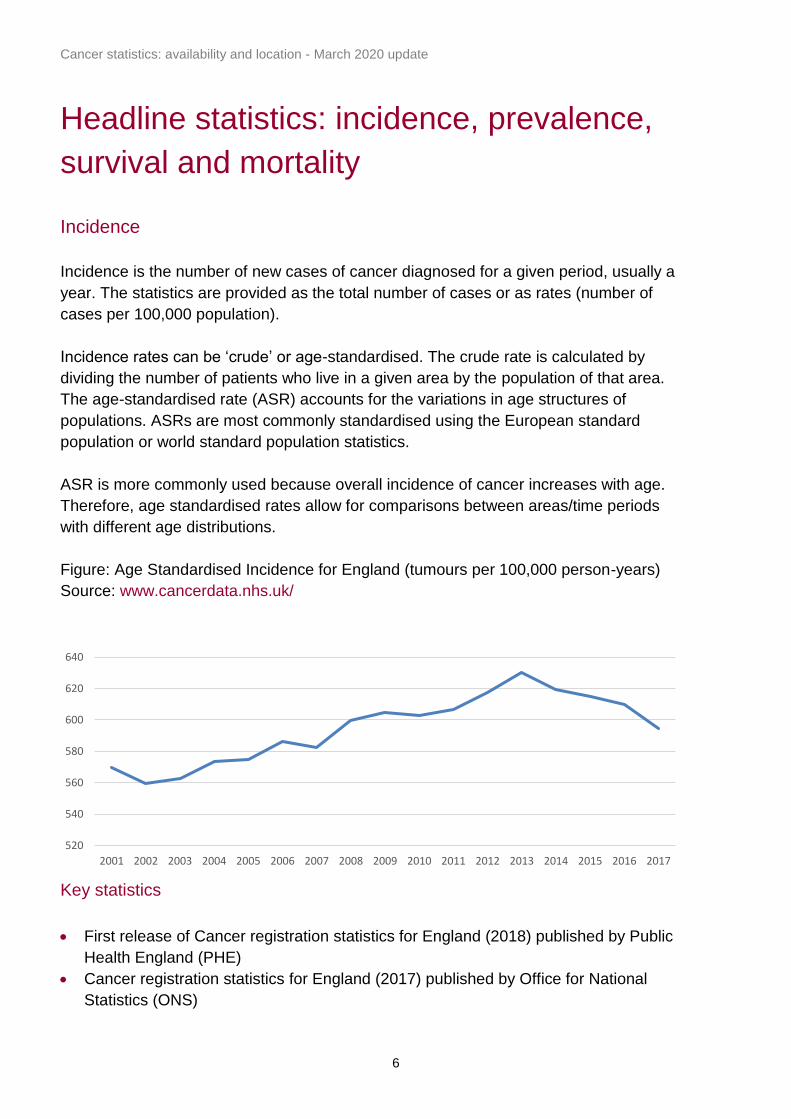
Figure: Age Standardised Incidence for England (tumours per 100,000 person-years)
Source: www.cancerdata.nhs.uk/
Key statistics
• First release of Cancer registration statistics for England (2018) published by Public
Health England (PHE)
• Cancer registration statistics for England (2017) published by Office for National
Statistics (ONS)
520
540
560
580
600
620
640
2001 2002 2003 2004 2005 2006 2007 2008 2009 2010 2011 2012 2013 2014 2015 2016 2017
Cancer statistics: availability and location - March 2020 update
7
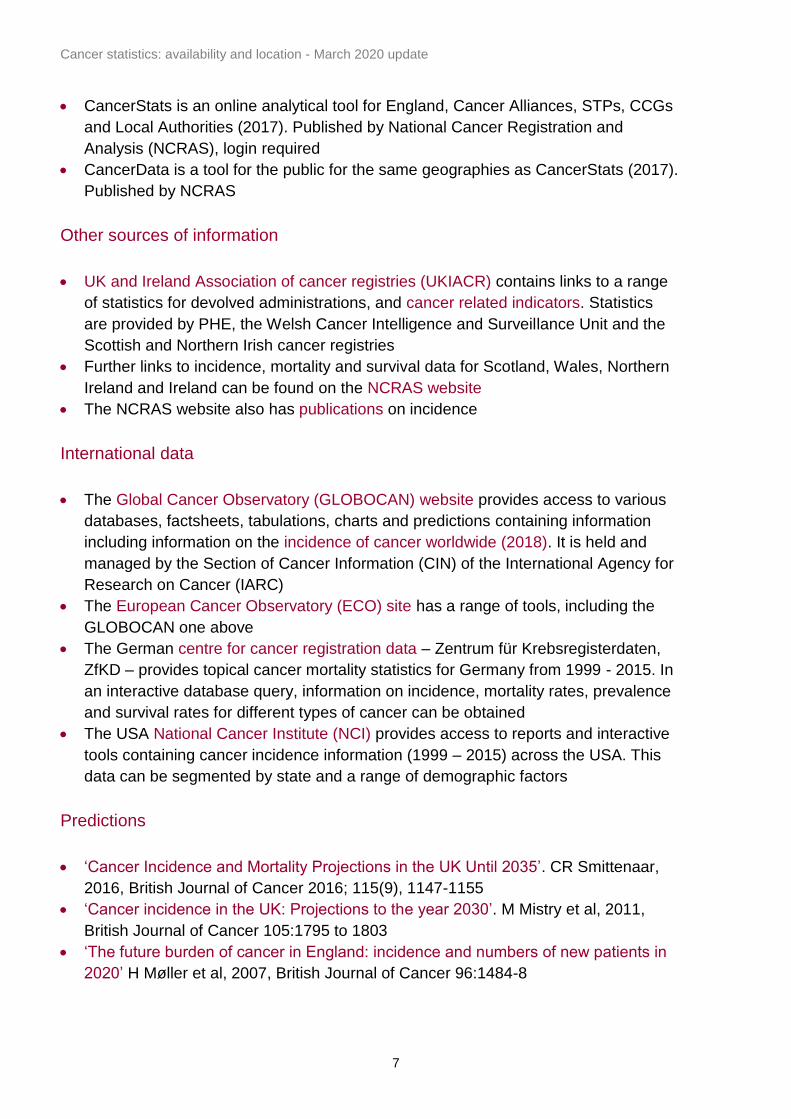
• CancerStats is an online analytical tool for England, Cancer Alliances, STPs, CCGs
and Local Authorities (2017). Published by National Cancer Registration and
Analysis (NCRAS), login required
• CancerData is a tool for the public for the same geographies as CancerStats (2017).
Published by NCRAS
Other sources of information
• UK and Ireland Association of cancer registries (UKIACR) contains links to a range
of statistics for devolved administrations, and cancer related indicators. Statistics
are provided by PHE, the Welsh Cancer Intelligence and Surveillance Unit and the
Scottish and Northern Irish cancer registries
• Further links to incidence, mortality and survival data for Scotland, Wales, Northern
Ireland and Ireland can be found on the NCRAS website
• The NCRAS website also has publications on incidence
International data
• The Global Cancer Observatory (GLOBOCAN) website provides access to various
databases, factsheets, tabulations, charts and predictions containing information
including information on the incidence of cancer worldwide (2018). It is held and
managed by the Section of Cancer Information (CIN) of the International Agency for
Research on Cancer (IARC)
• The European Cancer Observatory (ECO) site has a range of tools, including the
GLOBOCAN one above
• The German centre for cancer registration data – Zentrum für Krebsregisterdaten,
ZfKD – provides topical cancer mortality statistics for Germany from 1999 - 2015. In
an interactive database query, information on incidence, mortality rates, prevalence
and survival rates for different types of cancer can be obtained
• The USA National Cancer Institute (NCI) provides access to reports and interactive
tools containing cancer incidence information (1999 – 2015) across the USA. This
data can be segmented by state and a range of demographic factors
Predictions
• ‘Cancer Incidence and Mortality Projections in the UK Until 2035’. CR Smittenaar,
2016, British Journal of Cancer 2016; 115(9), 1147-1155
• ‘Cancer incidence in the UK: Projections to the year 2030’. M Mistry et al, 2011,
British Journal of Cancer 105:1795 to 1803
• ‘The future burden of cancer in England: incidence and numbers of new patients in
2020’ H Møller et al, 2007, British Journal of Cancer 96:1484-8
Cancer statistics: availability and location - March 2020 update
8
• Based on the above data, ‘Cancer mortality trends: 1992-2020’ by Macmillan cancer
support
• Cancer Research UK (CRUK) data visualisation displays projection for incidence of
all cancers combined
• For Scotland, the cancer incidence projections report gives projections for the
number of cancer cases up to 2027 with policy and methodology background.
• For Ireland, the National Cancer Registry Ireland published projections from
2015-2040
• GLOBOCAN provides UK and worldwide incidence (and mortality) predictions for up
to 2040. Predictions can be generated on the future burden of a selected cancer or
group of cancers, in a selected group of populations, in a selected year
• ‘Global cancer transitions according to the Human Development Index (2008–
2030): a population-based study’ F Bray, The Lancet Oncology, 13(8), 790-80
highlights past and present cancer specific patterns to produce a future burden
scenario for 2030
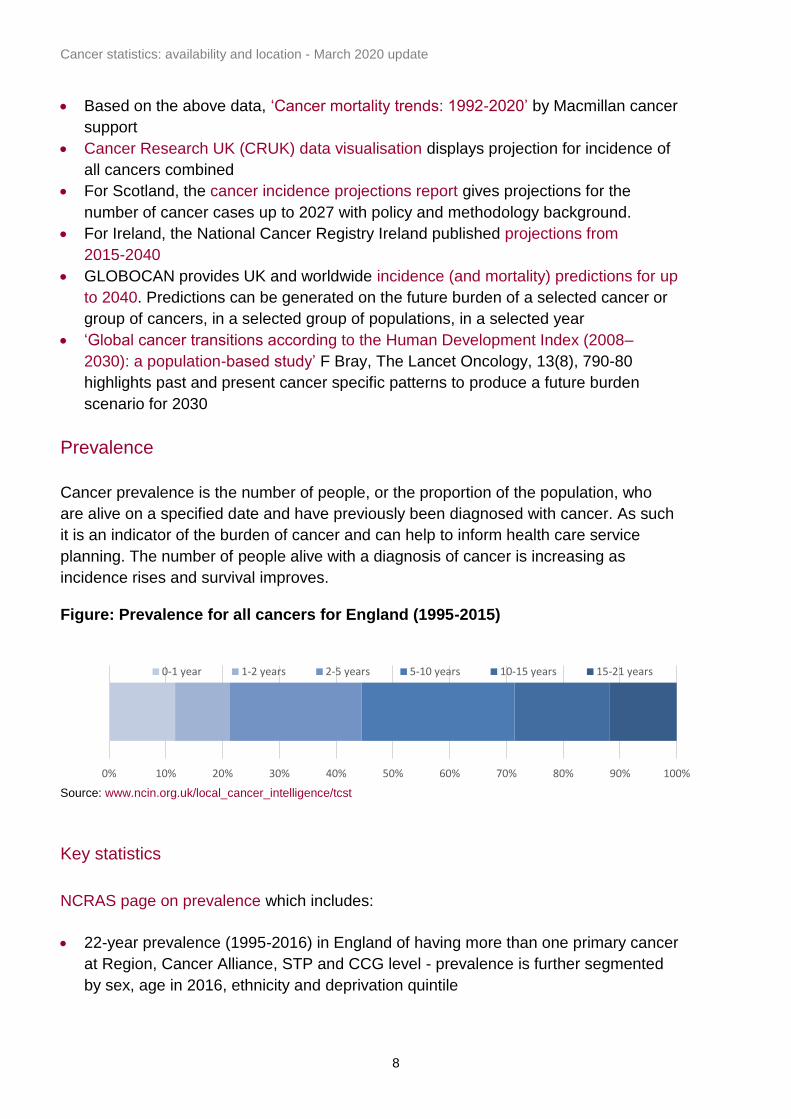
Prevalence
Cancer prevalence is the number of people, or the proportion of the population, who
are alive on a specified date and have previously been diagnosed with cancer. As such
it is an indicator of the burden of cancer and can help to inform health care service
planning. The number of people alive with a diagnosis of cancer is increasing as
incidence rises and survival improves. Figure: Prevalence for all cancers for England (1995-2015)
Source: www.ncin.org.uk/local_cancer_intelligence/tcst
Key statistics
NCRAS page on prevalence which includes:
• 22-year prevalence (1995-2016) in England of having more than one primary cancer
at Region, Cancer Alliance, STP and CCG level - prevalence is further segmented
by sex, age in 2016, ethnicity and deprivation quintile
0% 10% 20% 30% 40% 50% 60% 70% 80% 90% 100%
0-1 year 1-2 years 2-5 years 5-10 years 10-15 years 15-21 years
Cancer statistics: availability and location - March 2020 update
9
• Comorbidity at diagnosis for those living with cancer in London (1995-2014) at STP
and CCG
Macmillan-PHE Local Cancer Intelligence portal contains prevalence estimates and
projections (1995-2015).
Other sources of information
• Macmillan produced an infographic detailing current and future cancer prevalence in
the UK
• Age-standardised rate for all cancers ordered by the countries with the 50 highest
rates in the world (2018). Published by World Cancer Research Fund
• GLOBOCAN estimated cancer prevalence worldwide for all cancers in 2018
• The USA National Cancer Institute cancer prevalence reports and interactive tools
up to 2016
• The Australian Institute of Health and Welfare report and summary tables on cancer
survival and prevalence statistics for the period from 1982-2010
• ‘Projections of cancer prevalence in the United Kingdom, 2010–2040’ J Maddams,
2012, British Journal of Cancer, 107:1195 to 1202
• Macmillan factsheet which includes prevalence projections
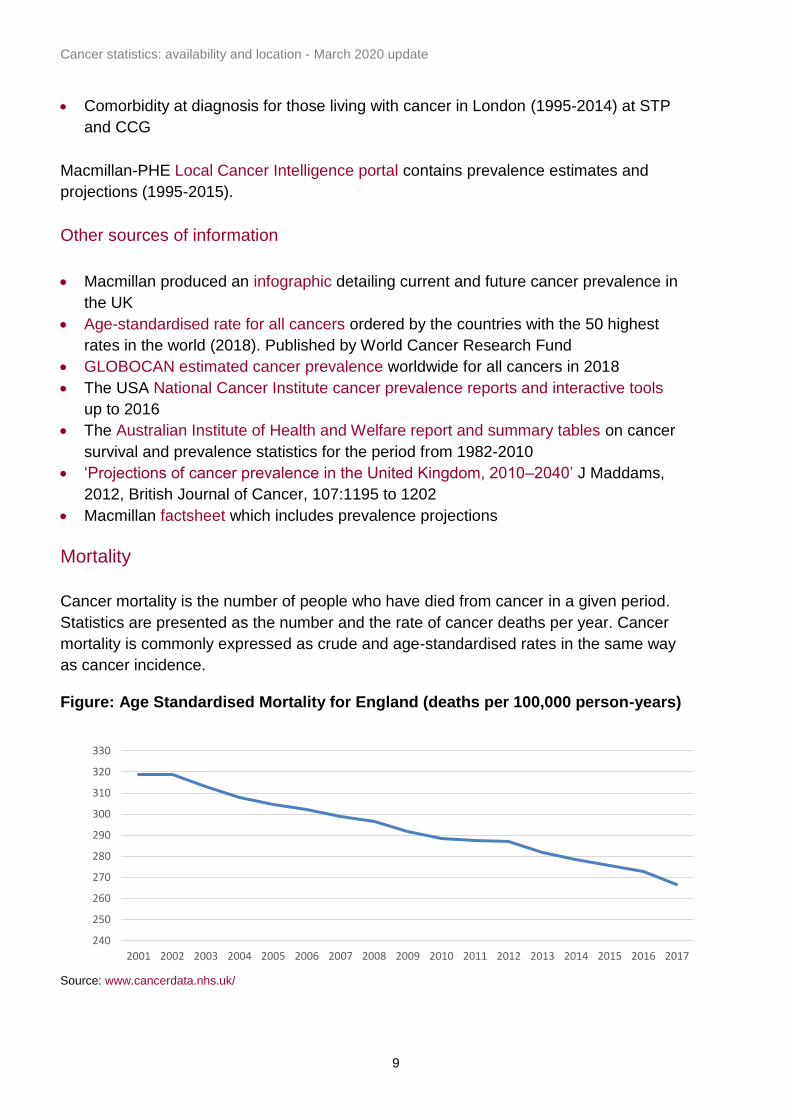
Mortality
Cancer mortality is the number of people who have died from cancer in a given period.
Statistics are presented as the number and the rate of cancer deaths per year. Cancer
mortality is commonly expressed as crude and age-standardised rates in the same way
as cancer incidence. Figure: Age Standardised Mortality for England (deaths per 100,000 person-years)
Source: www.cancerdata.nhs.uk/
240
250
260
270
280
290
300
310
320
330
2001 2002 2003 2004 2005 2006 2007 2008 2009 2010 2011 2012 2013 2014 2015 2016 2017
Cancer statistics: availability and location - March 2020 update
10
Key statistics
• Deaths registered in England and Wales (2018) published by ONS
• CancerStats is an online analytical tool for England, Cancer Alliances, STPs, CCGs
and Local Authorities (2017). Published by National Cancer Registration and
Analysis (NCRAS), login required
• CancerData is a tool for the public for the same geographies as CancerStats (2017).
Published by NCRAS
• PHE portal with statistics on all cancer mortality, including premature mortality by
MSOA, Ward, LA, CCG and England (2011-2015)
• Macmillan-PHE Local Cancer Intelligence portal contains prevalence estimates and
projections (1995-2015)
• CRUK mortality statistics for UK, and devolved administrations (2016)
• PHE Fingertips mortality tool for England, Districts and Counties (2015-17)
• Scotland mortality statistics (1994-2016)
• Welsh mortality statistics (2001-2017)
• Northern Ireland mortality statistics (1993-2017)
Other sources of information
• The publications section of the NCRAS website, including a report on mortality in
the first year after ovarian cancer diagnosis
• CRUK provides cancer mortality projections up to 2035 for all cancers combined.
• 'Cancer incidence and mortality projections in the UK until 2035' C R Smittenaar,
2016, British Journal of Cancer
• GLOBOCAN provides UK and worldwide mortality (and incidence) predictions to
2040 using data held in GLOBOCAN. Predictions can be generated on the future
burden of a selected cancer or group of cancers, in a selected group of populations
in a selected year
• Macmillan Cancer Support report in (2013), assimilating data focusing on the cancer
burden by 2020 and associated mortality
International data
• The Global Cancer Observatory (GCO/GLOBOCAN) website provides access to
various databases, factsheets, tabulations, charts and predictions containing
information on the occurrence of cancer worldwide. It is held and managed by the
CIN of IARC
• The German centre for cancer registration data – Zentrum für Krebsregisterdaten,
ZfKD – provides topical cancer mortality statistics for Germany from 1999 - 2015. In
an interactive database query, information on incidence, mortality rates, prevalence
and survival rates for different types of cancer can be obtained
Cancer statistics: availability and location - March 2020 update
11
• The USA National Cancer Institute (NCI) provides access to reports and interactive
tools containing cancer incidence information (1999 – 2015) by state and a range of
demographic factors
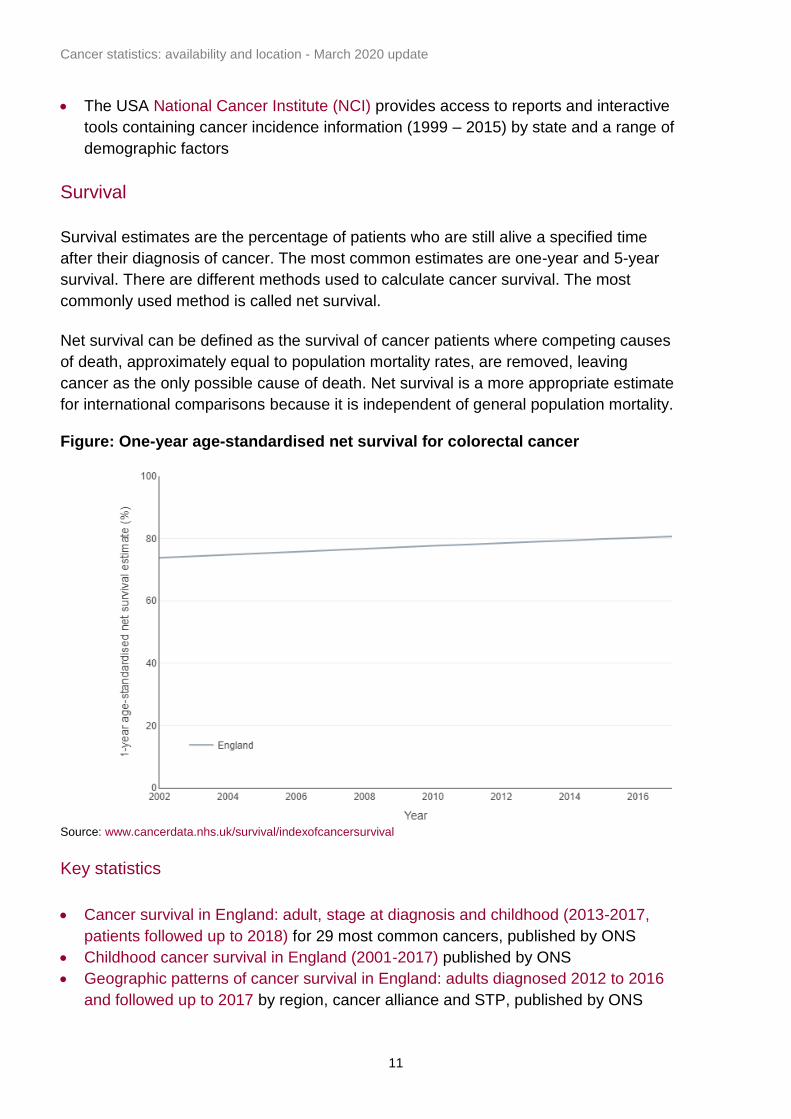
Survival
Survival estimates are the percentage of patients who are still alive a specified time
after their diagnosis of cancer. The most common estimates are one-year and 5-year
survival. There are different methods used to calculate cancer survival. The most
commonly used method is called net survival.
Net survival can be defined as the survival of cancer patients where competing causes
of death, approximately equal to population mortality rates, are removed, leaving
cancer as the only possible cause of death. Net survival is a more appropriate estimate
for international comparisons because it is independent of general population mortality. Figure: One-year age-standardised net survival for colorectal cancer
Source: www.cancerdata.nhs.uk/survival/indexofcancersurvival
Key statistics
• Cancer survival in England: adult, stage at diagnosis and childhood (2013-2017,
patients followed up to 2018) for 29 most common cancers, published by ONS
• Childhood cancer survival in England (2001-2017) published by ONS
• Geographic patterns of cancer survival in England: adults diagnosed 2012 to 2016
and followed up to 2017 by region, cancer alliance and STP, published by ONS
Male
All
Female
Cancer statistics: availability and location - March 2020 update
12
• Index of cancer survival for Clinical Commissioning Groups in England: adults
diagnosed 2001 to 2016 and followed up to 2017 for CCG, STP and cancer alliance,
published by ONS
Other sources of information
• Cancer survival statistical bulletin methodology by ONS
• Stage at diagnosis and early mortality from cancer in England, McPhail et al. 2015:
British Journal of Cancer 2015; 112:S108S115
• NCRAS website survival by stage publications and general publications page
• ONS article, including visualisations, looking at survival trends over a 40-year period
• The UKIACR website points to statistics for devolved administrations
• ‘On estimation in relative survival’ examines net survival methodology, by M Perme
et al, 2012. Biometrics 2012; 68(1): 113 to 120
• ‘Global surveillance of cancer survival 1995–2009: analysis of individual data for
25 676 887 patients from 279 population-based registries in 67 countries
(CONCORD-2)’ Allemani et al, 2014, Lancet 2015;385(9972):977–1010
• A summary of the research above by Centre for Disease Control and Prevention.
• ‘Cancer survival in Australia, Canada, Denmark, Norway, Sweden, and the UK,
1995-2007 (the International Cancer Benchmarking Project) an analysis of
population-based cancer registry data’ M Coleman et al, 2011, Lancet 2011; 377:
127-138
International data
• EUROCARE (EUROpean CAncer REgistry-based study on survival and care of
cancer patients) is a cancer epidemiology research project on the survival of
European cancer patients. A range of data and publications are available on the
EUROCARE website
• The German centre for cancer registration data – Zentrum für Krebsregisterdaten,
ZfKD – provides cancer survival rates for patients diagnosed between 2007-2014 in
Germany. In an interactive database query, 1-10-year survival crude/age
standardised survival rates can be obtained for different types of cancer
• The USA National Cancer Institute (NCI) Cancer Statistics Review (1975-2013,
USA) for which data tables and reports can be accessed via interactive database
query. It also includes relative survival rates by year of diagnosis (1975-2016) and
5-year survival (1975-2015) for all cancer sites
• ‘Oncologic treatment strategies and relative survival of patients with stage I–III rectal
cancer - A EURECCA international comparison between the Netherlands, Belgium,
Denmark, Sweden, England, Ireland, Spain, and Lithuania’ A.J. Breugom et al,
2018, European Journal of Surgical Oncology, Volume 44, Issue 9, September
2018, Pages 1338-1343
Cancer statistics: availability and location - March 2020 update
13
revention: reducing risk factors
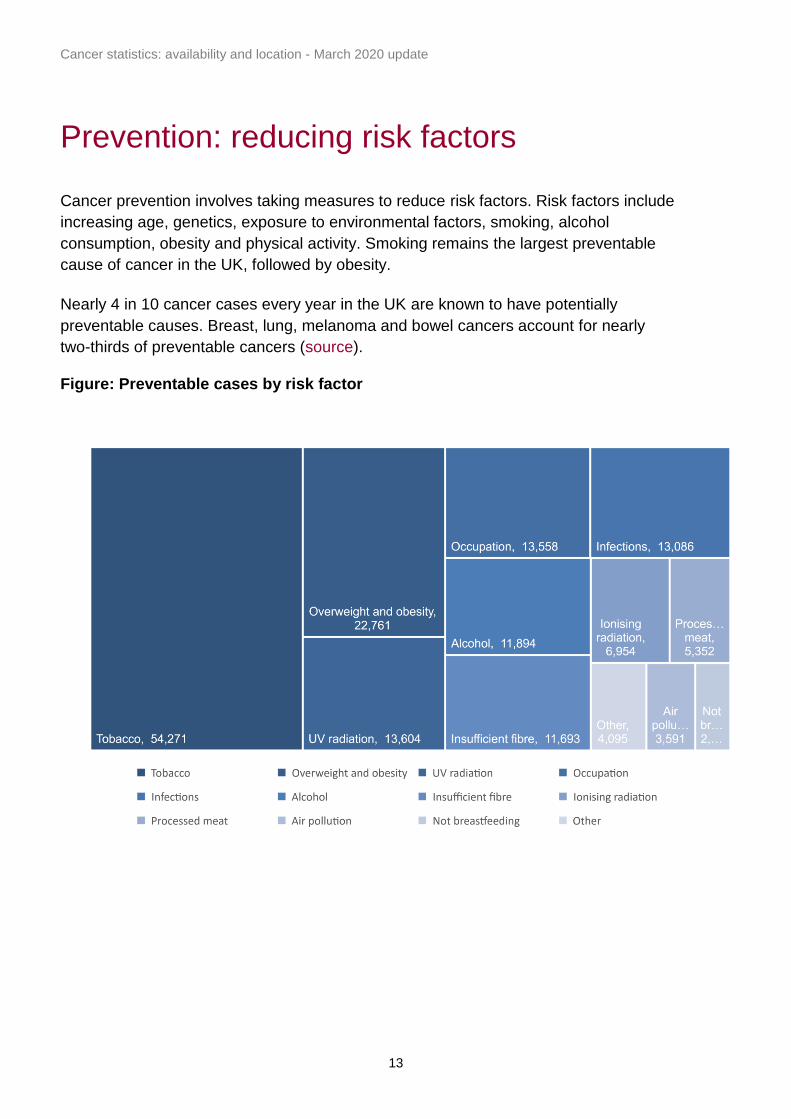
Prevention: reducing risk factors
Cancer prevention involves taking measures to reduce risk factors. Risk factors include
increasing age, genetics, exposure to environmental factors, smoking, alcohol
consumption, obesity and physical activity. Smoking remains the largest preventable
cause of cancer in the UK, followed by obesity.
Nearly 4 in 10 cancer cases every year in the UK are known to have potentially
preventable causes. Breast, lung, melanoma and bowel cancers account for nearly
two-thirds of preventable cancers (source). Figure: Preventable cases by risk factor
Cancer statistics: availability and location - March 2020 update
14
Smoking
In 2018 14.4% of people in the UK aged 18 years and above smoked cigarettes
(source below).
PHE smoking prevalence tool contains data on various metrics for England, by Region,
STP, CCG, County and District. Latest data 2018/19.
Obesity
Being overweight or obese is related to more than one in 20 cancers cases in the UK
(source), and more than 6 in 10 adults in the UK are overweight (source). NHSD Statistics on Obesity, Physical Activity and Diet contains data for England, by LA, Region, CCG, STP for 01/04/17 to 31/12/18.
Alcohol
PHE alcohol consumption tool contains data for England, by Region for 2017/18. An investigation of public knowledge of the link between alcohol and cancer (2016) by CRUK.
General risk factor
Estimate of preventable cancers in the UK by World Cancer Research Fund. ‘The fraction of cancer attributable to modifiable risk factors in England, Wales, Scotland, Northern Ireland, and the United Kingdom in 2015’ Brown KF, 2018, British Journal of Cancer.
Cancer statistics: availability and location - March 2020 update
15
gnosing earlier and faster
Diagnosing earlier and faster
Awareness
Public awareness of the potential signs and symptoms of cancer, as well as an
understanding of when and how to seek help, can play an important part in ensuring that
cancer is diagnosed at an early stage.
Cancer Research UK (CRUK), University College London, King’s College London and
the University of Oxford, as part of the National Awareness and Early Diagnosis
Initiative (NAEDI), developed a cancer awareness measure (CAM). The CAM is a
validated set of questions designed to reliably assess and track public awareness of:
cancer warning signs, anticipated delay and perceived barriers to seeking medical
advice.
CAM data comes from 2 surveys which were:
• an ONS opinions survey that is sampled to be representative of the UK population
• an Ethnibus survey of the main ethnic minority groups in England - surveys were
carried out in 2008, 2010, 2012 and 2014
Site specific CAMs have also been completed for breast, colorectal/bowel, cervical, lung
and ovarian cancer. These measures were developed with the support of Breakthrough
Breast Cancer, Breast Cancer Care, Cancer Research UK, Ovarian Cancer Action, The
Eve Appeal, Ovacome, Target Ovarian Cancer and the Department of Health.
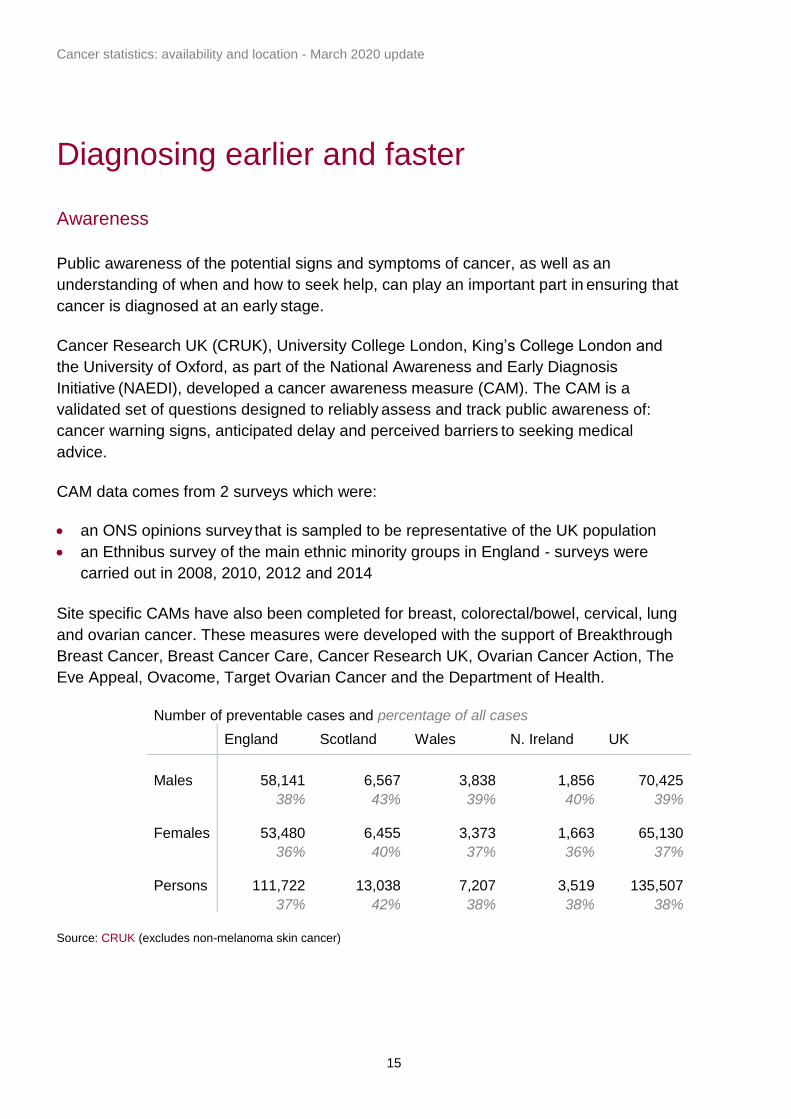
Number of preventable cases and percentage of all cases
England Scotland Wales N. Ireland UK
Males
58,141
6,567
3,838 1,856
70,425
38% 43% 39% 40% 39%
Females
53,480
6,455
3,373 1,663
65,130
36% 40% 37% 36% 37%
Persons
111,722
13,038
7,207 3,519
135,507
37% 42% 38% 38% 38%
Source: CRUK (excludes non-melanoma skin cancer)
Cancer statistics: availability and location - March 2020 update
16
Key statistics
• Be clear on cancer campaign reports for England, published by NCRAS
• Statistics on preventable cancers (2015) for UK, England, Scotland, Wales and
Northern Ireland by CRUK
• Cancer Awareness Measures (CAM) report (2017) for UK, England, Scotland, Wales
Other sources of information
• Improving cancer symptom awareness among deprived communities in the UK
Moriarty Y, 2019, BioMed Central (BMC) Public Health
• ‘Impact of national cancer awareness campaigns for bowel and lung cancer
symptoms and inequalities’ Moffat J, 2015, PubMed
• Cervical cancer risk factor knowledge among screening non-participants by socio-
demographic group, ‘Socio-demographic correlates of cervical cancer risk factor
knowledge among screening non-participants in Great Britain’ Ryan M, 2011,
PubMed
• Be Clear on Cancer Programme Evaluation Summaries (2013 and 2014) published
by CRUK
Site specific CAMs
• ‘Validation of a measurement tool to assess awareness of breast cancer’ Linsell L,
2010, European Journal of Cancer; 46(8):1374-81
• ‘The impact of national cancer awareness campaigns for bowel and lung cancer
symptoms on sociodemographic inequalities in immediate key symptom awareness
and GP attendances’ Moffat J, 2015, British Journal of Cancer
• ‘Ovarian and cervical cancer awareness: development of two validated
measurement tools’ Simon A, 2012, Journal of Family Planning and Reproductive
Health Care; 38(3):167-74
• ‘What do British women know about cervical cancer symptoms and risk factors?’
Low EL, 2012, European Journal of Cancer; 48(16):3001-8
• ‘Assessing awareness of colorectal cancer symptoms: measure development and
results from a population survey in the UK’ Power E, 2011, BMC Cancer
• ‘Knowledge of lung cancer symptoms and risk factors in the UK: development of a
measure and results from a population-based survey’ Simon A et al, 2012, Thorax;
67(5):426-32
Cancer statistics: availability and location - March 2020 update
17
General CAM
• CAM National Baseline Report, ‘Public awareness of cancer in Britain’, published in
2009
• ‘Public awareness of cancer in Britain: a population-based survey of adults’ Robb K
et al, 2009, British Journal of Cancer; 101:S18–S23 - covers the process of data
collection and analysis
• ‘Development of a measurement tool to assess public awareness of cancer’
Stubbings S, 2009, British Journal of Cancer 2009; 101:S13–S17
• ‘Delay Kills’ (2012) published by CRUK and Tesco. It details key results from the
CAM 2010 survey, the problems of diagnosing cancer early and why we need to
solve them
• ‘Differences in cancer awareness and beliefs between Australia, Canada, Denmark,
Norway, Sweden and the UK (the International Cancer Benchmarking Partnership):
do they contribute to differences in survival?’ Forbes L J L, 2013, British Journal of
Cancer
Screening
The UK National Screening Committee makes UK-wide policies. It recommends
systematic population screening programmes for breast cancer, cervical cancer and
bowel cancer. It is up to each part of the UK to determine when, and how, to put those
policies into practice. This means that there will be some differences in the screening
services available in England, Northern Ireland, Scotland or Wales.
Key screening measures are ‘coverage’ and ‘uptake’. These definitions vary by tumour
group and are detailed below.
Breast screening
Purpose
Breast screening is intended to detect breast cancer at an early stage, enabling more
effective treatment.
Invited population
In the UK, women aged 50 to 70 are routinely invited for breast screening every 3 years
under a national programme. Women over the age of 70 can request screening every 3
years by making an appointment at their local screening unit, but they do not receive
invitations. Since 2010 some parts of England have extended screening to those aged
47 to 73 as part of a trial. In Wales, younger women at increased risk of breast cancer
can be referred by the All Wales Cancer Genetics service for screening.
Cancer statistics: availability and location - March 2020 update
18
Coverage For a given time point, the percentage of women resident and eligible for screening who had a test with a recorded result within the last 3 years. Uptake The percentage of women who, having been sent an invitation for screening, attend a screening unit and undergo mammography in response to that invitation.
Cervical screening
Purpose
Cervical screening is intended to detect abnormalities within the cervix that could, if
untreated, develop into cancer. Invited population
Women aged 25 to 49 are invited for screening every 3 years. Women aged 50 to 64
are invited every 5 years.
Coverage
The percentage of women who were screened adequately within a specified period as a
percentage of eligible women. The period for women aged 25 to 49 is 3.5 years, and for
women aged 50 to 64 is 5.5 years. Uptake The percentage of people with a final screening test result, out of those eligible.
Bowel screening
Purpose
Bowel screening is intended to detect bowel cancer at an early stage, when treatment is
more likely to be effective or to help prevent cancer from developing in the first place by
allowing the treatment of pre-cancerous conditions.
Invited population
All UK programmes invite men and women for bowel screening every 2 years.
Screening is offered to people aged 50 to 74 in Scotland, and to those aged 60 to 74 in
Wales, England and Northern Ireland. A further one-off diagnostic test using flexible
sigmoidoscopy is being piloted in England, aimed at men and women aged 55. In
Cancer statistics: availability and location - March 2020 update
19
August 2018 the UK National Screening Committee recommended the bowel cancer
screening should be offered from age 50 to 74 using the new faecal immunochemical
test (FIT) kit. Coverage
The proportion of eligible men and women aged 60 to 74 years invited for screening
who have had an adequate screening result in the previous 30 months.
Uptake
The proportion of eligible men and women aged 60 to 74 years invited to participate in
bowel cancer screening who adequately participate.
Key statistics
• Screening coverage (2018) from Public Health Outcomes Framework, Health
Improvement, metrics 2.20i-iii by region, county and district
• Coverage and uptake (2017/18) from Cancer Services profiles, by region, county
and district
• Breast Screening Programme summaries (2017/18), including an interactive
dashboard for England and regions
• Audit of screen detected breast cancer (2017/18) published by Association of Breast
Surgery by devolved administrations, and English regions
• Cervical Screening Programme summaries (2017/18), by England, CCG and GP
Other sources of information
• UK screening portal contains information on the UK screening programmes
• NHS bowel cancer screening programme in England
• NCRAS data briefing ‘Improved Survival for Screen-Detected Breast Cancer’ based
on data from the ABS Audit
• 'Outcomes from the first UK bowel cancer screening programme (BCSP) site:
screening and surveillance experience since 2006', Padmanabhan H, 2015 BMJ Gut
• ‘Reasons for non-uptake and subsequent participation in the NHS Bowel Cancer
Screening Programme: a qualitative study’, Palmer et al. 2014, British Journal of
Cancer
• Flexible-sigmoidoscopy trial results
• ‘Nationwide bowel cancer screening programme in England: cohort study of lifestyle
factors affecting participation and outcomes in women’ Blanks R G, 2015, British
Journal of Cancer
• 'Outcomes of the Bowel Cancer Screening Programme (BCSP) in England after the
first one million tests', Logan R, 2012, BMJ Gut
Cancer statistics: availability and location - March 2020 update
20
• Scotland breast screening statistics: Annual statistics (2018) published on the
Information Services Division (ISD) Scotland website
• Wales breast screening statistics: Annual statistical report (2017-18)
• Northern Ireland breast screening statistics: Annual report and statistical bulletin
(2012-13)
• Scotland cervical screening statistics: Scottish Cervical Screening Programme
(2016-17)
• Wales cervical screening statistics: Cervical Screening Wales Programme (2018-19)
• Northern Ireland cervical screening statistics: Northern Ireland cancer screening
programme
• Scotland bowel screening statistics: Scottish bowel screening programme key
performance indicators (2018)
• Wales bowel screening statistics: annual report 2017-18
• Northern Ireland bowel screening statistics: Bowel screening programme reports up
to 2013
Routes to diagnosis
Routes to Diagnosis defines a methodology by which the route the patient follows to the
point of diagnosis can be categorised to examine demographic, organisational, service
and personal reasons for delayed diagnosis. Administrative hospital episode statistics
(HES) data is combined with cancer waiting times (CWT) data, data from the cancer
screening programmes and cancer registration data. Using these datasets, every case
of cancer registered is categorised into one of 8 routes to diagnosis.
Different cancers show substantial differences in the proportion of cases that present by
each route, in reasonable agreement with previous clinical studies. Patients presenting
via emergency routes have substantially lower one-year relative survival. This
methodology can be used to explore possible reasons for delayed diagnosis, direct the
focus of early diagnosis initiatives and identify areas for further research.
Graph from CRUK www.cancerresearchuk.org/health-professional/cancer-
statistics/diagnosis-and-treatment#heading-Zero