Embed Size (px)
Citation preview

Introduction
Cancer is an important public health con-cern in the United States and around theworld. In order to provide an up-to-dateperspective on the occurrence of cancer,we present an overview of cancer inci-dence, mortality, and survival statisticsfor 1997.
MethodsEstimated New Cancer Cases: We esti-mated the number of new cancer casesthat we expect to be diagnosed in thecoming year using population data col-lected by the US Bureau of the Censusand cancer incidence data collected bythe National Cancer Institute’s Surveil-lance, Epidemiology, and End Results(SEER) Program.1-3
Estimates were calculated using atwo-step procedure. First, we multipliedcancer incidence rates for 1979 through1993 by US Census Bureau populationprojections for the same years to estimatethe number of cancer cases diagnosed an-nually from 1979 to 1993.1-3 Next, we fit-ted these annual case estimates to a qua-dratic function using the SAS procedurePROC FORECAST to project the num-ber of cancer cases expected to be diag-nosed in 1997.4,5 Some additional adjust-ments were made for sites with recentlychanging incidence rates or with widelyvarying year-to-year estimates. Thesesites included rectum, pancreas, and oth-er leukemia in males and females; larynx,prostate, chronic lymphocytic leukemia,and anus, anal canal, and anorectum inmales; and lung and bronchus, corpus andother uterus, eye and orbit, and Hodgk-in’s disease in females.
Because cancer incidence rates for1979 through 1993 were not available formany states, we used state-specific dataon cancer deaths to estimate the numberof new cancer cases occurring in eachstate. First, using methods described inthe section below, we estimated the num-ber of 1997 cancer deaths expected to oc-cur in each state and in the United Statesas a whole. Next, we used these US andstate estimates to calculate the propor-tion of cancer deaths expected to occur ineach state. Finally, we estimated the num-ber of cancer cases for each state by mul-tiplying the proportion of cancer deathsexpected to occur in each state in 1997 bythe estimated number of new cancer casesfor the United States for the same year.
C A C a n c e r J C l i n 1 9 9 7 ; 4 7 : 5 - 2 7
Vol. 47 No. 1 january/February 1997 5
Cancer Statistics, 1997
Sheryl L. Parker, MSPHTony Tong, MSSherry Bolden, BAPhyllis A. Wingo, PhD, MS
Ms. Parker is an Epidemiologist with the Sur-veillance Research Program, Department ofEpidemiology and Surveillance, American CancerSociety, Atlanta, Georgia.
Mr. Tong is a Consultant to the SurveillanceResearch Program, Department of Epidemiologyand Surveillance, American Cancer Society,Atlanta, Georgia.
Ms. Bolden is a Program Specialist with theSurveillance Research Program, Department ofEpidemiology and Surveillance, American CancerSociety, Atlanta, Georgia.
Dr. Wingo is Director of the Surveillance ResearchProgram, Department of Epidemiology andSurveillance, American Cancer Society, Atlanta,Georgia.
The authors thank Belinda Hill for her assistance inthe preparation of this manuscript and KourtneyJohnston Davis for her suggestions regarding con-tent and organization.

Estimated Cancer Deaths: We estimatedthe number of US cancer deaths expectedto occur in 1997 using data on underlyingcause of death gathered from death cer-tificates by the National Center for HealthStatistics (NCHS).6 Data on the numberof cancer deaths occurring annually from1979 to 1993 were fitted to a quadraticmodel using the SAS procedure PROCFORECAST. This model was used toforecast the number of cancer deaths ex-pected to occur in 1997.4,5 Some estimateswere adjusted slightly to compensate forthe effect of recently changing mortalityrates or large year-to-year variations inestimates. These sites included rectum,pancreas, larynx, bones and joints, othernonepithelial skin, breast, testis, urinarybladder, other endocrine, and acute mye-locytic leukemia in men; and stomach,cervix uteri, corpus and other uterus, andthyroid in women.
The estimated number of cancerdeaths for each state was calculated withthe same modeling procedure that wasused to estimate cancer deaths for theUnited States as a whole.
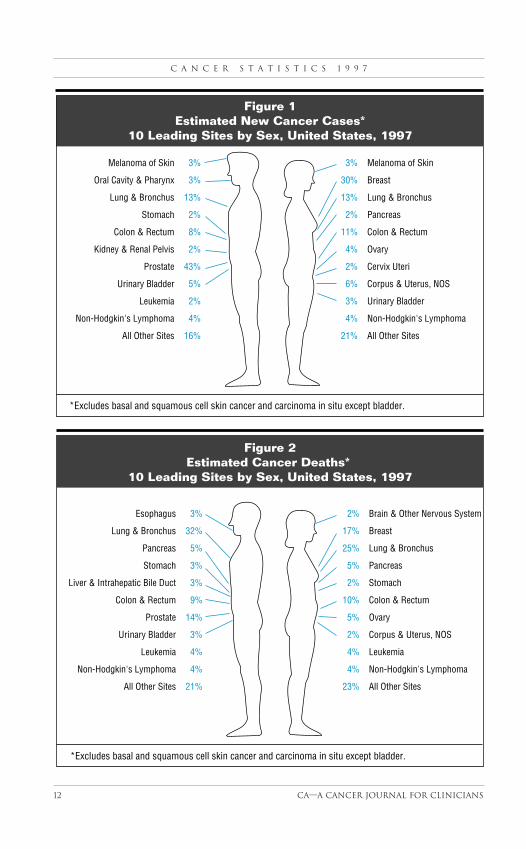
Other Statistics: Statistics on cancer andnoncancer mortality, the probability ofdeveloping cancer, and relative survivalare also presented in this report (Figs. 3-6,Tables 5-14). These statistics have beenassembled from several sources, andmethods used to calculate them havebeen previously described.7
Selected FindingsExpected Numbers of New Cancer Cases:In 1997, we estimate that about 1,382,400new cases of invasive cancer are expectedto be diagnosed in the United States(Table 1). This estimate does not includecarcinoma in situ of any site but bladder,nor does it include basal and squamouscell cancers of the skin. Over 900,000cases of basal and squamous cell skin can-cers, 36,400 cases of breast carcinoma insitu, and 20,100 cases of melanoma carci-
noma in situ are expected to be diag-nosed in 1997.
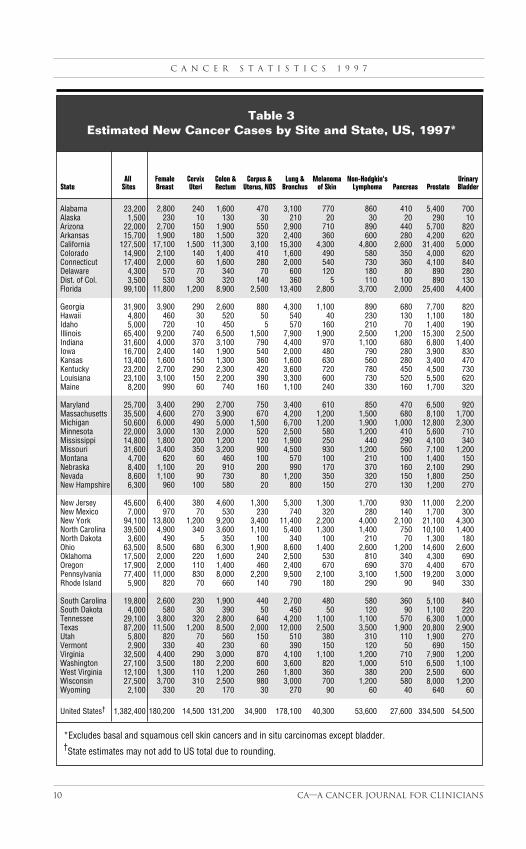
Among women, we estimate that in1997 the three most commonly diagnosedcancers will be cancers of the breast, lungand bronchus, and colon and rectum (Fig.1). There will be about 324,800 new can-cers occurring at these sites, accountingfor over 50 percent of new cancer cases.Breast cancer alone will account for 30percent of new cancer cases with about180,200 new cases to be diagnosed in1997.
Among men, the most common can-cers in 1997 will be cancers of theprostate, lung and bronchus, and colonand rectum (Fig. 1). Prostate is the lead-ing cancer site, accounting for 43 percentof new cancer cases. Between 1990 and1997, our estimates for prostate cancercases increased sharply; this increase re-flects the dramatic increase in prostatecancer incidence rates between 1988 and1993.
Expected Numbers of Cancer Deaths: In1997, we estimate that about 560,000Americans will die of cancer—more than1,500 people a day (Table 2). Preliminarydata for 1995 suggest that overall cancermortality rates have recently begun to de-cline.9 Numbers of deaths, however, havecontinued to increase due to the agingpopulation.
Among women, we estimate thatcancers of the lung and bronchus, breast,and colon and rectum will account forover half of all cancer deaths in 1997 (Fig.2). Lung is the leading cancer site, ac-counting for 25 percent of all cancerdeaths. Since 1987, lung cancer has beenthe leading cause of cancer death inwomen. Prior to that time, more deathswere caused by breast cancer, which forover 40 years was the major cause of can-cer death in women.1,6 In 1997, breastcancer is expected to be responsible for17 percent of female cancer deaths. Theoverall breast cancer mortality rate hasbeen declining since 1989. Between 1989
C a n c e r s t a t i s t i c s 1 9 9 7
6 Ca—A cancer Journal for Clinicians

and 1993, breast cancer mortality de-clined among white women aged 80 yearsand younger and among African-Ameri-can women aged 70 years and younger.1,6
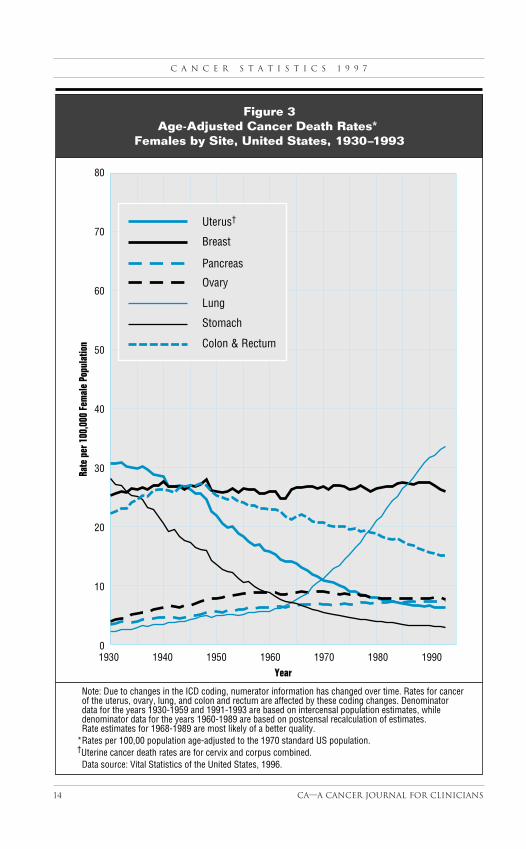
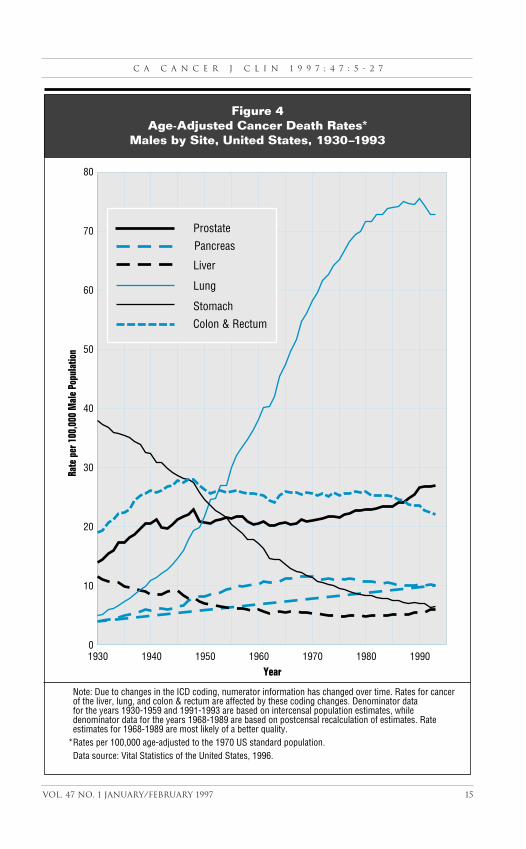
Among men, most 1997 cancerdeaths are expected to be caused by can-cers of the lung and bronchus, prostate,and colon and rectum (Fig. 2). Likewomen, men are more likely to die oflung cancer than cancer of any other site.In 1997 alone, lung cancer is expected tobe responsible for 98,300 deaths in men(32 percent). Responsible for about halfas many deaths as lung cancer, prostatecancer is expected to cause about 14 per-cent of cancer deaths in 1997. Recent in-creases in prostate cancer mortality rateshave been much less dramatic than in-creases in prostate cancer incidence rates.Consequently, our estimated number ofprostate cancer deaths increased only 39percent between 1990 and 1997 com-pared to over 200 percent for our estimat-ed number of prostate cancer cases.
Limitations and Future Challenges Our estimated numbers of new cancercases and cancer deaths should be inter-preted with caution when used to studytrends in cancer incidence and mortality.Numbers can vary considerably fromyear to year, particularly for less commoncancers and for states with small popula-tions. NCHS mortality rates and SEERand state cancer incidence rates are gen-erally more informative statistics to usewhen tracking cancer trends.
Changes in incidence or mortalitytrends that have occurred since 1993 arenot reflected in this year’s estimates. Forexample, regional reports suggest that therapid increase in prostate cancer inci-dence rates observed between 1988 and1992 may have begun to slow or changein 1993.1,8 If this is correct, the estimatesof new prostate cases that we have pub-lished in recent years will be higher thanthe actual number of new cases.
In addition, our estimates may notreflect fluctuations in trends occurring be-tween 1979 and 1993. For example, al-though breast cancer incidence rates in-creased about one percent per yearbetween 1979 and 1982 and four percentper year between 1982 and 1987, rateswere about constant between 1987 and1993. Despite the stabilization of ratesduring the latter time period, our esti-mates for new breast cancer cases contin-ued increasing between 1988 and 1986.
Despite these limitations, our esti-mates do provide an indication of currentpatterns of cancer in the United States.Continuing efforts in the areas of preven-tion, screening, and treatment are neces-sary to reduce the burden of cancer in theUS and world populations as we ap-proach the 21st century.
References1. Ries LAG, Kosary CL, Hankey BF, et al: SEERCancer Statistics Review, 1973-1993: Tables andGraphs (NIH Pub. 96-2789). Bethesda, Md,National Cancer Institute, 1995.2. United States Bureau of the Census: CurrentPopulation Reports, P-25-1130, Population Pro-jections of the United States, by Age, Sex, Race,and Hispanic Origin: 1995 to 2050. Washington,DC, Government Printing Office, 1996.3. United States Bureau of the Census: CurrentPopulation Reports, P25-1127, National and StatePopulation Estimates: 1990 to 1994. WashingtonDC, Government Printing Office, 1995.4. Box GEP, Jenkins GM: Time Series Analysis:Forecasting and Control. San Francisco, Holden-Day, 1976.5. SAS Institute Inc., SAS/ETS User’s Guide,Version 6, First Edition. Cary, North Carolina, SASInstitute Inc., 1988.6. National Center for Health Statistics: VitalStatistics of the United States, 1993. Washington,DC, Public Health Service, 1996.7. Parker SL, Tong T, Bolden St, Wingo PA: Cancerstatistics 1996. CA Cancer J Clin 1996;46:5-27.8. Stephenson RA, Smart CR, Mineau GP, et al:The fall in incidence of prostate carcinoma. Cancer1996;77:1342-1348.9. Rosenberg HM, Ventura SJ, Maurer JD, et al:Birth and Deaths, 1995: Monthly Vital StatisticsReport; Vol 45 No 3, Supp 2. Hyattsville, Md,National Center for Health Statistics, 1996.
C A C a n c e r J C l i n 1 9 9 7 ; 4 7 : 5 - 2 7
Vol. 47 No. 1 january/February 1997 7

C a n c e r s t a t i s t i c s 1 9 9 7
8 Ca—A cancer Journal for Clinicians
All Sites†
Oral cavity & pharynxTongueMouthPharynxOther oral cavityDigestive systemEsophagusStomachSmall intestineColonRectumAnus, anal canal, & anorectumLiver & intrahepatic bile ductGallbladder & other biliaryPancreasOther digestive organsRespiratory systemLarynxLung & bronchusOther respiratory organsBones & jointsSoft tissue (including heart)Skin (excluding basal & squamous)Melanomas-skinOther non-epithelial skinBreastGenital systemCervix uteriCorpus & uterus, NOSOvaryVulvaVagina & other genital organs, femaleProstateTestisPenis & other genital organs, maleUrinary systemUrinary bladderKidney & renal pelvisUreter & other urinary organsEye & orbitBrain & other nervous systemEndocrine systemThyroidOther endocrineLymphomaHodgkin’s diseaseNon-Hodgkin’s lymphomaMultiple myelomaLeukemiaAcute lymphocytic leukemiaChronic lymphocytic leukemiaAcute myelocytic leukemiaChronic myelocytic leukemiaOther leukemiaOther & unspecified primary sites
*Excludes basal and squamous cell skin cancers and in situ carcinomas except bladder.†Site-specific estimates may not add to all sites’ total due to rounding.
Table 1Estimated New Cancer Cases by Sex, United States, 1997*
Total Male Female1,382,400 785,800 596,600
30,750 20,900 9,8506,400 4,200 2,200
11,000 6,700 4,3008,800 6,400 2,4004,550 3,600 950
225,900 120,000 105,90012,500 9,400 3,10022,400 14,000 8,400
4,900 2,600 2,30094,100 45,500 48,60037,100 20,900 16,200
3,400 1,400 2,00013,600 9,100 4,500
6,900 2,500 4,40027,600 13,400 14,200
3,400 1,200 2,200194,600 111,400 83,200
10,900 8,900 2,000178,100 98,300 79,800
5,600 4,200 1,4002,500 1,300 1,2006,600 3,700 2,900
54,300 34,900 19,40040,300 22,900 17,40014,000 12,000 2,000
181,600 1,400 180,200424,800 343,000 81,800
14,500 14,50034,900 34,90026,800 26,800
3,300 3,3002,300 2,300
334,500 334,5007,200 7,2001,300 1,300
85,400 58,000 27,40054,500 39,500 15,00028,800 17,100 11,700
2,100 1,400 7002,100 1,100 1,000
17,600 10,100 7,50017,560 5,530 12,03016,100 4,700 11,400
1,460 830 63061,100 34,200 26,900
7,500 3,900 3,60053,600 30,300 23,30013,800 7,900 5,90028,300 15,900 12,400
3,000 1,600 1,4007,400 4,300 3,1009,200 4,700 4,5004,300 2,400 1,9004,400 2,900 1,500
35,500 16,500 19,000

C A C a n c e r J C l i n 1 9 9 7 ; 4 7 : 5 - 2 7
Vol. 47 No. 1 january/February 1997 9
All Sites†
Oral cavity & pharynxTongueMouthPharynxOther oral cavityDigestive systemEsophagusStomachSmall intestineColonRectumAnus, anal canal, & anorectumLiver & intrahepatic bile ductGallbladder & other biliaryPancreasOther digestive organsRespiratory systemLarynxLung & bronchusOther respiratory organsBones & jointsSoft tissue (including heart)Skin (excluding basal & squamous)Melanomas-skinOther non-epithelial skinBreastGenital systemCervix uteriCorpus & uterus, NOSOvaryVulvaVagina & other genital organs, femaleProstateTestisPenis & other genital organs, maleUrinary systemUrinary bladderKidney & renal pelvisUreter & other urinary organsEye & orbitBrain & other nervous systemEndocrine systemThyroidOther endocrineLymphomaHodgkin’s diseaseNon-Hodgkin’s lymphomaMultiple myelomaLeukemiaAcute lymphocytic leukemiaChronic lymphocytic leukemiaAcute myelocytic leukemiaChronic myelocytic leukemiaOther leukemiaOther & unspecified primary sites
*Excludes basal and squamous cell skin cancers and in situ carcinomas except bladder. †Site-specific estimates may not add to all sites’ total due to rounding.
Table 2Estimated Cancer Deaths by Sex, United States, 1997*
Total Male Female
560,000 294,100 265,9008,440 5,600 2,8401,820 1,200 6202,500 1,400 1,1002,030 1,500 5302,090 1,500 590
127,070 67,440 59,63011,500 8,700 2,80014,000 8,300 5,7001,140 540 600
46,600 22,600 24,0008,300 4,400 3,900
410 150 26012,400 7,500 4,9003,500 1,300 2,200
28,100 13,500 14,6001,120 450 670
165,920 98,490 67,4304,230 3,300 930
160,400 94,400 66,0001,290 790 5001,410 750 6604,100 1,900 2,2009,490 6,100 3,3907,300 4,600 2,7002,190 1,500 690
44,190 290 43,90068,870 42,370 26,5004,800 4,8006,000 6,000
14,200 14,200800 800700 700
41,800 41,800350 350220 220
23,520 15,060 8,46011,700 7,800 3,90011,300 7,000 4,300
520 260 260250 140 110
13,200 7,200 6,0002,070 870 1,2001,230 450 780
840 420 42025,280 13,220 12,0601,480 820 660
23,800 12,400 11,40010,900 5,500 5,40021,310 11,770 9,5401,410 770 6404,900 2,800 2,1006,300 3,400 2,9002,400 1,400 1,0006,300 3,400 2,900
34,000 17,400 16,600
10 Ca—A cancer Journal for Clinicians
C a n c e r s t a t i s t i c s 1 9 9 7
*Excludes basal and squamous cell skin cancers and in situ carcinomas except bladder.†State estimates may not add to US total due to rounding.
StateFemaleBreast
CervixUteri
Corpus &Uterus, NOS
Lung &Bronchus
Melanomaof Skin
All Sites
Non-Hodgkin'sLymphoma Pancreas Prostate
UrinaryBladder
Table 3Estimated New Cancer Cases by Site and State, US, 1997*
AlabamaAlaskaArizonaArkansasCalifornia ColoradoConnecticutDelawareDist. of Col.Florida
GeorgiaHawaiiIdahoIllinoisIndianaIowaKansasKentuckyLouisianaMaine
MarylandMassachusettsMichiganMinnesotaMississippiMissouriMontanaNebraskaNevadaNew Hampshire
New JerseyNew MexicoNew YorkNorth CarolinaNorth DakotaOhioOklahomaOregonPennsylvaniaRhode Island
South CarolinaSouth DakotaTennesseeTexasUtahVermontVirginiaWashingtonWest VirginiaWisconsinWyoming
United States†
2,800230
2,7001,900
17,1002,1002,000
570530
11,800
3,900460720
9,2004,0002,4001,6002,7003,100
990
3,4004,6006,0003,0001,8003,400
6201,1001,100
960
6,400970
13,8004,900
4908,5002,0002,000
11,000820
2,600580
3,80011,500
820330
4,4003,5001,3003,700
330
180,200
24010
150180
1,500140607030
1,200
2903010
74037014015029015060
290270490130200350602090
100
38070
1,200340
568022011083070
23030
3201,200
7040
29018011031020
14,500
Colon &Rectum
1,600130
1,9001,500
11,3001,4001,600
340320
8,900
2,600520450
6,5003,1001,9001,3002,3002,200
740
2,7003,9005,0002,0001,2003,200
460910730580
4,600530
9,2003,600
3506,3001,6001,4008,000
660
1,900390
2,8008,500
560230
3,0002,2001,2002,500
170
131,200
47030
550320
3,10041028070
1402,500
880505
1,500790540360420390160
750670
1,5005201209001002008020
1,300230
3,4001,100
1001,900
240460
2,200140
44050
6402,000
15060
87060026098030
34,900
3,100210
2,9002,400
15,3001,6002,000
600360
13,400
4,300540570
7,9004,4002,0001,6003,6003,3001,100
3,4004,2006,7002,5001,9004,500
570990
1,200800
5,300740
11,4005,400
3408,6002,5002,4009,500
790
2,700450
4,20012,000
510390
4,1003,6001,8003,000
270
178,100
77020
710360
4,300490540120
52,800
1,10040
1601,900
970480630720600240
6101,2001,200
580250930100170350150
1,300320
2,2001,300
1001,400
530670
2,100180
48050
1,1002,500
380150
1,10082036070090
40,300
86030
890600
4,800580730180110
3,700
890230210
2,5001,100
790560780730330
8501,5001,9001,200
4401,200
210370320270
1,700280
4,0001,400
2102,600
810690
3,100290
580120
1,1003,500
310120
1,2001,000
3801,200
60
53,600
41020
440280
2,60035036080
1002,000
68013070
1,200680280280450520160
470680
1,000410290560100160150130
930140
2,10075070
1,200340370
1,50090
36090
5701,900
11050
71051020058040
27,600
5,400290
5,7004,200
31,4004,0004,100
890890
25,400
7,7001,1001,400
15,3006,8003,9003,4004,5005,5001,700
6,5008,100
12,8005,6004,1007,1001,4002,1001,8001,200
11,0001,700
21,10010,1001,300
14,6004,3004,400
19,200940
5,1001,1006,300
20,8001,900
6907,9006,5002,5008,000
640
334,500
70010
820620
5,000620840280130
4,400
820180190
2,5001,400
830470730620320
9201,7002,300
710340
1,200150290250270
2,200300
4,3001,400
1802,600
690670
3,000330
840220
1,0002,900
270150
1,2001,100
6001,200
60
54,500
23,2001,500
22,00015,700
127,50014,90017,4004,3003,500
99,100
31,9004,8005,000
65,40031,60016,70013,40023,20023,1008,200
25,70035,50050,60022,00014,80031,6004,7008,4008,6006,300
45,6007,000
94,10039,5003,600
63,50017,50017,90077,4005,900
19,8004,000
29,10087,2005,8002,900
32,50027,10012,10027,5002,100
1,382,400

C A C a n c e r J C l i n 1 9 9 7 ; 4 7 : 5 - 2 7
Vol. 47 No. 1 january/February 1997 11
United States‡
State
ReportedDeath Rate
per 100,000†
173
Estimated Number of Deaths
560,000
AlabamaAlaskaArizonaArkansasCalifornia ColoradoConnecticutDelawareDist. of Col.Florida
GeorgiaHawaiiIdahoIllinoisIndianaIowaKansasKentuckyLouisianaMaine
MarylandMassachusettsMichiganMinnesotaMississippiMissouriMontanaNebraskaNevadaNew Hampshire
New JerseyNew MexicoNew YorkNorth CarolinaNorth DakotaOhioOklahomaOregonPennsylvaniaRhode Island
South CarolinaSouth DakotaTennesseeTexasUtahVermontVirginiaWashingtonWest VirginiaWisconsinWyoming
43,900
67060
670470
4,200520480140130
2,900
950110170
2,200960590380650760240
8401,1001,500
720430840150270260230
1,600240
3,4001,200
1202,100
480490
2,700200
620140910
2,80020080
1,10085032089080
4,800
805
5060
51050202010
380
100105
2401205050
1005020
10090
1604070
12020103030
13020
400110
52207040
27020
8010
1004002010
1006040
10010
54,900
66050
810610
4,700590690140130
3,700
1,100220190
2,7001,300
770550940920310
1,1001,6002,100
860510
1,300190380310240
1,900220
3,9001,500
1502,600
680590
3,300280
800160
1,2003,600
230100
1,300930490
1,00070
6,000
805
10050
53070501020
430
150105
2601409060707030
1301202609020
1502030105
22040
58018020
3304080
38020
7010
1103503010
15010040
1705
160,400
2,800190
2,6002,200
13,8001,5001,800
540330
12,100
3,900490510
7,1004,0001,8001,5003,3003,0001,000
3,0003,8006,1002,2001,7004,100
510890
1,100720
4,700660
10,2004,800
3107,7002,3002,2008,500
710
2,400400
3,80010,800
460360
3,7003,2001,6002,700
240
7,300
1405
13060
78090
100205
510
1901030
34017090
11013011040
11022022010050
17020306030
23060
41023020
26010012039030
9010
2004507030
20015070
13020
23,800
38010
390270
2,2002603208050
1,700
39010090
1,100490350250350320150
38065086053020055090
170140120
760120
1,80064090
1,100360310
1,400130
26050
4801,600
14050
52045017054030
28,100
42020
450280
2,60036037080
1002,100
69013070
1,200690280290460530160
480700
1,000420300570100170160130
940140
2,10076070
1,200340380
1,50090
36090
5801,900
11050
72052020059040
41,800
67040
710530
3,900500520110110
3,200
960140180
1,900850490430560690220
8101,0001,600
700510890180260220150
1,400220
2,6001,300
1701,800
530560
2,400120
630140780
2,60024090
980810320
1,00080
179171159180162147166195221168
177137149181178159159193194186
190181177156181177162157184182
184146172175157181170168179179
178155179170126175179165184166154
9,400600
8,9006,400
51,7006,0007,0001,8001,400
40,100
12,900 1,900
2,00026,50012,8006,8005,4009,4009,4003,300
10,40014,40020,5008,9006,000
12,8001,9003,4003,5002,600
18,5002,800
38,10016,0001,500
25,7007,1007,200
31,3002,400
8,0001,600
11,80035,3002,4001,200
13,20011,0004,900
11,200830
Table 4Cancer Mortality by Site and State, US, 1997*
*Excludes basal and squamous cell skin cancers and in situ carcinomas except bladder.†NCHS average annual mortality rate for 1989-1993, age-adjusted to the 1970 US standard population.‡State estimates may not add to US total due to rounding.
FemaleBreast
CervixUteri
Corpus &
Uterus,NOS
Lung &Bronchus
Mela-noma
of SkinAll
Sites
Non-Hodgkin'sLymphoma Pancreas Prostate
UrinaryBladder
Colon &Rectum
11,700
1505
180130
1,1001301806030
940
1804040
53029018010016013070
20036049015070
25030605060
46070
91030040
56015014063070
18050
2306206030
25023013025010
C a n c e r s t a t i s t i c s 1 9 9 7
12 Ca—A cancer Journal for Clinicians
3%
3%
13%
2%
8%
2%
43%
5%
2%
4%
16%
Melanoma of Skin
Oral Cavity & Pharynx
Lung & Bronchus
Stomach
Colon & Rectum
Kidney & Renal Pelvis
Prostate
Urinary Bladder
Leukemia
Non-Hodgkin's Lymphoma
All Other Sites
3%
30%
13%
2%
11%
4%
2%
6%
3%
4%
21%
Melanoma of Skin
Breast
Lung & Bronchus
Pancreas
Colon & Rectum
Ovary
Cervix Uteri
Corpus & Uterus, NOS
Urinary Bladder
Non-Hodgkin's Lymphoma
All Other Sites
*Excludes basal and squamous cell skin cancer and carcinoma in situ except bladder.
3%
32%
5%
3%
3%
9%
14%
3%
4%
4%
21%
Esophagus
Lung & Bronchus
Pancreas
Stomach
Liver & Intrahepatic Bile Duct
Colon & Rectum
Prostate
Urinary Bladder
Leukemia
Non-Hodgkin's Lymphoma
All Other Sites
2%
17%
25%
5%
2%
10%
5%
2%
4%
4%
23%
Brain & Other Nervous System
Breast
Lung & Bronchus
Pancreas
Stomach
Colon & Rectum
Ovary
Corpus & Uterus, NOS
Leukemia
Non-Hodgkin's Lymphoma
All Other Sites
Figure 1Estimated New Cancer Cases*
10 Leading Sites by Sex, United States, 1997
Figure 2Estimated Cancer Deaths*
10 Leading Sites by Sex, United States, 1997
*Excludes basal and squamous cell skin cancer and carcinoma in situ except bladder.

C A C a n c e r J C l i n 1 9 9 7 ; 4 7 : 5 - 2 7
Vol. 47 No. 1 january/February 1997 13
Birth
to 3
9 40
to 5
960
to 7
9 Ev
er
Year
sYe
ars
Year
s(B
irth
to D
eath
)
All s
ites*
Mal
e1.
71 (1
in 5
8)8.
27 (1
in 1
2)37
.79
(1 in
3)
48.1
7 (1
in 2
)
Fem
ale
1.96
(1 in
51)
9.12
(1 in
11)
22.4
8 (1
in 4
)38
.33
(1 in
3)
Brea
stFe
mal
e0.
46 (1
in 2
17)
3.92
(1 in
26)
6.94
(1 in
14)
12.6
1 (1
in 8
)
Colo
n &
Mal
e0.
06 (1
in 1
,667
)0.
92 (1
in 1
09)
4.27
(1 in
23)
6.02
(1 in
17)
Rect
umFe
mal
e0.
05 (1
in 2
,000
)0.
70 (1
in 1
43)
3.24
(1 in
31)
5.77
(1 in
17)
Lung
&M
ale
0.04
(1 in
2,5
00)
1.46
(1 in
68)
6.82
(1 in
15)
8.60
(1 in
12)
Bron
chus
Fem
ale
0.03
(1 in
3,3
33)
1.05
(1 in
95)
3.83
(1 in
26)
5.48
(1 in
18)
Pros
tate
Mal
eLe
ss th
an 1
in 1
0,00
01.
58 (1
in 6
3)17
.04
(1 in
6)
19.8
4 (1
in 5
)
* Ex
clud
es b
asal
and
squ
amou
s ce
ll sk
in c
ance
rs a
nd in
situ
car
cino
mas
exc
ept b
ladd
er.
Data
sou
rce:
NCI
Sur
veill
ance
, Epi
dem
iolo
gy, a
nd E
nd R
esul
ts P
rogr
am, 1
996.
Tab
le 5
Per
centa
ge
of
Pop
ula
tion D
evel
op
ing I
nva
sive
Can
cers
at C
erta
in A
ges
, U
nit
ed S
tate
s, 1
99
1–1
99
3
14 Ca—A cancer Journal for Clinicians
C a n c e r s t a t i s t i c s 1 9 9 7
80
70
60
50
40
30
20
10
01930 1940 1950 1960 1970 1980 1990
Year
Rate
per
100
,000
Fem
ale
Popu
latio
n
Figure 3Age-Adjusted Cancer Death Rates*
Females by Site, United States, 1930–1993
Note: Due to changes in the ICD coding, numerator information has changed over time. Rates for cancer of the uterus, ovary, lung, and colon and rectum are affected by these coding changes. Denominator data for the years 1930-1959 and 1991-1993 are based on intercensal population estimates, while denominator data for the years 1960-1989 are based on postcensal recalculation of estimates. Rate estimates for 1968-1989 are most likely of a better quality.*Rates per 100,00 population age-adjusted to the 1970 standard US population.†Uterine cancer death rates are for cervix and corpus combined. Data source: Vital Statistics of the United States, 1996.
Uterus†
Breast
Pancreas
Ovary
Lung
Stomach
Colon & Rectum
C A C a n c e r J C l i n 1 9 9 7 ; 4 7 : 5 - 2 7
Vol. 47 No. 1 january/February 1997 15
80
70
60
50
40
30
20
10
01930 1940 1950 1960 1970 1980 1990
Year
Rate
per
100
,000
Mal
e Po
pula
tion
Figure 4Age-Adjusted Cancer Death Rates*
Males by Site, United States, 1930–1993
Note: Due to changes in the ICD coding, numerator information has changed over time. Rates for cancer of the liver, lung, and colon & rectum are affected by these coding changes. Denominator data for the years 1930-1959 and 1991-1993 are based on intercensal population estimates, while denominator data for the years 1968-1989 are based on postcensal recalculation of estimates. Rate estimates for 1968-1989 are most likely of a better quality.*Rates per 100,000 age-adjusted to the 1970 US standard population. Data source: Vital Statistics of the United States, 1996.
Prostate
Pancreas
Liver
Lung
Stomach
Colon & Rectum

C a n c e r s t a t i s t i c s 1 9 9 7
16 Ca—A cancer Journal for Clinicians
All Ages Ages 1-14 Ages 15-34Male Female Male Female Male Female
All Causes All Causes All Causes All Causes All Causes All Causes1,161,797 1,106,756 9,799 6,525 70,593 24,535
1 Heart Heart Accidents Accidents Accidents AccidentsDiseases Diseases 3,792 2,264 21,475 6,513367,479 375,981
2 Cancer Cancer Cancer Cancer Homicide Cancer279,375 250,529 922 689 12,892 3,308
3 Accidents Cerebro- Homicide Congenital HIV Homicide60,117 vascular 682 Anomalies Infection 2,810
Diseases 637 10,04091,060
4 Cerebro- Chronic Congenital Homicide Suicide HIVvascular Obstructive Anomalies 438 9,337 InfectionDiseases Pulmonary 652 1,86859,048 Disease
46,7065 Chronic Pneumonia Heart Heart Cancer Suicide
Obstructive & Influenza Diseases Diseases 3,509 1,819Pulmonary 44,824 313 286Disease54,371
6 Pneumonia Diabetes Suicide HIV Heart Heart& Influenza Mellitus 233 Infection Diseases Diseases37,996 30,464 177 2,984 1,536
7 HIV Accidents Cerebral Cerebral Pneumonia Cerebro-Infection 30,406 Palsy Palsy & Influenza vascular32,093 208 163 549 Diseases
4918 Suicide Nephritis HIV Pneumonia Congenital Pneumonia
25,007 12,107 Infection & Influenza Anomalies & Influenza182 152 549 426
9 Diabetes Septicemia Pneumonia Suicide Cerebro- CongenitalMellitus 11,718 & Influenza 88 vascular Anomalies23,430 165 Diseases 399
514
10 Homicide Diseases Chronic Septicemia Cirrhosis Diabetes20,290 of Arteries Obstructive 79 of Liver Mellitus
11,042 Pulmonary 501 331Disease112
Data source: Vital Statistics of the United States, 1996.
Table 6Reported Deaths for the 10 Leading Causes of Death
by Age and Sex, United States, 1993

C A C a n c e r J C l i n 1 9 9 7 ; 4 7 : 5 - 2 7
Vol. 47 No. 1 january/February 1997 17
Ages 35-54 Ages 55-74 Ages 75+Male Female Male Female Male Female
All Causes All Causes All Causes All Causes All Causes All Causes149,843 78,010 426,512 302,888 486,337 680,138
1 Heart Cancer Heart Cancer Heart HeartDiseases 30,345 Diseases 111,937 Diseases Diseases33,768 146,359 183,642 278,010
2 Cancer Heart Cancer Heart Cancer Cancer28,782 Diseases 142,057 Diseases 104,037 104,203
12,032 83,7873 HIV Accidents Chronic Chronic Cerebro- Cerebro-
Infection 5,182 Obstructive Obstructive vascular vascular19,670 Pulmonary Pulmonary Diseases Diseases
Diseases Diseases 36,047 70,19322,936 19,003
4 Accidents Cerebro- Cerebro- Cerebro- Chronic Pneumonia &16,102 vascular vascular vascular Obstructive Influenza
Diseases Diseases Diseases Pulmonary 36,8953,469 18,182 16,754 Diseases
29,3395 Suicide HIV Diabetes Diabetes Pneumonia & Chronic
7,976 Infection Mellitus Mellitus Influenza Obstructive2,746 10,797 11,665 26,135 Pulmonary
Diseases25,818
6 Cirrhosis Suicide Accidents Pneumonia Diabetes Diabetesof Liver 2,362 9,218 & Influenza Mellitus Mellitus6,183 5,870 9,288 16,230
7 Homicide Cirrhosis Pneumonia Accidents Accidents Accidents5,072 of Liver & Influenza 5,312 8,930 10,729
2,276 8,657
8 Cerebro- Diabetes Cirrhosis Cirrhosis Diseases Alzheimer’svascular Mellitus of Liver of Liver of Arteries DiseaseDiseases 2,209 7,489 4,218 7,421 9,8304,107
9 Diabetes Chronic Diseases Diseases Nephritis Athero-Mellitus Obstructive of Arteries of Arteries 6,682 sclerosis2,937 Pulmonary 6,504 3,183 9,701
Disease1,544
10 Substance Homicide Suicide Nephritis Alzheimer’s NephritisAbuse 1,517 4,797 3,128 Disease 8,2812,224 4,785
Data source: Vital Statistics of the United States, 1996.
Table 6Reported Deaths for 10 Leading Causes of Death
by Age and Sex, United States, 1993

C a n c e r s t a t i s t i c s 1 9 9 7
18 Ca—A cancer Journal for Clinicians
Rank Cause of Death
Numberof
Deaths
Death Rateper 100,000Population*
Percentof TotalDeaths
Table 7Fifteen Leading Causes of Death
United States, 1993
1
2
3
4
5
6
7
8
9
10
11
12
13
14
15
All Causes
Heart Diseases
Cancer
Cerebrovascular Diseases
Chronic Obstructive Pulmonary Diseases
Accidents
Pneumonia & Influenza
Diabetes Mellitus
HIV Infection
Suicide
Homicide
Diseases of Arteries
Cirrhosis of Liver
Nephritis
Septicemia
Atherosclerosis
Other & Ill-defined
2,268,553
743,460
529,904
150,108
101,077
90,523
82,820
53,894
37,267
31,102
26,009
26,005
25,209
23,317
20,634
17,272
309,952
697.3
218.3
172.9
42.3
30.8
31.5
22.5
16.9
11.7
10.9
9.7
7.8
8.8
6.8
6.0
4.5
100.0
32.8
23.4
6.6
4.5
4.0
3.7
2.4
1.6
1.4
1.1
1.1
1.1
1.0
0.9
0.8
13.7
*Age-adjusted to the 1970 US standard population.
Data source: Vital Statistics of the United States, 1996.

C A C a n c e r J C l i n 1 9 9 7 ; 4 7 : 5 - 2 7
Vol. 47 No. 1 january/February 1997 19
All Ages Under 15 15-34 35-54 55-74 75+
All Sites All Sites All Sites All Sites All Sites All Sites250,529 721 3,308 30,345 111,937 104,203
Lung & Leukemia Breast Breast Lung & Lung &Bronchus 238 560 9,279 Bronchus Bronchus56,234 31,803 18,802
Breast Brain & ONS Leukemia Lung & Breast Colon &43,555 205 441 Bronchus 18,937 Rectum
5,501 16,137
Colon & Endocrine Brain & ONS Colon & Colon & BreastRectum System 326 Rectum Rectum 14,77829,206 74 2,064 10,861
Pancreas Bones & Cervix Uteri Ovary Ovary Pancreas13,776 Joints 323 1,823 6,159 6,909
44
Ovary Soft Tissue Non-Hodgkin’s Cervix Uteri Pancreas Non-Hodgkin’s12,870 37 Lymphoma 1,623 5,933 Lymphoma
214 4,854
ONS = other nervous systemNote: All sites category excludes basal and squamous cell skin cancers and in situ carcinomas except bladder.Data source: Vital Statistics of the United States,1996.
Table 9Reported Deaths for the Five Leading Cancer Sites
Females by Age, United States, 1993
All Ages Under 15 15-34 35-54 55-74 75+
All Sites All Sites All Sites All Sites All Sites All Sites279,375 978 3,509 28,782 142,057 104,037
Lung & Leukemia Leukemia Lung & Lung & Lung &Bronchus 359 645 Bronchus Bronchus Bronchus92,493 8,771 55,421 28,122
Prostate Brain & ONS Non-Hodgkin’s Colon & Colon & Prostate34,865 255 Lymphomas Rectum Rectum 22,465
477 2,508 13,689
Colon & Endocrine Brain & ONS Non-Hodgkin’s Prostate Colon &Rectum System 458 Lymphomas 12,051 Rectum28,199 113 1,699 11,787
Pancreas Non-Hodgkin’s Colon & Brain & ONS Pancreas Pancreas12,669 Lymphomas Rectum 1,542 6,678 4.580
63 209
Leukemia Soft Tissue Hodgkin’s Pancreas Esophagus Leukemia10,873 47 Disease 1,375 4,661 4,076
197
ONS = other nervous systemNote: All sites category excludes basal and squamous cell skin cancers and in situ carcinomas except bladder.Data source: Vital Statistics of the United States,1996.
Table 8Reported Deaths for the Five Leading Cancer Sites
Males by Age, United States, 1993

C a n c e r s t a t i s t i c s 1 9 9 7
20 Ca—A cancer Journal for Clinicians
AsianAfrican and Pacific NativeAmerican Islander1 American1,2 White Hispanic3
All Sites All Sites All Sites All Sites All Sites59,873 6,636 1,491 461,891 15,743100.0% 100.0% 100.0% 100.0% 100.0%
Lung & Bronchus Lung & Bronchus Lung & Bronchus Lung & Bronchus Lung & Bronchus15,625 1,477 399 131,213 2,81126.1% 22.3% 26.8% 28.4% 17.9%
Colon & Rectum Colon & Rectum Colon & Rectum Colon & Rectum Colon & Rectum6,216 693 133 50,363 1,50810.4% 10.4% 8.9% 10.9% 9.6%
Prostate Liver & Intrahepatic Female Breast Female Breast Female Breast5,656 Bile Duct 94 38,044 1,2849.4% 571 6.3% 8.2% 8.2%
8.6%
Female Breast Stomach Prostate Prostate Liver & Other Biliary4,998 510 89 28,847 9498.3% 7.7% 6.0% 6.2% 6.0%
Pancreas Female Breast Leukemia Pancreas Prostate3,176 419 74 22,859 9435.3% 6.3% 5.0% 4.9% 6.0%
Stomach Pancreas Stomach Non-Hodgkin’s Pancreas2,241 357 58 Lymphoma 8803.7% 5.4% 3.9% 18,894 5.6%
4.1%
Esophagus Prostate Kidney Leukemia Non-Hodgkin’s2,011 273 54 17,666 Lymphoma3.4% 4.1% 3.6% 3.8% 788
5.0%
Leukemia Leukemia Pancreas Ovary Leukemia1,694 273 53 11,680 7292.8% 4.1% 3.6% 2.5% 4.6%
Multiple Myeloma Non-Hodgkin’s Liver & Intrahepatic Brain & Other Liver & Intrahepatic 1,634 Lynphoma Bile Duct Nervous System Bile Duct2.7% 249 53 11,132 718
3.8% 3.6% 2.4% 4.6%
Non-Hodgkin’s Oral Cavity Non-Hodgkin’s Stomach Brain & OtherLymphoma & Pharynx Lymphoma 11,041 Nervous System1,306 176 37 2.4% 4282.2% 2.7% 2.5% 2.7%
Note 1: Since each column includes only the top 10 cancer sites, site-specific numbers and percentages do notadd up to the all sites totals.Note 2: All sites category excludes basal and squamous cell skin cancers and in situ carcinomas except bladder.1Numbers likely to be underestimates due to underreporting of Asian and Native American race.2Includes American Indians, Eskimos, and Aleuts.3Persons classified as of Hispanic origin on death certificates may be of any race. Hispanic origin reported for all states except Oklahoma.Data source: Vital Statistics of the United States, 1996.
Table 10Reported Cancer Deaths for the 10 Leading Cancer Sites
by Race and Ethnicity, United States, 1993
C A C a n c e r J C l i n 1 9 9 7 ; 4 7 : 5 - 2 7
Vol. 47 No. 1 january/February 1997 21
1960-1963
Five-Year Relative Survival Rates
White BlackSite White Black White Black White Black White Black
1970-1973 1974-1976 1980-1982 1986-1992
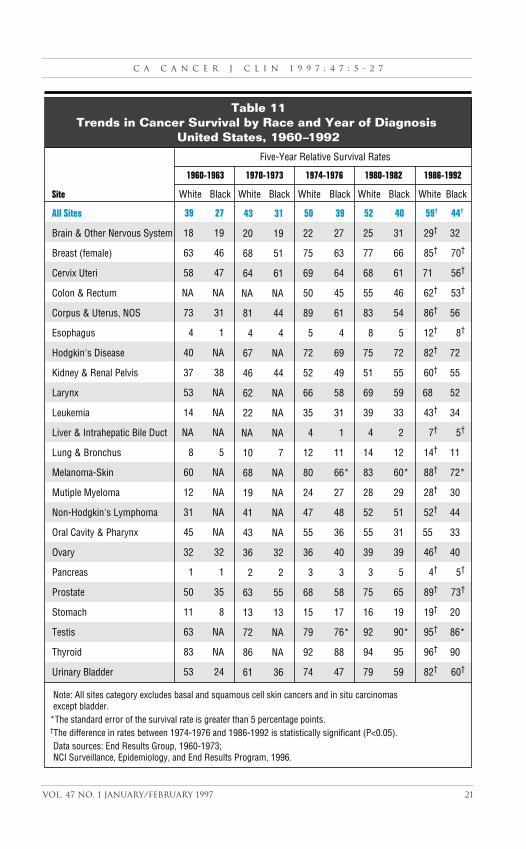
Table 11Trends in Cancer Survival by Race and Year of Diagnosis
United States, 1960–1992
Note: All sites category excludes basal and squamous cell skin cancers and in situ carcinomas except bladder. *The standard error of the survival rate is greater than 5 percentage points. †The difference in rates between 1974-1976 and 1986-1992 is statistically significant (P<0.05). Data sources: End Results Group, 1960-1973; NCI Surveillance, Epidemiology, and End Results Program, 1996.
43
20
68
64
NA
81
4
67
46
62
22
NA
10
68
19
41
43
36
2
63
13
72
86
61
31
19
51
61
NA
44
4
NA
44
NA
NA
NA
7
NA
NA
NA
NA
32
2
55
13
NA
NA
36
50
22
75
69
50
89
5
72
52
66
35
4
12
80
24
47
55
36
3
68
15
79
92
74
39
27
63
64
45
61
4
69
49
58
31
1
11
66*
27
48
36
40
3
58
17
76*
88
47
39
18
63
58
NA
73
4
40
37
53
14
NA
8
60
12
31
45
32
1
50
11
63
83
53
27
19
46
47
NA
31
1
NA
38
NA
NA
NA
5
NA
NA
NA
NA
32
1
35
8
NA
NA
24
52
25
77
68
55
83
8
75
51
69
39
4
14
83
28
52
55
39
3
75
16
92
94
79
40
31
66
61
46
54
5
72
55
59
33
2
12
60*
29
51
31
39
5
65
19
90*
95
59
59†
29†
85†
71
62†
86†
12†
82†
60†
68
43†
7†
14†
88†
28†
52†
55
46†
4†
89†
19†
95†
96†
82†
44†
32
70†
56†
53†
56
8†
72
55
52
34
5†
11
72*
30
44
33
40
5†
73†
20
86*
90
60†
All Sites
Brain & Other Nervous System
Breast (female)
Cervix Uteri
Colon & Rectum
Corpus & Uterus, NOS
Esophagus
Hodgkin's Disease
Kidney & Renal Pelvis
Larynx
Leukemia
Liver & Intrahepatic Bile Duct
Lung & Bronchus
Melanoma-Skin
Mutiple Myeloma
Non-Hodgkin's Lymphoma
Oral Cavity & Pharynx
Ovary
Pancreas
Prostate
Stomach
Testis
Thyroid
Urinary Bladder
C a n c e r s t a t i s t i c s 1 9 9 7
22 Ca—A cancer Journal for Clinicians
60316
54318
383719
75129
232426
152544
8284
39418
241457
82348
591811
183136
74183
Site
Localized
Regional
Distant
0 20 40 60 80 100Percent
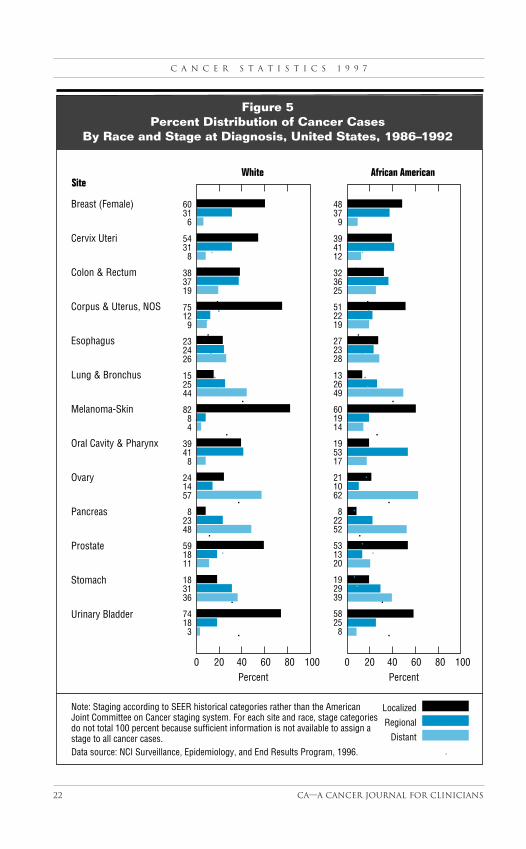
Note: Staging according to SEER historical categories rather than the American Joint Committee on Cancer staging system. For each site and race, stage categoriesdo not total 100 percent because sufficient information is not available to assign a stage to all cancer cases.Data source: NCI Surveillance, Epidemiology, and End Results Program, 1996.
Figure 5Percent Distribution of Cancer Cases
By Race and Stage at Diagnosis, United States, 1986–1992
Breast (Female)
Cervix Uteri
Colon & Rectum
Corpus & Uterus, NOS
Esophagus
Lung & Bronchus
Melanoma-Skin
Oral Cavity & Pharynx
Ovary
Pancreas
Prostate
Stomach
Urinary Bladder
48379
394112
323625
512219
272328
132649
601914
195317
211062
82252
531320
192939
58258
0 20 40 60 80 100Percent
White African American
C A C a n c e r J C l i n 1 9 9 7 ; 4 7 : 5 - 2 7
Vol. 47 No. 1 january/February 1997 23
All StagesLocalizedRegional
Distant
200 40 60 80 100Percent
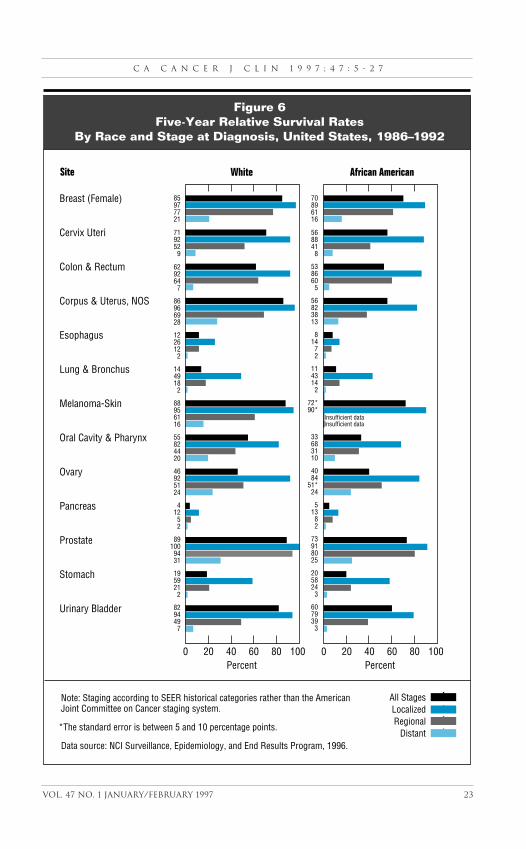
Figure 6Five-Year Relative Survival Rates
By Race and Stage at Diagnosis, United States, 1986–1992
Note: Staging according to SEER historical categories rather than the American Joint Committee on Cancer staging system.
*The standard error is between 5 and 10 percentage points.
Data source: NCI Surveillance, Epidemiology, and End Results Program, 1996.
85977721
7192529
6292647
86966928
1226122
1449182
88956116
55824420
46925124
41252
891009431
1959212
8294497
70896116
5688418
5386605
56823813
81472
1143142
72*90*
33683110
4084
51*24
51382
73918025
2058243
6079393
Site
Breast (Female)
Cervix Uteri
Colon & Rectum
Corpus & Uterus, NOS
Esophagus
Lung & Bronchus
Melanoma-Skin
Oral Cavity & Pharynx
Ovary
Pancreas
Prostate
Stomach
Urinary Bladder
White African American
200 40 60 80 100Percent
Insufficient dataInsufficient data

C a n c e r s t a t i s t i c s 1 9 9 7
24 Ca—A cancer Journal for Clinicians
Rank Cause of Death
Numberof
Deaths
Death Rateper 100,000Population*
Percentof TotalDeaths
Table 12Fifteen Leading Causes of Death Among Children
Aged 1-14, United States, 1993
1
2
3
4
5
6
7
8
9
10
11
12
13
14
15
All Causes
Accidents
Cancer
Congenital Anomalies
Homicide
Heart Diseases
Cerebral Palsy
HIV Infection
Suicide
Pneumonia & Influenza
Chronic Obstructive Pulmonary Disease
Septicemia
Benign Neoplasm
Viral Diseases
Cerebrovascular Diseases
Diseases of Infancy
All Others
15,724
6,056
1,611
1,289
1,120
599
371
359
321
317
189
156
149
135
128
120
2,804
26.5
10.3
2.9
2.0
1.9
1.0
0.7
0.6
0.7
0.5
0.3
0.2
0.2
0.2
0.2
0.2
100.0
38.5
10.2
8.2
7.1
3.8
2.4
2.3
2.0
2.0
1.2
1.0
0.9
0.9
0.8
0.8
17.8
*Age-adjusted to the 1970 US standard population. Data source: Vital Statistics of the United States, 1996.

C A C a n c e r J C l i n 1 9 9 7 ; 4 7 : 5 - 2 7
Vol. 47 No. 1 january/February 1997 25
Five-Year Relative Survival Rates
1960-1963
1970-1973
1974-1976
1980-1982
1986- 1992 Site
*Excludes basal and squamous cell skin cancer and in situ carcinomas except bladder.†The difference in rates between 1974-1976 and 1986-1992 is statistically significant (p<0.05).‡The standard error of the survival rate is between 5 and 10 percentage points. Data sources: End Results Group, 1960-1973; NCI Surveillance, Epidemiology, and End Results Program, 1996.
Year of Diagnosis
Table 13Trends in Cancer Survival for Children Under Age 15
United States, 1960–1992
All Sites*
Acute MyeloidLeukemia
Brain & Other Nervous System
Neuroblastoma
Soft Tissue
28
3
35
25
38‡
45
5
45
40
60‡
56
14
54
60
65
21‡
55
53
65
71†
61†
63†
72†
33†
52
Acute LymphocyticLeukemia
Bones & Joints
Hodgkin's Disease
Non-Hodgkin'sLymphoma
4
20‡
52‡
18
34
30‡
90
26
53
54‡
79
45
70
54‡
91
62
79†
65†
92†
71†
1977-1979
61
26‡
57
69
53
67
52‡
83
51
1983-1985
68
32‡
62
54
78
70
58‡
91
70
Wilms Tumor 33‡ 70‡ 74 86 93† 86 77

C a n c e r s t a t i s t i c s 1 9 9 7
26 Ca—A cancer Journal for Clinicians
Note: Ranks within site & sex group are in parentheses. *Rates are age-adjusted to the World Health Organization world standard population.
Table 14Cancer around the World
Age-Adjusted Death Rates* per 100,000 Populationby Site for Selected Sites for 48 Countries, 1990-1993
Country
United States##Albania§
Argentina††
Armenia##AustraliaAustriaBelarus§§
BulgariaCanada##China†+
Costa Rica††
Cuba†
Czech RebublicDenmarkEstoniaFinlandFrance##GermanyGreeceHungaryIreland##Israel##Italy††
Japan
KazakhistanKyrgyzstan†
LatviaLithuaniaMauritiusMexicoNetherlands##New Zealand##Norway##PolandPortugalRomania
Russian Fed.Singapore##SloveniaSpain##SwedenSwitzerlandTajikistan‡
Trinidad, Tobago††
Ukraine##United Kingdom§§
Uruguay†
Uzbekistan‡‡
All Sites
Male Female
165.3 (27)96.7 (46)
153.3 (29)137.2 (38)158.5 (28)171.6 (20)199.2 (11)140.5 (35)165.7 (25)165.7 (26)133.3 (39)127.4 (41)
237.2 ( 2)178.7 (17)211.9 ( 5)149.9 (31)197.4 (13)177.3 (18)145.8 (33)258.7 ( 1)174.4 (19)116.9 (43)189.2 (15)149.8 (32)
216.8 ( 4)140.1 (37)206.1 ( 6)200.7 (10)85.4 (47)81.6 (48)
189.7 (14)170.6 (21)145.2 (34)204.2 ( 8)151.1 (30)140.2 (36)
221.4 ( 3)170.2 (22)203.9 ( 9)169.8 (23)128.6 (40)167.2 (24)100.6 (45)120.0 (42)198.4 (12)179.1 (16)204.8 ( 7)104.7 (44)
111.1 ( 8)42.7 (48)96.4 (27)81.9 (39)
100.2 (20)105.6 (16)88.1 (34)84.6 (37)
109.1 ( 9)89.4 (33)94.7 (29)93.7 (30)
128.0 ( 3)138.7 ( 1)105.9 (14)89.9 (32)86.5 (36)
108.2 (11)76.4 (42)
135.2 ( 2)124.3 ( 6)101.5 (18)97.6 (24)75.2 (43)
105.6 (15)73.9 (44)98.7 (23)
100.2 (19)63.8 (46)77.6 (41)
108.5 (10)125.3 ( 4)99.4 (22)
107.6 (13)87.6 (35)84.5 (38)
99.9 (21)101.8 (17)108.0 (12)80.0 (40)97.2 (25)96.5 (26)60.4 (47)91.4 (31)95.1 (28)
124.6 ( 5)111.7 ( 7)66.9 (45)
Leukemia
Male Female
3.9 (11)1.9 (48)3.2 (32)3.3 (30)3.8 (13)3.7 (20)3.4 (26)2.7 (42)3.7 (18)3.2 (33)4.6 ( 2)3.9 (10)
4.4 ( 6)3.9 (12)3.8 (14)3.2 (34)3.6 (23)3.6 (22)3.5 (25)4.5 ( 3)3.2 (35)4.5 ( 4)4.0 ( 7)2.7 (43)
2.5 (46)2.3 (47)4.5 ( 5)4.8 ( 1)2.6 (44)3.0 (39)3.4 (28)3.7 (19)3.0 (38)3.6 (24)3.7 (16)3.0 (37)
3.6 (21)2.8 (40)3.7 (17)3.4 (27)3.3 (29)3.3 (31)2.7 (41)3.8 (15)3.9 ( 9)3.1 (36)4.0 ( 8)2.6 (45)
6.4 ( 9)2.7 (47)5.2 (27)4.3 (38)5.9 (14)5.3 (25)5.7 (21)4.4 (37)6.0 (11)4.1 (42)5.8 (18)4.5 (34)
7.2 ( 2)6.5 ( 6)6.5 ( 5)4.8 (32)5.9 (13)5.9 (15)5.6 (23)7.2 ( 3)5.9 (12)5.8 (16)6.5 ( 7)4.2 (39)
4.1 (40)3.6 (45)6.8 ( 4)7.9 ( 1)2.6 (48)3.7 (44)5.6 (22)6.4 ( 8)4.5 (35)5.8 (19)5.1 (28)4.4 (36)
5.5 (24)5.0 (31)5.2 (26)5.1 (29)4.8 (33)5.8 (17)3.7 (43)4.1 (41)6.2 (10)5.1 (30)5.7 (20)3.4 (46)
Breast
Female
22.0 (13)5.2 (46)
21.3 (16)16.5 (29)20.3 (18)21.8 (14)14.4 (38)15.4 (32)23.0 (10)4.9 (47)
11.2 (39)14.6 (36)
21.5 (15)27.2 ( 2)16.6 (27)16.6 (28)19.7 (19)22.2 (12)15.1 (33)23.4 ( 9)26.8 ( 4)23.4 ( 8)20.7 (17)6.6 (45)
8.9 (40)8.7 (41)
16.9 (26)17.5 (24)7.0 (44)8.3 (42)
26.9 ( 3)26.0 ( 5)18.6 (21)15.9 (31)18.5 (22)14.8 (35)
14.9 (34)14.5 (37)22.4 (11)17.3 (25)17.7 (23)24.0 ( 7)4.4 (48)
19.6 (20)16.1 (30)27.7 ( 1)25.9 ( 6)7.4 (43)
Colon & Rectum
Male Female
16.5 (23)2.0 (48)
13.6 (33)9.6 (39)
20.2 (10)22.8 ( 5)15.6 (26)15.3 (28)16.9 (21)8.1 (41)7.4 (42)9.7 (38)
34.6 ( 1)23.0 ( 4)18.2 (13)12.4 (35)17.4 (18)21.3 ( 8)7.2 (43)
30.8 ( 2)21.5 ( 7)15.3 (29)15.3 (30)15.7 (25)
11.9 (36)8.8 (40)
17.9 (14)17.2 (19)5.0 (44)3.3 (47)
17.7 (16)26.4 ( 3)20.1 (11)15.4 (27)16.0 (24)10.1 (37)
17.6 (17)18.9 (12)22.2 ( 6)14.6 (32)14.6 (31)17.8 (15)4.7 (45)
12.6 (34)17.0 (20)20.3 ( 9)16.8 (22)4.7 (46)
11.2 (20)2.2 (48)9.2 (34)7.5 (38)
13.7 ( 8)13.7 ( 9)10.3 (29)10.7 (25)11.2 (21)6.4 (41)7.1 (40)
11.2 (22)
18.1 ( 3)17.2 ( 4)12.5 (15)8.6 (37)
10.1 (30)15.1 ( 6)5.5 (43)
18.5 ( 2)13.8 ( 7)12.2 (17)9.9 (31)9.8 (32)
8.9 (35)6.2 (42)
11.6 (18)11.1 (23)4.6 (44)3.0 (47)
12.8 (14)18.9 ( 1)13.5 (11)10.4 (27)10.4 (28)7.3 (39)
12.3 (16)15.5 ( 5)12.9 (13)9.4 (33)
10.9 (24)10.5 (26)3.1 (46)8.9 (36)
11.5 (19)13.6 (10)13.3 (12)4.3 (45)

C A C a n c e r J C l i n 1 9 9 7 ; 4 7 : 5 - 2 7
Vol. 47 No. 1 january/February 1997 27
Table 14Cancer around the World
Age-Adjusted Death Rates* per 100,000 Populationby Site for Selected Sites for 48 Countries, 1990-1993
Oral Cavity & Pharynx
Male Female
3.6 (35)4.3 (30)4.3 (29)2.5 (43)4.5 (25)6.1 (18)8.8 ( 7)4.1 (34)4.2 (31)2.6 (41)2.8 (39)6.0 (19)
6.3 (17)4.2 (32)8.7 ( 8)2.3 (45)
12.9 ( 3)6.6 (12)1.8 (46)
17.0 ( 1)4.3 (28)1.4 (48)6.0 (21)2.4 (44)
7.4 (10)4.2 (33)6.5 (13)7.9 ( 9)5.2 (23)1.8 (47)2.8 (40)3.4 (36)3.3 (37)6.3 (15)6.0 (20)6.3 (14)
8.8 ( 6)13.2 ( 2)11.5 ( 4)6.9 (11)2.6 (42)6.3 (16)4.6 (24)4.5 (26)9.4 ( 5)3.0 (38)5.9 (22)4.4 (27)
1.3 (12)1.5 ( 7)0.8 (39)0.5 (48)1.4 ( 9)0.9 (30)0.7 (41)0.7 (44)1.3 (13)1.1 (20)1.1 (17)1.9 ( 3)
0.9 (29)1.3 (10)1.0 (24)0.8 (38)1.3 (11)1.1 (18)0.5 (47)2.2 ( 2)1.0 (23)0.6 (46)1.0 (26)0.7 (45)
1.7 ( 4)0.7 (42)0.7 (40)1.0 (27)1.4 ( 8)0.7 (43)1.0 (21)1.3 (14)0.9 (35)1.1 (19)0.9 (31)1.0 (28)
1.0 (22)4.0 ( 1)0.9 (34)0.8 (36)0.9 (32)1.1 (16)1.6 ( 5)1.0 (25)0.9 (33)1.1 (15)0.8 (37)1.5 ( 6)
Prostate
Male
17.5 (13)7.0 (38)
13.6 (24)2.8 (46)
18.6 ( 9)17.2 (14)8.0 (35)8.4 (34)
17.0 (16)—
15.0 (22)19.0 ( 8)
15.1 (21)19.5 ( 6)13.0 (27)18.3 (12)16.8 (17)16.4 (18)8.7 (33)
15.8 (19)18.5 (10)9.2 (32)
11.6 (29)4.0 (43)
5.3 (41)3.7 (44)
12.2 (28)13.2 (25)7.0 (37)
10.6 (30)18.4 (11)19.0 ( 7)22.1 ( 3)9.9 ( 31)15.3 (20)7.6 (36)
6.9 (39)4.4 (42)
14.7 (23)13.2 (26)21.1 ( 4)22.5 ( 2)3.5 (45)
32.9 ( 1)6.8 (40)
17.1 (15)21.0 ( 5)1.8 ( 47)
Stomach
Male Female
2.3 (48)6.3 (28)4.8 (36)
10.5 (14)3.1 (47)7.8 (22)
15.1 ( 5)10.4 (15)3.2 (46)
15.7 ( 4)17.6 ( 1)3.6 (44)
8.0 (20)3.9 (42)
13.5 ( 7)6.1 (31)3.3 (45)7.3 (24)4.6 (38)9.9 (16)5.9 (33)4.5 (39)7.9 (21)14.2 ( 6)
15.9 ( 3)13.0 ( 8)12.3 (10)12.3 (11)6.4 (27)7.1 (25)4.7 (37)3.9 (43)4.9 (34)7.6 (23)
11.5 (13)6.9 (26)
16.9 ( 2)9.3 (19)9.4 (18)6.3 (29)4.2 (40)3.9 (41)
11.7 (12)6.0 (32)
12.6 ( 9)4.8 (35)6.1 (30)9.4 (17)
5.0 (48)14.9 (26)11.7 (33)20.9 (17)6.8 (46)
15.5 (25)36.7 ( 3)19.2 (20)7.1 (45)
34.1 ( 5)42.5 ( 1)6.6 (47)
17.1 (22)7.1 (44)
28.6 (12)11.5 (34)8.2 (43)
13.9 (27)9.3 (38)
23.4 (14)12.2 (30)8.7 (41)
16.9 (23)32.8 ( 6)
35.6 ( 4)29.5 ( 8)28.8 (11)28.8 (10)13.0 (29)9.9 (37)
12.1 (31)9.0 (39)
10.6 (35)21.6 (16)24.2 (13)17.8 (21)
40.3 ( 2) 20.0 (19)22.9 (15)13.7 (28)8.4 (42)8.7 (40)
29.1 ( 9)10.2 (36)31.3 ( 7)11.8 (32)16.1 (24)20.5 (18)
Uterus
Cervix Other
2.6 (34)3.2 (27)6.4 ( 5)4.2 (20)1.6 (47)4.9 (13)3.9 (22)6.2 ( 6)2.4 (38)
— 2.4 (39)7.5 ( 4)
5.2 ( 8)3.4 (25)5.1 (10)2.6 (31)3.8 (23)3.1 (28)2.6 (35)5.0 (11)2.4 (36)2.3 (43)4.6 (18)2.2 (44)
7.6 ( 2)2.8 (29)5.2 ( 9)4.7 (17)8.0 ( 1)2.3 (41)2.3 (42)2.7 (30)2.4 (37)3.9 (21)4.9 (12)4.2 (19)
4.7 (16)2.1 (45)4.8 (14)3.5 (24)2.6 (33)3.2 (26)1.8 (46)7.5 ( 3)4.8 (15)2.4 (40)6.1 ( 7)2.6 (32)
2.6 (35)0.6 (48)4.5 (19)5.4 (13)2.7 (34)2.7 (33)4.4 (22)4.2 (23)2.1 (40)3.2 (31)
10.5 ( 2)5.3 (14)
5.6 (12)4.9 (17)6.8 ( 7)1.5 (44)1.7 (43)3.4 (29)1.4 (45)6.5 ( 8)3.0 (32)1.3 (46)0.9 (47)1.8 (41)
4.6 (18)6.3 ( 9)4.5 (20)6.8 ( 6)4.1 (25)
15.0 ( 1)2.3 (38)4.5 (21)4.1 (24)7.7 ( 5)2.4 (37)
10.2 ( 3)
5.0 (16)6.1 (10)3.5 (27)1.7 (42)2.2 (39)2.5 (36)3.5 (28)9.1 ( 4)5.6 (11)4.1 (26)5.0 (15)3.3 (30)
†1990 only. ‡1991 only. §1992 only. ††1990-1991. ‡‡1991-1992. §§1992-1993. ##1990-1992. +Oral cancer mortality rate includes nasopharynx only. Data source: World Health Organization
Lung & Bronchus
Male Female
57.1 (13)27.4 (40)38.4 (33)45.7 (26)40.4 (32)44.6 (27)60.4 (12)41.2 (30)55.1 (17)38.2 (34)14.3 (47)37.7 (35)
75.3 ( 2)50.4 (19)70.0 ( 5)46.1 (24)47.0 (22)47.9 (21)50.2 (20)81.6 ( 1)45.8 (25)25.7 (41)57.0 (14)30.6 (38)
68.4 ( 6)35.4 (36)65.4 ( 8)63.1 ( 9)17.2 (44)15.9 (45)66.9 ( 7)42.6 (29)30.9 (37)71.3 ( 4)27.9 (39)40.9 (31)
72.8 ( 3)50.5 (18)61.0 (11)46.9 (23)23.7 (42)43.6 (28)15.0 (46)13.6 (48)63.1 (10)55.9 (16)56.1 (15)19.7 (43)
25.6 ( 1)5.0 (39)6.0 (35)6.4 (33)
13.0 (11)9.3 (17)5.0 (41)6.5 (32)
21.8 ( 3)15.9 ( 9)5.0 (40)
13.8 (10)
10.1 (16)24.8 ( 2)7.5 (24)6.9 (29)5.2 (38)8.4 (20)6.9 (28)
16.6 ( 7)17.6 ( 6)7.9 (23)7.3 (25)8.1 (22)
9.0 (18)6.1 (34)6.6 (31)5.9 (37)4.0 (46)5.9 (36)
10.9 (12)18.0 ( 5)10.8 (13)10.2 (15)4.6 (43)6.6 (30)
7.3 (26)16.0 ( 8)8.5 (19)3.6 (48)
10.6 (14)8.3 (21)4.4 (44)4.0 (47)7.2 (27)
21.0 ( 4)4.2 (45)4.8 (42)