Embed Size (px)
Citation preview
Canfor Corporation
December 2020

RBC Capital MarketsForest Products Conference
The presentation and answers to questions today contain forward-looking statements which involve known and unknown risks, uncertainties and other factors that may cause actual results to be materially different from any future results, performance or achievements expressed or implied by such statements. Factors that could have a material impact on any future oriented statements made herein include, but are not limited to: general economic, market and business conditions, product selling prices, raw material and operating costs, foreign exchange rates, interest rates, changes in law and public policy, the outcome of trade disputes, and opportunities available to or pursued by the Company.
For further details on these factors and our assumptions and applicable risks and uncertainties, please refer to Canfor Corporation’s Annual Report for the year ended December 31, 2019 available at www.canfor.com or www.sedar.com.
Alan Nicholl
CFO and Executive VP,Finance and Canfor Pulp
Pat Elliott
SVP, Corporate Finance and Sustainability
2

Lumber Supply & Demand
3

LUMBER MARKETS – US Supply and Demand
2020 – US Softwood Lumber Supply & Demand
4
U.S. Lumber Supply U.S. Lumber Demand
Source: WWPA, Statistics Canada, FEA, Canfor
Supply (Bfbm) 2018 Est. 2019 Est. 2020 Fct.
U.S. PRODUCTION 34.9 35.1 34.3
Imports – Canada 13.6 13.2 12.9
Imports – EU & Other 1.4 1.5 1.9
U.S. Exports (minus) 1.7 1.4 1.2
Total Supply 48.2 48.4 47.9
Segments (Bfbm) 2018 Est. 2019 Est. 2020 Fct.
New Home 15.8 16.2 17.3
Repair & Remodeling 17.5 17.5 19.0
Industrial 12.0 12.1 11.4
Non-Residential 2.5 2.6 2.4
Total Demand 47.8 48.4 50.1
4

Demand Trends
5
Strong fundamentals supporting favourable outlook for lumber demand despite current economic uncertainty
* Average US home size has been trending down in recent years re. affordability; suburbanization supporting a more gradual decline in average home size
** Interest rate anticipated to increase modestly as COVID-19 runs its course
COVID-19 Trends
• Suburbanization• Increased % of SFH Starts• Increasing Home Size*• Increased Disposable Income• Accelerating R&R / DIY Demand
US Housing
• Pent-up Demand• Record-low Existing Inventory• Favourable Demographics• Population Growth• Improved Affordability• Age of housing stock supporting R&R
Government Policy
• Increased Infrastructure Spend • Green Building Initiatives• Fiscal Stimulus • Low Interest Rates**
Other
• Mass Timber Demand• Global Population & Middle-Class Growth• Increased Utilization of Wood in Housing
Source: Canfor

Source: U.S. Census Bureau, Canfor, CIBC, APA
Analysts’ Forecast – November 2020
US Housing Starts
65
Housing Starts (SAAR)
2020 2021
NAHB 1.36 1.33
CIBC 1.35 1.42
Fannie Mae 1.36 1.47
APA 1.35 1.33
MBA 1.36 1.47
FEA 1.36 1.49
Industry Average 1.36 1.42
• Solid housing starts in 2020 is projected to continue in the near term
• Demographics, interest rates and affordability remain supportive
• Increasing shift to suburban areas supporting increased lumber consumption, higher allocation of single-family starts
781
925
1,004
1,1121,174
1,2031,250
1,291
1,372
1,472
0
200
400
600
800
1,000
1,200
1,400
1,600
2012 2013 2014 2015 2016 2017 2018 2019 2020 2021
Single Family Multifamily
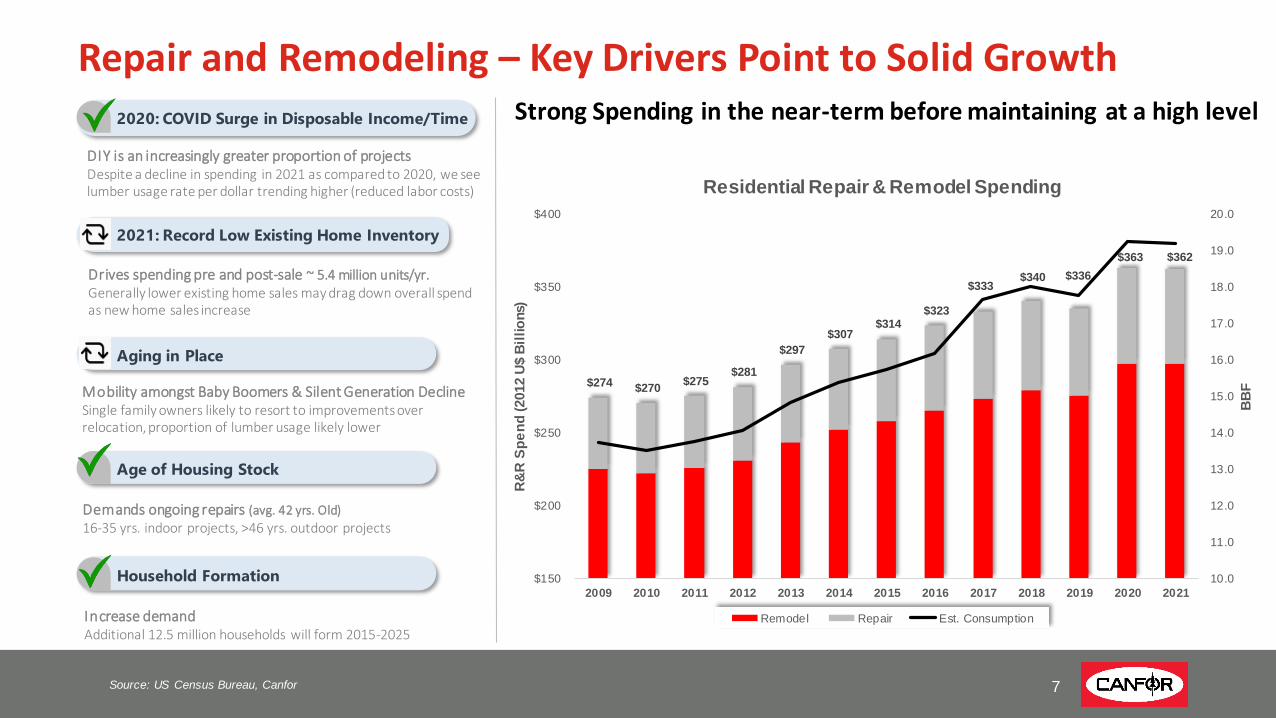
Repair and Remodeling – Key Drivers Point to Solid GrowthStrong Spending in the near-term before maintaining at a high level 2020: COVID Surge in Disposable Income/Time
Mobility amongst Baby Boomers & Silent Generation DeclineSingle family owners likely to resort to improvements over relocation, proportion of lumber usage likely lower
Aging in Place
Demands ongoing repairs (avg. 42 yrs. Old)
16-35 yrs. indoor projects, >46 yrs. outdoor projects
Age of Housing Stock
Drives spending pre and post-sale ~ 5.4 million units/yr.Generally lower existing home sales may drag down overall spend as new home sales increase
2021: Record Low Existing Home Inventory
Increase demand Additional 12.5 million households will form 2015-2025
Household Formation
DIY is an increasingly greater proportion of projectsDespite a decline in spending in 2021 as compared to 2020, we see lumber usage rate per dollar trending higher (reduced labor costs)
7Source: US Census Bureau, Canfor
$274 $270 $275
$281
$297
$307 $314
$323
$333 $340 $336
$363 $362
10.0
11.0
12.0
13.0
14.0
15.0
16.0
17.0
18.0
19.0
20.0
$150
$200
$250
$300
$350
$400
2009 2010 2011 2012 2013 2014 2015 2016 2017 2018 2019 2020 2021
BB
F
R&
R S
pe
nd
(2012 U
$ B
illio
ns)
Residential Repair & Remodel Spending
Remodel Repair Est. Consumption

W-SPF Declines While US South and EU Imports Gain Market Share
8
• As W-SPF production declines, diversified species and global operations allow us to support our US customers
• Softwood imports from EU will remain heavily dependent on housing starts
• German, Austrian, and Swedish manufacturers hold largest share of EU imports in North America
• EU volumes in 2020 projected to total 1.3 BBF with volumes increasing marginally in 2021
0
1
1
2
2
3
Imp
ort
ed V
olu
me (M
MB
F)
US Import Volume from EU (BBF)
Source: USDA-FAS
9
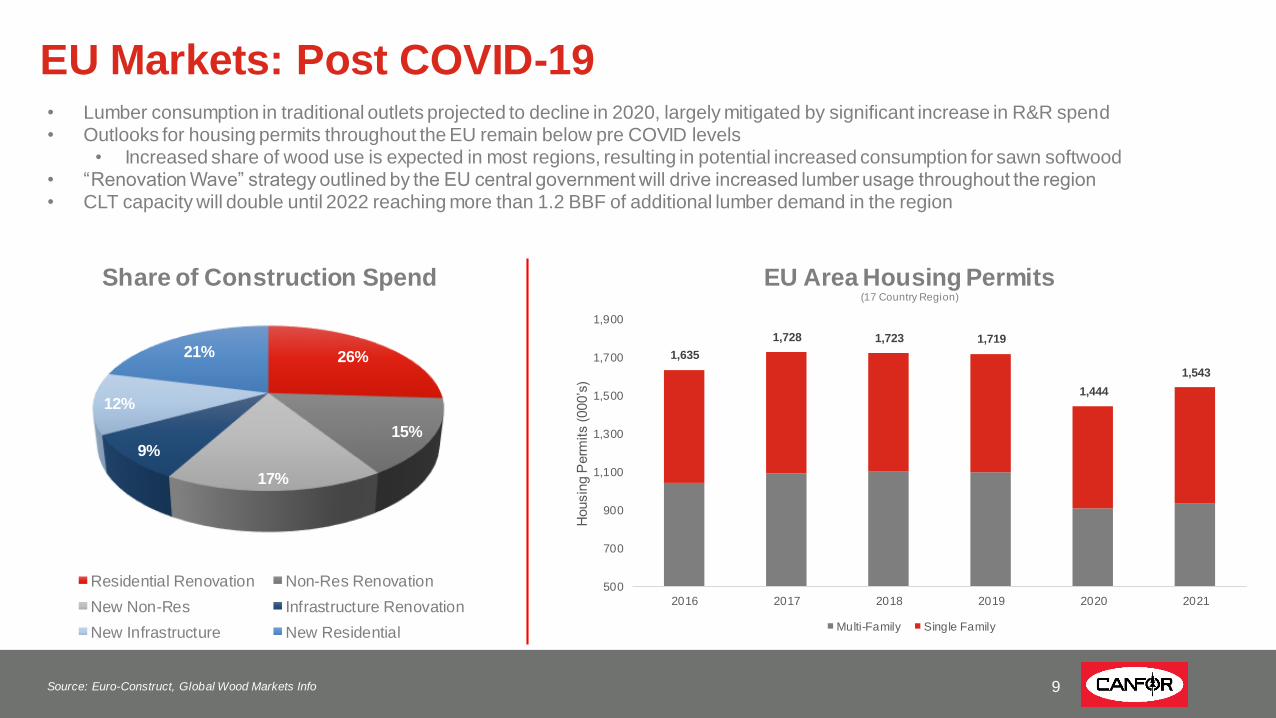
EU Markets: Post COVID-19• Lumber consumption in traditional outlets projected to decline in 2020, largely mitigated by significant increase in R&R spend• Outlooks for housing permits throughout the EU remain below pre COVID levels
• Increased share of wood use is expected in most regions, resulting in potential increased consumption for sawn softwood • “Renovation Wave” strategy outlined by the EU central government will drive increased lumber usage throughout the region• CLT capacity will double until 2022 reaching more than 1.2 BBF of additional lumber demand in the region
Source: Euro-Construct, Global Wood Markets Info
1,635
1,728 1,723 1,719
1,444
1,543
500
700
900
1,100
1,300
1,500
1,700
1,900
2016 2017 2018 2019 2020 2021
Housin
g P
erm
its (000’s
)
EU Area Housing Permits (17 Country Region)
Multi-Family Single Family
26%
15%
17%
9%
12%
21%
Share of Construction Spend
Residential Renovation Non-Res Renovation
New Non-Res Infrastructure Renovation
New Infrastructure New Residential

EU Beetle Kill: Production & Trade Outlook
10Source: FEA, Eurostat, Canfor
• Projecting modest increase in EU softwood lumber production as investments currently underway come online in response to spruce bark beetle
• Projecting continued increase in EU log exports as producers harvest beetle damaged timber; log exports reaching ~10 million m3 in 2021
• Beetle damaged fibre will continue to have mixed impacts depending on the country
• Anticipate a significant reduction of Russian logs exported to China due to increased duty rates and recent changes in legislation by the Russian government
66 67 68 6870 71
0
10
20
30
40
50
60
70
80
2017 2018 2019 2020 2021 2022
BB
F P
roduction
EU Production Outlook
Germany Sweden Finland Austria Other Europe Total Supply

China: Markets & Supply
11Source: FEA
Markets:
• Real estate development investment growth fell sharply in early 2020 in the wake of COVID-19
• Investment steadily improving from lows in early 2020, however growth ~5% lower than 2019 average
• Office and commercial buildings saw the sharpest decline, with residential investment down only .1%
• Retail sales of consumer goods are down 7.2% YoY with furniture sales continuing to decline
Supply:
• Changes in Russian legislation has led to a marked increase in kiln-dried lumber from the region while overall shipments remain level
• New supply regions such as Belarus have begun entering the market leveraging the Belt and Road initiative
• We anticipate increased imports from Europe into 2021

Jan Feb Mar Apr May Jun Jul Aug Sep Oct Nov Dec Jan Feb Mar Apr May Jun Jul Aug Sep Oct Nov Dec Jan Feb Mar Apr May Jun Jul Aug Sep Oct Nov Dec Jan Feb Mar Apr May June Jul Aug Sep Oct Nov2017 2018 2019 2020
WSPF 2x4 2&Btr 310 375 359 407 388 368 403 395 419 446 484 457 493 523 524 552 634 609 564 468 414 323 337 320 335 406 371 328 312 360 356 340 373 361 385 385 396 433 367 317 361 378 507 733 948 777 562
225
325
425
525
625
725
825
925
US
$/M
fbm
Commodity Lumber Prices (US$/Mfbm)
12
2017 BC Forest Fires1.2 M ha. (July - Sept)
2018 Severe WinterRailcar shortage
Curtailment
AnnouncementsCurtailment
Announcements
Curtailment
Announcements
7.28% ADD
(July – Dec 2017)
20.26% CVD
(April – Aug 2017) 20.52% CVD / ADD
(Jan 2018 – Nov 2020)
Duty
Rate
Current pricing (Nov 26, 2020)
• WSPF 2x4: $616
Source: Random Length Publications, Inc., Canfor

Operations
13

14
Canfor
Operations
Lumber
• 34 Sawmills with annual operating capacity of 6,700 MMfbm
• 10 Western Canada - 3,200 MMfbm
• 12 US South - 2,000 MMfbm
• 12 Sweden - 1,500 MMfbm*
Pulp and Paper
• 4 Mills in British Columbia
• 1.1 million tonnes of Northern Softwood Kraft
• 230k tonnes BCTMP
• 140k tonnes Kraft Paper
Other Operations
• 9 value-added facilities (packing, housing, energy) – Sweden
• 3 Pellet Plants – BC
• 2 Glulam Plants – US South
• Finger Joint Plant – US South
• Green Energy Plant – BC
• Trucking Fleet – US South
*Lumber capacity includes planned investment in Bergs Timber
43%
31%
22%
4%
Regional Lumber Capacity
BC US South Europe Alberta

• Significant action taken over the past 2 years in response to challenging market conditions and elevated log costs in British Columbia
• Approx. 2.2 billion board feet of permanent industry rationalization to-date (~1.0 billion board feet of additional rationalization required to balance demand with long-term fibre supply)
• Industry wide production curtailments in response to COVID-19 reduced production by approx. 600 million board feet in early 2020
• Western SPF pricing surged in 2020 as limited available supply was met with unprecedented demand
• Company has taken a number of short and long-term measures to mitigate fibre cost escalation and support improved market pricing
• Anticipating moderate market-related increase in log costs in 2021 reflecting record-high lumber pricing in 2020
• Canfor’s sales realizations anticipated to benefit from a ~16% reduction of duty rates effective December 2020
Western Canada
15
$200
$300
$400
$500
$600
$700
$800
$900
$1,000
$20
$30
$40
$50
$60
$70
$80
$90
$100
Lum
be
r P
rice
($
Cd
n/M
fbm
)
Bid
Pri
ce (
$/m
3)
Lumber Price vs. BCTS Bidding
BCTS Avg Bid ($/m3) 2x4 RL 2&Btr ($/Mfbm)
2019 MPSUpdate
2018 MPSUpdate
2020 MPSUpdate
Company Current Rate New Rate Change % Change
Canfor 20.5% 4.6% -15.9% -77.5%
West Fraser 23.6% 9.0% -14.6% -61.9%
J.D. Irving 9.4% 4.2% -5.2% -54.9%
Resolute 17.9% 20.3% 2.4% 13.1%
All Others 20.2% 9.0% -11.2% -55.6%
CVD / ADD Cash Deposit Rates
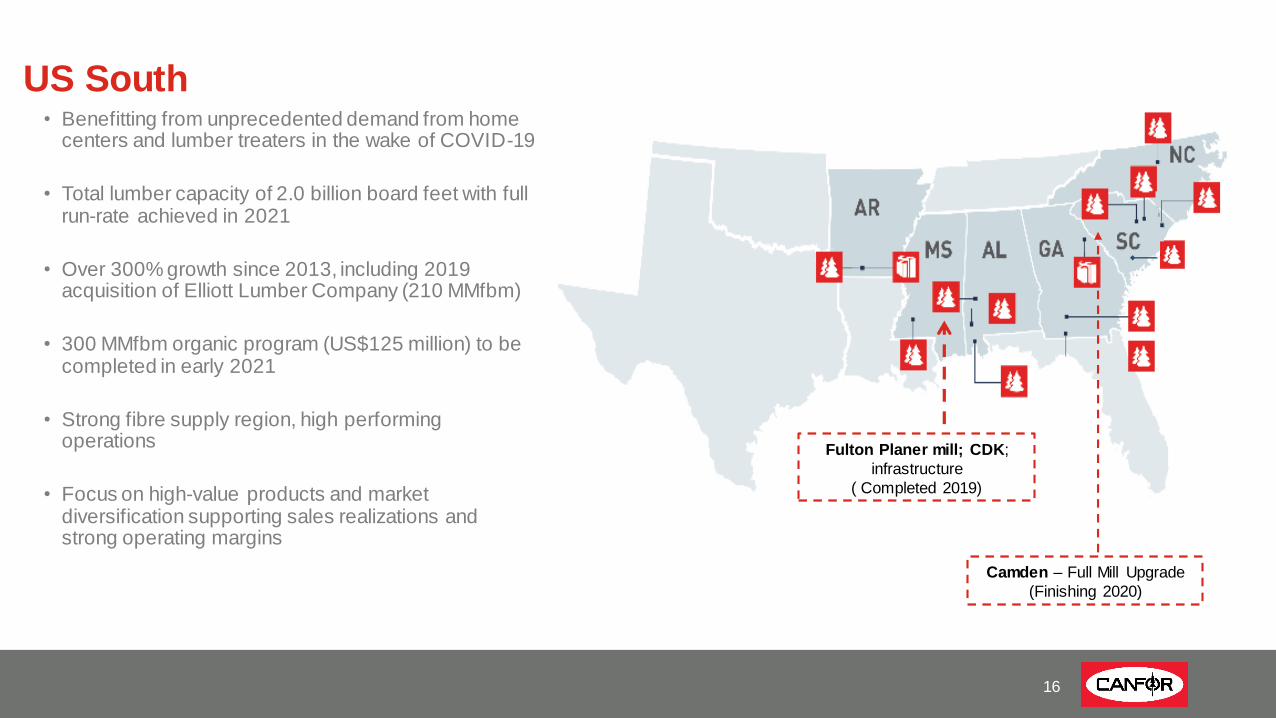
• Benefitting from unprecedented demand from home centers and lumber treaters in the wake of COVID-19
• Total lumber capacity of 2.0 billion board feet with full run-rate achieved in 2021
• Over 300% growth since 2013, including 2019 acquisition of Elliott Lumber Company (210 MMfbm)
• 300 MMfbm organic program (US$125 million) to be completed in early 2021
• Strong fibre supply region, high performing operations
• Focus on high-value products and market diversification supporting sales realizations and strong operating margins
US South
16
Fulton Planer mill; CDK;
infrastructure
( Completed 2019)
Camden – Full Mill Upgrade
(Finishing 2020)

17
Customer Channels – Aligned for the Future
DISTRIBUTION
HOME CENTER
INDUSTRIAL
OFFSHORE
PRO DEALER
WHOLESALE
SPF CUSTOMER CHANNELS
DISTRIBUTION
HOME CENTER
INDUSTRIAL
OFFSHORE
PRO DEALER
TREATER
WHOLESALE
SYP CUSTOMER CHANNELS
• SPF customer channels heavily aligned with key pro-dealer accounts able to respond to housing demand
• Strong alignment with Home Centers continues as we support programs with Euro supply
• Key industrial accounts allow for diversification (e.g. Universal Forest Products)
• Continued exposure to offshore markets allowing for global diversification
• Continued growth with Home Center accounts has allowed SYP to capture a key DIY demand segment
• High value products aligned with key treater accounts continue to provide return and increased exposure to R&R sector
• Focus on the pro-dealer segment provides diversified demand channel aligned well with housing starts
• Strategic accounts in offshore markets aid in diversification and exposure to more high value accounts
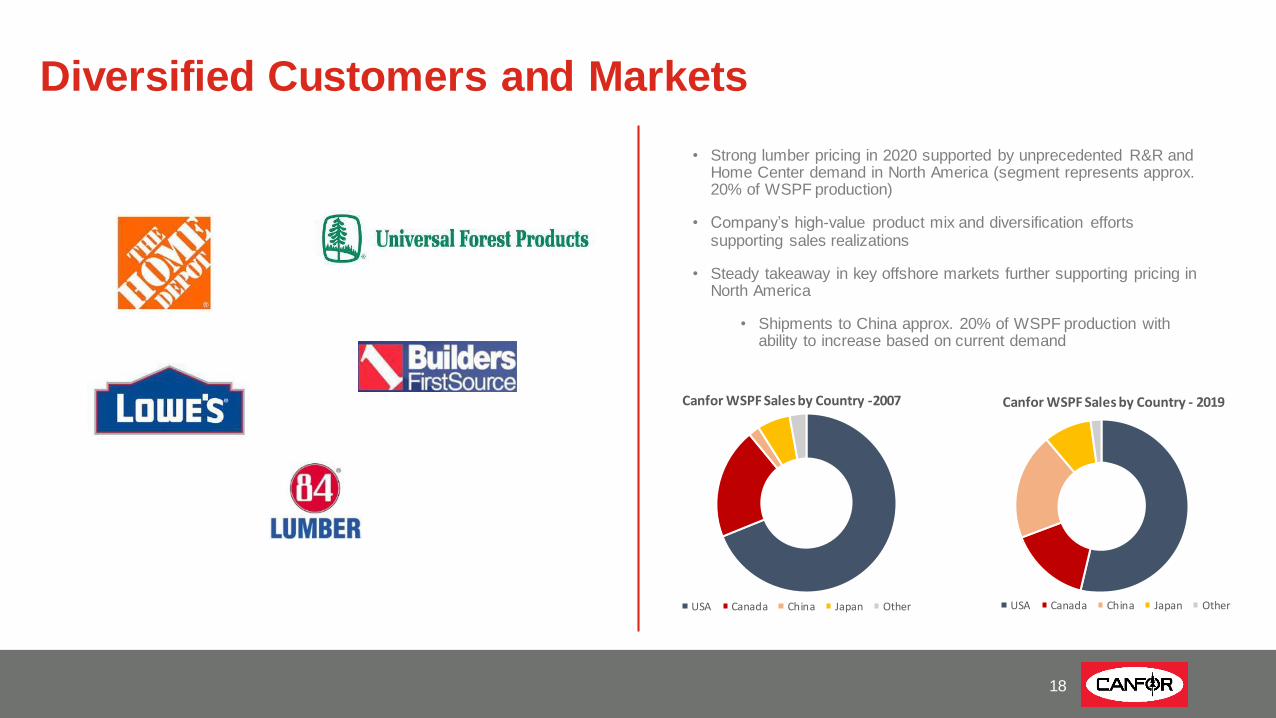
Diversified Customers and Markets
18
• Strong lumber pricing in 2020 supported by unprecedented R&R and Home Center demand in North America (segment represents approx. 20% of WSPF production)
• Company’s high-value product mix and diversification efforts supporting sales realizations
• Steady takeaway in key offshore markets further supporting pricing in North America
• Shipments to China approx. 20% of WSPF production with ability to increase based on current demand
Canfor WSPF Sales by Country -2007
USA Canada China Japan Other
Canfor WSPF Sales by Country - 2019
USA Canada China Japan Other

Application
J grade & Square Edge Dimension
Boards, Pattern, Fascia, Clear
SYP Long Length 22’/24’/26’
SPF & Spruce Metric Sizes
MSR Dimension
Lamina Blanks
SYP Glulam Beams
Canfor High Value Product Diversification
Visual appearance is primary purchase variable
Matching sizes to end-user requirements
Leverage fibre strength to match demand
Appearance
Strength
Products that unlock incremental value with stabilized pricing
19

20
Europe
VIDA Sales by Country - 2019
UK Other Europe Sweden USA Asia/Australia Other
• Total of 12 sawmills following Vida’s recent acquisition of Bergs Timber; proforma lumber capacity of 1.5 billion board feet
• Vida’s 9 sawmills operating at annualized rate of 1.2 billion board feet
• Production primarily focused on structural timber, mostly exported to markets other than North America
• Vida’s largest market is the UK, comprising approx. 30-35% of volume
• Other key markets include Asia, Australia, North Africa and the Middle East
• Vida’s acquisition of Bergs Timber completed in Q3 2020
• Purchase price of ~C$44 million, plus working capital
• Current production of 215 million board feet; targeting 300 million board feet capacity with modest capital investment
• Strong strategic alignment with Vida’s existing sawmills
• Geographic and product diversification contributing to more steady pricing despite current global economic challenges
• Access to significant supply of high-quality spruce and pine fibre in close proximity to sawmills
• Fibre costs tightly correlated to market pricing supporting more stable earnings
• Canfor and VIDA are well positioned to capitalize on joint global market opportunities with significantly enhanced market and
geographic diversification; currently on track to achieve targeted synergies
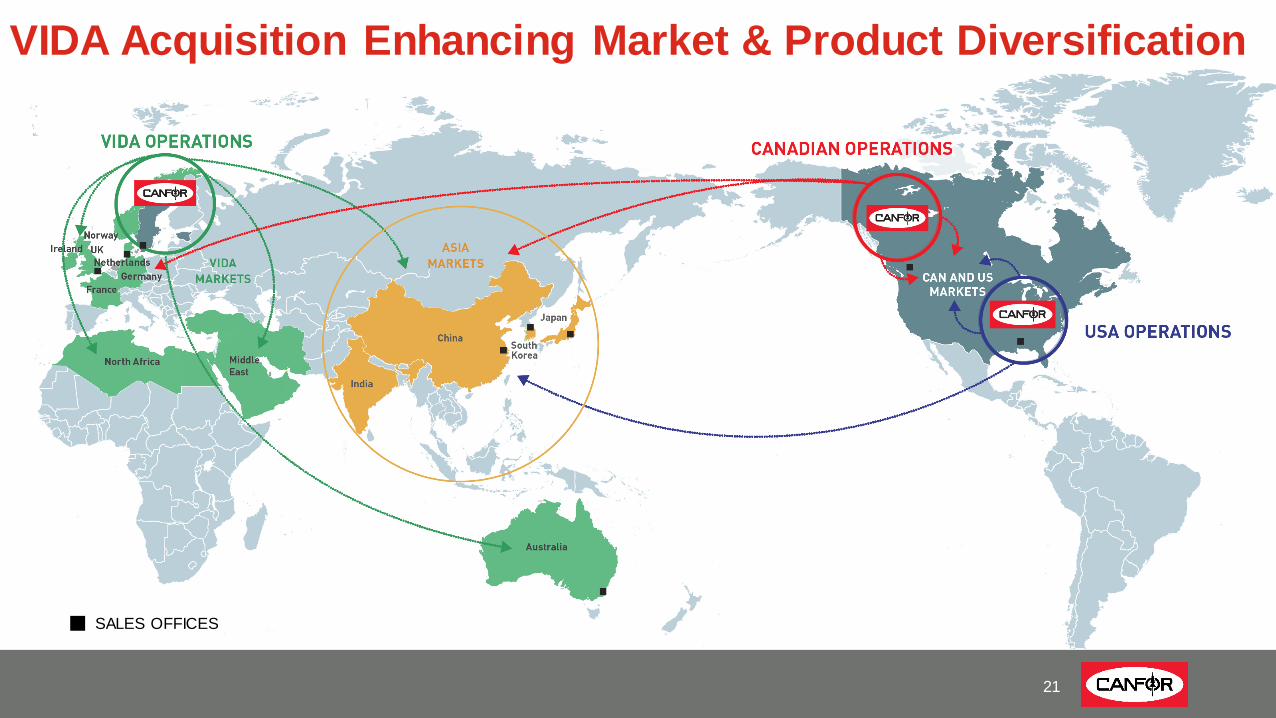
SALES OFFICES
21
VIDA Acquisition Enhancing Market & Product Diversification

22
Liquidity Update - Canfor
Canfor (excluding Canfor Pulp) had available liquidity of approximately $1.0 billion at end of Q3 2020
Available liquidity improved by approximately $345 million during the third quarter, supported by record high lumber prices a nd various initiatives underway to
maintain balance sheet strength:
▪ Liquidity benefited from significant cash earnings associated with record-high lumber prices combined with favourable working capital movements
▪ Canfor (excl. Canfor Pulp and Vida) fully repaid its operating loan facility in the third quarter; no scheduled debt maturities until late 2023
▪ Vida retains strong liquidity position following acquisition of Bergs Timber; cash of approximately $35 million at end of Q3; operating lines renewed annually
▪ As of September 30, Canfor had paid cumulative cash duty deposits of approximately $550 million
▪ The Company remains in full compliance with all covenants relating to operating loan facilities and long-term debt and expects to remain so for the foreseeable future
*US dollar denominated term debt translated at an assumed CAD to USD foreign exchange rate of $1.30
$-
$200
$400
$600
$800
$1,000
2017 2018 2019 Q1 2020 Q2 2020 Q3 2020
($ m
illi
on
s)
Available Liquidity(Canfor Excl. Canfor Pulp)
Operating Loan Facility Cash
$-
$100
$200
$300
$400
$500
$600
2021 2022 2023 2024 Beyond
($ m
illi
on
s)
Scheduled Maturities*(Canfor Excl. Vida and Canfor Pulp)
Term Debt Operating Loan Facility Revolver (Undrawn)

Canfor Pulp
23

Pulp Market Outlook
Supply
• Softwood capacity in 2021 projected to be flat with increased
supply at Nordic Kraft and Domtar Ashdown mitigated by Paper
Excellence closures of Pictou and Mackenzie
• COVID-19 providing some challenges with respect to major
maintenance and project schedules
• PPPC projects Softwood Market Pulp Capacity in 2024 to be
250,000 (0.9%) tonnes higher than 2019
• PPPC forecasts global pulp demand/capacity balance for softwood
market pulp at 91% in 2020, rebounding to 92% in 2021 and
gradually increasing to 94% to 2024
• Capacity increase through 2024 will be mainly concentrated on
Hardwood market pulp in South America leading to hardwood pulp
demand/capacity balance in the 89% to 93% range
Demand
• Global tissue demand up 3.2% YTD August 2020 reflecting increased
“At Home” demand, offset in part by lower “Away From Home” usage
• Global tissue demand estimated to growth at ~3% 2020 - 2024
• Global Printing & Writing Paper decline accelerating due to COVID
(down 15% for YTD August 2020) with Western Europe seeing
significant weakness (down 20% for YTD August 2020)
• PPPC projects a 1.6% increase in global demand for Market Pulp in
2020 and 2.6% decrease in Softwood demand
• PPPC estimates Chemical Market Pulp Demand to rebound by 1.2%
in 2021 and increase by an average of 1.5% annually between 2022-
2024
24

2008-2020 Global Market Pulp Demand
0
5,000
10,000
15,000
20,000
25,000
30,000
35,000
40,000
2008 2009 2010 2011 2012 2013 2014 2015 2016 2017 2018 2019 2020
Millio
n To
nn
es
Europe Asia N.America Other
Source: PPPC
China is the largest consumer of pulp
25

26
Liquidity Update – Canfor Pulp
Canfor Pulp had available liquidity of approximately $130 million at end of Q3 2020
Canfor Pulp remains focused on maintaining its balance sheet strength in light of current environment:
▪ Suspension of all non-essential overhead, disciplined cash management and government programs supporting liquidity
▪ Suspension of quarterly dividend for the foreseeable future recognizing significant market-challenges, Northwood RB5 capital project
▪ $50 million term debt matures in late 2022, with available operating line providing adequate liquidity for the foreseeable fu ture
▪ The Company remains in full compliance with all covenants relating to operating loan facilities and long-term debt and expects to remain so for the foreseeable future
$-
$20
$40
$60
$80
$100
$120
2021 2022 2023 2024 Beyond
($ m
illi
on
s)
Scheduled MaturitiesCanfor Pulp
Term Loan Operating Loan Facility
$-
$40
$80
$120
$160
$200
2017 2018 2019 Q1 2020 Q2 2020 Q3 2020
($ m
illi
on
s)
Available LiquidityCanfor Pulp
Operating Loan Facility Total Cash
Canfor / Canfor Pulp – Value Proposition
Sustainable, High-Quality
Fibre Supply
High Quality Products
& CustomersTop Performing
Pulp, Lumber Business
Well Capitalized
Mills
Strong Balance
Sheet
27

Investor ContactsPat ElliottSVP, Corporate Finance and Sustainability
[email protected] 604-661-5441
Alan NichollCFO and Executive Vice President, Finance and Canfor Pulp
[email protected] 604-661-5370
28