Embed Size (px)
Citation preview

Q2 2008For the three months ended June 30, 2008
CANFORCORPORATION2008 SECONDQUARTERINTERIM REPORT

1
2 Message to Shareholders 3 Management’s Discussion and Analysis 19 Consolidated Statements of Income and Retained Earnings
20 Consolidated Cash Flow Statements 21 Consolidated Balance Sheets
22 Consolidated Statements of Changes in Shareholders’ Equity and Comprehensive Loss 23 Notes to the Consolidated Financial Statements

2
To Our Shareholders
Canfor Corporation today reported net income of $64.2 million ($0.45 per share) for the second quarter of 2008, compared to a net loss of $85.4 million ($0.60 per share) for the first quarter of 2008 and a net loss of $38.8 million ($0.27 per share) for the second quarter of 2007. For the six months ended June 30, 2008, the Company’s net loss was $21.2 million ($0.15 per share), compared to a net loss of $81.5 million ($0.57 per share) reported for the first six months of 2007.
The net income for the second quarter of 2008 included the following significant items, which together had a net positive impact on net income of $85.0 million ($0.60 per share):
• Reduction of log inventories previously written down from cost to net realizable value in accordance with a new inventory accounting standard implemented in 2008, which positively impacted net income by $35.3 million ($0.25 per share). The majority of the log write-downs took place in the first quarter of 2008, when the Company built normal seasonal inventory ahead of spring break-up.
• Reversal of log inventory write-downs recognized in previous periods, which increased net income by $12.5 million ($0.09 per share). The reversal resulted from lower costs and higher finished product prices in the second quarter.
• Gain of $36.3 million ($0.25 per share) resulting from a fire that destroyed the Company’s North Central Plywoods (NCP) mill in Prince George in May. The gain mostly reflects estimated net insurance proceeds in excess of book value.
• Gains of $14.5 million ($0.10 per share) recorded on derivative financial instruments, designed primarily to protect the Company from rising natural gas and diesel prices, and foreign exchange rates.
• Restructuring, severance and mill closure costs of $13.6 million ($0.09 per share) resulting principally from the indefinite closures in June of the Company’s Mackenzie sawmill and PolarBoard oriented strand board (OSB) mill.
After taking account of these items, which affected comparability with prior periods, the Company had an adjusted net loss for the second quarter of 2008 of $20.8 million ($0.15 per share), compared to similarly adjusted net losses of $60.5 million ($0.42 per share) for the first quarter of 2008 and $42.8 million ($0.30 per share) for the second quarter of 2007.
Canfor continued to be significantly impacted by the continued downturn in the U.S. housing market, the strong Canadian dollar and a 15% export tax on lumber shipments to the U.S., in the second quarter. Housing starts in the U.S. fell 4% compared to the previous quarter, and were down 30% compared to the second quarter of 2007. Not surprisingly, lumber and panel sales activity was sluggish through most of the quarter, but lower supply resulted in a modest increase in prices. Pulp markets remained relatively balanced, with the result that prices were stable through the quarter. The Canadian dollar hovered around par with the U.S. dollar through the period.
With respect to the second quarter, the Company continued to make progress in its efforts to reduce costs, and conserve cash. In addition to the modest market price increases, and lower log and lumber inventory write-downs, the second quarter’s results reflected a number of operational improvements achieved in the face of the additional curtailments. These positives more than offset the effects of rising energy prices on input and distribution costs and scheduled maintenance outages at two of Canfor Pulp Limited Partnership’s pulp mills in the quarter.
In response to depressed market demand, the Company further curtailed its production in the second quarter, and in June indefinitely closed down its Mackenzie sawmill and PolarBoard OSB mill.
Conditions are expected to remain difficult through the balance of 2008, and a meaningful recovery of the U.S. housing market is not anticipated before the middle of 2009 at the earliest, particularly given increasing recession and inflationary concerns. The Company’s priorities will continue to be cash management and sustainable performance improvement. Peter J.G. Bentley James F. Shepard Chairman President and Chief Executive Officer
3
Canfor Corporation Second Quarter 2008 Management’s Discussion and Analysis This interim Management’s Discussion and Analysis (MD&A) provides a review of Canfor’s financial performance for the quarter ended June 30, 2008 relative to the quarters ended March 31, 2008 and June 30, 2007, and the Company’s financial condition. It should be read in conjunction with the unaudited interim consolidated financial statements and accompanying notes for the quarters ended June 30, 2008 and 2007, as well as the 2007 annual MD&A and audited consolidated financial statements and notes thereto, which are included in Canfor’s Annual Report for the year ended December 31, 2007 (available at www.canfor.com).
Throughout this discussion, reference is made to EBITDA (calculated as operating income before amortization), which Canfor considers to be an important indicator for identifying trends in the performance of each of its operating segments and the Company’s ability to generate funds to meet its debt repayment and capital expenditure requirements. EBITDA is not a generally accepted earnings measure and should not be considered as an alternative to net income or cash flows as determined in accordance with Canadian generally accepted accounting principles (GAAP). As there is no standardized method of calculating EBITDA, Canfor’s EBITDA may not be directly comparable with similarly titled measures used by other companies. A reconciliation of EBITDA to net income reported in accordance with GAAP is included in this MD&A.
Factors that could impact future operations are also discussed. These factors may be influenced by known and unknown risks and uncertainties that could cause the actual results to be materially different from those stated in this discussion. Factors that could have a material impact on any future oriented statements made herein include, but are not limited to: general economic, market and business conditions; product selling prices; raw material and operating costs; foreign exchange rates; changes in law and public policy; the outcome of trade disputes; and opportunities available to or pursued by Canfor.
Certain prior period comparative information throughout this report has been restated for consistency with the presentation in the current period. All financial references are in millions of Canadian dollars unless otherwise noted. The information in this report is as at July 28, 2008.
SECOND QUARTER 2008 EARNINGS OVERVIEW
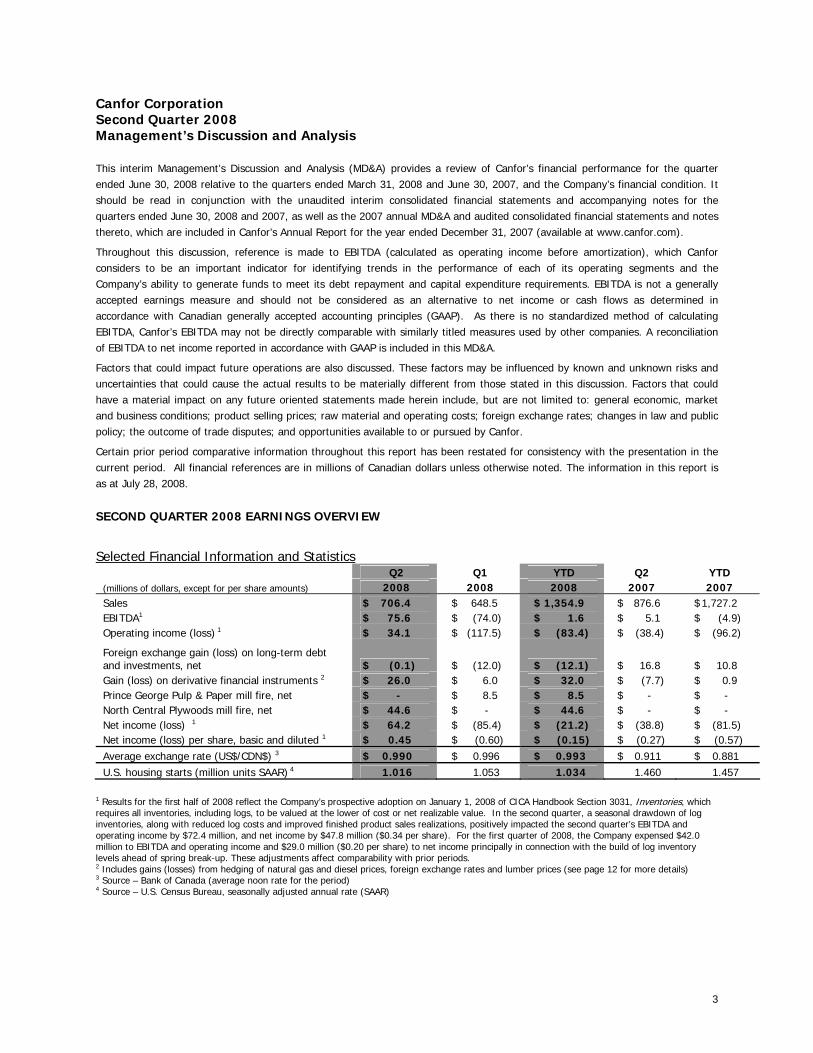
Selected Financial Information and Statistics Q2 Q1 YTD Q2 YTD (millions of dollars, except for per share amounts) 2008 2008 2008 2007 2007 Sales $ 706.4 $ 648.5 $ 1,354.9 $ 876.6 $ 1,727.2 EBITDA1 $ 75.6 $ (74.0) $ 1.6 $ 5.1 $ (4.9) Operating income (loss)
1 $ 34.1 $ (117.5) $ (83.4) $ (38.4) $ (96.2)
Foreign exchange gain (loss) on long-term debt and investments, net $ (0.1) $ (12.0) $ (12.1) $ 16.8 $ 10.8 Gain (loss) on derivative financial instruments 2 $ 26.0 $ 6.0 $ 32.0 $ (7.7) $ 0.9 Prince George Pulp & Paper mill fire, net $ - $ 8.5 $ 8.5 $ - $ - North Central Plywoods mill fire, net $ 44.6 $ - $ 44.6 $ - $ - Net income (loss) 1 $ 64.2 $ (85.4) $ (21.2) $ (38.8) $ (81.5) Net income (loss) per share, basic and diluted 1 $ 0.45 $ (0.60) $ (0.15) $ (0.27) $ (0.57) Average exchange rate (US$/CDN$) 3 $ 0.990 $ 0.996 $ 0.993 $ 0.911 $ 0.881 U.S. housing starts (million units SAAR)
4 1.016 1.053 1.034 1.460 1.457
1 Results for the first half of 2008 reflect the Company’s prospective adoption on January 1, 2008 of CICA Handbook Section 3031, Inventories, which requires all inventories, including logs, to be valued at the lower of cost or net realizable value. In the second quarter, a seasonal drawdown of log inventories, along with reduced log costs and improved finished product sales realizations, positively impacted the second quarter’s EBITDA and operating income by $72.4 million, and net income by $47.8 million ($0.34 per share). For the first quarter of 2008, the Company expensed $42.0 million to EBITDA and operating income and $29.0 million ($0.20 per share) to net income principally in connection with the build of log inventory levels ahead of spring break-up. These adjustments affect comparability with prior periods. 2 Includes gains (losses) from hedging of natural gas and diesel prices, foreign exchange rates and lumber prices (see page 12 for more details) 3 Source – Bank of Canada (average noon rate for the period) 4 Source – U.S. Census Bureau, seasonally adjusted annual rate (SAAR)

4
Overview
Net Income
The Company recorded net income of $64.2 million ($0.45 per share) for the second quarter of 2008, an increase of $149.6 million ($1.05 per share) compared to a net loss of $85.4 million ($0.60 per share) the first quarter of 2008, and $103.0 million ($0.72 per share) higher than the net loss reported for the second quarter of 2007. After adjusting for significant items affecting comparability with prior periods, the Company’s adjusted net loss was $20.8 million ($0.15 per share) for the second quarter of 2008, compared to $60.5 million ($0.42 per share) for the first quarter of 2008, and $42.8 million ($0.30 per share) for the second quarter of 2007.
The results for the first and second quarters of 2008 reflect the Company’s prospective adoption of CICA Handbook Section 3031, Inventories, on January 1, 2008, which requires inventories, including logs, to be valued at the lower of cost or net realizable value (previously, the Company valued logs at the higher of net realizable value and replacement cost, if lower than average cost). After a seasonal build of log inventories in the first quarter, the Company reduced inventories significantly during the spring break-up period in the second quarter. At quarter end, log inventory write-downs recorded by the Company reflected these lower log inventory levels, and the reversal of previously recognized write-downs to net realizable value as a result of lower costs and improved finished product sales realizations.
As a result, the adoption of the new accounting standard positively impacted the second quarter’s operating income and net income by $72.4 million and $47.8 million ($0.34 per share), respectively, in contrast to the first quarter, when the Company recorded an expense of $42.0 million to operating income, and $29.0 million ($0.20 per share) in net income, principally as a result of its log inventory build ahead of spring break-up.
Analysis of Specific Items Affecting Comparability of Net Income
After-tax impact, net of non-controlling interests Q2 Q1 YTD Q2 YTD (millions of dollars, except per share amounts) 2008 2008 2008 2007 2007 Net income (loss), as reported $ 64.2 $ (85.4) $ (21.2) $ (38.8) $ (81.5) (Gain) loss on derivative financial instruments $ (14.5) $ (2.7) $ (17.2) $ 3.7 $ (1.2) New inventory accounting standard $ (47.8) $ 29.0 $ (18.8) $ - $ - Foreign exchange (gain) loss on long-term debt and investments, net $ - $ 8.7 $ 8.7 $ (10.2) $ (4.9) Prince George Pulp & Paper mill fire, net $ - $ (3.6) $ (3.6) $ - $ - North Central Plywoods mill fire, net $ (36.3) $ - $ (36.3) $ - $ - Restructuring, mill closure and severance costs $ 13.6 $ 2.6 $ 16.2 $ 5.8 $ 5.8 Corporate income tax rate reductions $ - $ (9.1) $ (9.1) $ (1.0) (1.0) Other items $ - $ - $ - $ (2.3) $ (0.7) Net impact of above items $ (85.0) $ 24.9 $ (60.1) $ (4.0) $ (2.0) Net income (loss), as adjusted $ (20.8) $ (60.5) $ (81.3) $ (42.8) $ (83.5) Net income (loss) per share, as reported $ 0.45 $ (0.60) $ (0.15) $ (0.27) $ (0.57) Net impact of above items per share $ (0.60) $ 0.18 $ (0.42) $ (0.03) $ (0.02) Net income (loss) per share, as adjusted $ (0.15) $ (0.42) $ (0.57) $ (0.30) $ (0.59)

5
EBITDA
The following table reconciles the Company’s net income (loss), as reported in accordance with GAAP, to EBITDA:
Q2 Q1 YTD Q2 YTD (millions of dollars) 2008 2008 2008 2007 2007 Net income (loss), as reported $ 64.2 $ (85.4) $ (21.2) $ (38.8) $ (81.5) Add (subtract):
Non-controlling interests $ 9.2 $ 22.0 $ 31.2 $ 18.1 $ 42.4 Income tax expense (recovery) $ 24.0 $ (55.7) $ (31.7) $ (25.6) $ (51.6) Other (income) expense $ 1.4 $ (1.3) $ 0.1 $ 13.8 $ (1.5) (Gain) loss on derivative financial instruments $ (26.0) $ (6.0) $ (32.0) $ 7.7 $ (0.9) Asset impairments $ - $ - $ - $ - $ 5.0
Foreign exchange (gain) loss on long-term debt and investments, net $ 0.1 $ 12.0 $ 12.1 $ (16.8) $ (10.8) Prince George Pulp & Paper mill fire, net $ - $ (8.5) $ (8.5) $ - $ - North Central Plywoods mill fire, net $ (44.6) $ - $ (44.6) $ - $ - Interest expense, net $ 5.7 $ 5.3 $ 11.0 $ 3.3 $ 2.7 Equity (income) loss of affiliated companies $ 0.1 $ 0.1 $ 0.2 $ (0.1) $ - Amortization $ 41.5 $ 43.5 $ 85.0 $ 43.5 $ 91.3
EBITDA, as reported $ 75.6 $ (74.0) $ 1.6 $ 5.1 $ (4.9) Restructuring, mill closure and severance costs $ 20.7 $ 3.8 $ 24.5 $ 8.7 $ 8.7
EBITDA, as adjusted $ 96.3 $ (70.2) $ 26.1 $ 13.8 $ 3.8
The depressed U.S. housing market continued to weigh on the financial performance of the Company’s lumber and panel businesses in the second quarter of 2008. Seasonally adjusted annualized U.S. housing starts for the quarter were 1,016,000 units, which was 444,000, or 30%, lower than for the same quarter in 2007. June seasonally adjusted annualized housing starts were 1,066,000 units.
In response to the challenging conditions, the Company curtailed lumber production at several of its mills in the quarter, and indefinitely closed its Mackenzie lumber operation (“Mackenzie”) in June. The Company also indefinitely closed its PolarBoard OSB operation (“PolarBoard”) in June.
Sales activity for solid wood products was sluggish for most of the quarter, but prices edged steadily upwards from the record lows of the first quarter as a result of lower available supply. Pulp markets remained relatively balanced, with contractions in supply due in part to scheduled maintenance outages taken by many pulp producers, including Canfor Pulp Limited Partnership (CPLP), helping to offset softer demand.
EBITDA for the second quarter of 2008 was $75.6 million, up $149.6 million compared to the first quarter of 2008, and up $70.5 million compared to the second quarter of 2007. Adjusted EBITDA for the second quarter of 2008 was up $166.5 million compared to the previous quarter, and up $82.5 million compared to the second quarter of 2007. The improved adjusted EBITDA compared to the previous quarter was primarily attributable to the significant reduction in log inventories previously written down to net realizable value, with most of those write-downs occurring in the previous quarter. Other major contributors to the positive variance were supply driven increases in lumber and OSB market prices, lower log costs, manufacturing cost reductions at the Company’s B.C. Interior operations and the reversal of previously recognized log and lumber inventory write-downs, reflecting the lower costs and improved sales realizations. These factors more than offset the costs associated with the scheduled maintenance outages at CPLP’s Northwood and Intercontinental pulp mills and the Company’s Taylor pulp mill, and the impact of rising energy costs, particularly for the pulp and paper business segment.
Total shipment volumes of wood products were up 8% compared to the previous quarter primarily due to seasonal factors, and down 18% versus the second quarter of 2007, due substantially to increased curtailments. Compared to the previous quarter, average SPF lumber 2x4 No.2 and Better prices increased US$25 per Mfbm, but prices for Southern Yellow Pine (SYP) 2x4 No.2 and Better lumber, which after a short-lived rally fell back in June, averaged only US$9 per Mfbm higher. OSB 7/16” North Central prices improved steadily through April and May, but came off in June to end the quarter at US$202 per thousand square feet; average OSB prices were up US$36 per thousand square feet compared to the previous quarter. Pulp prices were stable through the second quarter, with average

6
NBSK list prices for U.S. delivery remaining at US$880 per tonne. Paper sales realizations showed a marginal improvement in the quarter. The average value of the Canadian dollar compared to the U.S. dollar was largely unchanged relative to the first quarter of 2007; however, compared to the second quarter of 2007, the Canadian dollar was stronger by 9%.
The Company recorded restructuring, severance and closure costs of $20.7 million in the second quarter of 2008, principally as a result of the indefinite closures of Mackenzie and PolarBoard. The affected mills have annual production capacities of approximately 300 million board feet of lumber and 640 million square feet (3/8” basis) of OSB, respectively.
The Company recorded gains on derivative financial instruments, both unrealized and realized, of $26.0 million in the second quarter of 2008, principally as a result of a sharp increase in natural gas and diesel prices.
On May 26, 2008, a fire at the Company’s North Central Plywoods facility (“NCP”) in Prince George, British Columbia completely destroyed the mill. Based on preliminary estimates of net property damage insurance proceeds receivable and costs related to the NCP fire, the Company recorded a pre-tax gain of $44.6 million in the second quarter of 2008.
OPERATING RESULTS BY BUSINESS SEGMENT
Lumber
Overview The Lumber segment reported operating income of $22.8 million for the second quarter of 2008, an improvement of $141.6 million compared to the first quarter of 2008 and up $74.0 million compared to the second quarter of 2007.
After adjusting for restructuring costs, EBITDA was up $149.7 million compared to the first quarter of 2008 and up $81.0 million compared to the second quarter of 2007.
The improvement compared to the previous quarter was mostly attributable to the significant log inventory reduction noted eariler. Higher sales realizations, as well as reduced log costs and conversion costs, also made a contribution to the improvement, both directly, through sales and production costs, and indirectly, through the reversal of previous log and lumber inventory write-downs at quarter end. These factors more than offset the impact from rising energy costs and restructuring costs related to the indefinite closure of Mackenzie. Production volumes were down only slightly compared to the previous quarter, with productivity gains largely offsetting additional curtailment taken in the period.
The improved results compared to the second quarter of 2007 for the most part reflected the change in log valuation accounting in 2008 and reduced log costs in the current period. These factors more than offset the impact of the stronger Canadian dollar, lower SPF lumber prices, and significantly increased curtailment of production.

7
Selected Financial Information and Statistics
Q2 Q1 YTD Q2 YTD (millions of dollars unless otherwise noted) 2008 2008 2008 2007 2007 Sales $395.3 $ 352.5 $ 747.8 $ 528.6 $1,040.2 EBITDA 5 $ 46.3 $ (93.0) $ (46.7) $ (27.7) $ (74.0) Adjusted EBITDA $ 57.4 $ (92.3) $ (34.9) $ (23.6) $ (69.9) EBITDA margin 5 12% -26% -6% -5% -7% Adjusted EBITDA margin 15% -26% -5% -4% -7% Operating income (loss) $ 22.8 $ (118.8) $ (96.0) $ (51.2) $ (125.8)
Average SPF 2x4 #2 & Better lumber price in US$ 6 $ 230 $ 205 $ 217 $ 258 $ 255 Average SPF price in Cdn$ $ 232 $ 206 $ 219 $ 283 $ 289 Average SYP 2x4 #2 lumber price in US$ 7 $ 294 $ 285 $ 289 $ 292 $ 286 Average SYP price in Cdn$ $ 296 $ 286 $ 291 $ 321 $ 325
Production – SPF lumber (MMfbm) 877.0 883.7 1,760.7 1,080.1 2,194.5 Production – SYP lumber (MMfbm) 104.4 106.0 210.4 100.7 199.8 Shipments – Canfor-produced SPF lumber (MMfbm)8 935.3 862.7 1,798.0 1,122.0 2,124.0 Shipments – Canfor-produced SYP lumber (MMfbm)8 125.9 110.3 236.2 126.1 234.2 Shipments – wholesale lumber (MMfbm) 46.0 49.5 95.5 96.4 199.0
Markets Demand for wood products in the U.S. continued to decline in the second quarter of 2008. U.S. housing starts were down 37,000 units (SAAR), or 4%9, compared to the previous quarter, and down 444,000 units SAAR, or 30%, compared to the second quarter of 2007. Single family starts continued to fall through the quarter and were down 57,00010 units SAAR, compared to the previous quarter and down 490,000 units SAAR compared to the same quarter of 2007. Although the inventory of new homes for sale decreased by 32,000 units11 compared to the previous quarter, the months supply of inventory remained the same as the pace of home sales continued to slow as a result of falling home prices, waning consumer confidence, increased mortgage lending standards, and increasing food and fuel costs. The inventory of existing homes for sale continued to rise during the period, and supply averaged 11 months12 inventory for the quarter.
Canadian housing starts began to decline in the second quarter of 2008, down 5,000 units SAAR13, or 2% compared to the previous quarter and 12,000 units SAAR or 5% to the second quarter of 2007. Japanese housing starts were down slightly compared to the previous quarter, but this was tempered by a 15% increase in “2X4” housing construction over the same period.
5 EBITDA for the second quarter of 2008 included $56.0 million largely due to the seasonal drawdown of logs, which had been previously written down to net realizable value, and the reversal of previously recognized log inventory write-downs. The Company recorded an expense of $38.0 million in the first quarter of 2008, principally as a result of its log inventory build ahead of the spring break-up. 6 Western Spruce/Pine/Fir, per thousand board feet (Source – Random Lengths Publications, Inc.) 7 Southern Yellow Pine, Eastside, per thousand board feet (Source – Random Lengths Publications, Inc.) 8 Includes shipments of lumber purchased for remanufacture 9 U.S. Bureau of the Census 10 U.S. Bureau of the Census 11 U.S. Bureau of the Census 12 National Association of Realtors 13 CHMC

8
Sales
Sales for the second quarter of 2008 were up $42.8 million, or 12%, compared to the first quarter of 2008, and down $133.3 million, or 25%, compared to the second quarter of 2007.
The average price for SPF 2X4 No.2 & Better was up US$25 per Mfbm, or 12%, compared to the previous quarter, but down US$28 per Mfbm, or 11%, compared to the second quarter of 2007. Average prices for SYP lumber, measured by 2x4 No.2 & Better, increased slightly over both comparative periods (US$9 per Mfbm and US$2 per Mfbm, respectively). Relative to the second quarter of 2007, the Canadian dollar strengthened 9%, negatively impacting the current quarter’s sales realizations.
The Random Lengths Framing Lumber Composite price averaged US$265 per Mfbm for the second quarter of 2008 (up US$18 per Mfbm compared to the previous quarter), and accordingly the export tax on all U.S. bound shipments remained at 15% through the quarter.
Shipments for the second quarter of 2008 were up 85 million board feet, or 8%, compared to the previous quarter, reflecting a seasonal drawdown of inventories after the traditionally slower winter period. Shipments were down 237 million board feet, or 18%, compared to the second quarter of 2007, reflecting significant levels of market-related curtailment taken in the current period.
Residual chip sales revenues were largely unchanged compared to the previous quarter, with increased prices offsetting the impact of reduced sales volumes. Compared to the second quarter of 2007, residual chip sales revenues were well down, reflecting significantly lower operating rates, which more than offset the impact of higher prices.
Operations
Lumber production in the second quarter was 981 million board feet, 8 million board feet lower than for the previous quarter and 199 million board feet, or 17%, lower than for the same quarter in 2007. Production for the period reflected reduced shifts and shortened work weeks, and the indefinite closures of Mackenzie (June) and Chetwynd (March) sawmills, but sawmill and planer efficiency gains offset most of the curtailed production. Production for the first and second quarters of 2008 included the Darlington mill in South Carolina, which was acquired in late 2007.
Unit conversion costs were down compared to the previous quarter due to seasonally lower energy consumption rates, productivity gains and reduced operational costs, which more than offset the impact of rising energy costs and increased curtailment. The solid operating performance in the current period also accounted for a modest improvement in conversion costs compared to the second quarter of 2007, despite significantly increased curtailment and higher energy costs.
Log costs were lower compared to the previous quarter, primarily due to reductions to B.C. Interior stumpage rates, and to a lesser extent, reduced overhead costs. The reduction in stumpage costs reflected lower lumber prices and the Company’s consumption of a higher mix of lower grade logs (infected by the mountain pine beetle). The same factors accounted for the significant majority of the favourable variance compared to the same quarter of 2007.
As a result of the above factors, the Company’s unit manufacturing costs at its Western Canadian operations were down 6% compared to the first quarter of 2008 and down 15% compared to the second quarter of 2007.

9
Panels
Overview
The Panels segment recorded operating income of $1.8 million for the second quarter, $28.6 million higher than the loss of $26.8 million reported for the previous quarter, and an improvement of $18.1 million compared to the second quarter of 2007. After taking account of restructuring costs of $9.4 million in the second quarter resulting from the indefinite closure of PolarBoard (Q1: $2.9 million), adjusted EBITDA was up $35.0 million compared to the previous quarter, and up $25.6 million compared to the second quarter of 2007.
The increase in adjusted EBITDA compared to the previous quarter resulted principally from higher OSB sales prices, the reversal of previously recognized inventory write-downs, due primarily to higher sales realizations, and a seasonal drawdown of log inventory levels. These factors more than offset the impact of weaker plywood prices and lower operating rates that reflected the NCP fire and an annual maintenance shutdown at the Peace Valley OSB mill in B.C., of which the Company owns 50%, and proportionately consolidates.
Compared to the same quarter of 2007, the reversal of previously recognized inventory write-downs in the current period was the most significant factor accounting for the improvement in reported income, with the impact of lower plywood prices and the stronger Canadian dollar more than offsetting higher OSB prices.
Selected Financial Information and Statistics
Q2 Q1 YTD Q2 YTD (millions of dollars unless otherwise noted) 2008 2008 2008 2007 2007 Sales $ 59.9 $ 53.9 $ 113.8 $ 81.6 $ 153.3 EBITDA14 $ 6.0 $ (22.5) $ (16.5) $ (10.2) $ (22.7) Adjusted EBITDA $ 15.4 $ (19.6) $ (4.2) $ (10.2) $ (22.6) EBITDA margin14 10% -42% -14% -13% -15% Adjusted EBITDA margin 26% -36% -4% -13% -15% Operating income (loss) $ 1.8 $ (26.8) $ (25.0) $ (16.3) $ (34.8) Average plywood price in Cdn$15 $ 337 $ 347 $ 342 $ 357 $ 368 Average OSB price in US$16 $ 174 $ 138 $ 156 $ 156 $ 150 Average OSB price in Cdn$ $ 176 $ 139 $ 157 $ 171 $ 170 Production – plywood (MMsf 3/8”) 85.7 89.8 175.5 101.2 202.1 Production – OSB (MMsf 3/8”) 134.3 158.4 292.7 166.9 346.8 Shipments – plywood (MMsf 3/8”) 95.7 86.0 181.7 118.7 205.6 Shipments – OSB (MMsf 3/8”) 152.9 163.8 316.7 168.0 341.8
14 EBITDA for the second quarter of 2008 included $16.4 million relating to the seasonal drawdown of logs, which had been previously written down to net realizable value, and the reversal of previously recognized log inventory write-downs. The Company recorded an expense of $3.9 million in the first quarter of 2008 substantially as a result of its log inventory build ahead of the spring break-up. 15 Canadian softwood plywood, per Msf 3/8” basis, delivered to Toronto (Source – C.C. Crowe Publications, Inc.) 16 OSB, per Msf 7/16” North Central (Source – Random Lengths Publications, Inc.)

10
Markets
Panel markets were mixed in the second quarter of 2008. OSB prices moved upwards in April and May as a result of industry curtailments but came under pressure towards the end of the quarter. Plywood prices lost most of the gains made during the previous quarter.
Sales
OSB prices averaged US$174 per thousand square feet of 7/16” delivered to North Central17 for the second quarter of 2008, up 26% from the previous quarter and up 12% from the second quarter of 2007. The Canadian softwood plywood 3/8” delivered Toronto price was down $10, or 3%, from the first quarter of 2008, and down $20, or 6%, from the second quarter of 2007. Total shipment volumes were similar to the previous quarter, at 249 million square feet, but were down 38 million square feet, or 13%, compared to the second quarter of 2007 due to lower production.
Operations
As a result of the Peace Valley OSB scheduled maintenance outage and the indefinite closure of PolarBoard, OSB production was down 15% from the previous quarter. Compared to the same quarter last year, production was lower by 19% due principally to market-related curtailment. Plywood production was down 5% versus the previous quarter due primarily to the NCP fire, and 15% lower than the same quarter last year substantially due to the weak markets and the NCP fire.
Pulp and Paper18
Overview
Operating income and EBITDA in the Pulp and Paper segment in the second quarter of 2008 were down $18.9 million and $18.5 million, respectively, from the previous quarter, largely due to costs associated with the scheduled maintenance outages taken at CPLP’s Northwood and Intercontinental pulp mills and the Company’s Taylor pulp mill, and higher fibre costs. Pulp sales realizations were down slightly compared to the previous quarter, primarily due to higher freight costs.
Compared to the same quarter last year, operating income and EBITDA were down $25.3 million and $25.6 million, respectively, primarily as a result of the significantly stronger Canadian dollar, increased fibre costs, and higher scheduled maintenance outages, which more than offset the favourable impact of higher U.S. dollar prices.
17 Random Lengths 18 Includes the Taylor Pulp Mill and 100% of Canfor Pulp Limited Partnership (CPLP), which is consolidated in Canfor’s operating results. Pulp production and shipment volumes presented are for both northern bleached softwood kraft (NBSK) and bleached chemi-thermo mechanical pulp (BCTMP)

11
Selected Financial Information and Statistics
Q2 Q1 YTD Q2 YTD (millions of dollars unless otherwise noted) 2008 2008 2008 2007 2007 Sales $ 251.2 $ 242.1 $ 493.3 $ 266.4 $ 533.7 EBITDA $ 26.6 $ 45.1 $ 71.7 $ 52.2 $ 113.1 EBITDA margin 11% 19% 15% 20% 21% Operating income $ 14.3 $ 33.2 $ 47.5 $ 39.6 $ 88.2
Average pulp price – US$19 $ 880 $ 880 $ 880 $ 810 $ 800 Average price in Cdn$ $ 889 $ 884 $ 886 $ 889 $ 908
Production – pulp (000 mt) 276.2 284.5 560.7 308.8 614.2 Production – paper (000 mt) 34.2 32.4 66.6 33.9 65.5 Shipments – Canfor-produced pulp (000 mt) 289.4 279.0 568.4 309.3 613.6
Pulp marketed on behalf of HSLP (000 mt)20 96.2 78.3 174.5 102.5 183.9 Shipments – paper (000 mt) 33.7 35.1 68.8 35.9 66.3
Markets
The pulp market remained balanced through the second quarter of 2008. Market pulp inventories (World 20 Producers) of softwood kraft market pulp were at 29 days of supply21 at the end of the second quarter, a reduction of four days from the level at the end of the preceding quarter. Inventories of 30 days are generally considered to be representative of a balanced market.
Supply concerns continued to impact market conditions in the second quarter of 2008 helping to maintain a balanced market and offsetting paper demand reductions, primarily in the U.S. The relative strength of the Canadian dollar and the Euro compared to the U.S. dollar continued to negatively impact revenues of Canadian and European producers. Fibre costs for these same producers continue to rise, adding to the financial strain and viability concerns of some higher cost producing mills. Adding to supply concerns is the reduced availability of fibre for Canadian pulp mills. The slowdown in the U.S. housing market has reduced demand for lumber resulting in closures of sawmills and reduced supply of residual woodchips. Market conditions were also impacted by the slowed global economic growth, resulting in a reduction in demand in the latter part of the quarter.
Sales
NBSK pulp shipment volumes were up slightly compared to the previous quarter. Average NBSK pulp list prices delivered to the U.S. were unchanged from the previous quarter at US$880 per tonne. NBSK pulp list prices were up US$70 per tonne, or 9%, compared to the second quarter of 2007 but the stronger Canadian dollar removed the benefit of this increase. NBSK pulp sales realizations were down slightly compared to the previous quarter, reflecting higher freight costs and a lower-value sales mix, while BCTMP sales realizations showed moderate gains. Paper sales realizations were up slightly compared to both the previous quarter and second quarter of 2007, reflecting higher prices.
Operations
Overall unit manufacturing costs for the second quarter of 2008 were up compared to the previous quarter due principally to costs associated with the scheduled maintenance outages and higher delivered fibre costs. The higher fibre costs are directly related to the continued sawmill downtime in the B.C. Interior. Lower production attributable to the maintenance outages in the second quarter approximated production losses arising from the fire at Prince George Pulp and Paper Mill’s chip screening and in-feed system in the first quarter.
Unit manufacturing costs were also higher compared to the same quarter of 2007, primarily due to increased fibre costs, in part due to additional whole log chipping, higher natural gas costs and the higher scheduled maintenance downtime in the current period. 19 Per tonne, NBSK pulp list price delivered to U.S. (RISI) 20 Howe Sound Pulp and Paper Limited Partnership Pulp Mill 21 Pulp and Paper Products Council (PPPC)
12
Non-Segmented Items
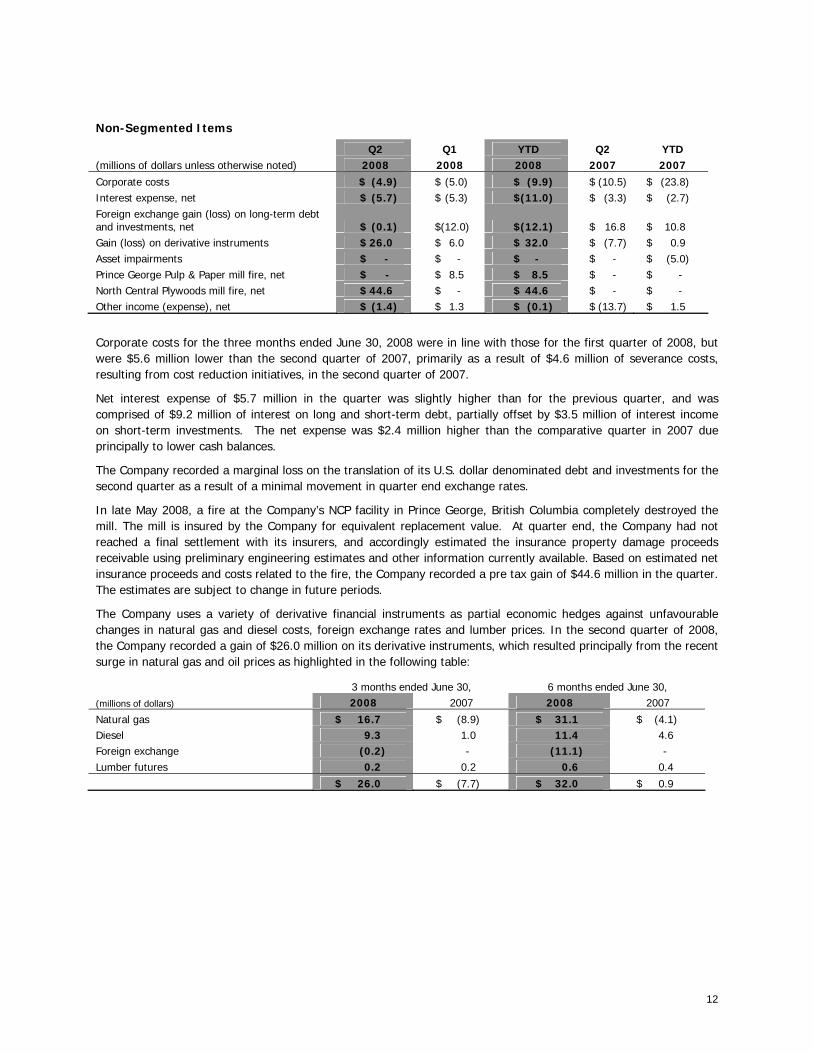
Q2 Q1 YTD Q2 YTD (millions of dollars unless otherwise noted) 2008 2008 2008 2007 2007 Corporate costs $ (4.9) $ (5.0) $ (9.9) $ (10.5) $ (23.8) Interest expense, net $ (5.7) $ (5.3) $(11.0) $ (3.3) $ (2.7) Foreign exchange gain (loss) on long-term debt and investments, net $ (0.1) $(12.0) $(12.1) $ 16.8 $ 10.8 Gain (loss) on derivative instruments $ 26.0 $ 6.0 $ 32.0 $ (7.7) $ 0.9 Asset impairments $ - $ - $ - $ - $ (5.0) Prince George Pulp & Paper mill fire, net $ - $ 8.5 $ 8.5 $ - $ - North Central Plywoods mill fire, net $ 44.6 $ - $ 44.6 $ - $ - Other income (expense), net $ (1.4) $ 1.3 $ (0.1) $ (13.7) $ 1.5
Corporate costs for the three months ended June 30, 2008 were in line with those for the first quarter of 2008, but were $5.6 million lower than the second quarter of 2007, primarily as a result of $4.6 million of severance costs, resulting from cost reduction initiatives, in the second quarter of 2007.
Net interest expense of $5.7 million in the quarter was slightly higher than for the previous quarter, and was comprised of $9.2 million of interest on long and short-term debt, partially offset by $3.5 million of interest income on short-term investments. The net expense was $2.4 million higher than the comparative quarter in 2007 due principally to lower cash balances.
The Company recorded a marginal loss on the translation of its U.S. dollar denominated debt and investments for the second quarter as a result of a minimal movement in quarter end exchange rates.
In late May 2008, a fire at the Company’s NCP facility in Prince George, British Columbia completely destroyed the mill. The mill is insured by the Company for equivalent replacement value. At quarter end, the Company had not reached a final settlement with its insurers, and accordingly estimated the insurance property damage proceeds receivable using preliminary engineering estimates and other information currently available. Based on estimated net insurance proceeds and costs related to the fire, the Company recorded a pre tax gain of $44.6 million in the quarter. The estimates are subject to change in future periods.
The Company uses a variety of derivative financial instruments as partial economic hedges against unfavourable changes in natural gas and diesel costs, foreign exchange rates and lumber prices. In the second quarter of 2008, the Company recorded a gain of $26.0 million on its derivative instruments, which resulted principally from the recent surge in natural gas and oil prices as highlighted in the following table:
3 months ended June 30, 6 months ended June 30, (millions of dollars) 2008 2007 2008 2007
Natural gas $ 16.7 $ (8.9) $ 31.1 $ (4.1) Diesel 9.3 1.0 11.4 4.6 Foreign exchange (0.2) - (11.1) - Lumber futures 0.2 0.2 0.6 0.4
$ 26.0 $ (7.7) $ 32.0 $ 0.9
13
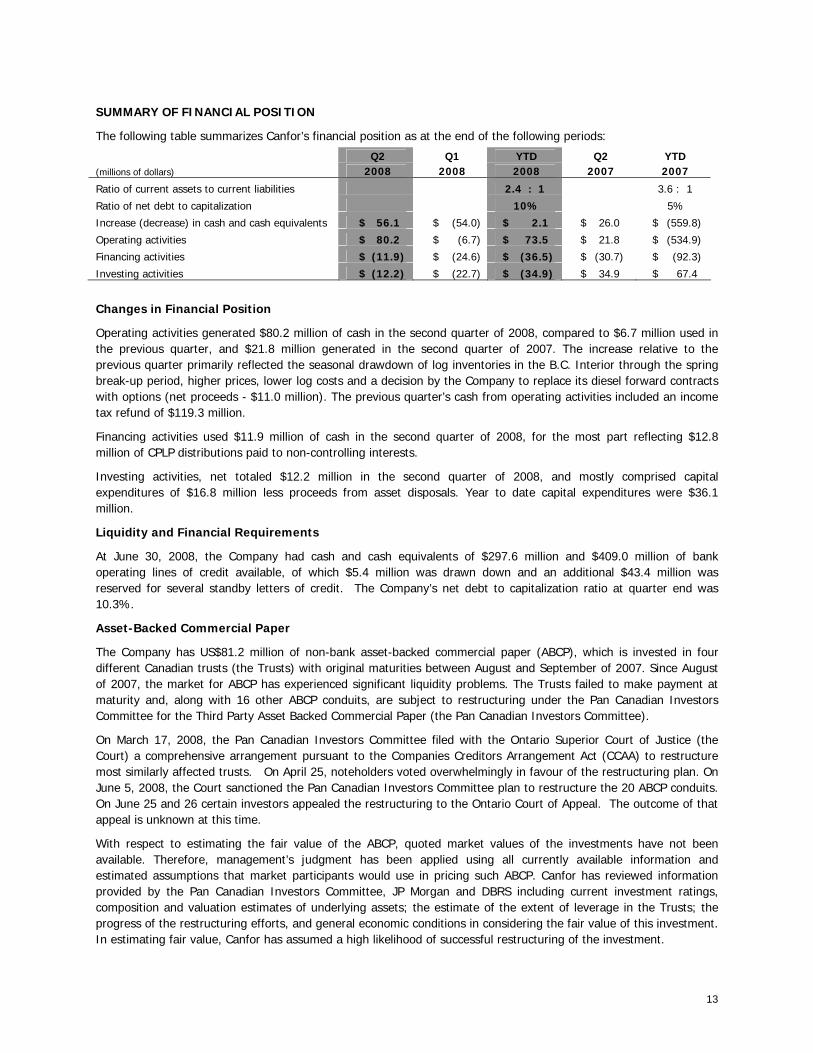
SUMMARY OF FINANCIAL POSITION
The following table summarizes Canfor’s financial position as at the end of the following periods:
Q2 Q1 YTD Q2 YTD (millions of dollars) 2008 2008 2008 2007 2007
Ratio of current assets to current liabilities 2.4 : 1 3.6 : 1
Ratio of net debt to capitalization 10% 5%
Increase (decrease) in cash and cash equivalents $ 56.1 $ (54.0) $ 2.1 $ 26.0 $ (559.8)
Operating activities $ 80.2 $ (6.7) $ 73.5 $ 21.8 $ (534.9)
Financing activities $ (11.9) $ (24.6) $ (36.5) $ (30.7) $ (92.3)
Investing activities $ (12.2) $ (22.7) $ (34.9) $ 34.9 $ 67.4
Changes in Financial Position
Operating activities generated $80.2 million of cash in the second quarter of 2008, compared to $6.7 million used in the previous quarter, and $21.8 million generated in the second quarter of 2007. The increase relative to the previous quarter primarily reflected the seasonal drawdown of log inventories in the B.C. Interior through the spring break-up period, higher prices, lower log costs and a decision by the Company to replace its diesel forward contracts with options (net proceeds - $11.0 million). The previous quarter’s cash from operating activities included an income tax refund of $119.3 million.
Financing activities used $11.9 million of cash in the second quarter of 2008, for the most part reflecting $12.8 million of CPLP distributions paid to non-controlling interests.
Investing activities, net totaled $12.2 million in the second quarter of 2008, and mostly comprised capital expenditures of $16.8 million less proceeds from asset disposals. Year to date capital expenditures were $36.1 million.
Liquidity and Financial Requirements
At June 30, 2008, the Company had cash and cash equivalents of $297.6 million and $409.0 million of bank operating lines of credit available, of which $5.4 million was drawn down and an additional $43.4 million was reserved for several standby letters of credit. The Company’s net debt to capitalization ratio at quarter end was 10.3%.
Asset-Backed Commercial Paper
The Company has US$81.2 million of non-bank asset-backed commercial paper (ABCP), which is invested in four different Canadian trusts (the Trusts) with original maturities between August and September of 2007. Since August of 2007, the market for ABCP has experienced significant liquidity problems. The Trusts failed to make payment at maturity and, along with 16 other ABCP conduits, are subject to restructuring under the Pan Canadian Investors Committee for the Third Party Asset Backed Commercial Paper (the Pan Canadian Investors Committee).
On March 17, 2008, the Pan Canadian Investors Committee filed with the Ontario Superior Court of Justice (the Court) a comprehensive arrangement pursuant to the Companies Creditors Arrangement Act (CCAA) to restructure most similarly affected trusts. On April 25, noteholders voted overwhelmingly in favour of the restructuring plan. On June 5, 2008, the Court sanctioned the Pan Canadian Investors Committee plan to restructure the 20 ABCP conduits. On June 25 and 26 certain investors appealed the restructuring to the Ontario Court of Appeal. The outcome of that appeal is unknown at this time.
With respect to estimating the fair value of the ABCP, quoted market values of the investments have not been available. Therefore, management’s judgment has been applied using all currently available information and estimated assumptions that market participants would use in pricing such ABCP. Canfor has reviewed information provided by the Pan Canadian Investors Committee, JP Morgan and DBRS including current investment ratings, composition and valuation estimates of underlying assets; the estimate of the extent of leverage in the Trusts; the progress of the restructuring efforts, and general economic conditions in considering the fair value of this investment. In estimating fair value, Canfor has assumed a high likelihood of successful restructuring of the investment.

14
Based on its assessment of fair value, Canfor recognized an impairment loss of $16.2 million in 2007 related to these investments, which represented 20% of the face value. No adjustment was recorded in the second quarter of 2008. It is possible that further information will become available on the actual composition of the referenced assets. A change in the estimate of the composition of the referenced assets would affect the valuation. In addition, if sales of the restructured senior or subordinated notes occur in the future, these sales might represent observable market transactions that could appropriately be used to determine the fair value of the investment.
AGREEMENT FOR SALE OF PANEL AND FIBRE PROPERTY
On April 11, 2008, the Company signed an agreement with the Vancouver Fraser Port Authority (VFPA) for the sale of a property (“Sale Agreement”) located in New Westminster, British Columbia. The agreed sales consideration is $47.5 million, which will result in a pre-tax gain on disposal of substantially the same amount. The property was the site of the Company’s former Panel and Fibre mill, which closed down in December 2007. Related closure costs of $14.4 million were recorded in the fourth quarter of 2007.
Following the signing of the Sale Agreement, the Greater Vancouver Sewage and Drainage District (“Metro Vancouver”) filed an expropriation notice against title to the subject lands, which prevented the Company from transferring legal title to the purchaser on the closing of the Sale Agreement. The VFPA has commenced an action against Metro Vancouver to remove the expropriation notice. In the event that the land is expropriated, under the Expropriation Act, Metro Vancouver is required to pay the Company fair value for the property.
The timing and ultimate outcome of this transaction is not determinable at this time and no amounts related to this transaction have been recorded in the second quarter of 2008.
OUTLOOK
Lumber and Panel Markets
There continues to be no immediate end in sight to the challenging North American structural lumber market conditions, with U.S. housing starts and inventories of new and existing homes expected to remain at or close to current levels through the balance of 2008. Housing starts in Canada have also started to taper off from historically high levels, and this trend is expected to continue for the remainder of the year. Repair and remodeling expenditures are also expected to decrease if the U.S. economy remains weak. As a result of less supply available to the market, prices are anticipated to stay relatively stable through the third quarter.
The U.S. housing market is not currently likely to show any meaningful recovery before the middle of 2009, and with increasing inflationary concerns in the U.S., there exists some risk that the recovery could be further delayed.
Pulp and Paper Markets
A US$20 per tonne price increase has been announced for North American markets effective July 1, which would take the price to US$900 per tonne. The European market price is currently at US$900 per tonne. Historically, pulp consumption and demand slows during the summer period. However, this demand slowdown is expected to be offset by reduced NBSK production as a result of mill closures. The expected result is that softwood market pulp will trade in a narrow price range for the balance of the year.
OUTSTANDING SHARES
At July 28, 2008, there were 142,589,312 common shares outstanding.

15
CRITICAL ACCOUNTING ESTIMATES
The preparation of financial statements in conformity with Canadian generally accepted accounting principles requires management to make estimates and assumptions that affect the amounts recorded in the financial statements. On an ongoing basis, management reviews its estimates, including those related to useful lives for amortization, impairment of long-lived assets, certain accounts receivable, pension and other employee future benefit plans and asset retirement obligations based upon currently available information. While it is reasonably possible that circumstances may arise which cause actual results to differ from these estimates, management does not believe it is likely that any such differences will materially affect the Company’s financial condition.
CHANGES IN ACCOUNTING POLICIES
Effective January 1, 2008, the Company adopted the Canadian Institute of Chartered Accountants’ new Handbook Sections: 1535 “Capital Disclosures”, 3031 “Inventories”, 3862 “Financial Instruments – Disclosures” and 3863 “Financial Instruments – Presentation”. Handbook sections 3862 and 3863 replace section 3861 “Financial Instruments – Disclosure and Presentation”. These recommendations have been incorporated into the unaudited interim consolidated financial statements.
Section 1535 – Capital Disclosures
This Section establishes standards for disclosing information about an entity's capital and how it is managed. Under this standard the Company is required to disclose qualitative and quantitative information that enables users of the financial statements to evaluate the Company’s objectives, policies and processes for managing capital.
Section 3031 - Inventories
This Section replaced Section 3030 – “Inventories” and provides significantly more guidance on the measurement of inventories, with an expanded definition of cost, and the requirement that inventories must be measured at the lower of cost and net realizable value. In addition, the section sets out additional disclosure requirements, including accounting policies, carrying values, and the amount of any inventory write-downs. In conjunction with section 3061 “Property Plant and Equipment”, it also provides guidance on the classification of major spare parts and stand-by equipment. On January 1, 2008, the Company adopted the new recommendations on a prospective basis. As a result of implementing these standards, inventories decreased by $60.6 million (log inventories by $46.5 million, processing materials and supplies by $14.1 million), property, plant and equipment increased by $14.1 million, future income tax liabilities decreased by $15.9 million and opening retained earnings were reduced by $30.6 million.
For the quarter ended June 30, 2008, the Company recorded a $72.4 million increase in operating income resulting from the adoption of the accounting standard (six months ended June 30, 2008 – increase of $30.4 million in operating income).
Section 3862 – Financial Instruments – Disclosures
This Section requires entities to provide disclosure of quantitative and qualitative information in their financial statements that enable users to evaluate: (a) the significance of financial instruments for the entity's financial position and performance; and (b) the nature and extent of risks arising from financial instruments to which the entity is exposed during the period and at the balance sheet date, and management’s objectives, policies and procedures for managing such risks.
Section 3863 – Financial Instruments – Presentation
This Section establishes standards for presentation of financial instruments and non-financial derivatives.

16
CONVERSION TO INTERNATIONAL FINANCIAL REPORTING STANDARDS
On February 13, 2008, the Accounting Standards Board announced that publicly accountable entities will be required to prepare financial statements in accordance with International Financial Reporting Standards (“IFRS”) for interim and annual financial statements for fiscal years beginning on or after January 1, 2011. The Company is currently in the process of developing a conversion implementation plan and assessing the impacts of the conversion on the consolidated financial statements and disclosures of the Company.
INTERNAL CONTROLS OVER FINANCIAL REPORTING
During the quarter ending June 30, 2008, there were no changes in the Company’s internal controls over financial reporting that materially affected, or would be reasonably likely to materially affect, such controls.
RISKS AND UNCERTAINTIES
A comprehensive discussion of risks and uncertainties is included in the Company’s 2007 annual statutory reports which are available on www.sedar.com or www.canfor.com.

17
SELECTED QUARTERLY FINANCIAL INFORMATION Q2 Q1 Q4 Q3 Q2 Q1 Q4 Q3 2008 2008 2007 2007 2007 2007 2006 2006 Sales and Income (millions of dollars) Sales $706.4 $ 648.5 $ 711.0 $ 837.4 $ 876.6 $ 850.6 $ 892.0 $ 927.7 Operating income (loss) $ 34.1 $ (117.5) $ (124.7) $ (52.1) $ (38.4) $ (57.8) $ 656.1 $ (44.8) Net income (loss) from
continuing operations $ 64.2 $ (85.4) $ (237.0) $ (42.1) $ (38.8) $ (42.7) $ 466.9 $ (51.6) Net income (loss) $ 64.2 $ (85.4) $ (237.0) $ (42.1) $ (38.8) $ (42.7) $ 465.3 $ (51.6) Per common share (dollars) Net income (loss) from continuing operations
Basic $ 0.45 $ (0.60) $ (1.66) $ (0.30) $ (0.27) $ (0.30) $ 3.28 $ (0.36) Diluted $ 0.45 $ (0.60) $ (1.66) $ (0.30) $ (0.27) $ (0.30) $ 3.27 $ (0.36)
Net income (loss) Basic and diluted $ 0.45 $ (0.60) $ (1.66) $ (0.30) $ (0.27) $ (0.30) $ 3.26 $ (0.36)
Statistics Lumber shipments (MMfbm) 1,107 1,023 1,149 1,301 1,345 1,213 1,352 1,416 Plywood shipments (MMsf 3/8”) 96 86 90 90 119 87 110 103 OSB shipments (MMsf 3/8”) 153 164 166 162 168 174 184 193 Pulp shipments (000 mt) 289 279 308 307 309 304 292 308 Average exchange rate (Cdn$/US$) $0.990 $ 0.996 $ 1.019 $ 0.957 $ 0.911 $ 0.854 $ 0.878 $ 0.892 Average Western SPF 2x4 #2&Btr lumber price (US $) $ 230 $ 205 $ 230 $ 260 $ 258 $ 253 $ 245 $ 278 Average SYP (East) 2x4 #2 lumber price (US $) $ 294 $ 285 $ 277 $ 273 $ 292 $ 279 $ 272 $ 304 Average plywood price–Toronto (Cdn $) $ 337 $ 347 $ 374 $ 394 $ 357 $ 379 $ 366 $ 364 Average OSB price–North Central (US $) $ 174 $ 138 $ 165 $ 177 $ 156 $ 145 $ 166 $ 181 Average NBSK pulp list price delivered to the U.S. (US $) $ 880 $ 880 $ 857 $ 837 $ 810 $ 790 $ 770 $ 757
In addition to exposure to changes in product prices and foreign exchange, the Company’s financial results are impacted by seasonal factors such as weather and building activity. Adverse weather conditions can cause logging curtailments, which can affect the supply of raw materials to sawmills, plywood and OSB plants, and pulp mills. Market demand also varies seasonally to some degree. For example, building activity and repair and renovation work, which affects demand for lumber and panel products, is generally stronger in the spring and summer months. Shipment volumes are affected by these factors as well as by global supply and demand conditions, which as indicated in the lumber operations commentary, has adversely impacted the Company’s production since late 2006, and particularly in the two most recent quarters. In the first quarter of 2007, strike action at CN resulted in shortages in railcar supply, which had an adverse impact on shipment volumes in the quarter. Following the spinout of the Pulp Business on July 1, 2006, Canfor continues to consolidate 100% of the income from CPLP (Canfor Pulp Limited Partnership). However, the 20% non-controlling interest is removed from the income statement beginning in the third quarter of 2006, and a further 29.8% at the end of November 2006, which affects comparability of net income of prior periods.

18
Other factors that impact the comparability of the quarters are noted below: Q2 Q1 Q4 Q3 Q2 Q1 Q4 Q3 (millions of dollars, after tax) 2008 2008 2007 2007 2007 2007 2006 2006 Gain (loss) on derivative financial instruments $ 14.5 $ 2.7 $ 3.5 $ 6.9 $ (3.7) $ 4.9 $ - $ - New inventory accounting standard 47.8 (29.0) - - - - - - Foreign exchange gain (loss) on long-term debt and investments, net - (8.7) (3.5) 5.1 10.2 (5.3) (9.9) (5.6) Prince George Pulp & Paper mill fire , net - 3.6 - - - - - -
North Central Plywoods mill fire, net 36.3 - - - - - - - Restructuring, mill closure and severance costs (13.6) (2.6) (14.2) (7.3) (5.8) - (4.3) - Corporate income tax rate reductions - 9.1 35.8 0.9 1.0 - - - Duty refund and interest - - - 2.0 - 1.4 551.2 - CEO remuneration on resignation - - - - - (3.0) - - Adjustment to incentive costs - - 1.5 - 2.3 - - - Asset impairments - - (189.1) (6.0) - (4.1) (16.2) - Dividend income - - - - - 4.1 - - Accrual for environmental and related liabilities - - (1.9) - - - - - Prior year tax reassessments and other tax adjustments - - 0.5 2.2 - - 0.5 - Spinout costs incurred by CPLP - - - - - - - (3.1)
Net income (loss) from discontinued operations - - - - - - (1.6) -
Net favourable (unfavourable) impact on net income $ 85.0 $(24.9) $(167.4) $ 3.8 $ 4.0 $ (2.0) $519.7 $ (8.7)

19
Canfor Corporation Consolidated Income Statements 3 months ended June 30, 6 months ended June 30,(millions of dollars, unaudited) 2008 2007 2008 2007
Sales $ 706.4 $ 876.6 $ 1,354.9 $ 1,727.2
Costs and expenses
Manufacturing and product costs 447.0 662.0 1,021.4 1,324.1 Freight and other distribution costs 129.7 152.7 244.8 296.0 Export taxes 18.2 29.2 31.6 57.9 Amortization 41.5 43.5 85.0 91.3 Selling and administration costs 15.2 18.9 31.0 45.4 Restructuring, mill closure and severance costs (Note 2) 20.7 8.7 24.5 8.7
672.3 915.0 1,438.3 1,823.4
Operating income (loss) 34.1 (38.4) (83.4) (96.2)
Equity income (loss) of affiliated companies (0.1) 0.1 (0.2) - Interest expense, net (5.7) (3.3) (11.0) (2.7)Foreign exchange gain (loss) on long-term debt and investments, net (0.1) 16.8 (12.1) 10.8Gain (loss) on derivative financial instruments (Note 12) 26.0 (7.7) 32.0 0.9 North Central Plywoods mill fire, net (Note 4 (a)) 44.6 - 44.6 - Prince George Pulp & Paper mill fire, net (Note 4 (b)) - - 8.5 - Asset impairments - - - (5.0)Other income (expense), net (1.4) (13.8) (0.1) 1.5
Net income (loss) before income taxes 97.4 (46.3) (21.7) (90.7)
Income tax (expense) recovery (Note 5) (24.0) 25.6 31.7 51.6
Non-controlling interests (9.2) (18.1) (31.2) (42.4)
Net income (loss) $ 64.2 $ (38.8) $ (21.2) $ (81.5)
Per common share (in dollars) (Note 6)
Net income (loss) - Basic and Diluted $ 0.45 $ (0.27) $ (0.15) $ (0.57)
The accompanying notes are an integral part of these interim financial statements.

20
Canfor Corporation Consolidated Cash Flow Statements 3 months ended June 30, 6 months ended June 30,(millions of dollars, unaudited) 2008 2007 2008 2007
Cash generated from (used in)
Operating activities Net income (loss) from operations $ 64.2 $ (38.8) $ (21.2) $ (81.5)
Items not affecting cash: Amortization 41.5 43.5 85.0 91.3 Income taxes 17.8 6.5 12.4 (4.1)Long-term portion of deferred reforestation (15.8) (10.6) 0.5 5.8 North Central Plywoods mill fire, net (Note 4 (a)) (44.6) - (44.6) - Prince George Pulp & Paper mill fire, net (Note 4 (b)) - - (8.5) - Foreign exchange gain (loss) on long-term debt (0.1) (47.8) 14.5 (54.3)(Gain) loss on derivative financial instruments (Note 12) (26.0) 7.7 (32.0) (0.9)Asset impairments - - - 5.0 Non-controlling interests 9.2 18.1 31.2 42.4 Other 7.1 9.5 5.5 9.8
Net proceeds from replacement of derivative financial instruments 11.0 - 11.0 -Salary pension plan contributions (4.6) (6.1) (4.6) (6.1)Deferred scheduled maintenance spending (5.2) (2.1) (5.6) (2.1)Net change in non-cash working capital (Note 7) 25.7 41.9 29.9 (540.2)
80.2 21.8 73.5 (534.9)
Financing activities
Repayment of long-term debt (Note 9) - (11.7) (14.8) (53.3)Changes in operating bank loans 1.5 (2.7) 5.3 (0.1)Cash distributions paid to non-controlling interests (13.2) (16.3) (26.8) (39.0)Other (0.2) - (0.2) 0.1
(11.9) (30.7) (36.5) (92.3)
Investing activities
Change in temporary investments - 61.7 - 115.4 Additions to property, plant, equipment and timber (16.8) (21.1) (36.1) (39.4)Proceeds from disposal of property, plant and equipment 2.8 0.1 4.2 0.6 Proceeds from Prince George Pulp & Paper mill fire damage claim 4.4 - 8.0 - Advances to affiliated companies (Note 8 (b)) - - (11.5) - Other (2.6) (5.8) 0.5 (9.2)
(12.2) 34.9 (34.9) 67.4
Increase (decrease) in cash and cash equivalents 56.1 26.0 2.1 (559.8)
Cash and cash equivalents at beginning of period 241.5 438.0 295.5 1,023.8
Cash and cash equivalents at end of period $ 297.6 $ 464.0 $ 297.6 $ 464.0
Cash payments (receipts) in the period
Interest, net $ 7.4 $ 3.8 $ 12.6 $ 6.9
Income taxes $ (4.3) $ 36.7 $ (123.6) $ 243.0

21
Canfor Corporation Consolidated Balance Sheets As at As at June 30, December 31,(millions of dollars) 2008 2007ASSETS (unaudited) (audited)
Current Assets Cash and cash equivalents $ 297.6 $ 295.5 Accounts receivable
Trade 213.3 199.5 Other (Note 4) 108.5 74.3
Income taxes recoverable 24.4 136.7 Inventories (Note 1(b)) 420.0 472.0 Prepaid expenses 55.1 40.8
Total current assets 1,118.9 1,218.8
Long-term investments and other (Note 8) 203.3 170.4
Property, plant, equipment and timber 1,902.7 1,959.4
Goodwill 70.9 69.2
Deferred charges 101.9 90.0
$ 3,397.7 $ 3,507.8
LIABILITIES
Current Liabilities Operating bank loans (Note 9) $ 5.4 $ - Accounts payable and accrued liabilities 285.7 335.0 Current portion of long-term debt (Note 9) 139.3 15.2 Current portion of deferred reforestation obligation 38.5 34.4 Future income taxes, net 0.4 19.0
Total current liabilities 469.3 403.6
Long-term debt (Note 9) 357.0 481.6
Long-term accrued liabilities and obligations (Note 10) 211.3 203.5
Future income taxes, net 283.1 299.5
Non-controlling interests 306.7 302.5
$ 1,627.4 $ 1,690.7
SHAREHOLDERS’ EQUITY
Share capital – 142,589,312 common shares outstanding $ 1,124.7 $ 1,124.7 Contributed surplus 31.9 31.9 Retained earnings 640.7 692.5 Accumulated other comprehensive loss (27.0) (32.0) $ 1,770.3 $ 1,817.1
$ 3,397.7 $ 3,507.8
Subsequent Event (Note 14)
APPROVED BY THE BOARD Director, R.L. Cliff Director, J.F. Shepard

22
Canfor Corporation Consolidated Statements of Changes in Shareholders’ Equity and Comprehensive Loss 3 months ended June 30, 6 months ended June 30,(millions of dollars, unaudited) 2008 2007 2008 2007
Consolidated Statements of Changes in Shareholders’ Equity
Share capital
Balance at beginning of period $ 1,124.7 $ 1,124.5 $ 1,124.7 $ 1,124.3 Common shares issued on exercise of stock options - 0.1 - 0.3 Balance at end of period $ 1,124.7 $ 1,124.6 $ 1,124.7 $ 1,124.6
Contributed surplus Balance at beginning and end of period $ 31.9 $ 31.9 $ 31.9 $ 31.9
Retained earnings Balance at beginning of period $ 576.5 1,010.4 $ 692.5 $ 1,068.5 Implementation of financial instruments standards (Note 1 (b)) - - - (13.2)Change in accounting for Canfor Pulp Limited Partnership’s pension liability
- - - (2.2)
Change in accounting for inventories (Note 1 (b)) - - (30.6) - Net income (loss) 64.2 (38.8) (21.2) (81.5)Balance at end of period $ 640.7 $ 971.6 $ 640.7 $ 971.6
Accumulated other comprehensive income (loss) Balance at beginning of period $ (25.0) $ 0.2 $ (32.0) $ - Implementation of financial instruments standards (Note 1 (b)) - - - (1.9)Reclassification from foreign exchange translation adjustment - - - 3.0 Net change in foreign exchange translation adjustment (1.8) (17.8) 5.4 (20.4)Reclassification to income of losses on derivatives designated as
cash flow hedges in prior periods (0.2) 0.5 (0.4) 2.2
Balance at end of period $ (27.0) $ (17.1) $ (27.0) $ (17.1)
Shareholders’ equity at end of period $ 1,770.3 $ 2,111.0 $ 1,770.3 $ 2,111.0
Consolidated Statement of Comprehensive Income (Loss)
Net income (loss) $ 64.2 $ (38.8) $ (21.2) $ (81.5)
Other comprehensive income (loss) Exchange translation adjustment on self-sustaining foreign
subsidiaries (1.8) (17.8) 5.4 (20.4)
Reclassification to income of losses on derivative instruments designated as cash flow hedges in prior periods, net of taxes and non-controlling interests
(0.2) 0.5 (0.4)
2.2
Other comprehensive income (loss) (2.0) (17.3) 5.0 (18.2)
Total comprehensive income (loss) $ 62.2 $ (56.1) $ (16.2) $ (99.7)

23
Notes to the Consolidated Interim Financial Statements
(unaudited, in millions of dollars unless otherwise noted) 1. Significant Accounting Policies and Changes in Accounting Policies
(a) Basis of Presentation
These interim financial statements do not include all of the disclosures required by Canadian generally accepted accounting principles for annual financial statements and, accordingly, should be read in conjunction with the financial statements and notes included in Canfor’s Annual Report for the year ended December 31, 2007 available at www.canfor.com or www.sedar.com. These interim financial statements follow the same accounting policies and methods of computation as used in the 2007 consolidated financial statements, except as noted below. Canfor’s financial results are impacted by seasonal factors such as weather and building activity. Adverse weather conditions can cause logging curtailments, which can affect the supply of raw materials to sawmills, plywood and OSB plants, and pulp mills. Market demand also varies seasonally to some degree. For example, building activity and repair and renovation work, which affects demand for lumber and panel products, is generally stronger in the spring and summer months. Shipment volumes are affected by these factors as well as by global supply and demand conditions.
(b) Changes in Accounting Policies
Effective January 1, 2008, the Company adopted the Canadian Institute of Chartered Accountants’ new Handbook Sections: 1535 “Capital Disclosures”, 3031 “Inventories”, 3862 “Financial Instruments – Disclosures” and 3863 “Financial Instruments – Presentation”. Handbook sections 3862 and 3863 replace section 3861 “Financial Instruments – Disclosure and Presentation”.
Section 1535 - Capital Disclosures
This section establishes standards for disclosures about an entity’s capital and how it is managed. Under this standard the Company is required to disclose qualitative information about its objectives, policies and processes for managing capital; to disclose quantitative data about what it regards as capital; and to disclose whether an entity has complied with any externally imposed capital requirements and, if not, the consequences of such non-compliance.
Section 3031 - Inventories
This Section replaced Section 3030 – “Inventories” and provides significantly more guidance on the measurement of inventories, with an expanded definition of cost, and the requirement that inventories must be measured at the lower of cost and net realizable value. In addition, the section sets out additional disclosure requirements, including accounting policies, carrying values, and the amount of any inventory write-downs. In conjunction with section 3061 “Property Plant and Equipment”, it also provides guidance on the classification of major spare parts and stand-by equipment. On January 1, 2008, the Company adopted the new recommendations on a prospective basis. As a result of implementing these standards, inventories decreased by $60.6 million (log inventories by $46.5 million, processing materials and supplies by $14.1 million), property, plant and equipment increased by $14.1 million, future income tax liabilities decreased by $15.9 million and opening retained earnings were reduced by $30.6 million.
For the quarter ended June 30, 2008, the Company recorded a $72.4 million increase in operating income resulting from the adoption of the accounting standard (six months ended June 30, 2008 – increase of $30.4 million in operating income).
Section 3862 - Financial Instruments – Disclosures
This section requires entities to provide disclosure of quantitative and qualitative information in their financial statements that enable users to evaluate: (a) the significance of financial instruments for the entity's financial position and performance; and (b) the nature and extent of risks arising from financial instruments to which the

24
entity is exposed during the period and at the balance sheet date, and management’s objectives, policies and procedures for managing such risks.
Section 3863 – Financial Instruments – Presentation
This Section establishes standards for presentation of financial instruments and non-financial derivatives.
On January 1, 2007, the Company adopted Sections 3855, 3861, 3865, “Financial Instruments”, “Financial Instruments – Disclosure and Presentation, Hedges” and Section 1530, “Comprehensive Income”. Opening retained earnings were reduced by $13.2 million as a result of the implementation of these new standards. This amount was comprised of a $14.2 million deferred unrealized foreign exchange loss on long-term debt arising from a previous hedging relationship and $2.8 million of deferred financing costs that were written off, partially offset by a $3.8 million adjustment to the associated liabilities for future income taxes and non-controlling interests.
2. Restructuring, Mill Closure and Severance Costs
Restructuring, mill closure and severance costs of $20.7 million for the second quarter of 2008 were substantially comprised of costs resulting from the indefinite closures in June 2008 of the Company’s PolarBoard and Mackenzie operations.
The following table provides a reconciliation of accrued amounts relating to the indefinite or permanent closures of facilities, as well as severance costs:
(millions of dollars)
As at June 30, 2008
As at December 31, 2007
Accrued liability at beginning of period $ 24.9 $ 4.9
Accrued in the period * 20.7 41.3
Less: non-cash items - (2.0)
Payments in the period (17.6) (8.4)
Accrued liability at end of period $ 28.0 $ 35.8
* reported in the following segments income statements (millions of dollars)
3 months ended June 30, 2008
Year Ended December 31, 2007
Lumber $ 11.2 $ 21.7
Panels 9.3 14.4
Corporate and Other 0.2 5.2
$ 20.7 $ 41.3
3. Employee Future Benefits
Canfor’s total benefit costs were as follows:
3 months ended June 30, 6 months ended June 30, (millions of dollars) 2008 2007 2008 2007
Defined benefit pension plans $ 0.9 $ 4.4 $ 1.6 $ 8.7
Other employee future benefit plans 4.3 4.2 8.5 8.5
Defined contribution pension plans and 401(k) plans 0.8 0.6 1.8 1.0
Contributions to forest industry union plans 5.0 6.1 10.4 12.6
$ 11.0 $ 15.3 $ 22.3 $ 30.8

25
4. Fires at North Central Plywoods Mill and Prince George Pulp & Paper Mill
(a) North Central Plywoods Mill Fire
On May 26, 2008 a fire at the Company’s North Central Plywoods (NCP) facility in Prince George, British Columbia completely destroyed the mill. The mill is insured by the Company for equivalent replacement value. At quarter end, the Company had not reached a final settlement with its insurers, and accordingly, estimated the insurance property damage amount receivable using preliminary engineering estimates and other information currently available. Based on estimated insurance proceeds, net of an aggregate policy deductible of $2.4 million, and costs related to the fire, the Company recorded a pre-tax gain of $44.6 million in the second quarter of 2008. The estimates are subject to adjustments in future periods.
On July 4, 2008, the Company received a cash advance of $10 million from its insurers.
(b) Prince George Pulp & Paper Mill Fire
On January 15, 2008, a fire at Canfor Pulp Limited Partnership’s (CPLP) Prince George Pulp & Paper mill destroyed the chip screening and in-feed system. CPLP recorded a property damage insurance receivable of $11.9 million, net of an aggregate policy deductible of $3.3 million, and a related gain on disposal of capital assets of $8.5 million, in the first quarter of 2008. CPLP also recorded a business interruption insurance receivable of $17.6 million at the end of June 2008, which was credited to sales in the first and second quarters of 2008.
At June 30, 2008, CPLP had received total advances of $22.9 million in connection with these claims.
5. Income Tax (Expense) Recovery 3 months ended June 30, 6 months ended June 30, (millions of dollars) 2008 2007 2008 2007
Current $ (11.0) $ 40.2 $ 12.6 $ 40.4 Future (13.0) (14.6) 19.1 11.2
$ (24.0) $ 25.6 $ 31.7 $ 51.6
The reconciliation of income taxes calculated at the statutory rate to the actual income tax provision is as follows:
3 months ended June 30, 6 months ended June 30, (millions of dollars) 2008 2007 2008 2007
Income tax recovery (expense) at statutory tax rate $ (30.2) $ 15.8 $ 6.7 $ 31.0 Add (deduct):
Non-controlling interests 2.9 6.2 9.7 14.5 Change in corporate income tax rate - 1.0 9.1 1.0 Entities with different income tax rates and other tax
adjustments 1.0 1.3 1.7 2.9
Tax recovery (expense) at rates other than statutory rate (3.4) - 0.4 - Permanent difference from capital gains and losses and
other non-deductible items 5.7 1.3 4.1 2.2
Income tax (expense) recovery $ (24.0) $ 25.6 $ 31.7 $ 51.6

26
6. Net Income (Loss) Per Share
Basic net income per share is calculated by dividing the net income available to common shareholders by the weighted average number of common shares outstanding during the period. Diluted net income per share is calculated by dividing the net income available to common shareholders by the weighted average number of common shares during the period using the treasury stock method. Under this method, proceeds from the potential exercise of stock options are assumed to be used to purchase the Company’s common shares.
3 months ended June 30, 6 months ended June 30, 2008 2007 2008 2007
Weighted average number of common shares 142,589,312 142,571,037 142,589,312 142,565,876
Incremental shares from potential exercise of stock options - 58,684 1,847 53,881
Diluted number of common shares 142,589,312 142,629,721 142,591,159 142,619,757
7. Changes in Non-Cash Working Capital
3 months ended June 30, 6 months ended June 30, (millions of dollars) 2008 2007 2008 2007
Accounts receivable $ (3.2) $ 10.0 $ (16.9) $ (25.6)
Income taxes 16.3 (76.6) 112.4 (282.7)
Future income taxes (4.9) 5.9 (31.5) (10.9)
Inventories 75.0 216.7 (8.0) 50.4
Prepaid expenses (21.4) (13.6) (20.1) (13.4)
Accounts payable, accrued liabilities and current portion of deferred reforestation (36.1) (100.5) (6.0) (258.0)
$ 25.7 $ 41.9 $ 29.9 $ (540.2)
8. Long-Term Investments and Other
(a) Asset-Backed Commercial Paper
Long-term investments and other includes US$64.0 million for non-bank asset-backed commercial paper (ABCP). The ABCP is measured at the estimated fair value of combined investments in asset-backed commercial paper of four different Canadian trusts (the Trusts) with total original principal amount of US$81.2 million and original maturities between August and September 2007. At the dates the Company acquired these investments they were rated R1 (High) by Dominion Bond Rating Service (DBRS), the highest credit rating issued for commercial paper and backed by R1 (High) rated assets and liquidity arrangements.
Since August of 2007, the market for ABCP has experienced significant liquidity problems. The demand for such paper has disappeared following the decline in credit markets and concerns regarding the quality and nature of underlying assets. The Trusts failed to make payment at maturity and, along with 16 other ABCP conduits, are subject to restructuring under the Pan-Canadian Investors Committee for Third Party structured Asset-Backed Commercial Paper (the Pan-Canadian Investors Committee).
On March 17, 2008 the Pan-Canadian Investors Committee filed with the Ontario Superior Court of Justice (the Court) a comprehensive arrangement pursuant to the Companies’ Creditors Arrangement Act (CCAA) to restructure the affected trusts. On April 25, noteholders voted overwhelmingly in favour of the restructuring plan. On June 5, 2008, the Court sanctioned the Pan Canadian Investors Committee plan to restructure the 20 ABCP conduits. On June 25 and 26 certain investors appealed the restructuring to the Ontario Court of Appeal.
Due to the disruption in the ABCP market, quoted market values of the investments have not been available. Therefore, the fair value of the ABCP has been determined based on management’s judgment using all currently
27
available information and estimated assumptions that market participants would use in pricing such ABCP as at the balance sheet date. Canfor reviewed information provided by the Pan-Canadian Investors Committee, JP Morgan and DBRS including current investment ratings, composition and valuation estimates of underlying assets; the estimate of the extent of leverage in the Trusts; the progress of the restructuring efforts, and general economic conditions in considering the fair value of this investment. In estimating fair value, Canfor used a valuation approach based on a high likelihood of successful restructuring of the investment. Of the US$81.2 million of ABCP which the Company has invested, it is estimated that:
• US$4.3 million is represented by traditional securitized assets that will, on restructuring, be replaced with long-term floating rate notes that are expected to receive a high investment grade rating;
• US$18.2 million is represented by a combination of synthetic and traditional securitized assets and collateralized debt obligations that will, on restructuring, be pooled with similar assets from other trusts and be replaced with a mix of senior and subordinated floating rate notes. It is anticipated that approximately 90% of the notes received by the Company will be senior notes and will carry a high investment grade rating;
• US$21.0 million is represented by assets that have exposure to US sub-prime assets or home equity loan mortgages that will, on restructuring, be replaced with long-term floating rate notes that may or may not be rated; and
• US$37.5 million is represented by assets of the Ironstone Trust Series B that had a rating of AAA by DBRS, published on January 9, 2008 (subsequently downgrade to ‘D’ on CCAA filing). On restructuring, the assets will be replaced with a long-term floating rate note that may or may not be rated.
It is possible that further information will become available on the actual composition of the referenced assets. A change in the estimate of the composition of the referenced assets would affect the valuation. In addition, if sales of the restructured senior or subordinated notes occur in the future, these sales might represent observable market transactions that could appropriately be used to determine the fair value of the investment.
(b) Howe Sound Pulp and Paper Limited Partnership
On February 5, 2008, Howe Sound Pulp and Paper Limited Partnership (HSLP) restructured its term debt pursuant to an agreement among HSLP, Canfor, Oji Paper Co., Ltd. (Oji) and a consortium of Japanese banks (the Banks). The restructuring resulted in a portion of the outstanding debt being subordinated for repayment after June 30, 2013.
As a consequence of the restructuring, Canfor contributed $7.3 million to HSLP in December 2007 and a further $11.5 million on closing in February 2008 (New Funds). These New Funds are secured by the assets of HSLP, subject to other security granted to the Banks and Oji. The repayment of the New Funds has priority to all other repayments, except a minimum debt repayment, from annual free cash flow of HSLP. The $18.8 million of New Funds are included in ‘Long-term investments and other’.
9. Operating Bank Loan and Long-Term Debt
On March 1, 2008, Canfor repaid $14.8 million (US$15.0 million) of privately placed 7.88% interest rate senior notes.
At June 30, 2008, Canfor had $409.0 million of bank operating lines of credit available, of which $5.4 million was drawn down and an additional $43.8 million was reserved for several standby letters of credit.
At June 30, 2008, the fair value of Canfor’s long-term debt, which was measured at its amortized cost of $496.3 million, was $494.2 million. The fair value of long-term debt was determined based on prevailing market rates for long-term debt with similar characteristics and risk profiles.

28
10. Long-term Accrued Liabilities and Obligations
(millions of dollars) As at June 30, 2008
As at December 31, 2007
Deferred reforestation obligation $ 66.1 $ 65.6
Accrued pension obligations 20.1 19.1
Accrued pension bridge benefit obligations 8.5 7.9
Post employment benefits 92.7 87.0
Asset retirement obligations 11.3 11.1
Other long-term liabilities 12.6 12.8
$ 211.3 $ 203.5
11. Segmented Information (a)
(millions of dollars)
Lumber (b) Panels Pulp &
Paper (d)
Corporate
& Other Consolidated
3 months ended June 30, 2008
Sales to external customers $ 395.3 59.9 251.2 - $ 706.4
Sales to other segments (c) $ 26.1 1.4 - - $ 27.5
Operating income (loss) $ 22.8 1.8 14.3 (4.8) $ 34.1Amortization $ 23.5 4.2 12.2 1.6 $ 41.5Capital expenditures $ 8.1 0.3 10.1 0.1 $ 18.6
3 months ended June 30, 2007
Sales to external customers $ 528.6 81.6 266.4 - $ 876.6
Sales to other segments (c) $ 29.9 1.2 - - $ 31.1
Operating income (loss) $ (51.2) (16.3) 39.6 (10.5) $ (38.4)Amortization $ 23.5 6.1 12.6 1.3 $ 43.5 Capital expenditures $ 14.4 0.9 5.1 0.7 $ 21.1
6 months ended June 30, 2008
Sales to external customers $ 747.8 113.8 493.3 - $ 1,354.9
Sales to other segments (c) $ 50.6 2.7 - - $ 53.3
Operating income (loss) $ (96.0) (25.0) 47.5 (9.9) $ (83.4)Amortization $ 49.3 8.5 24.1 3.1 $ 85.0Capital expenditures $ 18.1 0.4 19.4 - $ 37.9
6 months ended June 30, 2007
Sales to external customers $ 1,040.2 153.3 533.7 - $ 1,727.2
Sales to other segments (c) $ 58.8 2.1 - - $ 60.9
Operating income (loss) $ (125.8) (34.8) 88.2 (23.8) $ (96.2)Amortization $ 51.8 12.1 24.9 2.5 $ 91.3 Capital expenditures $ 26.6 3.5 8.3 1.0 $ 39.4

29
(a) Operations are presented by product line.
(b) Sales for the quarter include sales of Canfor-produced lumber of $335.8 million (2007 – $454.8 million) and $615.6 million for the year-to-date (2007 – $874.4 million).
(c) Sales to other segments are accounted for at prices that approximate market value.
(d) Includes 100% of Canfor Pulp Limited Partnership and the Taylor Pulp Mill, which was excluded from the spinout of the pulp and paper business in 2006.
Geographic Information
3 months ended June 30, 6 months ended June 30, (millions of dollars) 2008 2007 2008 2007 Sales by location of customer
Canada $ 129.3 $ 156.4 $ 263.0 $ 300.8 United States 373.8 507.7 719.3 1,022.7 Europe 50.9 42.6 96.3 87.7 Far East and Other 152.4 169.9 276.3 316.0 $ 706.4 $ 876.6 $ 1,354.9 $ 1,727.2
(millions of dollars)
As at June 30, 2008
As at December 31, 2007
Capital assets and goodwill by location Canada $ 1,816.3 $ 1,868.9United States 156.5 158.8Far East and Other 0.8 0.9 $ 1,973.6 $ 2,028.6
12. Financial Instruments
All financial instruments and derivatives are measured at fair value on initial recognition except for certain related party transactions.
Classification of Financial Instruments
The Company has classified its cash and cash equivalents and ABCP as held-for-trading. Accounts receivable are classified as loans and receivables. Bank indebtedness, accounts payable and accrued charges, and long-term debt, including interest payable, are classified as other liabilities, all of which are measured at amortized cost. Derivative instruments are recorded at fair value, including those derivatives that are embedded in financial or non-financial contracts that are not closely related to the host contract.
Financial Risk Management
The Company is exposed to a number of risks as a result of holding financial instruments. These risks include credit risk, liquidity risk and market price risk.
The Company’s Risk Management Committee manages risk in accordance with a Board approved Price Risk Management Controls Policy. This policy provides the framework for risk management related to commodity price, foreign exchange, interest rate and counterparty credit risk of the Company.
I. Credit risk:
Credit risk is the risk of financial loss to the Company if a customer or third party to a derivative instrument fails to meet its contractual obligations.
Financial instruments that are subject to credit risk include cash and cash equivalents, accounts receivable and long-term investments and other. Cash and cash equivalents includes cash held through major Canadian and international financial institutions and temporary investments with an original maturity date of 90 days or less. The cash and cash equivalents balance at June 30, 2008 is $297.6 million.

30
The Company utilizes a combination of credit insurance and self-insurance to manage the risk associated with trade receivables. Approximately 50% of the outstanding trade receivables are covered by credit insurance and the remaining balances are with creditworthy counterparties. The Company’s trade receivable balance at June 30, 2008 is $213.3 million.
II. Liquidity risk:
Liquidity risk is the risk that the Company will be unable to meet its financial obligations on a current basis. The Company manages liquidity risk through regular cash-flow forecasting in conjunction with an adequate committed operating bank loan facility.
At June 30, 2008, the Company has accounts payable and accrued liabilities of $285.7 million and current debt obligations of $139.3 million (US$137.3 million), all of which fall due for payment within one year of the balance sheet date.
III. Market risk:
Market risk is the risk that the fair value or future cash flows of a financial instrument will fluctuate because of changes in interest rates and foreign currency.
a. Interest Rate risk:
The Company is exposed to interest rate risk through its current financial assets and financial obligations bearing variable interest rate. The Company’s cash and cash equivalents include term deposits with original maturity dates of 90 days or less.
Changes in the market interest rates do not have a significant impact on the Company’s results of operations due to the short-term nature of the respective financial assets and obligations and because all long-term debt is based on fixed rates of interest.
The Company currently does not use derivative instruments to reduce its exposure to interest rate risk.
b. Currency risk:
The Company is exposed to foreign exchange risk primarily related to the U.S. dollar, as the Company’s products are sold principally in U.S. dollars and all long term debt is denominated in U.S. dollars. In addition, the Company holds financial assets and liabilities primarily related to New South Companies Inc. based in South Carolina, in U.S. dollars.
A portion of the currency risk associated with U.S. dollar denominated sales is naturally offset by U.S. dollar denominated expenses and the U.S. dollar denominated debt. The majority of the remaining exposure is subject to option contracts (foreign exchange collars) that effectively limit the minimum and maximum Canadian dollar recovery related to the sale of those dollars.
c. Energy Price risk
The Company is exposed to energy price risk relating to purchases of natural gas and diesel oil for use in its operations.
The exposure is hedged up to 100% through the use of floating to fixed swap contracts or option contracts with maturity dates up to a maximum of three years.
d. Commodity Price risk
The Company is exposed to commodity price risk related to sale of lumber, pulp, paper, plywood and oriented strand board. From time to time, the Company will enter into futures contracts on the Chicago Mercantile Exchange for lumber and forward contracts direct with customers for pulp. Under the Price Risk Management Controls Policy, up to 15% of lumber sales and 5% of pulp sales may be sold in this way.

31
Derivative Instruments
The Company uses a variety of derivative financial instruments to reduce its exposure to risks associated with fluctuations in foreign exchange rates, lumber prices and energy costs. At June 30, 2008, the fair value of outstanding commodity and exchange contracts was $33.7 million. The fair value of these contracts was determined based on prevailing market rates for instruments with similar characteristics.
A gain of $26.0 million was recorded in the second quarter, which comprised realized gains on derivative financial instruments ($4.6 million), a change in the fair value of derivative financial instruments ($21.0 million) and the reclassification, from accumulated other comprehensive income, of unrealized gains ($0.4 million) on derivative instruments formerly designated as cash flow hedges that were exercised in the current period.
3 months ended June 30, 6 months ended June 30, (millions of dollars) 2008 2007 2008 2007
Natural gas $ 16.7 $ (8.9) $ 31.1 $ (4.1) Diesel 9.3 1.0 11.4 4.6 Foreign exchange (0.2) - (11.1) - Lumber futures 0.2 0.2 0.6 0.4 $ 26.0 $ (7.7) $ 32.0 $ 0.9
13. Capital Disclosures
The Company’s objectives when managing capital are to safeguard its assets and maintain a globally competitive cost structure while looking for growth opportunities to ensure the ability to continue as a going concern and provide adequate returns to shareholders. In addition, the Company works with all relevant stakeholders to ensure the safety of its operations and employees, meet and exceed all environmental regulations and enhance the communities in which it operates.
The Company’s capital is comprised of net debt and shareholders’ equity:
(millions of dollars) As at June 30, 2008
As at December 31, 2007
Total debt (including operating bank loans) $ 501.7 $ 496.8
Less cash and cash equivalents (297.6) (295.5)
Net debt 204.1 201.3
Total shareholders’ equity 1,770.3 1,817.1
$ 1,974.4 $ 2,018.4
For the three and six months ended June 30, 2008 the Company remained in compliance with all capital requirements and covenants related to its debt facilities.
14. Subsequent Event
On April 11, 2008, the Company signed an agreement with the Vancouver Fraser Port Authority (VFPA) for the sale of a property (“Sale Agreement”) located in New Westminster, British Columbia. The agreed sales consideration is $47.5 million, which will result in a pre-tax gain on disposal of substantially the same amount. The property was the site of the Company’s former Panel and Fibre mill, which closed down in December 2007. Related closure costs of $14.4 million were recorded in the fourth quarter of 2007.
Following the signing of the Sale Agreement, the Greater Vancouver Sewage and Drainage District (“Metro Vancouver”) filed an expropriation notice against title to the subject lands, which prevented the Company from transferring legal title to the purchaser on the closing of the Sale Agreement. The VFPA has commenced an action

32
against Metro Vancouver to remove the expropriation notice. In the event that the land is expropriated, under the Expropriation Act, Metro Vancouver is required to pay the Company fair value for the property.
The timing and ultimate outcome of this transaction is not determinable at this time and no amounts related to this transaction have been recorded in the second quarter of 2008.
15. Comparative Figures
Certain comparative information has been reclassified to conform to the presentation in the current period.


![64.2(1) WASTEWATERCONSTRUCTIONANDOPERATIONPERMITS · Ch64,p.2 EnvironmentalProtection[567] IAC11/18/20 d. Anychangeduringconstructionthatrequiresmaterialchangesintheapprovedplansand](https://img.pdfslide.net/doc/110x75/60b0d0aac4ebc0414e113388/6421-wastewaterconstructionandoperationpermits-ch64p2-environmentalprotection567.jpg)