Embed Size (px)
Citation preview
ARTICLE IN PRESS
Planetary and Space Science 57 (2009) 751–763
Contents lists available at ScienceDirect
Planetary and Space Science
0032-06
doi:10.1
� Corr
Aerospa
Kanagaw
E-m
journal homepage: www.elsevier.com/locate/pss
Capability of the penetrator seismometer system for lunar seismicevent observation
R. Yamada a,b,�, I. Yamada c, H. Shiraishi a, S. Tanaka a, Y. Takagi d, N. Kobayashi e, N. Takeuchi f,Y. Ishihara g, H. Murakami h, K. Yomogida i, J. Koyama i, A. Fujimura a, H. Mizutani a,j
a Institute of Space and Astronautical Science, Japan Aerospace Exploration Agency, 3-1-1 Yoshinodai, Sagamihara, Kanagawa 229-8510, Japanb Department of Earth and Planetary Science, University of Tokyo, Bunkyo-ku, Tokyo 113-0033, Japanc Research Center for Seismology, Volcanology and Disaster Mitigation, Nagoya University, Chikusa-ku, Nagoya, Aichi 464-8602, Japand Mitutoyo Corporation, Kawasaki, Kangawa 213-8533, Japane Department of Earth and Planetary Science, Tokyo Institute of Technology, Meguro-ku, Tokyo 152-8551, Japanf Earthquake Research Institute, University of Tokyo, Bunkyo-ku, Tokyo 113-0032, Japang Japan Agency for Marine-Earth Science and Technology, Yokohama, Kanagawa 236-0001, Japanh Department of Applied Science, Faculty of Science, Kochi University, Kochi 780-8520, Japani Department of Earth and Planetary Science, Hokkaido University, Sapporo, Hokkaido 060-0810, Japanj Newton Press Inc, Shinjuku-ku, Tokyo 163-0207, Japan
a r t i c l e i n f o
Article history:
Received 28 March 2008
Received in revised form
28 November 2008
Accepted 1 December 2008Available online 13 December 2008
Keywords:
Seismometer
Penetrator
Moonquake
Lunar exploration
Planetary seismology
33/$ - see front matter & 2008 Elsevier Ltd. A
016/j.pss.2008.12.004
esponding author at: Institute of Space and
ce Exploration Agency, Room 1558A, 3-1
a 229-8510, Japan. Tel.: +81042 7598200; fa
ail address: [email protected] (
a b s t r a c t
We developed a seismometer system for a hard landing ‘‘penetrator’’ probe in the course of the former
Japanese LUNAR-A project to deploy new seismic stations on the Moon. The penetrator seismometer
system (PSS) consists of two short-period sensor components, a two-axis gimbal mechanism for
orientation, and measurement electronics. To carry out seismic observations on the Moon using the
penetrator, the seismometer system has to function properly in a lunar environment after a hard landing
(impact acceleration of about 8000 G), and requires a signal-to-noise ratio to detect lunar seismic
events. We evaluated whether the PSS could satisfactorily observe seismic events on the Moon by
investigating the frequency response, noise level, and response to ground motion of our instrument in a
simulated lunar environment after a simulated impact test. Our results indicate that the newly
developed seismometer system can function properly after impact and is sensitive enough to detect
seismic events on the Moon. Using this PSS, new seismic data from the Moon can be obtained during
future lunar missions.
& 2008 Elsevier Ltd. All rights reserved.
1. Introduction
During the Apollo lunar landing missions (1969–1972), apassive seismic network consisting of four stations (Apollo 12,14, 15, and 16) was constructed on the nearside of the Moon toinvestigate lunar seismicity. The network observation continueduntil 1977, and provided us with information about several typesof seismic events (deep moonquakes, shallow moonquakes,thermal moonquakes, and meteoroid impacts) and their uniquecharacteristics, as well as the internal structure of the Moon(Latham et al., 1973; Toksoz et al., 1974; Lammlein, 1977; Goinset al., 1979; Nakamura et al., 1982; Khan and Mosegaard, 2002;Lognonne et al., 2003; Gagnepain-Beyneix et al., 2006). However,
ll rights reserved.
Astronautical Science, Japan
-1 Yoshinodai, Sagamihara,
x: +81042 7598516.
R. Yamada).
we still need a better understanding of the physical mechanismsof moonquakes and the structure and composition of the deepinterior of the Moon, since the Apollo data were limited by thesmall number of stations and their regional locations on thenearside. We require more lunar seismic data from a globalseismic network to obtain further information about the wholeinterior of the Moon, especially the core.
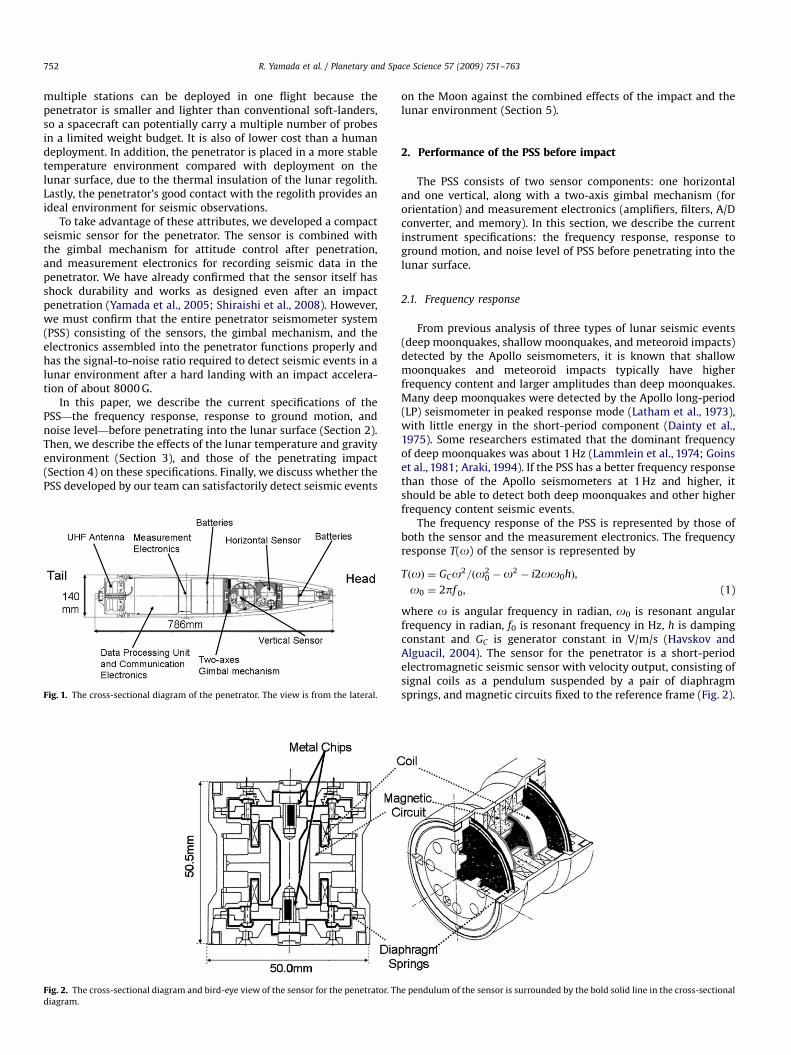
We developed a hard landing ‘‘penetrator’’ probe in the courseof the former Japanese LUNAR-A project (Mizutani et al., 2000,2003) to deploy new seismic stations on the Moon. The cross-sectional diagram of the LUNAR-A penetrator is shown in Fig. 1.The penetrator was designed to be deployed into the lunarregolith at a depth of 1–3 m by free fall from a spacecraft orbitingaround the Moon. Hence instruments in the penetrator need to beable to survive the high-speed impact (impact acceleration ofabout 8000 G) (Mizutani et al., 1999). The penetrator has notableadvantages over other types of probes (installed by a soft-landeror by astronauts) in constructing a global geophysical networkon the Moon. The principal advantage of the penetrator is that
ARTICLE IN PRESS
R. Yamada et al. / Planetary and Space Science 57 (2009) 751–763752
multiple stations can be deployed in one flight because thepenetrator is smaller and lighter than conventional soft-landers,so a spacecraft can potentially carry a multiple number of probesin a limited weight budget. It is also of lower cost than a humandeployment. In addition, the penetrator is placed in a more stabletemperature environment compared with deployment on thelunar surface, due to the thermal insulation of the lunar regolith.Lastly, the penetrator’s good contact with the regolith provides anideal environment for seismic observations.
To take advantage of these attributes, we developed a compactseismic sensor for the penetrator. The sensor is combined withthe gimbal mechanism for attitude control after penetration,and measurement electronics for recording seismic data in thepenetrator. We have already confirmed that the sensor itself hasshock durability and works as designed even after an impactpenetration (Yamada et al., 2005; Shiraishi et al., 2008). However,we must confirm that the entire penetrator seismometer system(PSS) consisting of the sensors, the gimbal mechanism, and theelectronics assembled into the penetrator functions properly andhas the signal-to-noise ratio required to detect seismic events in alunar environment after a hard landing with an impact accelera-tion of about 8000 G.
In this paper, we describe the current specifications of thePSS—the frequency response, response to ground motion, andnoise level—before penetrating into the lunar surface (Section 2).Then, we describe the effects of the lunar temperature and gravityenvironment (Section 3), and those of the penetrating impact(Section 4) on these specifications. Finally, we discuss whether thePSS developed by our team can satisfactorily detect seismic events
Fig. 1. The cross-sectional diagram of the penetrator. The view is from the lateral.
Fig. 2. The cross-sectional diagram and bird-eye view of the sensor for the penetrator. Th
diagram.
on the Moon against the combined effects of the impact and thelunar environment (Section 5).
2. Performance of the PSS before impact
The PSS consists of two sensor components: one horizontaland one vertical, along with a two-axis gimbal mechanism (fororientation) and measurement electronics (amplifiers, filters, A/Dconverter, and memory). In this section, we describe the currentinstrument specifications: the frequency response, response toground motion, and noise level of PSS before penetrating into thelunar surface.
2.1. Frequency response
From previous analysis of three types of lunar seismic events(deep moonquakes, shallow moonquakes, and meteoroid impacts)detected by the Apollo seismometers, it is known that shallowmoonquakes and meteoroid impacts typically have higherfrequency content and larger amplitudes than deep moonquakes.Many deep moonquakes were detected by the Apollo long-period(LP) seismometer in peaked response mode (Latham et al., 1973),with little energy in the short-period component (Dainty et al.,1975). Some researchers estimated that the dominant frequencyof deep moonquakes was about 1 Hz (Lammlein et al., 1974; Goinset al., 1981; Araki, 1994). If the PSS has a better frequency responsethan those of the Apollo seismometers at 1 Hz and higher, itshould be able to detect both deep moonquakes and other higherfrequency content seismic events.
The frequency response of the PSS is represented by those ofboth the sensor and the measurement electronics. The frequencyresponse T(o) of the sensor is represented by
TðoÞ ¼ GCo2=ðo20 �o
2 � i2oo0hÞ,
o0 ¼ 2pf 0, (1)
where o is angular frequency in radian, o0 is resonant angularfrequency in radian, f0 is resonant frequency in Hz, h is dampingconstant and GC is generator constant in V/m/s (Havskov andAlguacil, 2004). The sensor for the penetrator is a short-periodelectromagnetic seismic sensor with velocity output, consisting ofsignal coils as a pendulum suspended by a pair of diaphragmsprings, and magnetic circuits fixed to the reference frame (Fig. 2).
e pendulum of the sensor is surrounded by the bold solid line in the cross-sectional
ARTICLE IN PRESS
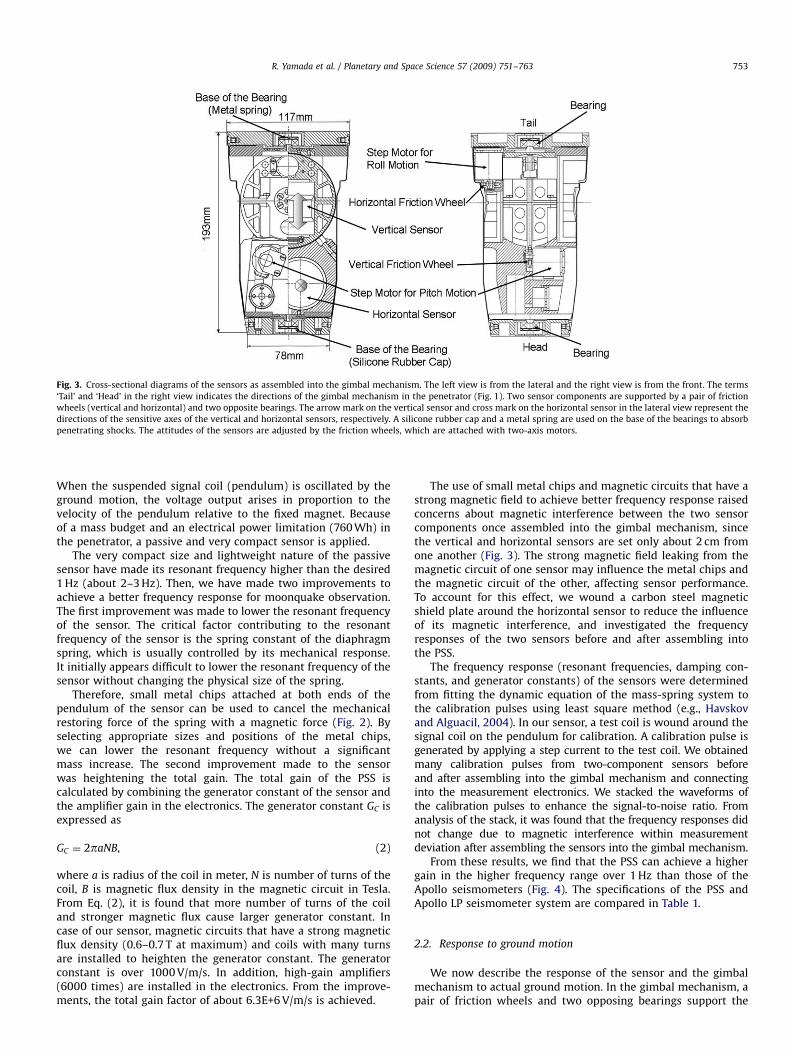
Fig. 3. Cross-sectional diagrams of the sensors as assembled into the gimbal mechanism. The left view is from the lateral and the right view is from the front. The terms
‘Tail’ and ‘Head’ in the right view indicates the directions of the gimbal mechanism in the penetrator (Fig. 1). Two sensor components are supported by a pair of friction
wheels (vertical and horizontal) and two opposite bearings. The arrow mark on the vertical sensor and cross mark on the horizontal sensor in the lateral view represent the
directions of the sensitive axes of the vertical and horizontal sensors, respectively. A silicone rubber cap and a metal spring are used on the base of the bearings to absorb
penetrating shocks. The attitudes of the sensors are adjusted by the friction wheels, which are attached with two-axis motors.
R. Yamada et al. / Planetary and Space Science 57 (2009) 751–763 753
When the suspended signal coil (pendulum) is oscillated by theground motion, the voltage output arises in proportion to thevelocity of the pendulum relative to the fixed magnet. Becauseof a mass budget and an electrical power limitation (760 Wh) inthe penetrator, a passive and very compact sensor is applied.
The very compact size and lightweight nature of the passivesensor have made its resonant frequency higher than the desired1 Hz (about 2–3 Hz). Then, we have made two improvements toachieve a better frequency response for moonquake observation.The first improvement was made to lower the resonant frequencyof the sensor. The critical factor contributing to the resonantfrequency of the sensor is the spring constant of the diaphragmspring, which is usually controlled by its mechanical response.It initially appears difficult to lower the resonant frequency of thesensor without changing the physical size of the spring.
Therefore, small metal chips attached at both ends of thependulum of the sensor can be used to cancel the mechanicalrestoring force of the spring with a magnetic force (Fig. 2). Byselecting appropriate sizes and positions of the metal chips,we can lower the resonant frequency without a significantmass increase. The second improvement made to the sensorwas heightening the total gain. The total gain of the PSS iscalculated by combining the generator constant of the sensor andthe amplifier gain in the electronics. The generator constant GC isexpressed as
GC ¼ 2paNB, (2)
where a is radius of the coil in meter, N is number of turns of thecoil, B is magnetic flux density in the magnetic circuit in Tesla.From Eq. (2), it is found that more number of turns of the coiland stronger magnetic flux cause larger generator constant. Incase of our sensor, magnetic circuits that have a strong magneticflux density (0.6–0.7 T at maximum) and coils with many turnsare installed to heighten the generator constant. The generatorconstant is over 1000 V/m/s. In addition, high-gain amplifiers(6000 times) are installed in the electronics. From the improve-ments, the total gain factor of about 6.3E+6 V/m/s is achieved.
The use of small metal chips and magnetic circuits that have astrong magnetic field to achieve better frequency response raisedconcerns about magnetic interference between the two sensorcomponents once assembled into the gimbal mechanism, sincethe vertical and horizontal sensors are set only about 2 cm fromone another (Fig. 3). The strong magnetic field leaking from themagnetic circuit of one sensor may influence the metal chips andthe magnetic circuit of the other, affecting sensor performance.To account for this effect, we wound a carbon steel magneticshield plate around the horizontal sensor to reduce the influenceof its magnetic interference, and investigated the frequencyresponses of the two sensors before and after assembling intothe PSS.
The frequency response (resonant frequencies, damping con-stants, and generator constants) of the sensors were determinedfrom fitting the dynamic equation of the mass-spring system tothe calibration pulses using least square method (e.g., Havskovand Alguacil, 2004). In our sensor, a test coil is wound around thesignal coil on the pendulum for calibration. A calibration pulse isgenerated by applying a step current to the test coil. We obtainedmany calibration pulses from two-component sensors beforeand after assembling into the gimbal mechanism and connectinginto the measurement electronics. We stacked the waveforms ofthe calibration pulses to enhance the signal-to-noise ratio. Fromanalysis of the stack, it was found that the frequency responses didnot change due to magnetic interference within measurementdeviation after assembling the sensors into the gimbal mechanism.
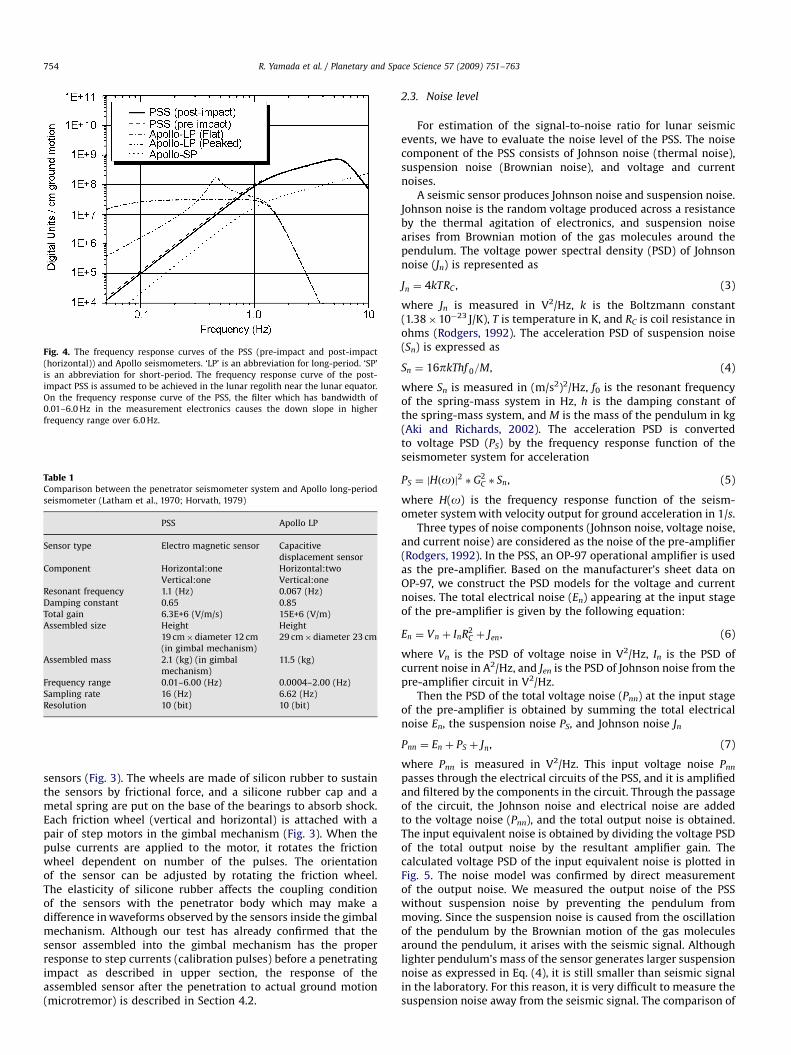
From these results, we find that the PSS can achieve a highergain in the higher frequency range over 1 Hz than those of theApollo seismometers (Fig. 4). The specifications of the PSS andApollo LP seismometer system are compared in Table 1.
2.2. Response to ground motion
We now describe the response of the sensor and the gimbalmechanism to actual ground motion. In the gimbal mechanism, apair of friction wheels and two opposing bearings support the
ARTICLE IN PRESS
Fig. 4. The frequency response curves of the PSS (pre-impact and post-impact
(horizontal)) and Apollo seismometers. ‘LP’ is an abbreviation for long-period. ‘SP’
is an abbreviation for short-period. The frequency response curve of the post-
impact PSS is assumed to be achieved in the lunar regolith near the lunar equator.
On the frequency response curve of the PSS, the filter which has bandwidth of
0.01–6.0 Hz in the measurement electronics causes the down slope in higher
frequency range over 6.0 Hz.
Table 1Comparison between the penetrator seismometer system and Apollo long-period
seismometer (Latham et al., 1970; Horvath, 1979)
PSS Apollo LP
Sensor type Electro magnetic sensor Capacitive
displacement sensor
Component Horizontal:one
Vertical:one
Horizontal:two
Vertical:one
Resonant frequency 1.1 (Hz) 0.067 (Hz)
Damping constant 0.65 0.85
Total gain 6.3E+6 (V/m/s) 15E+6 (V/m)
Assembled size Height
19 cm�diameter 12 cm
(in gimbal mechanism)
Height
29 cm�diameter 23 cm
Assembled mass 2.1 (kg) (in gimbal
mechanism)
11.5 (kg)
Frequency range 0.01–6.00 (Hz) 0.0004–2.00 (Hz)
Sampling rate 16 (Hz) 6.62 (Hz)
Resolution 10 (bit) 10 (bit)
R. Yamada et al. / Planetary and Space Science 57 (2009) 751–763754
sensors (Fig. 3). The wheels are made of silicon rubber to sustainthe sensors by frictional force, and a silicone rubber cap and ametal spring are put on the base of the bearings to absorb shock.Each friction wheel (vertical and horizontal) is attached with apair of step motors in the gimbal mechanism (Fig. 3). When thepulse currents are applied to the motor, it rotates the frictionwheel dependent on number of the pulses. The orientationof the sensor can be adjusted by rotating the friction wheel.The elasticity of silicone rubber affects the coupling conditionof the sensors with the penetrator body which may make adifference in waveforms observed by the sensors inside the gimbalmechanism. Although our test has already confirmed that thesensor assembled into the gimbal mechanism has the properresponse to step currents (calibration pulses) before a penetratingimpact as described in upper section, the response of theassembled sensor after the penetration to actual ground motion(microtremor) is described in Section 4.2.
2.3. Noise level
For estimation of the signal-to-noise ratio for lunar seismicevents, we have to evaluate the noise level of the PSS. The noisecomponent of the PSS consists of Johnson noise (thermal noise),suspension noise (Brownian noise), and voltage and currentnoises.
A seismic sensor produces Johnson noise and suspension noise.Johnson noise is the random voltage produced across a resistanceby the thermal agitation of electronics, and suspension noisearises from Brownian motion of the gas molecules around thependulum. The voltage power spectral density (PSD) of Johnsonnoise (Jn) is represented as
Jn ¼ 4kTRC , (3)
where Jn is measured in V2/Hz, k is the Boltzmann constant(1.38�10�23 J/K), T is temperature in K, and RC is coil resistance inohms (Rodgers, 1992). The acceleration PSD of suspension noise(Sn) is expressed as
Sn ¼ 16pkThf 0=M, (4)
where Sn is measured in (m/s2)2/Hz, f0 is the resonant frequencyof the spring-mass system in Hz, h is the damping constant ofthe spring-mass system, and M is the mass of the pendulum in kg(Aki and Richards, 2002). The acceleration PSD is convertedto voltage PSD (PS) by the frequency response function of theseismometer system for acceleration
PS ¼ jHðoÞj2 � G2C � Sn, (5)
where H(o) is the frequency response function of the seism-ometer system with velocity output for ground acceleration in 1/s.
Three types of noise components (Johnson noise, voltage noise,and current noise) are considered as the noise of the pre-amplifier(Rodgers, 1992). In the PSS, an OP-97 operational amplifier is usedas the pre-amplifier. Based on the manufacturer’s sheet data onOP-97, we construct the PSD models for the voltage and currentnoises. The total electrical noise (En) appearing at the input stageof the pre-amplifier is given by the following equation:
En ¼ Vn þ InR2C þ Jen, (6)
where Vn is the PSD of voltage noise in V2/Hz, In is the PSD ofcurrent noise in A2/Hz, and Jen is the PSD of Johnson noise from thepre-amplifier circuit in V2/Hz.
Then the PSD of the total voltage noise (Pnn) at the input stageof the pre-amplifier is obtained by summing the total electricalnoise En, the suspension noise PS, and Johnson noise Jn
Pnn ¼ En þ PS þ Jn, (7)
where Pnn is measured in V2/Hz. This input voltage noise Pnn
passes through the electrical circuits of the PSS, and it is amplifiedand filtered by the components in the circuit. Through the passageof the circuit, the Johnson noise and electrical noise are addedto the voltage noise (Pnn), and the total output noise is obtained.The input equivalent noise is obtained by dividing the voltage PSDof the total output noise by the resultant amplifier gain. Thecalculated voltage PSD of the input equivalent noise is plotted inFig. 5. The noise model was confirmed by direct measurementof the output noise. We measured the output noise of the PSSwithout suspension noise by preventing the pendulum frommoving. Since the suspension noise is caused from the oscillationof the pendulum by the Brownian motion of the gas moleculesaround the pendulum, it arises with the seismic signal. Althoughlighter pendulum’s mass of the sensor generates larger suspensionnoise as expressed in Eq. (4), it is still smaller than seismic signalin the laboratory. For this reason, it is very difficult to measure thesuspension noise away from the seismic signal. The comparison of
ARTICLE IN PRESS
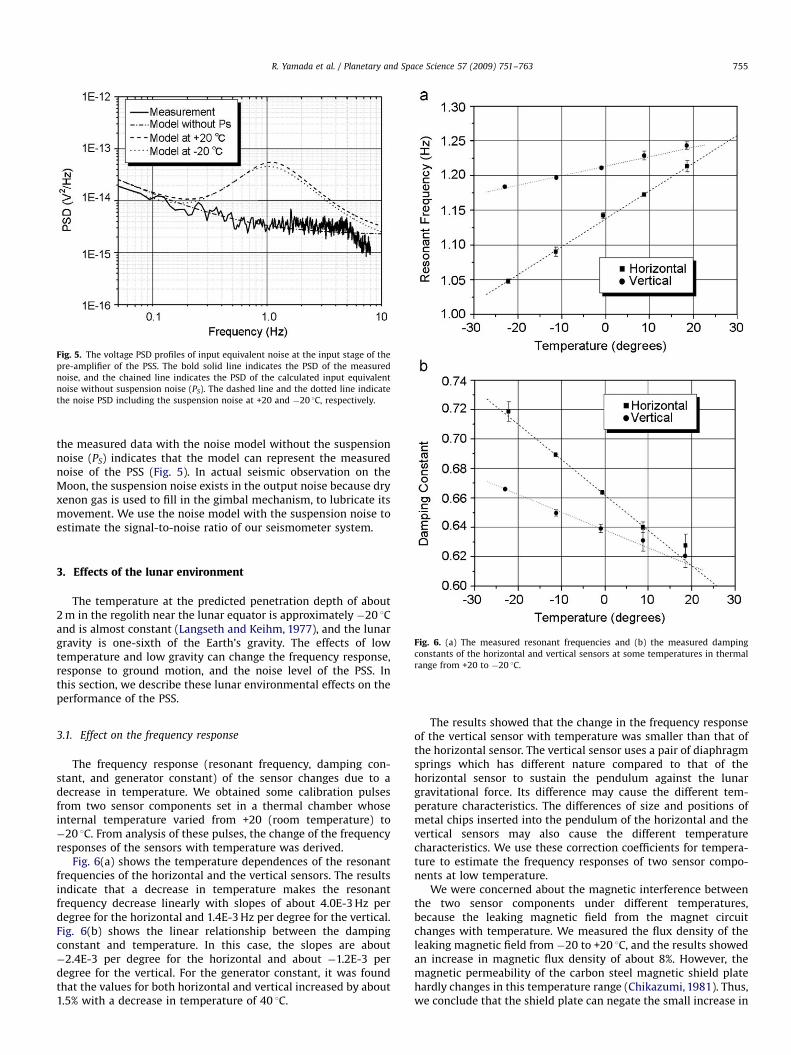
Fig. 5. The voltage PSD profiles of input equivalent noise at the input stage of the
pre-amplifier of the PSS. The bold solid line indicates the PSD of the measured
noise, and the chained line indicates the PSD of the calculated input equivalent
noise without suspension noise (PS). The dashed line and the dotted line indicate
the noise PSD including the suspension noise at +20 and �20 1C, respectively.
R. Yamada et al. / Planetary and Space Science 57 (2009) 751–763 755
the measured data with the noise model without the suspensionnoise (PS) indicates that the model can represent the measurednoise of the PSS (Fig. 5). In actual seismic observation on theMoon, the suspension noise exists in the output noise because dryxenon gas is used to fill in the gimbal mechanism, to lubricate itsmovement. We use the noise model with the suspension noise toestimate the signal-to-noise ratio of our seismometer system.
Fig. 6. (a) The measured resonant frequencies and (b) the measured damping
constants of the horizontal and vertical sensors at some temperatures in thermal
range from +20 to �20 1C.
3. Effects of the lunar environment
The temperature at the predicted penetration depth of about2 m in the regolith near the lunar equator is approximately �20 1Cand is almost constant (Langseth and Keihm, 1977), and the lunargravity is one-sixth of the Earth’s gravity. The effects of lowtemperature and low gravity can change the frequency response,response to ground motion, and the noise level of the PSS. Inthis section, we describe these lunar environmental effects on theperformance of the PSS.
3.1. Effect on the frequency response
The frequency response (resonant frequency, damping con-stant, and generator constant) of the sensor changes due to adecrease in temperature. We obtained some calibration pulsesfrom two sensor components set in a thermal chamber whoseinternal temperature varied from +20 (room temperature) to�20 1C. From analysis of these pulses, the change of the frequencyresponses of the sensors with temperature was derived.
Fig. 6(a) shows the temperature dependences of the resonantfrequencies of the horizontal and the vertical sensors. The resultsindicate that a decrease in temperature makes the resonantfrequency decrease linearly with slopes of about 4.0E-3 Hz perdegree for the horizontal and 1.4E-3 Hz per degree for the vertical.Fig. 6(b) shows the linear relationship between the dampingconstant and temperature. In this case, the slopes are about�2.4E-3 per degree for the horizontal and about �1.2E-3 perdegree for the vertical. For the generator constant, it was foundthat the values for both horizontal and vertical increased by about1.5% with a decrease in temperature of 40 1C.
The results showed that the change in the frequency responseof the vertical sensor with temperature was smaller than that ofthe horizontal sensor. The vertical sensor uses a pair of diaphragmsprings which has different nature compared to that of thehorizontal sensor to sustain the pendulum against the lunargravitational force. Its difference may cause the different tem-perature characteristics. The differences of size and positions ofmetal chips inserted into the pendulum of the horizontal and thevertical sensors may also cause the different temperaturecharacteristics. We use these correction coefficients for tempera-ture to estimate the frequency responses of two sensor compo-nents at low temperature.
We were concerned about the magnetic interference betweenthe two sensor components under different temperatures,because the leaking magnetic field from the magnet circuitchanges with temperature. We measured the flux density of theleaking magnetic field from �20 to +20 1C, and the results showedan increase in magnetic flux density of about 8%. However, themagnetic permeability of the carbon steel magnetic shield platehardly changes in this temperature range (Chikazumi, 1981). Thus,we conclude that the shield plate can negate the small increase in
ARTICLE IN PRESS
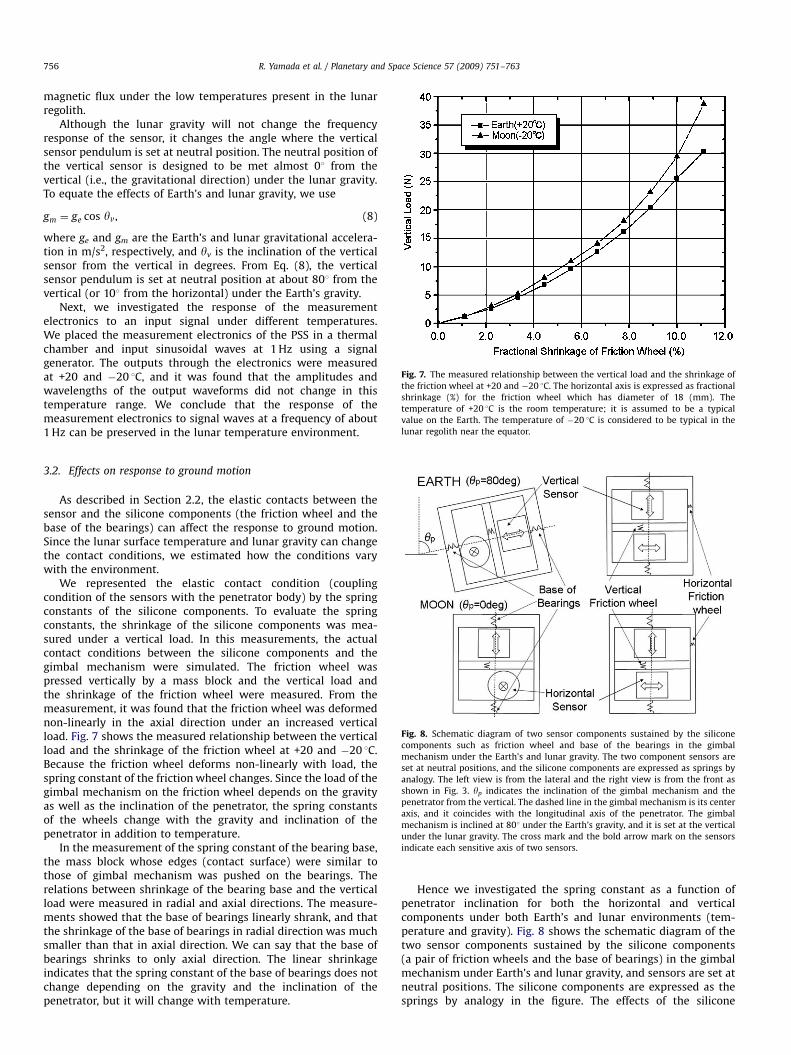
Fig. 7. The measured relationship between the vertical load and the shrinkage of
the friction wheel at +20 and �20 1C. The horizontal axis is expressed as fractional
shrinkage (%) for the friction wheel which has diameter of 18 (mm). The
temperature of +20 1C is the room temperature; it is assumed to be a typical
value on the Earth. The temperature of �20 1C is considered to be typical in the
lunar regolith near the equator.
R. Yamada et al. / Planetary and Space Science 57 (2009) 751–763756
magnetic flux under the low temperatures present in the lunarregolith.
Although the lunar gravity will not change the frequencyresponse of the sensor, it changes the angle where the verticalsensor pendulum is set at neutral position. The neutral position ofthe vertical sensor is designed to be met almost 01 from thevertical (i.e., the gravitational direction) under the lunar gravity.To equate the effects of Earth’s and lunar gravity, we use
gm ¼ ge cos yv, (8)
where ge and gm are the Earth’s and lunar gravitational accelera-tion in m/s2, respectively, and yv is the inclination of the verticalsensor from the vertical in degrees. From Eq. (8), the verticalsensor pendulum is set at neutral position at about 801 from thevertical (or 101 from the horizontal) under the Earth’s gravity.
Next, we investigated the response of the measurementelectronics to an input signal under different temperatures.We placed the measurement electronics of the PSS in a thermalchamber and input sinusoidal waves at 1 Hz using a signalgenerator. The outputs through the electronics were measuredat +20 and �20 1C, and it was found that the amplitudes andwavelengths of the output waveforms did not change in thistemperature range. We conclude that the response of themeasurement electronics to signal waves at a frequency of about1 Hz can be preserved in the lunar temperature environment.
Fig. 8. Schematic diagram of two sensor components sustained by the silicone
components such as friction wheel and base of the bearings in the gimbal
mechanism under the Earth’s and lunar gravity. The two component sensors are
set at neutral positions, and the silicone components are expressed as springs by
analogy. The left view is from the lateral and the right view is from the front as
shown in Fig. 3. yp indicates the inclination of the gimbal mechanism and the
penetrator from the vertical. The dashed line in the gimbal mechanism is its center
axis, and it coincides with the longitudinal axis of the penetrator. The gimbal
mechanism is inclined at 801 under the Earth’s gravity, and it is set at the vertical
under the lunar gravity. The cross mark and the bold arrow mark on the sensors
indicate each sensitive axis of two sensors.
3.2. Effects on response to ground motion
As described in Section 2.2, the elastic contacts between thesensor and the silicone components (the friction wheel and thebase of the bearings) can affect the response to ground motion.Since the lunar surface temperature and lunar gravity can changethe contact conditions, we estimated how the conditions varywith the environment.
We represented the elastic contact condition (couplingcondition of the sensors with the penetrator body) by the springconstants of the silicone components. To evaluate the springconstants, the shrinkage of the silicone components was mea-sured under a vertical load. In this measurements, the actualcontact conditions between the silicone components and thegimbal mechanism were simulated. The friction wheel waspressed vertically by a mass block and the vertical load andthe shrinkage of the friction wheel were measured. From themeasurement, it was found that the friction wheel was deformednon-linearly in the axial direction under an increased verticalload. Fig. 7 shows the measured relationship between the verticalload and the shrinkage of the friction wheel at +20 and �20 1C.Because the friction wheel deforms non-linearly with load, thespring constant of the friction wheel changes. Since the load of thegimbal mechanism on the friction wheel depends on the gravityas well as the inclination of the penetrator, the spring constantsof the wheels change with the gravity and inclination of thepenetrator in addition to temperature.
In the measurement of the spring constant of the bearing base,the mass block whose edges (contact surface) were similar tothose of gimbal mechanism was pushed on the bearings. Therelations between shrinkage of the bearing base and the verticalload were measured in radial and axial directions. The measure-ments showed that the base of bearings linearly shrank, and thatthe shrinkage of the base of bearings in radial direction was muchsmaller than that in axial direction. We can say that the base ofbearings shrinks to only axial direction. The linear shrinkageindicates that the spring constant of the base of bearings does notchange depending on the gravity and the inclination of thepenetrator, but it will change with temperature.
Hence we investigated the spring constant as a function ofpenetrator inclination for both the horizontal and verticalcomponents under both Earth’s and lunar environments (tem-perature and gravity). Fig. 8 shows the schematic diagram of thetwo sensor components sustained by the silicone components(a pair of friction wheels and the base of bearings) in the gimbalmechanism under Earth’s and lunar gravity, and sensors are set atneutral positions. The silicone components are expressed as thesprings by analogy in the figure. The effects of the silicone
ARTICLE IN PRESS
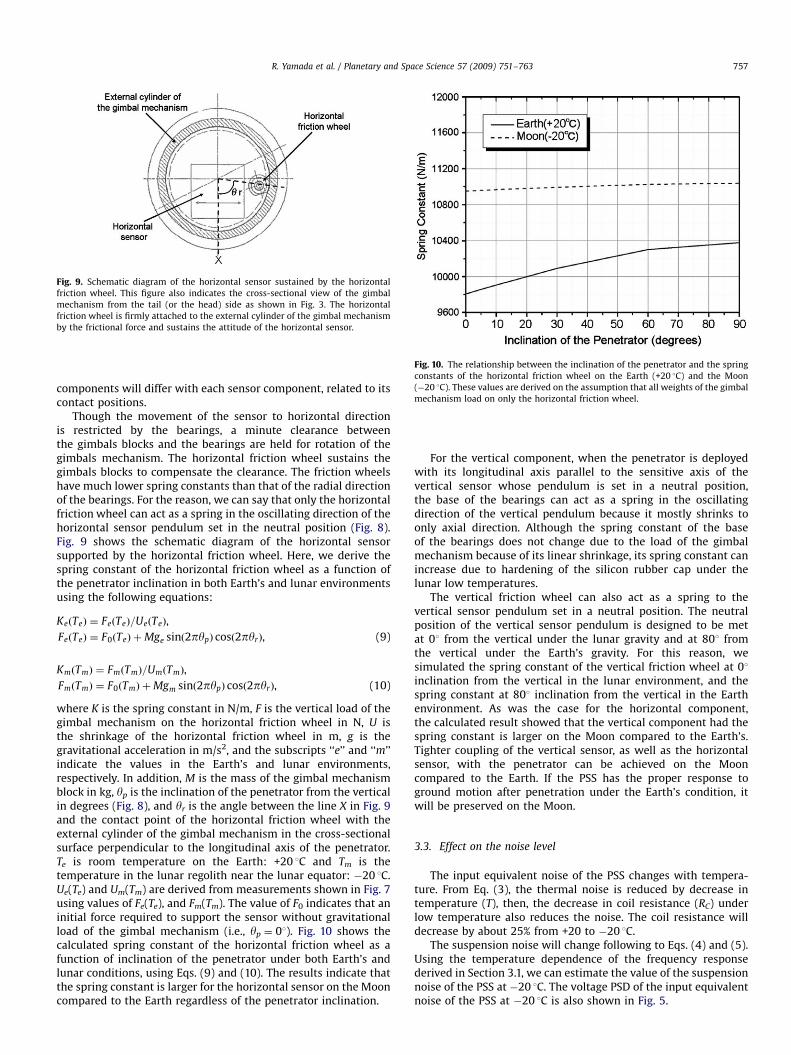
Fig. 9. Schematic diagram of the horizontal sensor sustained by the horizontal
friction wheel. This figure also indicates the cross-sectional view of the gimbal
mechanism from the tail (or the head) side as shown in Fig. 3. The horizontal
friction wheel is firmly attached to the external cylinder of the gimbal mechanism
by the frictional force and sustains the attitude of the horizontal sensor.
Fig. 10. The relationship between the inclination of the penetrator and the spring
constants of the horizontal friction wheel on the Earth (+20 1C) and the Moon
(�20 1C). These values are derived on the assumption that all weights of the gimbal
mechanism load on only the horizontal friction wheel.
R. Yamada et al. / Planetary and Space Science 57 (2009) 751–763 757
components will differ with each sensor component, related to itscontact positions.
Though the movement of the sensor to horizontal directionis restricted by the bearings, a minute clearance betweenthe gimbals blocks and the bearings are held for rotation of thegimbals mechanism. The horizontal friction wheel sustains thegimbals blocks to compensate the clearance. The friction wheelshave much lower spring constants than that of the radial directionof the bearings. For the reason, we can say that only the horizontalfriction wheel can act as a spring in the oscillating direction of thehorizontal sensor pendulum set in the neutral position (Fig. 8).Fig. 9 shows the schematic diagram of the horizontal sensorsupported by the horizontal friction wheel. Here, we derive thespring constant of the horizontal friction wheel as a function ofthe penetrator inclination in both Earth’s and lunar environmentsusing the following equations:
KeðTeÞ ¼ FeðTeÞ=UeðTeÞ,
FeðTeÞ ¼ F0ðTeÞ þMge sinð2pypÞ cosð2pyrÞ, (9)
KmðTmÞ ¼ FmðTmÞ=UmðTmÞ,
FmðTmÞ ¼ F0ðTmÞ þMgm sinð2pypÞ cosð2pyrÞ, (10)
where K is the spring constant in N/m, F is the vertical load of thegimbal mechanism on the horizontal friction wheel in N, U isthe shrinkage of the horizontal friction wheel in m, g is thegravitational acceleration in m/s2, and the subscripts ‘‘e’’ and ‘‘m’’indicate the values in the Earth’s and lunar environments,respectively. In addition, M is the mass of the gimbal mechanismblock in kg, yp is the inclination of the penetrator from the verticalin degrees (Fig. 8), and yr is the angle between the line X in Fig. 9and the contact point of the horizontal friction wheel with theexternal cylinder of the gimbal mechanism in the cross-sectionalsurface perpendicular to the longitudinal axis of the penetrator.Te is room temperature on the Earth: +20 1C and Tm is thetemperature in the lunar regolith near the lunar equator: �20 1C.Ue(Te) and Um(Tm) are derived from measurements shown in Fig. 7using values of Fe(Te), and Fm(Tm). The value of F0 indicates that aninitial force required to support the sensor without gravitationalload of the gimbal mechanism (i.e., yp ¼ 01). Fig. 10 shows thecalculated spring constant of the horizontal friction wheel as afunction of inclination of the penetrator under both Earth’s andlunar conditions, using Eqs. (9) and (10). The results indicate thatthe spring constant is larger for the horizontal sensor on the Mooncompared to the Earth regardless of the penetrator inclination.
For the vertical component, when the penetrator is deployedwith its longitudinal axis parallel to the sensitive axis of thevertical sensor whose pendulum is set in a neutral position,the base of the bearings can act as a spring in the oscillatingdirection of the vertical pendulum because it mostly shrinks toonly axial direction. Although the spring constant of the baseof the bearings does not change due to the load of the gimbalmechanism because of its linear shrinkage, its spring constant canincrease due to hardening of the silicon rubber cap under thelunar low temperatures.
The vertical friction wheel can also act as a spring to thevertical sensor pendulum set in a neutral position. The neutralposition of the vertical sensor pendulum is designed to be metat 01 from the vertical under the lunar gravity and at 801 fromthe vertical under the Earth’s gravity. For this reason, wesimulated the spring constant of the vertical friction wheel at 01inclination from the vertical in the lunar environment, and thespring constant at 801 inclination from the vertical in the Earthenvironment. As was the case for the horizontal component,the calculated result showed that the vertical component had thespring constant is larger on the Moon compared to the Earth’s.Tighter coupling of the vertical sensor, as well as the horizontalsensor, with the penetrator can be achieved on the Mooncompared to the Earth. If the PSS has the proper response toground motion after penetration under the Earth’s condition, itwill be preserved on the Moon.
3.3. Effect on the noise level
The input equivalent noise of the PSS changes with tempera-ture. From Eq. (3), the thermal noise is reduced by decrease intemperature (T), then, the decrease in coil resistance (RC) underlow temperature also reduces the noise. The coil resistance willdecrease by about 25% from +20 to �20 1C.
The suspension noise will change following to Eqs. (4) and (5).Using the temperature dependence of the frequency responsederived in Section 3.1, we can estimate the value of the suspensionnoise of the PSS at �20 1C. The voltage PSD of the input equivalentnoise of the PSS at �20 1C is also shown in Fig. 5.
ARTICLE IN PRESS
R. Yamada et al. / Planetary and Space Science 57 (2009) 751–763758
4. Effects of the penetrating impact
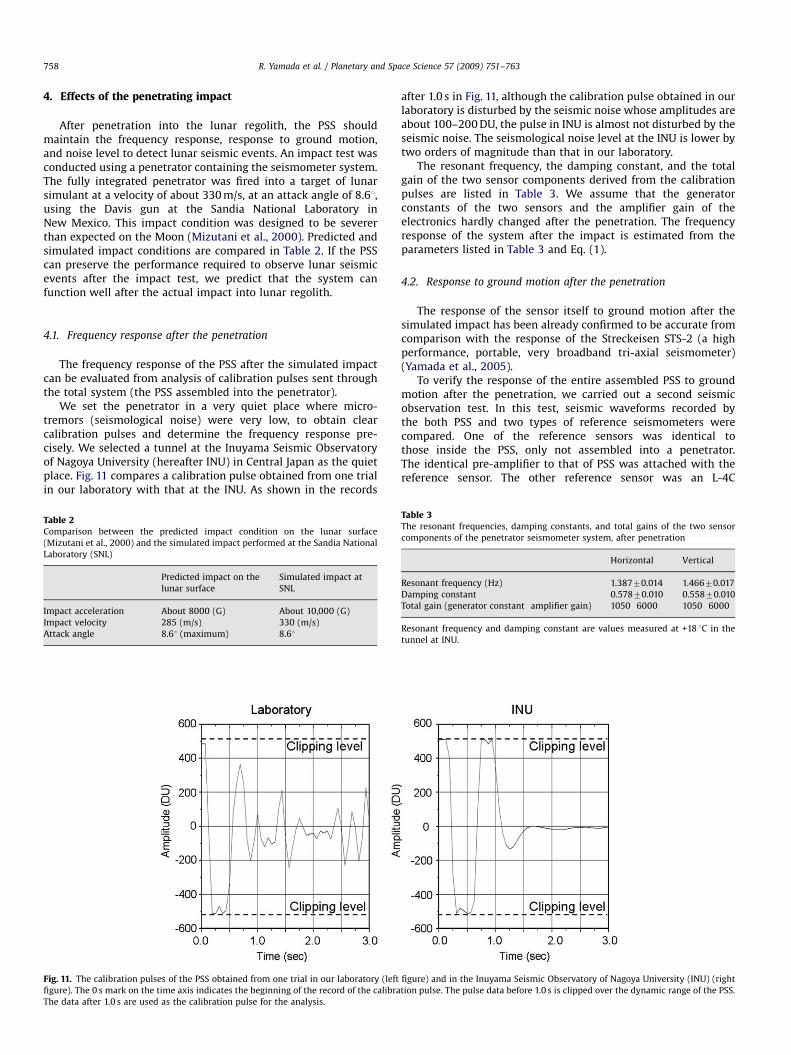
After penetration into the lunar regolith, the PSS shouldmaintain the frequency response, response to ground motion,and noise level to detect lunar seismic events. An impact test wasconducted using a penetrator containing the seismometer system.The fully integrated penetrator was fired into a target of lunarsimulant at a velocity of about 330 m/s, at an attack angle of 8.61,using the Davis gun at the Sandia National Laboratory inNew Mexico. This impact condition was designed to be severerthan expected on the Moon (Mizutani et al., 2000). Predicted andsimulated impact conditions are compared in Table 2. If the PSScan preserve the performance required to observe lunar seismicevents after the impact test, we predict that the system canfunction well after the actual impact into lunar regolith.
4.1. Frequency response after the penetration
The frequency response of the PSS after the simulated impactcan be evaluated from analysis of calibration pulses sent throughthe total system (the PSS assembled into the penetrator).
We set the penetrator in a very quiet place where micro-tremors (seismological noise) were very low, to obtain clearcalibration pulses and determine the frequency response pre-cisely. We selected a tunnel at the Inuyama Seismic Observatoryof Nagoya University (hereafter INU) in Central Japan as the quietplace. Fig. 11 compares a calibration pulse obtained from one trialin our laboratory with that at the INU. As shown in the records
Table 2Comparison between the predicted impact condition on the lunar surface
(Mizutani et al., 2000) and the simulated impact performed at the Sandia National
Laboratory (SNL)
Predicted impact on the
lunar surface
Simulated impact at
SNL
Impact acceleration About 8000 (G) About 10,000 (G)
Impact velocity 285 (m/s) 330 (m/s)
Attack angle 8.61 (maximum) 8.61
Fig. 11. The calibration pulses of the PSS obtained from one trial in our laboratory (left
figure). The 0 s mark on the time axis indicates the beginning of the record of the calibra
The data after 1.0 s are used as the calibration pulse for the analysis.
after 1.0 s in Fig. 11, although the calibration pulse obtained in ourlaboratory is disturbed by the seismic noise whose amplitudes areabout 100–200 DU, the pulse in INU is almost not disturbed by theseismic noise. The seismological noise level at the INU is lower bytwo orders of magnitude than that in our laboratory.
The resonant frequency, the damping constant, and the totalgain of the two sensor components derived from the calibrationpulses are listed in Table 3. We assume that the generatorconstants of the two sensors and the amplifier gain of theelectronics hardly changed after the penetration. The frequencyresponse of the system after the impact is estimated from theparameters listed in Table 3 and Eq. (1).
4.2. Response to ground motion after the penetration
The response of the sensor itself to ground motion after thesimulated impact has been already confirmed to be accurate fromcomparison with the response of the Streckeisen STS-2 (a highperformance, portable, very broadband tri-axial seismometer)(Yamada et al., 2005).
To verify the response of the entire assembled PSS to groundmotion after the penetration, we carried out a second seismicobservation test. In this test, seismic waveforms recorded bythe both PSS and two types of reference seismometers werecompared. One of the reference sensors was identical tothose inside the PSS, only not assembled into a penetrator.The identical pre-amplifier to that of PSS was attached with thereference sensor. The other reference sensor was an L-4C
figure) and in the Inuyama Seismic Observatory of Nagoya University (INU) (right
tion pulse. The pulse data before 1.0 s is clipped over the dynamic range of the PSS.
Table 3The resonant frequencies, damping constants, and total gains of the two sensor
components of the penetrator seismometer system, after penetration
Horizontal Vertical
Resonant frequency (Hz) 1.38770.014 1.46670.017
Damping constant 0.57870.010 0.55870.010
Total gain (generator constant�amplifier gain) 1050�6000 1050�6000
Resonant frequency and damping constant are values measured at +18 1C in the
tunnel at INU.
ARTICLE IN PRESS
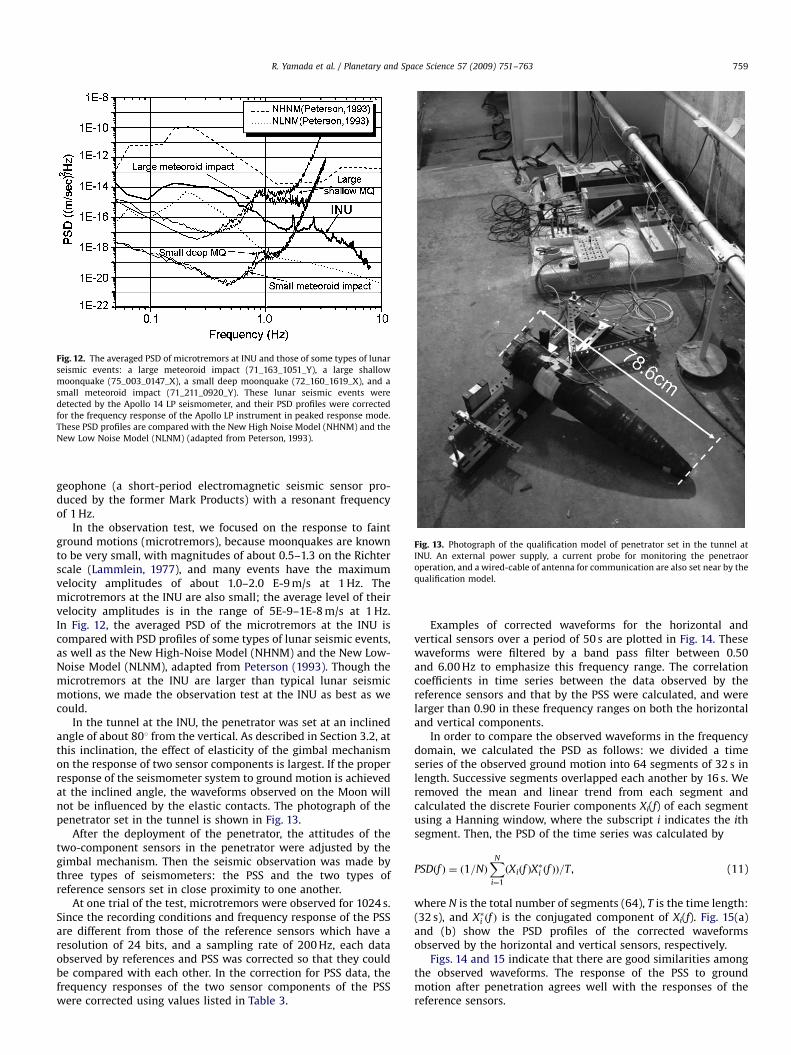
Fig. 12. The averaged PSD of microtremors at INU and those of some types of lunar
seismic events: a large meteoroid impact (71_163_1051_Y), a large shallow
moonquake (75_003_0147_X), a small deep moonquake (72_160_1619_X), and a
small meteoroid impact (71_211_0920_Y). These lunar seismic events were
detected by the Apollo 14 LP seismometer, and their PSD profiles were corrected
for the frequency response of the Apollo LP instrument in peaked response mode.
These PSD profiles are compared with the New High Noise Model (NHNM) and the
New Low Noise Model (NLNM) (adapted from Peterson, 1993).
Fig. 13. Photograph of the qualification model of penetrator set in the tunnel at
INU. An external power supply, a current probe for monitoring the penetraor
operation, and a wired-cable of antenna for communication are also set near by the
qualification model.
R. Yamada et al. / Planetary and Space Science 57 (2009) 751–763 759
geophone (a short-period electromagnetic seismic sensor pro-duced by the former Mark Products) with a resonant frequencyof 1 Hz.
In the observation test, we focused on the response to faintground motions (microtremors), because moonquakes are knownto be very small, with magnitudes of about 0.5–1.3 on the Richterscale (Lammlein, 1977), and many events have the maximumvelocity amplitudes of about 1.0–2.0 E-9 m/s at 1 Hz. Themicrotremors at the INU are also small; the average level of theirvelocity amplitudes is in the range of 5E-9–1E-8 m/s at 1 Hz.In Fig. 12, the averaged PSD of the microtremors at the INU iscompared with PSD profiles of some types of lunar seismic events,as well as the New High-Noise Model (NHNM) and the New Low-Noise Model (NLNM), adapted from Peterson (1993). Though themicrotremors at the INU are larger than typical lunar seismicmotions, we made the observation test at the INU as best as wecould.
In the tunnel at the INU, the penetrator was set at an inclinedangle of about 801 from the vertical. As described in Section 3.2, atthis inclination, the effect of elasticity of the gimbal mechanismon the response of two sensor components is largest. If the properresponse of the seismometer system to ground motion is achievedat the inclined angle, the waveforms observed on the Moon willnot be influenced by the elastic contacts. The photograph of thepenetrator set in the tunnel is shown in Fig. 13.
After the deployment of the penetrator, the attitudes of thetwo-component sensors in the penetrator were adjusted by thegimbal mechanism. Then the seismic observation was made bythree types of seismometers: the PSS and the two types ofreference sensors set in close proximity to one another.
At one trial of the test, microtremors were observed for 1024 s.Since the recording conditions and frequency response of the PSSare different from those of the reference sensors which have aresolution of 24 bits, and a sampling rate of 200 Hz, each dataobserved by references and PSS was corrected so that they couldbe compared with each other. In the correction for PSS data, thefrequency responses of the two sensor components of the PSSwere corrected using values listed in Table 3.
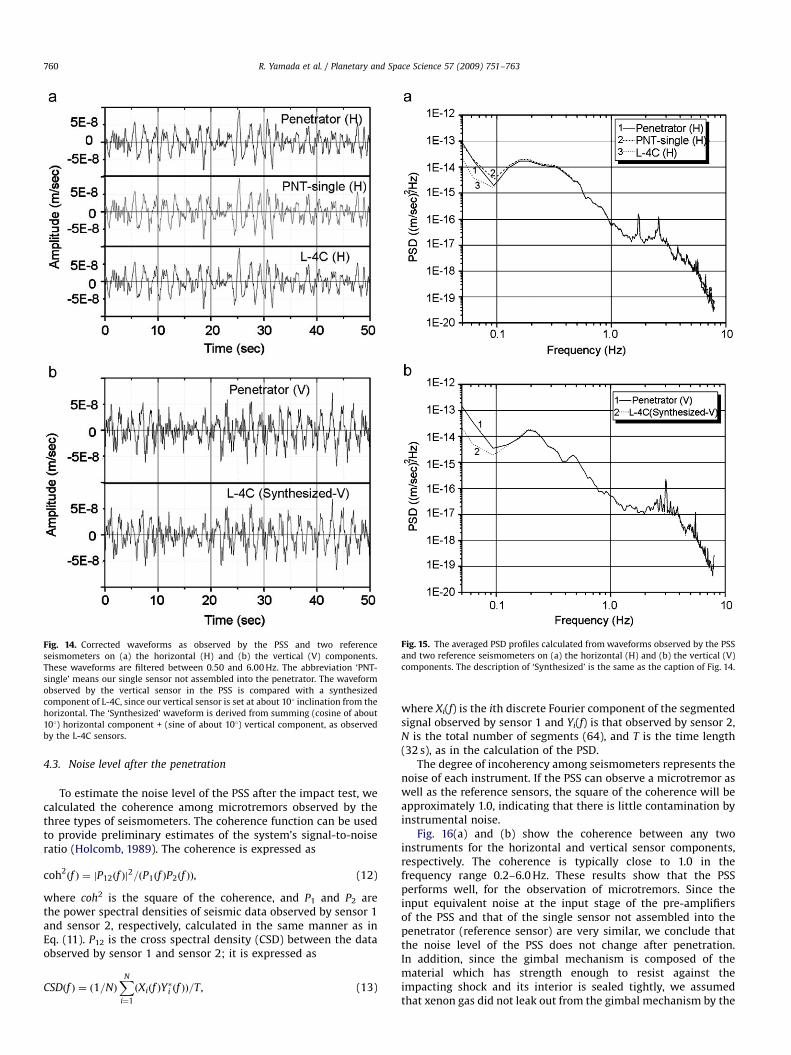
Examples of corrected waveforms for the horizontal andvertical sensors over a period of 50 s are plotted in Fig. 14. Thesewaveforms were filtered by a band pass filter between 0.50and 6.00 Hz to emphasize this frequency range. The correlationcoefficients in time series between the data observed by thereference sensors and that by the PSS were calculated, and werelarger than 0.90 in these frequency ranges on both the horizontaland vertical components.
In order to compare the observed waveforms in the frequencydomain, we calculated the PSD as follows: we divided a timeseries of the observed ground motion into 64 segments of 32 s inlength. Successive segments overlapped each another by 16 s. Weremoved the mean and linear trend from each segment andcalculated the discrete Fourier components Xi(f) of each segmentusing a Hanning window, where the subscript i indicates the ithsegment. Then, the PSD of the time series was calculated by
PSDðf Þ ¼ ð1=NÞXN
i¼1
ðXiðf ÞX�i ðf ÞÞ=T , (11)
where N is the total number of segments (64), T is the time length:(32 s), and X�i ðf Þ is the conjugated component of Xi(f). Fig. 15(a)and (b) show the PSD profiles of the corrected waveformsobserved by the horizontal and vertical sensors, respectively.
Figs. 14 and 15 indicate that there are good similarities amongthe observed waveforms. The response of the PSS to groundmotion after penetration agrees well with the responses of thereference sensors.
ARTICLE IN PRESS
Fig. 14. Corrected waveforms as observed by the PSS and two reference
seismometers on (a) the horizontal (H) and (b) the vertical (V) components.
These waveforms are filtered between 0.50 and 6.00 Hz. The abbreviation ‘PNT-
single’ means our single sensor not assembled into the penetrator. The waveform
observed by the vertical sensor in the PSS is compared with a synthesized
component of L-4C, since our vertical sensor is set at about 101 inclination from the
horizontal. The ‘Synthesized’ waveform is derived from summing (cosine of about
101) horizontal component + (sine of about 101) vertical component, as observed
by the L-4C sensors.
Fig. 15. The averaged PSD profiles calculated from waveforms observed by the PSS
and two reference seismometers on (a) the horizontal (H) and (b) the vertical (V)
components. The description of ‘Synthesized’ is the same as the caption of Fig. 14.
R. Yamada et al. / Planetary and Space Science 57 (2009) 751–763760
4.3. Noise level after the penetration
To estimate the noise level of the PSS after the impact test, wecalculated the coherence among microtremors observed by thethree types of seismometers. The coherence function can be usedto provide preliminary estimates of the system’s signal-to-noiseratio (Holcomb, 1989). The coherence is expressed as
coh2ðf Þ ¼ jP12ðf Þj
2=ðP1ðf ÞP2ðf ÞÞ, (12)
where coh2 is the square of the coherence, and P1 and P2 arethe power spectral densities of seismic data observed by sensor 1and sensor 2, respectively, calculated in the same manner as inEq. (11). P12 is the cross spectral density (CSD) between the dataobserved by sensor 1 and sensor 2; it is expressed as
CSDðf Þ ¼ ð1=NÞXN
i¼1
ðXiðf ÞY�i ðf ÞÞ=T, (13)
where Xi(f) is the ith discrete Fourier component of the segmentedsignal observed by sensor 1 and Yi(f) is that observed by sensor 2,N is the total number of segments (64), and T is the time length(32 s), as in the calculation of the PSD.
The degree of incoherency among seismometers represents thenoise of each instrument. If the PSS can observe a microtremor aswell as the reference sensors, the square of the coherence will beapproximately 1.0, indicating that there is little contamination byinstrumental noise.
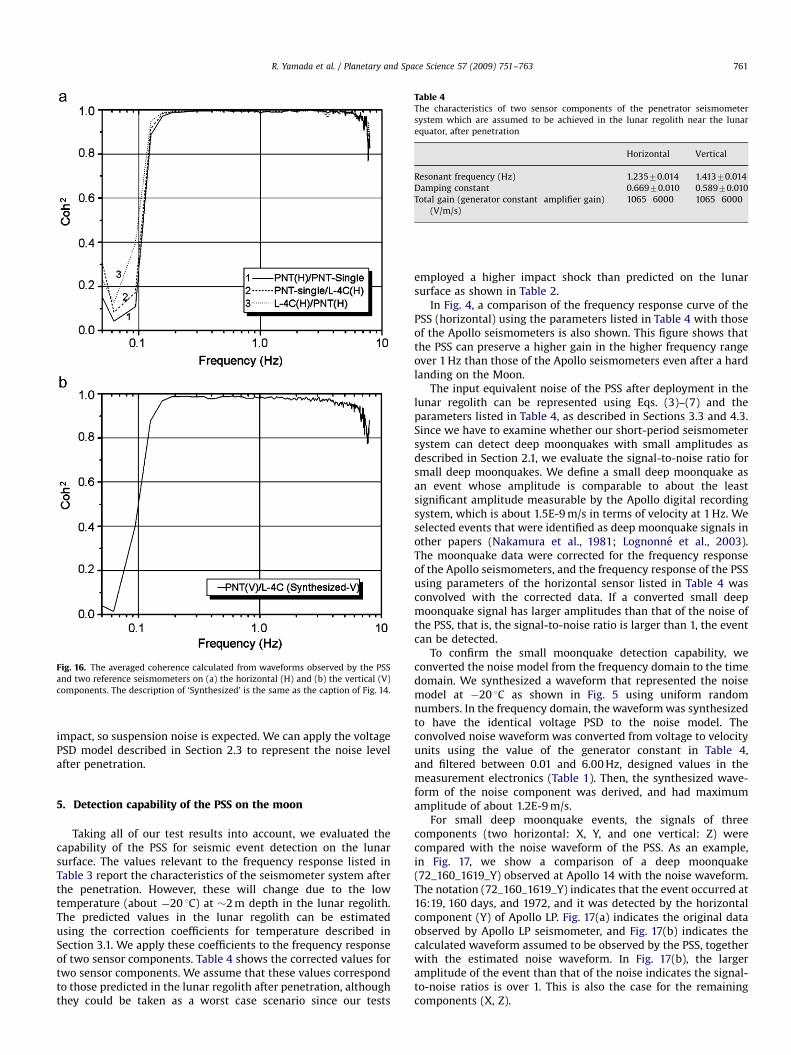
Fig. 16(a) and (b) show the coherence between any twoinstruments for the horizontal and vertical sensor components,respectively. The coherence is typically close to 1.0 in thefrequency range 0.2–6.0 Hz. These results show that the PSSperforms well, for the observation of microtremors. Since theinput equivalent noise at the input stage of the pre-amplifiersof the PSS and that of the single sensor not assembled into thepenetrator (reference sensor) are very similar, we conclude thatthe noise level of the PSS does not change after penetration.In addition, since the gimbal mechanism is composed of thematerial which has strength enough to resist against theimpacting shock and its interior is sealed tightly, we assumedthat xenon gas did not leak out from the gimbal mechanism by the
ARTICLE IN PRESS
Table 4The characteristics of two sensor components of the penetrator seismometer
system which are assumed to be achieved in the lunar regolith near the lunar
equator, after penetration
Horizontal Vertical
Resonant frequency (Hz) 1.23570.014 1.41370.014
Damping constant 0.66970.010 0.58970.010
Total gain (generator constant�amplifier gain)
(V/m/s)
1065�6000 1065�6000
Fig. 16. The averaged coherence calculated from waveforms observed by the PSS
and two reference seismometers on (a) the horizontal (H) and (b) the vertical (V)
components. The description of ‘Synthesized’ is the same as the caption of Fig. 14.
R. Yamada et al. / Planetary and Space Science 57 (2009) 751–763 761
impact, so suspension noise is expected. We can apply the voltagePSD model described in Section 2.3 to represent the noise levelafter penetration.
5. Detection capability of the PSS on the moon
Taking all of our test results into account, we evaluated thecapability of the PSS for seismic event detection on the lunarsurface. The values relevant to the frequency response listed inTable 3 report the characteristics of the seismometer system afterthe penetration. However, these will change due to the lowtemperature (about �20 1C) at �2 m depth in the lunar regolith.The predicted values in the lunar regolith can be estimatedusing the correction coefficients for temperature described inSection 3.1. We apply these coefficients to the frequency responseof two sensor components. Table 4 shows the corrected values fortwo sensor components. We assume that these values correspondto those predicted in the lunar regolith after penetration, althoughthey could be taken as a worst case scenario since our tests
employed a higher impact shock than predicted on the lunarsurface as shown in Table 2.
In Fig. 4, a comparison of the frequency response curve of thePSS (horizontal) using the parameters listed in Table 4 with thoseof the Apollo seismometers is also shown. This figure shows thatthe PSS can preserve a higher gain in the higher frequency rangeover 1 Hz than those of the Apollo seismometers even after a hardlanding on the Moon.
The input equivalent noise of the PSS after deployment in thelunar regolith can be represented using Eqs. (3)–(7) and theparameters listed in Table 4, as described in Sections 3.3 and 4.3.Since we have to examine whether our short-period seismometersystem can detect deep moonquakes with small amplitudes asdescribed in Section 2.1, we evaluate the signal-to-noise ratio forsmall deep moonquakes. We define a small deep moonquake asan event whose amplitude is comparable to about the leastsignificant amplitude measurable by the Apollo digital recordingsystem, which is about 1.5E-9 m/s in terms of velocity at 1 Hz. Weselected events that were identified as deep moonquake signals inother papers (Nakamura et al., 1981; Lognonne et al., 2003).The moonquake data were corrected for the frequency responseof the Apollo seismometers, and the frequency response of the PSSusing parameters of the horizontal sensor listed in Table 4 wasconvolved with the corrected data. If a converted small deepmoonquake signal has larger amplitudes than that of the noise ofthe PSS, that is, the signal-to-noise ratio is larger than 1, the eventcan be detected.
To confirm the small moonquake detection capability, weconverted the noise model from the frequency domain to the timedomain. We synthesized a waveform that represented the noisemodel at �20 1C as shown in Fig. 5 using uniform randomnumbers. In the frequency domain, the waveform was synthesizedto have the identical voltage PSD to the noise model. Theconvolved noise waveform was converted from voltage to velocityunits using the value of the generator constant in Table 4,and filtered between 0.01 and 6.00 Hz, designed values in themeasurement electronics (Table 1). Then, the synthesized wave-form of the noise component was derived, and had maximumamplitude of about 1.2E-9 m/s.
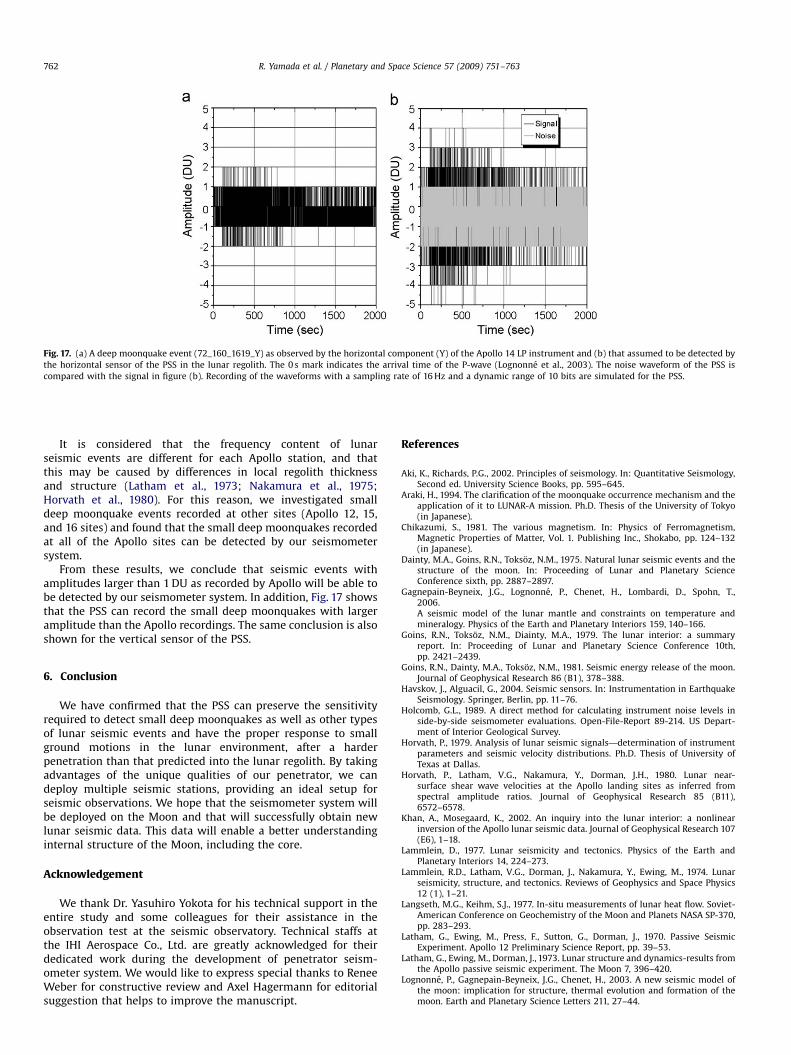
For small deep moonquake events, the signals of threecomponents (two horizontal: X, Y, and one vertical: Z) werecompared with the noise waveform of the PSS. As an example,in Fig. 17, we show a comparison of a deep moonquake(72_160_1619_Y) observed at Apollo 14 with the noise waveform.The notation (72_160_1619_Y) indicates that the event occurred at16:19, 160 days, and 1972, and it was detected by the horizontalcomponent (Y) of Apollo LP. Fig. 17(a) indicates the original dataobserved by Apollo LP seismometer, and Fig. 17(b) indicates thecalculated waveform assumed to be observed by the PSS, togetherwith the estimated noise waveform. In Fig. 17(b), the largeramplitude of the event than that of the noise indicates the signal-to-noise ratios is over 1. This is also the case for the remainingcomponents (X, Z).
ARTICLE IN PRESS
Fig. 17. (a) A deep moonquake event (72_160_1619_Y) as observed by the horizontal component (Y) of the Apollo 14 LP instrument and (b) that assumed to be detected by
the horizontal sensor of the PSS in the lunar regolith. The 0 s mark indicates the arrival time of the P-wave (Lognonne et al., 2003). The noise waveform of the PSS is
compared with the signal in figure (b). Recording of the waveforms with a sampling rate of 16 Hz and a dynamic range of 10 bits are simulated for the PSS.
R. Yamada et al. / Planetary and Space Science 57 (2009) 751–763762
It is considered that the frequency content of lunarseismic events are different for each Apollo station, and thatthis may be caused by differences in local regolith thicknessand structure (Latham et al., 1973; Nakamura et al., 1975;Horvath et al., 1980). For this reason, we investigated smalldeep moonquake events recorded at other sites (Apollo 12, 15,and 16 sites) and found that the small deep moonquakes recordedat all of the Apollo sites can be detected by our seismometersystem.
From these results, we conclude that seismic events withamplitudes larger than 1 DU as recorded by Apollo will be able tobe detected by our seismometer system. In addition, Fig. 17 showsthat the PSS can record the small deep moonquakes with largeramplitude than the Apollo recordings. The same conclusion is alsoshown for the vertical sensor of the PSS.
6. Conclusion
We have confirmed that the PSS can preserve the sensitivityrequired to detect small deep moonquakes as well as other typesof lunar seismic events and have the proper response to smallground motions in the lunar environment, after a harderpenetration than that predicted into the lunar regolith. By takingadvantages of the unique qualities of our penetrator, we candeploy multiple seismic stations, providing an ideal setup forseismic observations. We hope that the seismometer system willbe deployed on the Moon and that will successfully obtain newlunar seismic data. This data will enable a better understandinginternal structure of the Moon, including the core.
Acknowledgement
We thank Dr. Yasuhiro Yokota for his technical support in theentire study and some colleagues for their assistance in theobservation test at the seismic observatory. Technical staffs atthe IHI Aerospace Co., Ltd. are greatly acknowledged for theirdedicated work during the development of penetrator seism-ometer system. We would like to express special thanks to ReneeWeber for constructive review and Axel Hagermann for editorialsuggestion that helps to improve the manuscript.
References
Aki, K., Richards, P.G., 2002. Principles of seismology. In: Quantitative Seismology,Second ed. University Science Books, pp. 595–645.
Araki, H., 1994. The clarification of the moonquake occurrence mechanism and theapplication of it to LUNAR-A mission. Ph.D. Thesis of the University of Tokyo(in Japanese).
Chikazumi, S., 1981. The various magnetism. In: Physics of Ferromagnetism,Magnetic Properties of Matter, Vol. 1. Publishing Inc., Shokabo, pp. 124–132(in Japanese).
Dainty, M.A., Goins, R.N., Toksoz, N.M., 1975. Natural lunar seismic events and thestructure of the moon. In: Proceeding of Lunar and Planetary ScienceConference sixth, pp. 2887–2897.
Gagnepain-Beyneix, J.G., Lognonne, P., Chenet, H., Lombardi, D., Spohn, T.,2006.A seismic model of the lunar mantle and constraints on temperature andmineralogy. Physics of the Earth and Planetary Interiors 159, 140–166.
Goins, R.N., Toksoz, N.M., Diainty, M.A., 1979. The lunar interior: a summaryreport. In: Proceeding of Lunar and Planetary Science Conference 10th,pp. 2421–2439.
Goins, R.N., Dainty, M.A., Toksoz, N.M., 1981. Seismic energy release of the moon.Journal of Geophysical Research 86 (B1), 378–388.
Havskov, J., Alguacil, G., 2004. Seismic sensors. In: Instrumentation in EarthquakeSeismology. Springer, Berlin, pp. 11–76.
Holcomb, G.L., 1989. A direct method for calculating instrument noise levels inside-by-side seismometer evaluations. Open-File-Report 89-214. US Depart-ment of Interior Geological Survey.
Horvath, P., 1979. Analysis of lunar seismic signals—determination of instrumentparameters and seismic velocity distributions. Ph.D. Thesis of University ofTexas at Dallas.
Horvath, P., Latham, V.G., Nakamura, Y., Dorman, J.H., 1980. Lunar near-surface shear wave velocities at the Apollo landing sites as inferred fromspectral amplitude ratios. Journal of Geophysical Research 85 (B11),6572–6578.
Khan, A., Mosegaard, K., 2002. An inquiry into the lunar interior: a nonlinearinversion of the Apollo lunar seismic data. Journal of Geophysical Research 107(E6), 1–18.
Lammlein, D., 1977. Lunar seismicity and tectonics. Physics of the Earth andPlanetary Interiors 14, 224–273.
Lammlein, R.D., Latham, V.G., Dorman, J., Nakamura, Y., Ewing, M., 1974. Lunarseismicity, structure, and tectonics. Reviews of Geophysics and Space Physics12 (1), 1–21.
Langseth, M.G., Keihm, S.J., 1977. In-situ measurements of lunar heat flow. Soviet-American Conference on Geochemistry of the Moon and Planets NASA SP-370,pp. 283–293.
Latham, G., Ewing, M., Press, F., Sutton, G., Dorman, J., 1970. Passive SeismicExperiment. Apollo 12 Preliminary Science Report, pp. 39–53.
Latham, G., Ewing, M., Dorman, J., 1973. Lunar structure and dynamics-results fromthe Apollo passive seismic experiment. The Moon 7, 396–420.
Lognonne, P., Gagnepain-Beyneix, J.G., Chenet, H., 2003. A new seismic model ofthe moon: implication for structure, thermal evolution and formation of themoon. Earth and Planetary Science Letters 211, 27–44.

ARTICLE IN PRESS
R. Yamada et al. / Planetary and Space Science 57 (2009) 751–763 763
Mizutani, H., Fujimura, A., Hayakawa, M., Tanaka, S., Shiraishi, H., 1999. LUMAR-Apenetrator: its science and instruments. In: Komle, N.I., Kargl, G., Ball, A.J.,Lorenz, R.D. (Eds.), Penetrometry in the Solar System. Austrian Academy ofSciences Press, Vienna, pp. 125–136.
Mizutani, H., Fujimura, A., Hayakawa, M., Tanaka, S., Shiraishi, H., Yoshida, S., 2000.LUNAR-A MISSION: science objectives and instruments. In: ICEUM-4 Proceed-ing of Fourth International Conference on the Exploration and Utilization of theMoon, pp. 107–114.
Mizutani, H., Fujimura, A., Tanaka, S., Shiraishi, H., Nakajima, T., 2003. LUNAR-AMISSION: goals and status. Advances in Space Research 31, 2315–2321.
Nakamura, Y., Dorman, H.J., Duennebier, F., Lammlein, D., Latham, G., 1975. Shallowlunar structure determined from the passive seismic structure. The Moon 13,57–66.
Nakamura, Y., Latham, V.G., Dorman, J.H., Harris. E.J., 1981. Passive seismicexperiment long-period event catalog. Technical Report 118, Rev. ed.,University of Tex. Inst. for Geophysics., Austin.
Nakamura, Y., Latham, V.G., Dorman, H.J., 1982. Apollo lunar seismic experiment-final summary. Journal of Geophysical Research 87 (Supplement), A117–A123.
Peterson, J., 1993. Observations and modeling of seismic background noise. Open-File Report 93-322. US Department of Interior Geological Survey.
Rodgers, W.P., 1992. Frequency limits for seismometers as determined from signalto noise ratios. Part.1. the electromagnetic seismometer. Bulletin of theSeismological Society of America 82 (2), 1071–1098.
Shiraishi, H., Tanaka, S., Fujimura, A., Hayakawa, H., 2008. The present status of theJapanese penetrator mission: LUNAR-A. Advances in Space Research 42, 386–393.
Toksoz, N.M., Dainty, M.A., Solomon, C.S., Anderson, R.K., 1974. Structure of theMoon. Reviews of Geophysics and Space Physics 12 (4), 539–565.
Yamada, R., Yamada, I., Yokota, Y., Shiraishi, H., Tanaka, S., Fujimura, A., Mizutani,H., Kobayashi, N., Takeuchi, N., Murakami, H., Ishihara, Y., Koyama, J., Yomogida,K., Takagi, Y., 2005. Seismometer design and its characteristics onboardLUNAR-A penetrator. In: Proceedings of 6th IAA International Conference onLow-Cost Planetary Missions, pp. 433–440.