Embed Size (px)
Citation preview

HEADQUARTERS NOC & TECHNOLOGY CENTER
2900 N. Qu i n lan Park
R oad
Su i te B240 , #215
Aus t i n , TX 78732
512 318 2154
www. i nnovar i .c om
19720 NW Tanasbou rne
D r i ve
Su i te 320
H i l l sboro , OR 97124
BACKUP DATA CENTER
Santa C la ra , CA
INNOVARI INDIA
Gurgaon (De lh i )
Mumbai
Open i ng Soon :
Banga lo re
INNOVARI LAT IN AMERICA
Buenos Ai re s , Argent i na
Em Cal i , Co lombi a
Open i ng Soon - Panama
INNOVARI MIDDLE EAST
Amman , Jo rdan
Open i ng Soon – UAE & Bahra i n
CAPACITY FOR CHANGE
History of the Demand Side
Ceylon Electricity Board - August 2015

Industry Veterans with a global
viewpoint as your partner
Confidential @ 2014 Innovari, Inc. 2
Executive Team ExperienceInnovari Activity around the world

Electricity is the ONE thing
that drives a country’s GDP
Access to reliable, secure and affordable
electricity defines a nations health, welfare,
quality of life and overall success!
Confidential @ 2014 Innovari, Inc. 3

Demand Side
What’s all the fuss about?
Why care about the demand side?
What benefits should we expect?
How should we measure and/or track?
What have others done?
Program Activity versus Metric Driven
Success on the Demand Side
How can we use the demand side to
achieve our goals?
Confidential @ 2014 Innovari, Inc. 4
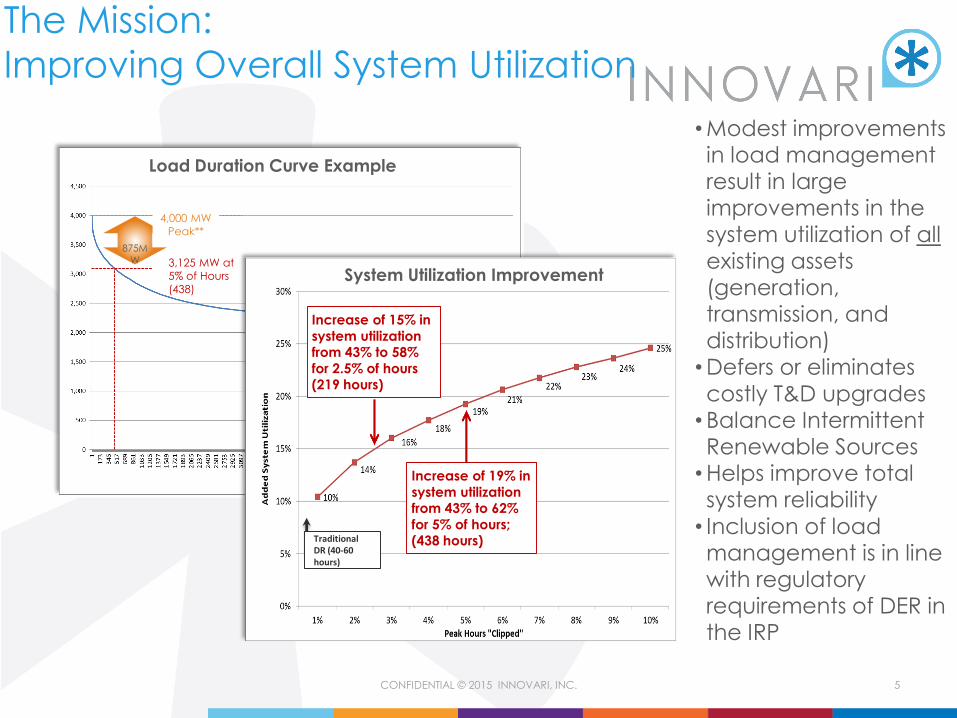
•Modest improvements in load management result in large improvements in the system utilization of all
existing assets (generation, transmission, and distribution)•Defers or eliminates
costly T&D upgrades•Balance Intermittent Renewable Sources•Helps improve total system reliability
• Inclusion of load management is in line with regulatory requirements of DER in the IRP
875MW
4,000 MW
Peak**
3,125 MW at
5% of Hours
(438)
Load Duration Curve Example
The Mission:
Improving Overall System Utilization
System Utilization Improvement
Increase of 19% in
system utilization from 43% to 62%
for 5% of hours; (438 hours)
Increase of 15% in
system utilization from 43% to 58%
for 2.5% of hours (219 hours)
Traditional DR (40-60 hours)
5CONFIDENTIAL © 2015 INNOVARI, INC.

Evolution of
Load Management
Most Existing
“dispatchable load”
driven by manual
measures via call,
page or text
~90% of Worldwide
LM is here
Two-way,
verifiable load
management
with dynamic
attributes that
allow the grid to
be served
<1% of Worldwide
LM is here
Previously known
as curtailment and
resurfaced in
residential as one
way Tstats
<10% of Worldwide
LM is here
Utility Equivalent & Trusted Resource/Product
Va
lue
Looks, acts and
is trusted as a
utility resource if
owned by utilityFully automated
response
intelligently taps
embedded
responsive load
in most buildings
Any initiative that creates dynamic communication
and control across this boundary must be secured
at the highest level to protect the power grid and
the control room that is responsible to maintain the
reliability of the power grid.
Confidential @ 2014 Innovari, Inc. 6

Evolution of
Measurement & Verification
Eliminates all
concepts of
‘gaming’ and
difficult post
processed
settlements.
Enables LM to
be a reliability
product
Confidential @ 2014 Innovari, Inc. 7

Choosing a Sustainable, Lower
Cost Asset to Optimize Your GridIncreases Customer Relationship and Loyalty
Asset: Central Station
Generator
Asset: Virtual Power Plant
(Approx 50% less cost)
• Single, rate based Asset• Ongoing O&M costs
• Fuel = Fossil fuels• Ongoing, highly variable• Increases grid losses• Negative environmental
effects• No End-Use Customer
interaction
• Many distributed sites as one rate based Asset
• Ongoing O&M costs• “Fuel” = Site Incentives
• No fossil fuel or variable cost • Reduces grid losses• Positive environmental effects
• End-Use Customer incentives increase customer loyalty
Confidential @ 2014 Innovari, Inc. 8

Start at the lowest system level –
A single feeder
• SCADA shows ~70 hours over 500 Amps. Maximum peak ~574
Amps
• To manage 50 to 75 Amps on this feeder, 620 to 930kW of load
management would be required to keep the feeder at or below
500 AmpsConfidential @ 2014 Innovari, Inc. 9

Optimize Operational Goals
This utility was seeking to optimize feeder usage to meet
equipment operating limits and defer or eliminate the need for
feeder and substation upgrades as previously planned
Confidential @ 2014 Innovari, Inc.
Capacity threshold
Also seeking to ‘bury’ load when wind
generation peaked during off hours

Real Time Monitoring and
Two-way Closed Loop Control
A combination of operating objectives can be achieved including peak
load management to mitigate system constraints, load bury to optimize
renewable energy resource production (in this example wind at night),
and individual building management such as pre-cooling to shift load
profiles, even a few hours a day. (EX: to balance the post solar peak)
* Example illustrates 362 hours of dispatch on one feeder from a peak load reduction of 1MW to a peak load bury of 275kW

Move up a level to Substation
Pursue the entire area with emphasis on feeder 291-23 291-21
291-23
291-12
290-22
290-21
253-21
70-51
Legend:Candidate > 10 kW30 – 50 kW50 – 100 kW> 100 kW
SurveyedApprovedInstalled
Delivered Site kW
Feeder 10-30 30-50 50-100 100+ Total kW
290-21 2 1 0 0 100
290-22 2 3 3 1 700
291-12 2 2 0 1 300
291-23 4 3 6 2 900
Total (all Feeders) ~2.0MW
$4.8 million feeder reconductor
deferral on feeder 291-23
$8.7 million substation upgrade
deferral on substation 291
$1.4 million dollar ADSM project
Confidential @ 2014 Innovari, Inc. 12

Move to a System Level View
50 MW Project Benefits:
6 deferred substation upgrades $43M
14 deferred feeder upgrades $35M
50 MW peaker eliminated $92M
Significant Loss improvement,
reduced emissions, improved customer
satisfaction and regulatory relationship
Benefits > $ 170 M
Project cost: $35M
Confidential @ 2014 Innovari, Inc. 13

Program based Demand Side:
Results are not what you want
In the U.S., great things have been accomplishedEE
Emission Reductions
Deferral or Elimination of Peak Power Plants
HVDC/FACTS and Power Electronics proof of concept and deployment
Full deployment of SCADA
AMI/AMR
However, In the U.S., DR is still utilized almost exclusively for “Emergency” reasons, lawsuits are rampant for gaming and the administrative burden for base lining and settlement is still largely unknown as it is buried into other overhead costs.
The net result related to the Root Cause Problem of our Industry?
The Root Cause Problem (LDC) is WORSE!
The grid has become more ‘peaky’ driving even greater economic issues and price/cost separation from peak to baseload.
Confidential @ 2014 Innovari, Inc. 14

PJM (ISO) Example
PJM (Pennsylvania-New Jersey-Maryland Interconnection) operates
a competitive wholesale electricity market which serves 20 distinct
regions (T&D Utilities)
63,000 miles of Transmission Lines
61 million people
Peak Demand of 165,000 MW
Generation Capacity of 184,000 MW
DR Capacity of ~11,000 MW
DR Program Costs:
2009 $410 M and not used
2010 $584 M for 5 days of use $ 25,000 /MWh
2011 $420 M for 1 day of use $ 35,000 /MWh
2012 $268 M for 2 days of use $ 24,000 /MWh
2013 $560 M for 5 days of use $ 8,000 /MWh
Total: $2.2 BillionConfidential @ 2014 Innovari, Inc. 15

PJM: Over Two Billion Dollars
for less than 100 hrs over 15 yrs2000 No Events
2001 Events on 4 days for a total of 11 hours
2002 Events on 3 days for a total of 13 hours
2003 No Events
2004 No Events
2005 Events on 2 days for a total of 5 hours
2006 Events on 2 days for a total of 8 hours
2007 Event on 1 day for a total of 3 hours
2008 No Events
2009 No Events
2010 Events on 5 days for a total of 25 hours Dispatched 2,700 MW
2011 Event on 1 day for a total of 5 hours Dispatched 2,100 MW
2012 Events on 2 days for a total of 6 hours Dispatched 2,200 MW
2013 Events on 5 days for a total of 18 hours Dispatched 5,800 MW
Never Dispatched more than 50% of Available Capacity
Largest Event was 3.5% of Peak Demand
Equivalent Capacity Factor: 0.09% Confidential @ 2014 Innovari, Inc. 16

California Example
CAISO (California Independent System Operator) operates a
wholesale electricity market which serves three Independently Owned Utilities (IOUs) and over 25 municipal organizations
27,000 miles of Transmission Lines
30 million people
Peak Demand of 50,000 MW
Generation Capacity of 56,000 MW
DR Capacity is estimated at ~3,000 MW
All “DR” programs are managed by the individual utilities
and are not provided as part of the daily operating forecasts.
An “event” for the CAISO is a mass media notification that the
state-wide generation capacity may not meet requirements.
Utilities may then trigger any combination of response including Interruptible
Tariff agreements, Capacity Bidding Programs and Aggregator Managed DR
programs. However, when reporting results, utilities include all other estimates
of demand reduction associated with Peak Pricing and Summer Discount
program agreements already operating prior to any “event”.
Confidential @ 2014 Innovari, Inc. 17
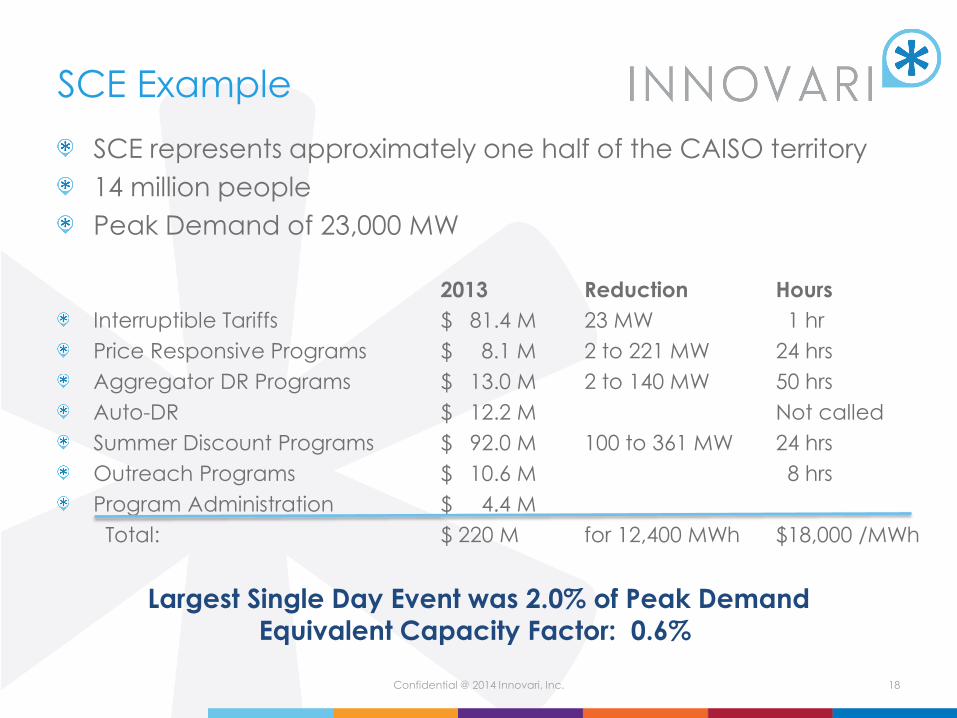
SCE Example
SCE represents approximately one half of the CAISO territory
14 million people
Peak Demand of 23,000 MW
2013 Reduction Hours
Interruptible Tariffs $ 81.4 M 23 MW 1 hr
Price Responsive Programs $ 8.1 M 2 to 221 MW 24 hrs
Aggregator DR Programs $ 13.0 M 2 to 140 MW 50 hrs
Auto-DR $ 12.2 M Not called
Summer Discount Programs $ 92.0 M 100 to 361 MW 24 hrs
Outreach Programs $ 10.6 M 8 hrs
Program Administration $ 4.4 M
Total: $ 220 M for 12,400 MWh $18,000 /MWh
Largest Single Day Event was 2.0% of Peak Demand
Equivalent Capacity Factor: 0.6%
Confidential @ 2014 Innovari, Inc. 18
ADSM is a game changer
Improve System Load Factor (System Utilization) by 20% (Dramatically
improve the utilization of existing and future assets)
Defer or eliminate “Inefficient Regulatory Assets” (Feeder
reconductor, substation upgrade, etc)
Defer or eliminate a portion of the required peaking power plants
Eliminate the need to burn fossil fuels for Ancillary services such as
spinning reserves
Real time phase balancing
Real time aggregation of DER (Solar, Battery, Generation, etc.)
Real time balancing of central station or distributed intermittent
resources
Put the control in the hands of the utility/grid operator and improve
both the regulatory and consumer relationship
Dramatically improve Grid Situational Awareness to the lowest level
of the network – to the “edge of grid”
Confidential @ 2014 Innovari, Inc. 19
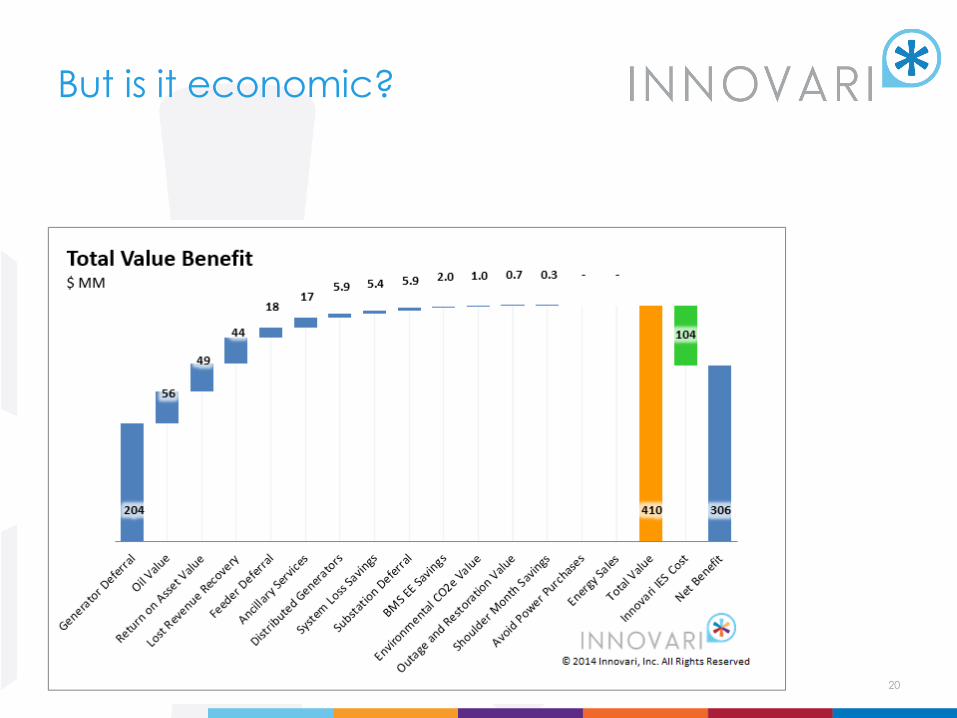
But is it economic?
Confidential @ 2014 Innovari, Inc. 20

Any effort undertaken
should strive to connect
utilities, their customers,
and their communities to
improve how the world
uses energy.
Crucial for an island economy to utilize and optimize
every resource available to the gridConfidential @ 2014 Innovari, Inc. 21

A Platform that delivers now
and enables the future
HVAC Other
Load
Lighting
Building Load
Phase Independent
Battery Storage
Generator
Solar Panel
Energy AgentTM
Balances
Distributed
Energy
Resources
Now: Two-way, verifiable,
closed loop control. ADSM
dispatched by the utility.
The possibilities go far
beyond load management.
Ancillary services (Spin and
Non-Spin reserves), feeder
management, substation
management, congestion
management, peaking
generator deferral or
elimination, positive
environmental benefits, etc.
Now and in the future: Utility enables edge-grid
technology and DER, even microgrids. Incorporate
customer-owned, or in the future, utility-owned
distributed generation. Manage distributed solar
with building loads where it is deployed or with
additional load on the feeder so the whole system
is not affected by this resource. Balance
intermittent renewables and utilize battery storage.
Balance central station renewables. Incorporate
distributed storage and use it to optimize phase
balance and feeder efficiency as well as protect
customers from outages.Grid Anaytics
Now and in the future:
Utility has greater visibility
deep into the grid, with
advanced monitoring and
analytics:
• Volt / VAR,
• Power Quality,
• DG & PV
integration/monitoring
• Harmonics
• Digital Fault Recording
• Distribution level PMU
Energy
Agent™(at customer site)
Grid
Agent™(at site or
on feeder)
DER
Agent™and “edge grid”
technology
enablement
Interactive
Energy
Platform™

Continue on this path?
Confidential @ 2014 Innovari, Inc. 23
875MW
4,000 MW
Peak
3,125 MW at
5% of Hours (438)
Load Duration Curve Example
250MW
~$2B of
Generation
Investment
~$500M in T&D
“Industry Average Utilization of 43%”
U.S. Energy Information Administration (EIA)
Billions spent on
underutilized
infrastructure
Fuel costs and emissions
increased through use
of inefficient peaking
power or hot stand-by
Peaking units use
increased and life
decreased to attempt
to balance renewables
on the grid
Customers resources
stranded and not
dramatically under
utilized
System technical losses
and imbalance
increasing over time

Or create a new one!
Confidential @ 2014 Innovari, Inc. 24
Increase Average Utilization to 60%!

HEADQUARTERS NOC & TECHNOLOGY CENTER
2900 N. Qu i n lan Park
R oad
Su i te B240 , #215
Aus t i n , TX 78732
512 318 2154
www. i nnovar i .c om
19720 NW Tanasbou rne
D r i ve
Su i te 320
H i l l sboro , OR 97124
BACKUP DATA CENTER
Santa C la ra , CA
INNOVARI INDIA
Gurgaon (De lh i )
Mumbai
Open i ng Soon :
Banga lo re
INNOVARI LAT IN AMERICA
Buenos Ai re s , Argent i na
Em Cal i , Co lombi a
Open i ng Soon - Panama
INNOVARI MIDDLE EAST
Amman , Jo rdan
Open i ng Soon – UAE & Bahra i n
THANK YOU!
Questions?

Traditional Peaker (2-6 or ??? Years) Innovari IES (6-24 months)
Purchase Land
Siting Process
EA/EIS - Environmental Permits
Interconnection Study
Gas Line Extension
Construction Costs/Delays
Interconnection Facility
Total delivered at end of project
Losses on Grid (10% = Lose 5 MW!!)
Increases Spinning Reserve Requirement(12% = Build another 6 MW!!!)
50MW – 5MW – 6MW = 39MW IRP EFFECT
Delivered for $1,500 to $2,500 per kW
O&M and Fuel Variable each year
New Emissions and increased fuel requirement
$75-$125M capx - $4-$8M opex
variable
No Land
No Siting Process
No EA/EIS or Permits (RECs!!!)
No Interconnection Study
No Gas Line Extension (No fuel cost)
No Construction Costs/Delays
No Interconnection Facilities
Delivered as acquired – even day one!
REDUCES losses (Gain 5 MW)
REDUCES Spinning Reserve Requirement (Gain 6 MW)
50MW + 5MW + 6MW = 61MW IRP EFFECT
Delivered for $695 per kW*
Annual Programmatic fixed $43 per kW-yr*
Reduce current and future emissions and fuel use
$34.75M capx - $2.15M opex
fixed
The Choice for a Utility – 50MW of What?
*plus applicable shipping/tax/customer incentive/etcConfidential @ 2014 Innovari, Inc. 26