Embed Size (px)
Citation preview

Capacity Improvement for Densely Deployed
Small Cell Networks
2


Self-optimization Technologies for Small Cells: Challenges and Opportunities
http://www.sciencepublishinggroup.com 15
As one of the key requirements in the 5G mobile communications system, the
capacity improvement technology by using densely deployed small cell networks
is considered as an efficient solution. In this chapter, both problems and
challenges of the capacity improvement technology are introduced in detail. Then,
three typical frequency allocation schemes, such as orthogonal frequency
allocation, co-channel frequency allocation, hybrid frequency allocation, are
proposed by using the capacity analysis with theoretical proofs in the densely
deployed small cell networks scenario. The optimal geographic region division
scheme is also proposed for small cell networks with closed-form solutions. At
last, the self-deployment procedure of hybrid frequency allocation scheme is
designed and the performances of proposed schemes are verified by numerous
results in this chapter.
2.1 Introduction of Problems and Challenges
According to recent studies, 50% of phone calls and 70% of data services will
take place indoors for the coming years [1]. Moreover, about two thirds voice
services and 90% of data services will take place indoors [2]. Studies also show
that more than 45% of households and 30% of businesses users’ experienced
inadequate indoor coverage in [3], leading to the poor quality of service (QoS).
Furthermore, Cisco forecasts that the global mobile data traffic grows by 81% in
2013 and smarter mobile devices are increasing fast in [4]. Moreover, the traffic
demands are surging rapidly for the 5G wireless networks. But the uneven traffic
distribution leads to new challenges for the capacity improvement. The
traditional network planning and optimization techniques can not guarantee a
wide range wireless network coverage and an effective service quality indoors,
leading to the expansion of network capacity as a fundamental problem for 5G
wireless networks.

Self-optimization Technologies for Small Cells: Challenges and Opportunities
16 http://www.sciencepublishinggroup.com
Furthermore, traditional capacity improvement techniques such as cell
splitting and employing more spectrum resources can not meet the unexpected
surging capacity demands, uneven traffic distribution in geography and time
domains, and various service requirements. Besides, due to the building block,
shadow effect, signal propagation loss, and reflection effect, the capacity holes in
hotspots and deteriorated user experiences are new challenges [5]. Therefore,
how to make full use of heterogeneous network resources, how to decrease the
complexity of resource management, and how to improve the network capacity
and the user experience indoors are still big problems unsolved. Traditional
network planning and optimization techniques face the problems of high
implementation cost, long deployment period, and complex optimization process.
Therefore, the self-optimization of densely deployed small cells, such as
femtocell, picocell, and microcell, are proposed and considered as an efficient
solution in [6]-[7] for the capacity and coverage enhancements indoors.
As one of the efficient capacity enhancement techniques, small cells are
introduced to operate on licensed bands for both indoor and outdoor scenarios in
[3] and [8]. Furthermore, small cells can provide a fast, flexible and cost-efficient
solution for existing cellular networks in [9], which include femtocells, picocells,
microcells and metrocells [10]. Also, small cells can be deployed in hotspots and
indoor scenarios to improve the network capacity and user’s experience.
However, the challenges for densely deployed small cells still exist, including the
interference management, frequency allocation, and access mode selection
schemes for small cells in 5G wireless networks.
In the literature, existing research works on capacity improvement by using
small cells are studied in terms of different frequency allocation schemes and
interference management issues. For the uplink capacity analysis in hierarchical
networks, both the closed subscriber group (CSG) access and open access modes
are considered in orthogonal frequency division multiple access (OFDMA) and

Self-optimization Technologies for Small Cells: Challenges and Opportunities
http://www.sciencepublishinggroup.com 17
time division multiple access (TDMA) based femtocell networks in [8]. Besides,
the macrocell users’ density is considered as a key factor for the optimal CSG and
open access modes selection where the open access mode is much preferred when
macrocell users’ density is small. Moreover, the open access mode is applied in
code division multiple access (CDMA) based femtocell networks in [11]. And a
distributed orthogonal frequency allocation scheme is proposed by using the
optimal frequency allocation ratio between femtocell and macrocell networks in
[12] to minimize the interference among different layers in hierarchical networks.
In [13], both the joint and disjoint sub-channel allocation schemes are proposed
for two-tier networks with quality of service constraints in terms of success
transmission probabilities and per-tier minimum rates. Considering the frequency
allocation in hierarchical networks, a hybrid orthogonal frequency allocation
scheme is proposed in [14], which considers about the distance between
femtocell and macrocell and the interference constraint area (ILCA) factor.
In terms of the interference problems among OFDMA based hierarchical
networks, a realtime multi-agent reinforce learning technology based intelligent
self-organized femtocell network is proposed in [15] by using the accumulated
interference from different femtocell networks to solve these problems.
Moreover, a docition based realtime scheme is proposed in [15] to improve the
learning ability and accuracy of Q-learning process, which solves the unstable
decision making problem and the drawbacks of complex learning process with a
slow learning speed. Considering the uplink capacity and interference
cancelation problems in CDMA based hierarchical networks, the uplink capacity
and time hop based TH-CDMA interference cancelation technology are proposed
and analyzed with the outage probability constraints of macrocell and femtocell
in a co-channel frequency deployment scenario [16]. Furthermore, in OFDMA
based hierarchical networks, self-configuration and self-optimization based

Self-optimization Technologies for Small Cells: Challenges and Opportunities
18 http://www.sciencepublishinggroup.com
interference cancelation schemes are proposed to solve the interference problems
in co-channel and orthogonal frequency allocation schemes in [17]-[18].
Considering the scarcity of spectrum resources, the small cell sharing the same
spectrum with macrocells is an efficient way to increase the network capacity.
Recent study works on the frequency allocation and capacity analysis for small
cells are using co-channel and orthogonal frequency allocation schemes in a
single cell scenario, which apply the interference cancelation methods to improve
the network capacity. However, considering that small cells are typically
deployed randomly by users without network planning, it is important that the
intelligent self-organizing techniques should be applied in small cells. Besides,
more and more researchers are paying much attention to adding cognitive
technologies in femtocell networks in [19]-[21]. But how to add intelligent
abilities for small cells optimization is a new challenge. Therefore, a hybrid
frequency allocation scheme is proposed in this chapter to increase the downlink
capacity in the scenario of densely deployed small cell networks. First, the
downlink network capacity of small cell networks is analyzed by using different
frequency allocation schemes, including orthogonal, co-channel, and hybrid
frequency allocation schemes. Both the density of small cells and interference
constraints to guarantee the quality of macrocells are considered and verified
with theoretical results in this chapter. The proposed hybrid frequency allocation
scheme utilizes different frequency allocation schemes for the inner and outer
circle regions to improve the network capacity. By adding the geographic region
cognition ability in densely deployed small cells, an optimal geographic region
division scheme is designed and the optimal square zone length is theoretically
obtained for an efficient information delivery among small cells via cognitive
pilot channel (CPC) [22]-[23]. Numerical results verify that the proposed novel
schemes can improve the network capacity in [29] by using appropriate small
cells deployments.

Self-optimization Technologies for Small Cells: Challenges and Opportunities
http://www.sciencepublishinggroup.com 19
2.2 Capacity Analysis Using Different Frequency
Allocation Schemes
2.2.1 System Model and Scenario
A typical architecture of heterogeneous networks is depicted in Figure 2.1 with
overlapped macrocell base stations (MBSs) and small cells. Three different
frequency allocation schemes, including orthogonal, co-channel, and hybrid
frequency allocation schemes, are described and compared in this section,
considering the impacts on downlink capacity and interference in heterogeneous
networks.
Figure 2.1 Small cell network architecture and three frequency allocation schemes.
SOURCE: Reproduced with permission from [29]. Copyright 2015 Springer
International Publishing.
(1) Orthogonal Frequency Allocation: Different frequency bands are assigned
to macrocell layer and small cell layer separately. Although the orthogonal
frequency allocation can reduce cross-layer interference, it has a disadvantage of
lower spectral efficiency. Furthermore, due to the scarce of available spectrum,
the intra-cell interference among small cells is a big problem, especially in the
densely deployed small cell scenario.
(2) Co-channel Frequency Allocation: Both macrocell and small cell share the
same frequency. Due to its low transmit power and small coverage area, the
inter-cell interference between macrocell and small cell can be avoided by using
the spatial isolation scheme, which can improve the network capacity. However,

Self-optimization Technologies for Small Cells: Challenges and Opportunities
20 http://www.sciencepublishinggroup.com
when the small cells are densely deployed, the interference issues can not be
solved only by using the spatial isolation scheme.
(3) Hybrid Frequency Allocation: The coverage area of macrocell is divided
into inner and outer circle regions. Small cells located within the inner circle
region apply the orthogonal frequency allocation scheme, in order to decrease the
interference to macrocell. When small cells are located in the outer circle region,
the co-channel frequency allocation scheme can be applied to improve the
network capacity by utilizing the spatial isolation scheme to minimize the
interference.
It is also assumed that the coverage area of MBS is modeled as a hexagon with
radius mR , and the coverage area is represented by H as 23 3 mH R . The
distribution of macrocell user equipment (MUE) is a Poisson Point Process (PPP)
[24]-[26] with the density MUE . The position of MUE is depicted as
MUE iX . Each MBS has six neighbors denoted by iMBS (i=1, 2... 6). The
distribution of small cells, such as femto base station (FBS) is modeled as a PPP
[24]-[26] with the density FBS . The position of FBS is represented as
FBS iY . The OFDMA-based LTE system is used and no power control
scheme is applied in the downlink. Thus, MBS transmission power is depicted by
mP and FBS transmission power is depicted by fP . To guarantee the quality of
signal in heterogeneous networks in terms of the outage probability , the SINR
(Signal to Interference plus Noise Ratio) of MUE and femtocell user equipment
(FUE) located at the cell edge should be greater than the target SINR argt et . The
amount of RB is N where MBS occupies mN and the number of RB that FBS
occupied depends on different frequency allocation schemes used by FBS. For
example, in the orthogonal frequency allocation scheme, f mN N N . When in

Self-optimization Technologies for Small Cells: Challenges and Opportunities
http://www.sciencepublishinggroup.com 21
the co-channel frequency allocation scheme, f mN N N . /mN N
denotes the ratio of RB resources that MBS occupies to the overall resources.
1 denotes that the co-channel frequency allocation scheme is used, while
0 1 is the orthogonal frequency allocation scheme. Considering that the
backhaul among MBS and small cells is non-ideal, the information exchange
among them faces the challenge of long time delay issues. Therefore, the
cognitive pilot channel (CPC) technique [22] is proposed to realize the effective
information delivery among MBS and small cells.
2.2.2 Orthogonal Frequency Allocation Scheme
In the orthogonal frequency allocation scheme, different frequency bands are
separately assigned to the macrocell and small cell layers, which can decrease the
cross-layer interference. As show in Figure 2.2, MUEs located at the edge of
0MBS using the specific RB resource in the downlink will receive strong
interference from the neighbor iMBS . Given the whole number of RB N and
the available RB mN N , the probability of co-channel interference received
by MUE is 1/ N . Similarly, the probability of co-channel interference
received by FUE from neighbor FBSs is 1/ ( ) 1/ [(1 ) ]mN N N .

Self-optimization Technologies for Small Cells: Challenges and Opportunities
22 http://www.sciencepublishinggroup.com
Figure 2.2 Scenario of orthogonal frequency allocation scheme. SOURCE:
Reproduced with permission from [29]. Copyright 2015
Springer International Publishing.
(1) The SINR of MUE in the downlink is depicted by orth
m mSINR d in (1).
6
0 ,
1
1
i
orth m m mm m
m m
I
G P dSINR d
N IN
(1)
6 6
, ,
1 1
i i im m m m m m
I i
I G P d (2)
mG is the channel gain which is modeled as a negative exponential
distribution with the mean of 1 . mP is the transmit power of MBS, is the

Self-optimization Technologies for Small Cells: Challenges and Opportunities
http://www.sciencepublishinggroup.com 23
path loss ratio, 0N represents the background noise power per RB, md is the
distance between 0MBS and MUE, ,im mI is the co-channel interference to MUE
in 0MBS from iMBS , ,im md is the mean distance between neighbour iMBS
and MUE in 0MBS .
To simplify the analysis, it is also assumed that only the strongest interference
from kMBS to MUE is considered, where ,im m md R . Then, the coverage radius
mR of MBS satisfies (3) in terms of the maximum outage probability of .
arg 0
arg
arg
1( ) exp 1
1 / ( )
t etorth
m m t et
m m t et
NP SINR R
P R N
(3)
arg
,minarg 0
(1 )
exp( ) (1 )
t et
m mt et
m m
N N NN
P R
(4)
To guarantee the orth
mSINR quality of MUE with the interrupt probability
constraints, the number of RB should be higher than ,minmN . When the MBS
transmit power 20WmP , the background noise power 12
0 10 WN ,
arg 3t et , 0.1 , the path loss ratio 4 , the system bandwidth is 20MHz,
and the RB resource 110N . Figure 2.3 shows that how the probability of
arg
orth
m t etSINR changes with
and mR . There is a minimum number of RB
resources to guarantee the cell edge MUE’s quality. And the minimum number
RB increases with mR . When 288mmR , and 0.25 , the minimum
28mN . When 500mR m , and 0.28 , the minimum 31mN . When
800mmR , and 0.61 , the minimum 68mN .

Self-optimization Technologies for Small Cells: Challenges and Opportunities
24 http://www.sciencepublishinggroup.com
When each MUE occupies one RB resource, the maximum capacity in the
downlink is given by (5).
2 arglog (1 )orth
m t etC (5)
Figure 2.3 SINR of MUE for different and mR . SOURCE: Reproduced with
permission from [29]. Copyright 2015 Springer International Publishing.
(2) The SINR of FUE in the downlink is depicted by orth
f fSINR d in (6).
0 ,
( )1
(1 )
f f forth
f f
f f
G P dSINR d
N IN
(6)
0, \{ }P
ii FBSf f Y f iY Y
I G P Y
(7)
fG is the channel gain which is modeled as a negative exponential
distribution with the mean 1 . fd is the distance between FBS and FUE, ,f fI

Self-optimization Technologies for Small Cells: Challenges and Opportunities
http://www.sciencepublishinggroup.com 25
denotes the co-channel interference from neighbor FBSs. iYG and || ||iY depict
the channel gain and the distance between FBS at location iY and FUE. And the
results in [24] [25] [28] are depicted in (8), where 2 / [ (2 / )]K sin , and
ˆFBS is the maximum density of FBS.
,0
2/ 2/
ˆ[exp( )]=exp[ 2 ]1 / ( )
ˆ =exp( )
f f FBS
f
FBS f
uE sI du
u sP
p s K
(8)
Considering the worst case of the interference from MBS, the SINR of FUE at
the cell edge of FBS should be greater than the target SINR threshold argt et
with the outage probability in (9).
arg( ( ) ) 1orth
f f t etP SINR R (9)
In the orthogonal frequency allocation scheme, the maximum density of FBS
ˆFBS is depicted in (10).
target
0
2 2/ 2/ 2/
target
-ln(1- )-
ˆ =(1 )
f f
FBS
f
NP R
R K N
(10)
Thus, the total system capacity is depicted by orthC in (11).
2 arg
[ (1 ) ]
ˆ[ (1 ) ]log (1 )
orth orth orth orth orth
m m s s m s
FBS t et
C N C N C N C C
N H
(11)
The maximum density of FBS ˆFBS is constrained by the resource ratio
and the coverage radius of FBS fR , as shown in Figure 2.4. With a fixed fR ,
available RB resources of FBS will decrease with the increase of , where the

Self-optimization Technologies for Small Cells: Challenges and Opportunities
26 http://www.sciencepublishinggroup.com
interference among different FBS will increase. In order to guarantee the quality
of FUE, the density of FBS should decrease to mitigate the interference by
utilizing the spatial isolation scheme among FBSs. Moreover, considering the
quality of MUE at the cell edge, FBS density achieves the maximum ,ˆFBS max ,
when MBS occupies RB resources with the minimum value , , /m min m minN N
and FBS has the maximum value , ,(1 )f max m minN N . For example, when
500mmR , , 0.28m min , the maximum , 79f maxN . When 10mfR , the
maximum density of FBS achieves 3
,ˆ 1.10*10FBS max . When 20mfR , the
maximum density of FBS achieves 4
,ˆ 2.74*10FBS max . Thus, both the RB
resource ratio and the coverage radius fR will affect the maximum density
of FBS in the orthogonal frequency allocation scenario.
When each FBS occupies one RB resource, the downlink capacity is given by
(12).
2 argˆ | | log (1 )orth
f FBS t etC H (12)
Therefore, when the system bandwidth is N , and the RB resource ratio is
/mN N , the total capacity in the downlink is given by (13).
2 argˆ[ (1 ) | |]log (1 )
orth orth orth
m m f f
FBS t et
C N C N C
N H
(13)

Self-optimization Technologies for Small Cells: Challenges and Opportunities
http://www.sciencepublishinggroup.com 27
Figure 2.4 FBS density ˆFBS with different and fR . SOURCE: Reproduced
with permission from [29]. Copyright 2015 Springer International Publishing.
Furthermore, the maximum total capacity in the downlink is defined as an
optimization problem in (14), when the optimal is chosen.
* orth
,
argmax(C )
. . / 1 m mins t N N
(14)
1 2/
1 1 1 ] ( [ )orthC A B
2/
1 1/ [1 (1 2 / )(1 ) ] 0 orthdC d A B
/2
1
11 [ ]
(1 2 /
) min
B
(15)

Self-optimization Technologies for Small Cells: Challenges and Opportunities
28 http://www.sciencepublishinggroup.com
Where 2/ 2 2/
1 target 0 target| | [ ln(1 ) / ] / ( / )f f fB H N N P R R K
and
1 2 targetlog (1 ) 2A N N . Therefore, the maximum value orthC is achieved
at , /m minN N in Figure 2.5.
To ensure the quality of MUE and FUE, the total capacity orthC achieves the
maximum 51.13*10 bit/sorthC when the FBS density is 3
,ˆ 1.10*10FBS max ,
where 500mmR , , 0.28m min , and 10mfR . When 20mfR , the total
capacity 42.83*10 bit/sorthC with the FBS density of 4
,ˆ 2.74*10FBS max .
Figure 2.5 System capacity in orthogonal frequency allocation scheme with different
and mR . SOURCE: Reproduced with permission from [29]. Copyright 2015
Springer International Publishing.

Self-optimization Technologies for Small Cells: Challenges and Opportunities
http://www.sciencepublishinggroup.com 29
2.2.3 Co-channel Frequency Allocation Scheme
Although the orthogonal frequency allocation scheme can suppress the
co-channel interference among macrocells and small cells, it reduces the spectral
efficiency. In terms of the scarce spectrum resources, the co-channel frequency
allocation scheme has been paid much attention recently to improve the spectral
efficiency. In terms of densely deployed small cells, new types of interference are
brought forward, such as the interference from FBS to nearby MUE in the
downlink, and neighbour MBS to MUE at the cell edge. Moreover, FUE at the
cell edge will suffer the strong co-channel interference from neighbour MBS in
the downlink. Therefore, the density of FBS is a key factor that will affect the
capacity of hierarchical networks using the co-channel frequency allocation
scheme.
Therefore, this section will analyze key influential factors to FBS density and
find out the optimal FBS density to improve the downlink capacity of
hierarchical networks. Different types of interference are depicted in Figure 2.6.
In terms of RB resources of N , the probability of MUE that suffers the
co-channel interference from iMBS is 1/ N . The probability of FUE that
sufferers the co-channel interference from neighbour FBSs is 1/ N .

Self-optimization Technologies for Small Cells: Challenges and Opportunities
30 http://www.sciencepublishinggroup.com
Figure 2.6 Scenario of co-channel frequency allocation scheme. SOURCE:
Reproduced with permission from [29]. Copyright 2015
Springer International Publishing.
(1) The SINR of MUE in the downlink is depicted by coch
m mSINR d in (16).
6
0 , ,
1
( )1 1
i
coch m m mm m
m m f m
i
G P dSINR d
N I IN N
(16)
6 6
, ,
1 1
i i im m m m m m
i i
I G P d
, Pii FBS
f m Y s iYI G P Y
(17)

Self-optimization Technologies for Small Cells: Challenges and Opportunities
http://www.sciencepublishinggroup.com 31
,f mI is the co-channel interference from FBS to MUE in 0MBS . ,im mI is the
co-channel interference from neighbour iMBS to MUE in 0MBS . ,im md
depicts the mean distance for MUEs in iMBS and 0MBS .
Considering the SINR of MUE at the cell edge with the outage probability
constraint , coch
mSINR satisfies the constraint in (18).
arg( ( ) ) 1coch
m f t etP SINR R (18)
By applying (16) in (18), the maximum density of FBS ,ˆFBS MUE is depicted
in (19).
0
, 2/2
2
ln 1 1
ˆ
target target
m m
FBS MUE
f target
m
m
N
N P R
PN R K
P
(19)
(2) Similarly, the SINR of FUE at the cell edge with the outage probability
constraint is depicted by ( )coch
f fSINR d in (20).
6
0 , ,0
1 1i
f f fcoch
f f
f f m fi
G P dSINR d
N I IN N
(20)
0, \{ }
pii FBS
f f Y f iY YI G P Y
(21)
6 6
, ,
0 0i i im f m m m f
i i
I G P d
(22)

Self-optimization Technologies for Small Cells: Challenges and Opportunities
32 http://www.sciencepublishinggroup.com
,f fI is the co-channel interference from neighbour FBS in the same MBS.
,im fI is the co-channel interference from neighbour iMBS . ,im fd depicts the
mean distance for FUEs in iMBS and 0MBS .
Considering the SINR of FUE at the cell edge with the outage probability
constraint , coch
fSINR satisfies the constraint in (23).
arg( ( ) ) 1coch
f f t etP SINR R (23)
The maximum density of FBS ,ˆFBS FUE is depicted in (24).
2
0
, 2
2 2/
ln 1 1target m m target
f f f f
FBS FUE
f target
P R N
P R N P R
N R K
(24)
Therefore, , ,min( , )FBS FBS MUE FBS FUE depicts the maximum density of
FBS. In terms of the system bandwidth of N , FBS density is FB , and the
achievable capacity in the downlink is depicted in (25).
21 log (1 )coch
FBS targetC N H (25)
Therefore, two key factors restricting the capacity in the downlink for the
co-channel frequency allocation are RB resources and the density of FBS. The
capacity increases with the increase of RB as depicted in Figure 2.7. And the
maximum density exists which is mainly determined by MUE’s tolerance to the
co-channel interference.

Self-optimization Technologies for Small Cells: Challenges and Opportunities
http://www.sciencepublishinggroup.com 33
Figure 2.7 System capacity in co-channel deployment for different N . SOURCE:
Reproduced with permission from [29]. Copyright 2015
Springer International Publishing.
2.2.4 Hybrid Frequency Allocation Scheme
Based on the analysis of orthogonal and co-channel frequency allocation
schemes, the FBS density FBS and the optimal RB resource ratio will affect
the capacity of hierarchical networks. However, the self-deployment and
uncertainty of switch-on and switch-off features of FBS in practice are key
challenges. Besides, the time delay of information exchange among hierarchical
networks via a third party backhaul is another big problem unsolved. Therefore, it
is difficult to make an optimal resource allocation scheme based on the FBS
density in a practical scenario. Moreover, the co-channel frequency allocation
scheme can provide an efficient spectrum utilization solution, but it inevitably
introduces the strong co-channel interference which will decrease the system
capacity.

Self-optimization Technologies for Small Cells: Challenges and Opportunities
34 http://www.sciencepublishinggroup.com
Therefore, a dynamic hybrid frequency allocation scheme is proposed to
increase the capacity, by taking into account the advantages of both orthogonal
and co-channel frequency allocation schemes. The coverage of MBS is divided
into inner and outer circle regions as shown in Figure 2.8. In the inner circle
region, the FBS applies the orthogonal frequency allocation scheme. In the outer
circle region, the FBS applies the orthogonal frequency allocation scheme when
it is within the threshold radius thR of MUE and applies the co-channel
frequency allocation scheme when it is outside the threshold radius thR . Thus,
the hybrid frequency allocation scheme is described and analyzed in detail below,
which can improve the capacity by increasing the density of FBS and the
frequency reuse.
Figure 2.8 Scenario of hybrid frequency allocation scheme. SOURCE: Reproduced
with permission from [29]. Copyright 2015 Springer International Publishing.

Self-optimization Technologies for Small Cells: Challenges and Opportunities
http://www.sciencepublishinggroup.com 35
1) Capacity analysis of the inner circle region
To simplify the theoretical analysis and mathematical calculations, it is
assumed that FUE will suffer from the strong co-channel interference from the
serving 0MBS and the interference from neighboring kMBS ( 1,2,...,6)k is
ignored. SINR of the FUE is denoted by ,
hybrid
f innerSINR in (26).
,
0
f f fhybrid
f inner f
m m m
G P dSINR d
N G P d
(26)
fd represents the distance between FBS and FUE, and md represents the
distance between MBS and FUE. To simplify the analysis, the effect of channel
gain from fG and mG to ,
hybrid
f innerSINR is ignored. When FUE is located at the
edge of FBS as depicted by f fd R , ,
hybrid
f innerSINR is denoted in (27).
,
0
f fhybrid
f inner f target
m m
P RSINR R
N P d
(27)
When 4 and 0 0f f targetP R N , the radius of FBS fR should satisfy
1/4
2
0/ 4.27 10f f targetR P N m . The radius innerR of the inner cell region is
depicted in (28).
1/
0
target m
inner m f f
f f target
PR d R R
P R N
(28)
When fR is small and the effect of the background noise to innerR can be
ignored, the innerR is simplified as 1/4[1 ( / ) ] 5.95inner f target m f f mR R P P R R .

Self-optimization Technologies for Small Cells: Challenges and Opportunities
36 http://www.sciencepublishinggroup.com
Furthermore, the total number of RB is N and 1 N is assigned to FBS.
Considering the SINR of MUE at the cell edge m innerd R with the outage
probability constraint , the innerR is depicted in (29)-(30).
0/ 1hybrid
m inner m m inner targetP SINR R G P R N (29)
1/
0ln(1 ) / ( )inner m targetR P N
(30)
Similarly, considering the SINR of FUE at the cell edge m innerd R with the
outage probability constraint , the SINR of FUE is depicted in (31), where
/ [ (1 ) ]target f fs P R N .
0 ,
1/ (1 )
f f fhybrid
f f targethybrid
f f
G P RP SINR R
N I N
(31)
0, \{ }, 2
|| ||pii i innerFBS
hybrid
f f Y f iY Y Y RI G P Y
(32)
innerRhybrid 1/2 -1 2 1/2
f ,f FBS f inner f[exp(-sI )]=exp[- (sP ) tan (4R /(sP ) )]E (33)
By putting (32) and (33) into (31), the SINR of FUE is denoted in (34).
innerR- 1/2 -1 2 1/2
0 target f f FBS f inner fexp[-N /(P R )]exp[- (sP ) tan (4R /(sP ) )]=1-
hybrid
f f targetP SINR R
(34)
Therefore, the density of FBS in the inner circle region is denoted by innerR
FBS in
(35).

Self-optimization Technologies for Small Cells: Challenges and Opportunities
http://www.sciencepublishinggroup.com 37
0
1 2
ln 1 / ( )
/ [(1 ) ] 4 / / [(1 ) ]
innertarget f fR
FBS
target f inner target f
N P R
R N tan R R N
(35)
The capacity in the downlink within the inner circle region of the proposed
hybrid frequency allocation scheme is depicted in (36), where 2
inner innerH R .
21 log (1 )innerRhybrid
inner FBS inner targetC N H (36)
When 110N , 0.28 , 31.10 10innerR
FBS , 59.5minnerR , the downlink
capacity is 32.0 10 bit / shybrid
innerC .
2) Capacity analysis of the outer circle region
In the outer circle region of MBS, MUE will suffer from strong interferences
from FBSs in the vicinity. Thus, FBS will apply the restricted co-channel
frequency allocation scheme to be aware of the available RB resources in
different locations by adding cognitive abilities. FBS will minimize the
co-channel interference to MUE and increase the deployment density of small
cells. Within the threshold radius thR of MUE, the orthogonal frequency
allocation scheme is applied to FBS to minimize the interference. Otherwise, the
co-channel frequency allocation scheme is applied to FBS in the outer circle
region of MBS.
In terms of the maximum outage probability , the SINR of MUE is depicted
by hybrid
m mSINR d in (37), which includes the interference from neighboring
MBS and FBS outside the threshold radius of thR .

Self-optimization Technologies for Small Cells: Challenges and Opportunities
38 http://www.sciencepublishinggroup.com
6
0 , ,1
1 1i
hybrid m m mm m
hybrid
m m f mi
G P dSINR d
N I IN N
(37)
6 6
, ,
1 1i i im m m m m m
i i
I G P d
(38)
, ,|| |||| ||p
ii i thFBS
hybrid
f m Y f iY Y RI G P Y
(39)
Where ,
hybrid
f mI depicts the interference from FBS outside the threshold radius
thR to MUE, ,im mI represents the interference from neighboring iMBS to
MUE in 0MBS , ,im md is the mean distance between iMBS and MUE in 0MBS .
When 4 , the calculations can be simplified as denoted in (40).
thRhybrid 1/2 -1 2 1/2
f ,m FBS f th f[exp(-sI )]=exp{- (sP ) [ /2-tan (R /(sP ) )]}E (40)
In terms of the outage probability constraint , the SINR of MUE at the cell
edge of MBS is depicted in (41).
1hybrid
m m targetP SINR R (41)
By putting (37) and (40) into (41), the SINR of MUE is denoted in (42), where
only one strong interference from kMBS is considered and ,im m md R .
Furthermore, the density of FBS is denoted by ,thR
FBS MUE in (43).

Self-optimization Technologies for Small Cells: Challenges and Opportunities
http://www.sciencepublishinggroup.com 39
0
42 1 2 2
,
exp( )
exp tan /1 / 2
1
th
hybrid
m m target
target
f target f targetRm mFBS MUE m th m
target m m
P SINR R
N
P PP RR R R
N NP NP
(42)
0
4
,
2 1 2 2
ln 1 1
tan /2
th
target target
m mR
FBS MUE
f target f target
m th m
m m
N
N P R
P PR R R
NP NP
(43)
Thus, the capacity in the downlink for the outer circle region is depicted by
hybrid
outerC in (44).
21 log (1 )hybrid outer
outer FBS outer targetC N H (44)
Where 2 23 3 2outer inner m innerH H H R R represents the outer circle
region. And the total capacity in the downlink of inner and outer circle regions are
denoted by hybrid
totalC in (45)-(46).
hybrid hybrid hybrid
total inner outerC C C (45)
21 1 log (1 )innerRhybrid outer
total FBS inner FBS outer targetC H H N (46)
In terms of different RB resources N and the threshold radius thR , the
capacity of hybrid frequency allocation scheme and co-channel frequency
allocation scheme is compared as depicted in Figure 2.9. The capacity will
increase with the increase of thR in the outer circle region. By using the

Self-optimization Technologies for Small Cells: Challenges and Opportunities
40 http://www.sciencepublishinggroup.com
orthogonal frequency allocation scheme for FBS within the threshold radius thR
of MUE in the outer circle region, the strong interference from FBS to MUE in
the vicinity can be greatly minimized, which can improve the capacity in the
downlink. Therefore, the proposed hybrid frequency allocation scheme can
effectively minimize the cross-tier interference in hierarchical networks. When
110N , 0.28 , 59.5minnerR , 50mthR , 31.10 10innerR
FBS ,
68.73 10outerR
FBS , the theoretical maximum capacity can achieve
33.45 10 bit / shybrid
totalC .
Figure 2.9 Total capacity (hybrid vs. co-channel deployment). SOURCE: Reproduced
with permission from [29]. Copyright 2015 Springer International Publishing.
In summary, based on the analysis above, there are four key factors that will
affect the capacity of hierarchical networks in the downlink. First, innerR is used
to identify the inner and outer cell regions, which is directly related to FBS
coverage radius fR . Second, the threshold radius thR of MUE will affect the
capacity which increases as thR increases. Third, the RB resource N will
Self-optimization Technologies for Small Cells: Challenges and Opportunities
http://www.sciencepublishinggroup.com 41
affect the capacity which will increase with the increase of N . Fourth, the
network capacity will increase as the increase of FBS . Therefore, by optimal
parameters design in the hybrid frequency allocation scheme, co-channel
interference can be greatly minimized, which can increase the FBS deployment
density and improve the network capacity.
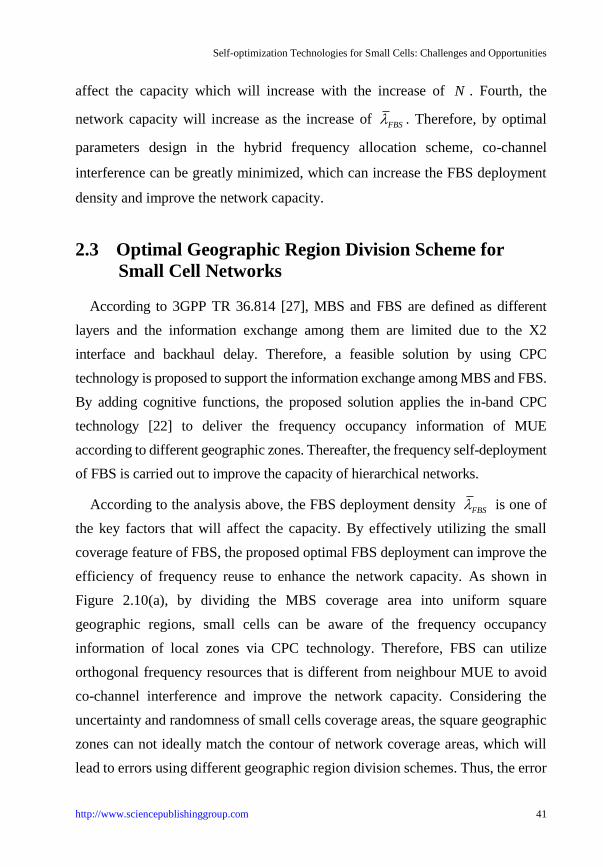
2.3 Optimal Geographic Region Division Scheme for
Small Cell Networks
According to 3GPP TR 36.814 [27], MBS and FBS are defined as different
layers and the information exchange among them are limited due to the X2
interface and backhaul delay. Therefore, a feasible solution by using CPC
technology is proposed to support the information exchange among MBS and FBS.
By adding cognitive functions, the proposed solution applies the in-band CPC
technology [22] to deliver the frequency occupancy information of MUE
according to different geographic zones. Thereafter, the frequency self-deployment
of FBS is carried out to improve the capacity of hierarchical networks.
According to the analysis above, the FBS deployment density FBS is one of
the key factors that will affect the capacity. By effectively utilizing the small
coverage feature of FBS, the proposed optimal FBS deployment can improve the
efficiency of frequency reuse to enhance the network capacity. As shown in
Figure 2.10(a), by dividing the MBS coverage area into uniform square
geographic regions, small cells can be aware of the frequency occupancy
information of local zones via CPC technology. Therefore, FBS can utilize
orthogonal frequency resources that is different from neighbour MUE to avoid
co-channel interference and improve the network capacity. Considering the
uncertainty and randomness of small cells coverage areas, the square geographic
zones can not ideally match the contour of network coverage areas, which will
lead to errors using different geographic region division schemes. Thus, the error

Self-optimization Technologies for Small Cells: Challenges and Opportunities
42 http://www.sciencepublishinggroup.com
probability of different geographic region division schemes is theoretically
analyzed. Then, the optimal region division scheme is proposed and achieved in
different cases.
Figure 2.10 Scenario of optimal zone division in different geographical regions.
SOURCE: Reproduced with permission from [29]. Copyright 2015 Springer
International Publishing.
Self-optimization Technologies for Small Cells: Challenges and Opportunities
http://www.sciencepublishinggroup.com 43
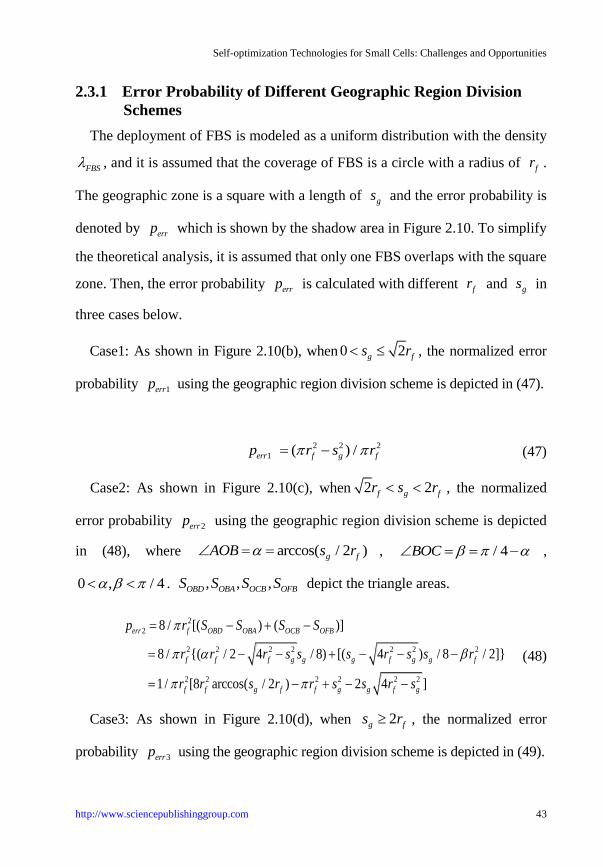
2.3.1 Error Probability of Different Geographic Region Division
Schemes
The deployment of FBS is modeled as a uniform distribution with the density
FBS , and it is assumed that the coverage of FBS is a circle with a radius of fr .
The geographic zone is a square with a length of gs and the error probability is
denoted by errp which is shown by the shadow area in Figure 2.10. To simplify
the theoretical analysis, it is assumed that only one FBS overlaps with the square
zone. Then, the error probability errp is calculated with different fr and gs in
three cases below.
Case1: As shown in Figure 2.10(b), when 0 2g fs r , the normalized error
probability 1errp using the geographic region division scheme is depicted in (47).
2 2 2
1 ( ) / err f g fp r s r (47)
Case2: As shown in Figure 2.10(c), when 2 2f g fr s r , the normalized
error probability 2errp using the geographic region division scheme is depicted
in (48), where arccos( / 2 )g fAOB s r , / 4BOC ,
0 , / 4 . , , ,OBD OBA OCB OFBS S S S depict the triangle areas.
2
2
2 2 2 2 2 2 2
2 2 2 2 2 2
8 / [( ) ( )]
8 / {( / 2 4 / 8) [( 4 ) / 8 / 2]}
1/ [8 arccos( / 2 ) 2 4 ]
err f OBD OBA OCB OFB
f f f g g g f g g f
f f g f f g g f g
p r S S S S
r r r s s s r s s r
r r s r r s s r s
(48)
Case3: As shown in Figure 2.10(d), when 2g fs r , the normalized error
probability 3errp using the geographic region division scheme is depicted in (49).

Self-optimization Technologies for Small Cells: Challenges and Opportunities
44 http://www.sciencepublishinggroup.com
2 2 2
3 ( / )err g f fp s r r (49)
The normalized error probability of dividing geographic region errp is
denoted in (50).
2 2 2
2 2 2 2 2 2
2 2 2
/ 0 2
8 arccos( ) 2 4 / 2 22
/ 2
f g f g f
g
err f f g g f g f f g f
f
g f f g f
r s r when s r
sp r r s s r s r when r s r
r
s r r when s r
(50)
2.3.2 Optimal Geographic Region Division Scheme
The optimal geographic region division scheme is defined as an optimization
problem that how to design an optimal square zone length Opt
gs with the
minimum error probability errp , as denoted in (51).
argming
Opt
g errs
s p (51)
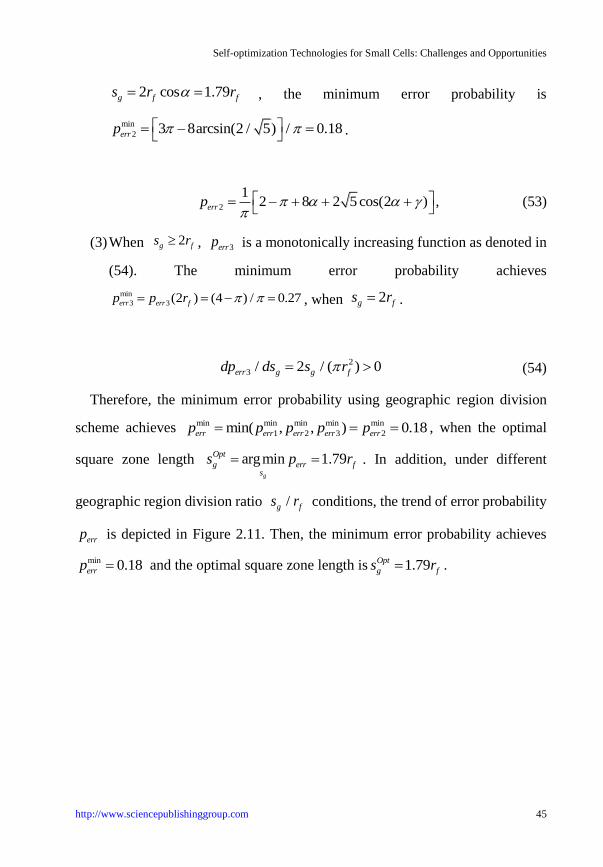
(1) When 0 2g fs r , 1errp is a monotonically decreasing function as
denoted in (52). The minimum error probability achieves
min
1 1( 2 ) 2 / 0.36err err fp p r , when 2g fs r .
2
1 / 2 / ( ) 0err g g fdp ds s r (52)
(2) When 2 2f g fr s r , by applying 2 cosg fs r in (48), 2errp is
depicted in (53), where arcsin(2 / 5) . When / 2 arcsin(2 / 5) ,
Self-optimization Technologies for Small Cells: Challenges and Opportunities
http://www.sciencepublishinggroup.com 45
2 cos 1.79g f fs r r , the minimum error probability is
min
2 3 8arcsin(2 / 5) / 0.18errp
.
2
12 8 2 5 cos(2 ) ,errp
(53)
(3) When 2g fs r , 3errp is a monotonically increasing function as denoted in
(54). The minimum error probability achieves
min
3 3(2 ) (4 ) / 0.27err err fp p r , when 2g fs r .
2
3 / 2 / ( ) 0err g g fdp ds s r (54)
Therefore, the minimum error probability using geographic region division
scheme achieves min min min min min
1 2 3 2min( , , ) 0.18err err err err errp p p p p , when the optimal
square zone length argmin 1.79g
Opt
g err fs
s p r . In addition, under different
geographic region division ratio /g fs r conditions, the trend of error probability
errp is depicted in Figure 2.11. Then, the minimum error probability achieves
min 0.18errp and the optimal square zone length is 1.79Opt
g fs r .

Self-optimization Technologies for Small Cells: Challenges and Opportunities
46 http://www.sciencepublishinggroup.com
Figure 2.11 Minimum error probability errp and square zone length /g fs
using
the optimal geographic region division scheme. SOURCE: Reproduced with permission
from [29]. Copyright 2015 Springer International Publishing.
2.4 Self-deployment Procedure of Hybrid Frequency
Allocation Scheme
In order to efficiently deliver the frequency occupancy information of MBS
in different geographic zones, the in-band CPC technology is applied as a
candidate solution in [22]. Therefore, the self-deployment procedure of FBS
using hybrid frequency allocation scheme is shown in Figure 2.12.
Step 1: FBS starts up and works in the listening mode. And FBS receives the
frequency occupancy information of MBS via the CPC channel and exchanges
the self-deployment default parameters with the core network via backhaul links.

Self-optimization Technologies for Small Cells: Challenges and Opportunities
http://www.sciencepublishinggroup.com 47
Figure 2.12 Procedure of hybrid frequency allocation scheme. SOURCE: Reproduced
with permission from [29]. Copyright 2015 Springer International Publishing.
Step 2: FBS monitors the CPC channel and depicts key parameters of
heterogeneous networks, such as the frequency occupancy information of MUE
within the vicinity of FBS, the density of FBS, the received signal strength of
MBS to estimate the distance between FBS and MBS.
Step 3: FBS makes spectrum self-deployment decisions based on the
calculation of innerR and thR . By comparing the distance of MBSd to innerR , FBS
Self-optimization Technologies for Small Cells: Challenges and Opportunities
48 http://www.sciencepublishinggroup.com
can decide whether it belongs to the inner circle region or the outer circle region.
Then, FBS makes a decision on applying different frequency allocation schemes,
such as orthogonal, co-channel and hybrid frequency allocation schemes, based
on the distance between MUEd and thR .
Step 4: The maximum capacity of heterogeneous network is calculated and the
procedure of hybrid frequency allocation scheme ends.
2.5 Results and Performance Analyses
In this part, numerical results of SINR and capacity of FBS and MBS are
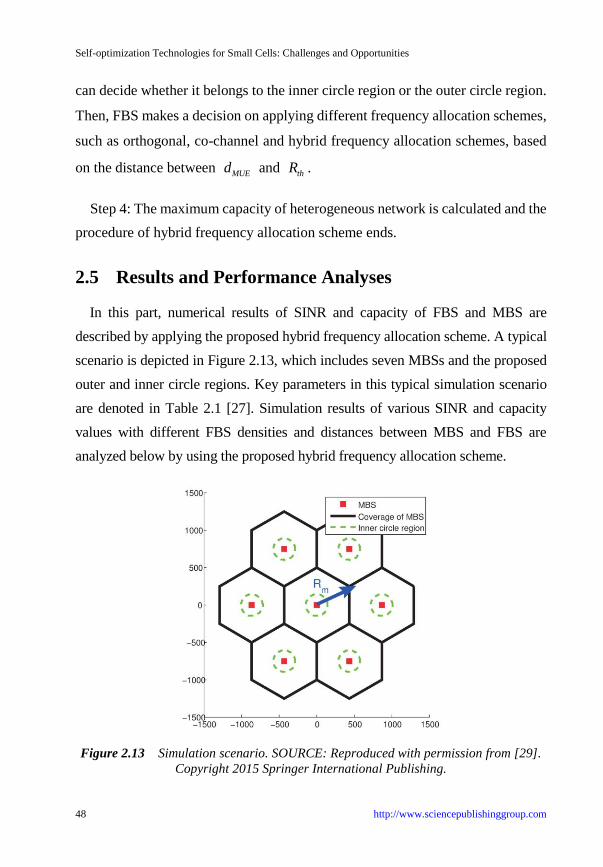
described by applying the proposed hybrid frequency allocation scheme. A typical
scenario is depicted in Figure 2.13, which includes seven MBSs and the proposed
outer and inner circle regions. Key parameters in this typical simulation scenario
are denoted in Table 2.1 [27]. Simulation results of various SINR and capacity
values with different FBS densities and distances between MBS and FBS are
analyzed below by using the proposed hybrid frequency allocation scheme.
Figure 2.13 Simulation scenario. SOURCE: Reproduced with permission from [29].
Copyright 2015 Springer International Publishing.
Self-optimization Technologies for Small Cells: Challenges and Opportunities
http://www.sciencepublishinggroup.com 49
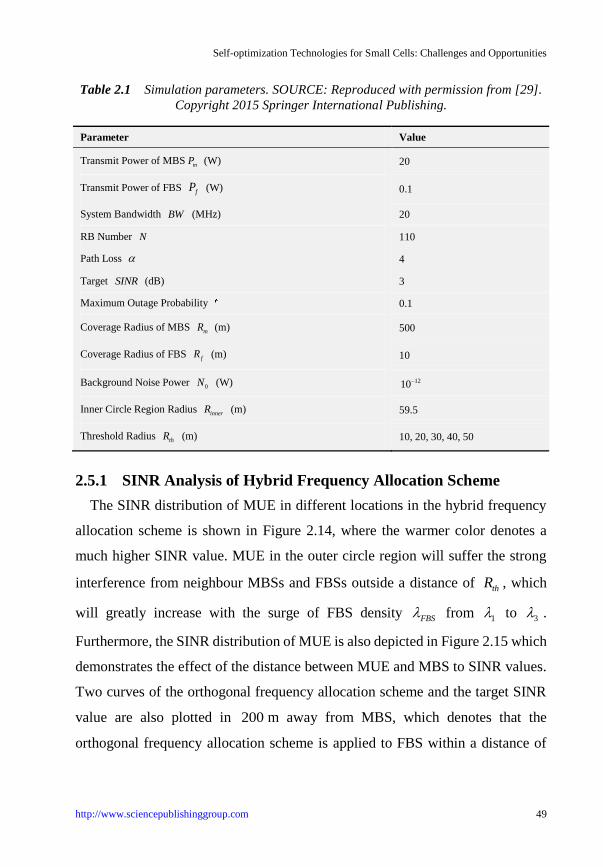
Table 2.1 Simulation parameters. SOURCE: Reproduced with permission from [29].
Copyright 2015 Springer International Publishing.
Parameter Value
Transmit Power of MBS mP (W) 20
Transmit Power of FBS fP (W) 0.1
System Bandwidth BW (MHz) 20
RB Number N 110
Path Loss 4
Target SINR (dB) 3
Maximum Outage Probability 0.1
Coverage Radius of MBS mR (m) 500
Coverage Radius of FBS fR (m) 10
Background Noise Power 0N (W) 1210
Inner Circle Region Radius innerR (m) 59.5
Threshold Radius thR (m) 10, 20, 30, 40, 50
2.5.1 SINR Analysis of Hybrid Frequency Allocation Scheme
The SINR distribution of MUE in different locations in the hybrid frequency
allocation scheme is shown in Figure 2.14, where the warmer color denotes a
much higher SINR value. MUE in the outer circle region will suffer the strong
interference from neighbour MBSs and FBSs outside a distance of thR , which
will greatly increase with the surge of FBS density FBS from 1 to 3 .
Furthermore, the SINR distribution of MUE is also depicted in Figure 2.15 which
demonstrates the effect of the distance between MUE and MBS to SINR values.
Two curves of the orthogonal frequency allocation scheme and the target SINR
value are also plotted in 200 m away from MBS, which denotes that the
orthogonal frequency allocation scheme is applied to FBS within a distance of

Self-optimization Technologies for Small Cells: Challenges and Opportunities
50 http://www.sciencepublishinggroup.com
thR of MUE. With the increase of FBS density FBS , the SINR value of MUE
will decrease extensively which denotes that MUE suffers from the strong
interference from neighbour FBSs outside a distance of thR . Therefore, MUE at
the edge of MBS can dynamically increase the threshold radius thR to decrease
the co-channel interference from densely deployed FBSs.
Moreover, the SINR distribution of FUE is shown in Figure 2.16 with different
FBS density values. With the increase of FBS, the SINR of FUE within FBS’s
coverage increases. But when the density of FBS is extensively large, the SINR
of FUE will decrease due to the strong interference from neighbour FBSs around
the FUE. Thus, the SINR distribution of FUE is also depicted in Figure 2.17
which demonstrates the effect of the distance between FUE and MBS to SINR
values. Two curves of the orthogonal frequency allocation scheme and the target
SINR value are also plotted in Figure 2.17. The SINR value of FUE achieves
several small peaks at the distance around 200 m and 300 m away from MBS,
which denotes that the orthogonal frequency allocation scheme is applied to
neighbour FBSs to decrease co-channel interferences. Furthermore, the
appropriate increase of thR can also decrease the co-channel interference to
FUE from neighbour FBSs, especially when the FBS density FBS is large.

Self-optimization Technologies for Small Cells: Challenges and Opportunities
http://www.sciencepublishinggroup.com 51
Figure 2.14 SINR of MUE with different FBS density FBS . SOURCE: Reproduced
with permission from [29]. Copyright 2015 Springer International Publishing.
Figure 2.15 SINR distribution of MUE with different distances between MUE and
MBS. SOURCE: Reproduced with permission from [29]. Copyright 2015
Springer International Publishing.

Self-optimization Technologies for Small Cells: Challenges and Opportunities
52 http://www.sciencepublishinggroup.com
Figure 2.16 SINR of FUE with different FBS density FBS . SOURCE: Reproduced
with permission from [29]. Copyright 2015 Springer International Publishing.
Figure 2.17 SINR distribution of FUE with different distances between FUE and MBS.
SOURCE: Reproduced with permission from [29]. Copyright 2015
Springer International Publishing.

Self-optimization Technologies for Small Cells: Challenges and Opportunities
http://www.sciencepublishinggroup.com 53
2.5.2 Capacity Analysis of Hybrid Frequency Allocation Scheme
As shown in Figure 2.18, the capacity of MBS increases with the increase of
MUE density. Due to the co-channel interference from densely deployed
neighbour FBSs, the capacity of MBS decreases with the increase of FBS density
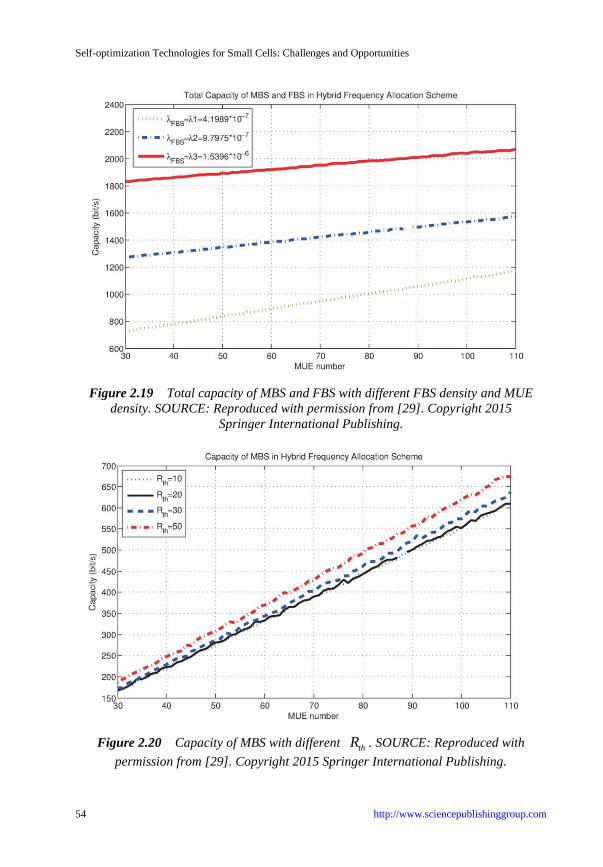
FBS . Moreover, the total capacity hybridC will increase with the surge of FBS
density FBS as shown in Figure 2.19, which depicts that the densely deployed
FBSs can increase the total capacity with appropriate thR by minimizing the
co-channel interference. And the total capacity will also increase with the
increase of MUE density. Moreover, the co-channel interference from neighbour
FBS to MUE can be minimized and the capacity of MBS and FBS will also
increase with the increase of thR in Figure 2.20 and Figure 2.21.
Figure 2.18 Capacity of MBS with different FBS density and MUE density. SOURCE:
Reproduced with permission from [29]. Copyright 2015 Springer
International Publishing.
Self-optimization Technologies for Small Cells: Challenges and Opportunities
54 http://www.sciencepublishinggroup.com
Figure 2.19 Total capacity of MBS and FBS with different FBS density and MUE
density. SOURCE: Reproduced with permission from [29]. Copyright 2015
Springer International Publishing.
Figure 2.20 Capacity of MBS with different thR . SOURCE: Reproduced with
permission from [29]. Copyright 2015 Springer International Publishing.

Self-optimization Technologies for Small Cells: Challenges and Opportunities
http://www.sciencepublishinggroup.com 55
Figure 2.21 Capacity of FBS with different thR . SOURCE: Reproduced with
permission from [29]. Copyright 2015 Springer International Publishing.
2.6 Concluding Remarks
To increase the capacity of hierarchical networks, a hybrid frequency
allocation scheme for densely deployed small cells is proposed. Based on the
theoretical modeling and mathematical analysis, three frequency allocation
schemes are proposed and key parameters affecting the capacity are defined and
proved with closed-form solutions in different scenarios. Both the outer and inner
circle regions are proposed to minimize the co-channel interference to MUE from
neighbour FBSs. Then, the optimal geographic region division scheme is
proposed with the optimal square zone length solutions, which can improve the
information delivery among small cells. Furthermore, the self-deployment
procedure of proposed hybrid frequency allocation scheme is designed and
described in detail. Finally, numerical results are presented and analyzed to verify
Self-optimization Technologies for Small Cells: Challenges and Opportunities
56 http://www.sciencepublishinggroup.com
the capacity improvement of the proposed scheme by considering the density of
FBS, co-channel interference and the spatial separation among small cells.
Reference
[1] G. Mansfield. “Femtocells in the US market-business drivers and consumer
propositions”, in Proc. Femtocells Europe, ATT, London, 2008.
[2] J. Zhang, G. de la Roche, Femtocells: technologies and deployment,
John Wiley & Sons, 2010.
[3] J. Cullen, “Radioframe presentation”, Femtocell Europe, London, 2008.
[4] Cisco VNI forecast white paper, Cisco visual networking index: global
mobile data traffic forecast update, pp. 2013-2018, 2014.
[5] W. Webb, Wireless communications: the future, John Wiley & Sons, 2007.
[6] V. Chandrasekhar, J. G. Andrews and A. Gatherer, “Femtocell networks:
a survey”, IEEE Commun. Mag., vol. 46, no. 9, pp. 59-67, Sept. 2008.
[7] J. G. Andrews, H. Claussen, M. Dohler, S. Rangan and M. C. Reed,
“Femtocells: past, present, and future”, IEEE J. Sel. Areas Commun., vol. 30,
no. 3, pp. 497-508, Apr. 2012.
[8] P. Xia, V. Chandrasekhar and J. G. Andrews, “Femtocell access control in
the TDMA/OFDMA uplink”, in Proc. IEEE Globecom, Miami, FL, pp. 1-5.
2010.
[9] H. Elsawy, E. Hossain and D. I. Kim, “HetNets with cognitive small cells:
user offloading and distributed channel access techniques”, IEEE Commun.
Mag., vol. 51, no. 6, pp. 28-36, Jun. 2013.
[10] D. Mavrakis, Small cell market status, Informa Telecoms & Media, 2013.
[11] P. Xia, V. Chandrasekhar and J. G. Andrews, “Open vs. closed access
femtocells in the uplink”, IEEE Trans. Wireless Commun., vol. 9, no. 12,
pp. 3798-3809, Dec. 2010.

Self-optimization Technologies for Small Cells: Challenges and Opportunities
http://www.sciencepublishinggroup.com 57
[12] V. Chandrasekhar and J. G. Andrews, “Spectrum allocation in tiered cellular
networks”, IEEE Trans. Commun., vol. 57, no. 10, pp. 3059-3068, Oct.
2009.
[13] W. C. Cheung, T. Q. S. Quek and M. Kountouris, “Throughput optimization,
spectrum allocation, and access control in two-tier femtocell networks”,
IEEE J. Sel. Areas Commun., vol. 30, no. 3, pp. 561-574, Apr. 2012.
[14] I. Guvenc, M. R. Jeong, F. Watanabe and H. Inamura, “A hybrid frequency
assignment for femtocells and coverage area analysis for co-channel
operation”, IEEE Commun. Lett., vol. 12, no. 12, pp. 880-882, Dec. 2008.
[15] A. Galindo-Serrano, L. Giupponi and M. Dohler, “Cognition and docition in
OFDMA-based femtocell networks”, in Proc. IEEE Globecom, Miami, FL,
Dec. 6-10, 2010.
[16] V. Chandrasekhar and J. G. Andrews, “Uplink capacity and interference
avoidance for two-tier femtocell networks”, IEEE Trans. Wireless Commun.,
vol. 8, no. 7, pp. 3498-3509, Jul. 2009.
[17] D. Lopez-Perez, A. Valcarce, G. de la Roche and J. Zhang, “OFDMA
femtocells: a roadmap on interference avoidance”, IEEE Commun. Mag.,
vol. 47, no. 9, pp. 41-48, Sept. 2009.
[18] D. Lopez-Perez, A Ladanyi, A. Juttner and J. Zhang, “OFDMA femtocells: a
self-organizing approach for frequency assignment”, in Proc. IEEE PIMRC,
Tokyo, Japan, pp. 2202-2207, Sept. 2009.
[19] S. Y. Lien, C. C. Tseng, K. C. Chen and C. W. Su, “Cognitive radio resource
management for QoS guarantees in autonomous femtocell networks”, in
Proc. IEEE ICC, Cape Town, pp. 1-6, May 2010.
[20] H. ElSawy and E. Hossain, “Two-tier HetNets with cognitive femtocells:
downlink performance modeling and analysis in a multichannel
environment”, IEEE Trans. Mob. Comput., vol. 13, no. 3, pp. 649-663, Mar.
2014.
[21] C. H. M. de Lima, M. Bennis and M. Latva-aho, “Coordination mechanisms
for self-organizing femtocells in two-tier coexistence scenarios”, IEEE

Self-optimization Technologies for Small Cells: Challenges and Opportunities
58 http://www.sciencepublishinggroup.com
Trans. Wireless Commun., vol. 11, no. 6, pp. 2212-2223, Jun. 2012.
[22] Q. Zhang, Z. Feng, G. Zhang, “Efficient mesh division and differential
information coding schemes in broadcast cognitive pilot channel”, Wireless
Pers. Commun., vol. 63, no. 2, pp. 363-392, Mar. 2012.
[23] K. Nolte, A. Kaloxylos, K. Tsagkaris, “The E3 architecture: enabling future
cellular networks with cognitive and self-x capabilities”, Int. J. Network
Management, vol. 21, no. 5, Sept. 2011.
[24] S. M. Cheng, W. C. Ao and K. C. Chen, “Downlink capacity of two-tier
cognitive femto networks”, in Proc. IEEE PIMRC, Istanbul, pp. 1303-1308,
Sept. 2010.
[25] J. Kingman, Poisson processes, Oxford University Press, 1993.
[26] Poisson process website,
http://en.wikipedia.org/wiki/Poisson_distribution\#2-dimensional_Poisson_
process.
[27] “3GPP TSG RAN (E-UTRA): Further advancements for E-UTRA physical
layer aspects (Release 9)”, 3GPP TR 36.814 V9.0.0, 3rd
Generation
Partnership Project (3GPP), 2010.
[28] F. Baccelli, B. Blaszczyszyn and P. Muhlethaler, “An aloha protocol for
multihop mobile wireless networks”, IEEE Trans. Inf. Theory, vol. 52, no. 2,
pp. 421-436, Feb. 2006.
[29] Q. Zhang, Z. Feng, Y. Zhang and T. Yang, “Hybrid frequency allocation
scheme for capacity improvement in densely deployed small cells”,
EURASIP J. Wireless Comm. and Networking, 2015 (62), pp. 1-19, Jun.
2015.