Embed Size (px)
Citation preview

CAPACITYCAPACITY
LOAD
OUTPUT

Learning Objectives
Explain the importance of capacity planning. Discuss ways of defining and measuring
capacity. Describe the determinants of effective
capacity. Discuss the major considerations related to
developing capacity alternatives. Briefly describe approaches that are useful
for evaluating capacity alternatives5-2
CAPACITYCAPACITY

• location• aggregate planning, and• scheduling
are 3 essential factors in the decision making of selecting capacity, independent if it is:• short term• intermediate, or• long term capacity.
Introduction
5-3
CAPACITYCAPACITY

Activities
6
Time horizon
(months)12 18 24
0
Location decisions
Aggregate Planning
Scheduling
Short termIntermediate
Long term5-4
CAPACITYCAPACITY
Capacity Planning
Capacity is the upper limit or ceiling on the load that an operating unit can handle.–The load might be in terms of the
number of physical units produced, e.g. bicycles assembled per hour or the number of services performed, e.g. computers upgraded per hour.
–An operating unit can be a plant, department, machine, store or worker.
5-6
CAPACITYCAPACITY

Capacity Planning Capacity is the upper limit or ceiling on the
load that an operating unit can handle.
Capacity also includes – Equipment– Space– Employee skills
5-7
CAPACITYCAPACITY

Basic questions in capacity handling
What kind of capacity is needed? How much is needed? When is it needed?
5-8
CAPACITYCAPACITY

1. Impacts ability to meet future demands2. Affects operating costs3. Major determinant of initial costs4. Involves long-term commitment5. Affects competitiveness, e.g. speed6. Affects ease of management7. Globalization adds complexity8. Impacts long range planning
Importance of Capacity Decisions
5-9
CAPACITYCAPACITY

Designing and Measuring Capacity
Design capacity– maximum output rate or service capacity an
operation, process, or facility is designed for Effective capacity
– Design capacity minus allowances such as personal time, maintenance, and scrap
Actual output– rate of output actually achieved - cannot
exceed effective capacity.5-10
CAPACITYCAPACITY

Actual outputEfficiency =
Effective capacity
Actual outputUtilization =
Design capacity
Both measures expressed as percentages
Designing and Measuring Capacity
5-11
CAPACITYCAPACITY
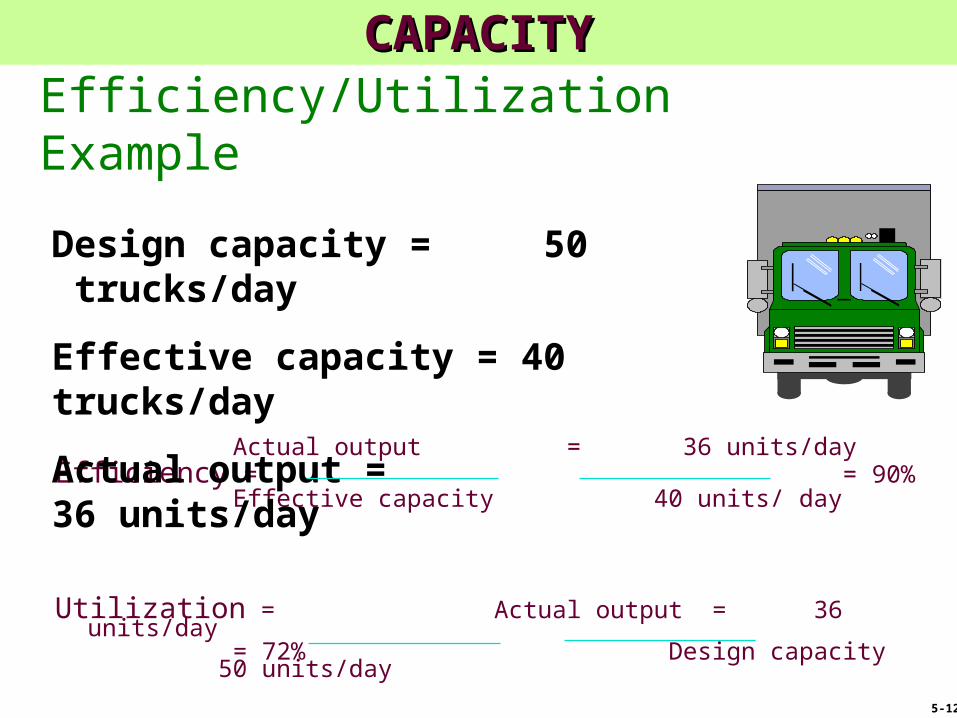
Actual output = 36 units/day Efficiency = = 90%
Effective capacity 40 units/ day
Utilization = Actual output = 36 units/day = 72%
Design capacity 50 units/day
Efficiency/Utilization Example
Design capacity = 50 trucks/day
Effective capacity = 40 trucks/day
Actual output = 36 units/day
5-12
CAPACITYCAPACITY

Decisions that have an impact on Capacity
Facilities Product and service factors Process factors Human factors Policy factors Operational factors Supply chain factors External factors
5-13
CAPACITYCAPACITY

Capacity Strategy Formulation
For long-term demand patterns and variability of demand
The growth rate The cost of building and operating facilities The rate and direction of technological
innovation The likely behavior of competitors Availability of capital and other inputs
5-15
CAPACITYCAPACITY
Key Decisions of Capacity Planning
1. Amount of capacity needed• Capacity cushion (100% - Utilization)
2. Timing of changes
3. Need to maintain balance thruout the system
4. Extent of flexibility of facilities and workforce
Capacity cushion = extra demand intended to offset uncertainty
5-16
CAPACITYCAPACITY

Capacity Expansion Strategies
5-17
CAPACITYCAPACITY

Calculating Processing Requirements
P r o d u c tA n n u a l
D e m a n d
S t a n d a r dp r o c e s s i n g t i m e
p e r u n i t ( h r . )P r o c e s s i n g t i m e
n e e d e d ( h r . )
# 1
# 2
# 3
4 0 0
3 0 0
7 0 0
5 . 0
8 . 0
2 . 0
2 , 0 0 0
2 , 4 0 0
1 , 4 0 0 5 , 8 0 0
P r o d u c tA n n u a l
D e m a n d
S t a n d a r dp r o c e s s i n g t i m e
p e r u n i t ( h r . )P r o c e s s i n g t i m e
n e e d e d ( h r . )
# 1
# 2
# 3
4 0 0
3 0 0
7 0 0
5 . 0
8 . 0
2 . 0
2 , 0 0 0
2 , 4 0 0
1 , 4 0 0 5 , 8 0 0
Calculate the number of machines needed?
A company works one 8 hour shift, 250 days/year, and has the following figures:
5-18
CAPACITYCAPACITY

Calculating Processing Requirements
P r o d u c tA n n u a l
D e m a n d
S t a n d a r dp r o c e s s i n g t i m e
p e r u n i t ( h r . )P r o c e s s i n g t i m e
n e e d e d ( h r . )
# 1
# 2
# 3
4 0 0
3 0 0
7 0 0
5 . 0
8 . 0
2 . 0
2 , 0 0 0
2 , 4 0 0
1 , 4 0 0 5 , 8 0 0
P r o d u c tA n n u a l
D e m a n d
S t a n d a r dp r o c e s s i n g t i m e
p e r u n i t ( h r . )P r o c e s s i n g t i m e
n e e d e d ( h r . )
# 1
# 2
# 3
4 0 0
3 0 0
7 0 0
5 . 0
8 . 0
2 . 0
2 , 0 0 0
2 , 4 0 0
1 , 4 0 0 5 , 8 0 0
If annual capacity is 2000 hours [= 8 x 250], then we need:5,800 hours/2,000 hours = 2.90 machines = 3 machines
A company works one 8 hour shift, 250 days/year, and has the following figures:
5-19
CAPACITYCAPACITY

Economies of Scale
Economies of scale– If the output rate is less than the optimal level,
increasing output rate results in decreasing average unit costs
Diseconomies of scale– If the output rate is more than the optimal
level, increasing the output rate results in increasing average unit costs
5-20
CAPACITYCAPACITY

5-21
Optimal Rate of Output
Minimumcost
Ave
rage
cos
t p
er u
nit
0 Rate of output
Production units have an optimal rate of output for minimal cost.
Figure 5.4
Minimum average cost per unit
CAPACITYCAPACITY

Economies of scale Dis-economies of scaleς
250,000 PC
125,000 PC
375,000 PC
Ave
rage
cos
t p
er u
nit
Output rate
Economies of scale(Under - utilization)
Dis-economies of scale(Over - utilization)
Optimum operating level
MinimumcostA
vera
ge c
ost
per
un
it
Output rate
5-22
CAPACITYCAPACITY

Output10/hr
Operation 3
10/hr
Operation 4
20/hr
Operation 2
30/hr
Operation 120/hr
Input
Bottleneck Operation
Bottleneck
Maximum output ratelimited by bottleneck
5-23
CAPACITYCAPACITY

Stevenson, p. 188-192, it can include slides 22 - here
Developing Capacity Alternatives
1. Design flexibility into systems
2. Take stage of life cycle into account
3. Take a “big picture” approach to capacity changes
4. Prepare to deal with capacity “chunks”
5. Attempt to smooth out capacity requirements
6. Identify the optimal operating level
5-24
CAPACITYCAPACITY

END

Techniques for Evaluating Capacity Alternatives
Cost-volume analysis– Break-even point
Financial analysis– Cash flow– Present value
Decision theory Waiting-line analysis
5-26
CAPACITYCAPACITY

Cost-Volume Relationships
Am
oun
t ($
)
0Q (volume in units)
Total cost = VC + FC
Total variable cost (VC)
Fixed cost (FC)A
mou
nt
($)
Q (volume in units)0
Total rev
enue
5-27
CAPACITYCAPACITY

Break-Even Problem with Step Fixed Costs
Quantity
FC + VC = TC
FC + VC = TCFC + VC = TC
Step fixed costs and variable costs.
1 machine
2 machines
3 machines
5-28
CAPACITYCAPACITY
1. One product is involved2. Everything produced can be sold3. Variable cost per unit is the same regardless
of volume4. Fixed costs do not change with volume5. Revenue per unit constant with volume6. Revenue per unit exceeds variable cost per
unit
Assumptions of Cost-Volume Analysis
5-29
CAPACITYCAPACITY

Financial Analysis
Cash Flow - the difference between cash received from sales and other sources, and cash outflow for labor, material, overhead, and taxes.
Present Value - the sum, in current value, of all future cash flows of an investment proposal.
5-30
CAPACITYCAPACITY

Decision Theory
Helpful tool for financial comparison of alternatives under conditions of risk or uncertainty
Suited to capacity decisions
5-31
CAPACITYCAPACITY

EXAMPLES
5-32
CAPACITYCAPACITY