Embed Size (px)
Citation preview
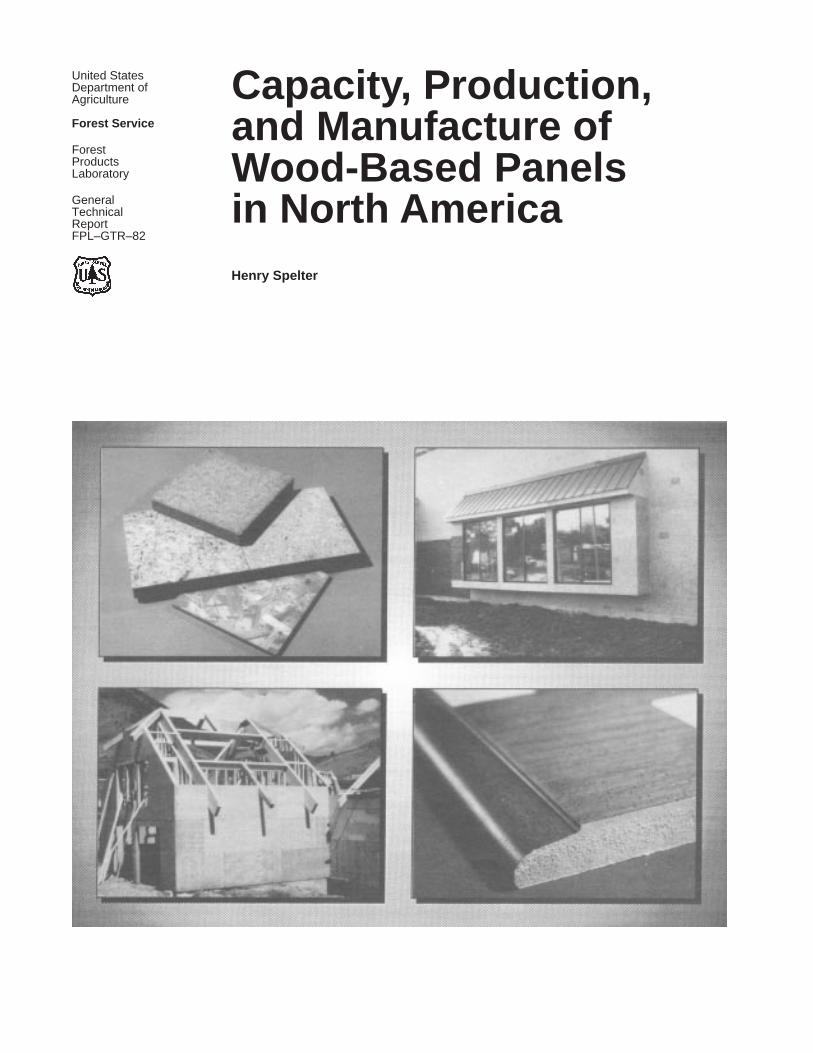
Capacity, Production,and Manufacture ofWood-Based Panelsin North America
United StatesDepartment ofAgriculture
Forest Service
ForestProductsLaboratory
GeneralTechnicalReportFPL–GTR–82
Henry Spelter
20
Abstract
This report is an informational report about four wood-basedpanel industries: particleboard, oriented strandboard,medium density fiberboard, and Southern Pine plywood.Items highlighted are trends in manufacturing and new plantcosts, industry manufacturing capacity, and location. Recentdata show the greatest amount of growth taking place in theoriented strandboard sector. Modest rates of growth areoccurring in the Southern Pine plywood, particleboard, andmedium density fiberboard sectors.
Keywords: Particleboard, oriented strandboard, plywood,capacity, cost, prices
October 1994
Spelter, Henry. 1994. Capacity, production, and manufacturing of wood-based panels in North America. Gen. Tech. Rep. FPL–GTR–82. Madison,WI: U.S. Department of Agriculture, Forest Service, Forest ProductsLaboratory. 17 p.
A limited number of free copies of this publication are available to thepublic from the Forest Products Laboratory, One Gifford Pinchot Drive,Madison, WI 53705–2398. Laboratory publications are sent to more than1,000 libraries in the United States and elsewhere.
The Forest Products Laboratory is maintained in cooperation with theUniversity of Wisconsin.
The United States Department of Agriculture (USDA) Forest Service is adiverse organization committed to equal opportunity in employment andprogram delivery. USDA prohibits discrimination on the basis of race, color,national origin, sex, religion, age, disability, political affiliation, and familialstatus. Persons believing they have been discriminated against shouldcontact the Secretary, U.S. Department of Agriculture, Washington, DC20250, or call (202) 720–7327 (voice), or (202) 720–1127 (TTY).
1
Capacity, Production,and Manufacturingof Wood-Based Panelsin North AmericaHenry Spelter, EconomistForest Products Laboratory, Madison, Wisconsin
Introduction
This is a report about the North American engineeredwood-based panel industry. The purpose is to provide areference to the location and size of plants, average manufac-turing costs, and trends in the costs of building new capacity.Specifically, the report traces the development of theparticleboard, oriented strandboard (OSB), medium densityfiberboard (MDF), and Southern Pine plywood industries.
Since World War II, few areas in forest products haveafforded more economic opportunities than the wood-basedpanel industry. The sometimes rapid growth attests to thepotential offered by new technologies. This growth is alsoevidence of changes in North American forest productsutilization, from a condition based on an abundance ofhigh-quality, low-cost timber in the Pacific Northwest toone where increasing scarcity of such material has forced anadaptation to lower quality resources in the South and North.
This report provides a perspective on the manufacturingconditions in the wood-based panel industry, focusing oncapacity, cost of new plants, manufacturing costs, and prices.The nature of the markets for these products is cyclical,a condition that is sometimes exacerbated by producers’overly optimistic investment responses in good economictimes and by caution in bad times. The report begins bydescribing capacity and production trends in the fourindustries: particleboard, OSB, MDF, and Southern Pineplywood. This is followed by an analysis of capacity costs.The report concludes with historical trends of manufacturingcosts and prices in each industry.
BackgroundParticleboard was the first of these four industries to develop.Its beginnings can be traced to 1947 in Seymour, Indiana,where a particleboard plant was built based upon modernstandards.
Particleboard can be manufactured by extrusion pressing orby flat, mat-formed pressing. This report deals only with theflat-pressed segment, because it represents the bulk of theindustry. In flat pressing, wood particles are blended withwax and urea-formaldehyde resin and then compressed inheated presses where the resin cures and solidifies theparticles into panels.
The presses are either batch (single or multi-opening) orcontinuous. Continuous presses cost more initially but canyield processing economies. These presses have becomewidely adopted in Europe and elsewhere. However, mostplants in North America continue to employ traditionalmulti-opening presses because these panels are made denseand thick, which slows down the throughput of continuouspresses. It is also claimed that frequent product changeovershinder continuous press productivity (Donnell 1991).
In most cases, the wood supply used in particleboard plantsconsists of residues from sawmills or other wood processingplants. A few North American plants, however, use round-wood as furnish. In recent times, wood residues have becomescarce in the western United States, and several plants haveexperimented with alternative fibers, such as wood demoli-tion debris and nonwood based fibers (e.g., straw) toaugment fiber supplies.
2
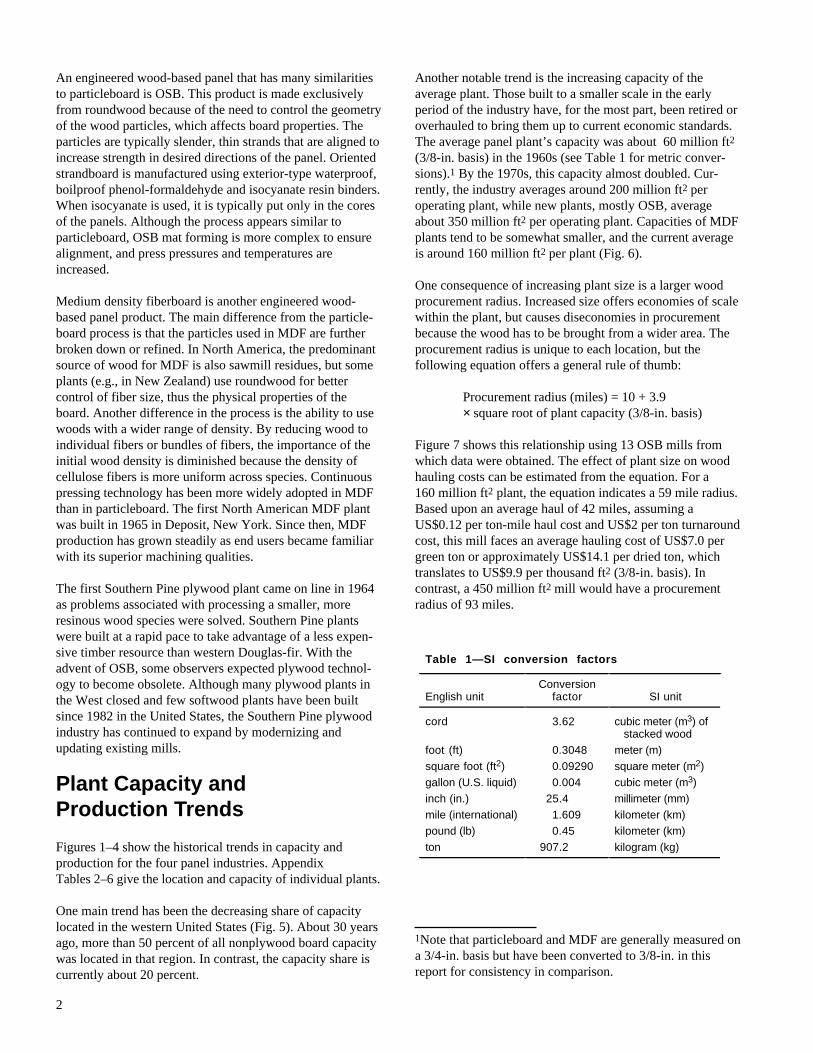
An engineered wood-based panel that has many similaritiesto particleboard is OSB. This product is made exclusivelyfrom roundwood because of the need to control the geometryof the wood particles, which affects board properties. Theparticles are typically slender, thin strands that are aligned toincrease strength in desired directions of the panel. Orientedstrandboard is manufactured using exterior-type waterproof,boilproof phenol-formaldehyde and isocyanate resin binders.When isocyanate is used, it is typically put only in the coresof the panels. Although the process appears similar toparticleboard, OSB mat forming is more complex to ensurealignment, and press pressures and temperatures areincreased.
Medium density fiberboard is another engineered wood-based panel product. The main difference from the particle-board process is that the particles used in MDF are furtherbroken down or refined. In North America, the predominantsource of wood for MDF is also sawmill residues, but someplants (e.g., in New Zealand) use roundwood for bettercontrol of fiber size, thus the physical properties of theboard. Another difference in the process is the ability to usewoods with a wider range of density. By reducing wood toindividual fibers or bundles of fibers, the importance of theinitial wood density is diminished because the density ofcellulose fibers is more uniform across species. Continuouspressing technology has been more widely adopted in MDFthan in particleboard. The first North American MDF plantwas built in 1965 in Deposit, New York. Since then, MDFproduction has grown steadily as end users became familiarwith its superior machining qualities.
The first Southern Pine plywood plant came on line in 1964as problems associated with processing a smaller, moreresinous wood species were solved. Southern Pine plantswere built at a rapid pace to take advantage of a less expen-sive timber resource than western Douglas-fir. With theadvent of OSB, some observers expected plywood technol-ogy to become obsolete. Although many plywood plants inthe West closed and few softwood plants have been builtsince 1982 in the United States, the Southern Pine plywoodindustry has continued to expand by modernizing andupdating existing mills.
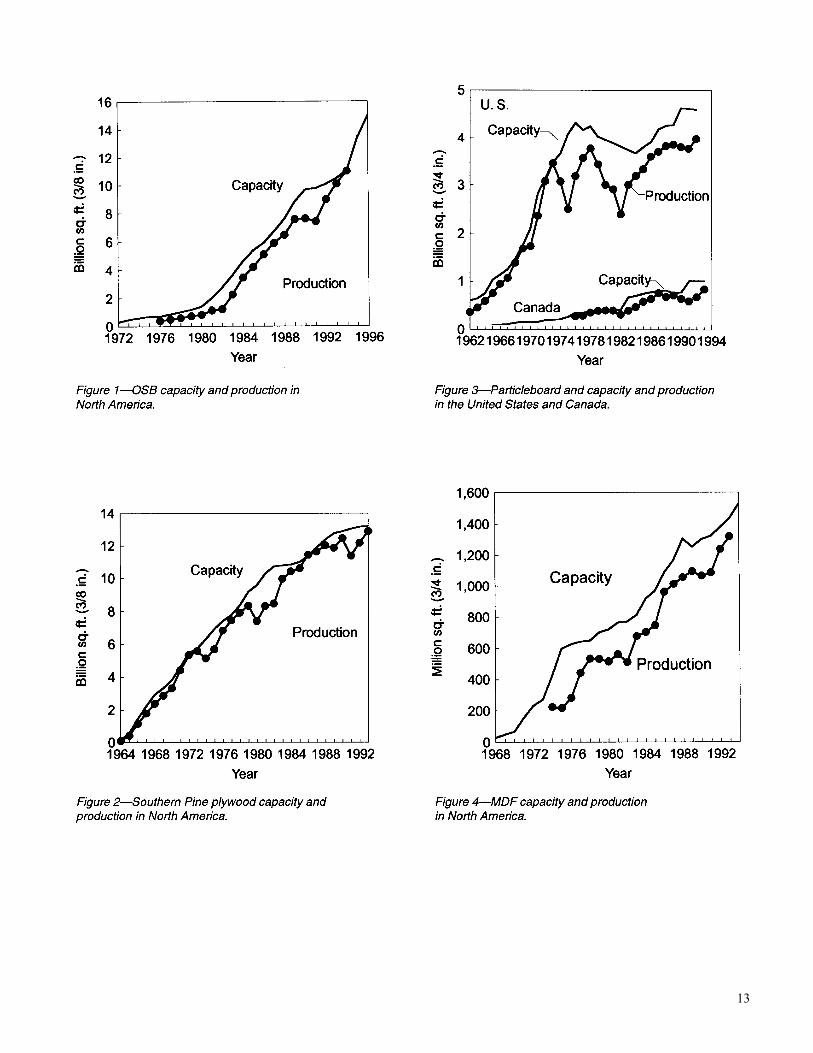
Plant Capacity andProduction Trends
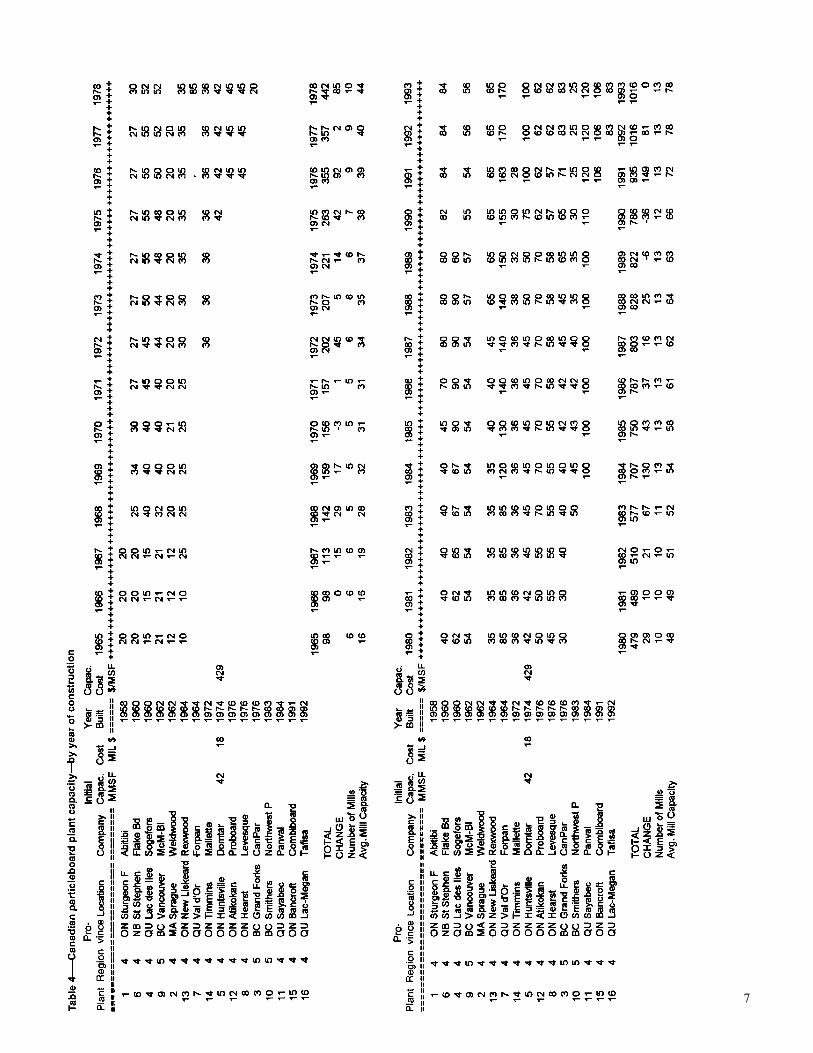
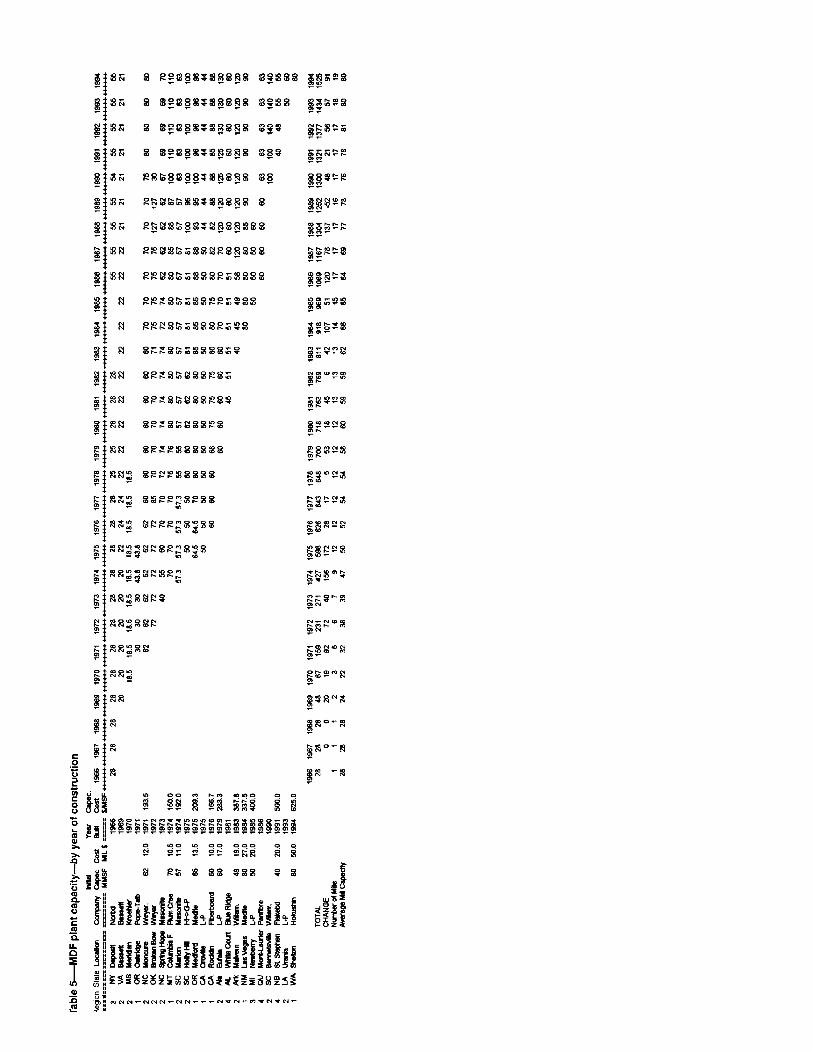
Figures 1–4 show the historical trends in capacity andproduction for the four panel industries. AppendixTables 2–6 give the location and capacity of individual plants.
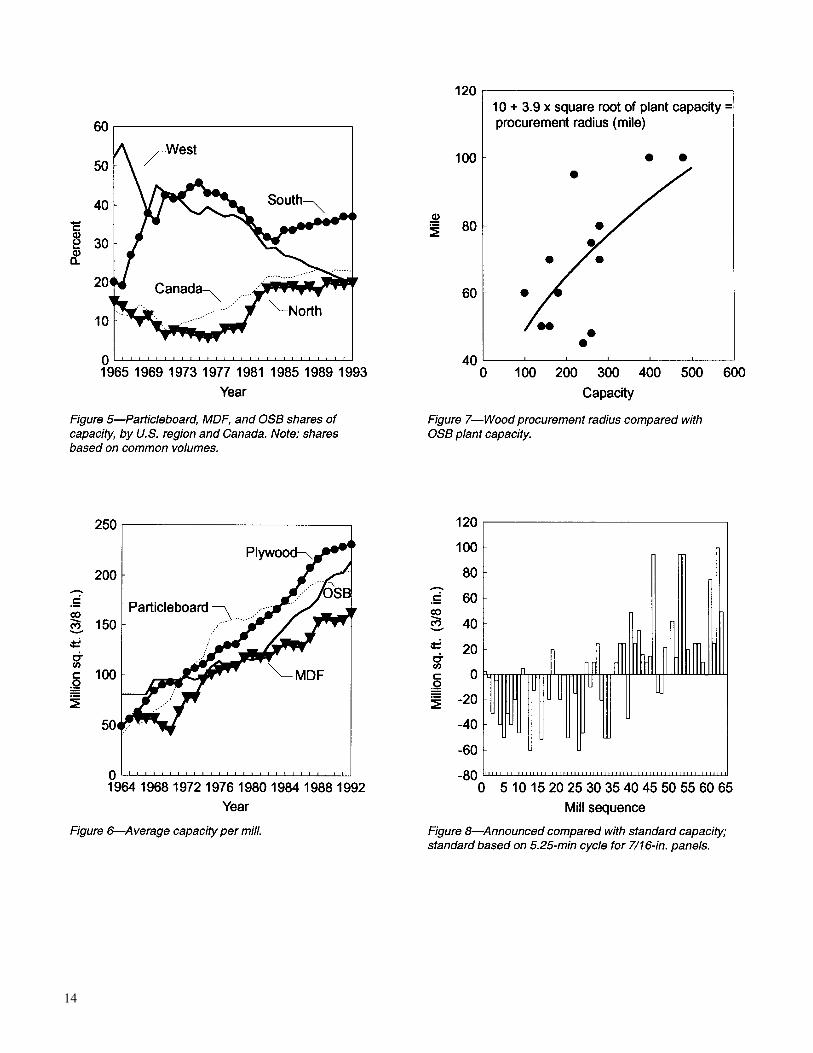
One main trend has been the decreasing share of capacitylocated in the western United States (Fig. 5). About 30 yearsago, more than 50 percent of all nonplywood board capacitywas located in that region. In contrast, the capacity share iscurrently about 20 percent.
Another notable trend is the increasing capacity of theaverage plant. Those built to a smaller scale in the earlyperiod of the industry have, for the most part, been retired oroverhauled to bring them up to current economic standards.The average panel plant’s capacity was about 60 million ft2
(3/8-in. basis) in the 1960s (see Table 1 for metric conver-sions).1 By the 1970s, this capacity almost doubled. Cur-rently, the industry averages around 200 million ft2 peroperating plant, while new plants, mostly OSB, averageabout 350 million ft2 per operating plant. Capacities of MDFplants tend to be somewhat smaller, and the current averageis around 160 million ft2 per plant (Fig. 6).
One consequence of increasing plant size is a larger woodprocurement radius. Increased size offers economies of scalewithin the plant, but causes diseconomies in procurementbecause the wood has to be brought from a wider area. Theprocurement radius is unique to each location, but thefollowing equation offers a general rule of thumb:
Procurement radius (miles) = 10 + 3.9× square root of plant capacity (3/8-in. basis)
Figure 7 shows this relationship using 13 OSB mills fromwhich data were obtained. The effect of plant size on woodhauling costs can be estimated from the equation. For a160 million ft2 plant, the equation indicates a 59 mile radius.Based upon an average haul of 42 miles, assuming aUS$0.12 per ton-mile haul cost and US$2 per ton turnaroundcost, this mill faces an average hauling cost of US$7.0 pergreen ton or approximately US$14.1 per dried ton, whichtranslates to US$9.9 per thousand ft2 (3/8-in. basis). Incontrast, a 450 million ft2 mill would have a procurementradius of 93 miles.
1Note that particleboard and MDF are generally measured ona 3/4-in. basis but have been converted to 3/8-in. in thisreport for consistency in comparison.
Table 1—SI conversion factors
English unitConversion
factor SI unit
cord 3.62 cubic meter (m3) of stacked wood
foot (ft) 0.3048 meter (m)square foot (ft2) 0.09290 square meter (m2)gallon (U.S. liquid) 0.004 cubic meter (m3)inch (in.) 25.4 millimeter (mm)mile (international) 1.609 kilometer (km)pound (lb) 0.45 kilometer (km)ton 907.2 kilogram (kg)

3
Assuming an average haul of 65 miles, this operation’shauling costs would be US$9.8 per green ton, US$19.6 perdried ton, and US$13.7 per thousand ft2. The larger millfaces a penalty of US$3.8 per million ft2 of product.2
There has been significant processing changes in manufac-turing these products. In the case of OSB, faster press timeshave increased plant efficiency. This is evident from thegrowing spread between rated capacities and what can beinferred from actual press sizes. Figure 8 depicts the differ-ence between announced and standard capacities calculatedfrom each mill’s individual press and from an arbitrarilychosen press cycle of 5.25 min (for 7/16-in. panels). Thiscomparison shows that initial plant capacity in most caseswas below the standard, indicating that press cycles, on theaverage, were more than 5.25 min long. For the past 30 or somills that were built, rated capacities have generally ex-ceeded the standard, indicating that cycle times are now lessthan 5.25 min. In fact, OSB press cycles are now around3 min, including loading/unloading time of 45 s (Lowood1994).
Another notable change in OSB manufacturing has been thedecreased use rate of resins. Initial liquid resin use ratesaveraged 5 percent of the panel’s weight in contrast to thecurrent average of 3.2 percent. When powdered resins wereemployed, the use rate ranged from 3.0 to 3.5 percent,whereas now it is less than 2 percent (Davis 1993, Morley1986).
Capacity Costs
Capacity costs in this report are based on plant announce-ments and offer only a rough guide to capacity cost trends.Costs of new mills have generally increased with inflation,although economies of scale obtained from larger complexeshave moderated the increase on the basis of a thousand ft2 ofcapacity.
Based on published mill announcements, a new MDF millwill cost approximately US$500 per thousand ft2 (3/4-in.basis) of capacity, or US$50 million for a 100 million ft2
complex. This is an increase from about US$200 perthousand ft2 from the early 1970s.
New particleboard plants also cost significantly more thanthose placed in service in the 1970s (Fig. 9). Aside frominflation, this increase can be explained by the tendency ofmodern mills to be built with the capability of makinglaminated rather than only raw boards. One mill was recentlybuilt to run on roundwood instead of plant residues, adding
2This relationship does not necessarily hold for other panels.Hauling costs would be affected by differences in bulkdensity, moisture content, and loading/unloading time.
to its equipment needs. Based on plant costs from the 1970sand subsequent capital goods inflation trends, I estimate thata raw board production facility comparable to those built inthe 1970s would currently cost around US$400 per thousandft2 (3/4-in. basis) of annual capacity, or US$40 million for a100 million ft2 plant.
Unlike MDF and particleboard costs, OSB plant costs havedefied inflation trends since 1980 (Fig. 10). This may be dueto economies of scale as the plants currently being installedare about twice as large as those in the late 1970s. Recentplant announcements indicate that a new OSB mill costsapproximately US$230 per thousand ft2 (3/8-in. basis) ofcapacity or US$80 million for a mill with an annual capacityof 350 million ft2.
A plywood mill has not been built in the South since 1982.However, based on capital goods inflation trends, theestimated cost for a new plywood mill would be aboutUS$230 per thousand ft2 (3/8-in. basis), which translates toabout US$60 million for a 260 million ft2 plant (Fig. 11).
Manufacturing Costsand Profits
The hallmark of most reconstituted panel mills is highvolume output of a basically undifferentiated commodity.The primary elements of manufacturing costs for theseoperations are wood, resin, and labor.
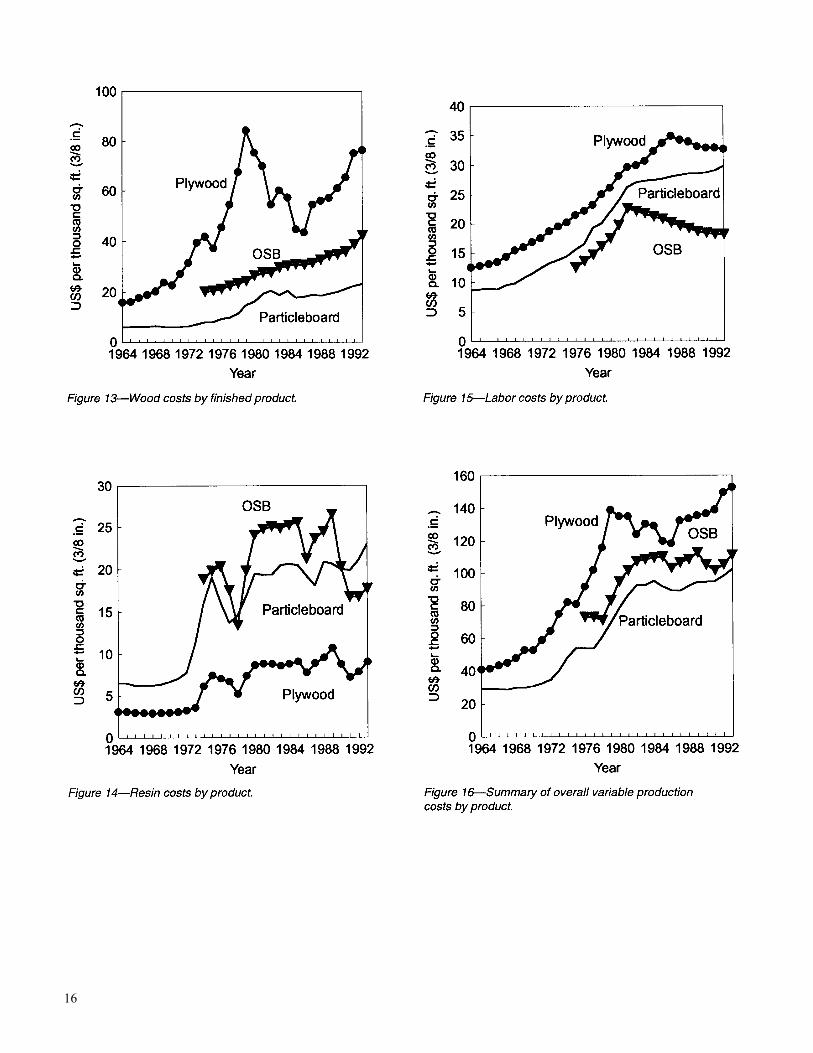
Wood costs per ton are given for plywood, OSB, andparticleboard in Figure 12. Historically, wood costs forplywood mills have been the highest because of larger,higher quality timber requirements. Over time, technologyhas enabled the economic use of smaller-sized logs, but thewood used for plywood is still more expensive than for OSB.
Data in Figure 12 are not comparable because the wood forparticleboard is partly dried mill residues and that forplywood and OSB is green stumpwood. Figure 13 compareswood costs on the basis of the finished product, all adjustedto a common basis of product measurement and with thevalue of salable residues subtracted from plywood costs.Even after subtracting the value of such residues, wood costsper unit of output for plywood are the highest among thethree processes, and under recent economic conditions, abouttwice that of an OSB operation. However, particleboardwood costs by product are less than for OSB.
In the realm of resin costs, plywood technology has tradi-tionally maintained an advantage (Fig. 14). Although theamount of resin use in OSB processing has declined by morethan 30 percent since the mid-1970s, it is still about twice asexpensive as it is for plywood. Current levels of liquidphenol-formaldehyde use (on a dry basis) for OSB

4
commodity grade panels average a little more than 3 percentby weight (about 45 lb for a thousand ft2, 3/8-in. basis) and alittle less than 2 percent (about 28 lb) if the powdered formof the resin is used. For particleboard, the use rate of urea-formaldehyde resin is about 8 percent or 140 lb for athousand ft2, 3/8-in. basis. This threefold use rate offsets aprice advantage that is about 70 percent, so the total cost perthousand ft2 is approximately equal between OSB andparticleboard. Medium density fiberboard costs are similar tothose for particleboard.
Figure 15 shows trends in labor costs. Plywood mills havemade great strides in automation, but the nature of thematerial and process requires an increase in labor for taskssuch as loading dryers and presses, laying up panels, andjoining strips of veneer to make standard-sized sheets.Meanwhile, economies of scale in OSB mills have reducedlabor costs.
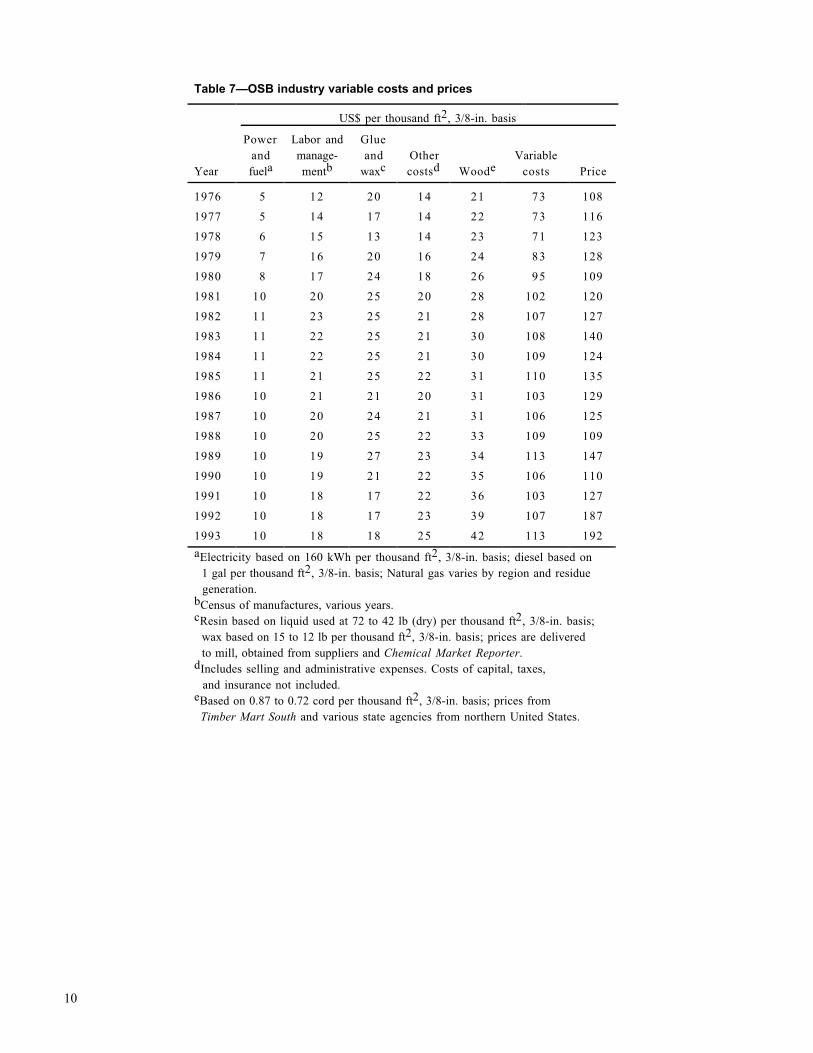
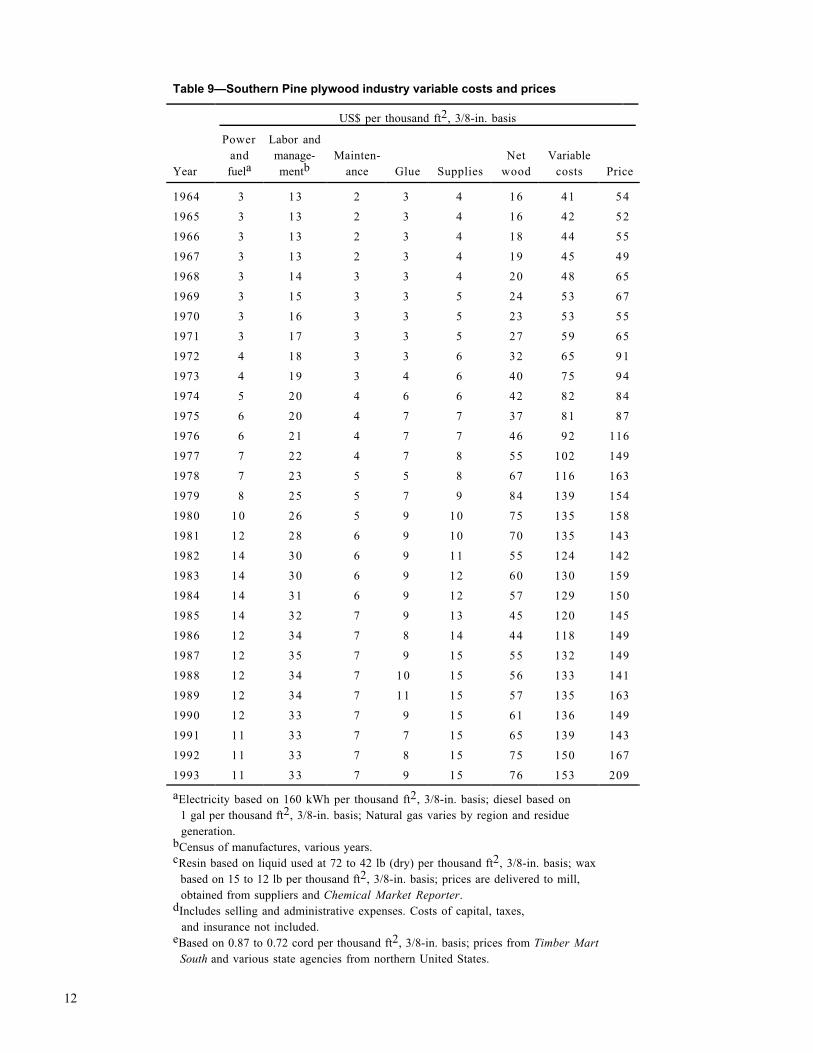
Estimates of overall variable production costs are containedin Tables 7 to 9 in the Appendix and are summarized inFigure 16. On a per ft2, 3/8-in. basis, costs ranged in 1993from about US$153 for plywood to US$102 for particle-board; OSB costs were intermediate at about US$113.
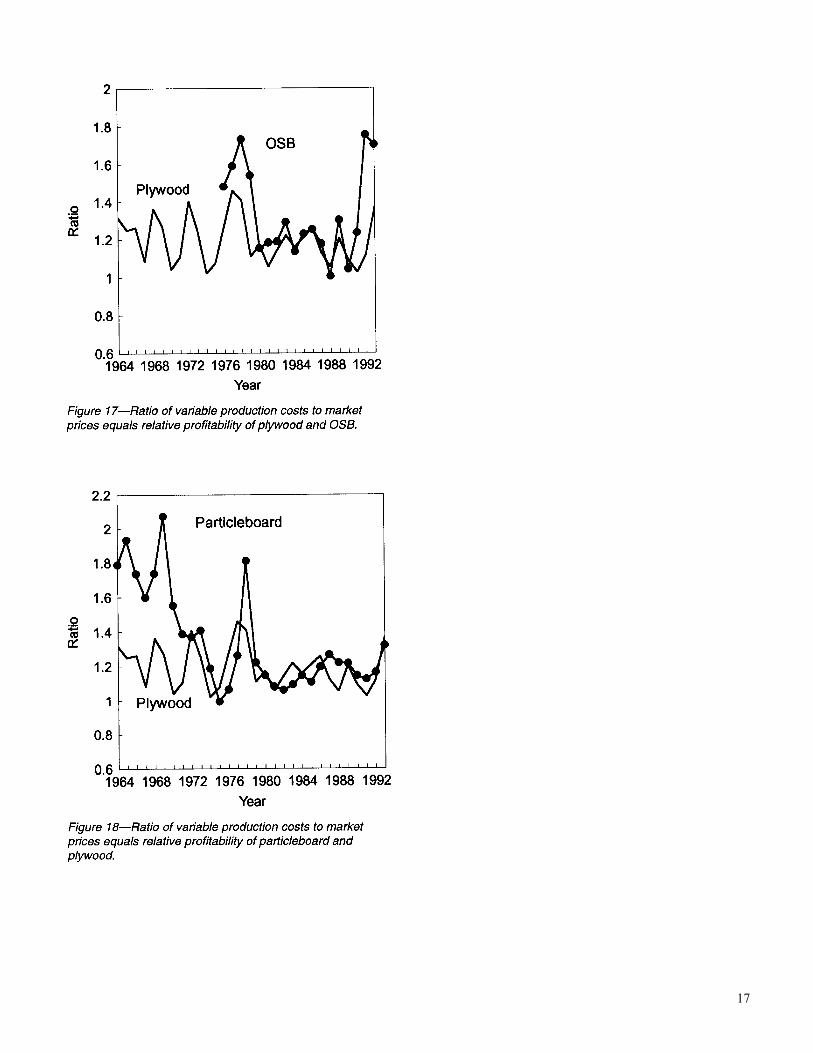
The ratio of variable production costs to market prices givessome indication of the relative profitability of these prod-ucts.3 This relationship is shown in Figure 17 for plywoodand OSB. In the 1970s and early 1980s, the profitability ofOSB was greater than that of plywood. As a result, OSBattracted the bulk of the investment in new capacity. Newplywood mill construction waned and capacity increases thatoccurred were mainly due to modernizing and upgradingplants. Around the mid-1980s, the profit margin of OSB andplywood came closer and capacity growth in OSB slowed.Since 1991, profitability of both panels has increased but thatof OSB has gained much more as a result of the bettercontrol of the previously described costs and the narrowingof the price discount for OSB compared with plywood. As aresult, a new wave of investment has been attracted to OSBwith more than 4 billion ft2 of new capacity expected from1994 to 1997.
Figure 18 gives the ratio of variable production costs tomarket prices for plywood and particleboard. Particleboardwas highly profitable in the 1960s and early 1970s, duringwhich capacity increased sevenfold. This profitable periodended with the 1974 to 1975 recession. Profits recovered bythe late 1970s, but not to the previous degree, and capacitygrowth slackened.
3Costs for insurance, taxes, and capital are not included;therefore, these ratios are not a true guide to overall profit-ability. When compared with the older plywood industry,capital costs would be greater especially for OSB andparticleboard plants.
Conclusions
During the past three decades, growth of reconstituted panelmanufacturing has been rapid. High profitability attracted agreat deal of investment interest in the early phase of theindustries, but as they matured and profit rates declined tonormal levels, growth rates tended to decrease. Currently, theOSB industry is in the rapid growth phase that plywood andparticleboard had previously. At the time of this report, allsegments of the panel industries are having favorableeconomic conditions, but OSB continues to have signifi-cantly lower costs than those panels with which it competes.
References
Davis, C.R. 1993. PF powder resin capabilities in OSB.Panel World, March.
Donnell, Richard. 1991. Can continuous press becomemodus operandi? Panel World, September.
Lowood, John. 1994 Personal communication. Director,Structural Board Association, Willowdale, Ontario, Canada.
Morley, Keith. 1986. Proceedings, Upper MississippiValley meeting of the Forest Product Research Society; 1986October 16; Duluth, MN. [Proceedings not published,presentation recorded on video and transcribed at ForestProducts Laboratory, Madison, WI.]
Appendix—Wood-BasedPanel Industry DataTables 2 to 6 give the location and capacity of individualplants for the four panel industries: OSB, particleboard,MDF, and Southern Pine plywood. Tables 7 to 9 containestimates of overall variable production costs for OSB,particleboard, and Southern Pine plywood.

5

6
7
8

9
10
Table 7—OSB industry variable costs and prices
US$ per thousand ft2, 3/8-in. basis
Year
Powerandfuela
Labor andmanage-mentb
Glueand
waxcOthercostsd Woode
Variablecosts Price
1976 5 12 20 14 21 73 108
1977 5 14 17 14 22 73 116
1978 6 15 13 14 23 71 123
1979 7 16 20 16 24 83 128
1980 8 17 24 18 26 95 109
1981 10 20 25 20 28 102 120
1982 11 23 25 21 28 107 127
1983 11 22 25 21 30 108 140
1984 11 22 25 21 30 109 124
1985 11 21 25 22 31 110 135
1986 10 21 21 20 31 103 129
1987 10 20 24 21 31 106 125
1988 10 20 25 22 33 109 109
1989 10 19 27 23 34 113 147
1990 10 19 21 22 35 106 110
1991 10 18 17 22 36 103 127
1992 10 18 17 23 39 107 187
1993 10 18 18 25 42 113 192
aElectricity based on 160 kWh per thousand ft2, 3/8-in. basis; diesel based on 1 gal per thousand ft2, 3/8-in. basis; Natural gas varies by region and residue generation.bCensus of manufactures, various years.cResin based on liquid used at 72 to 42 lb (dry) per thousand ft2, 3/8-in. basis; wax based on 15 to 12 lb per thousand ft2, 3/8-in. basis; prices are delivered to mill, obtained from suppliers and Chemical Market Reporter.dIncludes selling and administrative expenses. Costs of capital, taxes, and insurance not included.eBased on 0.87 to 0.72 cord per thousand ft2, 3/8-in. basis; prices from Timber Mart South and various state agencies from northern United States.

11
Table 8—Particleboard industry variable costs and prices
US$ per thousand ft2, 3/8-in. basis
Year
Powerandfuela
Labor andmanage-mentb
Glueand
waxcOthercostsd Woode
Variablecosts Price
1962 2 9 6 5 7 29 521963 2 9 6 5 7 29 521964 2 9 6 5 7 29 521965 2 9 6 5 7 29 571966 2 9 6 5 8 29 511967 2 9 6 5 7 29 461968 2 10 6 5 8 30 521969 2 10 6 5 7 30 621970 2 11 7 5 7 31 481971 2 11 7 5 7 32 451972 2 12 8 5 7 35 481973 2 13 11 6 8 41 571974 3 14 16 7 9 49 581975 4 14 19 8 9 54 541976 4 16 16 8 10 54 581977 5 17 14 8 11 54 681978 6 19 15 9 12 61 1101979 6 20 17 10 16 70 851980 8 22 19 12 17 78 901981 10 24 19 13 21 86 941982 11 26 19 14 22 92 981983 11 27 20 14 20 93 1011984 11 27 21 14 22 95 1091985 11 27 20 14 19 92 1021986 10 28 19 13 19 89 1071987 9 28 18 13 20 89 1131988 9 28 21 14 20 92 1121989 11 29 21 14 21 94 1151990 11 29 20 14 21 94 1081991 9 29 20 14 23 95 1071992 10 29 21 14 24 98 1141993 10 30 23 15 25 102 135aElectricity based on 160 kWh per thousand ft2, 3/8-in. basis; diesel based on 1 gal per thousand ft2, 3/8-in. basis; Natural gas varies by region and residue generation.bCensus of manufactures, various years.cResin based on liquid used at 72 to 42 lb (dry) per thousand ft2, 3/8-in. basis; wax based on 15 to 12 lb per thousand ft2, 3/8-in. basis; prices are delivered to mill, obtained from suppliers and Chemical Market Reporter.dIncludes selling and administrative expenses. Costs of capital, taxes, and insurance not included.eBased on 0.87 to 0.72 cord per thousand ft2, 3/8-in. basis; prices from Timber Mart South and various state agencies from northern United States.
12
Table 9—Southern Pine plywood industry variable costs and prices
US$ per thousand ft2, 3/8-in. basis
Year
Powerandfuela
Labor andmanage-mentb
Mainten-ance Glue Supplies
Netwood
Variablecosts Price
1964 3 13 2 3 4 16 41 54
1965 3 13 2 3 4 16 42 52
1966 3 13 2 3 4 18 44 55
1967 3 13 2 3 4 19 45 49
1968 3 14 3 3 4 20 48 65
1969 3 15 3 3 5 24 53 67
1970 3 16 3 3 5 23 53 55
1971 3 17 3 3 5 27 59 65
1972 4 18 3 3 6 32 65 91
1973 4 19 3 4 6 40 75 94
1974 5 20 4 6 6 42 82 84
1975 6 20 4 7 7 37 81 87
1976 6 21 4 7 7 46 92 116
1977 7 22 4 7 8 55 102 149
1978 7 23 5 5 8 67 116 163
1979 8 25 5 7 9 84 139 154
1980 10 26 5 9 10 75 135 158
1981 12 28 6 9 10 70 135 143
1982 14 30 6 9 11 55 124 142
1983 14 30 6 9 12 60 130 159
1984 14 31 6 9 12 57 129 150
1985 14 32 7 9 13 45 120 145
1986 12 34 7 8 14 44 118 149
1987 12 35 7 9 15 55 132 149
1988 12 34 7 10 15 56 133 141
1989 12 34 7 11 15 57 135 163
1990 12 33 7 9 15 61 136 149
1991 11 33 7 7 15 65 139 143
1992 11 33 7 8 15 75 150 167
1993 11 33 7 9 15 76 153 209
aElectricity based on 160 kWh per thousand ft2, 3/8-in. basis; diesel based on 1 gal per thousand ft2, 3/8-in. basis; Natural gas varies by region and residue generation.bCensus of manufactures, various years.cResin based on liquid used at 72 to 42 lb (dry) per thousand ft2, 3/8-in. basis; wax based on 15 to 12 lb per thousand ft2, 3/8-in. basis; prices are delivered to mill, obtained from suppliers and Chemical Market Reporter.dIncludes selling and administrative expenses. Costs of capital, taxes, and insurance not included.eBased on 0.87 to 0.72 cord per thousand ft2, 3/8-in. basis; prices from Timber Mart South and various state agencies from northern United States.
13
14

15
16
17