Embed Size (px)
Citation preview
NREL is a national laboratory of the U.S. Department of Energy, Office of Energy Efficiency and Renewable Energy, operated by the Alliance for Sustainable Energy, LLC.
Capacity Value: Evaluation of WECC Rule of Thumb
WECC Data Working Group
Michael Milligan, Ph.D. Eduardo Ibanez, Ph.D.
Western Electricity Coordinating Council Webinar
June 9, 2015
NREL/PR-5D00-64879
2
Objective
• Compare LOLE, wind/solar capacity values with ‘rules of thumb’ used in Western Interconnection Planning
• Provide alternative recommendations to WECC’s TEPPC modeling efforts
3
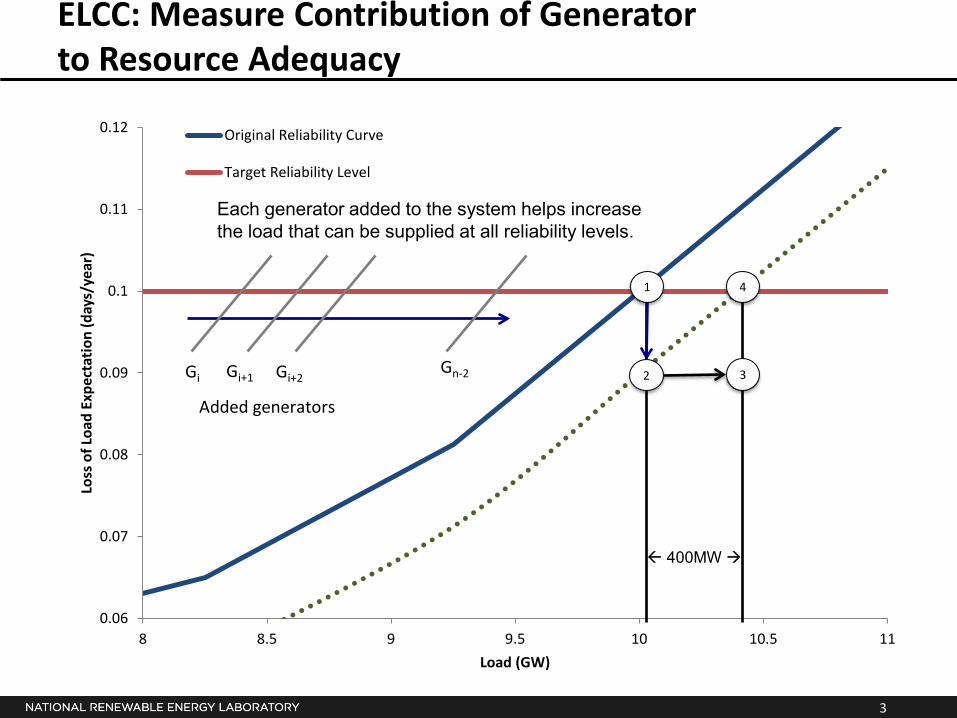
ELCC: Measure Contribution of Generator to Resource Adequacy
0.06
0.07
0.08
0.09
0.1
0.11
0.12
8 8.5 9 9.5 10 10.5 11
Loss
of L
oad
Expe
ctat
ion
(day
s/ye
ar)
Load (GW)
Original Reliability Curve
Target Reliability Level
1
2
4
3
Each generator added to the system helps increase the load that can be supplied at all reliability levels.
Added generators
Gi+1 Gi Gi+2 Gn-2
400MW
Evaluation of WECC Rules of Thumb for Resource Adequacy for Wind and Solar
4
5
Numerical Example
• Comparison of metrics and effect on capacity value
• Using WECC’s Transmission Expansion Planning Policy Committee (TEPPC) 2024 o Long-term transmission study for the U.S. Western
Interconnection
6
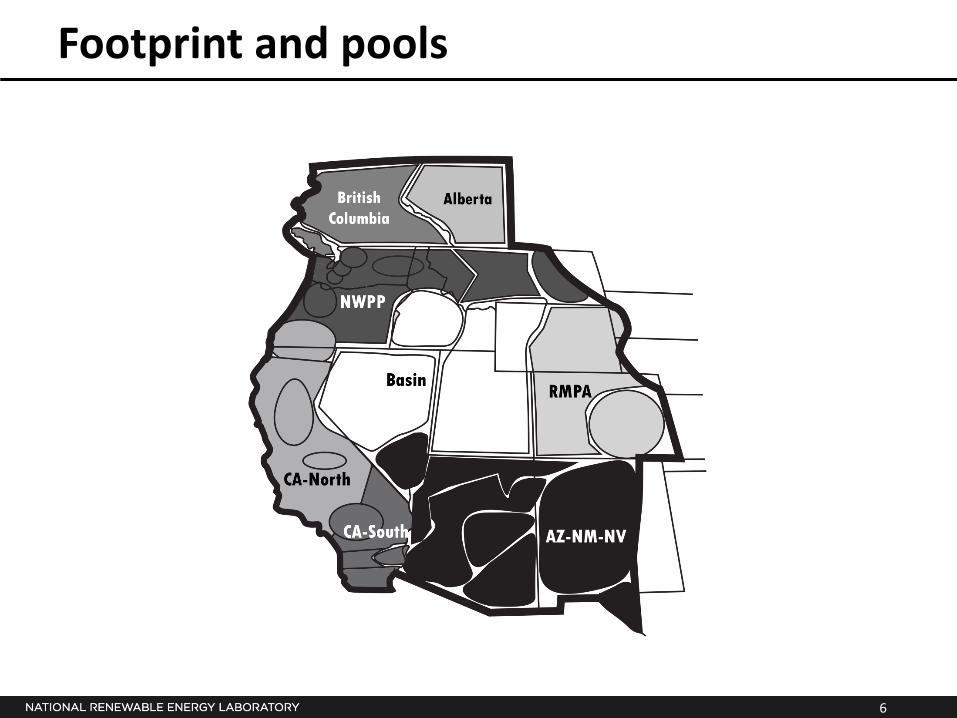
Footprint and pools
7
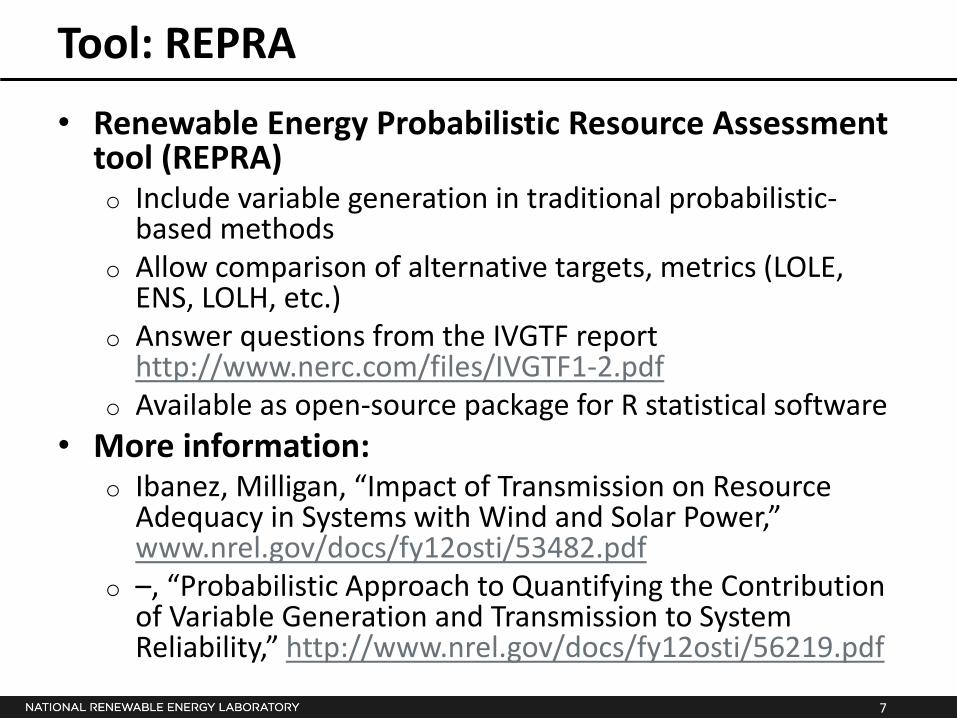
Tool: REPRA
• Renewable Energy Probabilistic Resource Assessment tool (REPRA) o Include variable generation in traditional probabilistic-
based methods o Allow comparison of alternative targets, metrics (LOLE,
ENS, LOLH, etc.) o Answer questions from the IVGTF report
http://www.nerc.com/files/IVGTF1-2.pdf o Available as open-source package for R statistical software
• More information: o Ibanez, Milligan, “Impact of Transmission on Resource
Adequacy in Systems with Wind and Solar Power,” www.nrel.gov/docs/fy12osti/53482.pdf
o –, “Probabilistic Approach to Quantifying the Contribution of Variable Generation and Transmission to System Reliability,” http://www.nrel.gov/docs/fy12osti/56219.pdf
8
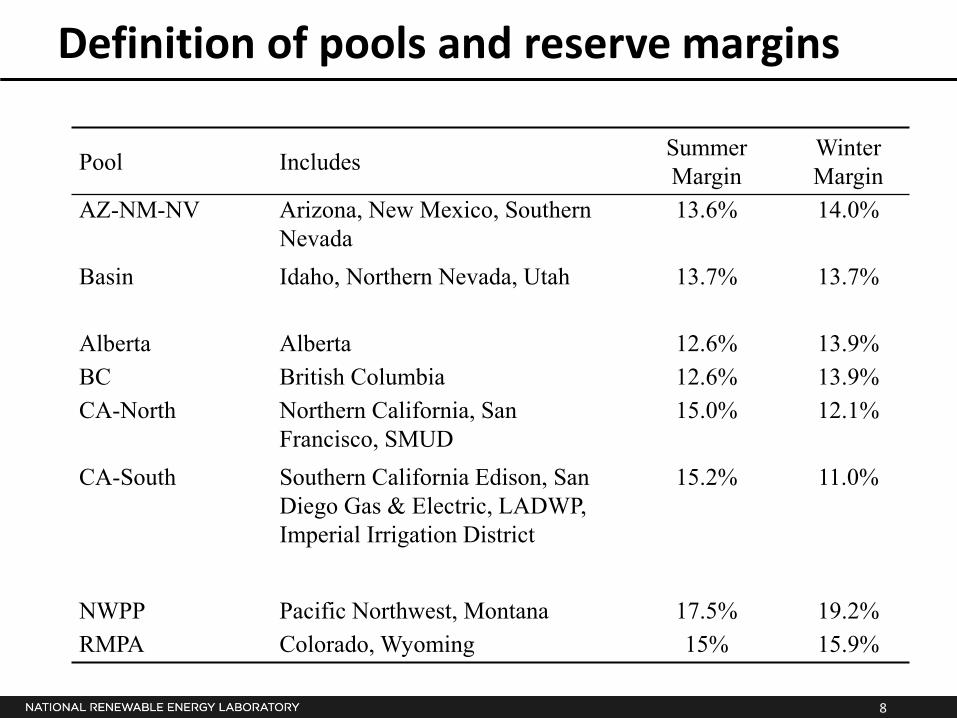
Definition of pools and reserve margins
Pool Includes Summer Margin
Winter Margin
AZ-NM-NV Arizona, New Mexico, Southern Nevada
13.6% 14.0%
Basin Idaho, Northern Nevada, Utah 13.7% 13.7%
Alberta Alberta 12.6% 13.9% BC British Columbia 12.6% 13.9% CA-North Northern California, San
Francisco, SMUD 15.0% 12.1%
CA-South Southern California Edison, San Diego Gas & Electric, LADWP, Imperial Irrigation District
15.2% 11.0%
NWPP Pacific Northwest, Montana 17.5% 19.2% RMPA Colorado, Wyoming 15% 15.9%
9
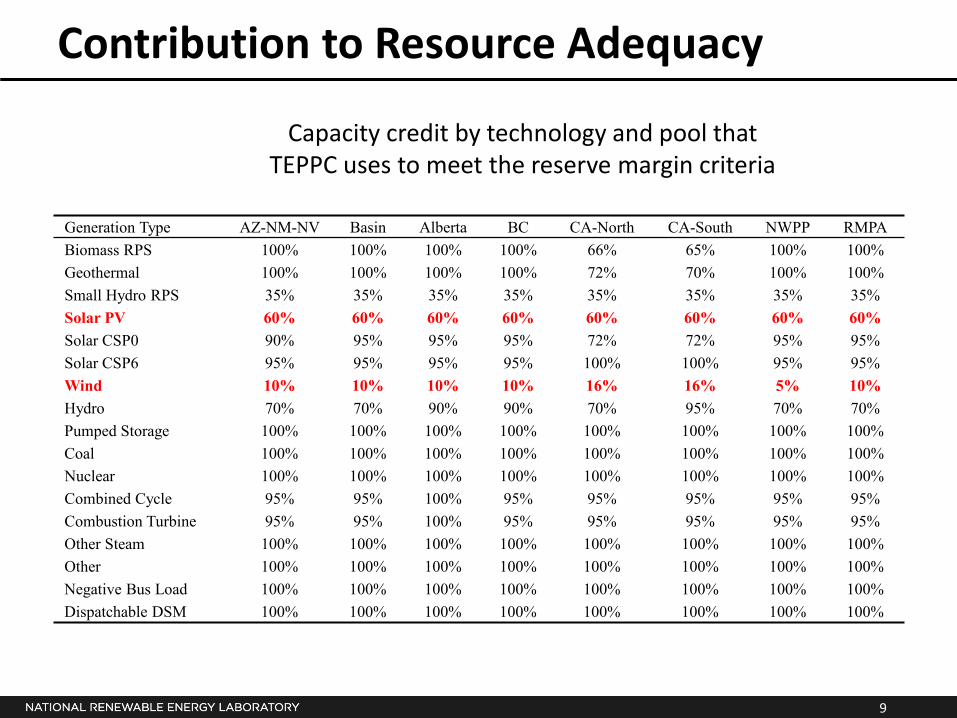
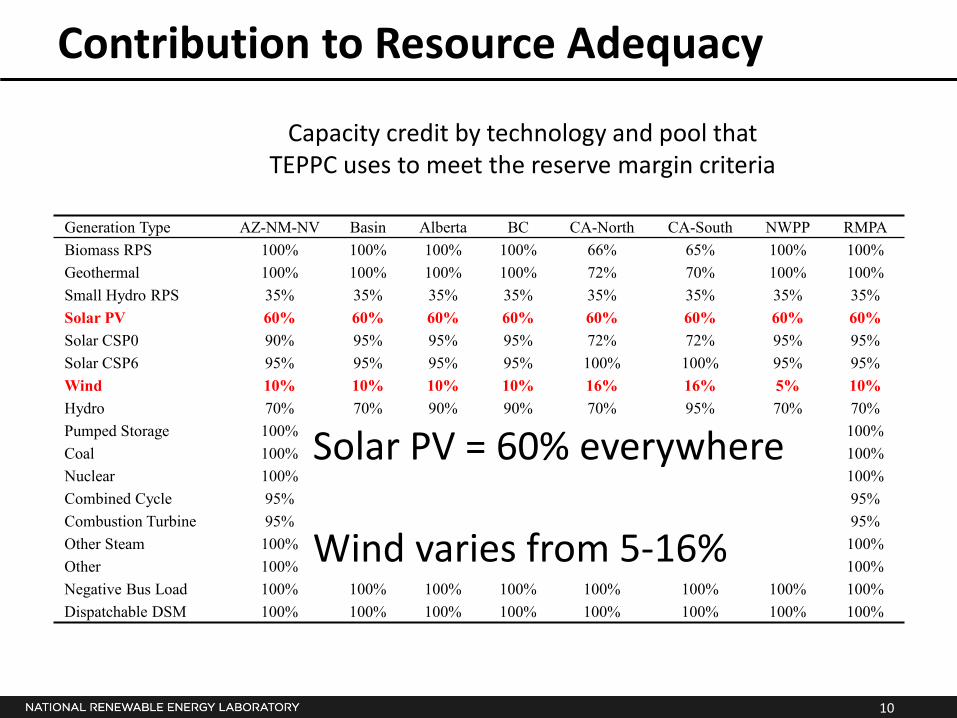
Contribution to Resource Adequacy
Generation Type AZ-NM-NV Basin Alberta BC CA-North CA-South NWPP RMPA Biomass RPS 100% 100% 100% 100% 66% 65% 100% 100% Geothermal 100% 100% 100% 100% 72% 70% 100% 100% Small Hydro RPS 35% 35% 35% 35% 35% 35% 35% 35% Solar PV 60% 60% 60% 60% 60% 60% 60% 60% Solar CSP0 90% 95% 95% 95% 72% 72% 95% 95% Solar CSP6 95% 95% 95% 95% 100% 100% 95% 95% Wind 10% 10% 10% 10% 16% 16% 5% 10% Hydro 70% 70% 90% 90% 70% 95% 70% 70% Pumped Storage 100% 100% 100% 100% 100% 100% 100% 100% Coal 100% 100% 100% 100% 100% 100% 100% 100% Nuclear 100% 100% 100% 100% 100% 100% 100% 100% Combined Cycle 95% 95% 100% 95% 95% 95% 95% 95% Combustion Turbine 95% 95% 100% 95% 95% 95% 95% 95% Other Steam 100% 100% 100% 100% 100% 100% 100% 100% Other 100% 100% 100% 100% 100% 100% 100% 100% Negative Bus Load 100% 100% 100% 100% 100% 100% 100% 100% Dispatchable DSM 100% 100% 100% 100% 100% 100% 100% 100%
Capacity credit by technology and pool that TEPPC uses to meet the reserve margin criteria
10
Contribution to Resource Adequacy
Generation Type AZ-NM-NV Basin Alberta BC CA-North CA-South NWPP RMPA Biomass RPS 100% 100% 100% 100% 66% 65% 100% 100% Geothermal 100% 100% 100% 100% 72% 70% 100% 100% Small Hydro RPS 35% 35% 35% 35% 35% 35% 35% 35% Solar PV 60% 60% 60% 60% 60% 60% 60% 60% Solar CSP0 90% 95% 95% 95% 72% 72% 95% 95% Solar CSP6 95% 95% 95% 95% 100% 100% 95% 95% Wind 10% 10% 10% 10% 16% 16% 5% 10% Hydro 70% 70% 90% 90% 70% 95% 70% 70% Pumped Storage 100% 100% 100% 100% 100% 100% 100% 100% Coal 100% 100% 100% 100% 100% 100% 100% 100% Nuclear 100% 100% 100% 100% 100% 100% 100% 100% Combined Cycle 95% 95% 100% 95% 95% 95% 95% 95% Combustion Turbine 95% 95% 100% 95% 95% 95% 95% 95% Other Steam 100% 100% 100% 100% 100% 100% 100% 100% Other 100% 100% 100% 100% 100% 100% 100% 100% Negative Bus Load 100% 100% 100% 100% 100% 100% 100% 100% Dispatchable DSM 100% 100% 100% 100% 100% 100% 100% 100%
Capacity credit by technology and pool that TEPPC uses to meet the reserve margin criteria
Solar PV = 60% everywhere Wind varies from 5-16%
11
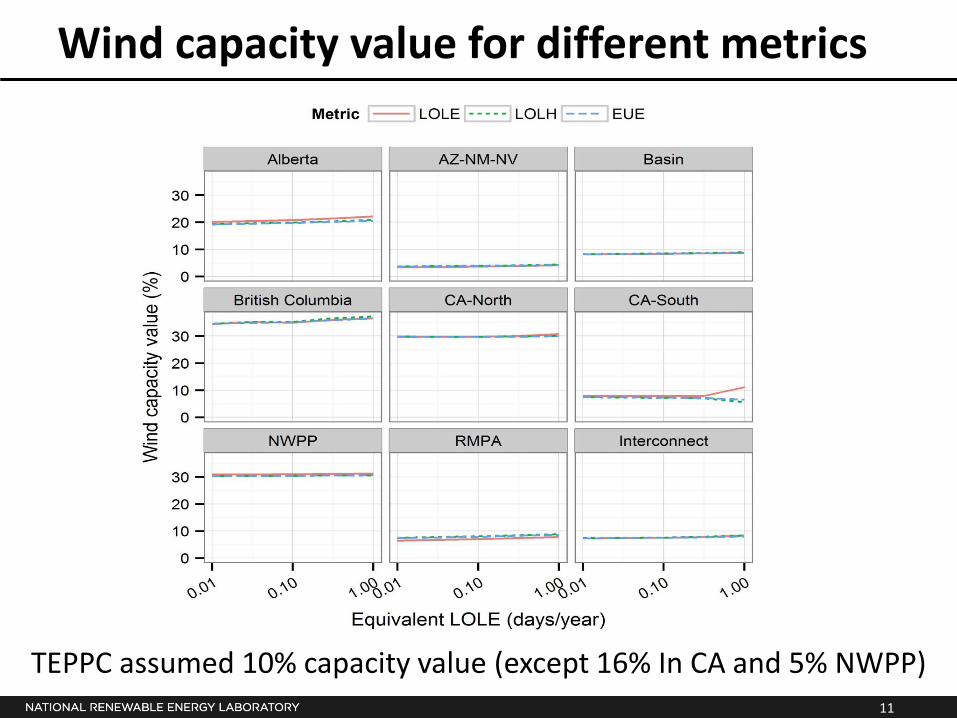
Wind capacity value for different metrics
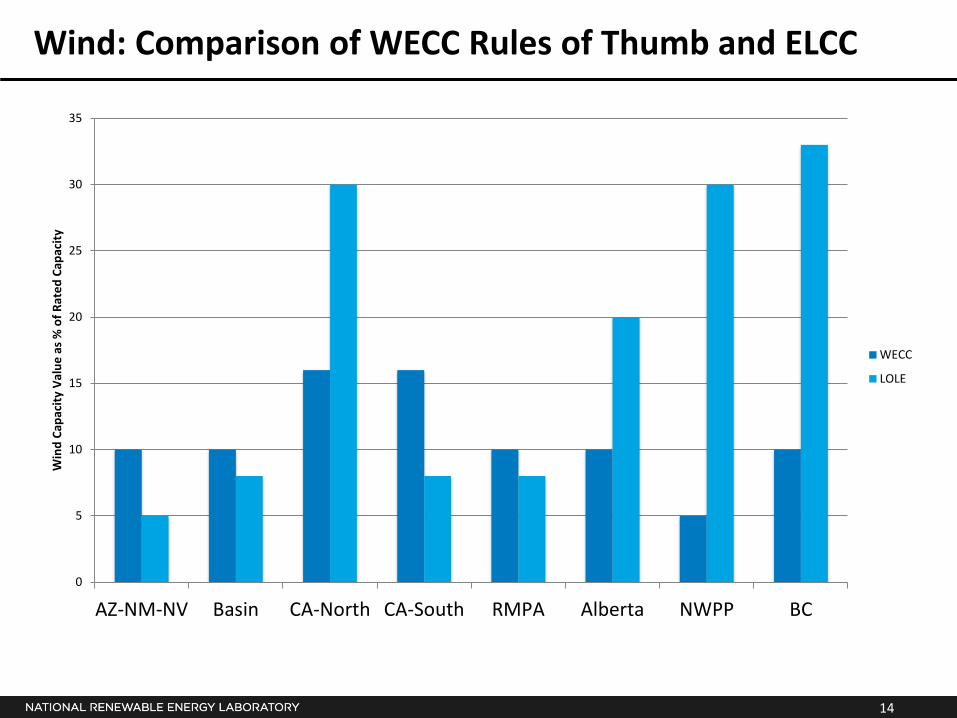
TEPPC assumed 10% capacity value (except 16% In CA and 5% NWPP)
12
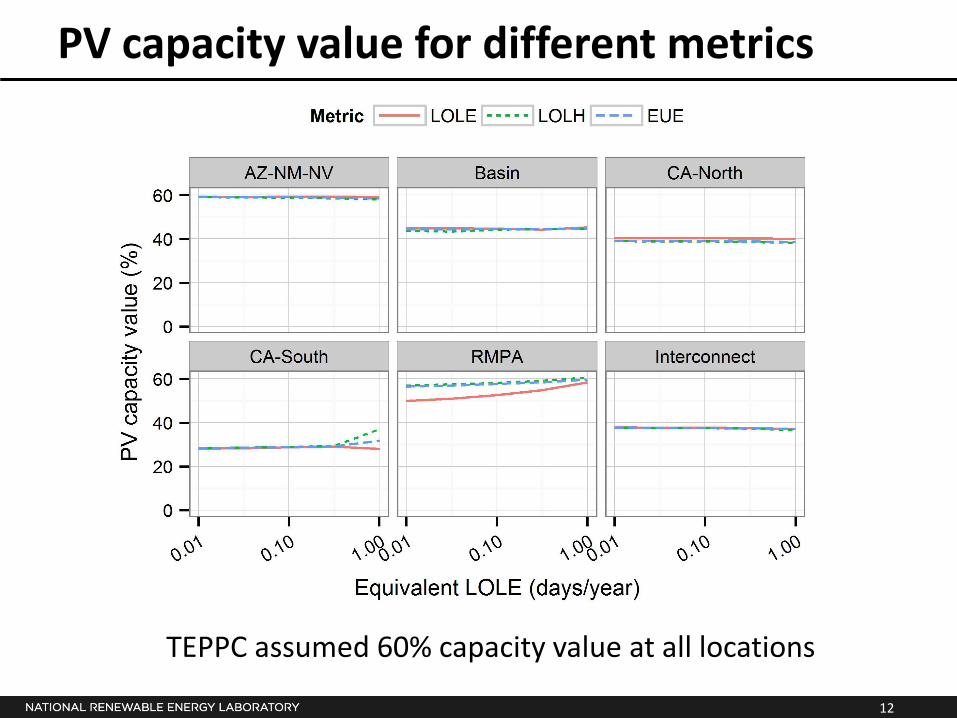
PV capacity value for different metrics
TEPPC assumed 60% capacity value at all locations
13
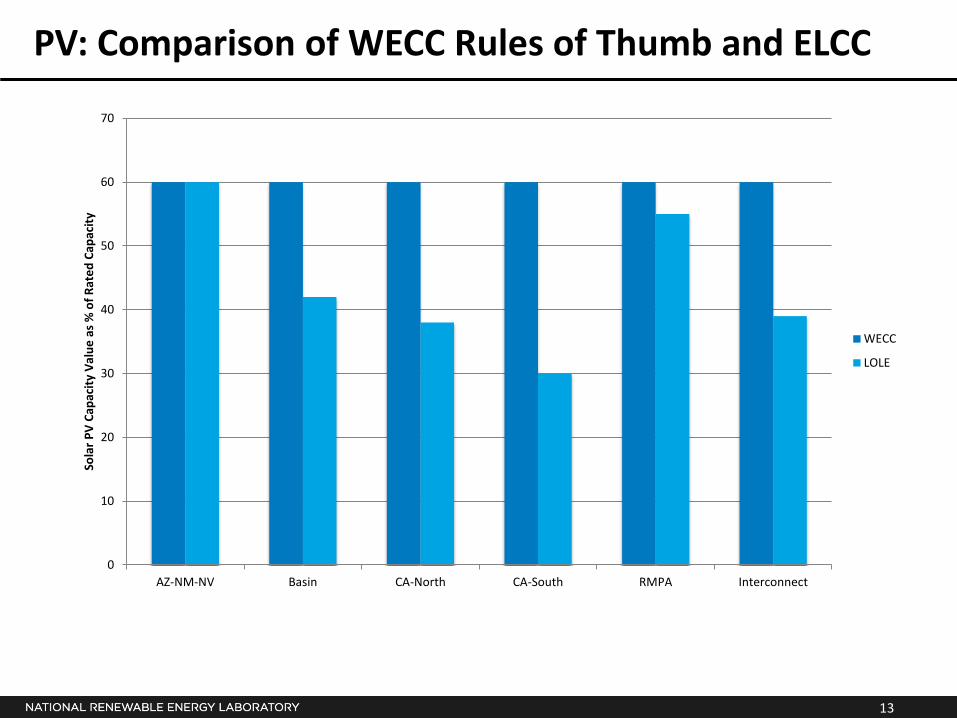
PV: Comparison of WECC Rules of Thumb and ELCC
0
10
20
30
40
50
60
70
AZ-NM-NV Basin CA-North CA-South RMPA Interconnect
Sola
r PV
Capa
city
Val
ue a
s % o
f Rat
ed C
apac
ity
WECC
LOLE
14
Wind: Comparison of WECC Rules of Thumb and ELCC
0
5
10
15
20
25
30
35
AZ-NM-NV Basin CA-North CA-South RMPA Alberta NWPP BC
Win
d Ca
paci
ty V
alue
as %
of R
ated
Cap
acity
WECC
LOLE
15
Conclusions – Resource Adequacy Metrics
• Estimating resource adequacy levels in the presence or renewables is an open area of research
• Capacity values are not very sensitive to metric or adequacy level selection
• Calculated CV were smaller than TEPPC assumptions; TEPPC cases might be slightly underbuilt
16
WECC may want to consider:
• Adopting these capacity values by type of resource and zone as new rules of thumb o Subject to periodic revision
• Utilizing NREL’s REPRA (open source) model to complement existing modeling resources in TEPPC process
• Utilizing an alternative approach to incorporate capacity valuation into the TEPPC process