Embed Size (px)
Citation preview
Capillary rise of a liquid into a deformable porous materialJ. I. Siddique,a� D. M. Anderson,b� and Andrei Bondarevc�
Department of Mathematical Sciences, George Mason University, Fairfax, Virginia 22030, USA
�Received 25 September 2008; accepted 12 December 2008; published online 27 January 2009�
We examine the effects of capillarity and gravity in a model of one-dimensional imbibition of anincompressible liquid into a deformable porous material. We focus primarily on a capillary riseproblem but also discuss a capillary/gravitational drainage configuration in which capillary andgravity forces act in the same direction. Models in both cases can be formulated as nonlinearfree-boundary problems. In the capillary rise problem, we identify time-dependent solutionsnumerically and compare them in the long time limit to analytically obtain equilibrium or steadystate solutions. A basic feature of the capillary rise model is that, after an early time regime governedby zero gravity dynamics, the liquid rises to a finite, equilibrium height and the porous materialdeforms into an equilibrium configuration. We explore the details of these solutions and theirdependence on system parameters such as the capillary pressure and the solid to liquid density ratio.We quantify both net, or global, deformation of the material and local deformation that may occureven in the case of zero net deformation. In the model for the draining problem, we identifynumerical solutions that quantify the effects of gravity, capillarity, and solid to liquid density ratioon the time required for a finite volume of fluid to drain into the deformable porous material. In theAppendix, experiments on capillary rise of water into a deformable sponge are described and themeasured capillary rise height and sponge deformation are compared with the theoreticalpredictions. For early times, the experimental data and theoretical predictions for these interfacedynamics are in general agreement. On the other hand, the long time equilibrium predictedtheoretically is not observed in our experimental data. © 2009 American Institute of Physics.�DOI: 10.1063/1.3068194�
I. INTRODUCTION
In this article we develop a model for capillary rise intoa deformable porous material. Capillary rise phenomena oc-cur in both rigid and deformable materials in a wide varietyof scientific fields such as oil recovery, inkjet printing, textileengineering, and flows in biological tissues. There is interestin this subject from the point of view of both industrial re-search and fundamental science. The present work addressesmodeling and solutions of this problem that contribute to abetter understanding of capillary rise into deformable porousmaterials.
The pioneering study of Washburn1 described fluid flowinto a rigid porous material. This model was based on theassumption that the porous material was a collection of smallcylindrical capillaries, and the flow through these capillarieswas Poiseuille flow subject to a pressure difference acting toforce the liquid in the capillaries. In the absence of gravity,the volume of the liquid that penetrates into the porous ma-terial in a time t is proportional to �t. In contrast, whengravity is present the liquid rises to a finite, equilibriumheight. The Washburn model has been widely used to de-scribe capillary rise phenomena in rigid nondeformable po-rous materials.
Recently, Zhmud et al.2 studied the dynamics of capil-lary rise in rigid porous materials. They showed that a num-
ber of models, including the Washburn model, describingdynamics of capillary rise can be obtained as particular lim-iting cases of a more general equation based on Newtoniandynamics. They also showed that these general equationswere in qualitative agreement with their experimental results.
However, other recent experimental investigations haverevealed capillary rise behavior in rigid porous materials thatdeparts notably from the Washburn predictions. Delker et al.3
performed experiments on capillary rise of water through apacking of glass beads. Their early time data for capillaryrise height follow a t1/2 power law, but for longer times theadvancing front rises beyond the Washburn equilibriumheight. Lago and Araujo4 also observed similar dynamics intheir experiments of capillary rise in an array of packedspheres. Both studies identified a new power law scaling forthis longer time regime that was close to t1/4.
Davis and Hocking5,6 considered a variety of models forliquid spreading and imbibition into a rigid porous base. Intheir first model5 they assumed that the porous material wasuniform and isotropic in structure. The flow in the poroussubstrate was described by Darcy’s law. In this model theyconsidered the partially saturated case in which the wettedportion of the substrate was assumed to extend to the bottomof the porous substrate. In their second model6 they extendedtheir previous work to include spreading above an initiallydry porous substrate. In this model they assumed that therewas no cross linking of the capillaries in the substrate whichwas also the case in the Washburn model. They calculatedthe penetration shapes as a function of time.
a�Electronic mail: [email protected]�Electronic mail: [email protected]�Co-author of Appendix. Electronic mail: [email protected].
PHYSICS OF FLUIDS 21, 013106 �2009�
1070-6631/2009/21�1�/013106/15/$25.00 © 2009 American Institute of Physics21, 013106-1
Downloaded 30 Oct 2009 to 129.174.55.245. Redistribution subject to AIP license or copyright; see http://pof.aip.org/pof/copyright.jsp
The above discussion outlines briefly some of the clas-sical as well as more recent studies involving flows in rigidporous materials. Here we turn our attention to porous ma-terials which deform when liquid passes through them, e.g.,spongelike materials. Deformable porous materials arise invarious fields, including geophysics,7 soil science,8–10
infiltration,11–15 snow physics,16 paper and printing,17,18 andmedical science.19–27 In such cases, the flow through the de-formable porous media deforms the material due to theforces associated with flow. The material deformation in turninfluences the flow. Models that account for both flow anddeformation are required to analyze the dynamics of thesematerials.
Early models of flows in deformable porous media weredeveloped to study soil consolidation. Biot28 described aproblem involving deformable porous media in whichDarcy’s law, used to describe the fluid flow, was coupled to alinear elasticity model for the solid deformation. He pre-sented the solutions for soil consolidation in one dimensionas well as two dimensions under permeable29 andimpermeable30 rectangular loads.
Our approach follows more recent work in which theporous material is modeled as a mixture of solid and fluid. Inmixture theory each component is treated as a single con-tinuum and every point in space is considered to be occupiedby a particle belonging to each component of the mixture ateach instant of time. A detailed mixture theory description ispresented by several authors.31,32
Barry and Aldis25,26 examined a variety of different mod-els of deformable porous media based on mixture theory.These models include cases of flow induced deformationfrom pressurized cavities in absorbing porous tissues and ra-dial flow through deformable porous shells. In their flowinduced deformation model, biological tissues are modeledas nonlinear deformable porous media where the deforma-tion of the tissues in turn alters the flow. In the case of radialflow, a governing system of equations was developed forcylindrical and spherical geometries.
Hou et al.24 studied the formulation of boundary condi-tions between a viscous fluid and a biphasic mixture. Theyused binary mixture theory to develop a set of boundaryconditions based on conservation laws. These conditionswere validated by applying them to Poiseuille flow andCouette flow problems.
Barry et al.27 revisited the work of Hou et al.24 for fluidflow over a thin deformable porous layer. Binary mixturetheory was used to obtain the governing system of equationswith assumptions that solid deformation was infinitesimaland the predominant displacement was along the axis of thechannel. Wang and Parker33 examined the effect of deform-able porous surface layers on the motion of a sphere in anarrow cylindrical tube. They also used binary mixturetheory for solid and liquid constituents to model the porouslayer on both the surface of the tube and the sphere. Theyapplied lubrication theory in the region between the sphereand the wall in order to study the effects of deformable lay-ers on the motion of the sphere.
Sommer and Mortensen11 considered the forced unidi-rectional infiltration in an initially dry deformable porous
material. A constant applied pressure drove the fluid flow inthe porous material. Agreement between their model and theexperimental results was reported.
Preziosi et al.12 studied the infiltration of a liquid into adeformable porous material. In this model, an initially dryand compressed porous material was infiltrated by an incom-pressible liquid which caused the porous material to deformand relax.
Following this work, Anderson34 presented a model forthe imbibition of a liquid droplet on a deformable poroussubstrate using the deformation model of Preziosi et al. Forthe assumed one-dimensional material deformation, a modelfor the imbibition of liquid into the porous material and alsofor the porous material deformation was developed. Ander-son’s model, which did not include gravitational effects, pre-dicted that during the imbibition of liquid into the deform-able porous substrate, swelling, swelling relaxation, andshrinking of the porous material could occur.
The ideas used for modeling deformable spongelike ma-terials also have application to problems involving suspen-sions and gels. Manley et al.35 performed experiments andexamined a model for gravitational collapse of colloidal gels.Their model was based on a Darcy’s equation similar to theone we use here. Approximations, such as negligible fluidvelocity relative to the solid velocity and constant solid vol-ume fraction, lead to a gel height that decays exponentiallyin time to an equilibrium height determined by a balance ofgravitational and elastic forces. Kim et al.36 examined asimilar problem that addresses gravitational collapse and sta-bilization of a suspension of attractive colloidal particles.Their mathematical model is very similar to ours but differsin details including boundary conditions as we discuss fur-ther in the next section.
Dufresne et al.37,38 studied related systems involving theflow and fracture in drying nanoparticle suspensions. Herethe compaction of the material is driven by evaporation andfluid flow at the drying surface. The dynamics of the com-paction front, crack formation in the drying suspension, andlong time crack propagation were investigated.
In the present work, we consider capillary rise of a fluidinto a deformable porous material. Our model is an analog ofthe Washburn model1 of capillary rise into a rigid porousmaterial. The basic governing equations for flow in deform-able material follow those of several previousauthors.11,12,21,25,26,34 Our model follows most closely that ofPreziosi et al.,12 Barry and Aldis,25,26 and Anderson.34 We areinterested in examining gravitational effects; these have beenincluded in previous models,12,25,26 but the corresponding so-lutions have not been addressed. Additionally, with theWashburn model and the experiments of Delker et al.3 andLago and Araujo4 in mind, in the Appendix we compare ourwork with experiments on capillary rise of water into de-formable porous sponges.
In Sec. II, we present the one-dimensional capillary riseproblem and then nondimensionalize the governing systemof equations. In Sec. III, we present equilibrium and time-dependent solutions of the capillary rise problem. In Sec. IVresults and discussion of the capillary rise problem are given.In Sec. V we discuss the drainage problem and its solutions.
013106-2 Siddique, Anderson, and Bondarev Phys. Fluids 21, 013106 �2009�
Downloaded 30 Oct 2009 to 129.174.55.245. Redistribution subject to AIP license or copyright; see http://pof.aip.org/pof/copyright.jsp
Section VI contains the conclusions. Finally, the Appendixgives details of experiments on the dynamics of capillary riseof water into deformable porous sponges and makes com-parisons with the theory.
II. ONE-DIMENSIONAL MODEL
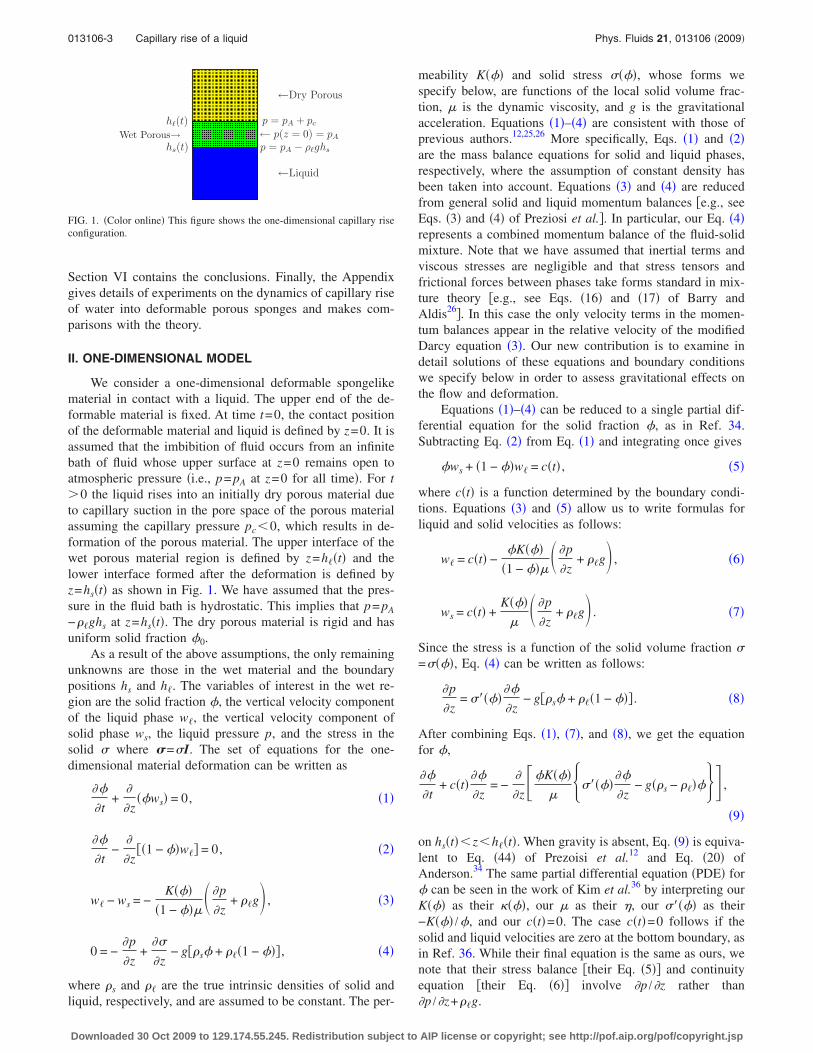
We consider a one-dimensional deformable spongelikematerial in contact with a liquid. The upper end of the de-formable material is fixed. At time t=0, the contact positionof the deformable material and liquid is defined by z=0. It isassumed that the imbibition of fluid occurs from an infinitebath of fluid whose upper surface at z=0 remains open toatmospheric pressure �i.e., p= pA at z=0 for all time�. For t�0 the liquid rises into an initially dry porous material dueto capillary suction in the pore space of the porous materialassuming the capillary pressure pc�0, which results in de-formation of the porous material. The upper interface of thewet porous material region is defined by z=h��t� and thelower interface formed after the deformation is defined byz=hs�t� as shown in Fig. 1. We have assumed that the pres-sure in the fluid bath is hydrostatic. This implies that p= pA
−��ghs at z=hs�t�. The dry porous material is rigid and hasuniform solid fraction �0.
As a result of the above assumptions, the only remainingunknowns are those in the wet material and the boundarypositions hs and h�. The variables of interest in the wet re-gion are the solid fraction �, the vertical velocity componentof the liquid phase w�, the vertical velocity component ofsolid phase ws, the liquid pressure p, and the stress in thesolid � where �=�I. The set of equations for the one-dimensional material deformation can be written as
��
�t+
�
�z��ws� = 0, �1�
��
�t−
�
�z��1 − ��w�� = 0, �2�
w� − ws = −K���
�1 − ���� �p
�z+ ��g� , �3�
0 = −�p
�z+
��
�z− g��s� + ���1 − ��� , �4�
where �s and �� are the true intrinsic densities of solid andliquid, respectively, and are assumed to be constant. The per-
meability K��� and solid stress ����, whose forms wespecify below, are functions of the local solid volume frac-tion, � is the dynamic viscosity, and g is the gravitationalacceleration. Equations �1�–�4� are consistent with those ofprevious authors.12,25,26 More specifically, Eqs. �1� and �2�are the mass balance equations for solid and liquid phases,respectively, where the assumption of constant density hasbeen taken into account. Equations �3� and �4� are reducedfrom general solid and liquid momentum balances �e.g., seeEqs. �3� and �4� of Preziosi et al.�. In particular, our Eq. �4�represents a combined momentum balance of the fluid-solidmixture. Note that we have assumed that inertial terms andviscous stresses are negligible and that stress tensors andfrictional forces between phases take forms standard in mix-ture theory �e.g., see Eqs. �16� and �17� of Barry andAldis26�. In this case the only velocity terms in the momen-tum balances appear in the relative velocity of the modifiedDarcy equation �3�. Our new contribution is to examine indetail solutions of these equations and boundary conditionswe specify below in order to assess gravitational effects onthe flow and deformation.
Equations �1�–�4� can be reduced to a single partial dif-ferential equation for the solid fraction �, as in Ref. 34.Subtracting Eq. �2� from Eq. �1� and integrating once gives
�ws + �1 − ��w� = c�t� , �5�
where c�t� is a function determined by the boundary condi-tions. Equations �3� and �5� allow us to write formulas forliquid and solid velocities as follows:
w� = c�t� −�K���
�1 − ���� �p
�z+ ��g� , �6�
ws = c�t� +K���
�� �p
�z+ ��g� . �7�
Since the stress is a function of the solid volume fraction �=����, Eq. �4� can be written as follows:
�p
�z= �����
��
�z− g��s� + ���1 − ��� . �8�
After combining Eqs. �1�, �7�, and �8�, we get the equationfor �,
��
�t+ c�t�
��
�z= −
�
�z��K���
������
��
�z− g��s − ����� ,
�9�
on hs�t��z�h��t�. When gravity is absent, Eq. �9� is equiva-lent to Eq. �44� of Prezoisi et al.12 and Eq. �20� ofAnderson.34 The same partial differential equation �PDE� for� can be seen in the work of Kim et al.36 by interpreting ourK��� as their ����, our � as their �, our ����� as their−K��� /�, and our c�t�=0. The case c�t�=0 follows if thesolid and liquid velocities are zero at the bottom boundary, asin Ref. 36. While their final equation is the same as ours, wenote that their stress balance �their Eq. �5�� and continuityequation �their Eq. �6�� involve �p /�z rather than�p /�z+��g.
p = pA + pc
← p(z = 0) = pAWet Porous→p = pA − ρ�ghs
←Liquid
hs(t)
h�(t)
←Dry Porous
FIG. 1. �Color online� This figure shows the one-dimensional capillary riseconfiguration.
013106-3 Capillary rise of a liquid Phys. Fluids 21, 013106 �2009�
Downloaded 30 Oct 2009 to 129.174.55.245. Redistribution subject to AIP license or copyright; see http://pof.aip.org/pof/copyright.jsp
The boundary conditions applied at the liquid–wet ma-terial interface z=hs�t� are
ws�hs+,t� =
�hs
�t, �10�
p�hs+,t� = pA − ��ghs�t� , �11�
��hs+,t� = 0, �12�
where pA is atmospheric pressure. Equations �10�–�12� arethe kinematic condition, hydrostatic pressure assumption inthe liquid bath, and zero stress condition, respectively.
The boundary conditions applied at the wet material–drymaterial interface z=h��t� are
w��h�−,t� =
�h�
�t, �13�
p�h�−,t� = pA + pc, �14�
where pc is a constant capillary pressure. Here Eqs. �13� and�14� are the kinematic and capillary pressure conditions,respectively.
Following Prezoisi et al. and Anderson, an expressionfor the c�t� can be written as
c�t� = �−�1 − �0�
�0� �K���
��1 − ����������
�z− g��s − �������
h�−.
�15�
The combination of Eqs. �6�–�8� with Eqs. �10� and �13�yields equations for interface positions,
�hs
�t= �c�t� +
K����
��������
�z− g��s − ������
hs+, �16�
�h�
�t= �c�t� −
�K�����1 − ��������
��
�z− g��s − ������
h�−.
�17�
To summarize, we need to solve Eqs. �8� and �9� subject toEqs. �11�, �12�, and �14� where the free surface positions aredetermined by Eqs. �16� and �17� along with appropriate ini-tial conditions. Note that Eq. �9� is coupled to Eq. �8� and thepressure via the boundary conditions.
A. Nondimensionalized system of equations
Before solving the time-dependent problem we introducethe following dimensionless quantities for space, time, inter-face positions, and pressure:
z̄ =z − hs�t�
h��t� − hs�t�, t̄ =
t
T, h̄s =
hs
L, h̄� =
h�
L, p̄ =
p
m,
�18�
where L=m /��g and T=L2� /mK0. Here K0 and m are thepermeability and stress scales defined below. These choicesof dimensionless variables allow us to transform the movingboundary problem to a fixed domain problem.
Our choices for permeability K��� and stress ����,which are consistent with physically realistic trends, areK���=K0 /�, where K0�0 and ����=m��r−��.34 We takem�0 so that �����=−m�0. The assumed form of the stressfunction is suitable for our one-dimensional deformationmodel; in higher dimensions, this would need to be general-ized to account for effects such as shear deformation. Notethat � is positive for ���r �i.e., expansion relative to therelaxed state� and negative for ���r �i.e., compression rela-tive to the relaxed state�. According to this choice, whensolid fraction is at a constant relaxed value �r, the stressfunction is zero.
Introducing these choices and dimensionless variables,the PDE for � can be written as
��
� t̄+ � �z̄ − 1�
�h̄� − h̄s�
dh̄s
dt̄−
z̄
�h̄� − h̄s�
dh̄�
dt̄� ��
� z̄+
c̄�t̄�
�h̄� − h̄s�
��
� z̄
=1
�h̄� − h̄s�2
�2�
� z̄2 +�
�h̄� − h̄s�
��
� z̄, �19�
where �= ��s /��−1�. Boundary conditions for solid volumefraction can be derived from the zero stress and stress equi-librium conditions as follows:
� = �r at z̄ = 0, �20�
� = ��� − �h̄� − h̄s�
0
1
��� + 1�dz̄ − h̄s at z̄ = 1, �21�
where ���=�r− pc /m. The boundary condition �21� is ob-
tained by integrating Eq. �8� and applying the pressureboundary conditions �11� and �14�. Note that in the absenceof gravity Eq. �21� reduces to �=��
�. The function c̄�t̄� isgiven by
c̄�t̄� = � 1 − �0
�0� 1
�1 − ���h̄� − h̄s�
��
� z̄+
��
�1 − ����z̄=1
,
�22�
and dimensionless interface positions satisfy the ordinarydifferential equations �ODEs�
dh̄s
dt̄= �c̄�t̄� − � 1
��h̄� − h̄s�
��
� z̄+ ���
z̄=0
, �23�
dh̄�
dt̄= �c̄�t̄� + � 1
�1 − ���h̄� − h̄s�
��
� z̄+
��
�1 − ����z̄=1
.
�24�
The initial conditions for the interface positions are
h̄��t̄ = 0� = 0, h̄s�t̄ = 0� = 0. �25�
013106-4 Siddique, Anderson, and Bondarev Phys. Fluids 21, 013106 �2009�
Downloaded 30 Oct 2009 to 129.174.55.245. Redistribution subject to AIP license or copyright; see http://pof.aip.org/pof/copyright.jsp
III. CAPILLARY RISE SOLUTIONS
The time-dependent free-boundary problem �19�–�25�can be solved numerically. First, however, we will identifythe equilibrium state solution which will be compared withthe time-dependent solution later in Sec. IV.
A. Steady state solution
The steady state solution for solid volume fraction andpressure can be written as follows:
��z̄� = �re��h̄s
−h̄��z̄ �26�
and
p̄�z̄� = �r − ��� + �h̄�
− h̄s��1 − z̄� + p̄A �27�
where h̄s and h̄�
are the equilibrium heights of solid andliquid, respectively, to be determined. Here p̄A is the dimen-sionless atmospheric pressure. This pressure corresponds tohydrostatic pressure and quantity �r−��
� can be interpretedas a dimensionless capillary pressure.
To find the steady state solid interface position h̄s, we
use a global mass conservation argument which can be statedas follows. The mass of the solid before liquid is imbibedinto the material is equal to the mass of the solid after liquidis imbibed into the material. In dimensionless form, this is
�0h̄� = �h̄�
− h̄s�
0
1
��z̄�dz̄ . �28�
The solution of Eq. �28� after using Eq. �26� yields a steadystate solid interface position,
h̄s =
1
�ln�1 − �h̄�
�0
�r� + h̄�
. �29�
Also the steady state liquid interface position can be writtenas
h̄� = ��
� − �r. �30�
Note that in dimensional form h�=−pc /��g, which is the
same as that for capillary rise in a rigid porous material giventhe same capillary pressure pc. Using Eqs. �26� and �29� wecan define
�� = �r − ����
� − �r��0, �31�
where �� is the solid volume fraction at the wet material–dry
material interface evaluated in the limit t→. Further dis-cussion of these solutions will be given in Sec. IV. In thefollowing section we will solve the time-dependent capillaryrise problem.
B. Time-dependent solution
The coefficients of Eqs. �19�, �23�, and �24� are singularat time t=0. However, in the asymptotic limit t→0 theseequations and the boundary condition �21� reduce to the zerogravity case. In this case, Eq. �19� with the associated bound-ary conditions can be solved using the similarity variable �
=z /2�Dt, where D=L2 /T=K0m /� has units of lengthsquared per unit time �see Ref. 34 for details�. Here the in-terface positions can be expressed as
h̄s�t̄� = 2s�t̄, h̄��t̄� = 2�
�t̄ . �32�
The zero gravity solution, denoted by �s, can be written interms of the error function as follows:
�s =erf�s − B� − erf�� − B�erf�s − B� − erf�� − B�
���� − �r� + �r, �33�
where
B = �1 − �0�� �34�
and
s =���
� − �r����erf�s − B� − erf�� − B��
1
�rexp�− �s − B�2�
−�1 − �0�
�0�1 − ����
exp�− �� − B�2� , �35�
� = −���
� − �r�exp�− �� − B��
�0�1 − �������erf�s − B� − erf�� − B��
. �36�
This is the solution given by Anderson,34 Eqs. �46�–�49�. We
avoid the singularity at t̄=0 �when h̄s�t̄�= h̄��t̄�=0� numeri-cally when solving Eqs. �19�–�24� by using this similaritysolution as an initial condition at time t̄= t̄I�0. Specifically,the initial condition for � can be derived from the similaritysolution ��z̄ , t̄I�=�s���, where t̄I is chosen to be sufficientlysmall so that the solution is independent of any further re-duction in t̄I. Noting that
� = s + z̄�� − s� , �37�
the initial condition for � in dimensionless form becomes
��z̄, t̄ = tI� = �s�s + z̄�� − s�� . �38�
The initial conditions for h̄s and h̄� are
h̄s�t̄I� = 2s�t̄I, h̄��t̄I� = 2�
�t̄I. �39�
The above system of equations �19�–�24� is solved numeri-cally subject to the initial conditions �39� and also by usingthe similarity solution �38� as an initial condition for �. Tocompute the numerical solution, we use a method of linesapproach with a second order accurate finite differencescheme in space. This converts the PDE to a system ofODEs. These ODEs along with Eqs. �23� and �24� are solvednumerically using MATLAB’s ode23s solver.
IV. CAPILLARY RISE RESULTS AND DISCUSSION
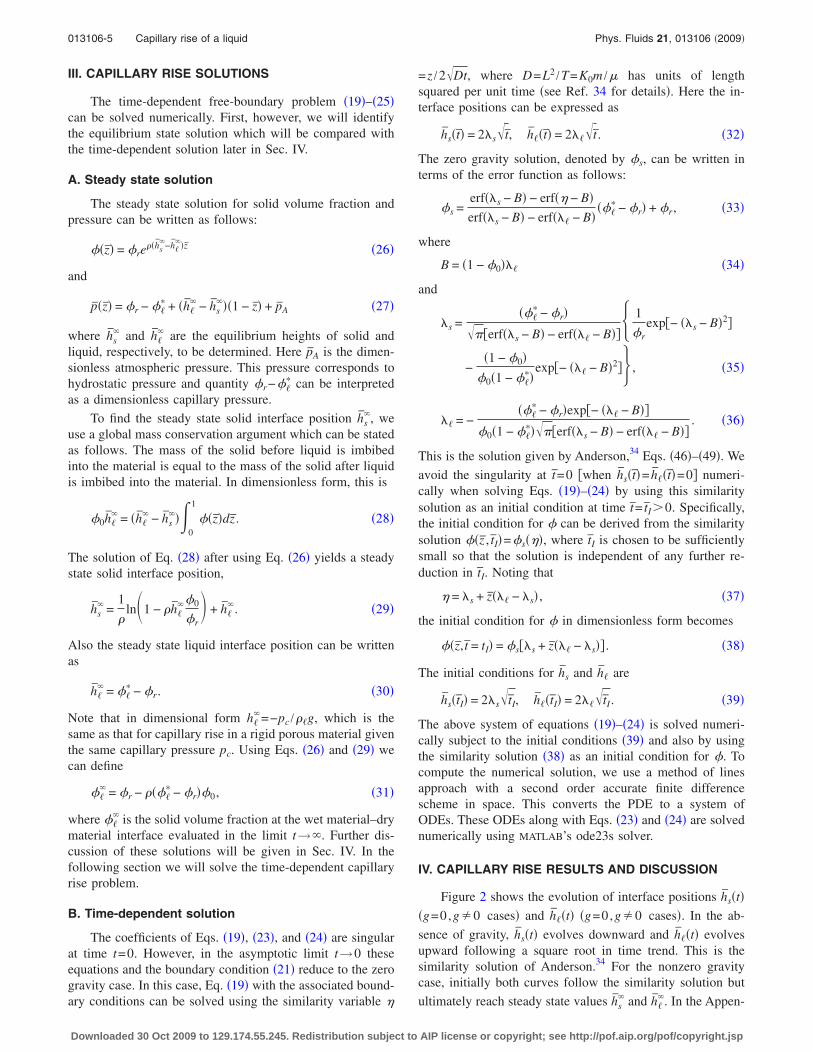
Figure 2 shows the evolution of interface positions h̄s�t��g=0,g�0 cases� and h̄��t� �g=0,g�0 cases�. In the ab-
sence of gravity, h̄s�t� evolves downward and h̄��t� evolvesupward following a square root in time trend. This is thesimilarity solution of Anderson.34 For the nonzero gravitycase, initially both curves follow the similarity solution but
ultimately reach steady state values h̄s and h̄�
. In the Appen-
013106-5 Capillary rise of a liquid Phys. Fluids 21, 013106 �2009�
Downloaded 30 Oct 2009 to 129.174.55.245. Redistribution subject to AIP license or copyright; see http://pof.aip.org/pof/copyright.jsp
dix we compare predictions for these interface positions tothe experimental data obtained for the capillary rise of waterinto deformable sponges for the same configuration exam-ined in the model.
The steady state values for h̄s, h̄�
that can be observed inFig. 2 depend on various parameters. In the next severalfigures we explore this dependence. We first note that the
dimensionless h̄� is independent of � �see Eq. �30��. How-
ever, it is important to point out that the length scale L andthe dimensional h�
do depend on ��. Therefore, we interpret� as a dimensionless quantity measuring solid density.
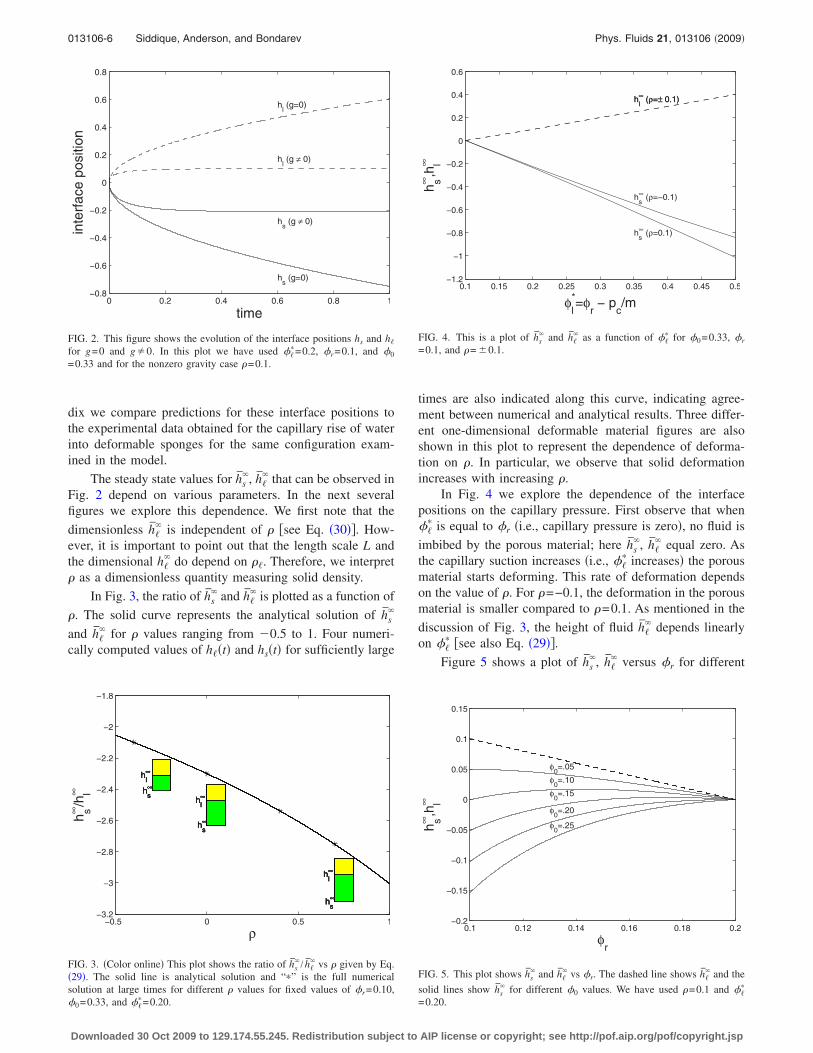
In Fig. 3, the ratio of h̄s and h̄�
is plotted as a function of
�. The solid curve represents the analytical solution of h̄s
and h̄� for � values ranging from �0.5 to 1. Four numeri-
cally computed values of h��t� and hs�t� for sufficiently large
times are also indicated along this curve, indicating agree-ment between numerical and analytical results. Three differ-ent one-dimensional deformable material figures are alsoshown in this plot to represent the dependence of deforma-tion on �. In particular, we observe that solid deformationincreases with increasing �.
In Fig. 4 we explore the dependence of the interfacepositions on the capillary pressure. First observe that when��
� is equal to �r �i.e., capillary pressure is zero�, no fluid is
imbibed by the porous material; here h̄s, h̄�
equal zero. Asthe capillary suction increases �i.e., ��
� increases� the porousmaterial starts deforming. This rate of deformation dependson the value of �. For �=−0.1, the deformation in the porousmaterial is smaller compared to �=0.1. As mentioned in the
discussion of Fig. 3, the height of fluid h̄� depends linearly
on ��� �see also Eq. �29��.
Figure 5 shows a plot of h̄s, h̄�
versus �r for different
0 0.2 0.4 0.6 0.8 1−0.8
−0.6
−0.4
−0.2
0
0.2
0.4
0.6
0.8
hl(g=0)
hl(g ≠ 0)
hs
(g=0)
hs
(g ≠ 0)
time
inte
rfac
epo
sitio
n
FIG. 2. This figure shows the evolution of the interface positions hs and h�
for g=0 and g�0. In this plot we have used ���=0.2, �r=0.1, and �0
=0.33 and for the nonzero gravity case �=0.1.
−0.5 0 0.5 1−3.2
−3
−2.8
−2.6
−2.4
−2.2
−2
−1.8
h∞l
h∞s
ρ
h∞ s/h
∞ l
h∞l
h∞s
h∞l
h∞s
h∞l
h∞s
h∞l
h∞s
h∞l
h∞s
h∞l
h∞s
h∞l
h∞s
h∞l
h∞s
h∞l
h∞s
h∞l
h∞s
h∞l
h∞s
FIG. 3. �Color online� This plot shows the ratio of h̄s / h̄�
vs � given by Eq.�29�. The solid line is analytical solution and “�” is the full numericalsolution at large times for different � values for fixed values of �r=0.10,�0=0.33, and ��
�=0.20.
0.1 0.15 0.2 0.25 0.3 0.35 0.4 0.45 0.5−1.2
−1
−0.8
−0.6
−0.4
−0.2
0
0.2
0.4
0.6
φ*l=φ
r− p
c/m
h∞ s,h
∞ l
h∞l
(ρ=± 0.1)
h∞s
(ρ=0.1)
h∞l
(ρ=± 0.1)
h∞s
(ρ=−0.1)
FIG. 4. This is a plot of h̄s and h̄�
as a function of ��� for �0=0.33, �r
=0.1, and �= 0.1.
0.1 0.12 0.14 0.16 0.18 0.2−0.2
−0.15
−0.1
−0.05
0
0.05
0.1
0.15
φr
h∞ s,h
∞ l
φ0=.25
φ0=.20
φ0=.15
φ0=.10
φ0=.05
FIG. 5. This plot shows h̄s and h̄�
vs �r. The dashed line shows h̄� and the
solid lines show h̄s for different �0 values. We have used �=0.1 and ��
�
=0.20.
013106-6 Siddique, Anderson, and Bondarev Phys. Fluids 21, 013106 �2009�
Downloaded 30 Oct 2009 to 129.174.55.245. Redistribution subject to AIP license or copyright; see http://pof.aip.org/pof/copyright.jsp
values of �0. Note that h̄�, indicated by the dashed line, is
independent of �0. Situations of net compression �h̄s posi-
tive� generally correspond to relatively small values of �0. Inorder for this to be physically realistic, we assume that theliquid bath remains in contact with the solid even in cases
with h̄s�0. On the other hand, net expansion �h̄s negative�
generally corresponds to relatively large values of �0. Forthe intermediate values of �0, details of other parameter val-ues determine the nature of the final configuration. This sug-gest that materials with relatively high porosity tend toshrink while those with sufficiently low porosity tend toexpand.
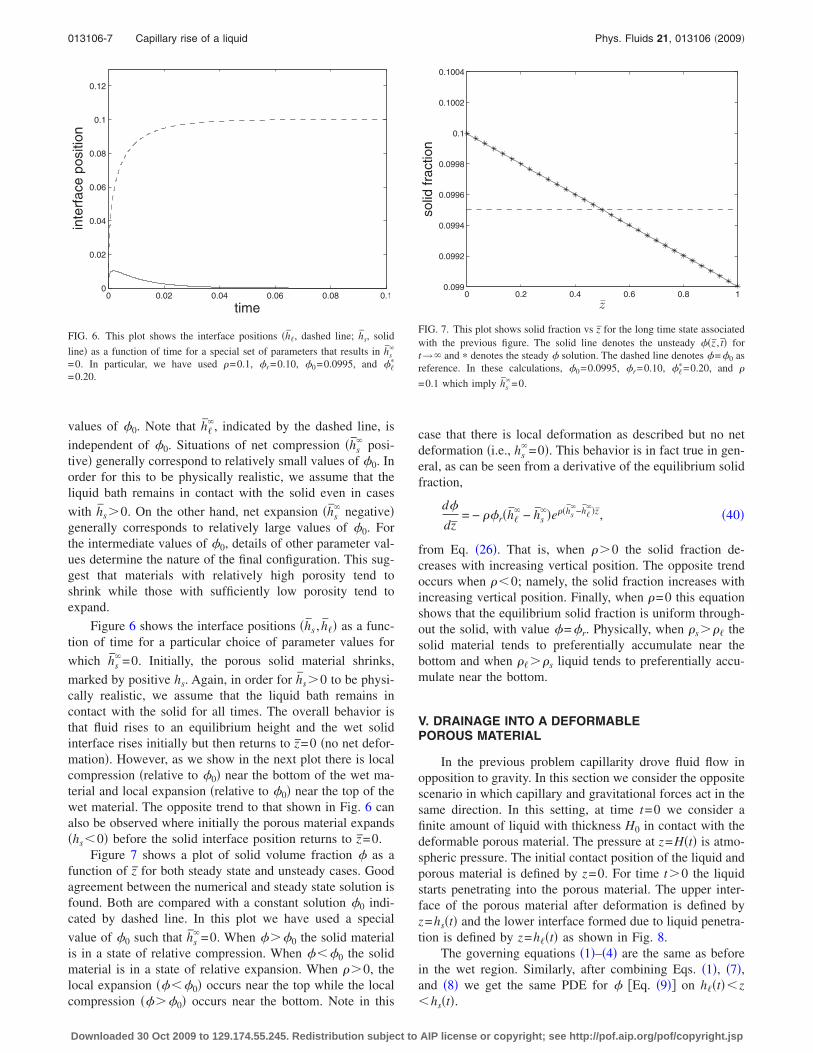
Figure 6 shows the interface positions �h̄s , h̄�� as a func-tion of time for a particular choice of parameter values for
which h̄s=0. Initially, the porous solid material shrinks,
marked by positive hs. Again, in order for h̄s�0 to be physi-cally realistic, we assume that the liquid bath remains incontact with the solid for all times. The overall behavior isthat fluid rises to an equilibrium height and the wet solidinterface rises initially but then returns to z̄=0 �no net defor-mation�. However, as we show in the next plot there is localcompression �relative to �0� near the bottom of the wet ma-terial and local expansion �relative to �0� near the top of thewet material. The opposite trend to that shown in Fig. 6 canalso be observed where initially the porous material expands�hs�0� before the solid interface position returns to z̄=0.
Figure 7 shows a plot of solid volume fraction � as afunction of z̄ for both steady state and unsteady cases. Goodagreement between the numerical and steady state solution isfound. Both are compared with a constant solution �0 indi-cated by dashed line. In this plot we have used a special
value of �0 such that h̄s=0. When ���0 the solid material
is in a state of relative compression. When ���0 the solidmaterial is in a state of relative expansion. When ��0, thelocal expansion ����0� occurs near the top while the localcompression ����0� occurs near the bottom. Note in this
case that there is local deformation as described but no netdeformation �i.e., hs
=0�. This behavior is in fact true in gen-eral, as can be seen from a derivative of the equilibrium solidfraction,
d�
dz̄= − ��r�h̄�
− h̄s�e��h̄s
−h̄��z̄, �40�
from Eq. �26�. That is, when ��0 the solid fraction de-creases with increasing vertical position. The opposite trendoccurs when ��0; namely, the solid fraction increases withincreasing vertical position. Finally, when �=0 this equationshows that the equilibrium solid fraction is uniform through-out the solid, with value �=�r. Physically, when �s��� thesolid material tends to preferentially accumulate near thebottom and when ����s liquid tends to preferentially accu-mulate near the bottom.
V. DRAINAGE INTO A DEFORMABLEPOROUS MATERIAL
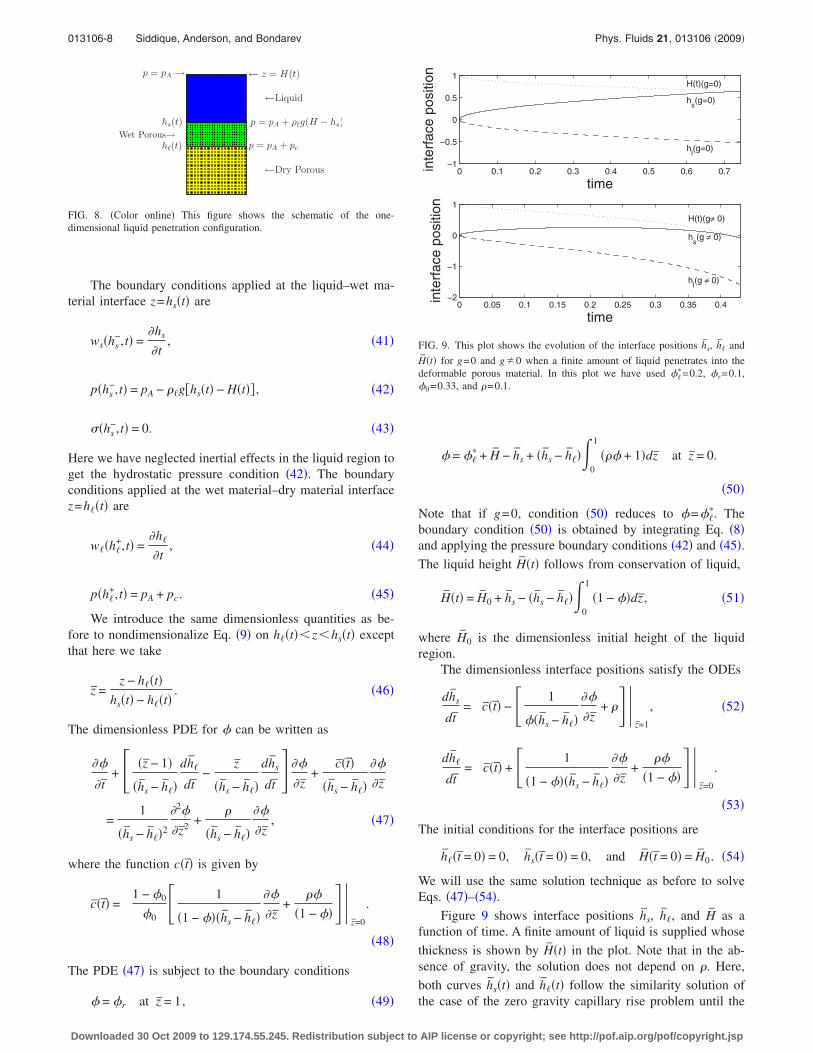
In the previous problem capillarity drove fluid flow inopposition to gravity. In this section we consider the oppositescenario in which capillary and gravitational forces act in thesame direction. In this setting, at time t=0 we consider afinite amount of liquid with thickness H0 in contact with thedeformable porous material. The pressure at z=H�t� is atmo-spheric pressure. The initial contact position of the liquid andporous material is defined by z=0. For time t�0 the liquidstarts penetrating into the porous material. The upper inter-face of the porous material after deformation is defined byz=hs�t� and the lower interface formed due to liquid penetra-tion is defined by z=h��t� as shown in Fig. 8.
The governing equations �1�–�4� are the same as beforein the wet region. Similarly, after combining Eqs. �1�, �7�,and �8� we get the same PDE for � �Eq. �9�� on h��t��z�hs�t�.
0 0.02 0.04 0.06 0.08 0.10
0.02
0.04
0.06
0.08
0.1
0.12
time
inte
rfac
epo
sitio
n
FIG. 6. This plot shows the interface positions �h̄�, dashed line; h̄s, solid
line� as a function of time for a special set of parameters that results in h̄s
=0. In particular, we have used �=0.1, �r=0.10, �0=0.0995, and ���
=0.20.
0 0.2 0.4 0.6 0.8 10.099
0.0992
0.0994
0.0996
0.0998
0.1
0.1002
0.1004
z̄
solid
frac
tion
FIG. 7. This plot shows solid fraction vs z̄ for the long time state associatedwith the previous figure. The solid line denotes the unsteady ��z̄ , t̄� fort→ and � denotes the steady � solution. The dashed line denotes �=�0 asreference. In these calculations, �0=0.0995, �r=0.10, ��
�=0.20, and �
=0.1 which imply h̄s=0.
013106-7 Capillary rise of a liquid Phys. Fluids 21, 013106 �2009�
Downloaded 30 Oct 2009 to 129.174.55.245. Redistribution subject to AIP license or copyright; see http://pof.aip.org/pof/copyright.jsp
The boundary conditions applied at the liquid–wet ma-terial interface z=hs�t� are
ws�hs−,t� =
�hs
�t, �41�
p�hs−,t� = pA − ��g�hs�t� − H�t�� , �42�
��hs−,t� = 0. �43�
Here we have neglected inertial effects in the liquid region toget the hydrostatic pressure condition �42�. The boundaryconditions applied at the wet material–dry material interfacez=h��t� are
w��h�+,t� =
�h�
�t, �44�
p�h�+,t� = pA + pc. �45�
We introduce the same dimensionless quantities as be-fore to nondimensionalize Eq. �9� on h��t��z�hs�t� exceptthat here we take
z̄ =z − h��t�
hs�t� − h��t�. �46�
The dimensionless PDE for � can be written as
��
� t̄+ � �z̄ − 1�
�h̄s − h̄��
dh̄�
dt̄−
z̄
�h̄s − h̄��
dh̄s
dt̄� ��
� z̄+
c̄�t̄�
�h̄s − h̄��
��
� z̄
=1
�h̄s − h̄��2
�2�
� z̄2 +�
�h̄s − h̄��
��
� z̄, �47�
where the function c�t̄� is given by
c̄�t̄� = � 1 − �0
�0� 1
�1 − ���h̄s − h̄��
��
� z̄+
��
�1 − ����z̄=0
.
�48�
The PDE �47� is subject to the boundary conditions
� = �r at z̄ = 1, �49�
� = ��� + H̄ − h̄s + �h̄s − h̄��
0
1
��� + 1�dz̄ at z̄ = 0.
�50�
Note that if g=0, condition �50� reduces to �=���. The
boundary condition �50� is obtained by integrating Eq. �8�and applying the pressure boundary conditions �42� and �45�.The liquid height H̄�t� follows from conservation of liquid,
H̄�t� = H̄0 + h̄s − �h̄s − h̄�� 0
1
�1 − ��dz̄ , �51�
where H̄0 is the dimensionless initial height of the liquidregion.
The dimensionless interface positions satisfy the ODEs
dh̄s
dt̄= �c̄�t̄� − � 1
��h̄s − h̄��
��
� z̄+ ���
z̄=1
, �52�
dh̄�
dt̄= �c̄�t̄� + � 1
�1 − ���h̄s − h̄��
��
� z̄+
��
�1 − ����z̄=0
.
�53�
The initial conditions for the interface positions are
h̄��t̄ = 0� = 0, h̄s�t̄ = 0� = 0, and H̄�t̄ = 0� = H̄0. �54�
We will use the same solution technique as before to solveEqs. �47�–�54�.
Figure 9 shows interface positions h̄s, h̄�, and H̄ as afunction of time. A finite amount of liquid is supplied whose
thickness is shown by H̄�t� in the plot. Note that in the ab-sence of gravity, the solution does not depend on �. Here,
both curves h̄s�t� and h̄��t� follow the similarity solution ofthe case of the zero gravity capillary rise problem until the
p = pA + ρ�g(H − hs)
← z = H(t)p = pA →
Wet Porous→p = pA + pc
←Liquid
h�(t)
hs(t)
←Dry Porous
FIG. 8. �Color online� This figure shows the schematic of the one-dimensional liquid penetration configuration.
0 0.05 0.1 0.15 0.2 0.25 0.3 0.35 0.4−2
−1
0
1
H(t)(g≠ 0)
hs(g ≠ 0)
hl(g ≠ 0)
time
inte
rfac
epo
sitio
n
0 0.1 0.2 0.3 0.4 0.5 0.6 0.7−1
−0.5
0
0.5
1H(t)(g=0)
hs(g=0)
hl(g=0)
time
inte
rfac
epo
sitio
n
FIG. 9. This plot shows the evolution of the interface positions h̄s, h̄� and
H̄�t� for g=0 and g�0 when a finite amount of liquid penetrates into thedeformable porous material. In this plot we have used ��
�=0.2, �r=0.1,�0=0.33, and �=0.1.
013106-8 Siddique, Anderson, and Bondarev Phys. Fluids 21, 013106 �2009�
Downloaded 30 Oct 2009 to 129.174.55.245. Redistribution subject to AIP license or copyright; see http://pof.aip.org/pof/copyright.jsp
fluid layer is completely drained into the porous material
when h̄s= H̄. For the nonzero gravity case, both curves fol-low the similarity solution initially but then depart from thistrend until again the liquid layer has completely drained. Wedefine a drainage time as the time at which all the liquid is
drained into the porous material t̄= t� �h̄s�t��= H̄�t���. Thisdrainage time is faster for the nonzero gravity case as com-pared to the zero gravity case.
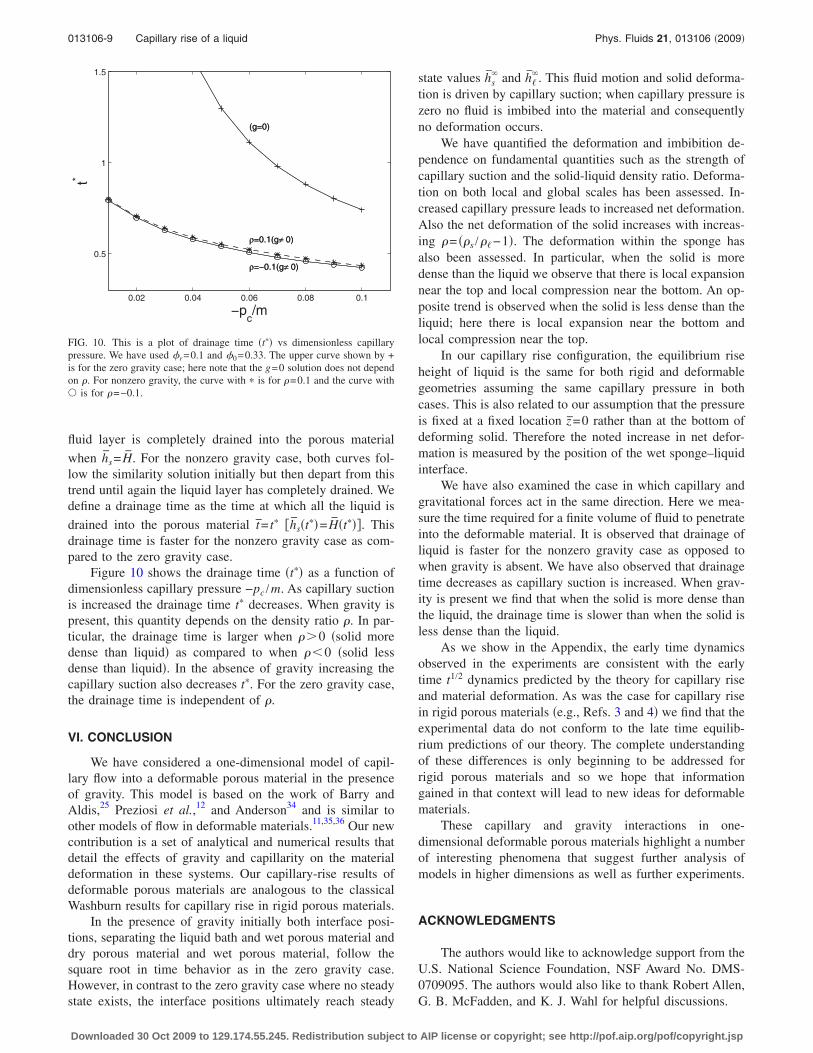
Figure 10 shows the drainage time �t�� as a function ofdimensionless capillary pressure −pc /m. As capillary suctionis increased the drainage time t� decreases. When gravity ispresent, this quantity depends on the density ratio �. In par-ticular, the drainage time is larger when ��0 �solid moredense than liquid� as compared to when ��0 �solid lessdense than liquid�. In the absence of gravity increasing thecapillary suction also decreases t�. For the zero gravity case,the drainage time is independent of �.
VI. CONCLUSION
We have considered a one-dimensional model of capil-lary flow into a deformable porous material in the presenceof gravity. This model is based on the work of Barry andAldis,25 Preziosi et al.,12 and Anderson34 and is similar toother models of flow in deformable materials.11,35,36 Our newcontribution is a set of analytical and numerical results thatdetail the effects of gravity and capillarity on the materialdeformation in these systems. Our capillary-rise results ofdeformable porous materials are analogous to the classicalWashburn results for capillary rise in rigid porous materials.
In the presence of gravity initially both interface posi-tions, separating the liquid bath and wet porous material anddry porous material and wet porous material, follow thesquare root in time behavior as in the zero gravity case.However, in contrast to the zero gravity case where no steadystate exists, the interface positions ultimately reach steady
state values h̄s and h̄�
. This fluid motion and solid deforma-tion is driven by capillary suction; when capillary pressure iszero no fluid is imbibed into the material and consequentlyno deformation occurs.
We have quantified the deformation and imbibition de-pendence on fundamental quantities such as the strength ofcapillary suction and the solid-liquid density ratio. Deforma-tion on both local and global scales has been assessed. In-creased capillary pressure leads to increased net deformation.Also the net deformation of the solid increases with increas-ing �= ��s /��−1�. The deformation within the sponge hasalso been assessed. In particular, when the solid is moredense than the liquid we observe that there is local expansionnear the top and local compression near the bottom. An op-posite trend is observed when the solid is less dense than theliquid; here there is local expansion near the bottom andlocal compression near the top.
In our capillary rise configuration, the equilibrium riseheight of liquid is the same for both rigid and deformablegeometries assuming the same capillary pressure in bothcases. This is also related to our assumption that the pressureis fixed at a fixed location z̄=0 rather than at the bottom ofdeforming solid. Therefore the noted increase in net defor-mation is measured by the position of the wet sponge–liquidinterface.
We have also examined the case in which capillary andgravitational forces act in the same direction. Here we mea-sure the time required for a finite volume of fluid to penetrateinto the deformable material. It is observed that drainage ofliquid is faster for the nonzero gravity case as opposed towhen gravity is absent. We have also observed that drainagetime decreases as capillary suction is increased. When grav-ity is present we find that when the solid is more dense thanthe liquid, the drainage time is slower than when the solid isless dense than the liquid.
As we show in the Appendix, the early time dynamicsobserved in the experiments are consistent with the earlytime t1/2 dynamics predicted by the theory for capillary riseand material deformation. As was the case for capillary risein rigid porous materials �e.g., Refs. 3 and 4� we find that theexperimental data do not conform to the late time equilib-rium predictions of our theory. The complete understandingof these differences is only beginning to be addressed forrigid porous materials and so we hope that informationgained in that context will lead to new ideas for deformablematerials.
These capillary and gravity interactions in one-dimensional deformable porous materials highlight a numberof interesting phenomena that suggest further analysis ofmodels in higher dimensions as well as further experiments.
ACKNOWLEDGMENTS
The authors would like to acknowledge support from theU.S. National Science Foundation, NSF Award No. DMS-0709095. The authors would also like to thank Robert Allen,G. B. McFadden, and K. J. Wahl for helpful discussions.
0.02 0.04 0.06 0.08 0.1
0.5
1
1.5
(g=0)
−pc/m
t*
ρ=0.1(g≠ 0)
ρ=−0.1(g≠ 0)
(g=0)
ρ=0.1(g≠ 0)
ρ=−0.1(g≠ 0)
FIG. 10. This is a plot of drainage time �t�� vs dimensionless capillarypressure. We have used �r=0.1 and �0=0.33. The upper curve shown by +is for the zero gravity case; here note that the g=0 solution does not dependon �. For nonzero gravity, the curve with � is for �=0.1 and the curve with� is for �=−0.1.
013106-9 Capillary rise of a liquid Phys. Fluids 21, 013106 �2009�
Downloaded 30 Oct 2009 to 129.174.55.245. Redistribution subject to AIP license or copyright; see http://pof.aip.org/pof/copyright.jsp
APPENDIX: EXPERIMENTS ON CAPILLARY RISEOF A LIQUID INTO A DEFORMABLE SPONGE
We present experimental results that document both thecapillary rise of water into an initially dry sponge and theresulting deformation of the sponge. We discuss these resultsin the context of capillary rise experiments that have previ-ously been performed for rigid porous materials as well as inthe context of the theoretical model presented in the maintext.
The classical model of Washburn1 has been used fornearly a century to describe capillary flow in rigid porousmaterials. Washburn’s model predicts that when a fluid isimbibed into a porous material due to capillarity and againstthe force of gravity the fluid height initially increases, fol-lowing a square root in time behavior before approaching anequilibrium value determined by the balance of capillaryforces with the weight of the elevated fluid.
Recent experimental work on capillary rise in rigid po-rous materials has verified Washburn’s early time t1/2 powerlaw but has also shown that at later times, rather than reach-ing an equilibrium height, the fluid may continue to rise fol-lowing a different power law. Delker et al.3 conducted ex-periments on capillary rise of water in a porous materialmade up of glass beads. In this setting they observed theearly time t1/2 power law predicted by Washburn but demon-strated that even after several orders of magnitude in timebeyond the early scaling regime, the fluid height continued toincrease, following dynamics that could be fitted with apower law t1/4. They attributed these long time dynamics torandomness in the capillary forces of the porous material.More recently, Lago and Araujo4 conducted similar experi-ments for capillary rise of water in a packing of glass beadsas well as capillary rise of water in Berea sandstones. Fortheir experiments with glass beads they, like Delker et al.,observed the early time Washburn dynamics and long timedynamics for height that followed a power law �they did notgive a specific value for this power law, but it appears to beclose to the t1/4 estimated by Delker et al.�. In contrast, forthe case of Berea sandstone only the t1/2 power law wasobserved.
In our experiments on capillary rise of water in deform-able sponges presented below, we measure the capillary riseheight hl�t� relative to the water level z=0 of the fluid bath,the sponge deformation depth hs�t� into the bath, and theoverall wet sponge height h�t�=hl�t�−hs�t�. We observe be-havior analogous to that observed by Delker et al.3 and Lagoand Araujo4 for their experiments with glass beads and water.Namely, we observe that the capillary rise height hl�t� anddeformation depth hs�t� follow early time dynamics consis-tent with a t1/2 power law. The long time dynamics that weobserve in the experiments for hl�t� can be characterized by apower law tb with 0.22�b�0.25, which appears to be closeto the t1/4 observed in rigid porous materials. The power lawobserved for hs�t� has a slightly smaller exponent rangingfrom 0.18 to 0.21.
1. Description of experiments
In our experiments we use commonly available cellulosesponges �e.g., kitchen sponges� and water. Four sponges, allcut from a single larger sponge, were used in the experimentsdescribed here. The four smaller sponges were approxi-mately rectangular parallelepipeds and when damp hadheight of 9.1 0.1 cm, width of 3.8 0.2 cm, and depth of2.4 0.1 cm. These same sponges when dry �as at the be-ginning of each experiment� had height of 8.1 0.2 cm,width of 3.5 0.2 cm, and depth of 2.1 0.1 cm. The varia-tions listed are representative of the variation of each dimen-sion within a given sponge as well as that between the indi-vidual sponges. In general it is difficult to avoid suchvariations in at least either the wet and dry sponges. Whilecareful milling or cutting of a sponge can be done �e.g., Ref.11� the sponge deforms during both wetting and drying andin general will not exactly maintain its shape. We note thatwhile it is possible to compress a sponge as it dries, forexample, for more efficient storage and transport of drysponges as well as more dramatic deformation when it soaksup liquid, in all the cases presented, the sponges were al-lowed to dry naturally �without external compression� andcompletely before each experiment. Further, we did not at-tempt to eliminate changes in the sponge properties that mayhave occurred over multiple wetting, drying, swelling, andshrinking cycles as has been reported in other similar experi-ments for polyurethane sponges �see Refs. 39–41 and 11�.While presumably the material properties may vary betweenexperiments conducted here, our interest is primarily in iden-tifying qualitative behavior of typical sponges �e.g., ones thatmay not have undergone multiple compression cycles toequilibrate material properties� and to document joint capil-lary rise and material deformation in an experimental setting.Our results show no qualitative changes in the imbibition/deformation process during the course of experiments run onthe same sponges over several months.
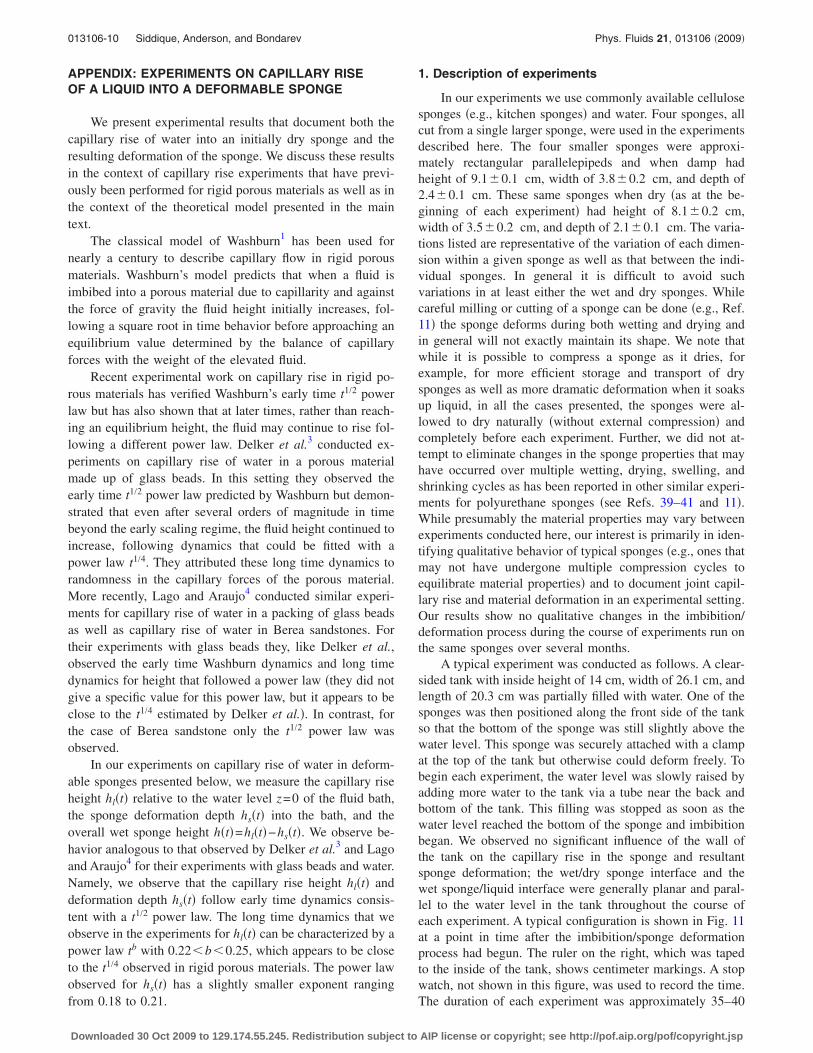
A typical experiment was conducted as follows. A clear-sided tank with inside height of 14 cm, width of 26.1 cm, andlength of 20.3 cm was partially filled with water. One of thesponges was then positioned along the front side of the tankso that the bottom of the sponge was still slightly above thewater level. This sponge was securely attached with a clampat the top of the tank but otherwise could deform freely. Tobegin each experiment, the water level was slowly raised byadding more water to the tank via a tube near the back andbottom of the tank. This filling was stopped as soon as thewater level reached the bottom of the sponge and imbibitionbegan. We observed no significant influence of the wall ofthe tank on the capillary rise in the sponge and resultantsponge deformation; the wet/dry sponge interface and thewet sponge/liquid interface were generally planar and paral-lel to the water level in the tank throughout the course ofeach experiment. A typical configuration is shown in Fig. 11at a point in time after the imbibition/sponge deformationprocess had begun. The ruler on the right, which was tapedto the inside of the tank, shows centimeter markings. A stopwatch, not shown in this figure, was used to record the time.The duration of each experiment was approximately 35–40
013106-10 Siddique, Anderson, and Bondarev Phys. Fluids 21, 013106 �2009�
Downloaded 30 Oct 2009 to 129.174.55.245. Redistribution subject to AIP license or copyright; see http://pof.aip.org/pof/copyright.jsp
min; this was the approximate amount of time required forthe imbibed liquid to reach the upper clamped portion of thesponge. Photographs of the sponge, ruler, water level, andstopwatch were taken during the course of each experiment.Initially, the capillary rise and deformation occur rapidly andphotographs were taken at approximately 3 frames/s for thefirst several seconds. As the dynamics slowed, the intervalbetween photographs was increased up to a maximum ofabout 1 min for the last 15–20 min of the evolution. Thisprocess was repeated for several different sponges on severaldifferent days. Sponges were reused after they were allowedto dry completely.
Measurements were obtained from digitized photographsusing software IMAGEJ �freeware for image analysis availablefrom NIH� to record for each image positions of the wetsponge/dry sponge interface �z=hl�, the wet sponge/waterinterface �z=hs�, the water level �z=0�, and markings on theruler. The time for each image was also recorded. The soft-ware allowed us to record pixel values at a given locationand a corresponding scale factor for conversion of pixels tocentimeters was obtained by recording pixel values on theimage of the ruler. Three points were identified along eachinterface hs and hl and then averaged to obtain a single valueh �total distance between the averaged points for the upperand lower interface positions� representing the total thicknessof the wet sponge region for each image. Numerical valuesfor hs and hl were obtained from the averaged positions re-corded for each interface by computing their distance fromthe line representing the water level at z=0. An assumptionmade in the analysis was that there was negligible change inthe water level of the bath during the course of each experi-ment. Based on the quantity of water taken up by the spongeand on the tank dimensions we estimate that the change in
water level was less than 0.5 mm during the course of eachexperiment. If one also accounts for the volume of deformedsolid below the water line the estimated change in waterlevel would be even smaller. Care was taken to avoid anymotion of the tank or camera during each experiment. Pre-liminary experiments in which the sponge was lowered intothe water resulted in slight motion of the sponge during ini-tial stages of imbibition and have not been included in thedata presented here. However, in those cases, the value of hcould be measured robustly even when the values of hs andhl revealed where sponge motion occurred. That is, the mea-sured value of h is essentially independent of the recordedwater level, unlike hs and hl which are determined relative tothe recorded water level.
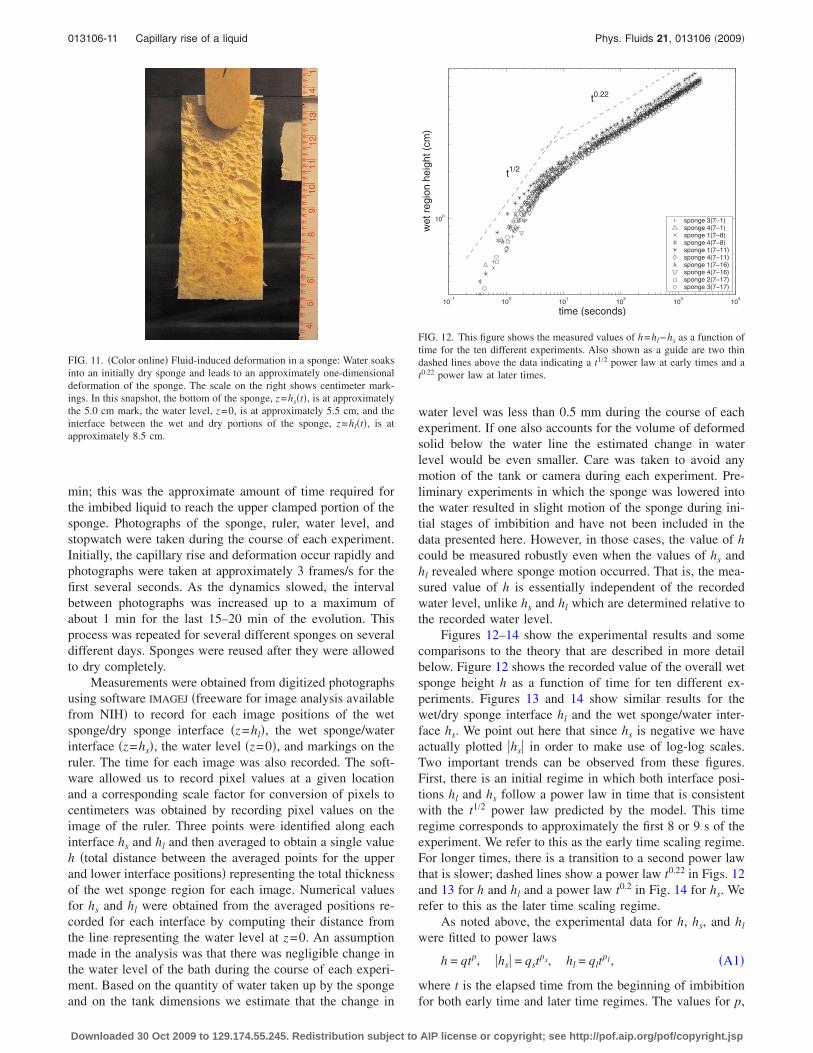
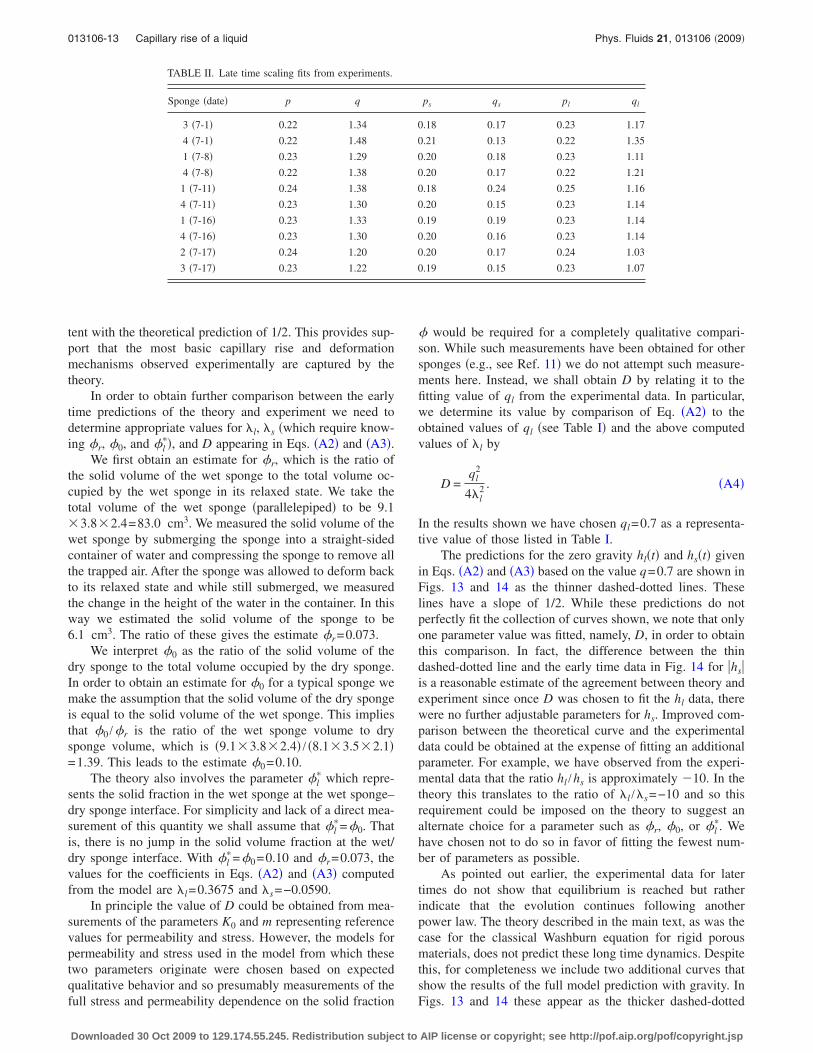
Figures 12–14 show the experimental results and somecomparisons to the theory that are described in more detailbelow. Figure 12 shows the recorded value of the overall wetsponge height h as a function of time for ten different ex-periments. Figures 13 and 14 show similar results for thewet/dry sponge interface hl and the wet sponge/water inter-face hs. We point out here that since hs is negative we haveactually plotted �hs� in order to make use of log-log scales.Two important trends can be observed from these figures.First, there is an initial regime in which both interface posi-tions hl and hs follow a power law in time that is consistentwith the t1/2 power law predicted by the model. This timeregime corresponds to approximately the first 8 or 9 s of theexperiment. We refer to this as the early time scaling regime.For longer times, there is a transition to a second power lawthat is slower; dashed lines show a power law t0.22 in Figs. 12and 13 for h and hl and a power law t0.2 in Fig. 14 for hs. Werefer to this as the later time scaling regime.
As noted above, the experimental data for h, hs, and hl
were fitted to power laws
h = qtp, �hs� = qstps, hl = qlt
pl, �A1�
where t is the elapsed time from the beginning of imbibitionfor both early time and later time regimes. The values for p,
FIG. 11. �Color online� Fluid-induced deformation in a sponge: Water soaksinto an initially dry sponge and leads to an approximately one-dimensionaldeformation of the sponge. The scale on the right shows centimeter mark-ings. In this snapshot, the bottom of the sponge, z=hs�t�, is at approximatelythe 5.0 cm mark, the water level, z=0, is at approximately 5.5 cm, and theinterface between the wet and dry portions of the sponge, z=hl�t�, is atapproximately 8.5 cm.
10−1
100
101
102
103
104
100
time (seconds)
wet
regi
onhe
ight
(cm
)
t1/2
t0.22
sponge 3(7−1)sponge 4(7−1)sponge 1(7−8)sponge 4(7−8)sponge 1(7−11)sponge 4(7−11)sponge 1(7−16)sponge 4(7−16)sponge 2(7−17)sponge 3(7−17)
FIG. 12. This figure shows the measured values of h=hl−hs as a function oftime for the ten different experiments. Also shown as a guide are two thindashed lines above the data indicating a t1/2 power law at early times and at0.22 power law at later times.
013106-11 Capillary rise of a liquid Phys. Fluids 21, 013106 �2009�
Downloaded 30 Oct 2009 to 129.174.55.245. Redistribution subject to AIP license or copyright; see http://pof.aip.org/pof/copyright.jsp
q, ps, qs, pl, and ql are listed for each experiment in Tables Iand II. For the early time regime we find exponents between0.47 and 0.56 for h, 0.47–0.59 for hs, and 0.47–0.57 for hl.For the later time regime we find exponents between 0.22and 0.24 for h, 0.18 and 0.21 for hs and 0.22 and 0.25 for hl.We note that these values are sensitive to the precise valueidentified as the starting time. Our experimental data for theearly times included photographs taken at a rate of 3 frames/swhich allowed us to visually identify the starting time towithin approximately 0.1–0.2 s. The scatter in the data isrepresentative of the sensitivity of the parameter fits to theuncertainty in the starting time. The power law for hl in thelate time regime is close to the t1/4 observed by Delker et al.3
and Lago and Araujo4 for capillary rise of water in glassbeads. The later time power law observed here for deforma-tion hs is also close to this value but appears to be slightlysmaller. That the late time power law exponent for h is muchcloser to hl than hs is consistent with the fact that hl isroughly ten times larger than �hs� and so a fit of h=hl−hs
would be dominated by the behavior of hl. As a check of ourdata processing we have confirmed that the value of h com-puted from the pixel data and the values of hl and hs com-puted from the pixel data are consistent in that hl−hs iswithin 10−14 of h �in cm�.
2. Comparison to theory
Our first and primary point of comparison between thetheory and the experiment is in the early time power lawscaling with respect to time. The theoretical prediction forthe capillary rise and sponge deformation can be expressedmost clearly in terms of the zero gravity similarity solutionfor the interface positions given by
hl�t� = 2l�Dt , �A2�
hs�t� = 2s�Dt . �A3�
The coefficients l and s are constants determined by pa-rameters �l
�, �0, and �r �e.g., see main text or Ref. 34 fordetails�. The values of hl and hs also depend on D=K0m /�,where K0 is a reference permeability, m is a stress scale, and� is the fluid viscosity. The experimentally measured powerlaw fits for the wet sponge/dry sponge interface hl and thewet sponge/liquid interface hs, shown in Table I, are consis-
10−1
100
101
102
103
104
10−1
100
101
time (seconds)
liqui
dhe
ight
(cm
)
t1/2
t0.22
sponge 3(7−1)sponge 4(7−1)sponge 1(7−8)sponge 4(7−8)sponge 1(7−11)sponge 4(7−11)sponge 1(7−16)sponge 4(7−16)sponge 2(7−17)sponge 3(7−17)
FIG. 13. This figure shows the measured values of hl as a function of timefor the ten different experiments. Also shown as a guide are two thin dashedlines above the data indicating a t1/2 power law at early times and a t0.22
power law at later times. Additionally, we have included dashed-dottedcurves that show predictions from the theory without gravity �thinnerdashed-dotted line� and with gravity �thicker dashed-dotted curve�.
10−1
100
101
102
103
104
10−2
10−1
100
101
time (seconds)
solid
dept
h(c
m)
t1/2
t0.20
sponge 3(7−1)sponge 4(7−1)sponge 1(7−8)sponge 4(7−8)sponge 1(7−11)sponge 4(7−11)sponge 1(7−16)sponge 4(7−16)sponge 2(7−17)sponge 3(7−17)
FIG. 14. This figure shows the measured values of �hs� as a function of timefor the ten different experiments. Also shown as a guide are two thin dashedlines above the data indicating a t1/2 power law at early times and a t0.20
power law at later times. Additionally, we have included dashed-dottedcurves that show predictions from the theory without gravity �thinnerdashed-dotted line� and with gravity �thicker dashed-dotted curve�.
TABLE I. Early time scaling fits from the experiments based on approximately the first 8–9 s of evolution.
Sponge �date� p q ps qs pl ql
3 �7-1� 0.55 0.68 0.59 0.071 0.55 0.61
4 �7-1� 0.51 0.84 0.55 0.072 0.50 0.77
1 �7-8� 0.56 0.67 0.55 0.073 0.57 0.60
4 �7-8� 0.50 0.80 0.56 0.074 0.49 0.73
1 �7-11� 0.49 0.94 0.50 0.11 0.49 0.83
4 �7-11� 0.50 0.74 0.56 0.065 0.50 0.68
1 �7-16� 0.47 0.86 0.47 0.10 0.47 0.76
4 �7-16� 0.52 0.68 0.57 0.064 0.52 0.62
2 �7-17� 0.51 0.70 0.52 0.075 0.51 0.63
3 �7-17� 0.52 0.70 0.59 0.066 0.51 0.63
013106-12 Siddique, Anderson, and Bondarev Phys. Fluids 21, 013106 �2009�
Downloaded 30 Oct 2009 to 129.174.55.245. Redistribution subject to AIP license or copyright; see http://pof.aip.org/pof/copyright.jsp
tent with the theoretical prediction of 1/2. This provides sup-port that the most basic capillary rise and deformationmechanisms observed experimentally are captured by thetheory.
In order to obtain further comparison between the earlytime predictions of the theory and experiment we need todetermine appropriate values for l, s �which require know-ing �r, �0, and �l
��, and D appearing in Eqs. �A2� and �A3�.We first obtain an estimate for �r, which is the ratio of
the solid volume of the wet sponge to the total volume oc-cupied by the wet sponge in its relaxed state. We take thetotal volume of the wet sponge �parallelepiped� to be 9.1�3.8�2.4=83.0 cm3. We measured the solid volume of thewet sponge by submerging the sponge into a straight-sidedcontainer of water and compressing the sponge to remove allthe trapped air. After the sponge was allowed to deform backto its relaxed state and while still submerged, we measuredthe change in the height of the water in the container. In thisway we estimated the solid volume of the sponge to be6.1 cm3. The ratio of these gives the estimate �r=0.073.
We interpret �0 as the ratio of the solid volume of thedry sponge to the total volume occupied by the dry sponge.In order to obtain an estimate for �0 for a typical sponge wemake the assumption that the solid volume of the dry spongeis equal to the solid volume of the wet sponge. This impliesthat �0 /�r is the ratio of the wet sponge volume to drysponge volume, which is �9.1�3.8�2.4� / �8.1�3.5�2.1�=1.39. This leads to the estimate �0=0.10.
The theory also involves the parameter �l� which repre-
sents the solid fraction in the wet sponge at the wet sponge–dry sponge interface. For simplicity and lack of a direct mea-surement of this quantity we shall assume that �l
�=�0. Thatis, there is no jump in the solid volume fraction at the wet/dry sponge interface. With �l
�=�0=0.10 and �r=0.073, thevalues for the coefficients in Eqs. �A2� and �A3� computedfrom the model are l=0.3675 and s=−0.0590.
In principle the value of D could be obtained from mea-surements of the parameters K0 and m representing referencevalues for permeability and stress. However, the models forpermeability and stress used in the model from which thesetwo parameters originate were chosen based on expectedqualitative behavior and so presumably measurements of thefull stress and permeability dependence on the solid fraction
� would be required for a completely qualitative compari-son. While such measurements have been obtained for othersponges �e.g., see Ref. 11� we do not attempt such measure-ments here. Instead, we shall obtain D by relating it to thefitting value of ql from the experimental data. In particular,we determine its value by comparison of Eq. �A2� to theobtained values of ql �see Table I� and the above computedvalues of l by
D =ql
2
4l2 . �A4�
In the results shown we have chosen ql=0.7 as a representa-tive value of those listed in Table I.
The predictions for the zero gravity hl�t� and hs�t� givenin Eqs. �A2� and �A3� based on the value q=0.7 are shown inFigs. 13 and 14 as the thinner dashed-dotted lines. Theselines have a slope of 1/2. While these predictions do notperfectly fit the collection of curves shown, we note that onlyone parameter value was fitted, namely, D, in order to obtainthis comparison. In fact, the difference between the thindashed-dotted line and the early time data in Fig. 14 for �hs�is a reasonable estimate of the agreement between theory andexperiment since once D was chosen to fit the hl data, therewere no further adjustable parameters for hs. Improved com-parison between the theoretical curve and the experimentaldata could be obtained at the expense of fitting an additionalparameter. For example, we have observed from the experi-mental data that the ratio hl /hs is approximately �10. In thetheory this translates to the ratio of l /s=−10 and so thisrequirement could be imposed on the theory to suggest analternate choice for a parameter such as �r, �0, or �l
�. Wehave chosen not to do so in favor of fitting the fewest num-ber of parameters as possible.
As pointed out earlier, the experimental data for latertimes do not show that equilibrium is reached but ratherindicate that the evolution continues following anotherpower law. The theory described in the main text, as was thecase for the classical Washburn equation for rigid porousmaterials, does not predict these long time dynamics. Despitethis, for completeness we include two additional curves thatshow the results of the full model prediction with gravity. InFigs. 13 and 14 these appear as the thicker dashed-dotted
TABLE II. Late time scaling fits from experiments.
Sponge �date� p q ps qs pl ql
3 �7-1� 0.22 1.34 0.18 0.17 0.23 1.17
4 �7-1� 0.22 1.48 0.21 0.13 0.22 1.35
1 �7-8� 0.23 1.29 0.20 0.18 0.23 1.11
4 �7-8� 0.22 1.38 0.20 0.17 0.22 1.21
1 �7-11� 0.24 1.38 0.18 0.24 0.25 1.16
4 �7-11� 0.23 1.30 0.20 0.15 0.23 1.14
1 �7-16� 0.23 1.33 0.19 0.19 0.23 1.14
4 �7-16� 0.23 1.30 0.20 0.16 0.23 1.14
2 �7-17� 0.24 1.20 0.20 0.17 0.24 1.03
3 �7-17� 0.23 1.22 0.19 0.15 0.23 1.07
013106-13 Capillary rise of a liquid Phys. Fluids 21, 013106 �2009�
Downloaded 30 Oct 2009 to 129.174.55.245. Redistribution subject to AIP license or copyright; see http://pof.aip.org/pof/copyright.jsp
curves. In order to plot the full results with gravity, the val-ues of two additional parameters are required. The first is thelength scale L=m / ��lg� and the second is the density ratioparameter �=�s /�l−1. Since the length scale L depends onthe parameter m �recall D depended on both K0 and m� weagain take the approach of not attempting to measure thisparameter directly. Rather, we have selected a value of L sothat the predicted equilibrium height for hl falls near its rep-resentative early time/later time transition region in the ex-perimental data. In the experiments of Lago and Araujo4 theWashburn equilibrium height occurred at a similar locationwith respect to the experimental data. We have used L=70 cm which, with �l=103 kg m−3 and g�10 m s−2 im-plies that m=7�103 Pa. Lastly, while we have not mea-sured � directly, we have observed experimentally that thesponge is more dense than the water so that ��0. However,the theoretical predictions with different values of � revealno significant change in the positions of the thick dashed-dotted curves in Figs. 13 and 14 and so the calculations wehave shown have used �=0 for simplicity. The resulting the-oretical values for �hs� overpredicts the experimental data.However, again we emphasize that only one additional pa-rameter, L, was fitted and so no parameters were adjustedspecifically for the hs comparison.
Some differences between the theory and experimentseven for the early time regime may be attributable to com-plexities in the experiments that are not accounted for in themodel. For example, it is worth pointing out that the quantityof fluid taken up by the sponge is actually much less than theavailable pore space in the sponge. One estimate for the liq-uid fraction in the wet sponge based on solid fraction alonewould be 1−�r�0.93. However, based on more direct mea-surements this appears to be too high. Our directly measuredestimate for the volume of liquid taken up by the spongeafter an experiment is 17.5 1 cm3 which corresponds to aliquid fraction of around 0.2. This total amount of liquid,estimated for different experiments by measuring the volumeof water that could be squeezed out of the sponge immedi-ately after the experiment was over, includes the liquid oc-cupying the region of the wet sponge below the water levelas well as above it. Based on this and the observation that aconsiderable amount of the pore space in the wet sponge wasoccupied by air, it seems safe to assume that the actual liquidfraction in the wet sponge is considerably less than the avail-able pore space. The presence of a third, vapor, phase wasnot accounted for in the theory and may be important forimproved agreement.
Just as our experiments are not fully explained by thetheoretical model in the main text, we note that the experi-mental work of Delker et al.3 and Lago and Araujo4 was notcompletely explained by the classical Washburn model. Inthe latter case, this discrepancy has recently motivated Lock-ington and Parlange42 to develop a new model that general-ized the Washburn model. Their new model predicts that, asin the experimental data, the capillary-driven liquid in theporous material continues to rise following dynamics char-acterized by a parameter related to the presence of saturationgradients in the system. While the incorporation of the recentideas of Lockington and Parlange have not been considered
in the present model for fluid flow and deformation, the de-velopment of more sophisticated models along these lines isan exciting avenue for future research.
3. Conclusions
In conclusion, we have presented experimental data thatshow capillary rise in a deformable porous sponge. Earlytime data were observed to follow approximately a t1/2 powerlaw and was found to be generally consistent with the theo-retical predictions. The experimental data also revealed along time regime, not predicted theoretically, in which boththe fluid height and sponge deformation followed a powerlaw that was clearly slower than the early time t1/2 scaling;estimates suggest t0.22 for the liquid height and t0.2 for thesolid deformation. These are comparable to the approximatet1/4 power law for an analogous long time regime observedfor rigid porous materials.3,4
1E. W. Washburn, “The dynamics of capillary flow,” Phys. Rev. 17, 273�1921�.
2B. V. Zhmud, F. Tiberg, and K. Hallstensson, “Dynamic of capillary rise,”J. Colloid Interface Sci. 228, 263 �2000�.
3T. Delker, D. B. Pengra, and P. Wong, “Interface pinning and the dynamicsof capillary rise in porous media,” Phys. Rev. Lett. 76, 2902 �1996�.
4M. Lago and M. Araujo, “Capillary rise in porous media,” J. ColloidInterface Sci. 234, 35 �2001�; “Capillary rise in porous media,” Physica A289 1 �2001�.
5S. H. Davis and L. M. Hocking, “Spreading and imbibition of viscousliquid on a porous base,” Phys. Fluids 11, 48 �1999�.
6S. H. Davis and L. M. Hocking, “Spreading and imbibition of viscousliquid on a porous base. II,” Phys. Fluids 12, 1646 �2000�.
7M. Spiegelman, “Flow in deformable porous media. Part 1. Simple analy-sis,” J. Fluid Mech. 247, 17 �1993�.
8M. Kaczmarek and T. Hueckel, “Chemico-mechanical consolidation ofclays: Analytical solutions for a linearized one-dimensional problem,”Transp. Porous Media 32, 49 �1998�.
9M. Kaczmarek, “Chemically induced deformation of a porous layercoupled with advective-dispersive transport. Analytical solutions,” Int. J.Numer. Analyt. Meth. Geomech. 25, 757 �2001�.
10G. P. Peters and D. W. Smith, “Solute transport through a deformingporous medium,” Int. J. Numer. Analyt. Meth. Geomech. 26, 683 �2002�.
11J. L. Sommer and A. Mortensen, “Forced unidirectional infiltration ofdeformable porous media,” J. Fluid Mech. 311, 193 �1996�.
12L. Preziosi, D. D. Joseph, and G. S. Beavers, “Infiltration of initially dry,deformable porous media,” Int. J. Multiphase Flow 22, 1205 �1996�.
13V. J. Michaud, J. L. Sommer, and A. Mortensen, “Infiltration of fibrousperforms by a pure metal: Part V. Influence of preform compressibility,”Metall. Mater. Trans. A 30, 471 �1999�.
14D. Ambrosi and L. Preziosi, “Modeling injection modeling processes withdeformable porous preforms,” SIAM J. Appl. Math. 61, 22 �2000�.
15L. Billi and A. Farina, “Unidirectional infiltration in deformable porousmedia: Mathematical modeling and self-similar solution,” Q. Appl. Math.58, 85 �2000�.
16J. Feng and S. Weinbaum, “Lubrication theory in highly compressibleporous media: The mechanics of skiing, from red cells to humans,” J.Fluid Mech. 422, 281 �2000�.
17K. S. A. Chen and L. E. Scriven, “Liquid penetration into a deformableporous substrate,” Tappi J. 73, 151 �1990�.
18A. D. Fitt, P. D. Howell, J. R. King, C. P. Please, and D. W. Schwende-man, “Multiphase flow in a roll press nip,” Eur. J. Appl. Math. 13, 225�2002�.
19M. H. Holmes, “A nonlinear diffusion equation arising in the study of softtissue,” Q. Appl. Math. 41, 209 �1983�.
20M. H. Holmes, “Comparison theorems and similarity solution approxima-tions for a nonlinear diffusion equation arising in the study of soft tissue,”SIAM J. Appl. Math. 44, 545 �1984�.
013106-14 Siddique, Anderson, and Bondarev Phys. Fluids 21, 013106 �2009�
Downloaded 30 Oct 2009 to 129.174.55.245. Redistribution subject to AIP license or copyright; see http://pof.aip.org/pof/copyright.jsp
21M. H. Holmes, “A theoretical analysis for determining the nonlinear hy-draulic permeability of a soft tissue from a permeation experiment,” Bull.Math. Biol. 47, 669 �1985�.
22M. H. Holmes, “Finite deformation of soft tissue: Analysis of a mixturemodel in uniaxial compression,” J. Biomech. Eng. 108, 372 �1986�.
23M. H. Holmes and V. C. Mow, “The nonlinear characteristic of soft gelsand hydrated connective tissue in ultrafiltration,” J. Biomech. 23, 1145�1990�.
24J. S. Hou, M. H. Holmes, W. M. Lai, and V. C. Mow, “Boundary condi-tions at the cartilage-synovial fluid interface for joint lubrication and the-oretical verifications,” J. Biomech. Eng. 111, 78 �1989�.
25S. I. Barry and G. K. Aldis, “Radial flow through deformable porousshells,” J. Aust. Math. Soc. Ser. B, Appl. Math. 34, 333 �1993�.
26S. I. Barry and G. K. Aldis, “Flow induced deformation from pressurizedcavities in absorbing porous tissues,” Bull. Math. Biol. 54, 977 �1992�.
27S. I. Barry, K. H. Parker, and G. K. Aldis, “Fluid flow over a thin deform-able porous layer,” J. Appl. Math. Phys. �ZAMP� 42, 633 �1991�.
28M. A. Biot, “General theory of three dimensional consolidation,” J. Appl.Phys. 12, 155 �1941�.
29M. A. Biot, “Consolidation settlement under a rectangular load distribu-tion,” J. Appl. Phys. 12, 426 �1941�.
30M. A. Biot and F. M. Clingan, “Consolidation settlement of a soil with animpervious top surface,” J. Appl. Phys. 12, 578 �1941�.
31M. R. Bowen, “Incompressible porous media models by use of the theoryof mixtures,” Int. J. Eng. Sci. 18, 1129 �1980�.
32R. J. Atkin and R. E. Crain, “Continuum theories of mixture: Basic theoryand historical development,” Q. J. Mech. Appl. Math. 29, 209�1976�.
33W. Wang and K. H. Parker, “The effect of deformable porous surfacelayers on the motion of a sphere in a narrow cylindrical tube,” J. FluidMech. 283, 287 �1995�.
34D. M. Anderson, “Imbibition of a liquid droplet on a deformable poroussubstrate,” Phys. Fluids 17, 087104 �2005�.
35S. Manley, J. M. Skotheim, L. Mahadevan, and D. A. Weitz, “Gravita-tional collapse of colloidal gels,” Phys. Rev. Lett. 94, 218302 �2005�.
36C. Kim, Y. Liu, A. Kühnle, S. Hess, S. Viereck, T. Danner, L. Mahadevan,and D. A. Weitz, “Gravitational stability of suspensions of attractive col-loidal particles,” Phys. Rev. Lett. 99, 028303 �2007�.
37E. R. Dufresne, E. I. Corwin, N. A. Greenblatt, J. Ashmore, D. Y. Wang,A. D. Dinsmore, J. X. Cheng, X. S. Xie, J. W. Hutchinson, and D. A.Weitz, “Flow and fracture in drying nanoparticle suspensions,” Phys. Rev.Lett. 91, 224501 �2003�.
38E. R. Dufresne, D. J. Stark, N. A. Greenblatt, J. X. Cheng, J. W. Hutch-inson, L. Mahadevan, and D. A. Weitz, “Dynamics of fracture in dryingsuspensions,” Langmuir 22, 7144 �2006�.
39G. S. Beavers, K. Wittenberg, and E. M. Sparrow, “Fluid flow through aclass of highly-deformable porous media. Part II. Experiments with wa-ter,” J. Fluids Eng. 103, 440 �1981�.
40K. H. Parker, R. V. Mehta, and C. G. Caro, “Steady flow in porous,elastically deformable materials,” J. Appl. Mech. 54, 794 �1987�.
41Y. Lanir, S. Sauob, and P. Maretsky, “Nonlinear finite deformation re-sponse of open cell polyurethane sponge to fluid filtration,” J. Appl. Mech.57, 449 �1990�.
42D. A. Lockington and J.-Y. Parlange, “A new equation for macroscopicdescription of capillary rise in porous media,” J. Colloid Interface Sci.278, 404 �2004�.
013106-15 Capillary rise of a liquid Phys. Fluids 21, 013106 �2009�
Downloaded 30 Oct 2009 to 129.174.55.245. Redistribution subject to AIP license or copyright; see http://pof.aip.org/pof/copyright.jsp


![Vega: Nonlinear FEM Deformable Object Simulatorrun.usc.edu/vega/SinSchroederBarbic2012.pdf · Vega: Nonlinear FEM Deformable Object Simulator ... (CalculiX [DW]) deformable ... J](https://img.pdfslide.net/doc/110x75/5aecb8f27f8b9a3b2e8f8865/vega-nonlinear-fem-deformable-object-nonlinear-fem-deformable-object-simulator.jpg)