Embed Size (px)
Citation preview

Business Finance : course n°7Business Finance : course n°7Capital Budgeting Decision & Cash flow forecast I
Major investment appraisal methods
BA 2nd Year - 01/11/2019
155Alexis NASS, CFA - 2019/2020
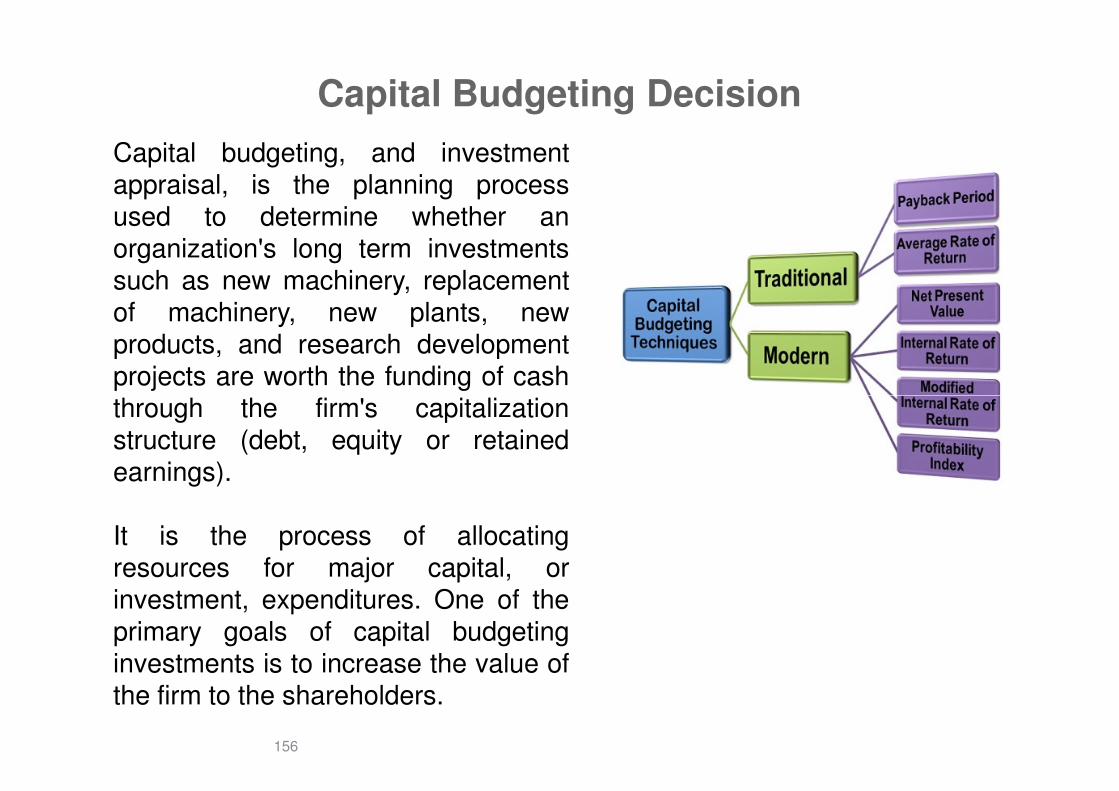
Capital Budgeting Decision
Capital budgeting, and investmentappraisal, is the planning processused to determine whether anorganization's long term investmentssuch as new machinery, replacementof machinery, new plants, newproducts, and research developmentprojects are worth the funding of cashthrough the firm's capitalization
156
through the firm's capitalizationstructure (debt, equity or retainedearnings).
It is the process of allocatingresources for major capital, orinvestment, expenditures. One of theprimary goals of capital budgetinginvestments is to increase the value ofthe firm to the shareholders.
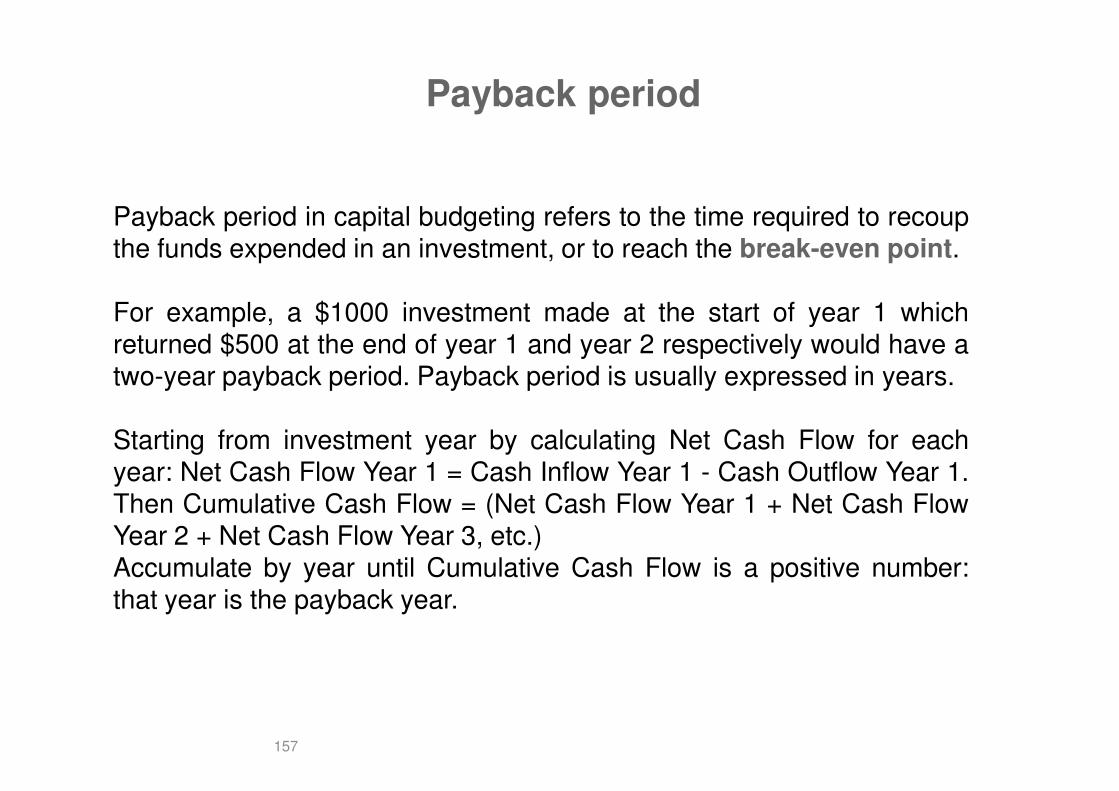
Payback period
Payback period in capital budgeting refers to the time required to recoupthe funds expended in an investment, or to reach the break-even point.
For example, a $1000 investment made at the start of year 1 whichreturned $500 at the end of year 1 and year 2 respectively would have atwo-year payback period. Payback period is usually expressed in years.
157
Starting from investment year by calculating Net Cash Flow for eachyear: Net Cash Flow Year 1 = Cash Inflow Year 1 - Cash Outflow Year 1.Then Cumulative Cash Flow = (Net Cash Flow Year 1 + Net Cash FlowYear 2 + Net Cash Flow Year 3, etc.)Accumulate by year until Cumulative Cash Flow is a positive number:that year is the payback year.
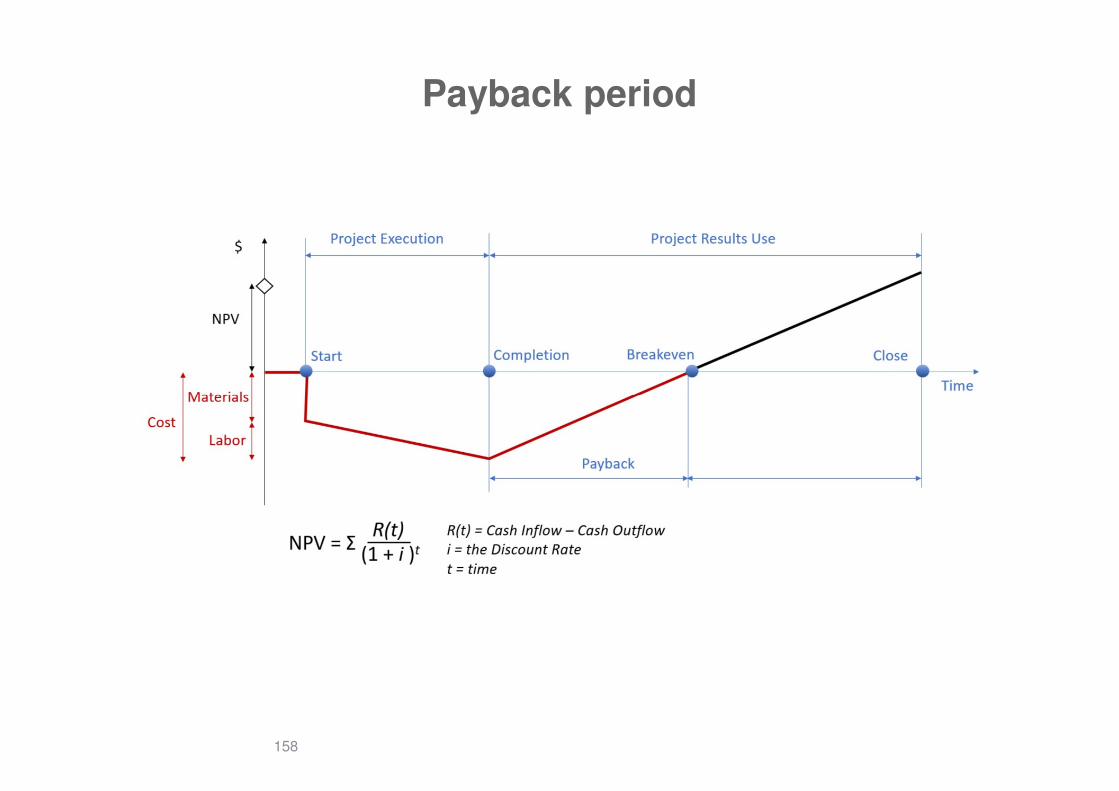
Payback period
158
Payback period
The time value of money is not taken into account.
Payback period intuitively measures how long something takes to "payfor itself." All else being equal, shorter payback periods are preferable tolonger payback periods. Payback period is popular due to its ease of usedespite the recognized limitations described below. See Cut off period.
159
The term is also widely used in other types of investment areas, oftenwith respect to energy efficiency technologies, maintenance, upgrades,or other changes. For example, a compact fluorescent light bulb may bedescribed as having a payback period of a certain number of years oroperating hours, assuming certain costs. Here, the return to theinvestment consists of reduced operating costs.
Payback period
Although primarily a financial term, the concept of a payback period isoccasionally extended to other uses, such as energy payback period(the period of time over which the energy savings of a project equal theamount of energy expended since project inception); these other termsmay not be standardized or widely used.
Other use : for stock investment : the Price / Earning ratio
160
Other use : for stock investment : the Price / Earning ratio
Payback period
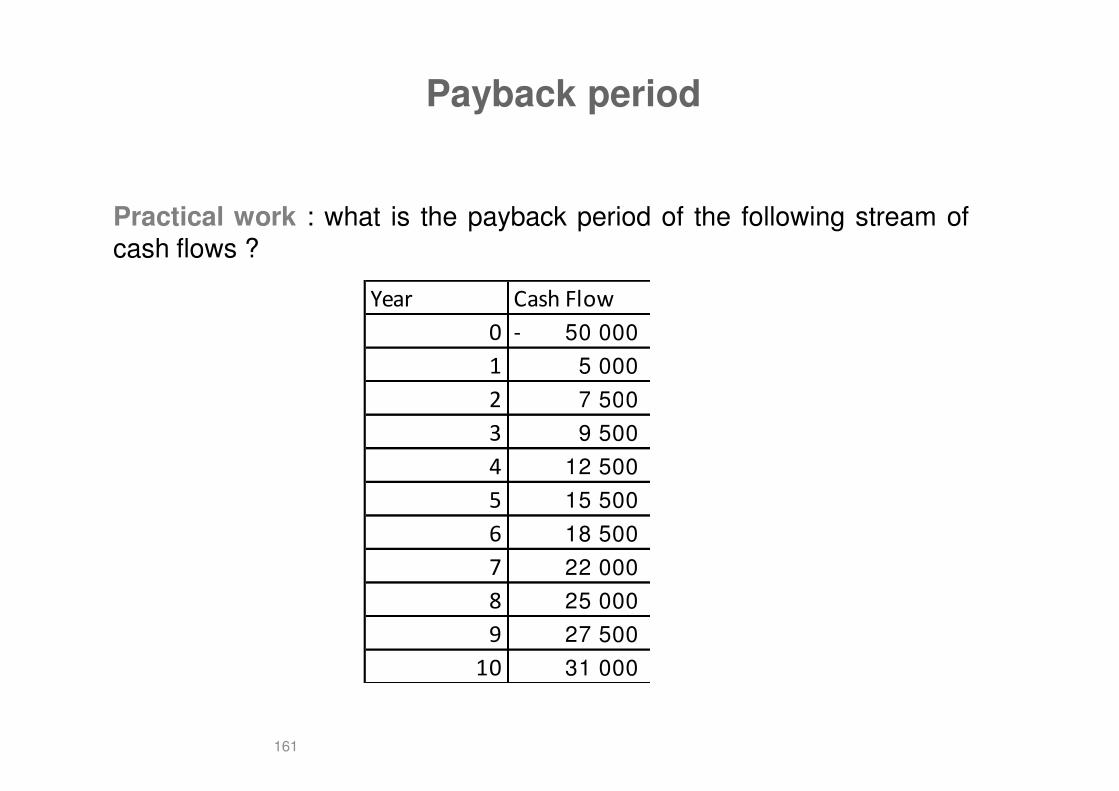
Practical work : what is the payback period of the following stream ofcash flows ?
Year Cash Flow
0 50 000-
1 5 000
2 7 500
161
2 7 500
3 9 500
4 12 500
5 15 500
6 18 500
7 22 000
8 25 000
9 27 500
10 31 000
Payback period
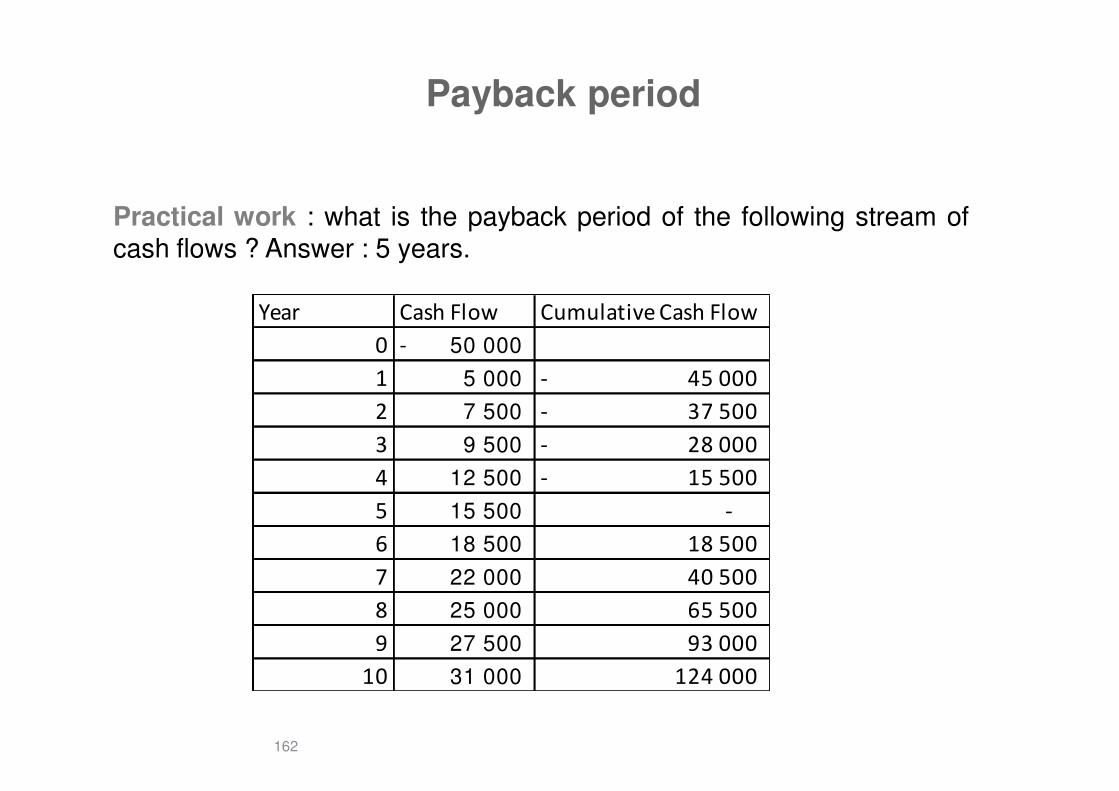
Practical work : what is the payback period of the following stream ofcash flows ? Answer : 5 years.
Year Cash Flow Cumulative Cash Flow
0 50 000-
1 5 000 45 000-
162
2 7 500 37 500-
3 9 500 28 000-
4 12 500 15 500-
5 15 500 -
6 18 500 18 500
7 22 000 40 500
8 25 000 65 500
9 27 500 93 000
10 31 000 124 000
Payback period
The Price / Earning Ratio (PER) is a concept that is
1) Very close to the Payback period concept
1) Widly used for stock comparison
You just divide the current price of a stock by the current earning per
163
You just divide the current price of a stock by the current earning pershare.
Will you prefere high PER or low PER ?
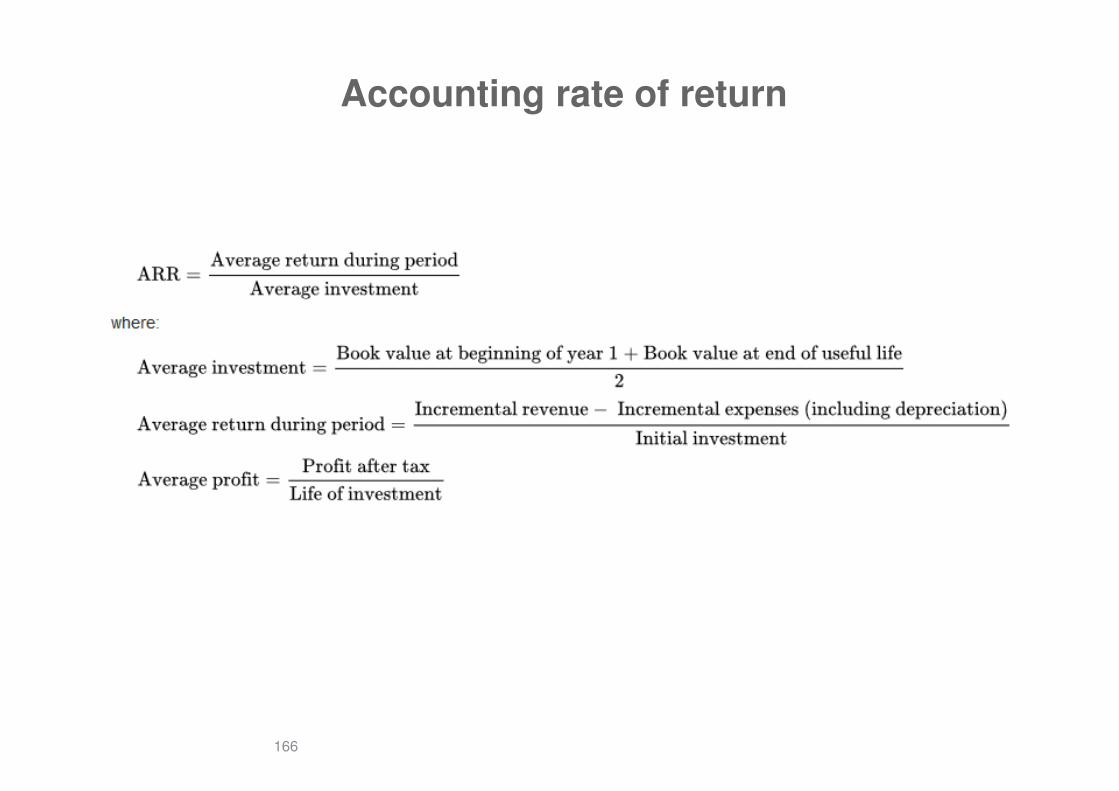
Accounting rate of return
Accounting rate of return, also known as the Average rate of return, orARR is a financial ratio used in capital budgeting. The ratio does not takeinto account the concept of time value of money.ARR calculates the return, generated from net income of the proposedcapital investment. The ARR is a percentage return. Say, if ARR = 7%,then it means that the project is expected to earn seven cents out ofeach dollar invested (yearly).
164
each dollar invested (yearly).If the ARR is equal to or greater than the required rate of return, theproject is acceptable. If it is less than the desired rate, it should berejected. When comparing investments, the higher the ARR, the moreattractive the investment. More than half of large firms calculate ARRwhen appraising projects.
Accounting rate of return
The key advantage of ARR is that it is easy to compute and understand.
The main disadvantage of ARR is that it disregards the time factor interms of time value of money or risks for long term investments.
The ARR is built on evaluation of profits and it can be easily manipulatedwith changes in depreciation methods.
165
with changes in depreciation methods.
The ARR can give misleading information when evaluating investmentsof different size.
Accounting rate of return
166
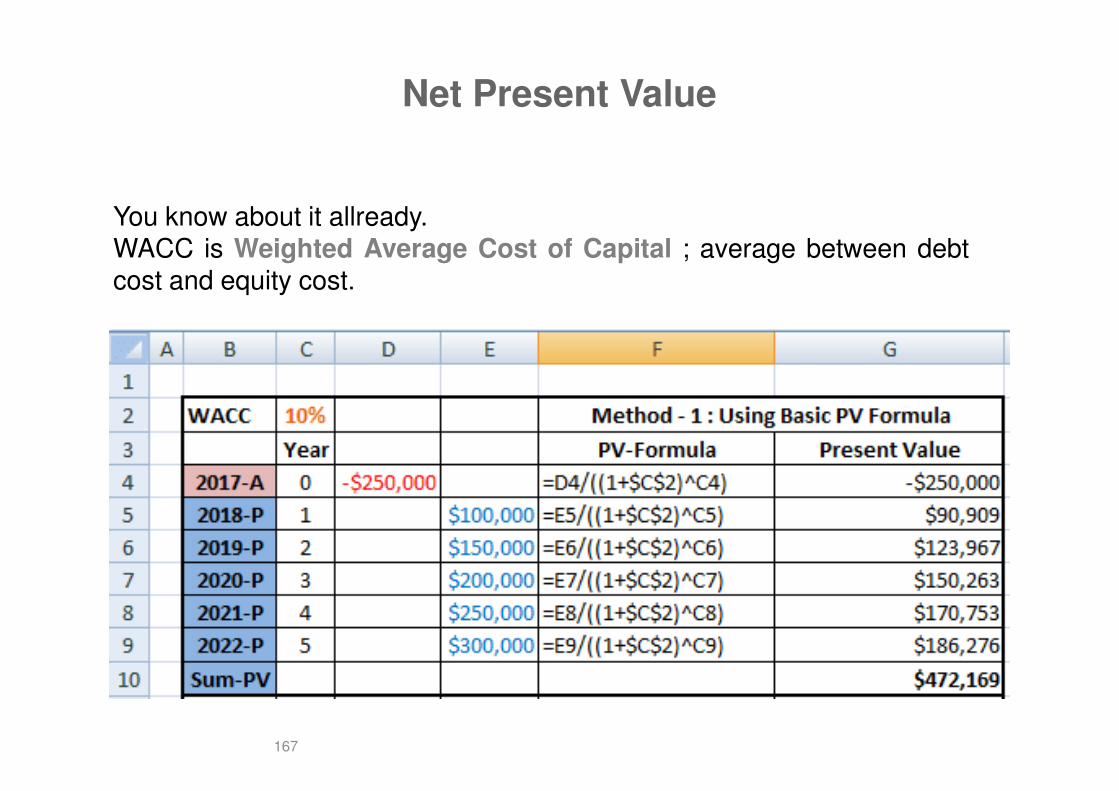
Net Present Value
You know about it allready.WACC is Weighted Average Cost of Capital ; average between debtcost and equity cost.
167
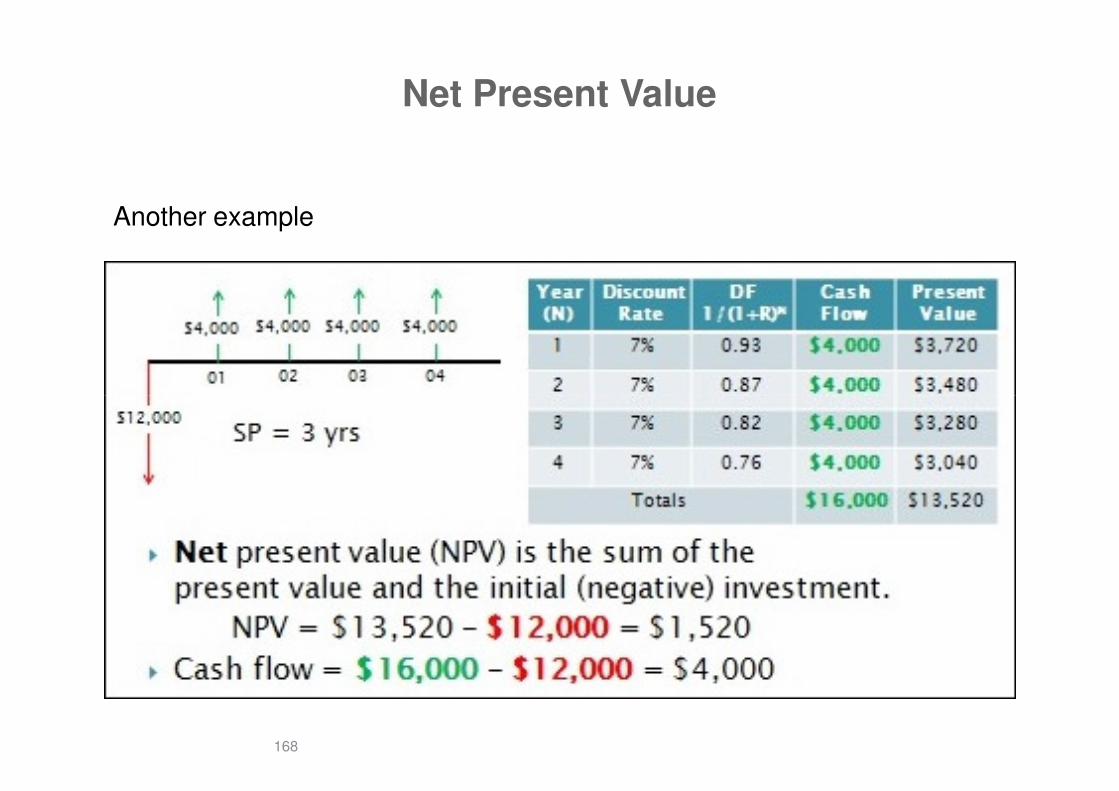
Net Present Value
Another example
168
Internal Rate of Return
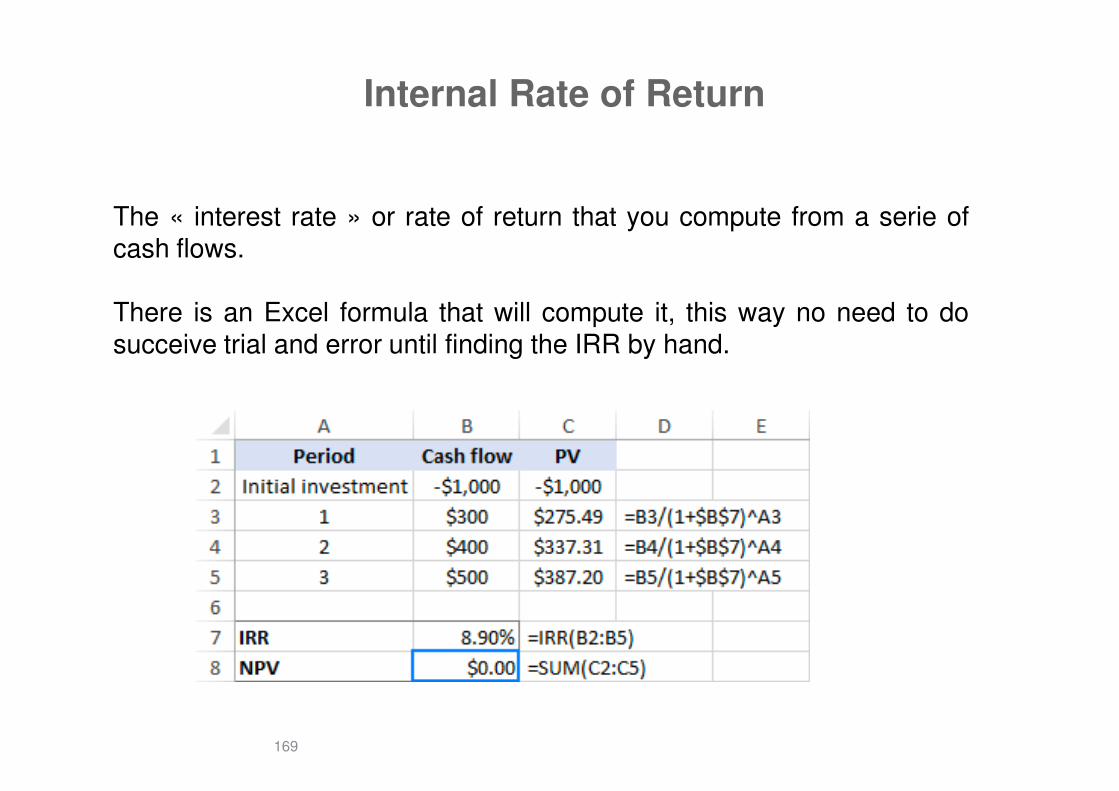
The « interest rate » or rate of return that you compute from a serie ofcash flows.
There is an Excel formula that will compute it, this way no need to dosucceive trial and error until finding the IRR by hand.
169
Internal Rate of Return
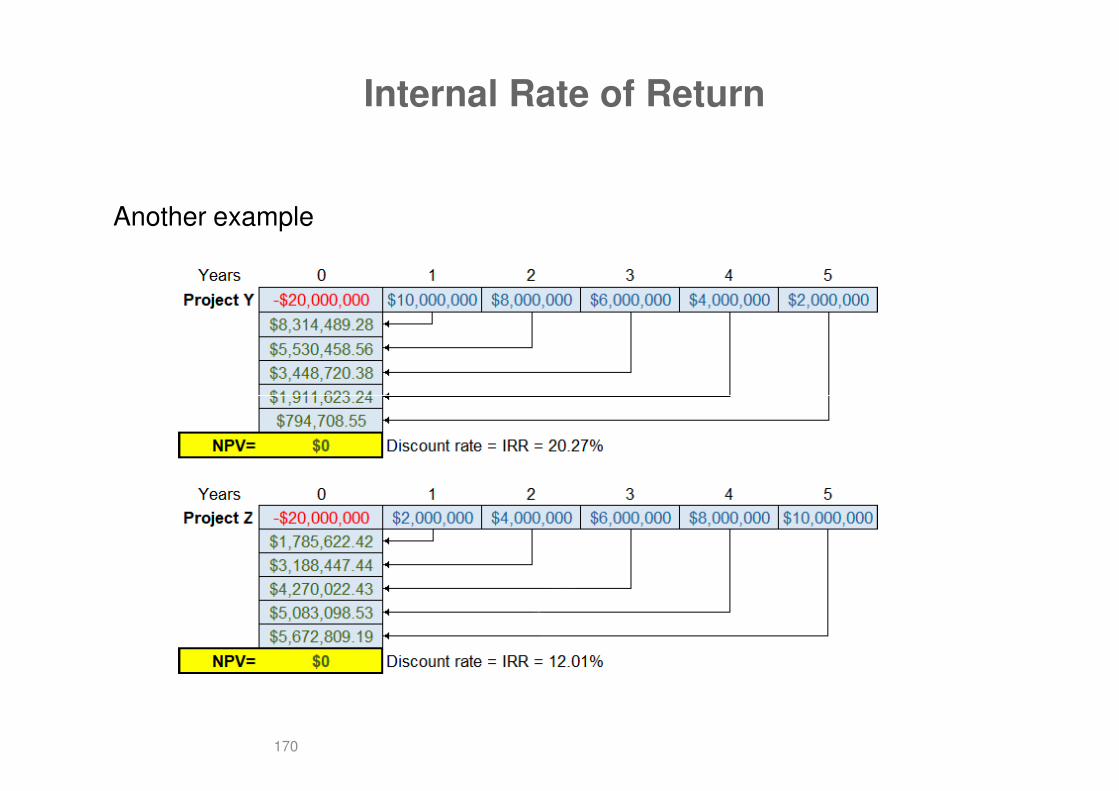
Another example
170
Modified Internal Rate of Return
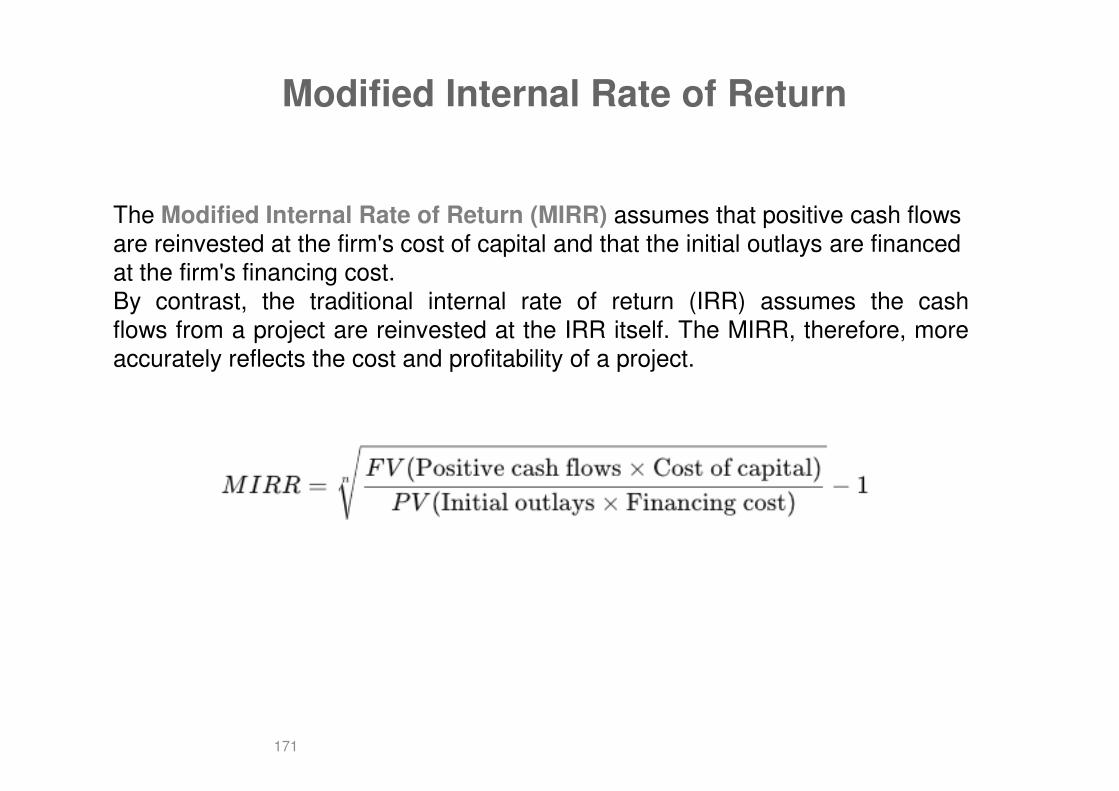
The Modified Internal Rate of Return (MIRR) assumes that positive cash flows are reinvested at the firm's cost of capital and that the initial outlays are financed at the firm's financing cost.By contrast, the traditional internal rate of return (IRR) assumes the cashflows from a project are reinvested at the IRR itself. The MIRR, therefore, moreaccurately reflects the cost and profitability of a project.
171
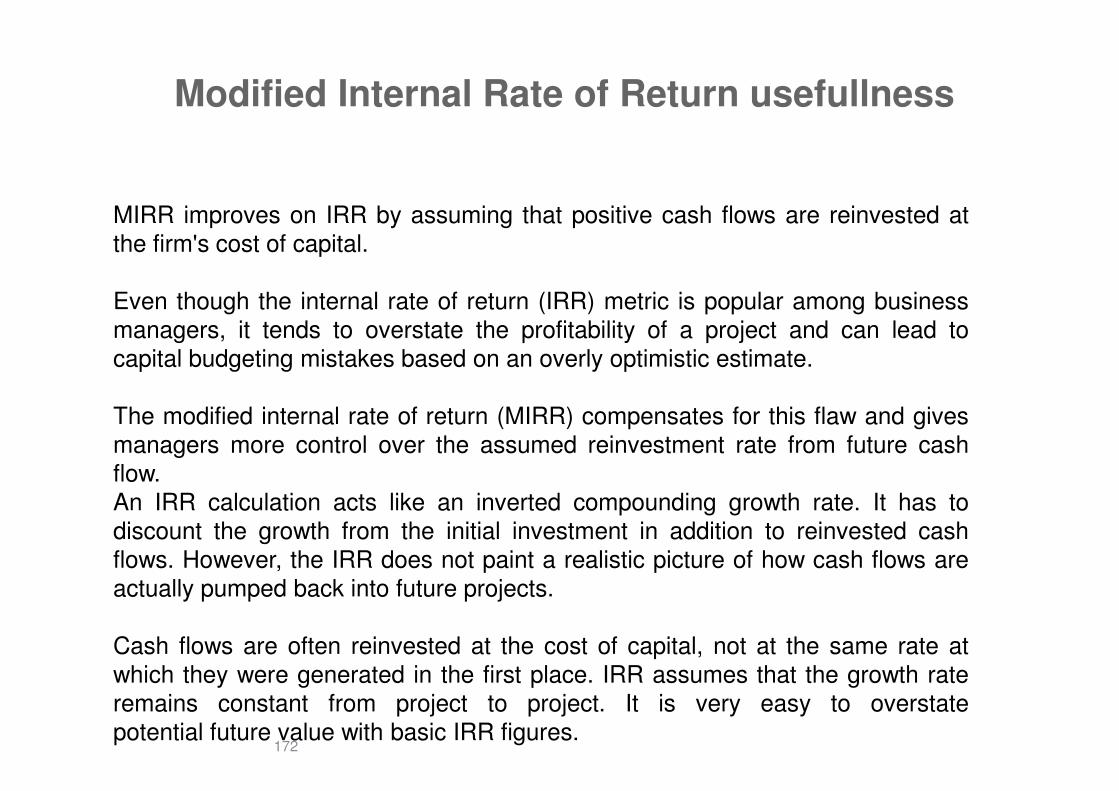
Modified Internal Rate of Return usefullness
MIRR improves on IRR by assuming that positive cash flows are reinvested atthe firm's cost of capital.
Even though the internal rate of return (IRR) metric is popular among businessmanagers, it tends to overstate the profitability of a project and can lead tocapital budgeting mistakes based on an overly optimistic estimate.
172
The modified internal rate of return (MIRR) compensates for this flaw and givesmanagers more control over the assumed reinvestment rate from future cashflow.An IRR calculation acts like an inverted compounding growth rate. It has todiscount the growth from the initial investment in addition to reinvested cashflows. However, the IRR does not paint a realistic picture of how cash flows areactually pumped back into future projects.
Cash flows are often reinvested at the cost of capital, not at the same rate atwhich they were generated in the first place. IRR assumes that the growth rateremains constant from project to project. It is very easy to overstatepotential future value with basic IRR figures.
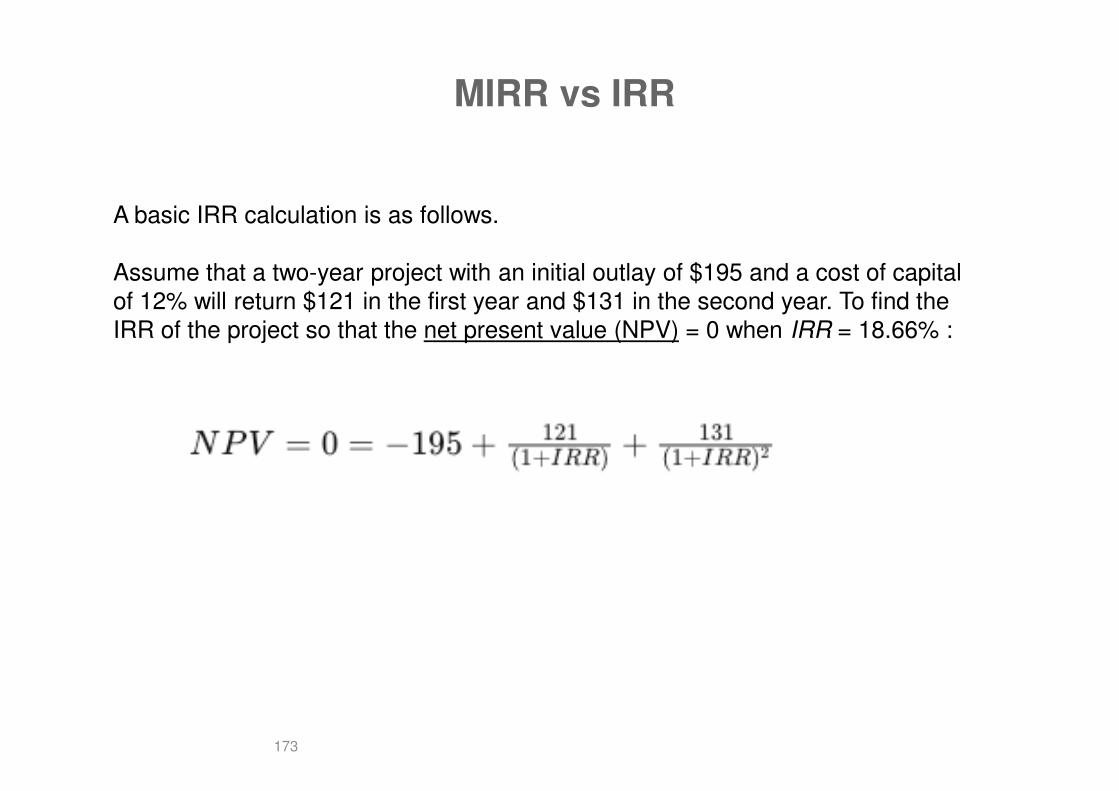
MIRR vs IRR
A basic IRR calculation is as follows.
Assume that a two-year project with an initial outlay of $195 and a cost of capital of 12% will return $121 in the first year and $131 in the second year. To find the IRR of the project so that the net present value (NPV) = 0 when IRR = 18.66% :
173
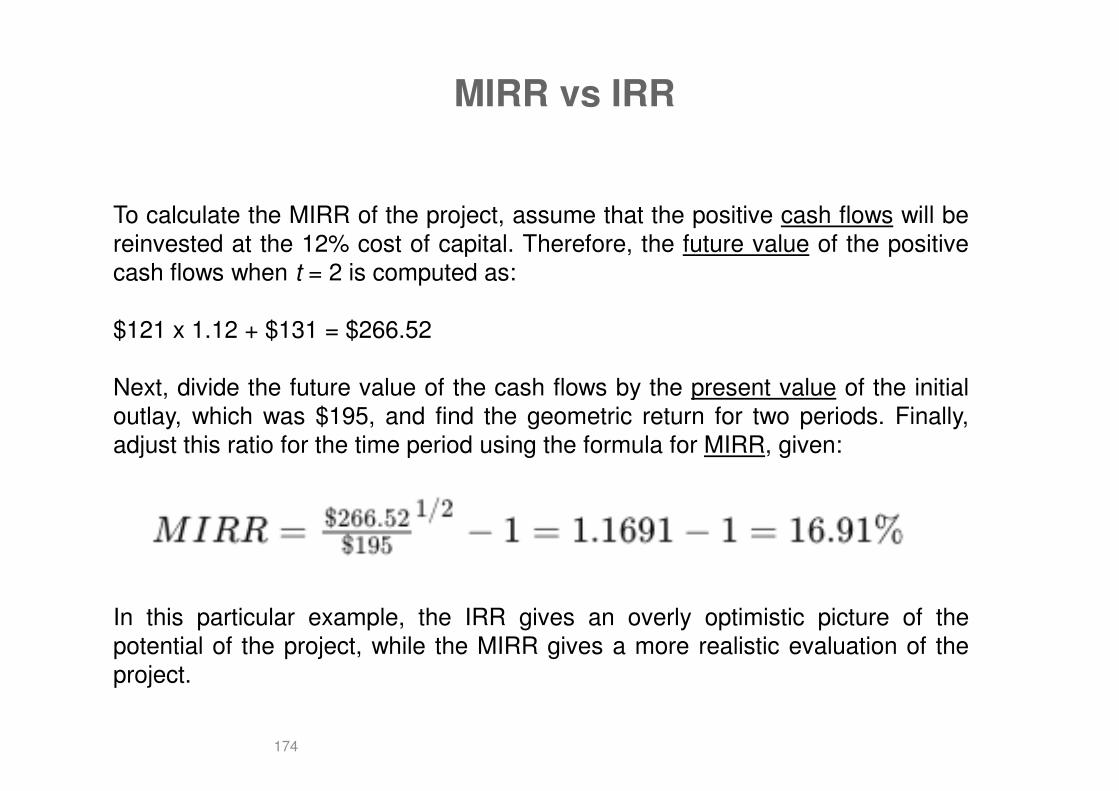
MIRR vs IRR
To calculate the MIRR of the project, assume that the positive cash flows will bereinvested at the 12% cost of capital. Therefore, the future value of the positivecash flows when t = 2 is computed as:
$121 x 1.12 + $131 = $266.52
Next, divide the future value of the cash flows by the present value of the initial
174
Next, divide the future value of the cash flows by the present value of the initialoutlay, which was $195, and find the geometric return for two periods. Finally,adjust this ratio for the time period using the formula for MIRR, given:
In this particular example, the IRR gives an overly optimistic picture of thepotential of the project, while the MIRR gives a more realistic evaluation of theproject.
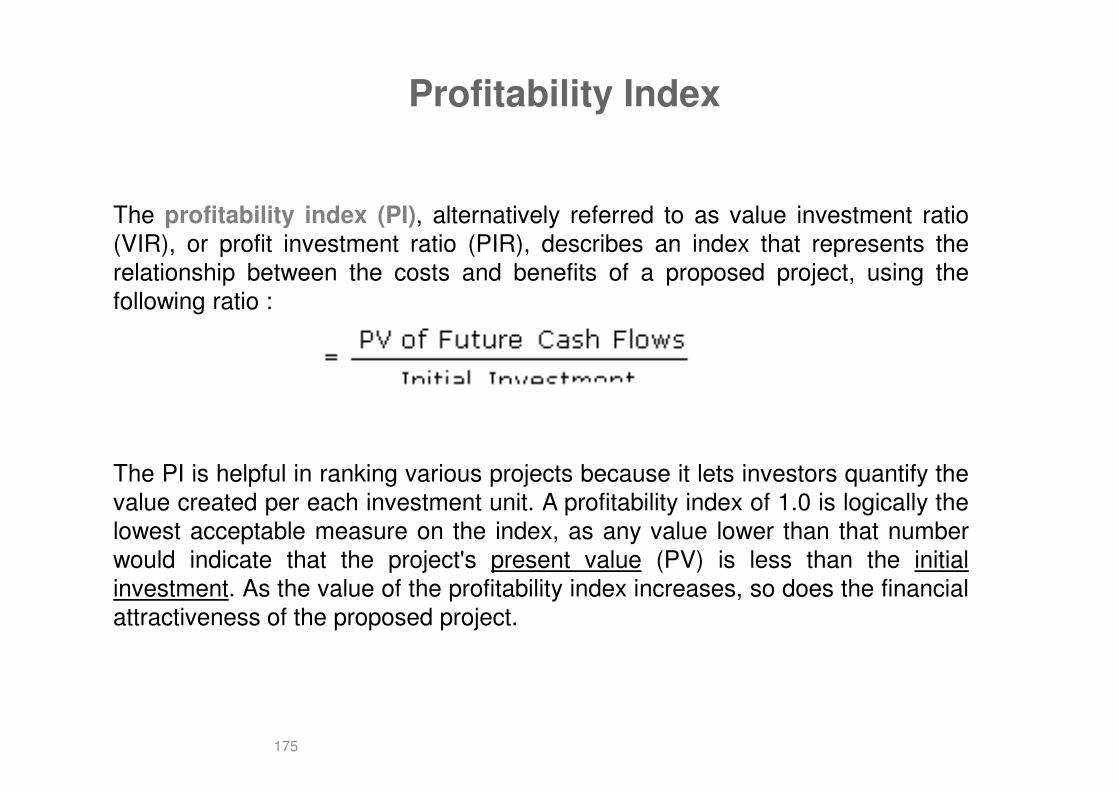
Profitability Index
The profitability index (PI), alternatively referred to as value investment ratio(VIR), or profit investment ratio (PIR), describes an index that represents therelationship between the costs and benefits of a proposed project, using thefollowing ratio :
175
The PI is helpful in ranking various projects because it lets investors quantify thevalue created per each investment unit. A profitability index of 1.0 is logically thelowest acceptable measure on the index, as any value lower than that numberwould indicate that the project's present value (PV) is less than the initialinvestment. As the value of the profitability index increases, so does the financialattractiveness of the proposed project.
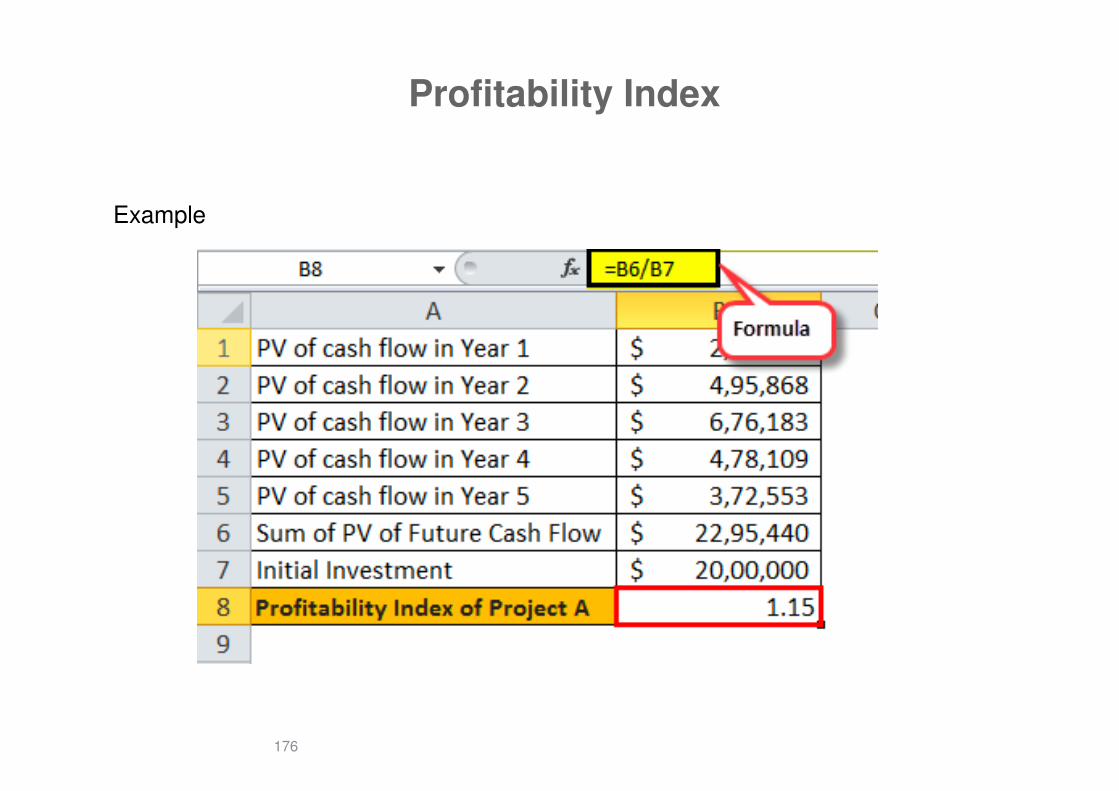
Profitability Index
Example
176