Embed Size (px)
Citation preview

PRELIMINARY DECISIONSA Power Networks
determination 2015−16 to 2019−20
Attachment 6 − Capital expenditure
April 2015
0 Attachment 6 – Capital expenditure | SA Power Networks' determination 2015–20

© Commonwealth of Australia 2015
This work is copyright. In addition to any use permitted under the Copyright Act 1968, all material contained within this work is provided under a Creative Commons Attributions 3.0 Australia licence, with the exception of:
the Commonwealth Coat of Arms
the ACCC and AER logos
any illustration, diagram, photograph or graphic over which the Australian Competition and Consumer Commission does not hold copyright, but which may be part of or contained within this publication. The details of the relevant licence conditions are available on the Creative Commons website, as is the full legal code for the CC BY 3.0 AU licence.
Requests and inquiries concerning reproduction and rights should be addressed to the Director, Corporate Communications,Australian Competition and Consumer Commission, GPO Box 4141, Canberra ACT 2601or [email protected].
Inquiries about this publication should be addressed to:
Australian Energy RegulatorGPO Box 520Melbourne Vic 3001
Tel: (03) 9290 1444Fax: (03) 9290 1457
Email: [email protected]
1 Attachment 6 – Capital expenditure | SA Power Networks' determination 2015–20

NoteThis attachment forms part of the AER's preliminary decision on SA Power
Networks' 2015–20 distribution determination. It should be read with all other parts of the preliminary decision.
The preliminary decision includes the following documents:
Overview
Attachment 1 – Annual revenue requirement
Attachment 2 – Regulatory asset base
Attachment 3 – Rate of return
Attachment 4 – Value of imputation credits
Attachment 5 – Regulatory depreciation
Attachment 6 – Capital expenditure
Attachment 7 – Operating expenditure
Attachment 8 – Corporate income tax
Attachment 9 – Efficiency benefit sharing scheme
Attachment 10 – Capital expenditure sharing scheme
Attachment 11 – Service target performance incentive scheme
Attachment 12 – Demand management incentive scheme
Attachment 13 – Classification of services
Attachment 14 – Control mechanism
Attachment 15 – Pass through events
Attachment 16 – Alternative control services
Attachment 17 – Negotiated services framework and criteria
Attachment 18 – Connection policy
2 Attachment 6 – Capital expenditure | SA Power Networks' determination 2015–20
Contents
Note...............................................................................................................6-2
Contents........................................................................................................6-3
Shortened forms..........................................................................................6-6
6 Capital expenditure................................................................................6-8
6.1 Preliminary decision.......................................................................6-8
6.2 SA Power Networks' proposal.....................................................6-12
6.3 AER’s assessment approach.......................................................6-13
6.3.1 Building an alternative estimate of total forecast capex..............6-16
6.3.2 Comparing the distributor's proposal with our alternative estimate.6-18
6.4 Reasons for preliminary decision...............................................6-19
6.4.1 Key assumptions.........................................................................6-20
6.4.2 Forecasting methodology............................................................6-21
6.4.3 Interaction with the STPIS...........................................................6-23
6.4.4 SA Power Networks' capex performance....................................6-24
6.4.5 Interrelationships.........................................................................6-29
6.4.6 Consideration of the capex factors..............................................6-30
6.5 Allocation of balancing item........................................................6-32
A Assessment Techniques.....................................................................6-33
A.1 Economic benchmarking.............................................................6-33
A.2 Trend analysis...............................................................................6-34
A.3 Category analysis.........................................................................6-35
A.4 Predictive modelling.....................................................................6-35
A.5 Engineering review.......................................................................6-36
B Assessment of capex drivers.............................................................6-37
3 Attachment 6 – Capital expenditure | SA Power Networks' determination 2015–20
B.1 Alternative estimate......................................................................6-37
B.2 AER findings and estimates for augmentation expenditure.....6-38
B.2.1 Demand-driven augmentation.....................................................6-40
B.2.2 Safety-related augmentation.......................................................6-48
B.2.3 Strategic programs......................................................................6-62
B.2.4 Reliability augmentation..............................................................6-73
B.2.5 Environmental.............................................................................6-82
B.2.6 Other augex — Power Line Environment Committee.................6-84
B.3 AER findings and estimates for connections and contributions 6-86
B.3.1 Position........................................................................................6-86
B.4 AER findings and estimates for replacement expenditure.......6-89
B.4.1 Position........................................................................................6-90
B.4.2 SA Power Networks' proposal.....................................................6-90
B.4.3 AER approach.............................................................................6-91
B.4.4 AER repex findings......................................................................6-93
B.5 AER findings and estimates for capitalised overheads..........6-108
B.5.1 Position......................................................................................6-108
B.5.2 Our assessment........................................................................6-108
B.6 AER findings and estimates for non-network capex...............6-109
B.6.1 Position......................................................................................6-110
B.6.2 SA Power Networks' proposal...................................................6-110
B.6.3 Information technology capex...................................................6-113
B.6.4 Buildings and property capex....................................................6-123
B.6.5 Fleet capex................................................................................6-127
B.7 Demand management.................................................................6-135
B.7.1 Position......................................................................................6-136
B.7.2 Reasons for preliminary decision..............................................6-137
4 Attachment 6 – Capital expenditure | SA Power Networks' determination 2015–20
C Demand...............................................................................................6-138
C.1 AER position on system demand trends..................................6-138
C.2 AER approach.............................................................................6-139
C.3 SA Power Networks' proposal...................................................6-139
C.4 AEMO forecasts..........................................................................6-141
D Real material cost escalation............................................................6-143
D.1 Position........................................................................................6-143
D.2 SA Power Networks proposal....................................................6-144
D.3 Assessment approach................................................................6-146
D.4 Reasons.......................................................................................6-147
D.5 Review of consultant's reports..................................................6-151
D.6 Conclusions on materials cost escalation................................6-157
D.7 Labour and construction escalators.........................................6-158
E Predictive modelling approach and scenarios................................6-159
E.1 Predictive modelling techniques...............................................6-159
E.2 Data specification process.........................................................6-160
E.3 Data collection and refinement..................................................6-161
E.4 Benchmarking repex asset data................................................6-161
E.4.1 Benchmark data for each asset category..................................6-162
E.5 Repex model scenarios..............................................................6-164
E.6 The treatment of staked wooden poles and plated stobie poles. .6-167
E.6.1 Like-for-like repex modelling.....................................................6-167
E.6.2 Non-like-for-like replacement....................................................6-167
E.7 Calibrating staked wooden poles..............................................6-169
E.8 Wooden pole asset adjustment (Ergon Energy)......................6-169
5 Attachment 6 – Capital expenditure | SA Power Networks' determination 2015–20
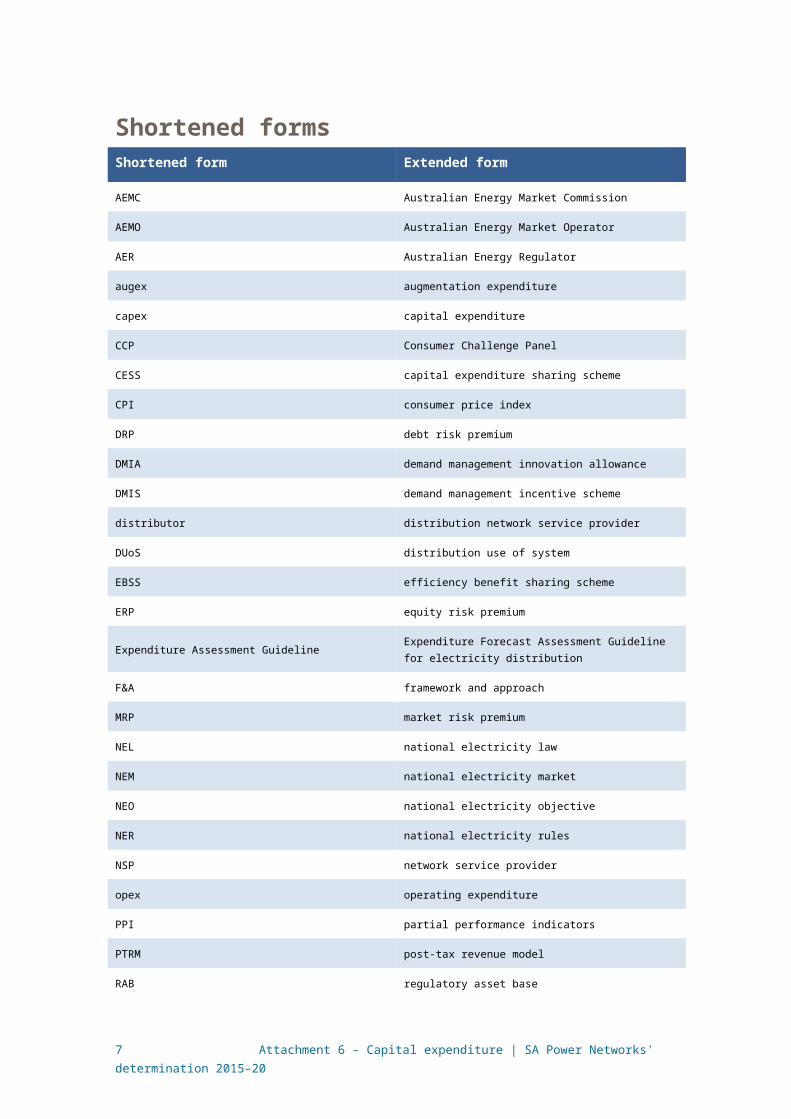
Shortened formsShortened form Extended form
AEMC Australian Energy Market Commission
AEMO Australian Energy Market Operator
AER Australian Energy Regulator
augex augmentation expenditure
capex capital expenditure
CCP Consumer Challenge Panel
CESS capital expenditure sharing scheme
CPI consumer price index
DRP debt risk premium
DMIA demand management innovation allowance
DMIS demand management incentive scheme
distributor distribution network service provider
DUoS distribution use of system
EBSS efficiency benefit sharing scheme
ERP equity risk premium
Expenditure Assessment GuidelineExpenditure Forecast Assessment Guideline for electricity distribution
F&A framework and approach
MRP market risk premium
NEL national electricity law
NEM national electricity market
NEO national electricity objective
NER national electricity rules
NSP network service provider
opex operating expenditure
PPI partial performance indicators
PTRM post-tax revenue model
RAB regulatory asset base
RBA Reserve Bank of Australia
repex replacement expenditure
RFM roll forward model
6 Attachment 6 – Capital expenditure | SA Power Networks' determination 2015–20
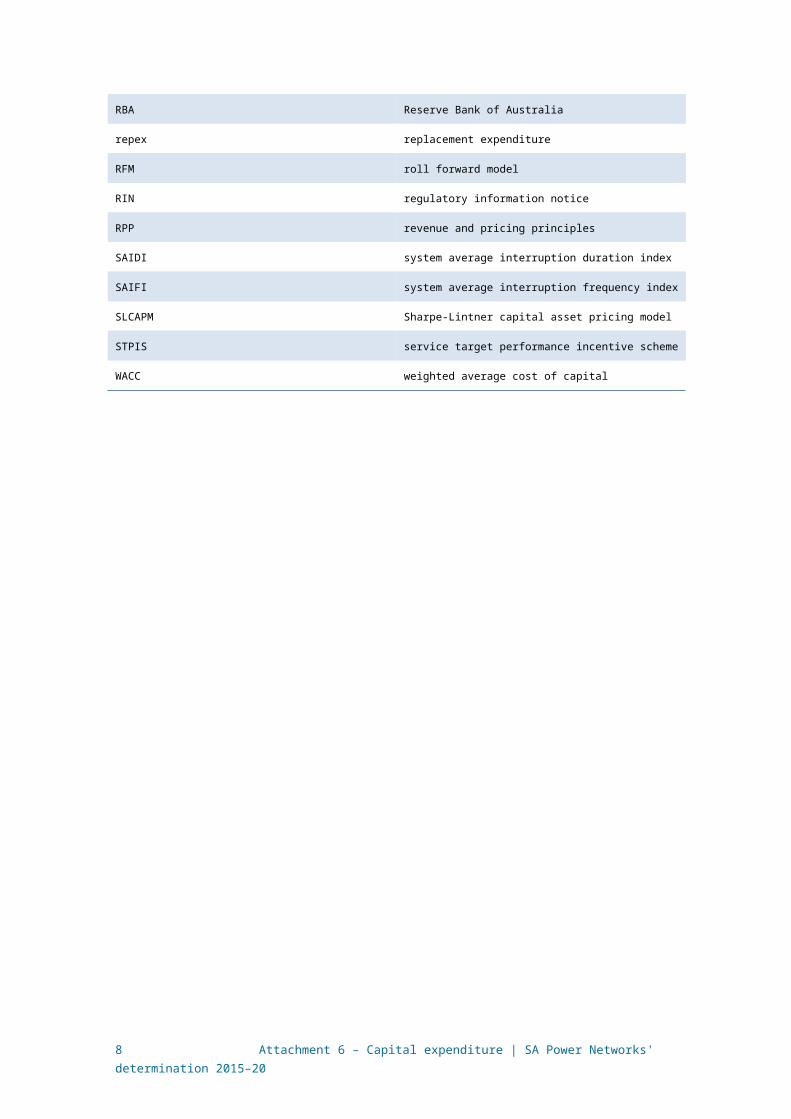
RIN regulatory information notice
RPP revenue and pricing principles
SAIDI system average interruption duration index
SAIFI system average interruption frequency index
SLCAPM Sharpe-Lintner capital asset pricing model
STPIS service target performance incentive scheme
WACC weighted average cost of capital
7 Attachment 6 – Capital expenditure | SA Power Networks' determination 2015–20
6 Capital expenditureCapital expenditure (capex) refers to the capital expenses incurred in the provision
of standard control services. The return on and of forecast capex are two of the building blocks that form part of SA Power Networks' total revenue requirement.1
This Attachment sets out our preliminary decision on SA Power Networks proposed total forecast capex. Further detailed analysis is in the following appendices:
Appendix A - Assessment Techniques
Appendix B - Assessment of capex drivers
Appendix C - Demand
Appendix D - Real material cost escalation
Appendix E - Predictive modelling approach.
6.1 Preliminary decisionWe are not satisfied that SA Power Networks proposed total forecast capex of
$2481.0 million ($2014-15) reasonably reflects the capex criteria. We have substituted our estimate of SA Power Networks total forecast capex for the 2015-20 regulatory control period. We are satisfied that our substitute estimate of $1684.0 million ($2014-15) reasonably reflects the capex criteria. Table 6-1 outlines our preliminary decision.
Table 6-1 Our preliminary decision on SA Power Networks total forecast capex ($2014-15, million)
2015–16 2016–17 2017–18 2018–19 2019–20 Total
SA Power Networks' proposal 459.1 508.3 510.4 517.8 485.4 2481.0
AER preliminary decision 311.2 341.7 348.3 345.0 337.8 1684.0
Difference -147.9 -166.6 -162.1 -172.8 -147.7 -797.0
Percentage difference (%) -32% -33% -32% -33% -30% -32%
Source: SA Power Networks Regulatory Proposal; AER analysis
Note: Numbers may not add up due to rounding.
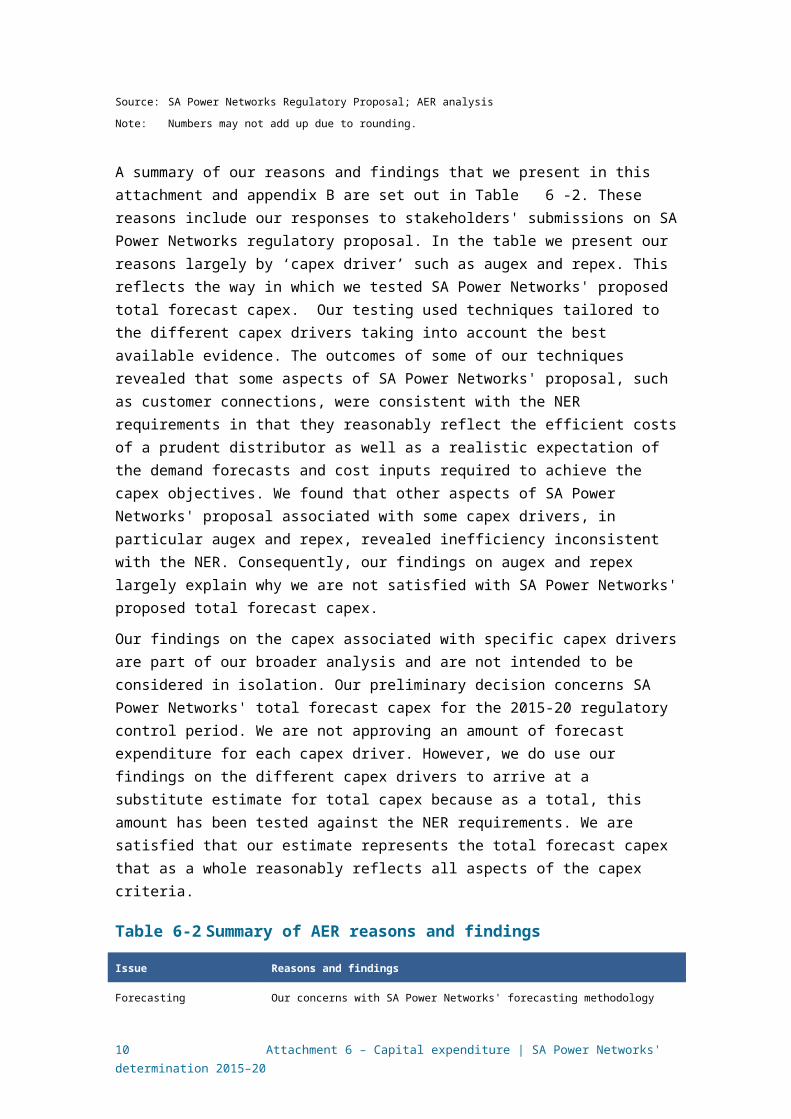
A summary of our reasons and findings that we present in this attachment and appendix B are set out in Table 6-2. These reasons include our responses to stakeholders' submissions on SA Power Networks regulatory proposal. In the table we present our reasons largely by ‘capex driver’ such as augex and repex. This reflects the way in which we tested SA Power Networks' proposed total forecast capex. Our testing used techniques tailored to the different capex drivers taking into account the best available evidence. The outcomes of some of our techniques revealed that some aspects of SA Power Networks' proposal, such as customer connections, were
1 NER, clause 6.4.3(a).
8 Attachment 6 – Capital expenditure | SA Power Networks' determination 2015–20

consistent with the NER requirements in that they reasonably reflect the efficient costs of a prudent distributor as well as a realistic expectation of the demand forecasts and cost inputs required to achieve the capex objectives. We found that other aspects of SA Power Networks' proposal associated with some capex drivers, in particular augex and repex, revealed inefficiency inconsistent with the NER. Consequently, our findings on augex and repex largely explain why we are not satisfied with SA Power Networks' proposed total forecast capex.
Our findings on the capex associated with specific capex drivers are part of our broader analysis and are not intended to be considered in isolation. Our preliminary decision concerns SA Power Networks' total forecast capex for the 2015-20 regulatory control period. We are not approving an amount of forecast expenditure for each capex driver. However, we do use our findings on the different capex drivers to arrive at a substitute estimate for total capex because as a total, this amount has been tested against the NER requirements. We are satisfied that our estimate represents the total forecast capex that as a whole reasonably reflects all aspects of the capex criteria.
Table 6-2 Summary of AER reasons and findings
Issue Reasons and findings
Forecasting methodology, key assumptions and past capex performance
Our concerns with SA Power Networks' forecasting methodology and key assumptions are material to our view that we are not satisfied that its proposed total forecast capex reasonably reflects the capex criteria
We conclude that SA Power Networks' forecasting methodology predominately relies upon a bottom-up build (or bottom-up assessment) to estimate the forecast expenditure and that the top-down constraints imposed by their governance process are insufficient for us to be able to conclude that the forecasts are prudent and efficient. Bottom up approaches have a tendency to overstate required allowances as they do not adequately account for inter-relationships and synergies between projects or areas of work. In the absence of a strong top-down challenge of the aggregated total of bottom-up projects, simply aggregating such estimates is unlikely to result in a total forecast capex allowance that we can be satisfied reasonably reflects the capex criteria.
In determining our alternative estimate we have addressed the concerns we have with SA Power Networks' forecasting methodology and key assumptions. Specifically, we have undertaken a top-down assessment by applying our assessment techniques of economic benchmarking, trend analysis and an engineering review. We have also addressed the deficiencies in SA Power Networks’ key assumptions about demand and customer forecast and forecast materials escalation rates and labour escalation rates.
Augmentation capex We do not accept SA Power Networks' proposed forecast of $848 million ($2014-15) for augex, and have instead included an amount of $463 million ($2014-15) in our alternative estimate, a reduction of 44 per cent. This amount is sufficient to provide SA Power Networks with a reasonable opportunity to recover at least the efficient costs to build its network to meet demand and meet its quality, safety, reliability and security of supply requirements.
SA Power Networks' augex forecast is comprised of a number of different components, each of which is driven by a different driver for augmentation. These include demand augmentation, safety, security, reliability, and environmental obligations. In building our alternative estimate, we have assessed each component of SA Power Networks' augex forecast and reached a conclusion on whether it satisfies the capex criteria. Our findings are as follows:
1. We accept the proposed $186 million for network augmentation to respond to localised demand growth and existing capacity constraints on its network. SA Power Networks’ proposal is consistent with flat network-wide demand and
9 Attachment 6 – Capital expenditure | SA Power Networks' determination 2015–20
Issue Reasons and findings
reductions in average network utilisation, as well as expected localised demand growth and capacity constraints.
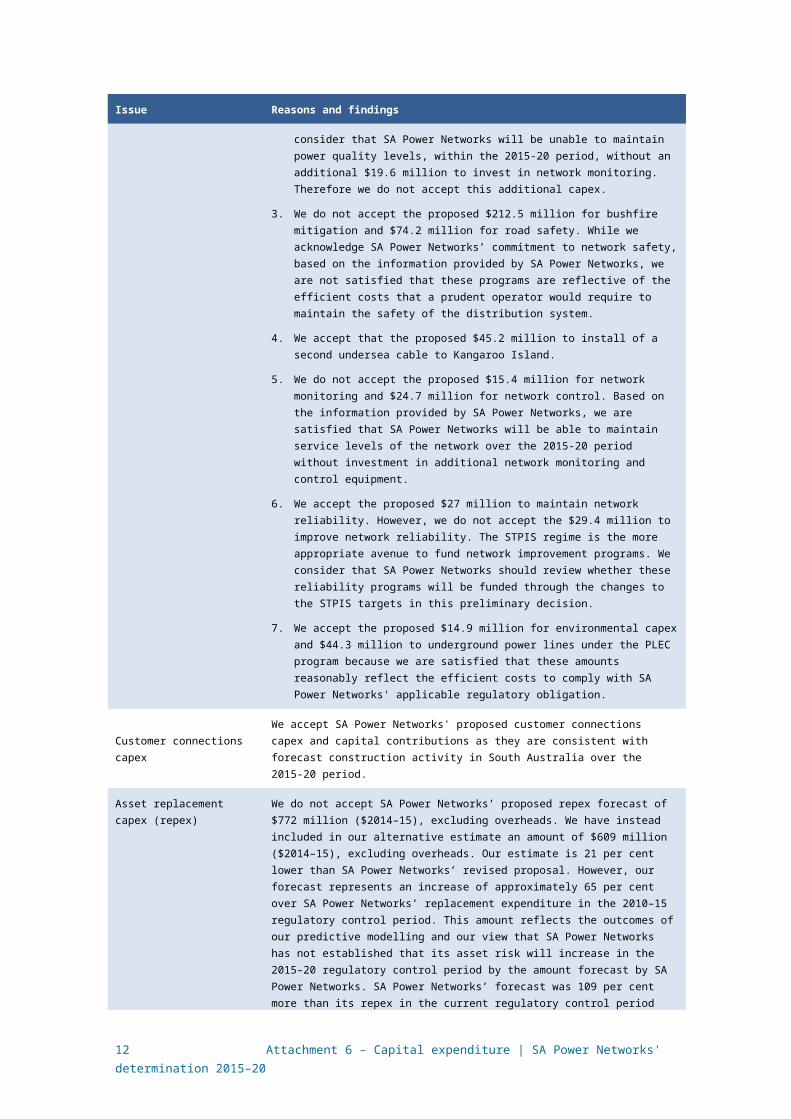
2. We accept the proposed $52.7 million to remediate power quality issues across its network. However, we do not consider that SA Power Networks will be unable to maintain power quality levels, within the 2015-20 period, without an additional $19.6 million to invest in network monitoring. Therefore we do not accept this additional capex.
3. We do not accept the proposed $212.5 million for bushfire mitigation and $74.2 million for road safety. While we acknowledge SA Power Networks’ commitment to network safety, based on the information provided by SA Power Networks, we are not satisfied that these programs are reflective of the efficient costs that a prudent operator would require to maintain the safety of the distribution system.
4. We accept that the proposed $45.2 million to install of a second undersea cable to Kangaroo Island.
5. We do not accept the proposed $15.4 million for network monitoring and $24.7 million for network control. Based on the information provided by SA Power Networks, we are satisfied that SA Power Networks will be able to maintain service levels of the network over the 2015-20 period without investment in additional network monitoring and control equipment.
6. We accept the proposed $27 million to maintain network reliability. However, we do not accept the $29.4 million to improve network reliability. The STPIS regime is the more appropriate avenue to fund network improvement programs. We consider that SA Power Networks should review whether these reliability programs will be funded through the changes to the STPIS targets in this preliminary decision.
7. We accept the proposed $14.9 million for environmental capex and $44.3 million to underground power lines under the PLEC program because we are satisfied that these amounts reasonably reflect the efficient costs to comply with SA Power Networks' applicable regulatory obligation.
Customer connections capexWe accept SA Power Networks' proposed customer connections capex and capital contributions as they are consistent with forecast construction activity in South Australia over the 2015-20 period.
Asset replacement capex (repex)
We do not accept SA Power Networks’ proposed repex forecast of $772 million ($2014–15), excluding overheads. We have instead included in our alternative estimate an amount of $609 million ($2014–15), excluding overheads. Our estimate is 21 per cent lower than SA Power Networks’ revised proposal. However, our forecast represents an increase of approximately 65 per cent over SA Power Networks’ replacement expenditure in the 2010–15 regulatory control period. This amount reflects the outcomes of our predictive modelling and our view that SA Power Networks has not established that its asset risk will increase in the 2015–20 regulatory control period by the amount forecast by SA Power Networks. SA Power Networks’ forecast was 109 per cent more than its repex in the current regulatory control period (the change is predominantly driven by a near fourfold increase in SA Power Networks’ forecast pole replacements).
We are satisfied our alternative estimate reasonably reflects the capex criteria. It includes:
1. $487 million of expenditure for six modelled asset categories based on SA Power Networks’ own 'business as usual' asset management practices and its historical unit costs.
2. $122 million for assets we consider that are not suitable for predictive modelling. This consists of $31 million for the SCADA, $52 million for pole top structures and $39 million for repex classified as ‘other’ by SA Power Networks.
Non-network capex We do not accept SA Power Networks' proposed non-network capex of $637.7 million ($2014-15). We have instead included in our alternative estimate of total capex an amount of $417.4 million ($2014-15) for non-network capex. This reflects our
10 Attachment 6 – Capital expenditure | SA Power Networks' determination 2015–20

Issue Reasons and findings
conclusion that SA Power Networks' forecast capex for information technology (IT), buildings and property, and fleet assets does not reflect the efficient costs of a prudent operator. In our view:
1. we are not satisfied that the proposed portfolio of IT projects is deliverable within the 2015–20 regulatory control period, or that the proposed capex reflects the efficient costs required to meet the identified need
2. SA Power Networks' forecasting methodology and supporting business cases do not provide evidence that its forecast buildings and property capex is prudent and efficient or is required to achieve the capex objectives
3. SA Power Networks' proposed vehicle replacement, new fleet and safety initiatives expenditure does not reasonably reflect the efficient costs that a prudent operator would require in the 2015–20 regulatory control period.
Capitalised overheads
We do not accept SA Power Networks' proposed capitalised overheads. We have instead included in our alternative estimate of overall total capex an amount of $84.1 million ($2013-14) for capitalised overheads.
Given that our assessment of SA Power Networks' proposed direct capex demonstrates that a prudent and efficient distributor would not undertake the full range of direct expenditure contained in SA Power Networks' proposal it follows that we would expect some reduction in the size of capitalised overheads. We have adjusted SA Power Networks' overheads on the basis of information they provided to us.
Real cost escalators
We are not accept SA Power Networks' proposed real material cost escalators (which lead to cost increases above CPI), which form part of its total forecast capex, reasonably reflect a realistic expectation of the cost inputs required to achieve the capex objectives over the 2015–20 regulatory period. We consider that zero per cent real cost escalation is reasonably likely to reflect the capex criteria including that it is likely to reasonably reflect a realistic expectation of the cost inputs required to achieve the capex objectives over the 2015–20 regulatory period. Our approach to real materials cost escalation does not affect the proposed application of labour and construction cost escalators which apply to SA Power Networks' forecast capex for standard control services.
In respect of real labour cost escalators (leading to cost increases above CPI), we are not satisfied that SA Power Networks' proposed real labour cost escalators which form part of its total forecast capex reasonably reflect a realistic expectation of the cost inputs required to achieve the capex objectives over the 2015–20 regulatory period. We have used Deloitte Access Economics’ (DAE’s) forecast of the electricity, gas, water and waste services (EGWWS) sector to forecast our labour price growth for SA Power Networks as detailed in attachment 7.
Adjustments and unaccounted for capex
SA Power Networks' RIN contained a balancing item of -$47.9 million ($2014-15). The negative adjustment of $47.9 million ($2014-15) over the five year period reflects the lower contributions that commenced part way through the 2013-14 regulatory year. We have allocated this balancing item to driver categories for the purpose of our assessment.
Source: AER analysis.
We consider that our overall capex allowance addresses the revenue and pricing principles. In particular, we consider that SA Power Networks has been provided a reasonable opportunity to recover at least the efficient costs it incurs in:2
Providing direct control network services; and
Complying with its regulatory obligations and requirements.
2 NEL, sections 7A.
11 Attachment 6 – Capital expenditure | SA Power Networks' determination 2015–20
As set out in appendix B we are satisfied that our overall capex allowance is consistent with the NEO in that our decision promotes efficient investment in, and efficient operation and use of, electricity services for the long term interests of consumers of electricity. Further, in making our preliminary decision, we have specifically considered the impact our decision will have on the safety and reliability of SA Power Networks' network. We consider our substitute estimate will allow a prudent and efficient distributor in SA Power Networks' circumstances to maintain the safety, service quality, security and reliability of its network consistent with its current obligations.
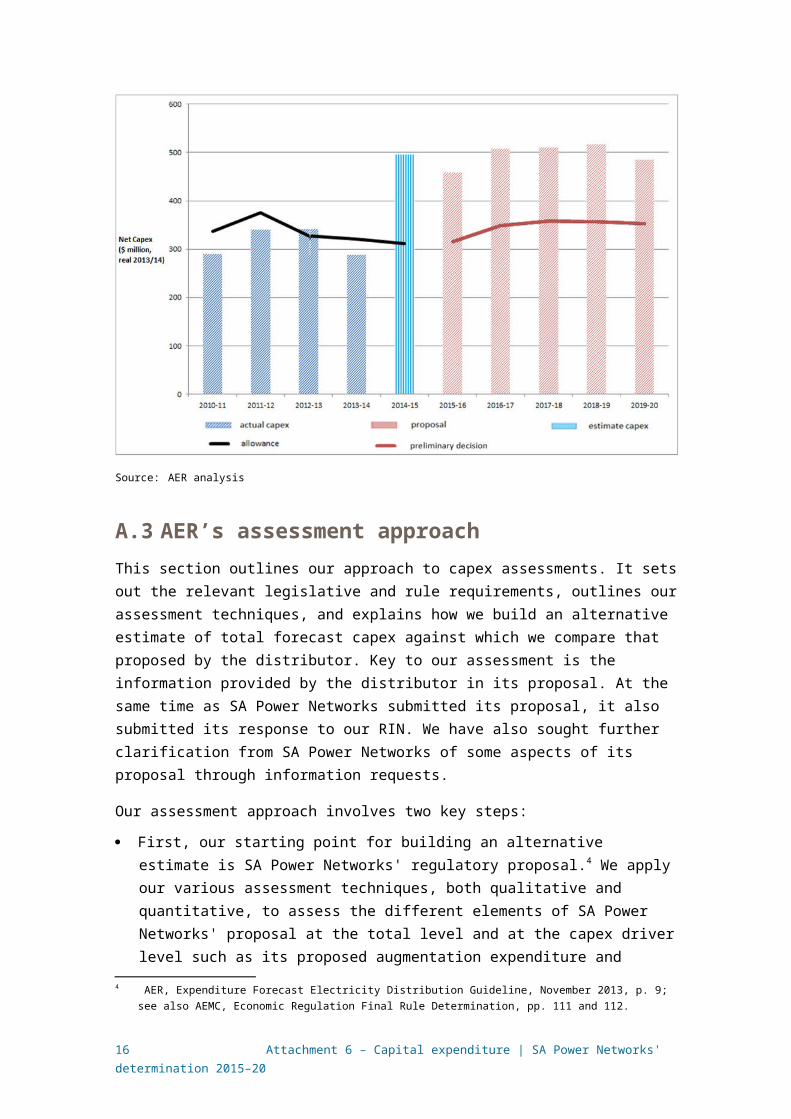
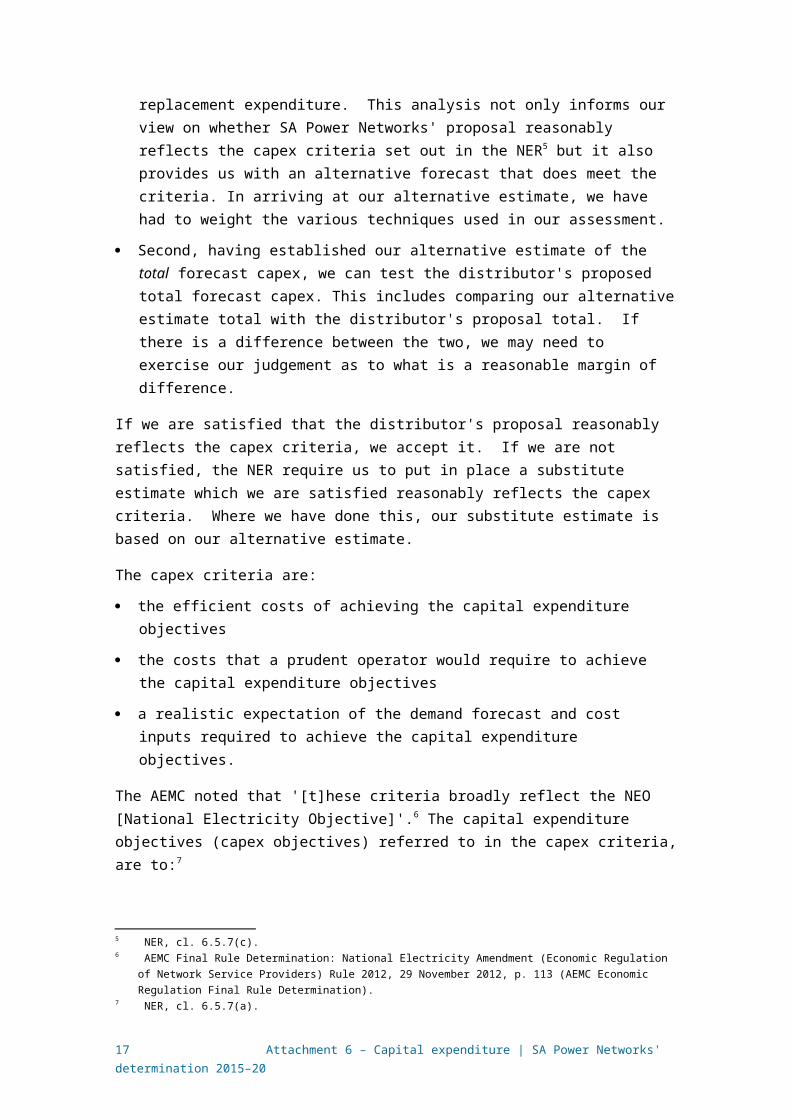
6.2 SA Power Networks' proposalSA Power Networks proposed total forecast capex of $2481.0 million ($2014–15) for the 2015–20 regulatory period. Figure 6-1 shows the increase between SA Power Networks' proposal for the 2015–20 regulatory period and the actual capex that it spent during the 2010–15 period. SA Power Networks has stated that this forecast increase in capex is mainly attributable to a need to:3
increase replacement of ageing assets to maintain network safety and reliability performance, and return the risk profile of the network assets to acceptable levels
improve the resilience of the most vulnerable parts of the network to improve the service experience of the worst served customers during severe weather events
improve vegetation management practices in line with community preferences
reduce the likelihood of starting bushfires
improve the service experience of customers
commence installation of more advanced meters.
Only partially offsetting this is reduced investment to augment the capacity of the network, in line with some moderation of customer peak demand growth since 2011.
Figure 6-1 SA Power Networks' total actual and forecast capex 2010–2020
3 SA Power Networks, Regulatory Proposal Overview, p.17.
12 Attachment 6 – Capital expenditure | SA Power Networks' determination 2015–20
Source: AER analysis
6.3 AER’s assessment approachThis section outlines our approach to capex assessments. It sets out the relevant
legislative and rule requirements, outlines our assessment techniques, and explains how we build an alternative estimate of total forecast capex against which we compare that proposed by the distributor. Key to our assessment is the information provided by the distributor in its proposal. At the same time as SA Power Networks submitted its proposal, it also submitted its response to our RIN. We have also sought further clarification from SA Power Networks of some aspects of its proposal through information requests.
Our assessment approach involves two key steps:
First, our starting point for building an alternative estimate is SA Power Networks' regulatory proposal.4 We apply our various assessment techniques, both qualitative and quantitative, to assess the different elements of SA Power Networks' proposal at the total level and at the capex driver level such as its proposed augmentation expenditure and replacement expenditure. This analysis not only informs our view on whether SA Power Networks' proposal reasonably reflects the capex criteria set out in the NER5 but it also provides us with an alternative forecast that does meet the criteria. In arriving at our alternative estimate, we have had to weight the various techniques used in our assessment.
4 AER, Expenditure Forecast Electricity Distribution Guideline, November 2013, p. 9; see also AEMC, Economic Regulation Final Rule Determination, pp. 111 and 112.
5 NER, cl. 6.5.7(c).
13 Attachment 6 – Capital expenditure | SA Power Networks' determination 2015–20

Second, having established our alternative estimate of the total forecast capex, we can test the distributor's proposed total forecast capex. This includes comparing our alternative estimate total with the distributor's proposal total. If there is a difference between the two, we may need to exercise our judgement as to what is a reasonable margin of difference.
If we are satisfied that the distributor's proposal reasonably reflects the capex criteria, we accept it. If we are not satisfied, the NER require us to put in place a substitute estimate which we are satisfied reasonably reflects the capex criteria. Where we have done this, our substitute estimate is based on our alternative estimate.
The capex criteria are:
the efficient costs of achieving the capital expenditure objectives
the costs that a prudent operator would require to achieve the capital expenditure objectives
a realistic expectation of the demand forecast and cost inputs required to achieve the capital expenditure objectives.
The AEMC noted that '[t]hese criteria broadly reflect the NEO [National Electricity Objective]'.6 The capital expenditure objectives (capex objectives) referred to in the capex criteria, are to:7
meet or manage the expected demand for standard control services over the period
comply with all regulatory obligations or requirements associated with the provision of standard control services
to the extent that there are no such obligations or requirements, maintain service quality, reliability and security of supply of standard control services and maintain the reliability and security of the distribution system
maintain the safety of the distribution system through the supply of standard control services.
Importantly, our assessment is about the total forecast capex and not about particular categories or projects in the capex forecast. AEMC has described our role in these terms:8
It should be noted here that what the AER approves in this context is expenditure allowances, not projects.
In deciding whether we are satisfied that SA Power Networks' proposed total forecast capex reasonably reflects the capex criteria, we have regard to the capex factors. The capex factors are:9
6 AEMC Final Rule Determination: National Electricity Amendment (Economic Regulation of Network Service Providers) Rule 2012, 29 November 2012, p. 113 (AEMC Economic Regulation Final Rule Determination).
7 NER, cl. 6.5.7(a).8 AEMC, Economic Regulation Final Rule Determination, p. vii.9 NER, cl. 6.5.7(e).
14 Attachment 6 – Capital expenditure | SA Power Networks' determination 2015–20
the AER's most recent annual benchmarking report and benchmark capex that would be incurred by an efficient distributor over the relevant regulatory control period
the actual and expected capex of the distributor during the preceding regulatory control periods
the extent to which the capex forecast includes expenditure to address the concerns of electricity consumers as identified by the distributor in the course of its engagement with electricity consumers
the relative prices of operating and capital inputs
the substitution possibilities between operating and capital expenditure
whether the capex forecast is consistent with any incentive scheme or schemes that apply to the distributor
the extent to which the capex forecast is referable to arrangements with a person other than the distributor that, in the opinion of the AER, do not reflect arm's length terms
whether the capex forecast includes an amount relating to a project that should more appropriately be included as a contingent project
the extent to which the distributor has considered, and made provision for, efficient and prudent non-network alternatives.
In addition, the AER may notify the distributor in writing, prior to the submission of its revised regulatory proposal, of any other factor it considers relevant.10 We have not had regard to any additional factors in this preliminary decision for SA Power Networks.
In taking these factors into account, the AEMC has noted that:11
…this does not mean that every factor will be relevant to every aspect of every regulatory determination the AER makes. The AER may decide that certain factors are not relevant in certain cases once it has considered them.
For transparency and ease of reference, we have included a summary of how we have had regard to each of the capex factors in our assessment at the end of this attachment.
More broadly, we also note that in exercising our discretion, we take into account the revenue and pricing principles which are set out in the NEL.12
Expenditure Assessment Guidelines
The rule changes the AEMC made in November 2012 require us to make and publish an Expenditure Forecast Assessment Guideline for electricity distribution,
10 NER, cl. 6.5.7(e)(12).11 AEMC, Economic Regulation Final Rule Determination, p. 115.12 NEL, ss. 7A and 16(2).
15 Attachment 6 – Capital expenditure | SA Power Networks' determination 2015–20
released in November 2013 (Guideline).13 The Guideline sets out the AER's proposed general approach to assessing capex (and opex) forecasts. The rule changes also require us to set out our approach to assessing capex in the relevant framework and approach paper. For SA Power Networks, our framework and approach paper (published in April 2014) stated that we would apply the Guideline, including the assessment techniques outlined in it.14 We may depart from our Guideline approach and if we do so, we need to explain why. In this determination we have not departed from the approach set out in our Guideline.
We note that the RIN data forms part of a distributor's regulatory proposal.15 In our Guidelines we set out that we would "require all the data that facilitate the application of our assessment approach and assessment techniques" and the RIN we issued in advance of a distributor lodging its regulatory proposal would specify the exact information required.16 Accordingly, we consider that our intention to materially rely upon the RIN data was made clear as part of the Guideline.
6.3.1 Building an alternative estimate of total forecast capex
Our starting point for building an alternative estimate is SA Power Networks' proposal.17 We then considered its performance in the previous regulatory control period to inform our alternative estimate. We also reviewed the proposed forecast methodology and the distributor's reliance on key assumptions that underlie its forecast.
We then applied our specific assessment techniques, to develop and estimate and assess the economic justifications that the distributor put forward. Many of our techniques encompass the capex factors that we are required to take into account. Further details on each of these techniques are included in appendix A and appendix B.
Some of these techniques focus on total capex; others focus on high level, standardised sub-categories of capex. Importantly, the techniques that focus on sub-categories are not conducted for the purpose of determining at a detailed level what projects or programs of work the distributor should or should not undertake. They are but one means of assessing the overall total forecast capex required by the distributor. This is consistent with the regulatory framework and the AEMC's statement that the AER does not approve specific projects but rather an overall revenue requirement that included total capex forecast.18 Once we approve total revenue, which will be determined by reference to our analysis of the proposed capex, the distributor is then able to prioritise its capex program given the prevailing circumstances at the time (such as demand and economic conditions that impact during the regulatory period). Some
13 AEMC, Economic Regulation Final Rule Determination, p. 114 and AER Expenditure Forecast Electricity Distribution Guideline.
14 AER, Framework and approach paper, p.72.15 NER, clause 6.8.2(c2) and (d). 16 AER, Expenditure Forecast Electricity Distribution Guideline, p. 25.17 AER, Expenditure Forecast Electricity Distribution Guideline, p. 9; see also AEMC Economic Regulation Final
Rule Determination, pp. 111 and 112.18 AEMC, Final Rule Determination: National Electricity Amendment (Economic Regulation of Network Service
Providers) Rule 2012, 29 November 2012, p. vii.
16 Attachment 6 – Capital expenditure | SA Power Networks' determination 2015–20
projects or programs of work that were not anticipated may be required. Equally likely, some of the projects or programs of work that the distributor has proposed for the regulatory control period may not ultimately be required in the regulatory period. We consider that a prudent and efficient distributor would consider the changing environment throughout the regulatory period and make sound decisions taking into account their individual circumstances.
As explained in our Guideline:
Our assessment techniques may complement each other in terms of the information they provide. This holistic approach gives us the ability to use all of these techniques, and refine them over time. The extent to which we use each technique will vary depending on the expenditure proposal we are assessing, but we intend to consider the inter-connections between our assessment techniques when determining total capex … forecasts. We typically would not infer the findings of an assessment technique in isolation from other techniques.19
In arriving at our estimate, we have had to weight the various techniques used in our assessment. How we weight these techniques will be determined on a case by case basis using our judgement as to which techniques are more robust, in the particular circumstances of each assessment. By relying on a number of techniques and weighting as relevant, we ensure we can take into consideration a wide variety of information and can take a holistic approach to assessing the proposed capex forecast.
Where our techniques involve the use of a consultant, to the extent that we accept our consultants' findings, we have set this out clearly in this preliminary decision and they form part of our reasons for arriving at our preliminary decision on overall capex. In all cases where we have relied on the findings of our consultants, we have done so only after carefully reviewing their analysis and conclusions, and evaluating these in the light of the outcomes from our other techniques.
We also need to take into account the various interrelationships between the total forecast capex and other components of a distributor's distribution determination. The other components that directly affect the total forecast capex are forecast opex, forecast demand, the service target performance incentive scheme, the capital expenditure sharing scheme, real cost escalation and contingent projects. We discuss how these components impact the total forecast capex in Table 6-4.
Underlying our approach are two general assumptions:
The capex criteria relating to a prudent operator and efficient costs are complementary such that prudent and efficient expenditure reflects the lowest long-term cost to consumers for the most appropriate investment or activity required to achieve the expenditure objectives:20
19 AER, Expenditure Forecast Electricity Distribution Guideline, p. 12.20 AER, Expenditure Forecast Electricity Distribution Guideline, pp. 8 and 9. AER Expenditure Forecast Electricity
Distribution Guideline, pp. 8 and 9. The Tribunal has previously endorsed this approach: see : Application by Ergon Energy Corporation Limited (Non-system property capital expenditure) (No 4) [2010] ACompT 12; Application by EnergyAustralia and Others [2009] ACompT 8; Application by Ergon Energy Corporation Limited (Labour Cost
17 Attachment 6 – Capital expenditure | SA Power Networks' determination 2015–20

Past expenditure was sufficient for SA Power Networks to manage and operate its network in that previous period, in a manner that achieved the capex objectives.21
After applying the above approach, we arrive at our alternative estimate of the total capex forecast.
6.3.2 Comparing the distributor's proposal with our alternative estimate
Having established our estimate of the total forecast capex, we can test the distributor's proposed total forecast capex. This includes comparing our alternative estimate of forecast total capex with the distributor's proposal. The distributor's forecast methodology and its key assumptions may explain any differences between our alternative estimate and its proposal.
As the AEMC foreshadowed, we may need to exercise our judgement in determining whether any 'margin of difference' is reasonable:22
The AER could be expected to approach the assessment of a NSP's expenditure (capex or opex) forecast by determining its own forecast of expenditure based on the material before it. Presumably this will never match exactly the amount proposed by the NSP. However there will be a certain margin of difference between the AER's forecast and that of the NSP within which the AER could say that the NSP's forecast is reasonable. What the margin is in a particular case, and therefore what the AER will accept as reasonable, is a matter for the AER exercising its regulatory judgment.
We have not relied solely on any one technique to assist us in forming a view as to whether we are satisfied that a distributor's proposed forecast capex reasonably reflects the capex criteria. We have drawn on a range of techniques as well as our assessment of other elements that impact upon capex such as demand and real cost escalators.
Our decision concerns SA Power Networks' total forecast capex and we are not approving specific projects. It is important to recognise that the distributor is not precluded from undertaking unexpected capex works, if the need arises, and despite the fact that such works did not form part our assessment in this determination. We consider that a prudent and efficient distributor would consider the changing environment throughout the regulatory period and make sound decisions taking into account their individual circumstances to address any unanticipated issues. Our provision of a total capex forecast does not constrain a distributor’s actual spending – either as a cap or as a requirement that the forecast be spent on specific projects or activities. It is conceivable that a distributor might wish to expend particular capital expenditure differently or in excess of the total capex forecast set out in our decision. Our decision does not constrain it from doing so.
Escalators) (No 3) [2010] ACompT 11; Application by DBNGP (WA) Transmission Pty Ltd (No 3) [2012] ACompT 14; Application by United Energy Distribution Pty Limited [2012] ACompT 1; Re: Application by ElectraNet Pty Limited (No 3) [2008] ACompT 3 ; Application by DBNGP (WA).
21 AER, Expenditure Forecast Electricity Distribution Guideline, p. 9.22 AEMC, Economic Regulation Final Rule Determination, p. 112.
18 Attachment 6 – Capital expenditure | SA Power Networks' determination 2015–20
The regulatory framework has a number of mechanisms to deal with unanticipated expenditure needs. Importantly, where unexpected events leads to an overspend of the approved capex forecast, a distributor does not bear the full cost, but rather bears 30 per cent of this cost, if the expenditure is found to be prudent and efficient. Further, for significant unexpected capex, the pass-through provisions provide a means for a distributor to pass on such expenses to customers where appropriate.
This does not mean that we have set our alternative estimate below the level where SA Power Networks has a reasonable chance to recover its efficient costs. Rather, we note that SA Power Networks is able to respond to any unanticipated issues that arise during the 2015-20 regulatory control period and in the event that the approved total revenue underestimates the total capex required, SA Power Networks has significant flexibility to allow it to meet its safety and reliability obligations.
Conversely, if we overestimate the amount of capex required, the stronger incentives put in place by the AEMC in 2012 should lead to a distributor spending only what is efficient, with the benefits of the underspend being shared between the distributor and consumers.
6.4 Reasons for preliminary decisionWe applied the assessment approach set out in section 6.3 to SA Power Networks.
We are not satisfied that SA Power Networks' total forecast capex reasonably reflects the capex criteria. We compared SA Power Networks' capex forecast to our alternative capex forecast we constructed using the approach and techniques outlined in appendix A and B. SA Power Networks' proposal is materially higher than ours. We are satisfied that our alternative estimate reasonably reflects the capex criteria.
Table 6-3 sets out the capex amounts by capex driver that we have included in our alternative estimate of SA Power Networks' total forecast capex for the 2015–2020 period.
Table 6-3 Our assessment of required capex by capex driver 2015–20 ($2014-15, million)
Category 2015-16 2016-17 2017-18 2018-19 2019-20 Total
Augmentation 78.8 97.3 102.6 96.2 88.8 463.6
Connections 96.3 99.5 101.8 108.0 114.6 520.2
Replacement 104.3 121.7 127.5 129.6 126.3 609.5
Non-Network 91.7 84.2 80.2 79.6 81.8 417.4
Capitalised overheads 15.7 15.9 16.8 17.4 18.2 84.1
Materials escalation adjustment
-4.5 -5.7 -7.8 -8.9 -10.0 -36.8
Gross Capex (includes capital contributions) 382.3 412.9 421.0 422.0 419.7 2058.0
Capital Contributions 71.1 71.2 72.7 77.1 81.9 374.0
19 Attachment 6 – Capital expenditure | SA Power Networks' determination 2015–20

Net Capex (excluding capital contributions) 311.2 341.7 348.3 345.0 337.8 1684.0
Source: AER analysis
Note: Numbers may not add up due to rounding.
Our assessment of SA Power Networks' forecasting methodology, key assumptions and past capex performance is discussed in the section below.
Our assessment of capex drivers is in appendix A. This sets out the application of our assessment techniques to the capex drivers, and the weighting we gave to particular techniques. We used our reasoning in the appendices to form our alternative estimate.
6.4.1 Key assumptions
The NER require SA Power Networks to include in its regulatory proposal the key assumptions that underlie its proposed forecast capex and a certification by its directors that those key assumptions are reasonable.23
SA Power Networks' key assumptions are:24
Expenditure forecasts are consistent with the strategic review they have undertaken
Forecast expenditure incorporates stakeholder engagement feedback
Past expenditure provides a reasonable indication of likely future expenditure, except where otherwise noted in the Proposal
Benchmarking confirms that they are acting as an efficient distributor
Unit costs of work will remain consistent with historical costs, with the exception of labour, materials and services cost escalation
Replacement asset management strategies and the scope of works selected for each asset category are appropriate to meet the capital expenditure objectives of the NER
Capacity asset management strategies and the scope of works selected for each asset category are appropriate to meet the capital expenditure objectives of the NER
Peak demand, connections, IT, Fleet and property expenditure are all as forecast.
We have assessed SA Power Networks' key assumptions in the appendices to this capex attachment.
6.4.2 Forecasting methodology
23 NER, clauses S6.1.1(2), (4) and (5).24 SA Power Networks, regulatory proposal, p.108
20 Attachment 6 – Capital expenditure | SA Power Networks' determination 2015–20

SA Power Networks is required to inform us about the methodology it proposes to use to prepare its forecast capex allowance before it submits its regulatory proposal.25 It is also required to include this information in its regulatory proposal.26
The main points of SA Power Networks' forecasting methodology are as follows:27
Capital expenditure plans are developed by aggregating a large number of generally bottom-up build asset management and/or expenditure plans across a range of expenditure categories. SA Power Networks also engages independent, expert advice to review and support its plans, processes and expenditure forecasts.
Consumer and stakeholder engagement program led to the identification and understanding of various stakeholder and consumer issues and concerns.
Once the scope of a capital expenditure plan has been determined, it is costed, generally utilising unit costs based on historical ‘building block’ estimates for similar projects and assembled in SA Power Networks’ standard estimating system.
The interaction between individual capital expenditure categories is considered by performing a ‘trade-off’ or benefits review. This review is conducted prior to aggregation of the capital expenditure categories, whereby each proposed expenditure scope will be examined for potential benefits in other expenditure lines and, where trade-off possibilities are considered prudent and efficient, corresponding adjustments will be made.
Finally, escalation for forecast changes in the real costs of materials, labour, contract services and land anticipated over the 2015-20 regulatory control period will be applied.
We have identified two aspects of SA Power Networks' forecasting methodology which indicate that its methodology is not a sufficient basis on which to conclude that its proposed total forecast capex reasonably reflects the capex criteria. These are:
SA Power Networks' forecasting methodology generally applies a bottom-up build (or bottom-up assessment) to estimate the forecast expenditure for all its capex categories.
SA Power Networks' cost-benefit evaluation of each of its capital projects or programs reveals that its underlying risk assessment is excessively conservative.
6.4.2.1 Lack of top-down restraint
SA Power Networks' forecasting methodology is primarily based upon a bottom-up build (or bottom-up assessment) to estimate the forecast expenditure for all its capex categories. SA Power Networks has not undertaken an overarching or top down assessment or provided information that could be readily used to test the overall capex portfolio in a top down manner. For example network performance and risk have not been considered by SA Power Networks at a total capex forecast level. While SA 25 NER, clauses 6.8.1A and 11.60.3(c); SA Power Networks, PR1238-EXPENDITURE FORECASTING
METHODOLOGY-METHOD-V1.026 NER, clause S6.1.1(2);27 SA Power Networks, Expenditure Forecasting Methodology, 25 November 2013.
21 Attachment 6 – Capital expenditure | SA Power Networks' determination 2015–20

Power Networks has in some cases considered risk in their asset management plans, business cases and other supporting documents, this information is of limited value as the risk assessment appears to be generally of poor quality, often qualitative in nature and not readily referable to the overall proposed capex portfolio. We do not consider that senior management review and board sign off provides a sufficient demonstration that a degree of overall restraint has been brought to bear. We would expect that a comprehensive review would have resulted in top down adjustments. However, we could not identify any information that demonstrated that this had occurred.
The drawback of deriving an estimate of capex by applying a bottom-up assessment is that of itself it does not provide sufficient evidence that the estimate is efficient. Bottom up approaches have a tendency to overstate required allowances as they do not adequately account for inter-relationships and synergies between projects or areas of work. In contrast, reviewing aggregated areas of expenditure or the total expenditure, allows for an overall assessment of efficiency. In certain very limited circumstances, a bottom up build may be a reasonable starting point to justifying expenditure.28 However, simply aggregating such estimates is unlikely to result in a total forecast capex allowance that we are satisfied reasonably reflects the capex criteria.
As we stated in our Expenditure Guideline, we intend to assess forecast capex proposals through a combination of top down and bottom up modelling.29 Our top-down assessment of SA Power Networks' proposed forecast is a material consideration in determining whether we are satisfied if it reasonably reflects the capex criteria. For example, trend analysis is a top-down assessment that can be applied in the context of a distribution network. This technique is able to test whether an estimate that results from a bottom-up assessment might be efficient. We have used this technique in this determination.
A top-down assessment should also clearly evidence a holistic and strategic consideration or assessment of the entire forecast capex program at a portfolio level. It should also demonstrate how the forecast capex proposal has been subject to governance and risk management arrangements. In turn, these arrangements should demonstrate how the timing and prioritisation of certain capital projects or programs has been determined over both the short and the long-term. It should also demonstrate that the capex drivers, such as asset health and risk levels, are well defined and justified. In particular, asset health and risk level metrics are key elements of capex drivers.
6.4.2.2 Excessively conservative risk assessment
Secondly, SA Power Networks' cost-benefit evaluation of some of its capital projects or programs reveals that its underlying risk assessment is excessively conservative. A number of business cases relied on unjustified assumptions,
28 It is possible for a bottom-up approach to reasonably reflect the capex criteria and if our assessment demonstrated this to be the case, then we would accept a total capex forecast derived from the bottom-up assessment. However, due to potential overestimation in a bottom-up approach, a top down assessment is a vital aspect of testing the validity of the bottom-up forecast.
29 AER, Expenditure Forecast Electricity Distribution Guideline, p. 17.
22 Attachment 6 – Capital expenditure | SA Power Networks' determination 2015–20

overstated benefits or did not consider relevant costs.30 In other cases the risk analysis did not reasonably justify assumptions and hence overstated the risk and the proposed response to the risk.31 Finally, in some cases, justification for the expenditure is not supported by the cost benefit analysis - that is SA Power Networks' own cost benefit analysis showed that the proposed expenditure was not justified.32
The lack of a rigorous cost-benefit approach, combined with the absence of a rigorous top-down assessment, indicates to us that SA Power Networks' forecast methodology is likely to result in a capex forecast that does not reasonably reflect the capex criteria.
6.4.3 Interaction with the STPIS
We consider that our approved capital expenditure forecast is consistent with the setting of targets under the STPIS. In particular, we consider that the capex allowance should not be set such that there is an expectation that it will lead to SA Power Networks systematically under or over performing against its STPIS targets. We consider our approved capex forecast is sufficient to allow a prudent and efficient SA Power Networks to maintain performance at the targets set under the STPIS. As such, it is appropriate to apply the STPIS as set out in attachment 11.
In making our preliminary decision, we have specifically considered the impact our decision will have on the safety and reliability of SA Power Networks' network. We consider our substitute estimate is sufficient for SA Power Networks to maintain the safety, service quality and reliability of its network consistent with its obligations. In any event, our provision of a total capex forecast does not constrain a distributor’s actual spending – either as a cap or as a requirement that the forecast be spent on specific projects or activities. It is conceivable that a distributor might wish to expend particular capital expenditure differently or in excess of the total capex forecast set out in our decision. Our decision does not constrain it from doing so. Under our analysis of specific capex drivers, we have explained how our analysis and certain assessment techniques factor in safety and reliability requirements.
6.4.4 SA Power Networks' capex performance
We have looked at a number of historical metrics of SA Power Networks' capex performance against that of other distributors in the NEM. We also compare SA Power Networks' proposed forecast capex allowance against historical trends. These metrics are largely based on outputs of the annual benchmarking report and other analysis undertaken using data provided by the distributors for the annual benchmarking report. This includes SA Power Networks' relative partial and multilateral total factor productivity (MTFP) performance, capex per customer and maximum demand, and SA Power Networks historic capex trend.
30 See SCADA and network control analysis as examples as set out in section B.2.31 See bushfire analysis as set out in section B.2.32 See SCADA and network control analysis as examples as set out in section B.2.
23 Attachment 6 – Capital expenditure | SA Power Networks' determination 2015–20

We note that the NER sets out that we must have regard to our annual benchmarking report.33 This section shows how we have taken it into account. We consider this high level benchmarking at the overall capex level is suitable to gain an overall understanding of SA Power Networks' proposal in a broader context. However, in our capex assessment we have not relied on our high level benchmarking metrics set out below other than to gain a high level insight into SA Power Networks' proposal. We have not used this analysis deterministically in our capex assessment.
Partial factor productivity of capital and multilateral total factor productivity
Figure 6-2 shows a measure of partial factor productivity of capital taken from our benchmarking report. This measure incorporated the productivity of transformers, overhead lines and underground cables. SA Power Networks performs relatively well on this measure, only falling behind some of the Victorian distributors.
Figure 6-2 Partial factor productivity of capital (transformers, overhead and underground lines)
2006 2007 2008 2009 2010 2011 2012 20130.600
0.800
1.000
1.200
1.400
1.600
1.800
2.000
03CIT13UED08JEN10SAP05ENX04END11AND06ERG02AGD09PCR01ACT07ESS12TND
Source: AER annual benchmarking report
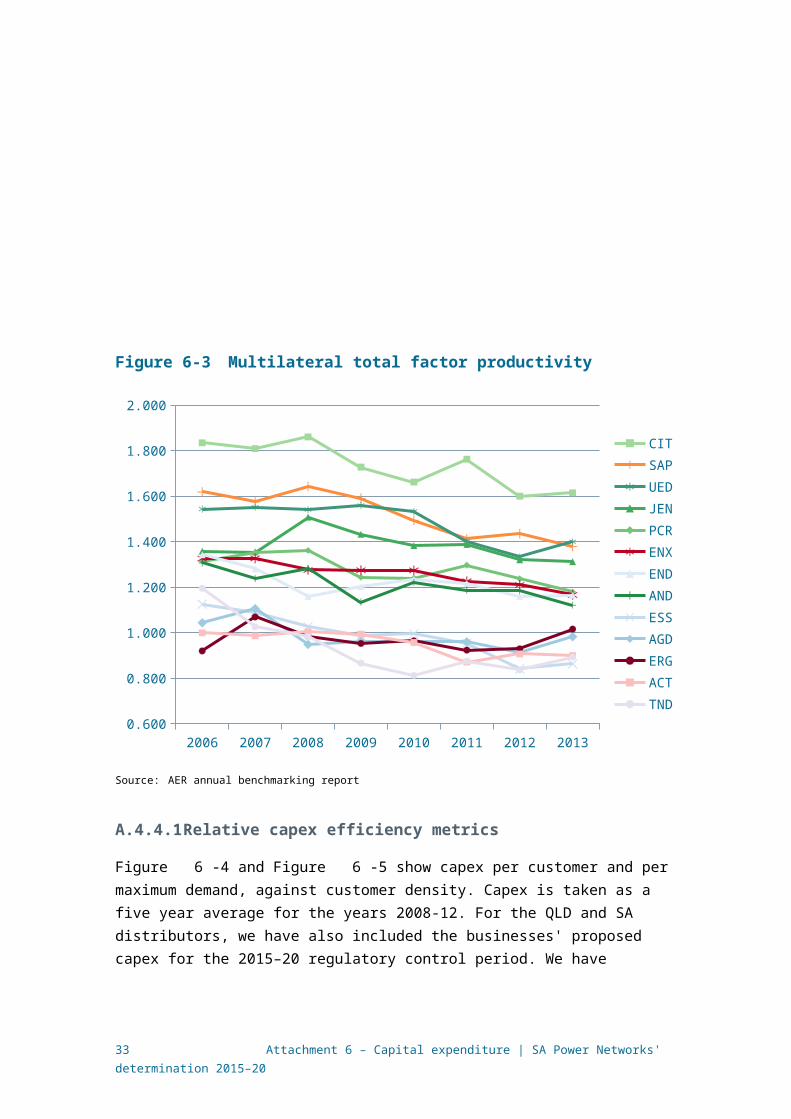
Figure 6-3 shows that SA Power Networks performs similar on MTFP. MTFP measures how efficient a business is in terms of its inputs (costs) and outputs (energy delivered, customer numbers, ratcheted maximum demand, reliability and circuit line length). SA Power Networks is one of the top performers on this metric.
33 NER, cl. 6.5.7(e).
24 Attachment 6 – Capital expenditure | SA Power Networks' determination 2015–20
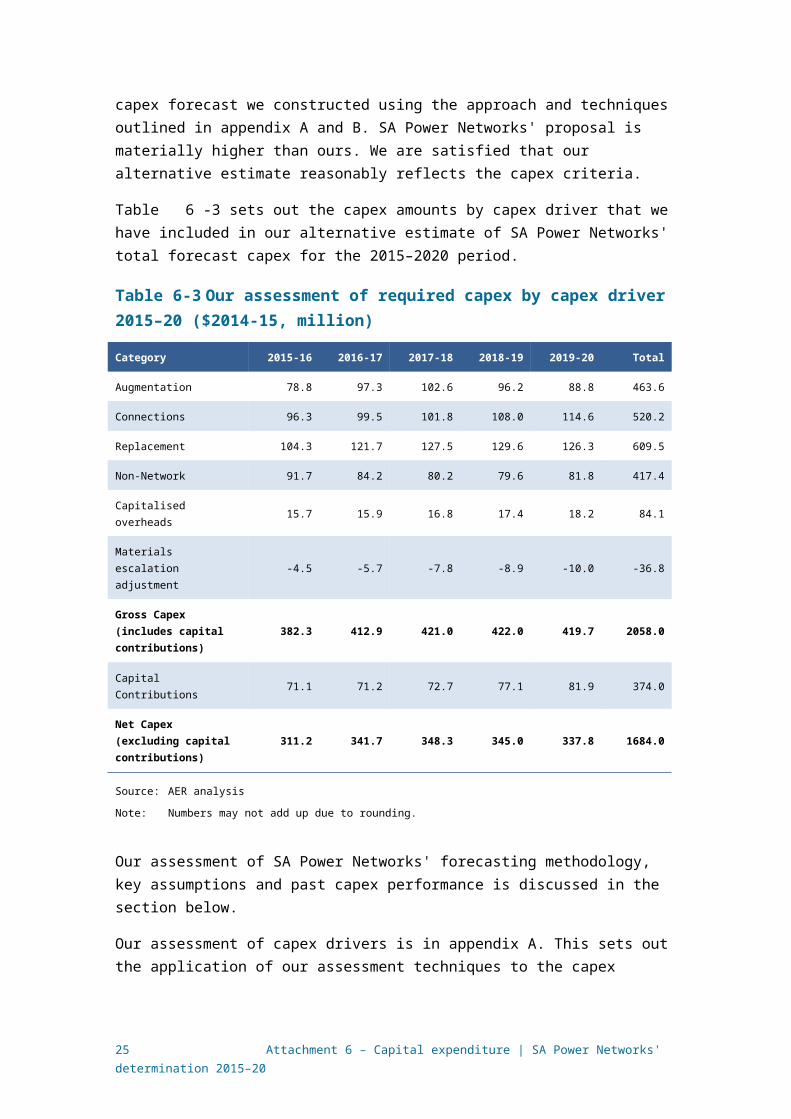
Figure 6-3 Multilateral total factor productivity
2006 2007 2008 2009 2010 2011 2012 20130.600
0.800
1.000
1.200
1.400
1.600
1.800
2.000
CITSAPUEDJENPCRENXENDANDESSAGDERGACTTND
Source: AER annual benchmarking report
6.4.4.1 Relative capex efficiency metrics
Figure 6-4 and Figure 6-5 show capex per customer and per maximum demand, against customer density. Capex is taken as a five year average for the years 2008-12. For the QLD and SA distributors, we have also included the businesses' proposed capex for the 2015–20 regulatory control period. We have considered capex per customer as it reflects the amount consumers are charged for additional capital investments.
Figure 6-4 shows that SA Power Networks performed well in the 2008-12 period in terms of capex per customer. However, SA Power Networks' capex per customer will
25 Attachment 6 – Capital expenditure | SA Power Networks' determination 2015–20
increase for the 2015–20 period based on their proposed forecast capex. This increase means that SA Power Networks' capex per customer will be relatively high in the 2015-20 regulatory control period.
Figure 6-4 Capex per customer (000s, $2013-14), against customer density
0 10 20 30 40 50 60 70 80 90 100 1100
0.1
0.2
0.3
0.4
0.5
0.6
0.7
0.8
0.9
1
ActewAGL
AusGrid
CitiPower
Endeavour EnergyEnergex
Ergon EnergyEssential Energy
JemenaPowercorSA Power Networks
SP AusNetTasNetworks
United Energy
Energex forecast
Ergon forecastSA Power Network
forecast
Customer density
Cap
ex p
er c
usto
mer
Source: AER analysis
Figure 6-5 shows that SA Power Networks performed well in 2008-12 in terms of capex per maximum demand. Again capex per maximum demand is forecast to increase for SA Power Networks in the next period and it will be one of the poorer performers next period.
26 Attachment 6 – Capital expenditure | SA Power Networks' determination 2015–20
Figure 6-5 Capex per maximum demand (000s, $2013-14), against customer density
0 10 20 30 40 50 60 70 80 90 100 110$0
$50
$100
$150
$200
$250
$300
$350
ActewAGL
AusGrid
CitiPower
Endeavour EnergyEnergex
Ergon Energy
Essential Energy
JemenaPowercor
SA Power Networks
SP AusNet
TasNetworks
United Energy
Energex forecastErgon forecast
SA Power Network forecast
Customer density
Cap
ex p
er M
axim
um d
eman
d
Source: AER analysis
SA Power Networks' historic capex trends
We have compared SA Power Networks' capex proposal for the 2015–20 regulatory control period against the long term historical trend in capex levels.
shows actual historic capex and proposed capex between 2001-12 and 2018-19. This figure shows that SA Power Networks' average proposed capex for the 2015–20 regulatory control period is substantially higher that in the previous regulatory period. Our detailed assessment in appendix B examined whether this increase is reasonably reflective of the capex criteria.
27 Attachment 6 – Capital expenditure | SA Power Networks' determination 2015–20

Figure 6-6 SA Power Networks' total capex (including overheads)—historical and forecast for 2015–2020 period
Source: AER analysis
6.4.5 Interrelationships
There are a number of interrelationships between SA Power Networks' total forecast capex for the 2015–20 regulatory control period and other components of its distribution determination that we have taken into account in coming to our preliminary decision. Table 6-4 summarises these other components and their interrelationships with SA Power Networks' total forecast capex.
Table 6-4 Interrelationships between total forecast capex and other components
28 Attachment 6 – Capital expenditure | SA Power Networks' determination 2015–20

Other component Interrelationships with total forecast capex
Total forecast opex
There are elements of SA Power Networks' total forecast opex that are related to its total forecast capex. These are:
the labour cost escalators that we approved in Attachment 7
the amount of maintenance opex that is reflected in SA Power Networks' opex base year that we approved in Attachment 7
The labour cost escalators are interrelated with capex because SA Power Networks' total forecast capex includes expenditure for capitalised labour. Maintenance opex is also related to capex, although we did not approve a specific amount of maintenance opex as part of assessing SA Power Networks' total forecast opex. This is because the amount of maintenance opex that is reflected in SA Power Networks' opex base in part determines the extent to which SA Power Networks needs to spend repex during the 2015–20 period.
Forecast demand
Forecast demand is related to SA Power Networks' total forecast capex. Growth driven capex, which includes augex and customer connections capex, is typically triggered by a need to build or upgrade a network to address changes in demand or to comply with quality, reliability and security of supply requirements. Hence, the main driver of growth-related capex is maximum demand and its effect on network utilisation and reliability.
Capital Expenditure Sharing Scheme (CESS)
The CESS is related to SA Power Networks' total forecast capex. In particular, the effective application of the CESS is contingent on the approved total forecast capex being efficient, and that it reasonably reflects the capex criteria. As we noted in [the capex criteria table below], this is because any efficiency gains or losses are measured against the approved total forecast capex. In addition, in future distribution determinations we will be required to undertake an ex post review of the efficiency and prudency of capex, with the option to exclude any inefficient capex in excess of the approved total forecast capex from SA Power Networks' regulatory asset base. In particular, the CESS will ensure that SA Power Networks bears at least 30 per cent of any overspend against the capex allowance. Similarly, if SA Power Networks can fulfil their objectives without spending the full capex allowance, it will be able to retain 30 per cent of the benefit of this. In addition, if an overspend is found to be inefficient through the ex post review, SA Power Networks risks having to bear the entire overspend.
Service Target Performance Incentive Scheme (STPIS)
The STPIS is interrelated to SA Power Networks' total forecast capex, in so far as it is important that it does not include any expenditure for the purposes of improving supply reliability during the 2015–20 period. This is because such expenditure should be offset by rewards provided through the application of the STPIS.
Further, the forecast capex should be sufficient to allow SA Power Networks to maintain performance at the targets set under the STPIS. The capex allowance should not be set such that there is an expectation that it will lead to SA Power Networks systematically under or over performing against its targets.
Contingent project
A contingent project is interrelated to SA Power Networks' total forecast capex. This is because an amount of expenditure that should be included as a contingent project should not be included as part of SA Power Networks' total forecast capex for the 2015–20 period.
We did not identify any contingent projects for SA Power Networks for the 2015–20 period.
Source: AER analysis
6.4.6 Consideration of the capex factors
In applying our assessment techniques to determine whether we are satisfied that SA Power Networks proposed total forecast capex and our alternative estimate reasonably reflects the capex criteria, we have had regard to the capex factors. Where relevant, we have also had regard to the capex factors in assessing the forecast capex
29 Attachment 6 – Capital expenditure | SA Power Networks' determination 2015–20

associated with its underlying capex drivers as set out in appendix A. Table 6-5 summarises how we have taken into account the capex factors.
Table 6-5 AER consideration of the capex factors
Capex factor AER consideration
The most recent annual benchmarking report and benchmarking capex that would be incurred by an efficient distributor over the relevant regulatory control period
We have had regard to our most recent benchmarking report in assessing SA Power Networks' proposed total forecast capex and in determining our alternative estimate for the 2015–2020 period. This can be seen in the metrics we used in our assessment of SA Power Networks' capex performance.
The actual and expected capex of SA Power Networks during any preceding regulatory control periods
We have had regard to SA Power Networks' actual and expected capex during the 2010–2015 and preceding regulatory control periods in assessing its proposed total forecast capex.
This can be seen in our assessment of SA Power Networks' capex performance. It can also be seen in our assessment of the forecast capex associated with the capex drivers that underlie SA Power Networks' total forecast capex.
For non-network related capex, we rely on trend analysis to arrive at an estimate that meets the capex criteria.
The extent to which the capex forecast includes expenditure to address concerns of electricity consumers as identified by SA Power Networks in the course of its engagement with electricity consumers
We have had regard to the extent to which SA Power Networks' proposed total forecast capex includes expenditure to address consumer concerns that have been identified by SA Power Networks. SA Power Networks undertook a consumer engagement program which included workshops, bilateral engagement with stakeholders and a willingness-to-pay survey. On the information available to us, including submissions received from stakeholders, we have been unable to identify the extent to which SA Power Networks' proposed total forecast capex includes capex that address the concerns of its consumers that it has identified.
The relative prices of operating and capital inputs
We have had regard to the relative prices of operating and capital inputs in assessing SA Power Networks' proposed real cost escalation factors for materials. In particular, we have accepted SA Power Networks' proposal to not apply real cost escalation for materials.
The substitution possibilities between operating and capital expenditure
We have had regard to the substitution possibilities between opex and capex. We have considered whether there are more efficient and prudent trade-offs in investing more or less in capital in place of ongoing operations. See our discussion about the interrelationships between SA Power Networks' total forecast capex and total forecast opex in Table 6-4 above.
Whether the capex forecast is consistent with any incentive scheme or schemes that apply to SA Power Networks
We have had regard to whether SA Power Networks' proposed total forecast capex is consistent with the CESS and the STPIS. See our discussion about the interrelationships between SA Power Networks' total forecast capex and the application of the CESS and the STPIS in Table 6-4 above.
The extent to which the capex forecast is referable to arrangements with a person other than the distributor that do not reflect arm's length terms
We have had regard to whether any part of SA Power Networks' proposed total forecast capex or our alternative estimate is referable to arrangements with a person other than SA Power Networks that do not reflect arm's length terms. We did not identify any parts of SA Power Networks' proposed total forecast capex or our alternative estimate that is referable in this way.
30 Attachment 6 – Capital expenditure | SA Power Networks' determination 2015–20

Capex factor AER consideration
Whether the capex forecast includes an amount relating to a project that should more appropriately be included as a contingent project
We have had regard to whether any amount of SA Power Networks' proposed total forecast capex or our alternative estimate relates to a project that should more appropriately be included as a contingent project. We did not identify any such amounts that should more appropriately be included as a contingent project.
The extent to which SA Power Networks has considered and made provision for efficient and prudent non-network alternatives
We have had regard to the extent to which SA Power Networks made provision for efficient and prudent non-network alternatives as part of our assessment of the capex associated with the non-network capex driver. We discuss this further in Appendix B.
Any other factor the AER considers relevant and which the AER has notified SA Power Networks in writing, prior to the submission of its revised regulatory proposal, is a capex factor
We did not identify any other capex factor that we consider relevant.
Source: AER analysis
6.5 Allocation of balancing itemSA Power Networks' RIN contained a balancing item of -$47.9 million ($2014-15). The negative adjustment of $47.9 million ($2014-15) over the five year period reflects the lower contributions that commenced part way through the 2013-14 regulatory year.34 We have allocated this balancing item to driver categories for the purpose of our assessment. Table 6-6 sets out our allocation of SA Power Networks' balancing item.
Table 6-6 Allocation of balancing item to driver ($2014-15, million)
Driver Initial ProposalInitial Proposal(after allocating balancing item)
Preliminary Decision
Augmentation 858.4 839.4 463.6
Connections 532.0 520.2 520.2
Replacement 772.6 755.5 609.5
Non-Network 637.7 637.7 417.4
Capitalised overheads 102.1 102.1 84.1
Materials escalation adjustment 0.0 0.0 -36.8
Balancing item -47.9 0.0 0.0
TOTAL GROSS CAPEX 2,855.0 2,854.9 2,058.0
Capital contributions 374.0 374.0 374.0
TOTAL NET CAPEX 2,481.0 2,480.9 1,684.0
Source: AER analysis
34 SA Power Networks, Regulatory Proposal 2015-20, 31 October 2014, p. 245
31 Attachment 6 – Capital expenditure | SA Power Networks' determination 2015–20

32 Attachment 6 – Capital expenditure | SA Power Networks' determination 2015–20
A Assessment TechniquesThis appendix describes the assessment approaches we have applied in assessing
SA Power Networks' proposed forecast capex. We use a variety of techniques to determine whether the proposed capex reasonably reflects the capex criteria. The extent to which we rely on each of the assessment techniques is set out in appendix B.
The assessment techniques that we apply in capex are necessarily different from those we apply in the assessment of opex. This is reflective of differences in the nature of the expenditure being assessed. As such, we use some assessment techniques in our capex assessment that are not suitable for assessing opex and vice versa. We set this out in our expenditure assessment guideline, where we stated:35
Past actual expenditure may not be an appropriate starting point for capex given it is largely non-recurrent or 'lumpy', and so past expenditures or work volumes may not be indicative of future volumes. For non-recurrent expenditure, we will attempt to normalise for work volumes and examine per unit costs (including through benchmarking across distributors) when forming a view on forecast unit costs.
Other drivers of capex (such as replacement expenditure and connections works) may be recurrent. For such expenditure, we will attempt to identify trends in revealed volumes and costs as an indicator of forecast requirements.
The assessment techniques that we have used to asses SA Power Networks' capex are set out below.
A.1 Economic benchmarkingEconomic benchmarking is one of the key outputs of our annual benchmarking
report. We are required to consider economic benchmarking as it is one of the capex factors under the NER.36 Economic benchmarking applies economic theory to measure the efficiency of a distributor's use of inputs to produce outputs, having regard to environmental factors.37 It allows us to compare the performance of a distributor against its own past performance, and the performance of other distributors. Economic benchmarking helps us to assess whether a distributor's capex forecast represents efficient costs.38 As stated by the AEMC, 'benchmarking is a critical exercise in assessing the efficiency of a NSP'.39
A number of economic benchmarks from the annual benchmarking report are relevant to our assessment of capex. These include measures of total cost efficiency and overall capex efficiency. In general, these measures calculate a distributor's efficiency with consideration given to its inputs, outputs and its operating environment. We have considered each distributor's operating environment in so far as there are
35 AER, Expenditure assessment guideline, p.8.36 NER, cl. 6.5.7(e)(4).37 AER, Explanatory Statement: Expenditure Forecasting Assessment Guidelines, November 2013.38 NER, cl. 6.5.7(c).39 AEMC, Economic Regulation Final Rule Determination, p. 25.
33 Attachment 6 – Capital expenditure | SA Power Networks' determination 2015–20

factors that are outside of a distributor's control but which affect a distributor's ability to convert inputs into outputs.40 Once such exogenous factors are taken into account, we expect distributors to operate at similar levels of efficiency. One example of an exogenous factor that we have taken into account is customer density. For more on how we have forecast these measures, see our annual benchmarking report.41
In addition to the measures in the annual benchmarking report, we have considered how distributors have performed on a number of overall capex metrics, including capex per customer, and capex per maximum demand. We have calculated these economic benchmarks based on actual data from the previous regulatory control period.
The results from the economic benchmarking give an indication of the relative efficiency of each of the distributors, and how this has changed over time.
A.2 Trend analysisWe have considered past trends in actual and forecast capex. This is one of the
capex factors to which we are required to have regard.42
Trend analysis involves comparing NSPs' forecast capex and work volumes against historic levels. Where forecast capex and volumes are materially different to historic levels, we have sought to understand what has caused these differences. In doing so, we have considered the reasons given by the distributors in their proposals, as well as changes in the circumstances of the distributor.
In considering whether a business' capex forecast reasonably reflects the capex criteria, we need to consider whether the forecast will allow the business to meet expected demand, and comply with relevant regulatory obligations.43 Demand and regulatory obligations (specifically, service standards) are key drivers of capex. More onerous standards will increase capex, as will growth in maximum demand. Conversely, reduced service obligations or a decline in demand will likely cause a reduction in the amount of capex required by a distributor.
Maximum demand is a key driver of augmentation or demand driven expenditure. As augmentation often needs to occur prior to demand growth being realised, forecast rather than actual demand is relevant when a business is deciding what augmentation projects will be required in an upcoming regulatory control period. However, to the extent that actual demand differs from forecast, a business should reassess the need for the projects. Growth in a business' network will also drive augmentation and connections related capex. For these reasons it is important to consider how trends in capex (and in particular, augex and connections) compare with trends in demand (both maximum demand and customer numbers).
For service standards, there is generally a lag between when capex is undertaken (or not) and when the service improves (or declines). This is important in considering
40 AEMC, Economic Regulation Final Rule Determination, p.113. Exogenous factors could include geographic factors, customer factors, network factors and jurisdictional factors.
41 AER, Annual Benchmarking Report, 2014.42 NER, cl. 6.5.7(e)(5).43 NER, cl. 6.5.7(a)(3).
34 Attachment 6 – Capital expenditure | SA Power Networks' determination 2015–20

the expected impact of an increase or decrease in capex on service levels. It is also relevant to consider when service standards have changed and how this has affected a NSP's capex requirements.
We have looked at trends in capex across a range of levels including at the total capex level, for growth related capex, for replacement capex, and for each of the categories of capex, as relevant. We have also compared these with trends in demand and changes in service standards over time.
A.3 Category analysisExpenditure category level analysis allows us to compare expenditure across
NSPs, and over time, for various levels of capex:
overall costs within each category of capex
unit costs, across a range of activities
volumes, across a range of activities
asset lives, across a range of asset classes which we have used in assessing repex.
Using standardised reporting templates, we have collected data on augex, repex, connections, non-network capex, overheads and demand forecasts for all distributors in the NEM. The use of standardised category data allows us to make direct comparisons across distributors. Standardised category data also allows us to identify and scrutinise different operating and environmental factors that affect the amount and cost of works performed by distributors, and how these factors may change over time.
A.4 Predictive modellingPredictive modelling uses statistical analysis to determine the expected efficient
costs over the regulatory control period associated with the demand for electricity services for different categories of works. We have two predictive models:
the repex model
the augex model (used in a qualitative sense)
The use of the repex and augex models is directly relevant to assessing whether a distributor's capex forecast reasonably reflects the capex criteria.44 The models draw on actual capex incurred by a distributor during the preceding regulatory control period. This past capex is a factor that we must take into account.45
The repex model is a high-level probability based model that forecasts asset replacement capex (repex) for various asset categories based on their condition (using age as a proxy), and unit costs. In instances where we consider a distributor’s proposed repex does not conform to the capex criteria, we have used this (in combination with other techniques where appropriate) to generate a substitute forecast. 44 NER, cl. 6.5.7(c).45 NER, cl. 6.5.7(e)(5).
35 Attachment 6 – Capital expenditure | SA Power Networks' determination 2015–20
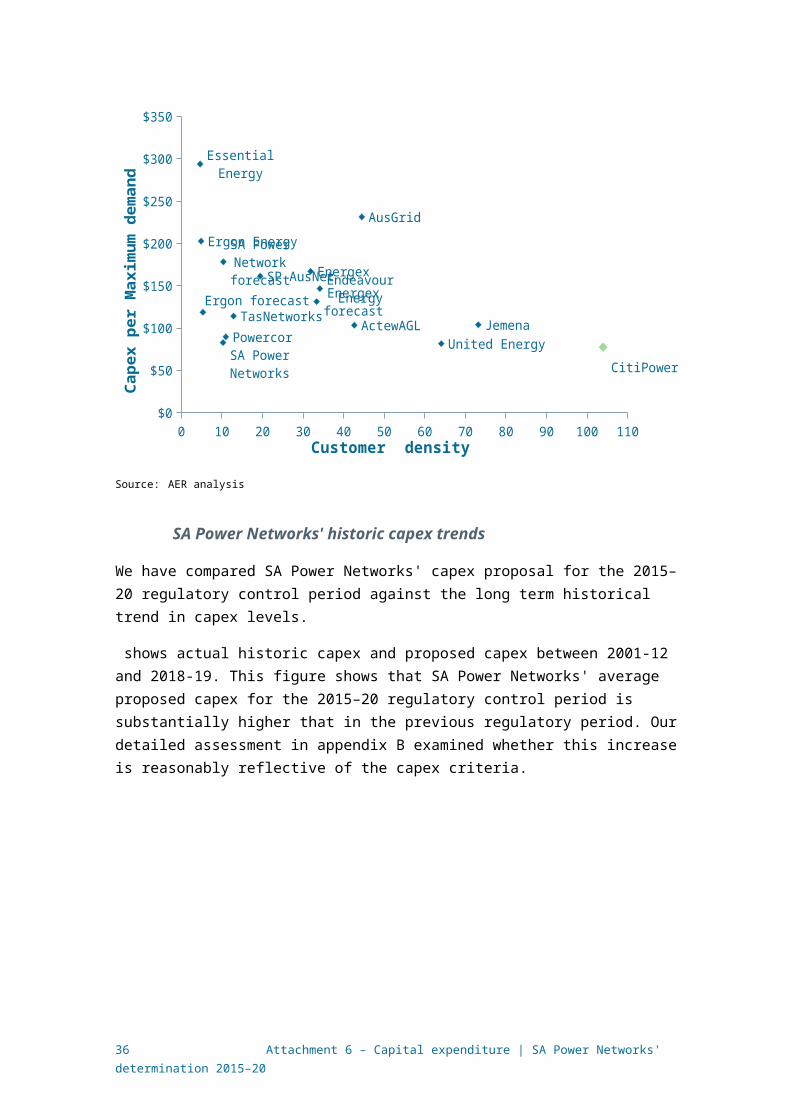
The augex model compares utilisation thresholds with forecasts of maximum demand to identify the parts of a network segment that may require augmentation.46 The model then uses capacity factors to calculate required augmentation, and unit costs to derive an augex forecast for the distributor over a given period.47 In this way, the augex model accounts for the main internal drivers of augex that may differ between distributors, namely peak demand growth and its impact on asset utilisation. We can use the augex model to identify general trends in asset utilisation over time as well as to identify outliers in a distributor's augex forecast.48 However, we have not relied heavily on the augex model for this reset. This is because SA Power Networks experienced negative demand growth and positive growth in augex in some network segments during the 2010-15 period. This resulted in the model being unable to produce reliable benchmark results from the previous period. Therefore, for this decision we have only had regard to trends in utilisation rates in a qualitative sense. We will apply the augex model to a greater degree in future determinations as we build up our dataset.
A.5 Engineering reviewWe have relied on internal engineering expertise to assist with our review of SA
Power Networks' capex proposals. This has involved reviewing SA Power Networks' processes, and specific projects and programs of work.
46 Asset utilisation is the proportion of the asset's capability under use during peak demand conditions.47 For more information, see: AER, Guidance document: AER augmentation model handbook, November48 AER, 'Meeting summary – distributor replacement and augmentation capex', Workshop 4: Category analysis
work-stream – Replacement and demand driven augmentation (Distribution), 8 March 2013, p. 1.
36 Attachment 6 – Capital expenditure | SA Power Networks' determination 2015–20

B Assessment of capex driversWe present our detailed analysis of the sub-categories of SA Power Networks'
forecast capex for the 2015–20 regulatory control period in this appendix. These sub-categories reflect the drivers of forecast capex over the 2015–20 period. These drivers are augmentation capex (augex), customer connections capex, replacement capex (repex), reliability improvement capex, capitalised overheads and non-network capex.
As we discuss in the capex attachment, we are not satisfied that SA Power Networks' proposed total forecast capex reasonably reflects the capex criteria. In this appendix we set out further analysis in support of this view. This further analysis also explains the basis for our alternative estimate of SA Power Networks total forecast capex that we are satisfied reasonably reflects the capex criteria. In coming to our views and our alternative estimate we have applied the assessment techniques that we discuss in appendix A.
This appendix sets out our findings and views on each sub-category of capex. The structure of this appendix is:
Section B.1: alternative estimate
Section B.2: forecast augex
Section B.3: forecast customer connections capex, including capital contributions
Section B.4: forecast repex
Section B.5: forecast capitalised overheads
Section B.6: forecast non-network capex
Section B.7: demand management.
In each of sections B.1 to B.7 we examine seven sub-categories of capex which we include in our alternative estimate. For each such sub-category, we explain why we are satisfied the amount of capex that we include in our alternative estimate reasonably reflects the capex criteria.
B.1 Alternative estimateHaving examined SA Power Networks' proposal, we formed a view on our alternative estimate of the capex required to reasonably reflect the capex criteria. Our alternative estimate is based on our assessment techniques, explained in section 6.3 and appendix B. Our weighting of each of these techniques, and our response to SA Power Networks submissions on the weighting should be given to particular techniques, is set out under the capex drivers in appendix B.
We are satisfied that our alternative estimate reasonably reflects the capex criteria.
37 Attachment 6 – Capital expenditure | SA Power Networks' determination 2015–20
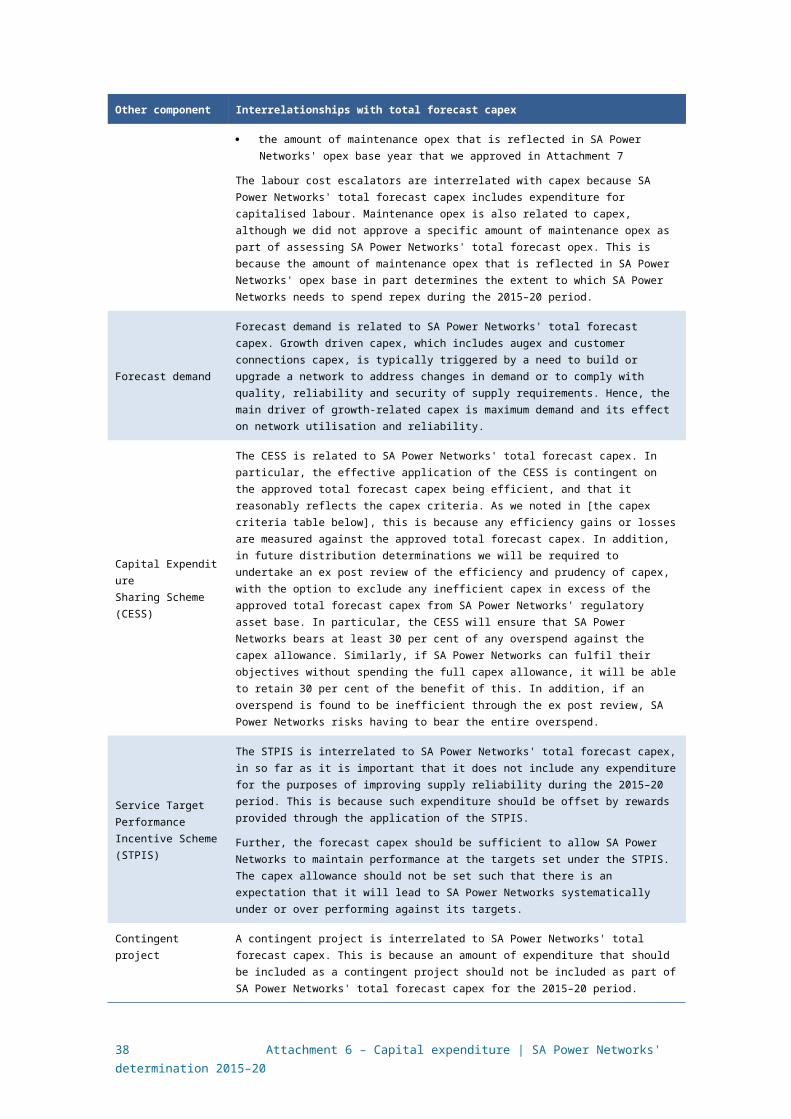
B.2 AER findings and estimates for augmentation expenditure
SA Power Networks proposed a forecast of $839.4 million ($2014–15) for augmentation capex (augex), excluding overheads. This is a 40 per cent increase compared to its actual augex in the 2010–15 regulatory control period.
Augmentation is typically triggered by the need to build or upgrade the network to address changes in demand and network utilisation. However, it can also triggered by the need to upgrade the network to comply with quality, safety, reliability and security of supply requirements. SA Power Networks' augex forecast is comprised of a number of different components, each of which is driven by a different driver for augmentation.
We do not accept SA Power Networks' proposal. We instead include an amount of $463 million ($2014–15) for forecast augex in our alternative estimate, a reduction of 45 per cent from SA Power Networks' proposal. This amount is sufficient to provide SA Power Networks with a reasonable opportunity to recover at least the efficient costs to build its network to meet demand and meet its quality, safety, reliability and security of supply requirements. We are satisfied that this amount reasonably reflects the capex criteria.
In coming to our view on the total augex forecast, we have considered each augex component as proposed by SA Power Networks and formed a view on whether it reasonably reflects the capex criteria. As part of our analysis, we applied:
trend analysis, comparing the proposed augex (and its components) with historic expenditure levels, taking into account changes in demand, network capacity, and security, safety and reliability obligations to assess whether the forecast is within a reasonable range to allow SA Power Networks to meet expected demand, and comply with relevant regulatory obligations
an engineering and economic review of major programs and projects proposed by SA Power Networks
the augex model to generate trends in asset utilisation, to assess SA Power Networks' need for demand-related network augmentation.49
Table B-7 sets out the proposed capex and our preliminary decision for each of SA Power Networks' proposed augex components.
49 The augex model has been developed to derive an estimate of required augex based on predicted augmentation requirements (based on demand and asset utilisation) and unit costs. However, we have not relied heavily on the augex model for this reset. This is because SA Power Networks experienced negative demand growth and positive growth in augex in some network segments during the 2010–15 period. This resulted in the model being unable to produce reliable benchmark results from the previous period. Therefore, for this decision we have only had regard to trends in utilisation rates in a qualitative sense. We will apply the augex model to a greater degree in future determinations as we build up our dataset.
38 Attachment 6 – Capital expenditure | SA Power Networks' determination 2015–20

Table B-7 SA Power Networks' augex forecast components and AER preliminary decision ($2014–15, million, excluding overheads)
ComponentProposed
capexPreliminary
decision AER reasons
Demand and power quality
331 311.4
We accept the proposed $186 million for network augmentation to meet localised demand growth and existing capacity constraints. This is based on our review of SA Power Networks' demand forecasts and forecast network utilisation from our augex model.
We also accept the proposed $52.7 million to remediate power quality issues across its network. However, we do not consider that SA Power Networks has provided sufficient evidence to demonstrate it will be unable to maintain power quality levels, within the 2015-20 period, without an additional $19.6 million to invest in network monitoring.
Safety
307.8 21.1
We do not accept the proposed $212.5 million for bushfire mitigation and $74.2 million for road safety. We acknowledge SA Power Networks' initiatives to review its current practices and procedures for network safety, and its efforts to engage with its customers. However, we are not satisfied that these programs are reflective of the efficient costs that a prudent operator would require to maintain the safety of the distribution system.
Strategic projects
92.9 45.2
We accept the proposed $45.2 million for the strategic project to install a second cable to Kangaroo Island. However, we do not accept the proposed strategic projects of $15.4 million to install network monitoring in select smart metres and $24.7 million for network control.
Reliability
56.4 27
We accept the proposed $27 million to maintain network reliability. However, we do not accept the additional $29.4 million to improve network reliability. We are not satisfied based on the information provided by SA Power Networks that the STPIS regime will not fund these programs over the 2015-20 period.
Environmental14.9 14.9
We accept the proposed $14.9 million for environmental capex because we are satisfied that these amounts reasonably reflect the efficient cost to comply with the applicable regulatory obligations.
Other — PLEC
44.3 44.3
We accept the proposed $44.3 million to underground power lines as part of the Power Line Environment Committee (PLEC) program because we are satisfied that these amounts reasonably reflect the efficient cost to comply with the applicable regulatory obligations.
Total 839.4 463.6
Source: AER analysis, SA Power Networks' reset RIN, SA Power Networks' response to AER SAPN 005
Note: The combined total of each augex component is $848 million, rather than $839.4 million as set out in this
table. As set out in Table 6-6, we allocated the superannuation capex item within SA Power Networks' reset
RIN balancing item across the network capex drivers. This reduces the total augex proposal to $839.4
million.
Table B-8 sets out SA Power Networks' augex proposal and our preliminary decision for each year of the 2015–20 regulatory control period. Our detailed findings are set out in the remainder of this section.
39 Attachment 6 – Capital expenditure | SA Power Networks' determination 2015–20

Table B-8 AER's alternative estimate of augex ($2014–2015, million, excluding overheads)
2015/16 2016/17 2017/18 2018/19 2019/20 Total
Proposal 142.6 176.1 185.7 174.3 160.8 839.4
AER alternative estimate 78.8 97.3 102.6 96.2 88.8 463.6
Difference 63.8 78.9 83.1 78.0 72.0 375.8
Source: AER analysis, SA Power Networks' reset RIN, SA Power Networks' response to AER SAPN 005
Note: To reach our alternative estimate for each year we first calculated our total estimate for the 2015-20 period
based on our assessment of the individual augex components within SA Power Networks' regulatory
proposal. We then allocated our total alternative estimate across year based on SA Power Networks'
allocations in the regulatory proposal.
Numbers may not add up due to rounding.
B.2.1 Demand-driven augmentation
SA Power Networks proposed a forecast of $331 million ($2014–15) for demand-driven augex (excluding overheads). As shown in Figure B-1, this is a 21 per cent decrease compared to SA Power Networks' actual demand-driven augex in the 2010–15 regulatory control period, and approximately equal to the long-term average.
Figure B-1 SA Power Networks' demand-driven capex historic actual and proposed for 2015–20 period ($2014–15, million, including overheads)
Source: SA Power Networks', Regulatory Proposal 2015-20, 31 October 2014, and historical regulatory reports
40 Attachment 6 – Capital expenditure | SA Power Networks' determination 2015–20

Note: Historical demand-driven augex is reported inclusive of overheads. The annual augex figures presented in
this chart are inclusive of overheads so that a comparison with historical augex is possible. Our assessment
of SA Power Networks' demand-driven augex forecast for 2015-20 is performed on the proposal excluding
overheads.
The major drivers of SA Power Networks' demand-driven augex proposal are $186 million ($2014-15) to augment network capacity for localised demand, greenfields growth, and existing capacity constraints, and $72.3 million ($2014-15) to address quality of supply issues as a result of existing demand (e.g. voltage fluctuations). The remaining augex is for a number of small projects relating to security, land and easements, and compliance requirements.
We do not accept SA Power Networks' proposed $331 million ($2014–15) forecast and instead include $311.4 million ($2014–15) in our alternative estimate. In coming to this view, we have assessed the two largest drivers of the demand augex proposal, as set out below.
Forecast demand growth and capacity constraints
SA Power Networks proposed $186 million ($2014–15) for network augmentation in response to localised demand growth and existing capacity constraints on its network.50 SA Power Networks stated that demand-driven capex is forecast to be similar to the current regulatory period because system-wide demand is forecast to remain relatively flat.51 Network augmentation will be driven localised areas of growth, such as the northern and southern suburbs of Adelaide.52
We have assessed SA Power Networks' demand-driven augex based on forecast trends in maximum demand and network utilisation as these are the key drivers of augmentation. As outlined in Appendix C, the available evidence points to flat peak demand growth for this period.
This forecast for flat peak demand growth follows declining demand in the previous period. Consistent with this fall in demand, our analysis highlights a decline in network utilisation between 2009–10 and 2013–14. Network utilisation is a measure of the installed network capacity that is in use (or is forecast to be). Where utilisation rates are shown to be declining over time, it is expected that total augex requirements would similarly fall.
Figure B-2 shows that a large number of zone substations decreased in utilisation between 2009–10 and 2013–14, including a substantial decrease in highly utilised substations.
50 This includes $94.6 million for general demand growth, $24.8 million for greenfields growth and $66.6 million for augmentation to address existing capacity constraints (excluding overheads).
51 SA Power Networks, Regulatory Proposal 2015-20, 31 October 2014, p. 217.52 SA Power Networks, Regulatory Proposal 2015-20, 31 October 2014, p. 217.
41 Attachment 6 – Capital expenditure | SA Power Networks' determination 2015–20

Figure B-2 Zone substation utilisation 2009-10 and 2013-14
Source: AER analysis; augex model, SA Power Networks' reset RIN
Note: Utilisation is the ratio of maximum demand and the normal cyclic rating of each substation for the specified
years.53 Figure B-2 shows the number of SA Power Networks' total zone substations at each utilisation band.
While system-wide demand is forecast to be flat over the 2015–20 period, SA Power Networks' proposed augmentation of some substations is necessary as they reach capacity due to forecast localised demand growth. SA Power Networks also proposed that new substations are required to meet demand in new housing estates.
Figure B-3 shows forecast zone substation utilisation for the 2015–20 period based on forecast demand at each substation and existing levels of capacity. This figure shows that the number of substations with relatively high levels of utilisation (e.g. between 60 and 90 per cent utilised) are expected to grow over the 2015–20 period. While this growth is not significant, it suggests that some levels of augmentation capex is required to alleviate forecast capacity constraints in the network over 2015–20.
53 Normal cyclic rating is the maximum peak loading based on a given daily load cycle that a substation can supply each day of its life under normal conditions resulting in a normal rate of wear.
42 Attachment 6 – Capital expenditure | SA Power Networks' determination 2015–20

Figure B-3 Zone substation forecast utilisation 2014-15 to 2019-20
Source: AER analysis, augex model, SA Power Networks' reset RIN
Notes: Utilisation is the ratio of maximum demand and the thermal rating of each feeder for the specified years.
Forecast utilisation in this figure is based on forecast weather corrected 50% POE maximum demand at
each substation and existing capacity without additional augmentation over 2015-20.
SA Power Networks identified the specific substations that it proposes to augment in the 2015–20 period. SA Power Networks' proposed major projects to augment the Campbelltown, Clare and Aldinga substations.54 We have reviewed the forecast utilisation at these substations to assess whether augmentation is prudent based on alleviating capacity constraints.
Table B-9 below shows the forecast utilisation (without augmentation) for the Campbelltown, Clare and Aldinga substations over the 2015–20 regulatory control period. These show that utilisation is proposed to increase over the period for each substation towards higher levels of utilisation, supporting the need for some augmentation.
Table B-9 Utilisation of sample of zone substations to be augmented
Substation 2014/15 2015/16 2016/17 2017/18 2018/19
Clare 0.79 0.79 0.80 0.80 0.80
54 SA Power Networks, Regulatory Proposal 2015-20, 31 October 2014, p. 217
43 Attachment 6 – Capital expenditure | SA Power Networks' determination 2015–20

Campbelltown 0.80 0.81 0.82 0.83 0.85
Aldinga 0.51 0.54 0.56 0.58 0.61
Source: AER analysis, SA Power Networks' reset RIN
The augmentation of the Aldinga substation is based on a forecast overloading of 'contingent' capacity rather than normal available capacity at this substation.55 Also, two of the four 11kV feeders supplied from this site are forecast to be overloaded by 2020, with the remaining two feeders forecast to become overloaded in 2021 and 2023, respectively. On this basis, SA Power Networks considers that the construction of a new substation at Maslin Beach is necessary to alleviate these forecast constraints at the Aldinga substation.
Based on the forecast trends in network utilisation discussed above, we consider that SA Power Networks' proposed demand-driven augex forecast is reasonably explained by the need to meet expected localised demand growth and alleviate forecast capacity constraints. We accept the proposed $186 million ($2014–15) forecast for network augmentation and will include it in our substitute estimate of total capex.
Quality of supply
SA Power Networks proposed $72.3 million ($2014–15) to address quality of supply constraints on its low voltage network (excluding overheads). Of this amount, SA Power Networks proposed:
$52.7 million to address forecast power quality issues using traditional techniques in response to customer complaints (as set out below)
$19.6 million to install monitors on its network to improve capacity planning and power quality management in rural areas of the network in the context of projected increases in solar system installations.56
Power quality issues are driven primarily by voltage fluctuations across the network. SA Power Networks submit that the rapid growth of solar panels in South Australia in the 2010–15 period drove an increasing number of 'two way' power flows across the low voltage network, leading to high-voltage fluctuations.57 SA Power Networks forecasts a doubling in the uptake of solar panels in South Australia by 2020 and considers that improved voltage regulation is required to prevent widespread customer power quality issues.58
55 SA Power Networks, Distribution System Planning Report, October 2014, p. 150.56 In particular, SA Power Networks propose to install monitors at low voltage transformers, SWER lines and
substations.57 High voltage fluctuations can occur when solar panels feed electricity into the distribution network and cause
localised increases in voltage levels on the low voltage network (sometimes above acceptable limits). 58 SA Power Networks, Regulatory Proposal 2015-20, 31 October 2014, p. 215.
44 Attachment 6 – Capital expenditure | SA Power Networks' determination 2015–20

We do not accept SA Power Networks' proposed $72.3 million ($2014–15) forecast and have instead included $52.7 million ($2014–15) in our alternative estimate. In coming to this view, we considered that:
SA Power Networks' projected doubling of solar panel connections by 2020 is likely overstated based on a comparison to AEMO’s independent forecast of South Australian solar generation by 2020. AEMO is currently preparing updated solar generation forecasts for South Australia as part of its National Electricity Forecasting Report for 2015. We expect SA Power Networks to take AEMO's most recent forecasts into account when preparing its submission on the revocation and substitution of our preliminary decision.
Through the use of traditional reactive techniques, SA Power Networks was able to effectively respond to a rapid increase in high-voltage problems over the 2010–15 period. SA Power Networks has not demonstrated that it will be unable to effectively and efficiently manage power quality issues using traditional industry standard approaches, without network monitoring.
Our alternative estimate of $52.7 million ($2014–15) will allow SA Power Networks to maintain power quality using existing approaches that have proven to be effective. While power quality issues will likely remain (as forecast by SA Power Networks), given the uncertainty surrounding the forecasting of future solar installations we consider that it is prudent to adopt a ‘wait and see’ approach rather than provide an additional $19.6 million ($2014–15) capex for network monitoring. This will allow SA Power Networks to consider the actual quantum and impact of additional solar panel installation on power quality problems, and its ability to manage these problems using existing industry standard approaches.
Forecast increases in solar panel installations
As noted, the key driver of this two-way network capex is SA Power Networks' expectation that solar panel installation will double by 2020 to 40 per cent network penetration.
AEMO provides an independent forecast of solar panel generation in South Australia in its South Australian Electricity Report published in August 2014.59 We have compared AEMO’s forecast of solar generation with SA Power Networks' forecast doubling of solar installations by 2020. While trends in generation and connections are not necessarily identical (as solar installations can differ based on capacity installed) any increase in solar generation will likely be driven by increases in the number of solar generators from new installations.
AEMO's forecasts an increase in solar generation of 70 per cent by 2020.60 While this translates into an increase in the number of solar connections, it does indicate that SA Power Networks' forecast of a 100 per cent increase in solar connections may be overestimated by 30 per cent. However, it is still reasonable to assume that there will be some increases in high-voltage issues associated with the increase in solar panel installations over the 2015–20 regulatory control period.59 AEMO, South Australian Electricity Report, August 2014.60 AEMO, South Australian Electricity Report, August 2014, pp. 18-20.
45 Attachment 6 – Capital expenditure | SA Power Networks' determination 2015–20
AEMO is currently preparing its National Electricity Forecasting Report 2015, which will be published in June 2015. As part of this report, AEMO will prepare updated forecasts for solar generation for each region of the NEM, including South Australia. Given the differences between SA Power Networks and AEMO’s existing solar forecasts for 2015–10, we consider that it is prudent to consider these forecasts when we make our decision on the revocation and substitution of this preliminary determination.
Managing power quality complaints
SA Power Networks currently manages power quality by relying on customer complaints of localised power quality problems. In response to customer complaints, SA Power Networks identifies the nature of the issue and upgrades distribution transformers, HV or LV mains, and voltage regulators. These are industry standard approaches to managing power quality. SA Power Networks submits that this reactive approach is effective and efficient to manage the historically small number and nature of the issues.
SA Power Networks proposed $52.7 million ($2014–15) capex over 2015–20 to manage power quality issues based on its traditional reactive approach. SA Power Networks estimates the same number of power quality complaints and remediation projects over 2015–20 and has not forecast any additional capex from the current period to address power quality issues.
Figure B-4 shows the annual number of customer complaints by power quality issue over the current period. This shows that the number of high-voltage complaints increased over the 2010–13 period due to the rapid growth in solar panel installation, and then decreased in 2013–14. The number of lower-voltage complaints and flickering decreased over the period.
46 Attachment 6 – Capital expenditure | SA Power Networks' determination 2015–20

Figure B-4 SA Power Networks' power quality complaints 2009–10 and 2013−14
Source: AER analysis, SA Power Networks' response to AER SAPN015
SA Power Networks considers that it will be unable to rely on a purely reactive approach without network monitoring if the number of high-voltage issues increases based on projects growth in solar installations.61 In support of its proposal, SA Power Networks references a report by Power Systems Consulting (PSC) which found that for some older areas of the low voltage network, infrastructure and voltage regulation limit acceptable solar panel penetration to around 25 per cent of customers before voltage regulation issues emerge.62 Based on the projected increase in solar connections over 2015–20, SA Power Networks expects that particular areas of the network where solar panel penetration will exceed 25 per cent will increase.
We have carefully reviewed the findings of the PSC report and SA Power Networks' proposal. While the PSC report finds that some minimal power quality issues are likely to arise through additional growth in solar panel installations in older areas of the network, in our view the report generally finds these could be managed using generally accepted responses typical in the industry and currently adopted by SA Power Networks (e.g. retaping distribution transformers, management of float voltages, targeted augmentation).63 We consider that the report does not identify specific issues that are likely to adversely impact on power quality performance or arise from two-way power flow which cannot be reasonably addressed through current strategies and expenditures.
61 SA Power Networks, Regulatory Proposal 2015-20, 31 October 2014, p. 215.62 Power Systems Consulting, Impact of distributed energy resources on quality of supply, May 2014, p. 6
(Attachment 13.2 of SA Power Networks, Regulatory Proposal 2015-20, 31 October 2014).63 Power Systems Consulting, Impact of distributed energy resources on quality of supply, May 2014, p. 6.
47 Attachment 6 – Capital expenditure | SA Power Networks' determination 2015–20

Further, through the use of traditional reactive techniques, SA Power Networks was able to effectively respond to a rapid increase in high-voltage problems over the 2010–13 period. Given the downwards movement in high-voltage problems in 2013–14, and the uncertainty about the projected increase in solar panel installations, it is not clear that there will be a rapid increase in high-voltage problems above what SA Power Networks has already managed. Based on the information available to us, SA Power Networks has not sufficiently justified why additional expenditure over and above using its traditional reactive approach would be in the long term interests of consumers
While power quality issues will likely remain (as forecast by SA Power Networks), given the uncertainty surrounding the forecasting of future solar installations, we consider that there is insufficient evidence that investing in network monitoring in 2015–20 is prudent and efficient. While we support innovation and new technology that allows a business to more efficiently and effectively maintain service levels, we consider that it is more prudent to adopt a 'wait and see' approach which will allow SA Power Networks to consider the actual quantum and impact of additional solar panel installation on power quality problems, and its ability to manage these problems using existing industry standard approaches. Therefore we have not included the additional $19.6 million ($2014–15) capex for network monitoring in our alternative estimate.
B.2.2 Safety-related augmentation
SA Power Networks proposed a forecast of $307.8 million ($2014–15) for safety-related augex (excluding overheads). This is driven primarily by two new safety programs for the 2015–20 period — a bushfire mitigation program, and a road-safety program.
SA Power Networks submits that these proposed investments are supported by the results of customer willingness-to-pay studies that show that SA Power Networks' customers support and are willing to pay for these investments through their electricity bills. We commissioned consultants Oakley Greenwood to review SA Power Networks' willingness-to-pay study.64 We consider its findings it the specific sections below.
We do not accept SA Power Networks' proposed $307.8 million ($2014–15) forecast and have instead included $21.1 million ($2014–15) in our alternative estimate. In coming to this view, we have assessed the proposed bushfire and road safety capex proposals. Based on our assessment, we find that the proposed capex for the bushfire and road-safety programs do not reasonably reflect the capex objectives and therefore we have not included the proposed capex in our alternative estimate of SA Power Networks' capex requirements.
Our assessment of these two programs is contained is contained in the sections below.
Bushfire mitigation
64 Oakley Greenwood, , April 2015.
48 Attachment 6 – Capital expenditure | SA Power Networks' determination 2015–20
SA Power Networks has proposed forecast capex of $212.5 million ($2014–15) for a bushfire mitigation program for the 2015–20 regulatory control period, excluding overheads. This proposed capex amount for the program is incremental to SA Power Networks’ business as usual capex and opex related to bushfire risk management. Table B-10 sets out the proposed components of the program.
Table B-10 SA Power Networks' proposed capex for a bushfire mitigation program ($2014–15, million, including overheads)
Strategy Proposed capex
Replace aged manual 33kV, 19kV and 11kV reclosers with fast-operating SCADA controlled units 17.9
Replace high risk power lines with modern construction (Bushfire Safer Places) 26.6
Replace high risk power lines with modern construction (targeted undergrounding supported by willingness-to-pay findings) 102
Replace road air gaps and current limiting arc horns with surge arrestors 12.3
Undertake field simulation, testing and trial installation of Ground Fault Neutralisation Technology 11.9
Reconstruct metered mains 32.7
Backup protection 18.4
Total 221.7
Source: Jacobs, Recommended Bushfire Risk Reduction Strategies for SA Power Networks, Final Report, October
2014; AER, Information request AER SAPN035, 12 March 2015, p. 7-8.
Based on the evidence submitted by SA Power Networks and other information before us, we are not satisfied that the bushfire mitigation program is required to maintain the reliability and safety of the network and would be a prudent and efficient investment in the network. As such, we do not accept SA Power Networks’ capex proposal to spend $212.7 million ($2014-15, excluding overheads) on a bushfire mitigation program. SA Power Networks’ regulatory proposal, and our alternative estimate, already factor in expenditure related to SA Power Networks’ business as usual bushfire risk management.
We acknowledge SA Power Networks’ initiatives to date in reviewing its current practices and procedures for bushfire risk management following the release of the recommendations of the Victorian Bushfire Royal Commission (VBRC) and the strategies proposed by the Powerline Bushfire Safety Taskforce (PBST). We also note SA Power Networks’ efforts to engage with its customers to identify and determine preferences on the undergrounding aspects of the program. However, our evaluation also takes into consideration submissions received from other stakeholders that were not supportive of the program and which queried the cost to consumers and other information. These submissions supported our finding that SA Power Networks has not properly evaluated the program costs or shown that the nature and scope of the
49 Attachment 6 – Capital expenditure | SA Power Networks' determination 2015–20
program reasonably reflects what a prudent and efficient distributor would require to achieve the capex objectives.
It is open to SA Power Networks in its revised proposal to address the issues raised in this preliminary decision and provide the necessary supporting material to show that its proposed capex for the bushfire mitigation program satisfies the capex criteria, and would be in the long term interests of consumers.
We note, in our reasons below, the specific areas where sufficient supporting material was not provided or the evidence submitted did not reasonably demonstrate the program satisfied the criteria.
In summary, we consider that:
SA Power Networks’ proposed capex is not required to maintain the reliability and safety of its network.
SA Power Networks has not provided sufficient evidence of increased bushfire risk from ignition by power lines in SA. There has also been no change to regulations and/or safety standards related to bushfire risk that would justify additional expenditure.
SA Power Networks’ proposed capex is not a prudent and efficient investment.
SA Power Networks have not undertaken a cost benefit analysis of the program. SA Power Networks’ business case is qualitative and other supporting material it has provided does not properly evaluate the costs versus the benefits of the program. This includes information it provided on consumers’ willingness-to-pay for undergrounding powerlines in High Bushfire Risk Areas (HBRAs).
For these reasons, we do not accept SA Power Networks’ proposed capex for the bushfire mitigation program satisfies the capex criteria. Each of these reasons is discussed further below.
We also undertook a preliminary analysis of some of the costs and the benefits of the program in order to cross check our conclusions. Our preliminary analysis based on the limited information before us, suggests that the costs of the proposed bushfire mitigation program outweighs the calculated benefits. Our preliminary analysis is based on confidential material, and is set out in more detail in the capex confidential appendix.
We also note that there are alternative funding options for the program, namely as a Power Line Environment Committee (PLEC) project, and this would likely involve a more consultative, collaborative approach then what was taken in developing SA Power Networks’ current proposal. SA Power Networks is required to fund undergrounding work for PLEC projects on an annual basis where this is considered justified under the PLEC provisions. The AER considers that there is scope for SA Power Networks to pursue the undergrounding aspects of the bushfire mitigation program as a PLEC project.
In addition, if during the 2015–20 regulatory period, there is a regulatory change that reflects new industry standards, then the NER provides that distributors can apply to us
50 Attachment 6 – Capital expenditure | SA Power Networks' determination 2015–20
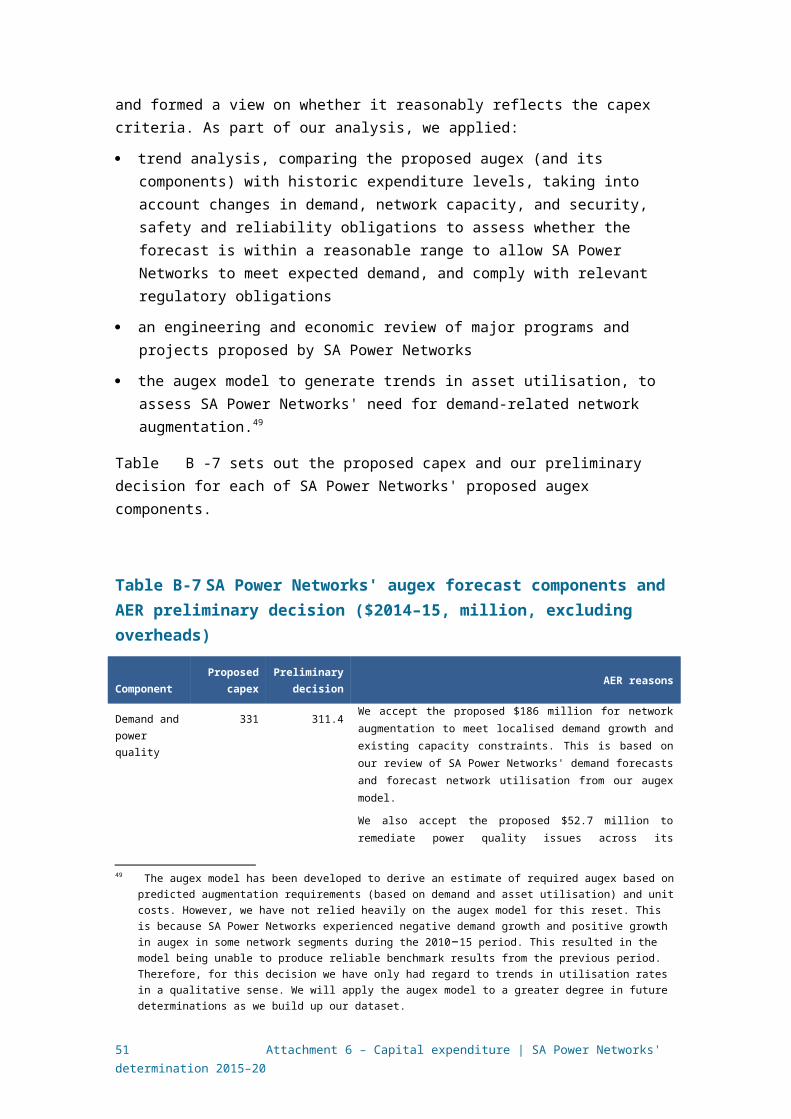
to pass through costs associated with such a change. In this way, SA Power Networks would be able to apply to recover the costs of complying with any new obligations as soon as they come into effect. We note that this occurred with some new standards that were introduced in Victoria as a result of the outcomes from the VBRC recommendations and the PBST’s strategies.65
Reliability and safety of the network
SA Power Networks submits that the proposed capex for the bushfire mitigation program is in addition to capex proposed for routine capex and opex for bushfire and non-bush fire risk areas. In support of the program, SA Power Networks submits that the risk of bushfire ignition by power lines is increasing and that the VBRC and PBST have set an industry standard for bushfire management.
In support of its view that the risk from bushfire ignition is increasing, SA Power Networks submitted reports from the CSIRO and the Bureau of Meteorology (BoM) which analyse the climatic trends in Australia, South Australia and the SA Power Networks coverage area.66 BoM and the CSIRO’s climate trends show that extreme hot temperatures in Australia are expected to increase, especially in SA over the next 5 to 10 years. BoM’s analysis also shows that the number of fire danger days in summer has increased between 1.7 and 2.5 times since 2000 in SA’s high risk bush fire areas, with this increase likely to remain or increase over the next 5 to 10 year timeframe.67
While the BoM and the CSIRO analyses submitted by SA Power Networks forecast increasing fire danger days in summer, SA Power Networks has not provided any analysis that correlates this increase to an increase in the likelihood of a bush fire ignition from an electricity asset. Without evidence of such a linkage, we consider that it is not possible to conclude from the CSIRO and BoM reports alone that there is an increased risk of bushfires from electricity assets in SA.
SA Power Networks engaged Jacobs to recommend bush fire reduction strategies based on a review of, amongst other considerations, the VBRC and PBST’s findings, and SA Power Networks’ current practices and procedures for bushfire risk management.68 Jacobs recommended a package of works totalling $135.6 million ($2014–15) – about $86.1 million less than SA Power Networks’ proposed capex of $212.5 million for the program. The difference is mostly due to the SA Power Networks bushfire mitigation program including $102 million ($2014–15) for the undergrounding portion of the program, which SA Power Networks has justified on the basis of the findings of the WTP survey.69 We note the submission from SA Treasury which questions the reasons for the additional capex SA Power Networks has proposed on
65 2009 Victorian Bushfires Royal Commission, Final Report – Summary, July 2010; Powerline Bushfire Safety Taskforce, 30 September 2011.
66 CSIRO and Bureau of Meteorology, State of the Climate 2014, 2014; Bureau of Meteorology (BOM), Climate extremes analysis for South Australian Power Network operations, 2014.
67 Bureau of Meteorology (BoM), Climate extremes analysis for South Australian Power Network operations, 2014, p. 4.
68 Jacobs, Recommended Bushfire Risk Reduction Strategies for SA Power Networks, Final Report, October 2014.69 Note that the Jacobs report also recommended $15.6 million of opex. The $102 million is in addition to Jacobs
recommended $26.6 million to underground portions of the main power lines located in HBFRAs that supply targeted Bushfire Safer Places (BSP).
51 Attachment 6 – Capital expenditure | SA Power Networks' determination 2015–20

top of Jacobs’ recommended package. SA Treasury submitted that the Jacob’s report recommended a lower cost undergrounding option than what SA Power Networks has in its program. 70 The Energy Consumers Coalition of SA (ECCSA) also questioned whether more cost effective options were considered by SA Power Networks.71
In their report, Jacobs considered SA Power Networks’ compliance against Jacobs’ view of good industry practice and concluded that it would be ‘prudent for SA Power Networks to implement additional risk mitigation strategies’. This conclusion by Jacobs was based on the findings of the VBRC and the resulting PBST. In particular: 72
The VBRC’s call for a ‘material reduction in the risk of bushfire caused by the failure of electrical assets’ – Jacobs view is that a ‘similar expectation is likely to apply within South Australia’
Initiatives identified by the PBST that Jacobs’ considered applicable to South Australia and ‘likely to now be considered as good industry practice within Australia’
Community expectation that network bushfire starts are preventable.
In arriving at its conclusion that additional risk mitigation strategies would be prudent, Jacobs has not demonstrated that similar expectations of the need for reduced bushfire starts are reasonably likely to exist in South Australia. Similarly, Jacobs provided no information to demonstrate that the South Australian community expectations regarding bushfire starts have altered.
Further, while Jacobs submit that some of the PBST initiatives may now be considered as good industry practice, it offered no information to reasonably demonstrate that in SA Power Networks’ circumstances it would be prudent to adopt these practices, nor that these practices would be the efficient option in addressing SA Power Networks’ bushfire management needs. It has also submitted no evidence to reasonably demonstrate that SA Power Networks’ current or expected future performance over the 2015–20 regulatory period does or would not comply with its obligations.
We therefore consider that the Jacobs report does not sufficiently support that its recommended package of works is required for SA Power Networks to comply with its current or expected future safety obligations related to bushfire risk and that its proposed level of investment is prudent and efficient.
The evidence before us indicates that SA Power Networks is meeting its existing obligations. SA Power Networks argues in various parts of its submission that historically their bushfire risk management has been effective.73 As noted by SA Power Networks, it has a ‘comprehensive and mature Bushfire Risk Management System (BRMS) ...’. This system has been in place since the early 1980s after investigations into the impacts of the 1983 Ash Wednesday fires in South Australia and has been
70 SA Treasury, Government of South Australia’s Submissions to the Australian Energy Regulatory on the SA Power Network’s Regulatory Proposal 2015-20, p. 3.
71 Energy Consumers Coalition of SA (ECCSA), A response by the Energy Consumers Coalition of SA, December 2014, p. 37.
72 Jacobs, October 2014, Recommended bushfire risk reduction strategies for SA Power Networks, p, 33.73 SA Power Networks, SA Power Networks: Bushfire Mitigation Programs Business Case, October 2014, p. 13.
52 Attachment 6 – Capital expenditure | SA Power Networks' determination 2015–20

progressively improved since. 74 The Office of the Technical Regulator has also confirmed that SA Power Networks currently satisfy existing regulations and standards relating to managing bushfires.75 We therefore consider that incremental capex for a bushfire mitigation program which is additional to other proposed capex and opex for bushfire risk management is not justified in the absence of compelling evidence that SA Power Networks’ current practices and procedures relating to managing bushfires are insufficient.
It is relevant to note that in SA, several legislative amendments relating to bush fire safety were made as a consequence of the Ash Wednesday bushfire in 1983. In particular, SA is the only state that has legislated the authority to the electricity entity to turn off the power in extreme bush fire weather, which further reduces the risk of bushfire starts from network assets.76 The VBRC and PBST recommendations made a similar recommendation for Victoria, but this was not accepted by the Victorian jurisdiction. In addition, we note it would be desirable if the issues raised by SA Power Networks and Jacobs about appropriate changes to bushfire mitigation obligations were considered by the appropriate technical and safety authorities in South Australia with a view to whether formal changes to South Australian requirements were necessary.
In reaching our conclusion, we have also taken into account the interrelationship between this proposed expenditure and other expenditure proposed by SA Power Networks. In addition to SA Power Networks’ proposed capex for this bushfire mitigation program and SA Power Networks’ business as usual level of capex and opex to manage bushfires, SA Power Networks is proposing a number of other expenditure increases that are likely to have a positive impact on bushfire risk reduction. In particular, the AER’s preliminary decision includes a repex component for the 2015–20 regulatory control period that is higher than SA Power Networks’ historical repex from the last period. This should enable SA Power Networks to engage in additional safety related work. This additional proposed expenditure will be included in SA Power Networks’ revenue allowance and therefore is likely to contribute to the management of SA Power Networks’ existing bushfire risk. This further supports the AER's position that SA Power Networks’ proposed incremental capex for a bushfire mitigation program to maintain the safety and reliability of the network has not been justified.
Prudent and efficient investment criteria
SA Power Networks submitted a business case that does not include the expenditure in undergrounding powerlines in High Bush Fire Areas (HBRAs). 77 In support for the undergrounding of power lines in High Bush Fire Areas (HBRAs), SA Power Networks has relied on a Willingness-To-Pay (WTP) survey conducted by NTF Group (NTF) and its findings to support a proposed capex of $128.6 million ($2014–15) for the undergrounding aspect of the bushfire mitigation program.
74 SA Power Networks, SA Power Networks: Bushfire Mitigation Programs Business Case, October 2014, p. 13. 75 File note of conversation with a representative from the Office of the Technical Regulator, 24 February 2015. 76 Electricity Act, section 53 (1 )and (2).77 SA Power Networks, SA Power Networks: Bushfire Mitigation Programs Business Case, October 2014.
53 Attachment 6 – Capital expenditure | SA Power Networks' determination 2015–20

We consider that the business case and the WTP survey and its findings do not demonstrate that the bushfire mitigation program is a prudent and efficient investment. In addition to our own assessment of the WTP survey and its findings, we were informed by Oakley Greenwood’s peer review of the survey and its findings.78 Our specific consideration of the WTP survey and its findings is discussed later in this section.
In terms of SA Power Networks’ business case for the bushfire mitigation program (that excludes the expenditure on undergrounding powerlines in HBRAs), SA Power Networks does not show that the proposed investment has an economic benefit.
SA Power Networks’ business case is qualitative and other supporting material it has provided does not properly identify and measure the costs and the benefits of the program as is typically required in a cost benefit analysis. We note that a properly constructed cost-benefit analysis would typically identify and measure (including probabilities of an event occurring) all incremental costs and benefits in dollar terms so that in choosing different options/scenarios (which includes the business as usual case, as well as a number of other program options), the one that maximises net benefits is chosen. Generally, an appropriate discount rate is applied to future cash flows to calculate the net present value of all options/scenarios.
SA Power Networks expresses uncertainty regarding the benefits from the proposed additional investment in comparison with that achieved from the current business as usual expenditure levels when it states that the ‘… financial benefits of implementing this program of work are difficult to express in monetary terms as it is difficult to quantify precisely the level of fire start risk reduction that will be achieved over the do nothing option.’79
SA Power Networks also submitted a report by Willis which details the estimated Maximum Probable Loss (MPL) that Willis derived from its modelling of SA Power Networks bushfire risk. MPL is an insurance industry term that reflects the largest loss that could reasonably be anticipated from a disaster such as a bushfire. Therefore, MPL is an estimate of the monetised consequence of a realistic maximum probable loss scenario. The Willis report estimates the MPL but does not account for the probability of such an occurrence – that is, it is focused on consequences as opposed to the frequency of scenarios.80 As the probability or frequency of a bushfire event is not taken into account in the Willis report, it does not present any information that demonstrates the case for additional investment by SA Power Networks for bushfire mitigation to that it already incurs, nor does it demonstrate that SA Power Networks’ current or expected performance needs to be improved.
We therefore consider that SA Power Networks has not reasonably demonstrated that the proposed incremental capex for the bushfire mitigation program is a prudent and efficient capital investment. With the limited information before us, we also undertook a preliminary analysis of the costs and the benefits of the program to cross check our
78 Oakley Greenwood, Peer review of the willingness to pay research submitted by SA Power Networks, April 2015.79 SA Power Networks, SA Power Networks: Bushfire Mitigation Programs Business Case, October 2014, p. 35.80 Willis Risk Services, December 2013, “SA Power Networks Limited Bushfire Modelling”, Attachment 11.3a, p. 11.
54 Attachment 6 – Capital expenditure | SA Power Networks' determination 2015–20
conclusion that the proposed program is not prudent and efficient.81 In summary, this preliminary analysis shows that as the estimated frequencies of recurrence (probability of the event) are very low (very rare events) for the MPL estimates provided, the annualised expected cost to avoid such events (expected benefits) is not significant. Further, as SA Power Networks’ proposed investment of $212.5 million ($2014–15) could not fully eliminate the bushfire risk, the benefit of this investment in terms of avoiding the cost of this risk will be even less than this annualised estimate.
Consumer support for the program
SA Power Networks submits that its proposed capex of $128.6 million ($2014–15) for undergrounding power lines in High Bushfire Risk Areas (HBRAs) is supported by NTF’s WTP findings that the majority of customers (around 63 per cent) would be willing to pay, along with 2.5 per cent tree removal and replacement, approximately $12 per annum.82
We acknowledge SA Power Networks’ initiative to engage with its consumers through its consumer engagement program and WTP survey. Submissions such as from the ECCSA note the SA Power Networks’ consumer engagement program is an improvement from its previous efforts.83 The South Australian Council of Social Service (SACOSS) also submits that it supports the emphasis on consumer engagement and sees the testing of willingness-to-pay as an important part of that engagement.84
SA Power Networks submits that the WTP research shows the majority of consumers support undergrounding. These findings are not supported by the nine submissions we received that criticised some aspects of the WTP survey and SA Power Networks’ reliance on its findings to support the proposed expenditure. For instance, the Energy Users Association of Australia and Business SA note that there was very limited participation by business consumers in the survey and therefore the survey was not representative of SA Power Networks' customers' views.85 Five of the nine submissions which commented on SA Power Networks’ proposed expenditure on the bushfire program did not support the bushfire mitigation program. For instance, the Consumer Challenge Panel (CCP) submits that ‘We accept it is important for SA Power Networks to carefully consider the findings of the Victorian Bushfire Committees. However, we do strongly suggest that the safe management of assets and vegetation should be part of the standard, ongoing operations of the relevant NSPs and should not generally require significant additional funding over historical “business as usual funding” unless there is a legislative change.’86
81 See confidential appendix.82 The NTF Group, SAPN Targeted Willingness to Pay Research – Research Findings, July 2014, p. 16.83 Energy Consumers Coalition of SA (ECCSA), A response by the Energy Consumers Coalition of SA, December
2014, p. 22.84 SACOSS, SACOSS Submission to the Australian Energy Regulator on SA Power Networks’ 2015-20 Regulatory
Proposal, January 2015, p. 3.85 Energy Users Association of Australia, Submission to SA Power Networks Revenue Proposal (2015-2020), 30
January 2015, pp.14-16; Business SA, SA Power Networks Regulatory Proposal 2015-2, January 2015, p. 20. 86 Consumer Challenge Panel 2, Submission by the Consumer Challenge Panel 2 to the AER in response to SA
Power Networks Regulatory Proposal for 2015-20, p. 42.
55 Attachment 6 – Capital expenditure | SA Power Networks' determination 2015–20
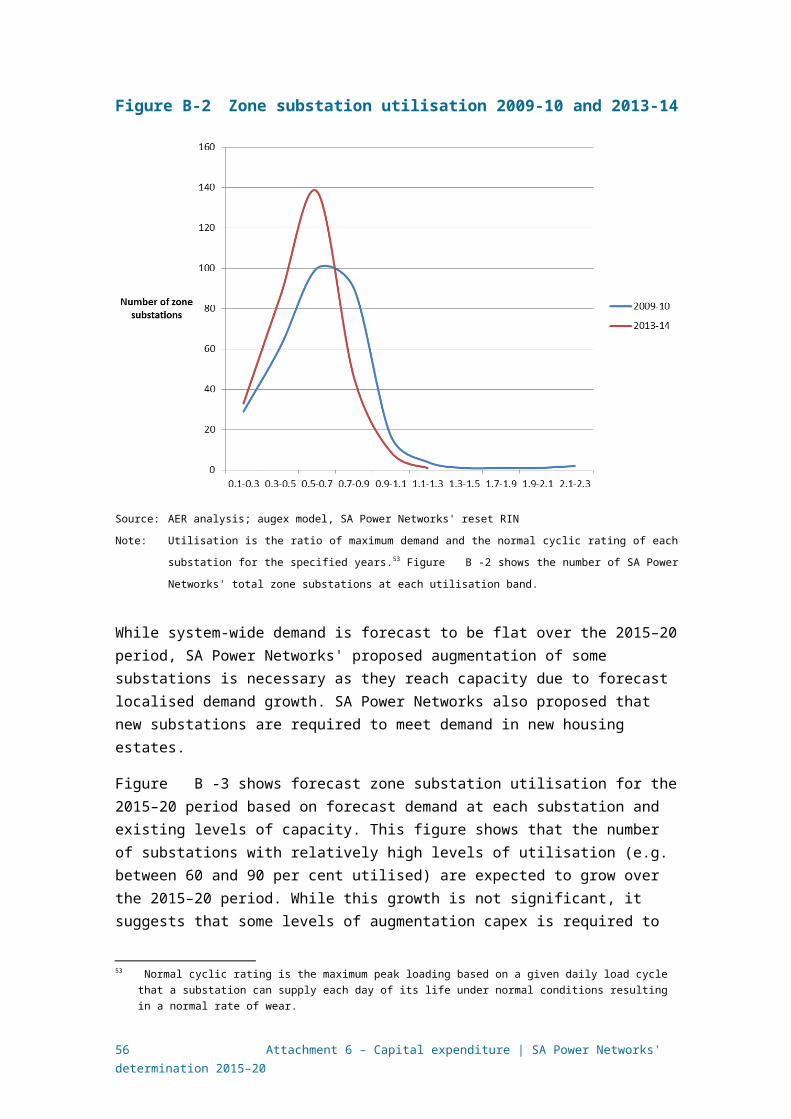
Upon reviewing the information submitted by SA Power Networks on the design, methodology and results of the WTP survey we consider that:
the WTP survey has not been based on a well-represented sample of SA Power Networks’ customer base. This is important given that all SA Power Networks customers would be expected to contribute to the cost of undergrounding powerlines in HBRAs
the way that the survey was presented to survey participants may have influenced their willingness to pay for undergrounding power lines. Information was also lacking around how survey participants would be affected by the cost of the undergrounding program. If survey participants are not adequately informed as to the outcome of possible choices in a WTP survey, the findings are less likely to reflect customers’ views as to their willingness-to-pay.
We also note the findings from Oakley Greenwood’s peer review of the WTP survey, including that the survey commissioned by SA Power Networks was relatively narrowly focussed, and that survey scope could have been widened to include other service improvements consumers' value. They also consider that a different approach could have been applied in choosing the most preferred service offering – Oakley Greenwood’s preferred approach would take account of the effect on all customers given that all customers would be expected to pay for the improved service offering.
Given the above concerns, while we have taken into account the consumer engagement results reported by SA Power Networks, we have placed limited weight on them in coming to our position.
On the issue of the WTP survey lacking representation of SA Power Networks’ customer base, we note that survey participants were only residential customers. Given that most business customers are likely to be located in metropolitan areas which are less prone to bushfires, the WTP survey may overestimate support for undergrounding in HBRAs. A well-represented WTP survey would sample across all of SA Power Networks’ customer base especially as the costs of the program would be borne by all SA Power Networks customers. We provide further views in our confidential appendix.
We also question whether the sample is broadly representative of the total ESCOSA region. The proportion of respondents from the Eastern Hills/Fleurieu Peninsula (EH&FP) region was 150 per cent higher than that required to be representative of SA Power Networks' customer base, mostly at the expense of under representing major metropolitan areas.87 This is problematic because the EH&FP region is affected far more by interruptions to SA Power Networks’ supply than major metropolitan areas.88 This may mean that those residing within the EH&FP region are willing to pay more for reliability-related improvements—such as undergrounding—than the average SA Power Networks customer. Over-representing the results from this region higher than other areas (like major metropolitan areas) is likely to skew results towards valuing the
87 NTF, Targeted willingness-to-pay research, July 2014, p. 29.88 For example, in 2013–14 the EH&FP region had the highest frequency of interruptions in South Australia, with
those residing in it suffering almost 70 per cent more interruptions on average than those in major metropolitan areas (ESCOSA, Performance of SA Power Networks — 2013–14, 2014, p. 2.)
56 Attachment 6 – Capital expenditure | SA Power Networks' determination 2015–20
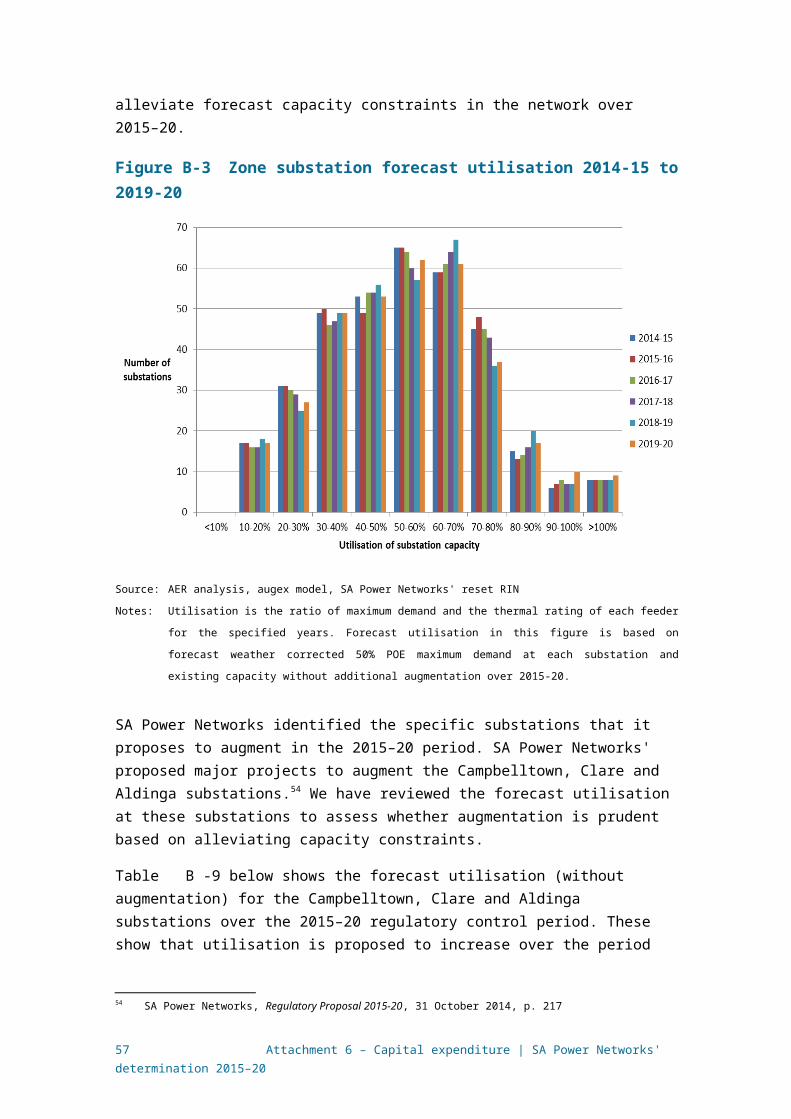
program more highly than compared to other respondents. Given that all SA Power Networks’ customers would be expected to pay for the program, we consider that the material provided by SA Power Networks does not establish majority SA Power Networks customer support for the program.
We consider the way that the survey was presented to survey participants could have influenced their survey responses. This is set out further in our confidential appendix. Oakley Greenwood also considered survey participants were not informed as to the likely fire reduction risk (benefit level) associated with each of the service offerings they could choose from. In this regard, ‘the consumer is being asked to make a choice on either a best guess or emotional basis.’89
We also note the submission from SA Treasury that questions whether the majority WTP of $12 per customer per year can be qualitatively supported by a proposed capex amount of $128.6 million ($2014–15). SA Treasury note the importance for ‘the AER to be satisfied that the proposed expenditure on projects identified during the consumer engagement process accurately reflect what respondents were willing to pay.’90 We provide more views on this in our confidential appendix.
We also note Oakley Greenwood’s observation that the focus of the WTP survey could have been widened to include other service areas. Oakley Greenwood noted that while the decision to test consumers’ willingness-to-pay for these specific services is not illogical, insights from SA Power Networks’ consumer engagement program suggest that a number of other service areas are likely to have offered fertile ground for increased service levels to better meet customers’ expectations and needs. For instance, within the WTP survey itself, a number of factors were identified that contribute to customer satisfaction. Undergrounding of powerlines contributed 4 per cent – the lowest contribution to overall customer satisfaction.91 Oakley Greenwood therefore question how SA Power Networks decided on the relative level of resources to devote to these areas compared to other areas which may provide greater impacts in terms of customer satisfaction.
Oakley Greenwood also considered that service offerings achieving acceptance by greater than 55 per cent of service participants (but which do not achieve the highest acceptance) should still be considered. Under the NTF approach, if more customers are willing to pay a higher amount, that higher amount is imposed on all other customers. Oakley Greenwood consider that the desire for some customers for higher service levels should be tempered by the amount of cost that desire imposes on other customers who are not willing to pay for the higher level of service. This would allow the majority to have its way while seeking to minimise the impact of the majority on others. Taking this alternative approach, Oakley Greenwood found that their approach would select the bundle comprising zero km of undergrounding in HBRAs and BFRAs and 2.5 per cent vegetation management.92
89 Oakley Greenwood, Peer review of the willingness to pay research submitted by SAPN, April 2015, p. 6.90 SA Treasury, Government of South Australia’s Submissions to the Australian Energy Regulatory on the SA Power
Network’s Regulatory Proposal 2015-20, p. 11.91 Oakley Greenwood, Peer review of the willingness to pay research submitted by SAPN, April 2015, p.7–9.92 Oakley Greenwood, Peer review of the willingness to pay research submitted by SAPN, April 2015, p.10–13.
57 Attachment 6 – Capital expenditure | SA Power Networks' determination 2015–20

Alternative funding avenues
We are aware that there may be alternative avenues available to fund the bushfire mitigation program – through support from the Power Line Environment Committee (PLEC). If through a collaborative approach a regulatory change is activated, SA Power Networks can apply to pass through costs associated with the regulatory change in a subsequent regulatory proposal.
The PLEC was established by the SA Government, to prepare a program of undergrounding of powerline works. SA Power Networks is required to fund the total PLEC project expenditure and recover one-third portion of the costs in accordance with a legislated formalised payment schedule.93 The PLEC charter sets out factors the committee would consider when assessing undergrounding work, which since 2012 now includes ‘electricity safety’ (and road safety). The PLEC currently comprises representatives from various government bodies, local councils, the community, SA Power Networks and other interested parties.
SA Power Networks submits that it expects the undergrounding of powerlines in HBRAs would be in addition to any work undertaken by PLEC. However, we consider that given the recent change in the PLEC charter to include electrical safety as a factor when considering undergrounding power line work, it would be conceivable that with council support (as councils generally submit applications to PLEC), undergrounding powerlines in HBRAs could be considered a PLEC project. Further, we note that SA Power Networks’ forecast PLEC expenditure is included in SA Power Networks’ regulatory proposal.94 Therefore SA Power Networks is seeking funding for PLEC undergrounding power lines work which is in addition to the amount it is proposing under the bushfire mitigation program.
The CCP submits that given the broad membership and knowledge of the PLEC, they would be better placed to make decisions as to whether undergrounding would be in the community’s interest and consider that it would be a better avenue for SA Power Networks to seek funding for underground work. The CCP consider that the councils, given they submit applications to PLEC, would be well placed to make judgements as to whether undergrounding work for the purposes of bush fire mitigation would be required. The CCP’s submission also recommends that SA Power Networks seek a broader approach, and not a unilateral one, to address bushfire risk by involving state and local government and other relevant emergency groups. The CCP notes that ‘[it] is not aware that the SA Government has established any such equivalent representative committee, however, we firmly believe this is the most appropriate and effective approach to addressing multi-causation events such as bushfires in a prudent and cost effective manner.’95
We also note that some of the outcomes of the VBRC and PBT included the development of new industry standards. If through a consultative process, a change in regulatory standards related to bush fires were achieved, then the NER provides that
93 See Electricity (Regulations) Act 2012, Part 9, section 44.94 SA Power Networks, SA Power Networks Regulatory proposal 2015-20, p.142–143.95 Submission by the Consumer Challenge Panel 2 to the AER in response to SA Power Networks Regulatory
Proposal for 2015-20, p. 43.
58 Attachment 6 – Capital expenditure | SA Power Networks' determination 2015–20
SA Power Networks may apply for approval to pass through costs associated with such a change.
Road-safety
SA Power Networks proposed $74.2 million ($2014–15) to underground powerlines at select traffic intersections and roads that are deemed as high risk for road-safety. SA Power Networks argues that the widening of South Australian roads over time has meant that SA Power Networks' poles are now closer to the road surface, increasing road-safety risk. Hence, SA Power Networks proposes to improve road safety by undergrounding its network in select locations.96
We do not accept the $74.2 million forecast because we consider that the proposed program is not required to maintain the safety or reliability of SA Power Networks' distribution system, and does not reasonably reflect the costs that a prudent operator, acting efficiently, would require to achieve the capex objectives. The reasons for this are outlined below.
Relevantly, the capex objectives require SA Power Networks to include capex required to maintain the safety of the distribution system through the supply of standard control services, and to comply with regulatory obligations or requirements, including in relation to reliability.97 The distribution system includes electricity poles that are adjacent to roads.
SA Power Networks does not demonstrate that there is an existing issue of network safety that it is trying to resolve through this capex program. Rather, SA Power Networks states that the program is based on concerns raised by some of its customers about the risk posed by network infrastructure for road safety.98 Road accidents may potentially affect the safety of the distribution network (such as by causing damage to poles and wires), but it is clear that this capex program is primarily about improving road-safety rather than maintaining network safety or reliability.
While road-safety is important for the community, it is not the sole responsibility of the electricity distributor and electricity consumers to fund programs to increase road-safety. This is particularly the case given that SA Power Networks does not demonstrate that there are safety hazards arising from faults in its distribution network at these particular road intersections. The proposed risk to road-safety appears to be the result of a widening of roads which is outside of SA Power Networks' control as operator of the distribution network and does not relate to a safety issue caused by the network.
This view is supported by submissions from Business SA, the SA Minister for Mineral Resources and Energy (Energy Minister) and the CCP. The Energy Minister submitted:
96 The proposed locations of undergrounding are informed by a working committee that consists of SA Power Networks, the Motoring Accident Commission and the Department of Planning, Transport and Infrastructure SA.
97 NER, cl. 6.5.7(a). to the extent that there is no applicable regulatory obligation or requirement in relation to reliability, SA Power Networks is required to maintain the reliability of the supply of standard control services, and of the distribution system through the supply of standard control services.
98 SA Power Networks, Regulatory Proposal 2015-20, 31 October 2014, p. 226.
59 Attachment 6 – Capital expenditure | SA Power Networks' determination 2015–20
The South Australian Government places significant importance on road safety as demonstrated through its commitment to ongoing road safety initiatives …
For this reason, rather than embarking on a program that directly impacts on electricity prices, the Government submits road safety initiatives are best left to expert agencies such as the Department of Planning, Transport and Infrastructure and the Motor Accident Commission to determine if undergrounding or relocating power lines is the most viable option available to protect South Australian motorists in specific locations.99
Similarly, Business SA submitted:
Business SA acknowledges that SA Power Networks' proposal to improve road safety is well intentioned but akin to measures being taken to improve bushfire mitigation, we consider that setting the appropriate level of road safety risk, and the optimum policy response to achieve this, are matters for Government.100
The CCP also submits that investment in undergrounding electricity lines should be as a result of a comprehensive plan agreed to by all stakeholders, including councils, road departments and tourism bodies. The CCP stated that this is not an economic regulatory matter, but rather a community issue of which SA Power Networks is but one part.101
Submissions point to an alternative source of funding for undergrounding of cables based on advice from Power Line Environment Committee (PLEC).102 As discussed in section B.2.6, the PLEC approves capex to improve network aesthetics through undergrounding the electricity network, and funding is shared between SA Power Networks, local councils and the Government. Since 2012 the PLEC must now consider road safety and electricity safety as factors when assessing an undergrounding project for funding. The PLEC includes membership from SA Power Networks, the Department of Planning, Transport and Infrastructure, local councils and community representatives.
The CCP states that given the broad membership and knowledge of the PLEC Committee, they would be better placed to make decisions as to whether undergrounding would be in the community’s interest and consider that it would be a better avenue for SA Power Networks to seek funding for underground work.103
In coming to our view on this capex project, we have considered the views of consumers as expressed the willingness-to-pay study submitted by SA Power Networks.104 On the basis of this study, SA Power Networks submits that community consultation confirmed majority support and willingness-to-pay for undergrounding
99 SA Government submission on SA Power Networks Regulatory Proposal 2015–20, p. 4.100 Business SA submission on SA Power Networks Regulatory Proposal 2015-20, pp. 16–18.101 CCP submission on SA Power Networks Regulatory Proposal 2015-20, p. 22.102 CCP submission on SA Power Networks Regulatory Proposal 2015-20, p.23; SA Government submission on SA
Power Networks Regulatory Proposal 2015-20, p. 4.103 CCP submission on SA Power Networks Regulatory Proposal 2015-20, p. 45.104 NTF Group, SA Power Networks Targeted Willingness to Pay Research — Research Findings, July 2014 (SA
Power Networks, Regulatory Proposal 2015–20, 31 October 2014, Attachment 6.8).
60 Attachment 6 – Capital expenditure | SA Power Networks' determination 2015–20
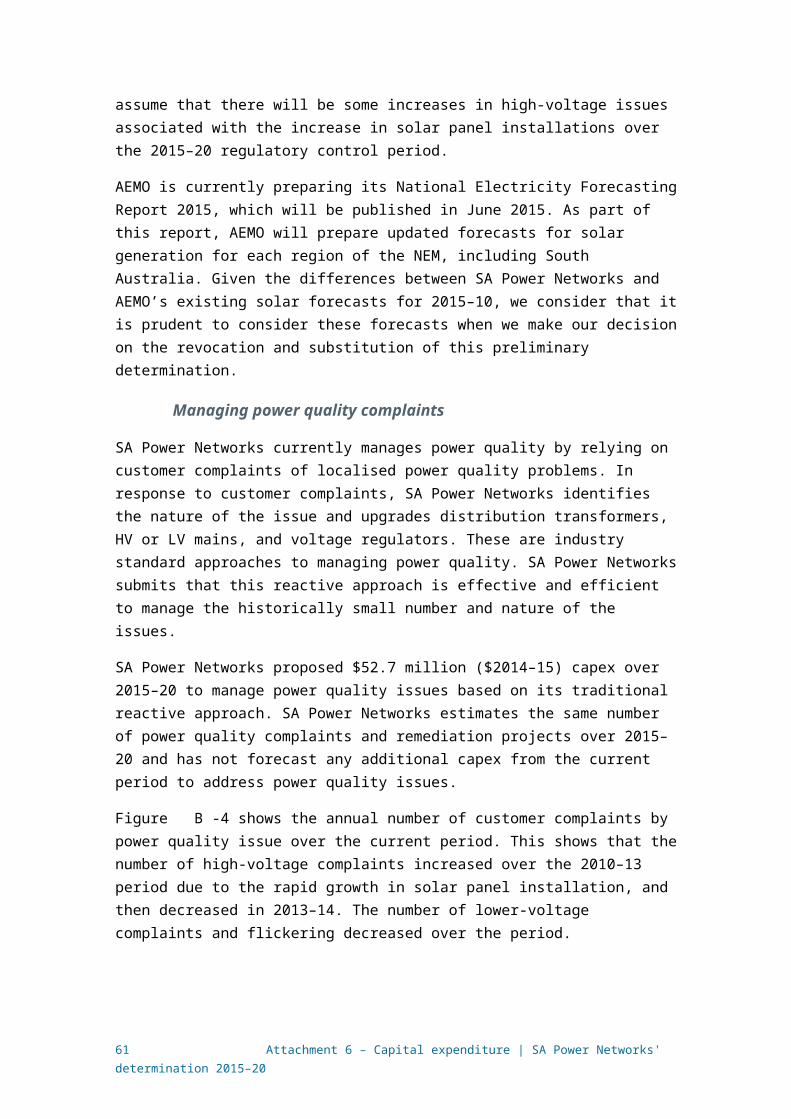
powerlines around traffic black spots.105 We also considered this report in our assessment of SA Power Networks' bushfire mitigation capex proposal (see above).
The willingness-to-pay study provided surveyed customers with different undergrounding options to deal with bushfire risk and traffic options. It found that the most preferred options amongst respondents were:
in high bushfire risk and bushfire risk areas, 135kms of undergrounding combined with 2.5 per cent tree removal and replacement
in non-bushfire risk areas, 2.5 per cent removal and replacement of inappropriate vegetation, associated with a 2 year trimming cycle without undergrounding powerlines,
undergrounding powerlines surrounding 30 Traffic Blackspots.106
As noted above, we commissioned consultants Oakley Greenwood to review SA Power Networks study.107 It considered that the decision made by consumers in support of undergrounding powerlines did not reflect informed choices given the limited information provided to consumers about the benefits associated with each of the options presented. In relation to traffic blackspots, the report observed that:
In these cases, there is no relationship between the relative amounts of money paid and the likely reduction in traffic accidents and associated property damage and injury/death (in the case of the traffic blackspots).
In each of these cases (bushfire and traffic blackspots), the consumer is being asked to make a choice on either a best guess or emotional basis. The analysis will provide a result, but it will not be the result of an informed choice.108
Submissions from the South Australian Energy Minister, the EUAA, Business SA and the CCP criticise the willingness-to-pay survey as not being representative of SA consumers as a whole, and pointed to the same issues we have identified.109 The CCP notes that the use of willingness-to-pay research is still in its infancy and is cautious about its use in supporting investment decisions. In particular, the CCP are critical of the surveying methodology used to produce the willingness-to-pay results, and were not satisfied that the robustness of the research justified the level of capex proposed.110
Having taken into account the issues identified above and the views expressed in submissions, we are not satisfied that SA Power Networks' willingness-to-pay study provides persuasive evidence that SA Power Networks' consumers support the proposed capex to underground powerlines at traffic blackspots, or that the proposed expenditure is prudent and efficient.
105 SA Power Networks, Regulatory Proposal 2015–20, 31 October 2014, p. 66.106 NTF Group, SA Power Networks Targeted Willingness to Pay Research — Research Findings, July 2014, p. 5
(SA Power Networks, Regulatory Proposal 2015–20, 31 October 2014, Attachment 6.8).107 Oakley Greenwood, , April 2015108 Oakley Greenwood, , April 2015, p. 6109 SA Government submission on SA Power Networks Regulatory Proposal 2015-20, p. 12-13; Energy Users
Association of Australia submission on SA Power Networks Regulatory Proposal 2015-20, pp. 15-16; Business SA submission on SA Power Networks Regulatory Proposal 2015-20, p. 20.
110 CCP submission on SA Power Networks Regulatory Proposal 2015-20, pp. 35–38.
61 Attachment 6 – Capital expenditure | SA Power Networks' determination 2015–20
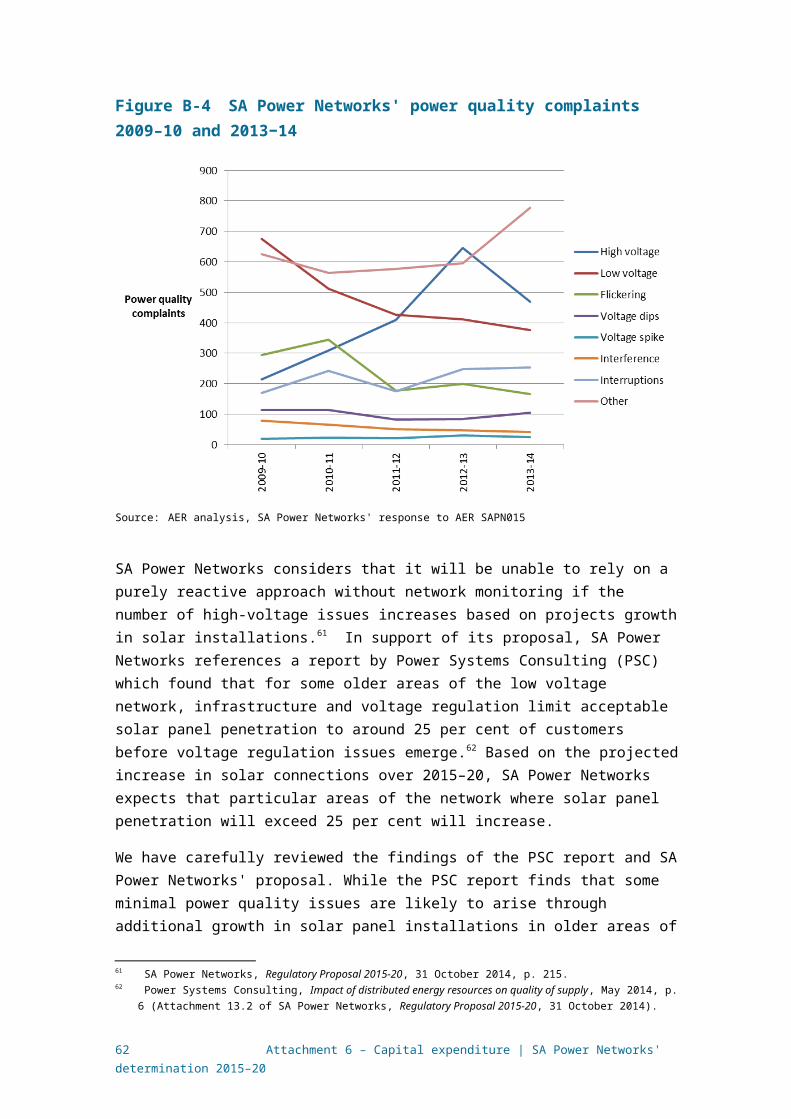
B.2.3 Strategic programs
SA Power Networks proposed a forecast of $92.9 million ($2014–15, excluding overheads) for a number of one-off strategic projects that SA Power Networks states aimed at ensuring the security of supply of the network. These include:
$45.2 million to install a second undersea cable to Kangaroo Island
$15.4 million to install network monitoring devices in select smart meters, and
$24.7 million to expand the rollout of network control equipment.
We do not accept SA Power Networks' proposed $92.9 million forecast and have instead included $45.2 million in our alternative estimate. This reflects the proposed capex for the Kangaroo Island undersea cable. In coming to this view, we have assessed the need for the three primary strategic projects below.
Kangaroo Island cable
SA Power Networks proposed $45.2 million ($2014–15) to install a second undersea electricity cable to Kangaroo Island (KI). The key reason for proposing a second cable is to maintain the security of electricity supply to Kangaroo Island.
Our preliminary decision includes a forecast of $45.2 million ($2014–15) in our alternative estimate of required capex for the 2015–20 regulatory control period to install a second undersea cable to KI. This is consistent with SA Power Networks' proposal. Our decision is based on the information currently before us at this time. However, as set out below, we note the concerns of stakeholders regarding the alternative options considered by SA Power Networks. SA Power Networks' response to these matters will be considered prior to us making a decision on the revocation and substitution of this preliminary decision.
SA Power Networks' Proposal
Currently KI is served by a single undersea cable that was installed in 1993 and has a predicted 30 year design life. SA Power Networks is proposing to install a second cable by 2018, when the existing cable will be 25 years old.
SA Power Networks is relying on the predicted service life of the undersea cable as an indicator of the condition of the cable. SA Power Networks submit that the cable is buried along 95 per cent of the route, making condition inspections very difficult.111 While SA Power Networks does not routinely undertake condition assessments of the cable it has submitted pictures taken of the condition of the exposed sections of the cable in 2012. SA Power Networks note that these pictures show minor corrosion was evident "intermittently with some of the cable’s outer sheath fibre being exposed."112 Business SA indicated that it considered that the photographic evidence was
111 SA Power Networks, AMP 2.1.03 Kangaroo Island – Network Security Second Undersea Cable 2015 to 2035, October 2014, p. 11
112 SA Power Networks, AMP 2.1.03 Kangaroo Island – Network Security Second Undersea Cable 2015 to 2035, October 2014, p. 11.
62 Attachment 6 – Capital expenditure | SA Power Networks' determination 2015–20
inconclusive and that the photo "appears to show an XLPE cable in normal condition for its age."113
SA Power Networks submit that relying upon the predicted service life is reasonable and prudent in this case due to the materiality of the impact upon the security of supply to KI were the cable to fail. SA Power Networks has estimated that the cost of local generation to meet the demand on KI would be $32 million ($2014–15) per annum. SA Power Networks further advise that following a failure of the cable, repair could take up to 12 months for a deep sea fault as it requires a special cable laying ship from overseas to recover, repair and reinstate the cable114 and 24 months to replace the cable.115
A confidential cost-benefit analysis of installing a second cable compared to the cost of the existing cable failing in the future has been provided by SA Power Networks. SA Power Networks submits that this analysis supports installing the second cable in 2018 as it is a lower cost in net present value terms when considering the cost of local generation and the cost to consumer using value of customer reliability (VCR) analysis.
AER analysis
As 95 per cent of the KI undersea cable is buried, the condition of the asset cannot easily be observed. So we consider it is reasonable for alternative supply arrangements to be put in place for KI as the existing cable nears its 30 year life expectancy.
We note the views of Business SA, who submits that there "is little evidence the existing cable is significantly deteriorated and likely to fail. It is currently 22 years old, with an expected life of 30 years or more. The previous cable (utilising much older cable technology) operated to 37 years, including 12 years beyond when SA Power Networks identified it was at risk of imminent failure and must be replaced."116
Similarly, the Energy Consumers Coalition of SA (ECCSA) submits that it is "not convinced that the second u/s cable is warranted considering that the existing cable still has some 10 years of design life remaining and diesel generator back up to provide reliability of supply."117
We acknowledge that the cable will have five years left of its expected life when SA Power Networks proposes that it is replaced in 2018. Further, we note that the previous undersea cable did operate to an age of 37 years before a suspected deep-sea joint failure caused it to be retired. However, it is also worth noting that the previous cable suffered its first fault at 22 years of age.118
113 Business SA submission on SA Power Networks Regulatory Proposal 2015-20, p. 23.114 SA Power Networks, AMP 2.1.03 Kangaroo Island – Network Security Second Undersea Cable 2015 to 2035,
October 2014, p. 8.115 SA Power Networks, Regulatory Proposal 2015-20, 31 October 2014, p. 220.116 Business SA submission on SA Power Networks Regulatory Proposal 2015-20, p. 22.117 ECCSA, Submission on SA Power Networks Regulatory Proposal 2015-20, p. 22.118 SA Power Networks, AMP 2.1.03 Kangaroo Island – Network Security Second Undersea Cable 2015 to 2035,
October 2014, p. 9.
63 Attachment 6 – Capital expenditure | SA Power Networks' determination 2015–20

Business SA and ECCSA note that SA Power Networks is proposing to install an additional cable ahead of the end of the existing cable's design life. However, we consider that this may still be a prudent and efficient course of action if it can be shown that the likely costs to consumers are minimised by the early installation of the cable. In order to be able to perform this analysis, the probability of failure must be included in the modelling. We are concerned that SA Power Networks did not originally include this in their assessment.
In order to address this issue, we undertook some simplified analysis of the net present value (NPV) of the likely costs to consumers by weighting the costs of backup generation by the probability of failure. To stylise a probability of failure, we assumed a linear probability curve increasing to 100 per cent when the cable reaches 30 years of age. In this model we excluded the possibility of repairing the cable and assumed that SA Power Networks replaced the cable within 12 months of cable failure. This simplified analysis estimated that the NPV of the costs associated with a cable failure increased throughout the 2015–20 regulatory control period up to a maximum of $40.3 million ($2014–15) in 2019–20. Given that this was marginally less than the NPV of $41.5 million ($2014–15) for SA Power Networks' preferred option, the simplified model highlighted that it may be possible to prudently defer the second cable.
Having developed this simplified model, we provided it to SA Power Networks. We also contracted Energy Market Consulting Associates (EMCa) to undertake a peer review of our analysis and the material submitted by SA Power Networks.
In response, SA Power Networks consider that the primary flaw with our simplified model is the assumption of a 12 month replacement time. SA Power Networks note that their NPV analysis is based on the cable being repaired within a 1 year period and then a concurrent cable installation timeframe of two years.119 SA Power Networks also provides a breakdown of the project timeline and copies of the vendor reports that underpin those timeframes. This information supports SA Power Networks' case that the appropriate assumption for cable replacement is two years. Assuming that no repair of the existing cable is possible, a two year replacement window increases the cost of backup generation from $32 million to $59.4 million. This materially increases the NPV of the probability weighted costs in our simplified model and justifies the construction of the additional cable in the 2015–20 regulatory control period as the NPV of the likely costs exceed that of SA Power Networks' preferred option.
EMCa agree that the application of a probability of failure into the NPV analysis is reasonable. Following a review of the SA Power Networks analysis, EMCa also conclude that the evidence supports the inclusion of the proposed project in the forecast for the 2015–20 regulatory control period.120
This position is supported by the South Australian Government which notes that the early replacement of the cable "will minimise the risk of additional costs being incurred should the cable fail prematurely."121
119 SA Power Networks, response to AER SAPN037, p. 1.120 EMCa, Peer review of AER analysis for Kangaroo Island – Network security second undersea cable, 9 April 2015,
p. ii.121 SA Government submission on SA Power Networks Regulatory Proposal 2015-20, p. 8.
64 Attachment 6 – Capital expenditure | SA Power Networks' determination 2015–20

SA Power Networks submit further modelling which includes a normalised probability of failure curve, with a cumulative 50 per cent probability of failure when the existing cable reaches 30 years old. The SA Power Networks revisions demonstrate that under all modelled scenarios, the NPV of likely costs to consumers is minimised by the installation of the cable during the 2015–20 regulatory control period.122
However, EMCa make a number of observations regarding the consistency of input assumptions included in SA Power Networks' modelling that bias the results towards a lower NPV for SA Power Networks' preferred option.123 While we expect SA Power Networks to address issues such as consistency of the timing of payment to vendors and the need for additional backup generation in 2034 across all models, correcting for these issues does not change EMCa's ultimate finding.
Consideration of alternative network options
Given the sensitivity of the analysis to the cost of backup generation we asked SA Power Networks whether there were alternative options that would shorten the time taken for cable replacement. Specifically, we sought information on the technical feasibility of pre-purchasing and storing the cable, or whether there was an option to pay a deposit with a cable supplier to shorten the production time.
In regards to storage, SA Power Networks advise that:
"It is not practical to purchase the 15km (one length) of cable required for the full cable installation, store the cable under controlled conditions until the existing cable fails, and then find an acceptable method (to the cable supplier) of transferring the cable from storage to a cable laying ship. This is because these types of cables are normally loaded directly onto a specifically designed cable laying ship and then installed. Loading the cable onto a ship, then off the ship and then back onto a cable laying ship would be an unusual and inefficient practice. In addition, we understand that there would be significant risk of damaging the cable during these extra handling operations."124
We understand that technology has been developed that would enable a storage solution.125 However, it is likely that the costs involved in the transport, storage and retrieval as set out by SA Power Networks would exceed the benefits of deferring installation until the existing cable fails. On the option of prepaying, SA Power Networks is currently awaiting responses from potential vendors.126 We expect that this option will be addressed in SA Power Networks' submission on the revocation and substitution of this preliminary decision.
On the basis of the information currently available, it is reasonable to include the installation of a second undersea cable in the capex forecast for the 2015–20 regulatory control period. However, we note the concerns of some stakeholders that
122 SA Power Networks response to AER SAPN037, e-mail, 12 March 2015.123 EMCa, Peer review of AER analysis for Kangaroo Island – Network security second undersea cable, 9 April 2015,
pp. 16-17.124 SA Power Networks, response to AER SAPN037, p. 2.125 See for example, http://www.rentocean.com/ 126 SA Power Networks, response to ER SAPN037, p. 4.
65 Attachment 6 – Capital expenditure | SA Power Networks' determination 2015–20
SA Power Networks has not presented or considered alternative options for local supply on KI. This issue is considered below.
Consideration of non-network alternatives
SA Power Networks present an option of meeting demand on KI through the use of renewable energy sources at a cost of $92 million ($2014–15), with an additional $14 million per annum. The costing for this option is based on an example from King Island where $46 million ($2014–15) was spent in meeting a load approximately half of KI through a mix of diesel, wind and solar energy generation.127 SA Power Networks' costings appear to be based on doubling the King Island expenditure.
Both Business SA128 and the Total Environment Centre129 (TEC) are critical of SA Power Networks for using King Island as a basis for costing renewable generation option. Both submissions suggest that this does not represent best practice and does not recognise the local KI environment and its renewable energy potential. Business SA submits that there are different examples from around Australia which would give "a much more reasonable cost estimate of the renewable energy option of approximately $3/W fully installed." In addition, Business SA notes that while a detailed study would be needed to confirm the estimate, on the basis of alternative benchmarks a "nominal 7MW wind farm on Kangaroo Island would therefore cost approximately $21 million ($2014–15) on that basis, including integration technology."130
Further, both Business SA and the TEC submit that SA Power Networks should consider alternative options to ensure security of supply for KI as once the existing cable has failed, KI will be reliant on the single cable. As noted by Business SA:
"A cable fault would result in disrupted supplies for up to 12 months, yet they propose to replace the cable with another that would provide equivalent security – noting that 85% of cable faults are due to “external factors” (damage) and not age. Standby generators installed on the island are not suitable for providing long-term backup in the event of a serious outage. We consider the true condition of the cable, and options to improve security of supply need to be rigorously re-assessed."131
These views are supported by the report of EMCa which notes that it did not find evidence of adequate consideration of alternate forms of generation capacity to meet the load on Kangaroo Island. In addition, EMCa notes that there appeared to be inadequate consideration of the impact of disruptive technologies as seen in other parts of the electricity networks in Australia, or analysis of solutions including PV, wind generation and storage.132
127 SA Power Networks, AMP 2.1.03 Kangaroo Island – Network Security, p. 17.128 Business SA submission on SA Power Networks Regulatory Proposal 2015-20, p. 23.129 TEC submission on SA Power Networks Regulatory Proposal 2015-20, p. 9.130 Business SA submission on SA Power Networks Regulatory Proposal 2015-20, p. 24.131 Business SA submission on SA Power Networks Regulatory Proposal 2015-20, p. 3.132 EMCa, Peer review of AER analysis for Kangaroo Island – Network security second undersea cable, 9 April 2015,
p. 17.
66 Attachment 6 – Capital expenditure | SA Power Networks' determination 2015–20
We note that this project will be subject to a regulatory investment test for distribution (RIT-D) process and that stakeholders will have an additional opportunity to propose alternative options through the formal consultation required under the NER. For example, we would expect that the community renewable energy project referred to by the TEC would be submitted as an option through the RIT-D process.133 It is important to note that despite our assessment techniques for SA Power Networks' augex forecast including an individual project review for the KI undersea cable, our distribution determinations do not approve funding for individual projects. Indeed, the NER do not provide for us to set an augex forecast or an individual project allowance. Rather, we either accept a distributor's total of forecast capex, or establish our own estimate of total required capex, for the relevant regulatory control period. From there, the requirement is on the network business to balance its opex and capex to meet its obligations. Accordingly, if the RIT-D consultation process discovers a more efficient non-network option, SA Power Networks is able to proceed with that option. To the extent that the cost of the ultimate solution is less than forecast, the benefits will be shared with consumers through our capital expenditure sharing scheme, as set out in attachment 10.
More immediately, we would expect that SA Power Networks would reflect on the comments of stakeholders as part of its submission on the revocation and substitution of this preliminary decision and determine whether there is an alternative option which should be included in the analysis. We will consider SA Power Networks' response in our decision on the revocation and substitution of this preliminary decision. Given the relative size and profile of expenditure associated with the KI project, there will be no material impact on tariffs for the 2015–16 year or the 'true-up' mechanism following the revocation and substitution of this preliminary decision regardless of whether the project is included in the forecast for the 2015–20 regulatory control period.
Network monitoring
SA Power Networks proposes a forecast of $15.4 million ($2014–15) for network monitoring augex (excluding overheads). SA Power Networks proposes to use this capex to install telecommunications modules in select 'smart meters' to monitor power quality (e.g. voltage levels).
This is part of SA Power Networks' broader strategy to adopt new technology to manage two-way networks from the projected increases in solar generation and other micro-generation installations. SA Power Networks envisages that this will be achieved through "the extension of monitoring and control capabilities, improvements in planning facilitated by systems and data, developing a network that would connect to and interact with customers and their energy technologies, expanding cost reflective tariffs, and utilising non-network solutions where effective.134 The other relevant capex proposals include network control, power quality monitors, and supporting IT capex.
SA Power Networks' proposal is to install telecommunications modules in select smart ready interval meters so they can become remotely read as these smart ready interval
133 TEC submission on SA Power Networks Regulatory Proposal 2015-20, p. 9.134 SA Power Networks, Regulatory Proposal 2015-20, 31 October 2014, Attachment 13.1, p. 3.
67 Attachment 6 – Capital expenditure | SA Power Networks' determination 2015–20
meters are rolled out. However, as stated in Attachment 16, our preliminary decision is to reject SA Power Networks' proposed capex to install smart ready interval meters over the 2015–20 period. This decision is made in the context of the expected market led rollout of smart meters in South Australia, and finalisation of national smart meter minimum functionality specifications.
This decision means that it is unclear whether or how many smart meters SA Power Networks will own and install in the 2015–20 regulatory control period. Irrespective of any proposed benefits from network monitoring, we consider that providing an allowance to install telecommunications modules in smart ready interval meters is not prudent without more certainty about the rollout of smart meters in South Australia. In the absence of such certainty, we are not satisfied that $15.4 million ($2014–15) reflects a prudent and efficient amount to install telecommunications modules to facilitate network monitoring in the 2015–20 regulatory control period.
We note that under the competitive metering framework, network operators will be able to commercially negotiate with metering co-ordinators to access metering data that they wish to use for network purposes. This means that SA Power Networks does not need to own smart meters and install its own telecommunications devices to be able to access information to more effectively monitor and manage two-way power flows.
Network control
SA Power Networks proposes $24.7 million capex ($2014–15) over the 2015–20 period to install network control and automation equipment (SCADA) and ADMS (Advanced Distribution Management System) to its rural substations and switches. As noted previously, this is part of SA Power Networks' broader strategy to adopt smart-grid technology to manage two-way networks from the projected increases in solar generation and other micro-generation installations.
SA Power Networks states that the extension of SCADA and ADMS to rural substations and switches forms part of the smarter network foundation. This proposal is comprised of three programs:135
$8.2 million to install SCADA to 33kV switches (including overheads)
$8.6 million to install SCADA to 11kV and 19kV switches (including overheads)
$9 million to install SCADA to rural substations (including overheads).
We do not accept SA Power Networks' proposed $24.7 million ($2014–15) forecast because we consider that it does not reasonably reflect the costs that a prudent operator, acting efficiently, would require to maintain service levels on the network. While we support innovation and new technology that allows a business to more efficiently and effectively maintain service levels, SA Power Networks has not provided sufficient evidence that additional network control equipment is required in the 2015–20 regulatory control period to maintain service levels on the network.
135 Note that the costs of these individual programs are inclusive of overheads. SA Power Networks did not submit the direct costs of these programs. However, given that our preliminary decision is not to include entire $24.7 million ($2014–15) (excluding overheads) in our alternative capex estimate, the inclusion of overheads in our assessment of each individual program does not affect the overall outcome.
68 Attachment 6 – Capital expenditure | SA Power Networks' determination 2015–20
SCADA to 33kV, 19kV and 11kV switches
SA Power Networks proposes a combined $16.8 million ($2014–15) to install SCADA to its 33kV switches and SCADA to 11kV and 19kV switches (including overheads). This is the continuation of an historical program to roll out network feeder automation across the network. SA Power Networks submits that a specific business case has not been prepared on the basis that this is a continuation of an approved long term program, which is also aligned with the smarter network strategy.136
SA Power Networks submits that SCADA control and monitoring of 33kV, 19kV and 11kV switches is industry standard across the NEM. It stated that these facilities are required to enable SA Power Networks to meet customer service standards and to optimise the network functionality.137 The expansion of this program is based on its broader smarter network strategy based on an expectation of wide-scale customer adoption of solar and micro-generation systems (as outlined in the background section).
In our view, SA Power Networks has not demonstrated that rolling out network automation and control equipment to its HV switches (including in rural areas) is necessary to maintain network service levels. We do not dispute that there are benefits to network automation and control, in particular for metropolitan networks, major feeders and critical assets. In this sense, the adoption of SCADA for these types of assets has become industry standard. However, the rollout of SCADA across the network is not necessarily industry standard unless it can be shown it has a positive incremental benefit to consumers.
SA Power Networks does not provide a specific business case to demonstrate that rolling this requirement out to its entire network provides a positive benefit to customers. Given that SA Power Networks' program is the continuation of a historical program, we consider that the most beneficial investment has likely been completed and what remains is of marginal net benefit to consumers.
As noted in our network monitoring decision above and in section B.2.1, solar generation and solar connections are projected to increase from existing levels over the 2015–20 regulatory control period. This is relevant to the network control proposal because SA Power Networks considers that it needs more centralised control and automation of its feeders due to projected increases in ‘two way power flows’ from solar generation. However, as we note, we do not consider that solar generation is expected to increase to the extent forecast by SA Power Networks. We will have more updated information when AEMO releases its latest National Electricity Forecasting Report in June 2015.
Based on this uncertainty, and the lack of supporting business case, we consider that SA Power Networks has not provided sufficient evidence to justify the level of capex for additional SCADA for switches within the 2015–20 regulatory control period. We consider that a more prudent approach is for SA Power Networks to defer the investment until the nature and timing of the issues are clearer. This will ensure that
136 SA Power Networks, response to AER SAPN020, p. 2.137 SA Power Networks, response to AER SAPN020, pp. 2–3.
69 Attachment 6 – Capital expenditure | SA Power Networks' determination 2015–20
investment is not premature. On this basis, we have not included the proposed $16.8 million in our alternative estimate of SA Power Networks' capex.
SCADA to rural substations
SA Power Networks proposes $9 million ($2014–15) to expand SCADA to rural substations. This is part of a program to rollout SCADA to all of SA Power Networks' substations by 2025.138 Since the 1990s, SCADA was progressively rolled out to SA Power Networks' larger, primarily metropolitan zone substations. SA Power Networks submits that without SCADA connectivity to all substations, the ability to proactively manage its network in rural areas is reliant on customers calling in with power complaints, and temporary monitoring equipment having to be installed within the substation.
SA Power Networks supports its capex based on a business case prepared by DNV-GL that considers there is a positive benefit to customers to rollout SCADA and associated ADMS to rural substations over the next 10 years.139 The key benefits identified are:
Reduced visits to zone substations based on more automation and centralised control.140
Reducing the number of customers that are without energy during times of bushfire risks (by allowing SA Power Networks to turn off specific customers in response to bushfire risks, rather than entire areas or zones)141
Reduce number of minutes without energy supply based on faster identification and restoration of outages and faults142
Allow SA Power Networks to control when embedded customers' generators are operating and switch them on/off at times of network capacity constraints. This could avoid the need to augment the network for new generation.143
Improved management of load to avoid outages from overloaded transformers.144
We have reviewed this business case and found that there are a number of flaws or overestimations which mean that the benefits to consumers are likely significantly overstated. Note that key figures within this business case are commercial in confidence and we have kept our reasons in this section at a high level. These are:
The business case uses VCR to model the impact of SCADA and AMDS on consumers. The results find that there is a positive benefit to consumers when VCR is taken into account. The VCR value used by the business case is higher than the
138 SA Power Networks, Asset Management Plan 2.1.02 Network Security and Control 2014 to 2025, October 2014, 18.
139 SA Power Networks, Regulatory Proposal 2015-20, 31 October 2014, supporting document 20.69b (DNV-GL, ADMS Roadmap and Project Investigation – Appendix E, 10 July 2014).
140 SA Power Networks, Regulatory Proposal 2015-20, 31 October 2014, supporting document 20.69b, p. 15.141 SA Power Networks, Regulatory Proposal 2015-20, 31 October 2014, supporting document 20.69b, pp. 16-17.142 SA Power Networks, Regulatory Proposal 2015-20, 31 October 2014, supporting document 20.69b, pp. 17-18.143 SA Power Networks, Regulatory Proposal 2015-20, 31 October 2014, supporting document 20.69b, p. 24.144 SA Power Networks, Regulatory Proposal 2015-20, 31 October 2014, supporting document 20.69b, p. 24.
70 Attachment 6 – Capital expenditure | SA Power Networks' determination 2015–20

VCR published by AEMO for SA ($38,090 per MWh). On this basis, the benefits that are calculated using VCR are overstated.
A major benefit identified is reduced zone substation visits. We consider that the business case overstates the number of annual visits per substation, the number of SA Power Networks crew in attendance and the time taken for each visit. By adopting more efficient site visits, this would reduce the cited cost savings by 57 per cent.
The benefit from managing customer generation is that it could avoid the need to augment the network for new generation. This is based on an assumption that SA Power Networks will connect large generators in the absence of additional control. We consider that the assumption that SA Power Networks can avoid such large generation in the absence of network control has not been substantiated. Also SA Power Networks can implement generator monitoring arrangements with its large connection customers without the need to install SCADA capability.
In addition, the business case assumes that SCADA will be rolled out to rural substations over 10 years. SA Power Networks' proposal and its business case do not set out how the costs of the program are shared between the 2015–20 and 2020–25 periods.
We consider that it is difficult to be satisfied that the proposed benefits outlined in the business case are accurate and therefore whether the overall cost-benefit is positive for consumers. On this basis, we have not included the proposed $9 million ($2014–15) in our alternative estimate of SA Power Networks' capex.
B.2.4 Reliability augmentation
SA Power Networks proposes $56.4 million ($2014–15, excluding overheads) in reliability capex, consisting of $27 million ($2014–15) for maintaining network reliability and $29.6 million ($2014–15) for improving network reliability. The total proposed capex of $56.4 million represents a 114 per cent increase over the actual reliability expenditure for the 2010–15 period.
SA Power Networks' forecast $27 million is to maintain historical average levels of reliability performance as required under reliability targets set by the Essential Services Commission of South Australia (ESCoSA) (as described in detail below). 145 SA Power Networks submits that the capex will “address degradation of the network based on the condition assessment of our aging assets and the continuing trend in severe weather events.”146 The proposed capex is broadly consistent with the $28.9 million ($2014–15) it spent during the 2010–15 period to maintain reliability.
SA Power Networks' additional $29.6 million ($2014–15) is to improve reliability performance for sections of the network and specific feeders that are more affected by major weather events.147 SA Power Networks is seeking to improve the overall network
145 SA Power Networks, Regulatory Proposal 2015-20, 31 October 2014, p. 218. 146 SA Power Networks, Regulatory Proposal 2015-20, 31 October 2014, p. 201. 147 SA Power Networks, Regulatory Proposal 2015-20, 31 October 2014, p. 218.
71 Attachment 6 – Capital expenditure | SA Power Networks' determination 2015–20

performance as experienced by its customers (including during major weather events), but not the underlying performance as measured by ESCoSA.
We do not accept SA Power Networks' proposed $56.4 million for reliability, and instead have included an amount of $27 million in our alternative capex estimate. This reflects the proposed capex to maintain reliability only.
Under the NER framework, SA Power Networks should only be funded for capex to meet relevant regulatory obligations associated with providing standard control services and, to the extent there are no such requirements in relation to reliability, maintain the reliability of the distribution system and supply of standard control services.148 As set out further below, reliability improvement programs are instead usually funded through the Service Target Performance Incentive Scheme (STPIS). However, SA Power Networks has argued that the STPIS regime may not fund a number of its reliability improvement projects due to their unique circumstances.149 We have reviewed these arguments and, where necessary, the merits of each project proposed for SA Power Networks' reliability capex to assess whether or not it will promote the long-term interests of electricity consumers.
Maintaining network reliability
SA Power Networks' propose $27 million ($2014–15) to maintain overall network reliability aligns with the historic amount of $27.4 million ($2014–15) SA Power Networks spent on maintaining reliability capex over the 2010–15 period.
Figure B-5 and Figure B-6 show SA Power Networks' average reliability performance over 2006–07 to 2013–14. While these show fluctuations in service levels, SA Power Networks has on average maintained service performance. These performance statistics exclude reliability performance during major weather events, such as storms and heat waves.
148 NER, Clause 6.5.7(a).149 SA Power Networks, response to AER SAPN020, 9 February 2015, p. 3.
72 Attachment 6 – Capital expenditure | SA Power Networks' determination 2015–20
Figure B-5 SA Power Networks' SAIDI performance 2006–07 to 2013–14
2006-07 2007-08 2008-09 2009-10 2010-11 2011-12 2012-13 2013-140
40
80
120
160
200
Unplannedsustainedminutes
off supply(SAIDI)
Source: AER analysis.
Figure B-6 SA Power Networks' SAIFI performance 2006–07 to 2013–14
2006-07 2007-08 2008-09 2009-10 2010-11 2011-12 2012-13 2013-140.0
0.2
0.4
0.6
0.8
1.0
1.2
1.4
1.6
1.8
Unplannedsustained
interruptionsto supply
(SAIFI)
Source: AER analysis.
ESCoSA has set SA Power Networks' average reliability service standards and targets for the 2015–20 regulatory control period to maintain SA Power Networks' average historical levels over 2009–10 to 2014–15. ESCoSA notes that these reliability targets for the 2015–20 regulatory period reflect the impacts of recent investment decisions by
73 Attachment 6 – Capital expenditure | SA Power Networks' determination 2015–20

SA Power Networks.150 These standards are supported by feedback from SA Power Networks' customers over the past ten years which indicate high levels of satisfaction with the current levels of reliability. SA Power Networks also states that this is supported by the low levels of service complaints.151
ESCoSA has on purpose set SA Power Networks' service standards to exclude the impact of major event days such as storms and heatwaves. ESCoSA considered that SA Power Networks' network must be built to perform consistently within normal weather conditions. 152 However, it would be very difficult (and prohibitively expensive) to design an electricity distribution network to withstand all severe weather events.153
SA Power Networks' proposed program is aimed at maintaining historical average network reliability within normal weather conditions. The capex works are targeted to address reliability issues in specific locations and assets. These include insulating (or reinsulating) specific conductors, installing fuses, animal and vegetation mitigation, and managing protection equipment.154 Some of these projects will restore reliability where it is degraded, while others will improve reliability.
It is difficult to conclude whether the combined impact of these works will maintain or improve average network reliability performance. However, the capex is commensurate with historical capex to maintain reliability during a period of broadly consistent performance. On this basis, we consider that the proposed $27 million ($2014–15) reasonably reflects an efficient amount to maintain network reliability over the 2014–15 period within normal weather conditions.
Improving network reliability
SA Power Networks proposes $29.6 million ($2014–15) to improve reliability performance for specific feeders in its network. SA Power Networks submitted that it undertook a customer engagement process —the TalkingPower program to help inform its 2015–20 revenue proposal.155 The majority of customers who responded to this program are said to be satisfied with the current reliability level of the SA Power Networks network. However, customers sought reliability improvement on parts of the network that experience poor reliability as a result of severe weather events.156 SA Power Networks submitted that the following reliability improvement projects respond to this customer feedback. These projects aim to improve network reliability during severe weather conditions and are as follows:157
150 The Essential Services Commission of South Australia (ESCOSA), SA Power Networks Jurisdictional Service Standards for the 2015-20 Regulatory Period Final Targets, October 2014, p. 2.
151 ESCOSA, Fact Sheet: SA Power Networks Jurisdictional Service Standards for the 2015-20 Regulatory Period Final Targets, October 2014, p. 2.
152 ESCoSA, Fact Sheet: SA Power Networks Jurisdictional Service Standards for the 2015–20 Regulatory Period, Implementation of Service Standard Targets, October 2014, p. 3.
153 ESCoSA, Fact Sheet: SA Power Networks Jurisdictional Service Standards for the 2015–20 Regulatory Period, Implementation of Service Standard Targets, October 2014, p. 3.
154 SA Power Networks, response to AER SAPN020, 9 February 2015, p. 6.155 SA Power Networks, Regulatory Proposal 2015-20, 31 October 2014, p. 57.156 SA Power Networks, Regulatory Proposal 2015-20, 31 October 2014, p. 219.157 SA Power Networks, Regulatory Proposal 2015-20, 31 October 2014, p. 219; SA Power Networks, response to
AER SAPN20, 9 February 2015,.
74 Attachment 6 – Capital expenditure | SA Power Networks' determination 2015–20

$16.3 million to ‘harden the network’ to mitigate the impact of severe weather events by improving the durability of 78 powerlines that are susceptible to storms and lightning.
$8.1 million to improve the performance of 24 high voltage feeders that consistently perform below SA Power Networks' reliability targets (i.e. worst performing feeders) during lightning and storms.
$2.3 million to improve network infrastructure to the Hawker and Elliston communities in response to customer concerns.
$2.7 million to conduct a trial of micro-grid to improve the reliability of SA Power Networks' worst performing feeder.
A number of submissions questioned the need for the proposed reliability capex when there is a trend of slowing demand in South Australia.158 In particular, the Government of South Australia questioned the need for a proposed reliability capex that is twice as high as the actual reliability capex over the 2010–15 period. The Government of South Australia noted that it is not prudent to attempt to safeguard the network against all weather events, and suggested that those activities that are most cost effective with the largest benefits should be undertaken.159
A submission from AGL also questioned the need to improve SA Power Networks' network beyond its current level when the network reliability performance is better than the NEM average.160
We also received submissions which questioned the need for the proposed reliability improvement capex when alternative surveys indicate that the majority of SA Power Networks' customers are satisfied with the current level of network reliability and are not willing to pay more for more reliable services. Submissions questioned the nature of SA Power Networks' consumer engagement survey.161 We provided SA Power Networks the opportunity to comment on this aspect of the submissions. SA Power Networks submitted it engaged with a broad range of customer groups and that SA Power Networks is unlikely to benefit financially from the hardening the network initiatives.162
158 Australian PV Institute, Submission to the Australian Energy Regulator on SA Power Networks Regulatory Proposal 2015–20, January 2015, p. 6; Origin Energy, submission to the Australian Energy Regulator on SA Power Networks Regulatory Proposal 2015–20, January 2015, p. 10; South Australian Wine Industry Association, submission to the Australian Energy Regulator on SA Power Networks Regulatory Proposal 2015–20, January 2015, p. 4. Central Irrigation Trust, submission to the Australian Energy Regulator on SA Power Networks Regulatory Proposal 2015–20, January 2015, p. 2; Energy Users Association of Australia, submission to the Australian Energy Regulator on SA Power Networks Regulatory Proposal 2015–20, January 2015, p. 9.
159 Government of South Australia, submission to the Australian Energy Regulator on SA Power Networks Regulatory Proposal 2015–20, January 2015, pp. 6–7.
160 AGL, Submission to the Australian Energy Regulator on SA Power Networks Regulatory Proposal 2015–20, January 2015, p. 11.
161 Energy Consumers Coalition of South Australia, submission to the Australian Energy Regulator on SA Power Networks Regulatory Proposal 2015–20, December 2014, pp. 31–32. Energy Users Association of Australia, submission to the Australian Energy Regulator on SA Power Networks Regulatory Proposal 2015–20, January 2015, pp. 9, 16; Central Irrigation Trust, submission to the Australian Energy Regulator on SA Power Networks Regulatory Proposal 2015–20, January 2015, pp. 2, 5, 6; The Renmark Irrigation Trust, submission to the Australian Energy Regulator on SA Power Networks Regulatory Proposal 2015–20, March 2015
162 SA Power Networks, response to AER SAPN39, 17 March 2015, p. 8.
75 Attachment 6 – Capital expenditure | SA Power Networks' determination 2015–20
Submission from the Energy Consumers Coalition of South Australia also questioned whether the proposed reliability improvement programs will reward SA Power Networks through the STPIS.163 As discussed in Attachment 11 (STPIS) of this preliminary decision, the STPIS regime provides an incentive for distributors to invest in further reliability improvements (via additional capex or opex) only where customers are willing to pay for it. Conversely, the STPIS penalises distributors where they let reliability deteriorate. Importantly, the distributor will only receive a financial reward after actual improvements are delivered to the customers.
The STPIS regime means that reliability improvement programs should generally not be funded through ex-ante capex allowances. However, as set below, SA Power Networks submits that the STPIS will not actually fund some or all of these programs due to the fact that they aim to improve reliability during severe weather conditions. However, SA Power Networks submits that these projects will provide a positive cost-benefit to consumers and therefore should be included within its ex-ante capex allowance.164
We have assessed the applicability of the STPIS to these reliability improvement programs and, where necessary, the merits of the programs for consumers.
Hardening the network
SA Power Networks proposes $16.3 million ($2014–15) for improving the reliability performance of the network during severe weather events. SA Power Networks supports this reliability improvement program with cost-benefit analysis using the value of customer reliability (VCR). SA Power Networks modelled the impact of this program based on the historic performance of its network during the 2010–14 period. SA Power Networks concludes that had the improvements had been in place during the 2010–14 period, the benefits to customers (in terms of the cost of reliability using VCR) would exceed the cost of the program within two years. 165
SA Power Networks submits that the reliability improvements for hardening the network will unlikely be funded through the STPIS. SA Power Networks analysis shows that if this program was implemented for the entirety of 2010–14, SA Power Networks would actually receive a STPIS penalty. This is because STPIS is calculated by excluding the impact of major weather events on SA Power Networks' reliability. The hardening the network program will improve the reliability of specific feeders during major weather events and hence no longer be excluded from the STPIS calculations. However, reliability is not expected to improve the level of average network reliability, and hence the overall impact would be to marginally reduce overall network reliability.166
The combined impact of this program will be to improve reliability to those customers that are supplied by feeders that are targeted for reliability improvement, but that
163 Energy Consumers Coalition of South Australia, submission to the Australian Energy Regulator on SA Power Networks Regulatory Proposal 2015–20, December 2014, p. 42.
164 SA Power Networks, response to AER SAPN020, 9 February 2015, p. 3.165 SA Power Networks, response to AER SAPN020, 9 February 2015, p. 3.166 SA Power Networks, response to AER SAPN020, 9 February 2015, pp. 2-3.
76 Attachment 6 – Capital expenditure | SA Power Networks' determination 2015–20
overall network reliability may not be improved. Hence, SA Power Networks submits that it will not receive a financial benefit to fund this program through the STPIS.167
We note that SA Power Networks modelled the impact of this program based on historical 2010–14 data. Embedded in this analysis is the assumption that the financial benefit arising from the reduction in customer-minutes-off-supply would not be captured under the STPIS financial reward framework, because the improvement are likely to occur during severe weather events, for which SA Power Networks' supply reliability measures are excluded from the STPIS reward calculation as major event days (MED).168
SA Power Networks provided a summary model to demonstrate the above effect.169 SA Power Networks modelled the impact of implementing the reliability improvement programs for the entirety of the 2010–14 period. SA Power Networks found that four MEDs in the analysed period would no longer be classified as MEDs. The average impact of these four days no longer being classified as MEDs would have increased or worsened the underlying customer-minutes-off supply (excluding MEDs) of 3.5 minutes.170
We consider SA Power Networks' analysis has not taken into consideration the change in how MED is defined for the next regulatory period. In its regulatory proposal, SA Power Networks accepted the proposed change to MED definition in the F&A, that the calculation method is to change from the existing Box-Cox method to the STPIS scheme standard IEEE method.171 This change will result in less number of major events days being excluded from the STPIS calculation.172 As set out in section 11.4.3, we have adjusted SA Power Networks' performance targets under the STPIS include historical MEDs that would not have been classified as major event days under the IEEE method.173
Based on information SA Power Networks provided, it is unclear whether SA Power Networks has taken into account the impact of the new definition of MEDs in its modelling of the hardening network program. This makes it difficult for us to be satisfied that the STPIS regime will not fund this program. On this basis, we do not accept the proposed $16.3 million ($2014–15) for hardening the network. However, we note that SA Power Networks should provide more information on whether its cost-benefit analysis of the hardening network program takes into account the new definition of MEDs.
167 SA Power Networks, response to AER SAPN020, 9 February 2015, pp. 2-3.168 SA Power Networks, response to AER SAPN020, 9 February 2015, pp. 2-4.169 SA Power Networks, response to AER SAPN020, 9 February 2015, p. 4.170 SA Power Networks, response to AER SAPN020, 9 February 2015, p. 2.171 AER, Final framework and approach for SA Power Networks Regulatory control period commencing 1 July 2015,
April 2014, p. 14.172 Footnote 23, p.11-11, Attachment 11 – STPIS | SA Power Networks' determination 2015–20 : Under the Box-Cox
method, approximately 4 to 6 most severe storms/heatwaves days each year are excluded from STPIS performance measures. The change to log-normal transformation method would mean the number of major event days being excluded would be reduced to 2 to 4 days each year.
173 See Section 11.4.3, Attachment 11 – STPIS | SA Power Networks' determination 2015–20. Footnote 2.
77 Attachment 6 – Capital expenditure | SA Power Networks' determination 2015–20
As set out in section 11.4.3, our decision takes into account information SA Power Networks provided about the reliability outcomes for "hardening the network" and "improving the low reliable feeders" programs.174
Low reliable feeders
SA Power Networks proposes $8.1 million ($2014–15) to improve the performance of 30 high voltage feeders reported to ESCoSA as consistently performing below SA Power Networks' service standard targets. These are also known as "worst performing feeders".175
There is no regulatory requirement to improve the performance of specific poor performing feeders. Instead, SA Power Networks must monitor and report to ESCoSA on each feeder that has low reliability, and report on action planned for improving the reliability of each identified feeder.176
SA Power Networks developed this reliability improvement program in response to customer concerns expressed through SA Power Networks' customer engagement program.177 SA Power Networks identifies the proposed reliability benefits from this program by considering how reliability outcomes from the 2010–15 period would change if these low performing feeders were improved. This would result in marginal reliability improvements with an annual STPIS benefit of 0.06 per cent per annum. However, SA Power Networks states that these benefits would be offset by the proposed reliability reductions from the hardening the network program.178
Again, based on information SA Power Networks provided, it is unclear whether the new definition of MEDs has been taken into account in these calculations. If it has not, there is a possibility that the new definition of MEDs would result in a positive STPIS outcome when the low reliable feeder improvement program is combined with the hardening network program.
Notwithstanding this, SA Power Networks does not provide any analysis to demonstrate that the consumer benefits to reliability in terms of VCR outcomes will exceed the costs of the program.
We do not accept the proposed $8.1 million capex to address low reliable feeders because we are not satisfied based on the information provided by SA Power Networks that there is a positive cost benefit analysis in terms of VCR, or that these feeders will not otherwise be funded through the STPIS regime.
Hawker and Ellison program
174 SA Power Networks, response to AER SAPN039, 17 March 2015, pp. 2–5.175 SA Power Networks, Regulatory Proposal 2015-20, 31 October 2014, p. 219.176 SA Power Networks, Regulatory Proposal 2015-20, 31 October 2014, p. 218.177 SA Power Networks, AMP 2.1.01 Reliability Performance Management Strategy 2015–20, October 2014, p. 24.178 SA Power Networks, response to AER SAPN020, February 2015, pp. 3–7.
78 Attachment 6 – Capital expenditure | SA Power Networks' determination 2015–20

SA Power Networks proposes $2.3 million ($2014–15) to improve network infrastructure to the Hawker and Elliston communities in response to customer concerns. Similar to the low reliable feeder improvement program, SA Power Networks proposes to improve reliability to specific feeders supplying the Hawker and Ellison communities.179
Similar to the other two reliability improvement programs, SA Power Networks submit that the STPIS benefits of this program would be offset by the reliability reductions from the hardening of the network program when the STPIS impacts of all three programs are combined.180
Again, based on information SA Power Networks provided, it is unclear whether the new definition of MEDs has been taken into account in these calculations. This leaves open the possibility that the new definition of MEDs would result in a positive STPIS outcome for this program even when combined with the hardening network program.
SA Power Networks states that:
The proposed option is the least cost approach utilising proven cost effective technology that is capable of addressing the poor reliability performance of the communities of Elliston and Hawker, returning performance closer to EDC target levels. The need for the project has been identified through direct engagement with customers as described above and a review of network and weather-related performance trends and risks.181
While SA Power Networks considers that this program utilises the most cost effective technology, it has not provided the any cost-benefit analysis or other information to demonstrate the need or efficiency of the proposed expenditure. Based on this, we do not accept the proposed capex.
Micro-grid trial program
SA Power Networks proposes $2.7 million ($2014–15) to conduct a trial of micro-grid on one of the 31 worst performing feeders to improve its reliability. SA Power Networks proposes this program to be a possible solution to improving poor performing feeders.182
This is an R&D style trial with no guarantee on reliability improvement. SA Power Networks submits that the micro-grid technologies need to be evaluated further as they are currently not a viable solution to the majority of low reliability feeder performance issues.183
A submission from the South Australian Council of Social Services questioned the need for capital intensive solution to low reliability feeders and welcomed the proposed trial micro-grid solution.184 We asked SA Power Networks to comment on the impact of the main reliability improvement programs for the hardening the network and improving 179 SA Power Networks, Regulatory Proposal 2015-20, 31 October 2014, p. 219.180 SA Power Networks, response to AER SAPN039, 17 March 2015, pp. 3–7.181 SA Power Networks, AMP 2.1.01 Reliability Performance Management Strategy 2015 - 2020, October 2014, p.
26.182 SA Power Networks, Regulatory Proposal 2015-20, 31 October 2014, p. 219.183 SA Power Networks, response to AER SAPN039, 17 March 2015, p. 9.
79 Attachment 6 – Capital expenditure | SA Power Networks' determination 2015–20
low reliability feeders programs pending the outcome of the trial micro-grid solution. SA Power Networks submitted that the improvement programs are needed as it can be expected that the number of low reliable feeders and worst served customers affected would increase during the 2015–20 period.185
We recognise that this is a trial, and therefore is difficult to accurately quantify the likely benefits in terms of reliability. However, SA Power Networks proposes this program on the basis of reliability improvement rather than reliability maintenance. To allow for reliability improvement, we need to be satisfied that the proposed expenditure will encourage prudent and efficient outcomes and that it will not otherwise be funded through the STPIS regime. Based on the information provided by SA Power Networks, it is not clear what the benefits may be from this trial, and how it will allow SA Power Networks to efficiently maintain or improve network reliability.
We will consider any further information provided by SA Power Networks on the benefits of this program, and how it fits within the suite of reliability improvement programs in our final decision.
B.2.5 Environmental
SA Power Networks proposes $14.9 million ($2014–15, excluding overheads) environmental capex to comply with its obligations under various environmental legislations. We accept this proposed environmental capex as we are satisfied that it will enable SA Power Networks to comply with the applicable regulatory obligations. Accordingly, we have included the proposed capex in our alternative capex estimate.
SA Power Networks' forecast is 83 per cent higher than the actual expenditure incurred during the 2010–15 period to meet its environmental obligations. SA Power Networks submitted that the main reason for the lower actual expenditure is delay in commencing the environment program during the 2010–15 period.186
In its submission, the Energy Consumers Coalition of South Australia (ECCSA) also observed that SA Power Networks actual spending on environmental capex during the 2010–15 regulatory period was under 50 per cent of its allowance. The ECCSA considered that it is poor practice for SA Power Networks to seek to reinstate a similar level of allowance for the 2015–20 period when it had not done the work during 2010–15.187 We took this comment into account in our review of the proposed environmental capex.
SA Power Networks' forecast is comprised of four programs:
$2.7 million for replacing aged oil-filled distribution equipment
$7.6 million for installing oil containment systems on high risk equipment
184 SA Council of Social Services, submission to the Australian Energy Regulator on SA Power Networks Regulatory Proposal 2015–20, January 2015.
185 SA Power Networks, response to AER SAPN039, 17 March 2015, p. 10.186 SA Power Networks, Regulatory Proposal 2015-20, 31 October 2014, p. 222.187 Energy Consumers Coalition of South Australia, submission to the Australian Energy Regulator on SA Power
Networks Regulatory Proposal 2015–20, December 2014, p. 34.
80 Attachment 6 – Capital expenditure | SA Power Networks' determination 2015–20

$0.9 million for rectifying transformers that exceed noise limits, and
$3.7 million for remediating the Mannum Town substation to mitigate potential environmental contamination of the River Murray.
We accept that the $2.7 million ($2014–15) proposed for the Environmental Management Program and the $7.6 million ($2014–15) for the Substation Oil Containment Program will enable SA Power Networks to comply with the relevant environmental obligations.188 Based on the information provided by SA Power Networks, we are satisfied that for each proposed project SA Power Networks assessed the risks of its assets becoming environmental contaminants and developed economic strategies to address these risks. 189
For the proposed Substation Noise Abatement Program, we accept that the $0.9 million ($2014–15) proposed will enable SA Power Networks to comply with the Environmental Protection (Noise) Policy 2007. This policy sets the transformer noise limits at substation boundaries.190 SA Power Networks proposes to control noise at substations that receive complaints.191 We reviewed SA Power Networks' Asset Management Plan for this project and consider that SA Power Networks provided sufficient information to show the proposed expenditure to be the most economically prudent approach.
Finally, we accept that the $3.7 million ($2014–15) proposed for the Mannum Town Substation Program will enable SA Power Networks to comply with the Environment Protection Act 1993. SA Power Networks submitted that the Mannum Town substation has two transformers which had a history of oil leaks of several years.192 This has resulted in a high level of soil contamination, which SA Power Networks had to notify the Environment Protection Authority about.193 SA Power Networks proposes to use the proposed expenditure to replace the Mannum Town Substation and remediate the property to avoid further contamination of the surrounding ground water.194
We took into account SA Power Networks' Asset Management Plan for this program, which assessed the options available for addressing the current contamination. The options SA Power Networks took into account are:195
188 The relevant obligations are the Environment Protection Act 1993, Environment Protection (Water Quality) Policy 2003 and the National Environment Protection Measure (1999). These obligations generally require SA Power Networks to ensure that oil or other substances is not deposited in the surrounding environment, including waterways.
189 SA Power Networks, Regulatory Proposal 2015-20, 31 October 2014, Supporting Document 20.103 Substation Oil Containment AMP 4.1.01, October 2014; and Supporting Document 20.103 Distribution Environmental AMP 4.1.03, October 2014.
190 SA Power Networks, Regulatory Proposal 2015-20, 31 October 2014, Supporting Document 20.103 SA Power Networks Substation Noise Control AMP 4.1.05, October 2014, p. 6.
191 SA Power Networks, Regulatory Proposal 2015-20, 31 October 2014, Supporting Document 20.103 SA Power Networks Substation Noise Control AMP 4.1.05, October 2014, p. 8.
192 SA Power Networks, Regulatory Proposal 2015-20, 31 October 2014, Supporting Document 20.103 SA Power Networks Mannum Town Substation Replacements AMP 4.1.06, October 2014, p. 7.
193 SA Power Networks, Regulatory Proposal 2015-20, 31 October 2014, Supporting Document 20.103 SA Power Networks Mannum Town Substation Replacements AMP 4.1.06, October 2014, p. 7.
194 SA Power Networks, Regulatory Proposal 2015-20, 31 October 2014, p. 222. 195 SA Power Networks, Regulatory Proposal 2015-20, 31 October 2014, Supporting Document 20.103 SA Power
Networks Mannum Town Substation Replacements AMP 4.1.06, October 2014, pp. 9–11.
81 Attachment 6 – Capital expenditure | SA Power Networks' determination 2015–20

Option 1 – Do nothing
Option 2 – Replace Mannum Town Substation to address environmental issues
Option 3 – Transfer load to another site or demand management
Option 4 – Disassemble and rebuild a like for like substation
SA Power Networks submits that it has chosen option 2 as the most economical option. SA Power Networks considered that option 3 is not economically competitive because the Mannum Town Substation is an isolated rural substation which does not have ties to adjacent substations. SA Power Networks also considered that option 4 is not feasible because rebuilding a "like for like" substation will not comply with today's standards. Further, rebuilding a "like for like" substation would mean a mobile substation will be required for an unacceptable length of time. This will leave parts of the SA Power Networks at risk for outage.196 We accept that SA Power Networks provided sufficient information to show the proposed expenditure is the most economically prudent approach.
B.2.6 Other augex — Power Line Environment Committee
SA Power Networks proposes $44.3 million ($2014–15, excluding overheads) expenditure to underground power lines as part of the Power Line Environment Committee (PLEC) program. This program, required under the Electricity Act (South Australia) 1996, aims to improve aesthetics of SA Power Networks' electricity infrastructure by undergrounding power lines in partnership with local councils and the Department of Transport.
The projects that SA Power Networks are required to undertake under this program are prioritised according to the PLEC Charter, and are approved by the SA Energy Minister. PLEC projects are funded two-thirds by SA Power Networks, with the remainder being funded by local councils or the Department of Transport. In practice, SA Power Networks funds all of the required expenditure and collects the remainder as a customer contribution.197
In its submission, the Government of South Australia noted that the PLEC assists the Minister for Mineral Resources and Energy in assessing and recommending the undergrounding of overhead power lines to be undertaken by SA Power Networks as required by the Electricity Act.198
We are satisfied that SA Power Networks has provided sufficient information to demonstrate that the proposed $44.3 million PLEC program will be aimed at complying with the applicable regulatory obligations. Therefore, the proposed expenditure for this
196 SA Power Networks, Regulatory Proposal 2015-20, 31 October 2014, Supporting Document 20.103 SA Power Networks Mannum Town Substation Replacements AMP 4.1.06. October 2014, pp. 9–10.
197 SA Power Networks, Regulatory Proposal 2015-20, 31 October 2014, p. 140; SA Power Networks, response to AER SAPN027, 18 February 2015.
198 Government of South Australia, submission to the Australian Energy Regulator on SA Power Networks Regulatory Proposal 2015–20, January 2015, p. 4.
82 Attachment 6 – Capital expenditure | SA Power Networks' determination 2015–20

program meets the NER requirements and we have included this proposed expenditure in our alternative capex estimate.199
199 NER, clause 6.5.7(a)(2)
83 Attachment 6 – Capital expenditure | SA Power Networks' determination 2015–20

B.3 AER findings and estimates for connections and contributions
Connections capex is incurred by SA Power Networks to connect new small customers to its network and augment the shared network in order to connect customers.
Capital contributions are made up of the value of assets constructed by third parties who are operated by SA Power Networks, and cash provided by customers to fund connection works which specifically benefit them. These contributions are subtracted from total gross capex and as such decrease the revenue that is recovered from all consumers.
B.3.1 Position
We approve SA Power Networks' forecast of proposed forecast connections capex and capital contributions.
SA Power proposed an allowance of $146.2 million ($2014–15) to fund forecast connection works for the 2015–20 regulatory control period, net of customer contributions. Table B-11 presents SA Power's proposed allowance to fund connections expenditure.
Table B-11 SA Power Networks proposed connections capex ($2014/15, million, excluding overheads)
Category 2015-16 2016-17 2017-18 2018-19 2019-20 Total
Connections capex 96.3 99.5 101.8 108.0 114.6 520.2
Customer contributions 71.1 71.2 72.7 77.1 81.9 373.9
Net connections capex 25.2 28.3 29.1 30.9 32.7 146.2
Source: SA Power, Regulatory proposal, p. 230.
SA Power Networks developed its forecast for connections capex based upon forecast population growth, building approvals and building activity. As shown in Figure B-8, SA Power Networks connections forecast is greater from the actual connections capex it incurred in the 2010–15 period and increases over the 2015–20 regulatory control period.
84 Attachment 6 – Capital expenditure | SA Power Networks' determination 2015–20

Figure B-7 Connections capex historic actual and proposed for 2010–2020 period ($2014–15, million, including overheads)
Source: SA Power Networks regulatory proposal
The Australian PV institute submits that it is hard to see how customer connections could be justified by increased projections in demand when a downturn in the South Australian economy is expected following progressive closure of the car industry.200 In its submission, SA Power Networks considers that it is misleading to link connections expenditure with overall flat demand forecasts.201
The Energy Consumers Coalition of South Australia (ECCSA) notes that SA Power Networks has increased its proposed connections allowance, net of capital contributions, since the 2010–15 period. The ECCSA considers that the net allowance should reflect the historic costs of connections rather than some inflated estimate.202
We consider that forecast dwelling growth and construction expenditure are reasonable proxies for forecast growth in connections services for residential and commercial customers. We consider that the trend of SA Power Networks' forecast of connections expenditure and capital contributions is not inconsistent with the trends in forecast construction activity in South Australia as Figure B-9. On the basis of these comparisons, we accept SA Power networks' proposed forecast for connections expenditure and customer contributions.200 Australian PV Institute, APVI submission to the AER on the issues paper on SA Power network's regulatory
proposal, December 2014, p. 4.201 South Australia Power Networks, SA Power Networks response to the AER's issues paper: SA Power Networks
electricity distribution regulatory proposal 2015–16 to 2019–20, p. 4.202 Energy Consumers Coalition of South Australia, SA electricity distribution revenue reset, A response, December
2014, pp. 38–39.
85 Attachment 6 – Capital expenditure | SA Power Networks' determination 2015–20
Figure B-8 Connection capex and non-residential construction activity
Source: BIS Shrapnel, SA Power Networks.
Figure B-9 Connections capex and residential construction activity
86 Attachment 6 – Capital expenditure | SA Power Networks' determination 2015–20

Source: Housing Industry Association, SA Power Networks.
B.4 AER findings and estimates for replacement expenditure
Repex is driven by a distributor's need to replace its assets. In the long run, a distributor's assets will no longer meet the requirements of the network and need to be replaced, refurbished or removed.203 Replacement may occur when an asset fails, or a condition assessment may find it is likely to fail soon and replacement is the most economic option. It may also occur because jurisdictional safety regulations mean it can no longer be safely operated on the network, or because the risk of using the asset exceeds the benefit of continuing to operate it on the network.
In general, the majority of network assets will remain in efficient use for far longer than a single five year regulatory period. As a consequence, a distributor will only need to replace a portion of its network assets in each regulatory control period. The majority of its assets will remain in commission beyond the end of the regulatory control period, and be replaced in subsequent regulatory periods.
Our assessment of repex seeks to establish the portion of SA Power Networks' assets that will likely require replacement over the 2015–20 period and the associated expenditure.
B.4.1 Position
We do not accept SA Power Networks' proposed repex of $772 million204 ($2014–15). We have instead included in our alternative estimate of overall total capex, an amount of $609 million ($2014–15) for repex, excluding overheads, 21 per cent lower than SA Power Networks' proposal. We are satisfied that this amount reasonably reflects the capex criteria. This amount is higher than what SA Power Networks spent on repex in the current regulatory control period.
B.4.2 SA Power Networks' proposal
SA Power Networks' initial proposal for repex is $772 million (excluding overheads). SA Power Networks submitted that this expenditure is required to maintain an acceptable level of distribution safety and reliability by addressing identified defects in, and degradation of, its aging network assets.205
This expenditure covers replacement programs in the following areas: power lines; substations in the network; telecommunications components of the network; and safety related programs. SA Power Networks submitted that these repex programs were required for, respectively, the following reasons:
203 Assets may also be replaced due to network augmentation. In these cases the primary reason for the asset expenditure is not the replacement of an asset that has reached the end of its economic life, but the need to deploy new assets to augment the network, predominantly in response to changing demand.
204 We have presented an amount of $756 million in our preliminary decision capex model due to the allocation of a negative balancing item contained in SA Power Networks RIN response across the capex drivers, including repex.
205 SA Power Networks Regulatory Proposal, October 2014, p. 180.
87 Attachment 6 – Capital expenditure | SA Power Networks' determination 2015–20
A more detailed and frequent power line asset inspection program has collected more asset condition data than was previously available and has resulted in the identification of a large volume of pole defects requiring rectification.206
Substation power transformers in SA Power Networks' network have aged and deteriorated and, as such, they have become more prone to failure.207
The telecommunications components repex programs are the continuation of long term programs necessary for SA Power Networks to maintain an acceptable level of safety and reliability by addressing degradation of its aging assets. 208
Additional safety-related expenditure is required to comply with applicable regulatory obligations or requirements.209
B.4.3 AER approach
We have applied several assessment techniques to assess SA Power Networks' forecast of repex against the capex criteria. These techniques are:
analysis of SA Power Networks' long term repex trends
predictive modelling of SA Power Networks' assets in commission
technical review of SA Power Networks' approach to forecasting, costs, work practices and risk management
consideration of various asset health indicators.
We primarily use our predictive modelling to assess approximately 77 per cent of SA Power Networks' proposed repex in combination with the findings of our technical review. For the remaining categories of expenditure, we do not use our predictive modelling but rely instead on the analysis of historical expenditure for those categories as supported by the findings of our technical review. We note that the other two assessment techniques were considered, but were not ultimately used to reject SA Power Networks' forecast of repex or develop our alternative estimate, though our findings from those other assessment techniques are consistent with our overall conclusion.
Trend analysis
We recognise the limitations of using expenditure trends to forecast future expenditure needs, especially in circumstances where replacement needs may change over time (e.g. a distributor may have a lumpy asset age profile or its legislative obligations may change over time). In recognition of these limitations, we have drawn general observations from the historic trend analysis and benchmarking in relation to repex, but we have not used trend analysis to reject SA Power Networks' forecast of repex or develop our alternative estimate 206 SA Power Networks Regulatory Proposal, October 2014 p. 189.207 SA Power Networks Regulatory Proposal, October 2014 p. 197.208 SA Power Networks, Regulatory Proposal 2015–20, October 2014, p. 201.209 SA Power Networks, Regulatory Proposal 2015–20, October 2014, p. 202.
88 Attachment 6 – Capital expenditure | SA Power Networks' determination 2015–20

Predictive modelling
We use a predictive model known as the repex model to predict likely asset replacement volumes and expenditure based on the number and age of assets in commission, the assumed age of replacement of these assets and their corresponding unit costs.210 The model uses age as a proxy for many factors that drive individual asset replacement.211 The technical underpinnings of the repex model are discussed in detail in the Replacement expenditure model handbook.212 At a basic level, the model predicts the volume of a distributor's assets that may need to be replaced over each of the next 20 years. This prediction is made by looking at the age of assets already in commission, and the time at which, on average, these assets would be expected to be replaced. The unit cost of replacing the assets is used to provide an estimate of replacement expenditure. The data used in the model is derived from the distributor’s regulatory information notice responses and from the outcomes of the unit cost and replacement life benchmarking across all distribution businesses in the NEM. More detail on the repex model and input data is at appendix E.
The repex model can predict the reasonable amount of repex SA Power Networks would require if it maintains its current risk profile for condition-based replacement into the next regulatory control period. Using what we refer to as calibrated replacement lives in the repex model gives an estimate that reflects 'business as usual' asset management practices consistent with achieving the capex objectives. We explain the calibrated replacement life scenario, along with other input scenarios, further in section E.5.
Any material difference from the calibrated (business as usual) estimate could be explained by evidence of a non-age related increase in asset risk in the network (such as a change in jurisdictional safety or environmental legislation) or evidence of significant asset degradation that could not be explained by asset age. We use our other techniques, particularly our technical review, to assess whether there is any such evidence.
We recognise that our predictive modelling cannot perfectly predict SA Power Networks' necessary replacement volumes and expenditure over the next regulatory control period, in the same way that no prediction of future needs will be absolutely precise. However, we consider the repex model is suitable for providing a reasonable statistical estimate of replacement volumes and expenditure for certain types of assets, where we are satisfied we have the necessary data. We explain our reasons for this in Appendix E.
We also recognise that there are reasons why some assets may be better assessed outside of the model. Where we considered this was justified, we have separately assessed those assets by using techniques other than predictive modelling.
210 We first used the predictive model to inform our assessment of the Victorian distributors' repex proposals in 2010. We undertook extensive consultation on this technique in developing the Expenditure Forecasting Assessment Guideline. We have since used the repex model to inform our assessment of repex proposals for Tasmanian, NSW, ACT and QLD distributors.
211 AER, Electricity network service providers, Replacement expenditure model handbook, November 2013, p. 10.212 AER, Electricity network service providers, Replacement expenditure model handbook, November 2013.
89 Attachment 6 – Capital expenditure | SA Power Networks' determination 2015–20
Technical review
We reviewed SA Power Networks' proposed repex focussing on its approach to forecasting, including whether it had conducted cost benefit analysis that was robust and appropriate. We also assessed SA Power Networks' costs, work practices and risk management approach. This was to identify whether risk was systematically overestimated and, in turn, whether its approach to repex and repex forecasts were in accordance with its risk profile in the next regulatory control period.
We have had regard to this to assess whether SA Power Networks' risk profile is different in the next regulatory control period, such that it requires repex above the business as usual prediction of our repex model. We have also relied on this, in combination with analysis of historical repex at the category level, to inform our assessment of repex programs to which we did not apply our predictive modelling.
Asset health indicators
We have used a number of asset health indicators with a view to observing asset health. The indicators we have used are aged based. We acknowledge that these indicators have limited usefulness for providing a check on the outcomes of our predictive modelling because the model also assumes age is a reasonable proxy for asset condition. While providing some context for our decision, we have not relied on these age-based indicators to any significant extent to inform our alternative estimate. We do note that SA Power Networks has also used age based indicators in its proposal. SA Power Networks' use is consistent with a general acceptance that the age of assets is a reasonable proxy for asset condition.213 This assumption accords with our use of our predictive modelling.
B.4.4 AER repex findings
Trends in historical and forecast repex
We use trend analysis to gauge how SA Power Networks' historical actual repex compares to its expected repex for the 2015–20 regulatory control period. Figure B-10 below indicates that SA Power Networks' repex proposal for the 2015–20 regulatory control period is well above that it incurred in the previous regulatory control period and the early 2000s.
213 SA Power Networks, Regulatory Proposal 2015–20, October 2014, p. 86.
90 Attachment 6 – Capital expenditure | SA Power Networks' determination 2015–20

Figure B-10 SA Power Networks' repex - historic actual and proposed for 2015–20 regulatory control period (real $ million 2014–15)
Source: Historical years: SA Power Networks 2010-15 Revised Regulatory Proposal - RIN response - Table 2 -
Capital expenditure by purpose.Current and forthcoming regulatory periods: SA Power Networks -
Regulatory Proposal 2015-20 - Reset RIN - Table 2.1.1 - Standard Control Services Capex
When considering the above trend we acknowledge there are limitations in long term year on year comparisons of replacement expenditure. In particular, we are mindful that:
SA Power Networks' regulatory reporting has been subject to varied definitions of replacement expenditure across time. 214
There are natural variations in a distributors replacement needs over time. Such variations can be a result of a lumpy asset age profiles or changes in relevant regulatory obligations. 215
In its proposal SA Power Networks made several observations on the pattern of its replacement expenditure across time. SA Power Networks stated that the major drivers of its replacement expenditure relate to meeting its regulatory obligations. 216
Figure B-11 compares actual and expected repex in the current and forthcoming regulatory control period.
214 In the Reset RIN we defined replacement expenditure to be: Repex: The non-demand driven capex to replace an asset with its modern equivalent where the asset has reached the end of its economic life. Capex has a primary driver of replacement expenditure if the factor determining the expenditure is the existing asset's inability to efficiently maintain its service performance requirement.
215 NER, cl. 6.5.7 (a).216 SA Power Networks, Regulatory Proposal 2015–20, October 2014, p. 180.
91 Attachment 6 – Capital expenditure | SA Power Networks' determination 2015–20

Figure B-11 Actual and expected repex ($ million real 2014–15)
Source: SA Power Networks - Regulatory Proposal 2015-20 - Reset RIN - Table 2.1.1 - Standard Control Services
Capex
SA Power Networks submitted that it overspent on repex compared to its allowance for the 2010-15 regulatory control period. It attributed this repex overspend to increases in the volume of assets identified as defective compared to the volumes included in the 2010-15 expenditure forecast. The increases in identified defects resulted from enhanced asset inspection practices implemented by SA Power Networks.217
As Figure B-11 indicates, SA Power Networks is proposing to increase its repex for the 2015–20 regulatory control period compared to the current regulatory control period. SA Power Networks submitted that the increases it identified in asset defects impacted the calculation of the overall level of network risk.218 The overall network risk is in turn a major determinant of the obligations in the safety, reliability, maintenance and technical management plan (SRMTMP).219,220 SA Power Networks submitted that the forecast allowance provides it the ability prudently manage the increased level of network risk and return it to the level required for compliance with its regulatory obligations in the SRMTMP.221
We observe that SA Power Networks is proposing a significant increase in repex across the 2015–20 regulatory control period. In these circumstances and where SA Power Networks is citing a shift in network risk across time, we have used our other assessment techniques to assess the basis for the proposed increase in repex.
217 SA Power Networks, Regulatory Proposal 2015–20, October 2014, p. 183.218 SA Power Networks, Regulatory Proposal 2015–20, October 2014, p. 183.219 https://www.sa.gov.au/topics/water-energy-and-environment/electrical-gas-and-plumbing-safety-and-technical-
regulation/compliance-and-enforcement/srmtmp/about-srmtmps220 SA Power Networks, Regulatory Proposal 2015–20, October 2014, pp. 183–84.221 SA Power Networks, Regulatory Proposal 2015–20, October 2014, p. 186.
92 Attachment 6 – Capital expenditure | SA Power Networks' determination 2015–20

Predictive modelling
We use predictive modelling to estimate how much repex SA Power Networks is expected to need in future, given how old its current assets are, and based on when it is likely to replace the assets. We modelled six asset groups using the repex model. These were poles, overhead conductors, underground cables, service lines, transformers and switchgear. To ensure comparability across different distributors, these asset groups have also been split into various asset sub categories. Pole top structures and SCADA were not modelled, along with specialised categories of capex defined by SA Power Networks that were not classified under the groups above. In total, the assets modelled represent 81 per cent of SA Power Networks' proposed repex. Our predictive modelling calculation process is described at Appendix E of this preliminary decision.
We consider the best estimate of business as usual repex for SA Power Networks is provided by using calibrated asset replacement lives and unit costs derived from SA Power Networks' recent forecast expenditure. We have assessed this finding in the context of our technical review before forming a view as to the appropriate repex component of capex for SA Power Networks. We set out below our views on the modelling input scenarios, and our views on their suitability for use in our assessment.
In total for all six modelled categories we have included an amount of $487 million ($2014–15) in our alternative estimate of total forecast capex, compared to SA Power Networks' forecast of $598 million. We have had regard to the outcome and the findings of the technical review in considering whether it is appropriate to forecast repex on the basis of a business as usual estimate, or whether SA Power Networks has provided sufficient evidence to suggest that its replacement needs are higher in the next period,
Submissions on SA Power Networks' repex proposal expressed great concern with SA Power Networks' proposed significant increase in repex. Submissions generally considered there was no change in underlying conditions that would justify an increase in repex. For example, submissions questioned why SA Power Networks requires a significant increase in repex when its reliability performance is above the NEM average. Submissions also observed that SA Power Networks underspent relative to its total capex forecast, which does not support its claim for a sudden and significant increase in repex.222
The Energy Consumers Coalition of SA (ECCSA) considered it was important to recognise that just because an asset has reached the end of its economic life that this does not indicate replacement is needed. The ECCSA reported its members considered they had many assets that were fully depreciated but still used and useful. The ECCSA contrasts this with SA Power Networks' claims that its repex forecast is
222 Energy Users Association of Australia, Submission on SAPN's regulatory proposal 2015–20, January 2015, pp. 5–7; Renmark Irrigation Trust, Submission on SAPN's regulatory proposal 2015–20, January 2015, p. 2; Energy Consumers Coalition of SA, Submission on SAPN's regulatory proposal 2015–20, January 2015, pp. 41–49; SA Financial Counsellors Association Consortium, Submission on SAPN's regulatory proposal 2015–20, January 2015, p. 9; Central Irrigation Trust, Submission on SAPN's regulatory proposal 2015–20, January 2015, p. 6; AGL, Submission on SAPN s regulatory proposal 2015-20, January 2015, p. 11.
93 Attachment 6 – Capital expenditure | SA Power Networks' determination 2015–20
justified on the basis of its aged network.223 The SA Council of Social Services and the SA Greens considered SA Power Networks' argument that it has the oldest average asset life in the NEM was somewhat misleading as its stobie poles have a longer operational life than the timber poles used by other NEM distributors.224
Business SA considered SA Power Networks' unit costs appeared at the upper end of what it considered was reasonable for activities such as replacing poles and overhead conductors. Business SA noted these unit costs were critical as these programs form a large part of SA Power Networks' proposed repex. Further, that the prudency (in need and timing) and efficiency of SA Power Networks' proposed expenditures needed to be demonstrated. Business SA also considered SA Power Networks could investigate more initiatives to extend the life of its assets.225
Model scenario inputs
The repex model uses the following inputs:
The asset age profile input is the number of assets in commission and when each one was installed.
The replacement life input is a mean replacement life and standard deviation (i.e. on average, how old assets are when they are replaced).
The unit cost input is the unit cost of replacement (i.e. on average, how much each asset costs to replace).
In Appendix E, we describe using the repex model to create three scenarios. In each of the three modelling scenarios (base case scenario, calibrated scenario and benchmark scenario) we combined different data for the final two inputs.
Under all scenarios, the first input is SA Power Networks' asset age profile (how old SA Power Networks' existing assets are). This is fixed and does not change.
The second and third inputs can be varied by using different input assumptions about:
how long we expect an asset to last before it needs replacing; and
how much it costs to replace it.
The repex model takes the replacement life input for each asset category and applies it to the actual age of the assets in each asset category, on an asset category basis. In doing this it calculates when and how many assets in the asset category will need replacement in the near future.226 The model then applies the unit cost input to calculate how much expenditure is needed for that amount of replacement in each asset category. This is aggregated to a total repex forecast for each of the next 20 years.
223 Energy Consumers Coalition of SA, Submission on SAPN's regulatory proposal 2015-20, January 2015, pp. 41-49.
224 SA Council of Social Services, Submission on SAPN's regulatory proposal 2015-20, January 2015, p. ii; SA Greens, Submission on SAPN's regulatory proposal 2015–20, January 2015, p. 1.
225 Business SA, Submission on SAPN's regulatory proposal 2015-20, January 2015, pp. 4, 12.226 The repex model predicts replacement volumes for the next 20 years.
94 Attachment 6 – Capital expenditure | SA Power Networks' determination 2015–20

The remainder part of this section outlines the replacement lives and unit cost inputs we tested in the repex model to assess SA Power Networks' proposed repex. As part of our assessment, we compared the outcomes of using SA Power Networks' estimated replacement lives and its unit costs, both forecast and historical, with the replacement lives and unit costs achieved by other NEM distributors. We also used the repex model to determine calibrated replacement lives that are based on SA Power Networks' past five years of actual replacement data. These reflect SA Power Networks' immediate past approach to replacement.
We calculated historic unit costs by dividing historic expenditure by historic volumes and forecast unit costs by dividing forecast expenditure by forecast volumes.
Detail on how we prepared the model inputs is at Appendix E of this preliminary decision.
Finding 'business as usual' repex
The calibrated asset life scenario gives an estimate of SA Power Networks' current risk profile, as evidenced by its own replacement practices. Our estimate trends forward SA Power Networks' current approach to asset risk management, weighted by the actual age of its assets. Calibrated replacement lives use SA Power Networks' recent asset replacement practices to estimate a replacement life for each asset type. These replacement lives are calculated by using SA Power Networks' past five years of replacement volumes, and its current asset age profile (which reveals how many, and how old, SA Power Networks' assets are), to find the age at which, on average, SA Power Networks replaces its assets. The calibrated replacement life represents this age.
The calibrated asset life scenario has been our preferred modelling scenario in recent reviews of other distributors.227 This is because we considered the calibrated replacement lives formed the basis of a business as usual estimate of repex, as they are derived from the distributor's actual replacement practice observed over the past five years.
The distributor decides to replace each asset at a certain time by taking into account the age and condition of its assets, its operating environment, and its regulatory obligations. If the distributor is currently meeting its network reliability, quality and safety requirements by replacing assets when they reach a certain age, then by adopting the same approach to replacement in future they are likely to continue to meet its obligations.
However, if underlying circumstances are different in the next regulatory control period, then this approach to replacement may no longer allow a distributor to meet its obligations. We consider a change in underlying circumstances to be a genuine change in the underlying risk of operating an asset, genuine evidence that there has been a change in the expected non-age related condition of assets from the last
227 See the AER's draft decisions for Essential Energy, Endeavour Energy, ActewAGL and Ausgrid published in November 2014.
95 Attachment 6 – Capital expenditure | SA Power Networks' determination 2015–20

regulatory control period, or a change in relevant regulatory obligations (e.g. obligations governing safety and reliability).
If we are satisfied that there is evidence of a change in a distributor's underlying circumstances, we will accept that future asset replacement should not be based on a business as usual approach. This means that where there is evidence that a distributor's risk profile has changed then it may be necessary to provide a forecast of repex that differs from the business as usual estimate. This forecast would be required in order to satisfy us that the amount reasonably reflects the capex criteria.
Calibrated scenario
We have modelled the calibrated lives using two unit cost assumptions, being:
SA Power Networks' own historical unit costs from the current regulatory control period. These reflect the unit costs SA Power Networks has incurred over the last five years.
SA Power Networks' own forecast unit costs for the next control regulatory period. These reflect the unit costs SA Power Networks expects to incur over the next five years.
The calibrated scenario gives an output of $487 million for historical unit costs and $674 million for forecast unit costs. There is a significant difference between the calibrated scenario outcomes when using SA Power Networks' historical or forecast unit costs. This is because SA Power Networks' forecast unit costs for the next five years are, on average, higher than its unit costs over the last five years. SA Power Networks has also submitted that its unit costs have been based upon historic costs, and validated by its advisor, GHD.228 We note the overall discrepancy observed between the total modelled outcome using forecast and historical unit costs does not reflect this submission. We would also not expect forecast unit costs to be higher than historical unit costs given the incentive framework encourages a distributor to become more cost efficient over time. We note that the outcome using historical unit costs is lower than SA Power Networks' forecast. This suggests that SA Power Networks' proposal is likely to be above a "business as usual" estimate of repex.
We consider that SA Power Networks' historical unit costs are more likely to reflect a realistic expectation of future input costs than its forecast costs. Accordingly, we adopted SA Power Networks' historical unit costs for the purpose of calculating a business as usual repex estimate. Consequently, we consider $487 million forms the most reasonable business as usual estimation of repex. As noted above, we will rely on this outcome and the findings of the technical review in considering whether it is appropriate to forecast repex on the basis of a business as usual estimate, or whether SA Power Networks has provided sufficient evidence to substantiate that its replacement needs are higher in the next regulatory control period, such that its forecast of $589 million is appropriate.
Testing other model inputs
228 SA Power Networks, Regulatory Proposal 2015–20, October 2014, p. 206.
96 Attachment 6 – Capital expenditure | SA Power Networks' determination 2015–20
As outlined earlier (and in Appendix E) we used the repex model to create other scenarios combining different input data. In this section we explain how the outcomes of these other scenarios support our conclusion to use the calibrated scenario.
Base case scenario outcomes
SA Power Networks provided its own estimate of asset replacement lives in the RIN accompanying its regulatory proposal. To test these inputs we include them in a predictive modelling scenario that is referred to as the base case. The base case scenario gives repex estimates of $4.1 billion (historical unit cost) and $4.15 billion (forecast unit cost). These forecasts are significantly higher than SA Power Networks' forecast of $589 million for the six modelled asset groups.
The replacement profile predicted by the repex model under the base case scenario features a sharp step-up in expenditure in the first year of the forecast, which then declines over the remainder of the period (see Figure B-12). This replacement profile indicates that a significant portion of the asset population currently in commission is much older than would be expected using SA Power Networks' estimated replacement lives. Using this input causes the model to immediately predict the replacement of this stock of assets. This, in turn, results in a large stock of predicted asset replacements in the first year of the forecast, which then declines over time.
Figure B-12 Base case scenario outcomes
0
100
200
300
400
500
600
700
800
900
1000
Total Repex ($ millions)
Year
Actual repex ($real, 2014-15)
Forecast repex using SA Power Networks' estimated replacement lives and historic unit costs ($nominal)
Forecast Repex using SA Power Networks' estimated replacement lives and forecast unit costs ($nominal)
Source: SA Power Networks, AER analysis.
97 Attachment 6 – Capital expenditure | SA Power Networks' determination 2015–20

Based on our analysis of the base case scenario outcomes we consider that SA Power Networks' estimated replacement lives are not credible or reliable for the following reasons.
First, if SA Power Networks' actual replacement lives were consistent with their estimated replacement lives, we would not expect to see the observed asset replacement profile. If SA Power Networks' actual asset replacement profile followed its estimated replacement lives, the older assets would have:
already reached the end of their economic (replacement) lives and would have already been largely replaced; and
would therefore not be expected to be in the asset age profile, or be in such insignificant volumes that it would not materially affect the outcome of predictive modelling.
The 'step-up/trend down' replacement profile observed from the base case scenario suggests that a significant proportion of the asset population has survived longer than would be expected using SA Power Networks' estimated replacement lives. These 'survivor' assets have a material effect on the observed outcome. This outcome suggests that SA Power Networks' estimated replacement lives are shorter than those it achieves in practice.
Second, further analysis of the base case scenario reveals the replacement life inputs are the main drivers of the base case scenario outcome. Under the calibrated scenario where SA Power Networks' estimated replacement lives are substituted with calibrated replacement lives, the model outputs are $497 million for historical unit costs and $674 million for forecast unit costs (the calibrated model is discussed in the next section). Taken together with the information from our other analytical techniques and our concerns that SA Power Networks' estimated replacement lives do not reflect its actual replacement practices, we consider that the estimated replacement life information provided by SA Power Networks will not result in a reasonable forecast of business as usual repex.
Benchmarked scenario outcomes
Benchmarked uncalibrated replacement lives
We developed a series of benchmark replacement lives using the data collected from all NEM distributors in the category analysis RINs. For model inputs we used the average, third quartile (above average), and longest replacement lives of all NEM distributors for each category. We discuss how we prepared this data in Appendix E.
As with SA Power Networks' estimated replacement lives, we found using these benchmark replacement lives produced sharp 'step-up/trend down' forecast expenditure, indicating the replacement lives used are likely to be too short for modelling purposes as they predict an unrealistically large 'backlog' of replacement. When used in the model these also produced outcomes higher than SA Power Networks' own forecasts.
Benchmarked calibrated replacement lives
98 Attachment 6 – Capital expenditure | SA Power Networks' determination 2015–20

We developed benchmark calibrated lives by first using the repex model to calculate calibrated lives based on the replacement data from all NEM distributors. For model inputs we again used the average, third quartile (above average), and longest of the calibrated lives of all NEM distributors for each category. We discuss how we prepared this data in Appendix E.
When the average benchmark is applied to the model for SA Power Networks, it produces an outcome higher than the business as usual outcome. Using the replacement life observations at the third quartile gives an outcome similar to the business as usual outcome, while using the highest observation results in an outcome below the business as usual outcome. This indicates that the SA Power Networks achieves asset replacement lives in line with the top quarter of distributors in the NEM. The calibrated benchmark replacement lives may reflect to some extent the particular circumstances of a distributor and this may not be applicable to the business under review. However, this input provided us with a check that SA Power Networks' calibrated replacement lives were reasonable against its peer distributors in the NEM.
Benchmarked unit costs
We developed industry benchmark unit costs using the data collected from all NEM distributors in the category analysis RINs. For model inputs we used the average, first quartile (below average), and lowest unit costs of all NEM distributors for each asset category. We discuss how we prepared this data in Appendix E.
Applying the average benchmark unit costs (in combination with the calibrated lives) in the repex model for SA Power Networks gave an outcome that was higher than the historical unit cost/calibrated life scenario. The outcome when using the first quartile and lowest unit costs was lower than the historical unit cost/calibrated life scenario. This indicates that SA Power Networks' direct historical unit costs are lower than the average of distributors in the NEM, but above those distributors in the first quartile.
Technical review
We discussed our review of SA Power Networks' overall capex forecasting approach in the capex chapter. We highlighted the lack of top-down challenge in SA Power Networks' capex forecasting and that we consider its approach to asset management is overly conservative. We concluded that we did not consider SA Power Networks' total capex forecast was likely to be prudent and efficient. Our views on SA Power Network's total capex forecasting and risk management extend to its replacement expenditure programs.
Overall we consider SA Power Networks' asset management strategies for replacement appear reasonable for assessing and prioritising the replacement works it will require. However, we do not consider there is sufficient evidence to support that the resulting proposed amount of repex is prudent and efficient. There appears to be a lack of robust cost benefit or economic analysis, along with insufficient top-down portfolio assessment.
99 Attachment 6 – Capital expenditure | SA Power Networks' determination 2015–20

SA Power Networks describes its overall repex forecasting methodology as:229
for unplanned asset replacement, applying a forecast based on historical failure rates
for planned asset replacement, assessing a probability of failure and the consequence of failure
for assets of unknown condition, consequence of failure will be considered in conjunction with age, to develop an age-based replacement forecast until such time as condition information becomes available through the asset inspection and/or monitoring program.
Based on our review of SA Power Networks' supporting material, we consider there may be a level of conservatism and subjectivity embedded in some of the above forecasting approaches. For example, some of SA Power Networks' options analysis appears limited, and consequence and criticality rankings have an excessive degree of subjectivity.
During the 2010–15 period SA Power Networks moved to incorporate more condition based risk assessment (CBRM) in its asset management practices to forecast planned asset replacement for the asset groups that represent approximately 80 per cent of capex (poles, overhead conductor, substation transformers and substation circuit breakers).230 SA Power Networks' CBRM methodology assigns a level of risk for an asset group based on three investment scenarios: do nothing, targeted replacement, and replace a fixed percentage of assets every year. The methodology then determines the optimal time to replace the assets.231
SA Power Networks envisages that over the next five years it will create four new CBRM models for the following asset groups: protection and control; ground level switchgear; underground cables; and reclosers and sectionalisers.232 SA Power Networks outlines its evolving approach to improving its asset management of each of its asset groups.233 SA Power Networks outlines some of the drivers that would lead it to change its approach to asset management. These include: increased asset failures leading to replacement; increasing planned expenditure on replacement of assets deemed to be not maintainable without accepting increased risk and reduced network performance; and an age profile indicating that large portions of network will need replacement within the next 20 years.234
While SA Power Networks' approach is likely to improve the condition-based data it has on its network assets, we consider SA Power Networks should demonstrate that
229 SA Power Networks, Expenditure forecasting methodology, October 2014, p. 31.230 SA Power Networks, Asset Management Plan 3.0.01 – Condition Monitoring & Life Assessment Methodology,
October 2014, p. 7.231 SA Power Networks, Asset Management Plan 3.0.01 – Condition Monitoring & Life Assessment Methodology,
October 2014, pp. 10–11.232 SA Power Networks, Asset Management Plan 3.0.01 – Condition Monitoring & Life Assessment Methodology,
October 2014, p. 19.233 SA Power Networks, Asset Management Plan 3.0.01 – Condition Monitoring & Life Assessment Methodology,
October 2014, pp. 23–24.234 SA Power Networks, Asset Management Plan 3.0.01 – Condition Monitoring & Life Assessment Methodology,
October 2014, p. 13.
100 Attachment 6 – Capital expenditure | SA Power Networks' determination 2015–20

changes to its asset management strategies result in prudent and efficient expenditure. Further, that SA Power Networks' demonstrates quantified benefits of improving its strategies and the need for changes. In particular, given that SA Power Networks has consistent historical reliability performance and benchmarks that compare well to other NEM distributors as discussed in the capex chapter.
Based on our review of SA Power Networks' data, during the 2010–15 regulatory control period, a change in its inspection practices resulted in it identifying an increased number of defects. We recognise there may be an increasing defect backlog SA Power Networks is identifying as a result of changes in inspection frequency, and possibly as a result of changes in the inspection standards being applied. In particular, SA Power Networks proposed significant increases in its pole, conductor and other line equipment repex categories. Although SA Power Networks has become more aware of the extent of defects that have existed in its network undetected for some years, there appear to be no adverse trends apparent in its network performance metrics. We do not consider there is sufficient evidence that SA Power Networks' asset risk has materially changed, or that there is a technical reason for a change in underlying risk. We consider there is a reasonably well demonstrated backlog of defects that SA Power Networks could prudently seek to address. However, we do not consider SA Power Network has established the need for a near fourfold increase in pole replacement in the 2015–20 regulatory control period to address this backlog. That is, SA Power Networks has not demonstrated a need for repex estimate other than the business as usual in estimate of repex. We consider there is insufficient evidence to establish that SA Power Networks' repex forecast is the prudent and efficient amount required.
SA Power Networks have used a number of approaches to develop their repex forecast including the proprietary CBRM tool, internally developed spreadsheet models, and forecasts developed by consultants. Our review of SA Power Networks' forecasting methods suggests that age, defect volumes, and corrosion zone are material factors in its forecast. Our technical review has also led us to understand that defect volumes is an important factor that SA Power Networks’ CBRM tool relies on in forecasting risk, and hence replacement volumes. Given that annual defect volumes have increased sharply due to changes in SA Power Networks' inspection practices, we consider this may have created an upwards bias in SA Power Networks' forecasts as a result of any backlog of replacement. We have not seen if or how SA Power Networks has made any correction for any temporary clearance of any backlog in replacements that this change in defect rate may have introduced.
Un-modelled repex
As noted in Appendix E, repex categorised as: supervisory control and data acquisition (SCADA), network control and protection (collectively referred to hereafter as SCADA); Pole top structures; and "Other" in SA Power Networks' RIN response was not included in the repex model.
We did not consider these asset groups were suitable for inclusion in the model, either because of lack of commonality, or because we did not possess sufficient data
101 Attachment 6 – Capital expenditure | SA Power Networks' determination 2015–20

to include them in the model. Together, these categories of repex account for 19 per cent of SA Power Networks' proposed repex.
Because we are not in a position to directly use predictive modelling for these asset categories, we have placed more weight on analysis of historical repex and our technical review in relation to these categories. Our analysis of these is included below.
Other repex
SA Power Networks categorised a number of assets under an "Other" asset group in its RIN response. SA Power Networks forecast $39 million of repex for these assets for the 2015–20 regulatory control period. This represents a 13 per cent increase over the 2010–15 regulatory control period, or $4 million.
We do not consider expenditure for this asset category has materially changed from the last regulatory control period. We also note that the difference is small in magnitude. Consequently, we consider SA Power Networks' forecast repex of $39 million is likely to reflect the capex criteria and have included this amount in our alternative estimate of total forecast capex.
SCADA, network control and protection
SA Power Networks has proposed repex of $64 million for SCADA, network control and protection. This represents a doubling in expenditure over the 2010–15 regulatory control period, or $33 million.
SA Power Networks' expenditure on this asset category increased significantly in the final year of the 2010–15 regulatory control period. SA Power Networks' proposal for the next period includes a further increase in repex at the commencement of the 2015-20 regulatory control period, which remains relatively stable throughout the period.
We reviewed SA Power Networks' supporting business cases and asset management plans for its SCADA assets and expenditure. We are of the view that it relied on assumptions that were not sufficiently justified. Additionally, we consider that SA Power Networks did not make a satisfactory case for the investment. That is, its own cost benefit analysis does not appear to support the investment.
In reaching our view on this asset category, we have considered our technical review of SCADA, network control and protection, and our overall views on systemic issues with SA Power Networks' forecasting approach and assessment of risk. Taking these factors into account, we do not consider the step increase proposed by SA Power Networks for SCADA repex is justified. We consider SA Power Networks' SCADA, network control and protection repex from last period of $31 million is likely reasonably to reflect the capex criteria and have included this amount in our alternative estimate of total forecast capex.
Pole top structures
102 Attachment 6 – Capital expenditure | SA Power Networks' determination 2015–20

SA Power Networks has forecast $72 million of repex on pole top structures over the 2015–20 regulatory control period. This represents a 36 per cent increase over the 2010–15 regulatory control period, or $19 million.
We considered SA Power Networks' proposed step increase in pole top structures in our technical review, particularly as it related to the replacement of pole assets. In doing so, we came to the view that SA Power Networks may have a backlog issue related to increased identification of condition-based issues with its power line assets. However, we did not consider SA Power Networks had justified the increase in expenditure from the last regulatory control period of the level it had proposed. In particular, it had not established a change in risk that would necessitate such a significant increase. Given this, we do not consider there is sufficient justification for a step increase in pole top structure repex in the 2015–20 regulatory control period. We consider SA Power Networks' actual pole top repex from last period of $52 million is likely to reflect the capex criteria and have included this amount in our alternative estimate of total forecast capex.
Network health indicators
We consider an important determinant of variations in repex levels over time is the condition of network assets. We expect distributors will have regard to the condition of its network assets when forecasting the capex it requires safely to meet expected demand while maintaining the quality, reliability and security of supply.235
Our trend analysis indicates that SA Power Networks is forecasting an increase to its recent repex requirements for the 2015–20 regulatory control period. We would expect that this increase would be reflected in a deterioration in the condition of its network assets in recent years and or SA Power Networks' age profile which may suggest a need for substantial increases in asset replacement.
To inform our understanding of the condition of SA Power Networks' network assets, we have considered trends in the remaining service life of SA Power Networks' network assets.
Trends in the remaining service life of network assets
Figure B-13 plots the estimated residual service life of SA Power Networks' assets across time and that forecast for the 2015–20 period.
235 NER, cl. 6.5.7(c).
103 Attachment 6 – Capital expenditure | SA Power Networks' determination 2015–20

Figure B-13 SA Power Networks estimated residual service life by asset class
0
5
10
15
20
25
30
2005-06 2006-07 2007-08 2008-09 2009-10 2010-11 2011-12 2012-13 2013-14 2014-15 2015-16 2016-17 2017-18 2018-19 2019-20
Asset lives -estimated residual service life(years)
Overhead network assets less than 33kV (wires and poles) Underground network assets less than 33kV (cables)
Distribution substations including transformers Overhead network assets 33kV and above (wires and towers / poles etc)
Overhead network assets 33kV and above (wires and towers / poles etc) Zone substations and transformers
Source: SA Power Networks - EBT RIN - 4. Assets (RAB) - Table 4.4.2 Asset Lives – estimated residual service life
(Standard control services).
Figure B-13 shows that SA Power Networks' residual asset lives have declined since 2006 and is forecast increase through the 2015–20 regulatory control period.
We acknowledge limitations exist when using estimated residual service life to indicate the trend in the underlying condition of network assets. In particular, we are mindful that increases in growth related capex relative to repex can distort this measure's effectiveness as a proxy of the trend in the existing network asset's condition. That is, if additions to the asset base are of a higher value than those being replaced the residual service life will improve without necessarily addressing any underlying asset condition deterioration.
However, the declining historical trend in SA Power Networks residual asset lives (where age is a proxy for asset condition) suggest that while asset health may have declined, the proposed amount provides for increased repex relative to the current regulatory control period.
B.5 AER findings and estimates for capitalised overheads
Capitalised overheads are costs associated with capital works that have been capitalised in accordance with SA Power Network's capitalisation policy. They are generally costs shared across different assets and cost centres.
B.5.1 Position
104 Attachment 6 – Capital expenditure | SA Power Networks' determination 2015–20
We do not accept SA Power Network's proposed capitalised overheads. We have instead included in our alternative estimate of overall total capex and amount of $84.1 million ($2013-14) for capitalised overheads. This is 18 per cent lower than SA Power Network's proposal of $102.1 million. We are satisfied that this amount reasonably reflects the capex criteria.
B.5.2 Our assessment
As a logical proposition we consider that reductions in SA Power Networks forecast expenditure should see some reduction in the size of SA Power Networks total overheads. Given that our assessment of SA Power Networks proposed direct capex, demonstrates that a prudent and efficient distributor would not undertake the full range of direct expenditure contained in SA Power Networks proposal. It follows that we would expect some reduction in the size of SA Power Networks capitalised overheads. We do accept that some of these costs are relatively fixed in the short term and so are not correlated to the size of the expenditure program. However, we maintain that a portion of the overheads should vary in relation to the size of the expenditure.
We have engaged with SA Power Networks regarding its overheads.236 We sought to understand how overheads vary with the size of SA Power Networks expenditure program and in particular to quantify the proportion of overheads that are fixed and varied. SA Power Networks provided a breakdown of the components of its overheads that it considers fixed and variable.237
Further SA Power Networks submitted that:238
we would expect that for a 1% increase/decrease in total network capex, comprising augmentation, replacement and/or gross connections capex, there would be an equivalent 0.67% (averaged over 5 years) adjustment to capitalised overheads.
We have considered the relationship between opex and capex, specifically whether it is necessary to account for the way the CAM allocates overheads between capex and opex in making this decision. We considered that this was not necessary in order to satisfy the capex criteria. This is because:
Our opex assessment sets the efficient level of opex inclusive of overheads and so has accounted for the efficient level of overheads required to deliver the opex program by applying techniques which utilise the best available data and information for opex.
The starting point of our capitalised overheads assessment is SA Power Networks proposal, which is based on its CAM. As such, SA Power Networks forecast application of the CAM underlies our estimate. We have only reduced the capitalised overheads to account for the reduced scale of SA Power Networks approved capex based on assessment techniques best suited to each of the capex
236 AER, Info request SAPN 033237 SA Power Networks, response to AER information request SAPN 033238 SA Power Networks response to AER information request SAPN 033
105 Attachment 6 – Capital expenditure | SA Power Networks' determination 2015–20
drivers. In doing so we have accounted for there being a fixed proportion of capitalised overheads.
We have formed our alternative estimate on the basis of the information provided by SA Power Networks. On this basis we consider that a 1 per cent reduction in SA Power Networks forecast capex should result in a 0.67 per cent reduction in SA Power Networks capitalised overheads. As a result of a 26 per cent reduction in SA Power Networks direct capex that attract overheads, we consider a reduction of 18 per cent in capitalised overheads reasonably reflect the capex criteria.
B.6 AER findings and estimates for non-network capex
Non-network capex includes expenditure on information technology (IT), buildings and property, motor vehicles, and plant and equipment.
B.6.1 Position
SA Power Networks forecast total non-network capex of $637.7 million ($2014-15) for the 2015–20 regulatory control period.239 We do not accept SA Power Networks' proposal. We have instead included an amount of $417.4 million ($2014-15) for forecast non-network capex in our alternative estimate which we consider reasonably reflects the capex criteria.
In coming to this view, we have found that:
SA Power Networks' forecast non-network IT capex of $353.7 million does not reasonably reflect the efficient costs that a prudent operator would require to achieve the capex objectives. We are not satisfied that the proposed portfolio of IT projects is deliverable within the 2015–20 regulatory control period, or that the proposed capex reflects the efficient costs required to meet the identified need.240 We consider that forecast capex of $213.6 million ($2014-15) reasonably reflects a prudent and efficient level of capex that is deliverable in the 2015–20 regulatory control period.
neither the methodology used by SA Power Networks to forecast its $111.6 million ($2014-15) buildings and property capex, nor the supporting business cases, provide evidence that the forecast capex is prudent and efficient or is required to achieve the capex objectives. We consider that an estimate of forecast capex of $71.8 million ($2014-15), reflecting SA Power Networks' historical capex in the 2010–2015 regulatory control period, will allow SA Power Networks to continue to invest in prudent construction, refurbishment, and maintenance projects as required.
SA Power Networks' forecast fleet capex of $146.0 million ($2014-15) does not reasonably reflect the efficient costs that a prudent operator would require to
239 SA Power Networks, 21.11b - SEM-Capex Model 2015 V17.2, Reconciliation tab. This excludes communications expenditure of $25.4 million which is discussed in this section but modelled as part of network capex in line with SA Power Networks' capex model.
240 NER, cl. 6.5.7(c).
106 Attachment 6 – Capital expenditure | SA Power Networks' determination 2015–20
achieve the capex objectives. We consider that forecast capex of $103.2 million ($2014–15) reasonably reflects the required expenditure. This represents a reduction of 29 per cent from SA Power Networks' proposed fleet capex for the 2015–20 regulatory control period. We have made adjustments to SA Power Networks' proposed vehicle replacement, new fleet and safety initiatives expenditure.
B.6.2 SA Power Networks' proposal
Figure B-14 shows SA Power Networks' actual and expected non-network capex for the period from 2000-01 to 2014-15, and forecast capex for the 2015–20 regulatory control period.
Figure B-14 SA Power Networks' non-network capex 2000-01 to 2019-20 ($million, 2014-15)
0
20
40
60
80
100
120
140
160
180
$ million 2014-15
SAPN - Non-network capex
Source: SA Power Networks, Regulatory information notice, template 2.6; ETSA Utilities, RIN response for 2010-15
regulatory control period, template 2.2.1; AER analysis. Includes capitalised overheads.
SA Power Networks' forecast non-network capex for the 2015–20 regulatory control period is 57 per cent higher than actual and expected capex in the 2010–2015 regulatory control period.
Our analysis of longer term trends in non-network capex suggests that SA Power Networks has forecast capex for this category at historically high levels. Non-network capex in each year of the 2015–20 regulatory control period is forecast to be higher than actual capex in any prior year for which comparable data is available. We therefore consider that SA Power Networks' forecast non-network capex program warrants further review to confirm the need and timing for the proposed expenditure.
107 Attachment 6 – Capital expenditure | SA Power Networks' determination 2015–20
We have assessed forecast expenditure in each category of non-network capex. Analysis at this level has been used to inform our view of whether forecast capex is reasonable relative to historical rates of expenditure in each category, and to identify trends in the different category forecasts which may warrant further review.241 Figure B-15 shows SA Power Networks' actual and forecast non-network capex by sub-category for the period from 2008-09 to 2019-20.
Figure B-15 SA Power Networks' non-network capex by category ($million, 2014-15)
0
10
20
30
40
50
60
70
80
90
2008-09 2009-10 2010-11 2011-12 2012-13 2013-14 2014-15 2015-16 2016-17 2017-18 2018-19 2019-20
$ million 2014-15
IT Motor vehicles Buildings and property Plant and equipment Communications
Source: SA Power Networks, Regulatory information notice, template 2.6; SA Power Networks, Category Analysis
RIN 2014, template 2.6; AER analysis.
SA Power Networks has forecast significant increases in capex for IT, motor vehicles, and buildings and property in the 2015–20 regulatory control period. SA Power Networks has proposed to maintain capex on plant and equipment at levels consistent with the 2010–2015 regulatory control period, while communications expenditure is forecast to reduce substantially.
The peak in non-network capex in 2015-16 is largely driven by peaks in the IT and motor vehicles categories in that year. Forecast capex for both of these categories generally declines after 2015-16 but remains at historically high levels throughout the remaining years of the regulatory control period. SA Power Networks also forecast buildings and property capex to be at historically high levels from 2016-17 onwards.
We therefore undertook a detailed review of the justification for SA Power Networks' forecast IT, motor vehicles, and buildings and property capex to confirm the need and timing of the forecast expenditure. Our conclusions on each of these categories of non-network capex are summarised below.241 NER, cl. 6.5.7(e)(5).
108 Attachment 6 – Capital expenditure | SA Power Networks' determination 2015–20
B.6.3 Information technology capex
SA Power Networks has forecast non-network IT capex of $353.7 million ($2014-15) for the 2015–20 regulatory control period.242 This is an increase of $194.4 million or 122 per cent from actual and estimated expenditure in the 2010–2015 regulatory control period.
SA Power Networks has divided its IT capex forecast into recurrent and non-recurrent expenditure segments. Recurrent expenditure is defined as the base level of expenditure necessary to keep existing IT systems and infrastructure operational during the 2015–20 regulatory control period. Non-recurrent expenditure is capex needed to respond to business requirements identified for the 2015–20 regulatory control period. This category includes business change costs, and is influenced by internal, external and technology drivers including risk mitigation, regulatory changes, customer preferences and emerging technology trends.243 As shown in Figure B-16, the overall increase in IT capex in the 2015–20 regulatory control period is largely driven by an increase in non-recurrent IT capex.
242 SA Power Networks, Regulatory proposal, October 2015, p. 235. SA Power Networks 's post tax revenue model includes forecast capex for IT assets of $358.7 million ($2014-15).
243 SA Power Networks, Regulatory proposal, October 2014, p. 233.
109 Attachment 6 – Capital expenditure | SA Power Networks' determination 2015–20
Figure B-16 SA Power Networks' non-network IT capex from 2008-09 to 2019-20 ($million, 2014-15)
0
10
20
30
40
50
60
70
2008-09 2009-10 2010-11 2011-12 2012-13 2013-14 2014-15 2015-16 2016-17 2017-18 2018-19 2019-20
$ million 2014-15
Non-recurrent IT capex Recurrent IT capex
Source: SA Power Networks, Regulatory information notice, template 2.6; SA Power Networks, CA RIN response,
template 2.6; AER analysis.
Non-recurrent IT capex projects and business change costs of $227.8 million account for nearly two-thirds (64 per cent) of SA Power Networks' forecast IT capex for the 2015–20 regulatory control period.244 While recurrent IT capex is also forecast to increase from historical levels, expenditure in this category is relatively smooth and declining across the period from a peak in 2014-15. SA Power Networks' recurrent IT capex is driven by the ongoing needs of its existing IT applications and infrastructure. By its nature, non-recurrent IT capex is more likely to relate to the introduction of new capabilities and technologies into the business, and therefore be more discretionary in nature than recurrent IT capex. For these reasons, we have focussed on this non-recurrent category in our assessment of the prudence and efficiency of SA Power Networks' forecast IT capex.
Non-recurrent IT capex
SA Power Networks has proposed 24 non-recurrent IT capex projects, with a total cost of $181.9 million ($2014-15). Of these projects, 14 include associated business change costs totalling a further $45.8 million.245 These business change costs cover activities such as change management and business process changes, providing for additional labour resources to ensure that IT changes are managed and embedded efficiently
244 SA Power Networks, Regulatory proposal, October 2014, p. 237.245 SA Power Networks, Regulatory proposal, October 2014, pp. 236-237.
110 Attachment 6 – Capital expenditure | SA Power Networks' determination 2015–20
and effectively.246 We have assessed SA Power Networks' forecast non-recurrent IT capex from both a top down portfolio perspective and through a bottom up evaluation of the individual business cases to assess the prudence and efficiency of the proposed capex.
IT portfolio review - resourcing and deliverability
SA Power Networks' forecast non-recurrent IT capex of $227.8 million ($2014-15) is an increase of $158.5 million or 229 per cent from actual and expected non-recurrent IT capex in the 2010–2015 regulatory control period.247 The proposed portfolio of projects is complex, interrelated, and affects a number of SA Power Networks' core IT systems. The proposed works will have substantial implications for SA Power Networks' ongoing operations, as evidenced by the $45.8 million in business change costs included in the program. SA Power Networks proposes to implement these wide ranging business and system changes largely within a five year regulatory control period.248 We have therefore considered whether such a large scale and complex portfolio of IT investment is likely to reflect the costs of a prudent operator with respect to the deliverability and resourcing requirements of the program.
SA Power Networks' proposal reflects its IT strategy to establish an integrated 'end state' approach to investments in data, systems, processes and people.249 Based on this strategy SA Power Networks is seeking to implement a set of interrelated IT and business changes impacting on a wide range of core IT systems and business processes. SA Power Networks submitted that its IT capex program is required in order to:250
manage lifecycle changes of core systems
enable regulatory and legal compliance
move towards cost-reflective pricing tariffs and respond to changing customer preferences
drive efficiencies across the business
maintain current levels of service and manage risks.
This is the largest portfolio of IT capital investments planned by SA Power Networks in the past 20 years, as shown in Figure B-17 below. Including business change costs, the forecast is more than three times the size of the non-recurrent IT capex program delivered in the 2010–2015 regulatory control period. In our view, the sheer scale and complexity of the portfolio of works is likely to present deliverability risks for the non-recurrent IT capex program.
246 SA Power Networks, Regulatory proposal, October 2014, p. 245.247 SA Power Networks, Regulatory information notice, template 2.6; SA Power Networks, CA RIN response,
template 2.6; AER analysis.248 SA Power Networks, IT capital and operating expenditure model, Business Cases - Summary tab.249 SA Power Networks, Regulatory proposal, October 2014, p. 232.250 SA Power Networks, Attachment 20.32 - Information Technology Investment Plan 2015-2020, October 2014, pp.
5-6.
111 Attachment 6 – Capital expenditure | SA Power Networks' determination 2015–20

Figure B-17 SA Power Networks' IT investment drivers and lifecycle stages
Source: SA Power Networks, Attachment 20.43 - IT Sourcing and Resourcing Plan 2015-20, 20 October 2014, p. 6.
SA Power Networks' actual IT capex in the 2010–2015 regulatory control period was itself a substantial increase on IT capex in the 2005–2010 regulatory control period. SA Power Networks stated that over the 2010–2015 regulatory control period, its IT function was challenged by the significant increase in demand for IT services and the focus on IT as a means for improving business outcomes:251
The gap between the capabilities required to meet the demand, and the SA Power Networks IT operating model became increasingly evident, culminating in the creation of an IT Transformation program in 2013.
SA Power Networks submitted an IT sourcing and resourcing plan. This provides an estimate of the resources required to deliver the forecast IT capex program, accompanied by a broad discussion on the type of sourcing to be employed.252
In relation to delivering the forecast IT capex, SA Power Networks stated that this will require the IT function to operate in new and more effective ways to deliver an increased level of work within the timeframes that the business requires the new functionality.253 Further, SA Power Networks acknowledged that the resource requirements derived from the 2015-20 regulatory control period forecast are significant in comparison to historical demand.254
SA Power Networks has estimated that delivering the IT capex program will require between 169 and 210 full time equivalent (FTE) resources over the 2015–20 regulatory control period. This represents an increase of 90 FTEs in one year from 2014-15 to 2015-16.255
251 SA Power Networks, Attachment 20.43 - IT Sourcing and Resourcing Plan 2015-20, 20 October 2014, p. 3.252 SA Power Networks, Attachment 20.43 - IT Sourcing and Resourcing Plan 2015-20, 20 October 2014. 253 SA Power Networks, Attachment 20.43 - IT Sourcing and Resourcing Plan 2015-20, 20 October 2014, p. 5.254 SA Power Networks, Attachment 20.43 - IT Sourcing and Resourcing Plan 2015-20, 20 October 2014, p. 3.255 SA Power Networks, Attachment 20.43 - IT Sourcing and Resourcing Plan 2015-20, 20 October 2014, p. 11.
112 Attachment 6 – Capital expenditure | SA Power Networks' determination 2015–20
SA Power Networks has proposed to source the additional resources required to deliver the IT capex program from outsourced distributors through its IT Services Panel. Given that SA Power Networks' IT capex program has historically been delivered almost entirely 'in-house',256 this represents a significantly increased reliance on outsourced resources. SA Power Networks has forecast the proportion of outsourced FTEs used to deliver the IT capex program will increase from 5 per cent in 2013-14 to 47 per cent in 2014-15 and peak at 65 per cent in 2015-16.257 In total, SA Power Networks has proposed to outsource the delivery of 63 per cent of the total IT capex program over the 2015–20 regulatory control period. This compares to the mean level of IT outsourcing for Australian utilities in 2013, for both capital and operational roles, of 24 per cent.258
SA Power Networks' IT investment plan also covers aspects of SA Power Networks' delivery model including IT sourcing, vendor risk and performance management, the IT operating model, and IT delivery, management and governance.259 SA Power Networks has restructured its IT services, altered governance arrangements as well as its distributor supply model, and has defined the extent of resources it will require to undertake the proposed program of work. However, based on our review, it has not provided evidence that shows:
how it will be able to leverage these arrangements to deliver such an extensive program in a short period of time
whether it has the capability to manage and accommodate the extent of changes required over this period while also maintaining business as usual operations,
such that it will be able to expend the forecast capex in an efficient and prudent way over the 2015–20 regulatory control period.
For example, in 2011 external consultancy Solisma undertook a review of SA Power Networks' management of IT functions and delivery of IT services. This review assessed the efficacy of SA Power Networks' IT service management capability, measured by a capability maturity model. Solisma found that:260
“…overall ISO/IEC 20000 process compliance was measured to be at 45%, with ITIL process maturity measured at 2.1 out of a maximum level of 5; this is less than ideal… targets should be of at least 80% and level 3.0 maturity overall.”
SA Power Networks is now targeting a capability maturity rating of 4. However, its current assessment is that, while this rating has improved since 2011, it would not exceed 2.5 overall at this time.261 In our view, this suggests that SA Power Networks'
256 SA Power Networks, Attachment 20.43 - IT Sourcing and Resourcing Plan 2015-20, 20 October 2014, p. 27.257 SA Power Networks, Attachment 20.43 - IT Sourcing and Resourcing Plan 2015-20, 20 October 2014, p. 20.258 SA Power Networks, Attachment 20.43 - IT Sourcing and Resourcing Plan 2015-20, 20 October 2014, pp. 7 and
21.259 SA Power Networks, Attachment 20.32 - Information Technology Investment Plan 2015-2020, 20 October 2014,
pp. 59-63.260 Solisma, Service Management Maturity Assessment Report - May 2011, quoted in SA Power Networks, BC29 - IT
Management and Operations, pp. 9-10.261 SA Power Networks, BC29 - IT Management and Operations, p. 10.
113 Attachment 6 – Capital expenditure | SA Power Networks' determination 2015–20

current IT service management capability is relatively immature and may struggle to deliver the proposed IT capital program in the timeframe proposed while also changing the way in which the IT function is resourced and maintaining ongoing IT operations.
Despite the analysis presented by SA Power Networks of the number of resources required, in our view the question of the specific skills required, and the timely availability of these skills and resources is not clear from the information provided. Furthermore, SA Power Networks has not addressed how it will be able to draw all these resources and skills together to successfully deliver the proposed outcomes in the timeframe proposed.
In our view, the observations set out above suggest a significant level of risk associated with SA Power Networks' ability to deliver the proposed non-recurrent IT capex program. This includes risks that:
the program may be delayed or costs increase
necessary resources may be difficult to obtain and utilise efficiently in a timely way
identified benefits may not be realised
business and process changes may prove difficult or take longer to implement.
The Consumer Challenge Panel (CCP) reached a similar conclusion in its submission on SA Power Networks' regulatory proposal. The CCP submitted that, while it seems SA Power Networks' IT plans are well developed, the sheer volume of additional projects would not only require additional resources but would be high risk to the business.262
Based on our review, we are not satisfied that SA Power Networks' non-recurrent IT capex program is prudent, or that SA Power Networks is likely to deliver the full program in the 2015–20 regulatory control period as proposed. This view is based on our assessment of the information provided by SA Power Networks and reflects our conclusions that:
the proposed program is a large scale, complex and interdependent program of works which impacts broadly across core IT systems and business processes
the program is to be delivered in a relatively short timeframe for such a complex portfolio of works
SA Power Networks' IT service management capability is, at present, relatively immature
SA Power Networks' proposal to substantially increase its use of outsourced resources to deliver 63 per cent of the IT capex program presents delivery risks given SA Power Networks has not previously applied this level of outsourced service delivery in the IT area
the risks to the successful delivery of this program in the timeframe proposed, in terms of resourcing, implementation, business process changes and the realisation of benefits, appear high
262 Consumer Challenge Panel Sub-panel 2, Submission to the AER, 30 January 2015, p. 23.
114 Attachment 6 – Capital expenditure | SA Power Networks' determination 2015–20
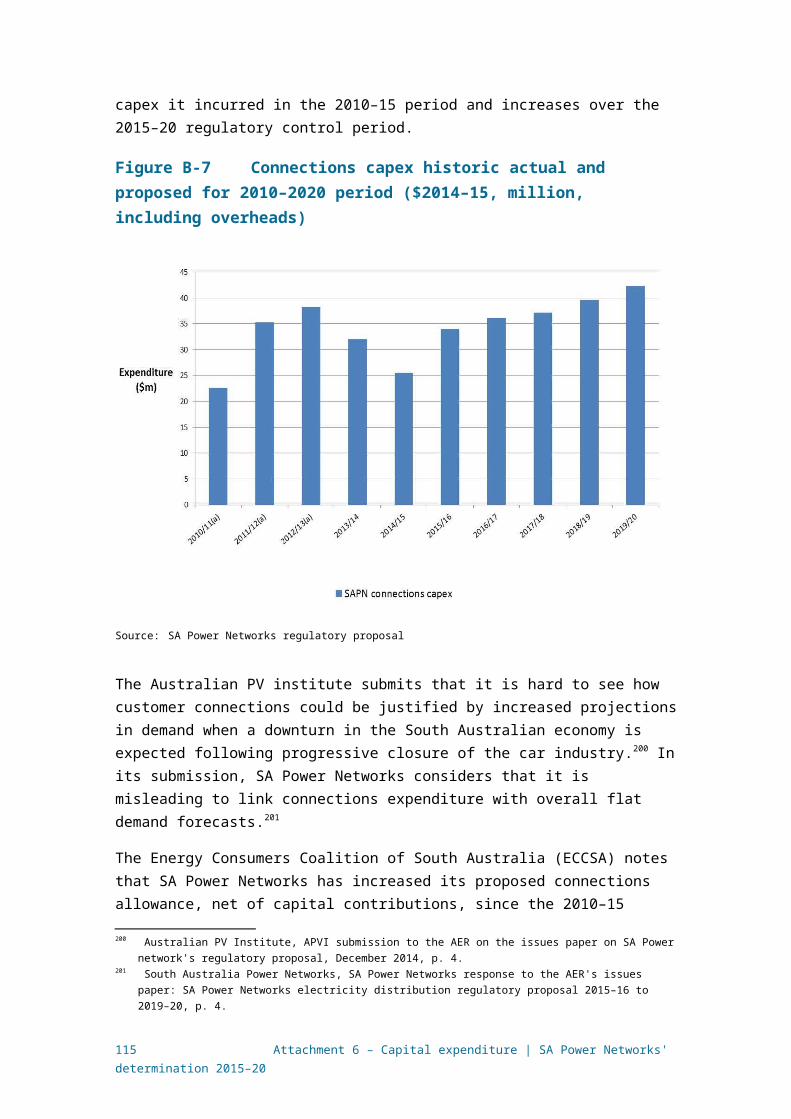
in our view, a prudent operator would undertake such a portfolio of work over a longer timeframe to reduce delivery and resourcing risk.
Business case review
Each non-recurrent IT capex project outlined in SA Power Networks' regulatory proposal is supported by a business case setting out the estimated costs, options analysis, cost-benefit analysis and justification for the preferred option.263 SA Power Networks' business cases summarise the need, timing and scope of the proposed non-recurrent IT capex projects. Typically, the business cases consider a range of investment options, including the 'do-nothing' option, and evaluate the costs, benefits and risks of each.
SA Power Networks engaged KPMG to review its methodology and approach to developing its IT capex and opex forecasts for the 2015–20 regulatory control period. This included a review of a sample of the non-recurrent IT capex business cases. KPMG provided a positive assessment of SA Power Networks' IT governance and forecasting methodology.264 However, KPMG identified a number of concerns in relation to the economic justification of the forecast IT capex, including that:
SA Power Networks had used a number of regulatory obligation changes, such as RIN, Power of Choice and contestable metering changes, as justification within the IT investment plan when some of these are yet to be mandated265
the economic justifications for the planned expenditure increase do not comprehensively support the investments on an NPV basis, though they have been supported by strong risk analysis justifications266
while SA Power Networks' IT capex per customer in 2013 was below the industry average, SA Power Networks' forecast IT capex per customer in the 2015–20 regulatory control period will be well above (two to three times) the 2013 industry mean.267
The Consumer Challenge Panel made a similar argument in its submission regarding SA Power Networks' use of changes in regulatory obligations to justify IT capex projects such as the implementation of back office IT capabilities to handle 'smart ready' meters and new network demand tariffs. The CCP was concerned that government and regulatory decisions on these matters are in flux, as is the timing of implementation. Given this uncertainty, the CCP considered we should not provide an ex ante allowance for SA Power Networks' proposed IT capex relating to these potential market developments.268
263 SA Power Networks, Regulatory proposal, October 2014, p. 233.264 KPMG, Independent Prudence and Efficiency Review of the 2015-20 Regulatory Technology Submission,
October 2014, pp. 10-12.265 KPMG, Independent Prudence and Efficiency Review of the 2015-20 Regulatory Technology Submission,
October 2014, p. 9.266 KPMG, Independent Prudence and Efficiency Review of the 2015-20 Regulatory Technology Submission,
October 2014, p. 10.267 KPMG, Independent Prudence and Efficiency Review of the 2015-20 Regulatory Technology Submission,
October 2014, p. 13.268 Consumer Challenge Panel Sub-panel 2, Submission to the AER, 30 January 2015, pp. 23-24.
115 Attachment 6 – Capital expenditure | SA Power Networks' determination 2015–20

We reviewed the business cases submitted by SA Power Networks in support of its proposed non-recurrent IT capex projects, to assess whether the forecast capex reflects the efficient costs that a prudent operator would incur.269
In our view, and based on the information provided, we consider that SA Power Networks' non-recurrent IT capex business cases do not provide a strong economic justification for the forecast capex. Typically, individual projects provide few tangible benefits relative to forecast costs, and are not economically justified. For the 24 non-recurrent IT capex projects proposed, we found that:
only two projects provide an economic return (positive NPV)270
the economically preferred (highest NPV) option has been selected for only nine projects271
six projects provide no quantifiable benefits in terms of either cost reduction or cost avoidance272
in some cases, SA Power Networks' options analysis appears to inflate the cost of the 'do nothing' option through an assumption that improved capability is required and the IT project will therefore avoid future costs associated with providing that improved capability
while the customer information system (CIS) replacement project is likely to be required in the 2015–20 regulatory control period, most projects are wholly or partially discretionary in nature and are not required to maintain service levels. This point was also made by Business SA, which considered the bulk of SA Power Networks' IT capex forecast to be discretionary273
projects driven by efficiency comprise 13 per cent of the forecast non-recurrent IT capex but provide 35 per cent of all identified tangible benefits274
as noted by the EUAA275, the total $62.1 million of tangible benefits identified is low compared to the total proposed costs $227.8 million
only $25.3 million of benefits, less than half of the benefits identified by SA Power Networks, are realisable through offsets to forecast opex.276 Business SA submitted that, in general, IT investments should improve the efficiency of operations and be largely offset by other reductions in costs.277
a number of projects are, at least in part, driven by other elements of SA Power Networks' capex and opex forecasts which we have not accepted in this
269 NER, clauses .6.5.7(c)(1) and 6.5.7(c)(2).270 These projects are: Intelligent Design Management System and Field Force Mobility.271 These projects are: Customer Facing Technologies, Enterprise Asset Management, Supply Chain, Portfolio
Project Management, Intelligent Design Management System, HR Systems, Unified Communications, Enterprise Integration, and Data Management.
272 These projects are: SAP Foundation, Enterprise Mobility, Business Intelligence Enablement, Enterprise Information Management, Enterprise Information Security, and Risk, Governance and Compliance.
273 Business SA, Submission to the AER, January 2015, p. 18.274 SA Power Networks, Attachment 20.42 - IT Benefits Map, October 2014, pp. 6-8.275 Energy Users Association of Australia, Submission to the AER, 30 January 2015, p. 9.276 SA Power Networks, Attachment 20.42 - IT Benefits Map, October 2014, p. 12.277 Business SA, Submission to the AER, January 2015, p. 18.
116 Attachment 6 – Capital expenditure | SA Power Networks' determination 2015–20
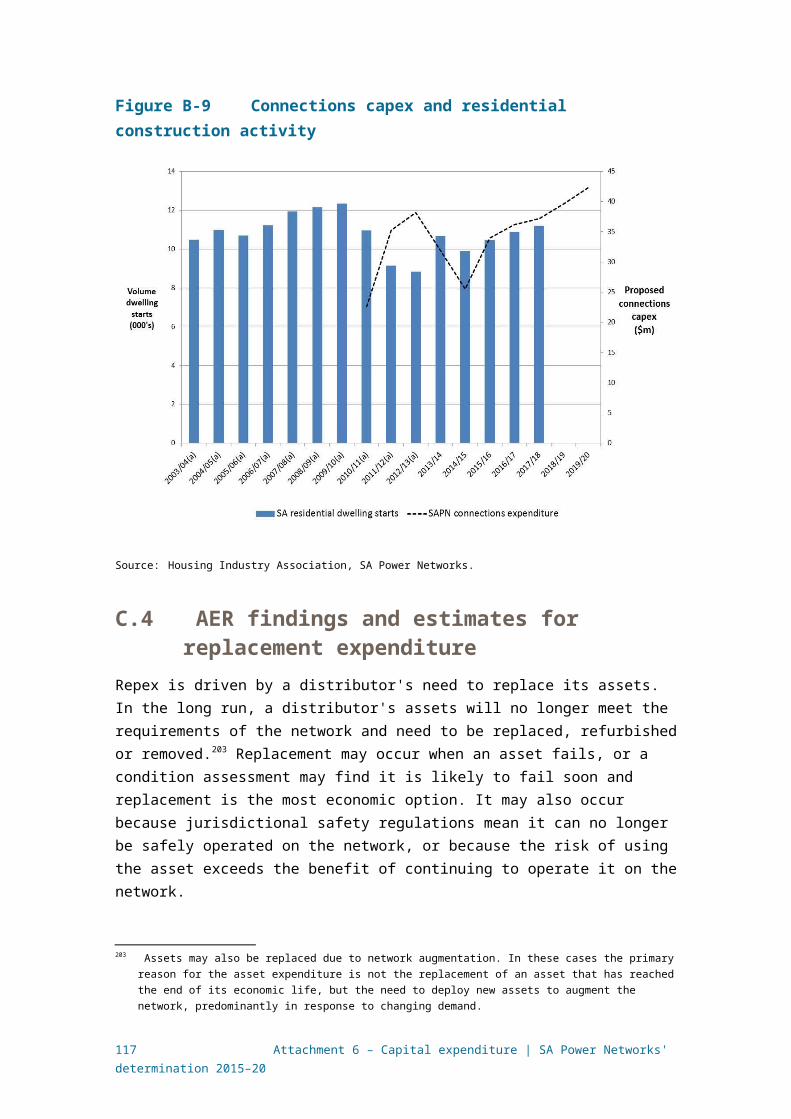
preliminary decision. An example of this is the IT capex related to the rollout of interval meters and increased network monitoring.278
An economic justification is not the sole basis for proceeding with a capex project, which may be otherwise necessary to meet the capex objectives of the NER.279 For example, a particular capability may be necessary to comply with a regulatory obligation or to maintain the quality, reliability and security of supply. However, in assessing SA Power Networks' forecast of required capex we must be satisfied that the capex reasonably reflects the efficient costs that a prudent operator would require to achieve the capex objectives.280 Based on our review, the evidence provided by SA Power Networks across the suite of non-recurrent IT capex business cases does not support this conclusion.
Given the concerns identified above in relation to the economic justification of projects, SA Power Networks' selection of preferred options, the discretionary nature of many projects, and the low level of tangible benefits identified, it is not clear that the forecast non-recurrent IT capex reflects efficient costs or the costs that a prudent operator would incur. In our view, it is likely that a prudent operator would not proceed with some of the proposed non-recurrent IT capex projects in the 2015-20 regulatory control period, or would pursue alternative options to meet the identified need. Our alternative estimate of an efficient and prudent forecast for non-recurrent IT capex in the 2015-20 regulatory control period is set out below.
Conclusion
For the reasons set out above, and based on our review of both the total portfolio of non-recurrent IT capex projects and the individual supporting business cases, we are not satisfied that SA Power Networks' non-network IT capex forecast reasonably reflects the efficient costs that prudent operator would require to achieve the capex objectives.281 In determining our alternative estimate of non-network IT capex, we have considered the level of investment which is likely to be:
deliverable, having regard to SA Power Networks' resourcing capacity and historical capex
prudent, having regard to SA Power Networks' business needs in the 2015–20 regulatory control period
efficient and justifiable, having regard to the economic evaluation of alternative investment options.
We consider that non-network IT capex of $213.6 million ($2014-15) reasonably reflects SA Power Networks' required capex for this category in the 2015–20 regulatory control period. This estimate is comprised of:
recurrent IT capex of $126.0 million ($2014-15), as forecast by SA Power Networks
278 Refer to the discussion on augmentation capex in this decision.279 NER, cl. 6.5.7(a).280 NER, clauses .6.5.7(c).281 NER, clauses .6.5.7(c).
117 Attachment 6 – Capital expenditure | SA Power Networks' determination 2015–20
non-recurrent IT capex of $87.6 million ($2014-15), reflecting the average level of investment delivered by SA Power Networks across the 2013-14 and 2014-15 years.
This is a reduction of $140.2 million or 40 per cent to SA Power Networks' forecast non-network IT capex. Nonetheless, our estimate provides for an increase of 34 per cent from actual non-network IT capex in the 2010–2015 regulatory control period. This recognises SA Power Networks' historically low levels of IT investment282 and current IT asset lifecycle requirements. Importantly, we consider that our revised estimate of non-recurrent IT capex based on SA Power Networks' actual and estimated non-recurrent IT capex in 2013-14 and 2014-15 is:
deliverable, as it:
o reflects actual and estimated historical capex expected to be delivered by SA Power Networks in the years following its 2013 IT transformation program
o can be implemented without a further significant increase in SA Power Networks' IT resources.
prudent, as it:
o provides for a smaller scale, lower risk program of IT system and business changes
o is sufficient for SA Power Networks to undertake the key, non-discretionary CIS replacement project.
efficient and justifiable, as it:
o provides scope for SA Power Networks to deliver a number of additional, economically justified projects which will provide tangible benefits to both SA Power Networks and consumers.
In determining our alternative estimate of non-network IT capex, we have not sought to determine which of the 24 proposed non-recurrent IT capex projects SA Power Networks should pursue in the 2015–20 regulatory control period. This is a matter for SA Power Networks. Rather, we have sought to estimate a prudent and efficient level of capex that is deliverable in the 2015–20 regulatory control period. We are satisfied that forecast capex of $213.6 million ($2014-15) reasonably reflects the efficient costs that a prudent operator would require to meet the capex criteria.283 We will make an allowance for it in our estimate of total capex for the 2015–20 regulatory control period.
B.6.4 Buildings and property capex
SA Power Networks forecast capex of $111.6 million ($2014-15) for non-network buildings and property projects in the 2015–20 regulatory control period. The majority of this expenditure relates to buildings ($107.3 million), with further minor expenditure related to land and easements.284 The forecast buildings and property capex 282 SA Power Networks, Regulatory proposal, October 2014, p. 238.283 NER, clauses .6.5.7(c)(1) and 6.5.7(c)(2).284 SA Power Networks, Regulatory proposal, October 2014, p. 241.
118 Attachment 6 – Capital expenditure | SA Power Networks' determination 2015–20
represents an increase of 55 per cent above actual and estimated capex in the 2010–2015 regulatory control period.
SA Power Networks submitted that its buildings and property capex forecast is based on a bottom up analysis of requirements, reflecting:285
consultation with key internal stakeholders
analysis of forecast employee growth
an assessment of each property's location, functionality, condition and compliance
consideration of relevant options
preparation of business cases for major projects.
The process used to develop SA Power Networks' forecast buildings and property capex program is summarised in SA Power Networks' strategic property plan, and set out in more detail in the property portfolio review report prepared by MRS Property.286 In summary, SA Power Networks developed the buildings and property capex program as follows:
Phase I ('Blue Sky')—SA Power Networks retained MRS Property to facilitate a workshop for internal SA Power Networks stakeholders examining forecast business operations, staffing and locations. This shaped the strategy to be applied to key commercial and industrial properties in the 2015–20 regulatory control period.287
Phase II Stage I ('Blue Sky Detail Review')—each property was subject to a capacity review and assessed based on location, functionality, condition and compliance. MRS Property then identified a scope of works, cost estimate and approximate timing of expenditure for each location across the 2015–20 regulatory control period. Cost estimates were based on recent works commissioned by SA Power Networks, supported by input from expert quantity surveyors and MRS Property. The total Phase II Stage I cost estimate was $223.5 million.288
Phase II Stage II ('Prudent' Approach)—this stage included revisions to reflect 'variations to the aspirations' of earlier phases, resulting in a reduced cost estimate for land and buildings of $101.4 million ($2013-14). MRS Property and SA Power Networks identified efficiencies through:289
o reconfiguration of existing properties to facilitate revised business functions
o revised expansion and rebuild expectations through the depot portfolio
o retention of leased property and previously identified 'surplus' properties
o acceptance by the business that existing properties can, in the main, facilitate the strategic growth of resources and functions.
285 SA Power Networks, Regulatory proposal, October 2014, pp. 240-241.286 SA Power Networks, Attachment 16.7 - Strategic Property Plan 2015-2020, September 2014, pp. 20-22 ; and
MRS Property, Property Portfolio Review and Analysis 2015-2020, September 2014.287 MRS Property, Property Portfolio Review and Analysis 2015-2020, September 2014, p. 11.288 MRS Property, Property Portfolio Review and Analysis 2015-2020, September 2014, pp. 11-18.289 MRS Property, Property Portfolio Review and Analysis 2015-2020, September 2014, pp. 19-20.
119 Attachment 6 – Capital expenditure | SA Power Networks' determination 2015–20
As a result of this process, SA Power Networks identified the need for eight major investments at Seaford (new depot and industrial facility), Angle Park North, Marleston North, Keswick, St Marys, Nuriootpa and Clare. The remainder of the capex program comprises moderate and minor works to address the outcomes of the location, functionality, condition and compliance based assessment of existing properties.290
Clearly, SA Power Networks' top down review of the initial $223.5 million estimate of required buildings and property capex has resulted in a more prudent and efficient estimate. However, it is not clear what process of rationalisation or prioritisation SA Power Networks applied to the initial 'Blue Sky' estimate to reduce this to the $101.4 million ($2013-14) proposed for the 2015–20 regulatory control period. For example, it is not apparent that SA Power Networks has:
applied a specific set of criteria or a defined process to prioritise the range of possible projects
assessed or compared the risk of different projects or portfolios of work
assessed or compared the benefits of different projects or portfolios of work
identified the portfolio of works which provides the optimum balance of cost, benefit, and risk.
Based on the material submitted, it appears that SA Power Networks' rationalisation of projects was based on an adjustment in the businesses 'aspirations' and 'expectations' of the non-network property program. 291 SA Power Networks has not provided evidence of a systematic and transparent optimisation process that might justify the prudence and efficiency of the proposed works program. For this reason, we are not satisfied that SA Power Networks' forecast reasonably reflects the efficient costs that a prudent operator would require to achieve the capex objectives.292
We also examined the eight business cases submitted by SA Power Networks in support of the proposed major property projects, to assess whether they provided justification for the proposed expenditure.293 We found that, in every instance, the business cases prepared by SA Power Networks did not address key factors which we consider would typically be evident in documentation used to justify the prudence and efficiency of a proposed capex project. While the business cases provide a description of proposed works, costs and delivery timeframes, they typically do not provide:
a detailed description of the need for investment, with supporting evidence as to forecast staff numbers and work volumes, designed and actual occupancy levels, contamination and remediation costs, the nature of asset obsolescence, or other specific site condition, compliance, capacity or service demand issues
evidence that a suitable range of alternative options, including a 'do nothing' option, has been considered294
290 SA Power Networks, Regulatory proposal, October 2014, p. 241.291 MRS Property, Property Portfolio Review and Analysis 2015-2020, September 2014, pp. 19-20.292 NER, clauses .6.5.7(c)(1) and 6.5.7(c)(2).293 SA Power Networks, Regulatory proposal attachments 21.50a - 21.50h, October 2014.294 The Nuriootpa business case (Attachment 21.50g - Business Case Nuriootpa) is the only business case which
formally considers a 'do-nothing' option of minimal maintenance and refurbishment.
120 Attachment 6 – Capital expenditure | SA Power Networks' determination 2015–20
evidence of a formal risk assessment or analysis performed as part of the need identification or options analysis process
evidence that tangible and intangible benefits have been identified and quantified for all options considered
a comparison of costs and benefits for each option considered295
evidence of a positive net present value (NPV), or that the highest NPV option has been selected such that the preferred option is economically justified
evidence to justify the inclusion of any contingency amount.
We sought further information from SA Power Networks to support the need for the proposed major projects.296 SA Power Networks provided a range of documentation, including site drawings, drainage and fire assessments, office accommodation standards, and a site assessment for each property.297 Typically, each site assessment provided a number of photographs and a high level dot point summary of identified issues at each site.298 In our view, the additional documentation submitted by SA Power Networks provided some further support for the need for investment at individual sites, albeit at a high level. However, the information did not address the range of deficiencies in SA Power Networks' business cases identified above.
SA Power Networks describes the preparation of these business cases for the identified major property projects as the final step in its forecasting process.299 In our view, this is apparent in the focus on the preferred option and absence of detail evaluating the costs, benefits and risks of alternative options presented in the business cases.
Based on the information available, we are not satisfied that either the process used by SA Power Networks to forecast its buildings and property capex or the business cases submitted provide evidence that the forecast capex is prudent and efficient or is required to achieve the capex objectives.
In considering our alternative estimate of non-network buildings and property capex which is likely to be prudent and efficient, we have had regard to SA Power Networks' actual and expected buildings and property capex for the 2010–2015 regulatory control period.300 Due to the issues associated with SA Power Networks' forecasting process and project justifications identified above, we are not satisfied that any specific adjustment to SA Power Networks' forecast would necessarily result in a reasonable estimate of prudent and efficient costs.
SA Power Networks' actual and estimated buildings and property capex for the 2010–2015 regulatory control period of $68.0 million ($nominal) is 24 per cent below the
295 The business cases only identify the benefits of the preferred option296 AER, Information request AER SA Power Networks 013, 19 December 2014.297 SA Power Networks, Response to Information Request AER SA Power Networks 013, 19 January 2015.298 For example, the Clare Depot Site Assessment is six pages long and contains 29 photographs and 18 dot points.299 SA Power Networks, Regulatory proposal, October 2014, p. 241.300 NER, cl. 6.5.7(e)(5).
121 Attachment 6 – Capital expenditure | SA Power Networks' determination 2015–20
AER's allowance for that period. SA Power Networks advised that a number of planned projects were deferred or alternative approaches adopted, including:301
an increased number of leased properties where it was more cost-effective to lease than own
delayed land acquisition and construction in response to the downturn in outer metropolitan residential growth and difficulties in sourcing suitable properties.
For example, SA Power Networks submitted that it deferred construction of the Seaford depot until housing development growth in this area increased in line with expectations.302 Nonetheless, SA Power Networks submitted that it had made significant investment during the 2010–2015 regulatory control period, including construction of a new depot at Holden Hill and a range of other major refurbishment projects. On that basis, we consider that an estimate of forecast capex of $71.8 million ($2014-15), reflecting SA Power Networks' historical capex in the 2010–2015 regulatory control period:
will allow SA Power Networks to continue to invest in prudent construction, refurbishment, and maintenance projects as required. For example, this amount is sufficient for SA Power Networks to undertake all eight major projects proposed for the 2015–20 regulatory control period, or a mix of major, moderate and minor projects as determined by SA Power Networks
is deliverable, as it reflects actual and estimated historical capex expected to be delivered by SA Power Networks
reasonably reflects the efficient costs that a prudent operator would require to meet the capex criteria.
In determining our alternative estimate of non-network buildings and property capex, we have not sought to determine which of the proposed non-network buildings and property capex projects SA Power Networks should pursue in the 2015–20 regulatory control period. This is a matter for SA Power Networks. Rather, we have sought to estimate a prudent and efficient level of capex that is deliverable in the 2015–20 regulatory control period. We are satisfied that forecast capex of $71.8 million ($2014-15), a reduction of $39.7 million ($2014-15) or 36 per cent from SA Power Networks' forecast, reasonably reflects the efficient costs that a prudent operator would require to meet the capex objectives.303 We will make an allowance for it in our estimate of total capex for the 2015–20 regulatory control period.
B.6.5 Fleet capex
SA Power Networks forecast capex of $146.0 million ($2014-15) for fleet assets in the 2015-20 regulatory control period.304 SA Power Networks stated that it owns and
301 SA Power Networks, Regulatory proposal, October 2014, p. 240.302 SA Power Networks, Regulatory proposal, October 2014, p. 240. SA Power Networks has proposed to complete
the Seaford depot in 2016-17, but has not submitted evidence relating to historical or forecast housing development growth.
303 NER, clauses .6.5.7(c)(1) and 6.5.7(c)(2).304 SA Power Networks, Revenue proposal, October 2015, p. 241. SA Power Networks 's post tax revenue model
included forecast capex for motor vehicles assets of $142.9 million ($2014-15).
122 Attachment 6 – Capital expenditure | SA Power Networks' determination 2015–20

operates a range of fleet assets to enable delivery of its network program of work, including passenger and light commercial vehicles, heavy vehicles such as line trucks, Elevating Work Platforms (EWP), cranes, forklifts, trailers and associated plant and equipment. SA Power Networks also stated that the majority of its fleet is owned and that its core operational activities include the management, acquisition, maintenance, replacement and disposal of fleet assets.305
SA Power Networks proposed fleet capex
SA Power Networks stated that its proposed fleet capex program for the 2015-20 regulatory control period is being driven by:306
a fleet replacement plan for heavy and light vehicles, including proposed changes to the replacement criteria;
new fleet requirements driven by forecast employee growth and the associated resourcing strategy to deliver the network program of work; and
two specific business initiatives identified (In-Vehicle Management System (IVMS) and Vehicle Weight Management) in response to legislative and WH&S obligations, strategic and operational business requirements and the availability of new technology to offer an effective solution to these requirements.
SA Power Networks' forecast fleet capex for the 2015-20 regulatory control period is 46 per cent higher than the actual/estimated expenditure of $99.7 million ($2014-15) for the 2010-15 regulatory period, with expenditure forecast to be higher in 2015-16 and 2016-17 and flat across each of the remaining forecast years.307 SA Power Networks' actual/forecast fleet capex for the 2010-15 regulatory period is 7.2 per cent higher than the AER allowance for the period. Table B-12 shows a breakdown of SA Power Networks' proposed fleet expenditure by vehicle type for the 2015-20 regulatory control period.
Table B-12 SA Power Networks' Fleet forecast capex for 2015-20 ($ million, 2014-15)
Vehicle Category 2015-16 2016-17 2017-18 2018-19 2019-20 Total
Vehicle replacement 36.7 20.9 15.3 18.5 22.4 113.8
New fleet 1.7 5.9 8.2 5.9 3.9 25.6
Safety initiatives 0.7 2.3 2.4 1.2 0.0 6.6
In-Vehicle Management system
0.7 1.1 1.2 0.0 0.0 3.0
Vehicle weight compliance
0.0 1.2 1.2 1.2 0.0 3.6
305 SA Power Networks, Revenue Proposal, SA Power Networks - 20.26 PUBLIC - Strategic Fleet Plan 2015-2020, October 2015, p. 4.
306 SA Power Networks, Revenue Proposal, SA Power Networks - 20.26 PUBLIC - Strategic Fleet Plan 2015-2020, October 2015, p. 20.
307 SA Power Networks, Revenue proposal, October 2015, p. 244.
123 Attachment 6 – Capital expenditure | SA Power Networks' determination 2015–20
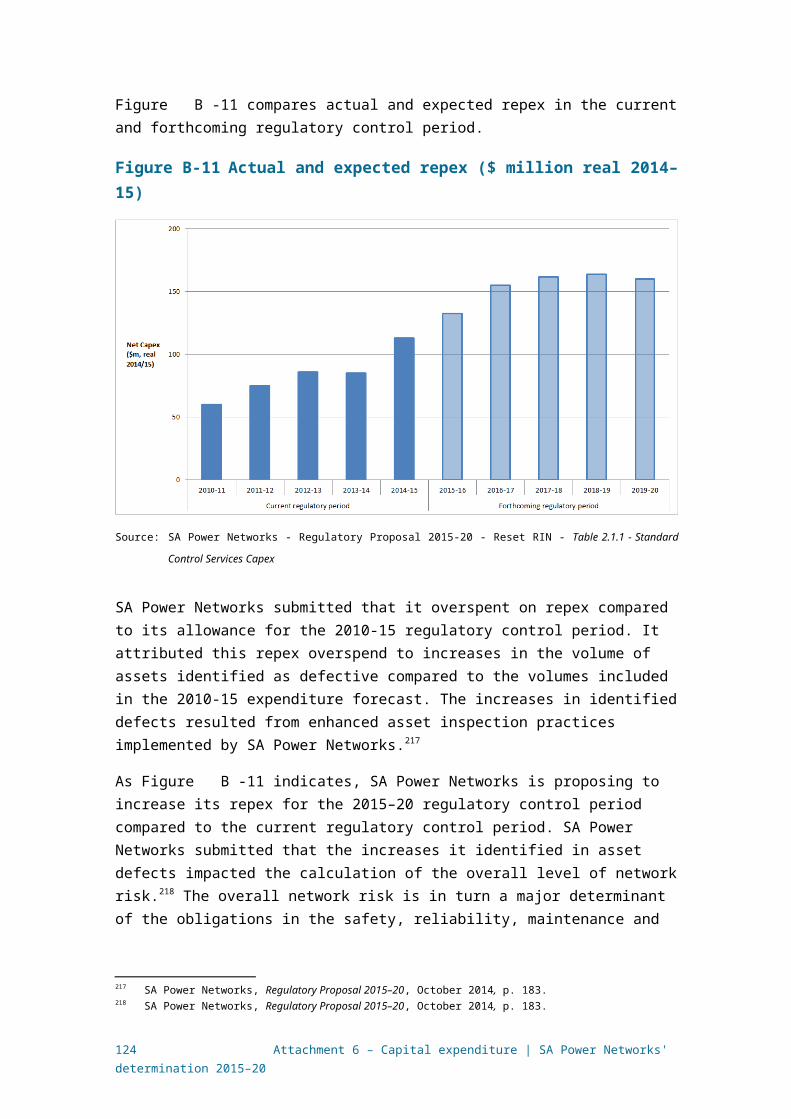
Total 39.1 29.1 25.9 25.6 26.3 146.0
Source: SA Power Networks, Revenue proposal, October 2015, p. 244.
Note: Numbers may not add up due to rounding.
For the 2015-20 regulatory control period, SA Power Networks' is proposing to:
change the replacement criteria for other specialist heavy commercial vehicles from 20 years to 15 years and passenger and light commercial vehicles from 5 years to 4 years. SA Power Networks stated that these changes are driven by an increasing number of vehicles being replaced early due to poor condition and safety concerns. SA Power Networks also stated that a comparison with other distributors showed that SA Power Networks maintain one of the oldest aged and condition based commercial and light and passenger fleets in Australia.308
maintain the change in its fleet replacement criteria for Elevated Work Platforms (EWP) from 20 years to 10 years which occurred in January 2012309
link its new fleet requirements with forecast employee growth and operating crew structures required to deliver the proposed network program of growth, which includes the recruitment of an additional 90 Trade Skilled Workers310
maintain its recent increases in expenditure in the vehicle category Miscellaneous311
introduce its IVMS to meet WH&S legislative requirements, and so as to improve driver behaviour312, and
introduce vehicle weight compliance expenditure of $3.6 million ($2014-15).
On the basis of the significant increase in SA Power Networks' proposed fleet capex program for the 2015-20 regulatory control period and to seek clarification on a number of issues we identified, we sought further information from SA Power Networks to justify the proposed increased level of fleet capex.313 A summary of SA Power Networks' response is provided below:314
SA Power Networks provided business cases based on NPV calculations for each vehicle type to justify a higher turnover of vehicles. The NPV calculations are predicated on cost input assumptions for each vehicle type. The cost input assumptions are fed into NPV calculations for each vehicle type (EWPs, Heavy
308 SA Power Networks, Revenue Proposal, SA Power Networks - 20.26 PUBLIC - Strategic Fleet Plan 2015-2020, October 2015, p. 15.
309 SA Power Networks, Revenue Proposal, SA Power Networks - 20.26 PUBLIC - Strategic Fleet Plan 2015-2020, October 2015, p. 19.
310 SA Power Networks, Revenue Proposal, SA Power Networks - 20.26 PUBLIC - Strategic Fleet Plan 2015-2020, October 2015, p. 21.
311 SA Power Networks, Revenue Proposal, SA Power Networks - 20.26 PUBLIC - Strategic Fleet Plan 2015-2020, October 2015, p. 14.
312 SA Power Networks, Revenue Proposal, SA Power Networks - 20.26 PUBLIC - Strategic Fleet Plan 2015-2020, October 2015, p. 22.
313 AER, Information request SA Power Networks 009 - fleet, 16 January 2015.314 AER, Information request SA Power Networks 009 - fleet, 16 January 2015.
124 Attachment 6 – Capital expenditure | SA Power Networks' determination 2015–20

Commercial and Passenger and Light Commercial) based on a range of disposal periods.
In relation to heavy commercial vehicles, SA Power Networks' business case showed that a replacement period of 15 years was marginally more cost effective than the current replacement period of 20 years but slightly less cost effective than a replacement period of 10 years.315 SA Power Networks emphasised a number of benefits of earlier replacement, including:316
o new safety features to be incorporated in vehicles earlier
o new environmental features to be incorporated in new vehicles earlier
o eliminating a general level of dissatisfaction with crews with respect to the age, maintenance and breakdowns; and
o enabling the latest compatible technology.
In relation to passenger and light commercial vehicles, SA Power Networks' NPV analysis showed that it is less cost effective to replace vehicles at four years compared to the current rate of five years. Based on SA Power Networks' RIN response for motor vehicle metrics we have calculated the difference to be equivalent to an additional cost of $12.3 million ($2014-15) over the 2015-20 regulatory control period.317 SA Power Networks justified these additional costs by claiming that these costs would be more than offset by gains in technological and safety advances in the motor industry and the improvement in the flexibility in operational changes that are likely as the distribution business environment evolves.318 SA Power Networks did not identify the alleged technological and safety advances or the operational changes, nor quantify their anticipated impact.
In relation to EWPs, SA Power Networks' NPV analysis shows that the difference between replacement at 10 and 20 years is very slightly more per EWP at 10 years replacement).319 SA Power Networks stated the drivers for replacement of EWPs at 10 years are:
o new safety features to be incorporated in vehicles earlier
o new environmental features to be incorporated in new vehicles earlier
o eliminating the requirement of the EWPs being off the road for up to three months during each rebuild, and
o eliminating a general level of dissatisfaction with crews with respect to age, maintenance and breakdowns.
315 AER, Information request SA Power Networks 009 - fleet, CONFID Fleet Analysis Model.xlsx (Confidential), 16 January 2015.
316 AER, Information request SA Power Networks 009 - fleet, 16 January 2015.317 SA Power Networks, Revenue Proposal, SA Power Networks - RESET RIN 2015-20 PUBLIC, template 2.6 Non-
network, Table 2.6.3, October 2015.318 AER, Information request SA Power Networks 009 - fleet, 16 January 2015.319 AER, Information request SA Power Networks 009 - fleet, CONFID Fleet Analysis Model.xlsx (Confidential), 16
January 2015.
125 Attachment 6 – Capital expenditure | SA Power Networks' determination 2015–20

SA Power Networks further supported its proposal by referring to reviews which showed faults and remedial work to its EWP fleet chassis and mechanics. SA Power Networks stated that these reviews supported its proposal for EWP replacement at 10 years.320
SA Power Networks justified its change in vehicle replacement criteria by reference to changes in its health and safety obligations, particularly the harmonised WHS Act which commenced on 1 January 2013 and Heavy Vehicle National Law. SA Power Networks stated that the guiding principle of the WHS Act is that workers are to be given the highest level of health and safety protection so far as is reasonably practicable. SA Power Networks stated that it interpreted the term ‘reasonably practicable’ to mean what could be reasonably done at a particular time and as such is not a static concept but something that changes over time. SA Power Networks provided an example in respect of regulation 213 of the WHS Act which SA Power Networks stated imposes a new obligation to carry out inspection of vehicles in accordance with manufacturer’s obligations. SA Power Networks did not, however, provide any additional examples of potentially new obligations. SA Power Networks also referred to part of the WHS Act that specifies that cost is not to be considered to be a key factor unless it can be shown to be “grossly disproportionate" to the risk.321
SA Power Networks stated that the miscellaneous vehicle category includes forklifts, all-terrain vehicles and earthmoving equipment and that the proposed capex increase is due to in part growth in its proposed capital works program and replacement of long term hired equipment.322
In its response to an information request regarding its justification of its proposed IVMS on the basis of WHS legislative requirements and improved driver behaviour, SA Power Networks responded with the same justification for its change to its vehicle replacement criteria. In particular, SA Power Networks provided a business case which stated that the cost of doing nothing was that any health and safety risks are not mitigated or that any benefits are realised. The business case identified the benefits as being able to measure the following driver vehicle behaviours:
harsh braking
harsh cornering
rapid acceleration; and
speeding.
SA Power Networks also stated that additional functionality was provided by:
'man-down' function (measures if wearer of the device is orientated at less than 45 degrees for greater than 30 seconds), and
a duress button.
320 AER, Information request SA Power Networks 009 - fleet, 16 January 2015.321 AER, Information request SA Power Networks 009 - fleet, 16 January 2015.322 AER, Information request SA Power Networks 009 - fleet, 16 January 2015.
126 Attachment 6 – Capital expenditure | SA Power Networks' determination 2015–20

SA Power Networks proposes to install the IVMS to all its 933 fleet by 30 June 2017 at a cost of $3 million.
SA Power Networks claimed that about three years ago it observed an increasing number of vehicle incidents involving its workers. A driver incident safety report provided by SA Power Networks (Table B-13) shows the vehicle damage driving statistics between 2012 to 2014.
Table B-13 SA Power Networks Driving statistics 2012 to 2014
Year Vehicles damaged (number) At fault (per cent)
2012 273 47%
2013 252 45%
2014 (January to June) 122 (244 pro-rated for 12 months) 39%
Source: AER, Information request SA Power Networks 009 - fleet, Attachment, PUBLIC SA Power Networks AER 009 -
Fleet attachment Q6.2, 16 January 2015; AER analysis.
SA Power Networks also stated that as a large number of its workers often work alone, the IVMS offers increased levels of connectivity which is critical.
Similar to its response to justifying its proposed IVMS expenditure, SA Power Networks referred to relevant legislative requirements as the basis to justify its proposed vehicle weight compliance expenditure, particularly the mass, dimension and loading requirements under the Road Traffic Act and Regulations and the Heavy Vehicle National Law and Regulations which commenced in February 2014. SA Power Networks stated that they currently use public weighbridges to weigh vehicles, which exposes them to risk of non-compliance when the vehicle is driven to the public weighbridge and when any additional weight is loaded onto the vehicle during the course of the working day. SA Power Networks claimed that there are 700 vehicles in its fleet that are considered to be at risk of weight management non-compliance.
SA Power Networks stated that the use of portable vehicle scales are impractical to use in the work environment, there is difficulty in ensuring that there is adequate space and GVM capacity on the vehicle to carry them and that they are costly to maintain and calibrate.
SA Power Networks stated that by integrating the vehicle weight management system with the IVMS, the cost of the vehicle weight management system is reduced. SA Power Networks has evaluated the option of permanent and semi-permanent weighbridges at 26 locations and stated that this solution does not mitigate the risk of the driver loading additional materials after leaving the depot.
AER assessment
We have reviewed SA Power Networks' proposal and its response to our information requests.
127 Attachment 6 – Capital expenditure | SA Power Networks' determination 2015–20

Table 2.6.3 of SA Power Networks' RIN response titled 'Motor Vehicle Metrics' shows the volumes of proposed fleet numbers and purchases by fleet type for the last year of the 2010-15 regulatory control period and the 2015-20 regulatory control period.323 In comparison to SA Power Networks' estimate for 2014-15, total fleet numbers of passenger vehicles and heavy commercial vehicles are forecast to remain unchanged at 158 and 30 vehicles, respectively, throughout the 2015-20 regulatory control period. Fleet numbers for light commercial vehicles and EWPs are forecast to increase by 6.6 per cent (from 440 to 469 vehicles) and 23.6 per cent (from 123 to 152 vehicles), respectively. Table B-14 shows fleet purchases are forecast to increase for all vehicle categories, except for EWPs (HCV) which has a longer replacement period than other vehicles.
Table B-14 SA Power Networks Proposed new vehicles purchases 2015-20
Year Estimated number purchased 2014-15
Forecast average annual number purchased 2015-20
Passenger 50 58
Light commercial 80 134
Elevated Work Platform (HCV)
25 20
Heavy commercial vehicle 0 4
Total 155 216
Source: SA Power Networks, Revenue Proposal, SA Power Networks - RESET RIN 2015-20 PUBLIC, template 2.6
Non-network, Table 2.6.3, October 2015; AER analysis.
The increase in new vehicle purchases is driven by two factors:
reduced replacement periods for passenger and light commercial and other commercial vehicles; and
the forecast employee growth and associated resourcing strategy to deliver the proposed network growth program.
As shown in Table B-12, SA Power Networks has forecast an outlay of $113.8 million ($2014-15) for fleet replacement capex and $25.6 million ($2014-15) for new fleet capex associated with its proposed network growth program. Further, an additional $6.6 million ($2014-15) capex has been proposed for safety initiatives.
Our analysis and conclusions on each of these three components of SA Power Networks' proposed fleet capex program for the 2015-20 regulatory control period is set out below.
Vehicle replacement
323 SA Power Networks, Revenue Proposal, SA Power Networks - RESET RIN 2015-20 PUBLIC, template 2.6 Non-network, Table 2.6.3, October 2015.
128 Attachment 6 – Capital expenditure | SA Power Networks' determination 2015–20

We consider SA Power Networks' proposed replacement criteria for specialist heavy commercial vehicles and EWPs to be reasonable based on:
SA Power Networks' NPV analysis, which is based on cost inputs which we consider are reasonable and in line with our expectation of commercial rates
the potential for newer vehicles to incorporate updated safety features and other features that may improve the operation or efficiency of the vehicle
the potential for a reduced number of breakdowns; and
SA Power Networks' reported comparison of vehicle replacement criteria which shows that its proposed replacement criteria for other specialist heavy commercial vehicles and EWPs is consistent with other Australian electricity distributors.324
We consider that collectively the above factors suggest that this element of SA Power Networks' fleet capex is likely to reflect the capex criteria.
In respect of passenger and light commercial vehicles, however, we do not accept SA Power Networks' proposed replacement period from five to four years because:
SA Power Networks' NPV analysis shows that it costs more to replace passenger and light commercial vehicles at four years compared to the current rate of five years325
SA Power Networks' justification that these additional costs would be more than offset by gains in technological and safety advances in the motor industry and the improvement in the operational flexibility have not been substantiated by SA Power Networks; and
SA Power Networks' reported comparison of vehicle replacement criteria shows that a number of other Australian electricity distributors have passenger and light commercial vehicle replacement criteria similar to SA Power Networks' current criteria.
We have calculated that on the basis of SA Power Networks' proposed purchases of 288 passenger vehicles and 669 light commercial vehicles during the 2015-20 regulatory control period, maintaining a replacement period of five years for these vehicles would result in a reduction of $10.6 million ($2014-15) to SA Power Networks' proposed vehicle replacement capex of $113.8 million ($2014-15).
New fleet expenditure
SA Power Networks has forecast $26.7 million ($2014-15) for new fleet capex expenditure for the 2015-20 regulatory control period. SA Power Networks stated that this expenditure is driven by forecast employee growth and the associated resourcing strategy to deliver the network program of growth.326
324 SA Power Networks, Revenue Proposal, SA Power Networks - 20.26 PUBLIC - Strategic Fleet Plan 2015-2020, October 2015, p. 26.
325 AER, Information request SA Power Networks 009 - fleet, CONFID Fleet Analysis Model.xlsx (Confidential), 16 January 2015.
326 SA Power Networks, Revenue Proposal, SA Power Networks - 20.26 PUBLIC - Strategic Fleet Plan 2015-2020, October 2015, p. 20.
129 Attachment 6 – Capital expenditure | SA Power Networks' determination 2015–20
Our estimate of total capex for the 2015-20 regulatory control period is in line with SA Power Networks' actual expenditure during the 2010-2015 regulatory control period. Accordingly, we do not consider that SA Power Networks' forecast new fleet expenditure of $26.7 million ($2014-15) is justified.
Safety initiatives
SA Power Networks justified its forecast capex of $6.6 million ($2014-15) for two safety initiatives largely on recent changes to legislative and WH&S obligations. We consider that whilst there may be some merit in these proposed safety initiatives, SA Power Networks did not provide persuasive justification that its proposed IVMS expenditure is necessary to meet new legislative and WH&S obligations. SA Power Networks' recent vehicle damage driving statistics, as shown in Table B-13, do not support its claim that there is either an increasing number of SA Power Networks vehicles incidents or SA Power Networks drivers responsible for the incident.
In relation to SA Power Networks' proposed vehicle weighing system, we consider there have been no material changes to the compliance requirements with respect to the weight that its vehicles are required to operate. In particular, we are of the view that the commencement of the Heavy Vehicle National Law in February 2014 did not change SA Power Networks' obligations in respect to the weight of its vehicles. We consider that these obligations existed in the 2010-15 regulatory control period and therefore do not consider the proposed expenditure to be justified and necessary to meet the capex criteria.327
Conclusion
In summary, we are not satisfied that SA Power Networks' forecast fleet capex reasonably reflects the efficient costs that a prudent operator would require to meet the capex criteria.328 We consider that forecast capex of $103.2 million ($2014–15) reasonably reflects the required expenditure. This represents a reduction of 29 per cent from SA Power Networks' proposed fleet capex for the 2015–20 regulatory control period. We will make an allowance for it in our estimate of total capex for the 2015–20 regulatory control period.
B.7 Demand managementDemand management refers to non-network strategies to address growth in demand and/or peak demand. Demand management can have positive economic impacts by reducing peak demand and encouraging the more efficient use of existing network assets, resulting in lower prices for network users, reduced risk of stranded network assets and benefits for the environment.
Demand management is an integral part of good asset management for network businesses. Network owners can seek to undertake demand management through a range of mechanisms, such as incentives for customers to change their demand
327 NER, cl. 6.5.7(c)(1).328 NER, cl. 6.5.7(c)(1).
130 Attachment 6 – Capital expenditure | SA Power Networks' determination 2015–20

patterns, operational efficiency programs, load control technologies, or alternative sources of supply (such as distributed or embedded generation and energy storage).
The current incentive frameworks and obligations in the NER are designed to encourage distributors to make efficient investment and expenditure decisions. However, the NER recognises that the planning and investment framework and the incentive regulation structure may not be sufficient by themselves to remove any bias towards network capital investment over non-network responses.
As such, the NER set out that distributors should examine non-network alternatives when developing network investments through the regulatory investment test for distribution (RIT-D) process. The RIT-D requires distributors to consult with stakeholders on the need for new capex projects and consider all credible network and non-network options as part of their planning processes. Its aim is to create a level playing field for the assessment of non-network options, such as demand-side management, against network options.
The NER also require us to consider the extent to which a business has considered efficient and prudent non-network alternatives in our assessment of capex proposals.329 In addition, the NER require us to develop and implement mechanisms to incentivise distributors to consider economically efficient alternatives to network solutions. As set out in our demand management incentive scheme attachment (attachment 12), we are continuing SA Power Networks' demand management innovation allowance.
B.7.1 Position
Our preliminary decision is that it is most appropriate to rely on the incentive framework, together with the requirements in the RIT-D and the distribution Annual Planning Report, to drive the efficient use of demand management. The benefits of capex deferral would be shared with consumers through the Capital Expenditure Sharing Scheme (CESS).
Accordingly, our alternative estimate of required capex does not include a generic reduction to overall system capex for potential for deferred capital needs through the use of demand management initiatives.
Our preliminary decision not to include a generic capex offset for possible future demand management activities does not impact on our consideration of the business cases for specific demand management proposals, or the consideration of non-network alternatives within the RIT-D process. Where a specific capex/opex trade-off can be shown to meet the capex and opex criteria we will include the amounts in the forecasts. This approach is consistent with the capital expenditure factor that requires us to have regard to the extent to which the distributor has considered, and made provision for, efficient and prudent non-network alternatives.330
B.7.2 Reasons for preliminary decision 329 NER, clause 6.5.7(3)(10).330 NER Clause 6.5.7(e)(10)
131 Attachment 6 – Capital expenditure | SA Power Networks' determination 2015–20
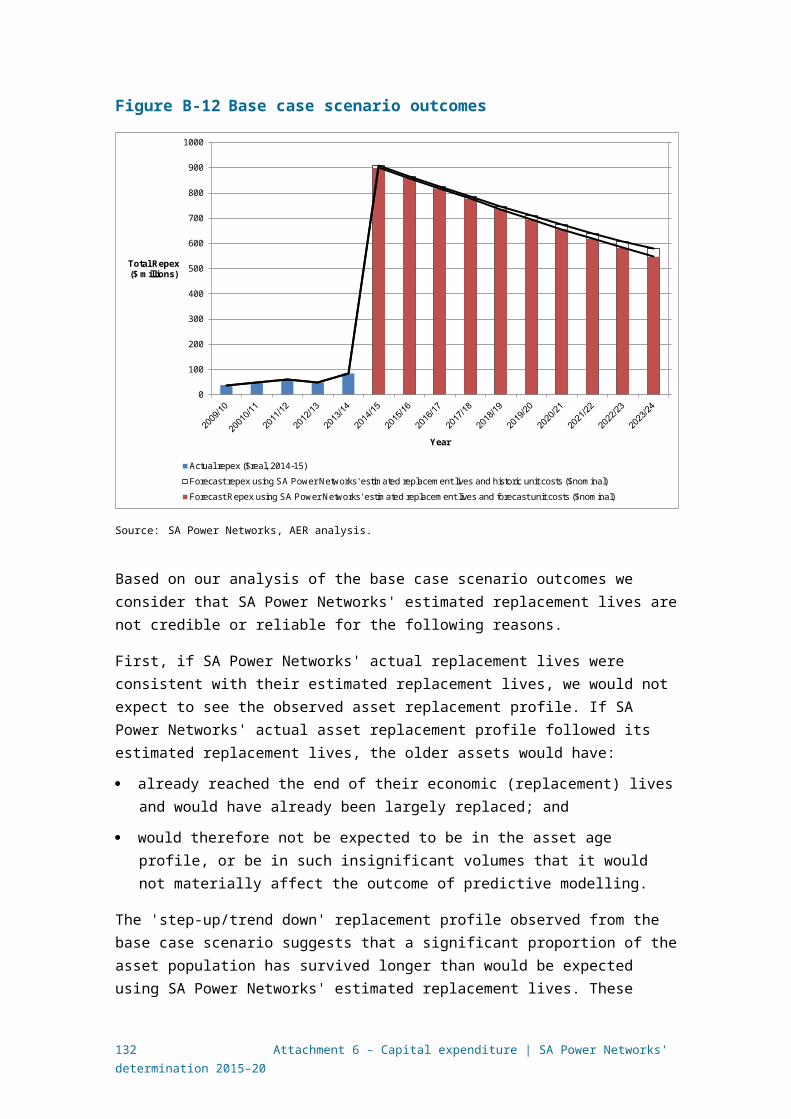
Distributors are required to transparently consider non-network alternatives through the RIT-D process. Through the RIT-D process and other initiatives developed as part of the demand management innovation allowance, it is expected that some amount of system capex currently in the forecast will be efficiently deferred. We are therefore considering whether it is appropriate to estimate the amount of capex that may be efficiently deferred through the use of demand management initiatives and explicitly reduce the capex forecast by this amount.
If we were to include an additional generic reduction to system capex to take account of the potential for capex deferrals, we would also need to assess the efficient opex required to support this capex offset. Given that we do not currently have actual expenditure data from which to accurately calculate a capex/opex trade-off, our preliminary decision is to not include an explicit reference in the capex or opex forecasts for broad based demand management activities.
However, we welcome views on whether this is the most appropriate approach in providing incentives for the optimal amount of demand management. To the extent that stakeholders consider that the long term interests of consumers may be better promoted through explicit recognition of demand management and consequential adjustments to capex and opex, we seek views on the appropriate capex/opex trade-off that should be included.
132 Attachment 6 – Capital expenditure | SA Power Networks' determination 2015–20

C DemandThis appendix sets out our observations of forecast demand in SA Power Networks'
network for the 2015–20 regulatory control period.331
Demand forecasts are fundamental to forecasting an NSP's capex and opex, and to the AER's assessment of that forecast expenditure.332 SA Power Networks must deliver electricity to its customers and build, operate and maintain its network to manage expected changes in demand for electricity. When SA Power Networks invests in its network to meet demand and increases in electricity consumption, it incurs capex. In particular, the expected growth in demand is an important factor driving network augmentation expenditure and connections expenditure (growth capex).333 SA Power Networks uses demand forecasts in conjunction with network planning to determine the amount and timing of such expenditure. SA Power Networks also incurs opex in relation to the new assets it builds to meet demand.
System demand represents total demand in the SA Power Networks distribution network. This appendix considers demand forecasts in SA Power Networks' network at the system level. System demand trends give a high level indication of the need for expenditure on the network to meet changes in demand. Forecasts of increasing system demand generally signal an increased requirement for growth capex, and converse for forecasts of stagnant or falling system demand.334 Accurate, or at least unbiased, demand forecasts are important inputs to ensuring efficient levels of investment in the network. For example, overly high demand forecasts may lead to inefficient expenditure as NSPs install unnecessary capacity on the network.
C.1 AER position on system demand trendsWe are satisfied the system demand forecast in SA Power Networks' regulatory
proposal for the 2015–20 period reasonably reflects a realistic expectation of demand.335 We formed this view after comparing SA Power Networks' forecasts against the trend in demand and the most recent independent system demand forecasts for South Australia prepared by the Australian Energy Market Operator (AEMO).
SA Power Networks forecasts that maximum demand will 'flatten' in South Australia over the 2015–20 regulatory control period. This is consistent with the flattening of demand over the 2010-15 period. As set out in section C.4 below, AEMO also forecasts a similar flattening of demand growth for SA Power Networks' network.
331 In this attachment, 'demand' refers to summer maximum, or peak, demand (megawatts, MW) unless otherwise indicated.
332 NER, clause 6.5.6(c)(3) and 6.5.7(c)(3).333 Sections B.2 and B.3 discuss our consideration of SA Power Networks' augex and connections expenditure.334 Other factors, such as network utilisation, are also important high level indicators of growth capex requirements.335 NER, clause 6.5.6(c)(3) and 6.5.7(c)(3).
133 Attachment 6 – Capital expenditure | SA Power Networks' determination 2015–20

AEMO's system demand forecast is 3 per cent higher than SA Power Networks' demand forecast over a 10 year period.336 Both SA Power Networks and AEMO arrived at their forecasts using consistent methodologies, which likely explain the similarities between forecasts. The small differences between the forecasts are discussed further in section C.4 below)
On the basis that SA Power Networks' system demand forecasts overlaps to a high degree with the independently determined forecasts of AEMO, we are satisfied that SA Power Networks' system demand forecasts reflect a realistic expectation of demand for the 2015-20 regulatory control period.
C.2 AER approachOur consideration of demand trends in SA Power Networks' network relied primarily
on comparing demand information from the following sources:
SA Power Networks' regulatory proposal
AEMO's 2014 transmission connection point forecast report for South Australia
stakeholder submissions on SA Power Networks' regulatory proposal.
C.3 SA Power Networks' proposalSA Power Networks has forecast a flat demand outlook with an annual downward reduction of around 0.32 per cent in the 2015–20 regulatory control period. This is broadly consistent with the "flattened" demand trend over the 2010–15 period, as shown in Figure C-18. SA Power Networks' forecast system maximum demand for the 2015–20 regulatory control period is based on the latest available data following the 2013 winter and 2013–14 summer season.
336 AEMO, Transmission Connection Point Forecasting Report for South Australia, December 2014, p. 2.
134 Attachment 6 – Capital expenditure | SA Power Networks' determination 2015–20

Figure C-18 SA Power Networks maximum demand (summer)
2010 2011 2012 2013 2014 2015 2016 2017 2018 2019 20200
500
1000
1500
2000
2500
3000
3500
Forecast - AEMO
Actual -regulatory proposal
Forecast - regulatory proposal
Demand (MW)
Source: AER analysis based on data from AEMO.
Note: There is a slight difference between AEMO's data and the data SA Power Networks provided in its RIN.
However, this difference did not impact on our analysis. We have used AEMO's data for this comparison
between AEMO's and SA Power Networks' demand forecasts.
Table C-15 Maximum system demand (summer) – Weather corrected (50% PoE) (MW)
2015-16 2016-17 2017-18 2018-19 2019-20
Average annual growth
(2015-20)
Regulatory proposal (October 2014) 2625 2608 2607 2595 2592 -0.32%
Source: SA Power Networks regulatory proposal, SA Power Networks reset RIN
While SA Power Networks did not repeat its forecasting methodology in its regulatory proposal, the 2014 Transmission Connection Point Forecasting Report for South Australia contains an assessment of their methodology compared to that of AEMO.337 AEMO's analysis showed that SA Power Networks started its system demand forecasts from the most recent historical point and adopts a consistent forecasting methodology to AEMO. Details of this analysis can be found in AEMO's report.338
337 AEMO, Transmission Connection Point Forecasting Report for South Australia, December 2014, p. 11.338 AEMO, Transmission Connection Point Forecasting Report for South Australia, December 2014, p. 11.
135 Attachment 6 – Capital expenditure | SA Power Networks' determination 2015–20

Several stakeholders acknowledged the flattening demand trend since 2010.339 Some stakeholders attributed this trend to increased uptake of rooftop PV.340 However, some stakeholders raised concern that flattened demand has continued to see increased prices and high levels of investment on SA Power Networks' network.341
We acknowledge stakeholders' concerns regarding price increases on SA Power Networks' network. However, we compared SA Power Networks' demand forecasts against AEMO's independents forecasts and found that SA Power Networks' demand forecasts are similar to AEMO's forecasts. Origin Energy and AGL made similar observations in their submissions. These submissions noted that SA Power Networks' demand forecasts are reasonable because they are similar to AEMO's demand forecasts and also reflect a reasonable expectation of demand for the 2015–20 regulatory period.342
C.4 AEMO forecastsIn December 2014, AEMO published the first edition of transmission connection point forecasts for South Australia.343 These forecasts are AEMO's independent electricity maximum demand forecasts at transmission connection point level, over a 10-year outlook period.344 The Standing Council on Energy Resources (SCER) intended these demand forecasts to inform our regulatory determinations.345 The NEFR includes AEMO's summer and winter demand forecasts for all regions (states) in the National Electricity Market. More information about the AEMO process is included in other recent AER decisions.346
Figure C-18 compares AEMO's summer system demand forecasts with the forecasts proposed by SA Power Networks in its regulatory proposal.347 SA Power Networks' summer system demand forecast trend was consistent with AEMO's forecast over the 2015–20 regulatory control period. However, AEMO' s summer system demand
339 SA Council of Social Services, submission to the Australian Energy Regulator on SA Power Networks Regulatory Proposal 2015–20, January 2015, p.2; SA Greens, submission to the Australian Energy Regulator on SA Power Networks Regulatory Proposal 2015–20, January 2015, p.1.
340 Australian PV Institute, submission to the Australian Energy Regulator on SA Power Networks Regulatory Proposal 2015–20, January 2015, p.2; AGL, submission to the Australian Energy Regulator on SA Power Networks Regulatory Proposal 2015–20, January 2015, p.8; Total Environment Centre, submission to the Australian Energy Regulator on SA Power Networks Regulatory Proposal 2015–20, January 2015, p.3.
341 COTA SA, submission to the Australian Energy Regulator on SA Power Networks Regulatory Proposal 2015–20, January 2015, p.5; Energy Consumers Coalition of South Australia, submission to the Australian Energy Regulator on SA Power Networks Regulatory Proposal 2015–20, December 2014, pp.3-4; UnitingCare Australia, submission to the Australian Energy Regulator: response to Electricity Distribution Business Regulatory Proposal for 2015-20 from SA Power Networks, February 2015, p. 16.
342 Origin Energy, submission to the Australian Energy Regulator on SA Power Networks Regulatory Proposal 2015–20, January 2015, p.5; AGL, submission to the Australian Energy Regulator on SA Power Networks Regulatory Proposal 2015–20, January 2015, p.8.
343 AEMO, Transmission Connection Point Forecasting Report for South Australia, December 2014. 344 AEMO, Transmission Connection Point Forecasting Report for South Australia, December 2014, p.5. 345 AER, Better regulation: Explanatory statement: Expenditure forecast assessment guideline, November 2013, p.
182.346 AER, Draft Decision, Ausgrid distribution determination, 2015-16 to 2018-19, Attachment 6: Capital expenditure,
November 2014, p 6-118347 SA Power Networks did not provide winter demand forecasts to AEMO. (See AEMO, Transmission Connection
Point Forecasting Report for South Australia, December 2014, p. 2.)
136 Attachment 6 – Capital expenditure | SA Power Networks' determination 2015–20

forecast is 3 per cent higher than SA Power Networks' demand forecast over a 10 year period.348
AEMO forecasts that maximum demand will "flatten" in South Australia over the 2015–20 regulatory control period. However, some individual connection points will see an increase in demand.349 This will be driven by a combination of positive growth and declines in growth. Positive growth will be primarily driven by block loads and load transfers, population growth and positive economic outlook. Declines in growth will be driven primarily by load transfers, energy efficiency savings and rooftop PV during summer. 350
Both SA Power Networks and AEMO adopt consistent methodologies in preparing demand forecasts.351 The slight difference in demand forecasts is due to the different forecasting inputs used by AEMO and SA Power Networks. The key differences are the selection of the forecasting starting points, and the assessment of energy efficiency and rooftop solar generation.352 Details of the difference between AEMO and SA Power Networks' forecasting methodologies can be found in AEMO's report.353
348 AEMO, Transmission Connection Point Forecasting Report for South Australia, December 2014, p. 2. 349 AEMO, Transmission Connection Point Forecasting Report for South Australia, December 2014, p. 1. 350 AEMO, Transmission Connection Point Forecasting Report for South Australia, December 2014, p. 1. 351 AEMO, Transmission Connection Point Forecasting Report for South Australia, December 2014, p. 11352 AEMO, Transmission Connection Point Forecasting Report for South Australia, December 2014, p. 11353 AEMO, Transmission Connection Point Forecasting Report for South Australia, December 2014, p. 11.
137 Attachment 6 – Capital expenditure | SA Power Networks' determination 2015–20

D Real material cost escalationReal material cost escalation is a method for accounting for expected changes in
the costs of key material inputs to forecast capex. The materials input cost model submitted by SA Power Networks includes forecasts for changes in the prices of commodities such as copper, aluminium, steel and crude oil, rather than the prices of physical inputs themselves (e.g., poles, cables, transformers) used to provide network services. SA Power Networks has also escalated construction costs in its forecast.
D.1 PositionWe are not satisfied that SA Power Networks proposed real material cost
escalators (leading to cost increases above CPI) which form part of its total forecast capex reasonably reflect a realistic expectation of the cost inputs required to achieve the capex objectives over the 2015–20 regulatory control period.354 We consider that zero per cent real cost escalation is reasonably likely to reflect the capex criteria including that it is likely to reasonably reflect a realistic expectation of the cost inputs required to achieve the capex objectives over the 2015–20 regulatory control period. We have arrived at this conclusion on the basis that:
the degree of the potential inaccuracy of commodities forecasts is such that we consider that zero per cent real cost escalation is likely to provide a more reliable estimation for the price of input materials used by SA Power Networks to provide network services
there is little evidence to support how accurately SA Power Network's materials escalation model forecasts reasonably reflect changes in prices paid by SA Power Networks for physical assets in the past and by which we can assess the reliability and accuracy of its forecast materials model. Without this supporting evidence, it is difficult to assess the accuracy and reliability of SA Power Networks' material input cost escalators model as a predictor of the prices of the assets used by SA Power Networks to provide network services, and
SA Power Networks has not provided any supporting evidence to show that it has considered whether there may be some material exogenous factors that impact on the cost of physical inputs that are not captured by the material input cost models used by SA Power Networks.
Our approach to real materials cost escalation does not affect the proposed application of labour and construction cost escalators which apply to SA Power Networks standard control services capital expenditure. We consider that labour and construction cost escalation as proposed by SA Power Networks is likely to more reasonably reflect a realistic expectation of the cost inputs required to achieve the capex criteria given these are direct inputs into the cost of providing network services.355
354 NER, clause 6.5.7(a).355 NER, clause 6.5.7(c)(3).
138 Attachment 6 – Capital expenditure | SA Power Networks' determination 2015–20

D.2 SA Power Networks proposalSA Power Networks applied material and labour cost escalators to various asset
classes in forecasting its capex for the 2015-20 regulatory control period.356 Real cost escalation indices for the following material cost drivers were calculated for SA Power Networks by Competition Economists Group (CEG):357
aluminium
copper
steel, and
crude oil.
CEG sourced forward rates from Bloomberg up to 2019-20 to convert commodities traded on international markets priced in United States dollars to Australian dollars.358
Real cost escalation indices for engineering construction costs were calculated for SA Power Networks by Jacobs359
Table D-16 outlines SA Power Networks real materials cost escalation forecasts.
Table D-16 SA Power Networks real materials cost escalation forecast—inputs (per cent)
2015–16 2016–17 2017–18 2018–19 2019–20
Aluminium 2.9 2.1 1.7 1.5 1.5
Copper --0.9 -1.0 -0.2 -0.3 -0.2
Steel 3.1 0.5 0.1 0.0 0.1
Crude oil 1.6 1.3 1.1 1.0 1.1
Engineering Construction Index1
4.85 4.81 4.72 4.7 4.75
Source: SA Power Networks, Revenue proposal, Attachment 20.3, CEG Materials cost escalation factors: a report
for SA Power Networks, August 2014, pp. 15, 17, and 19 and Attachment 20.4, Jacobs: Nominal Material
Cost Escalation Indices Forecast, September 2014, p. 1.1 Nominal cost escalation.
These individual material cost escalators were aggregated by SA Power Networks through its consultant Jacobs to develop the material cost escalation indices forecast for various common electricity network classes.360 Table D-17 shows the nominal
356 SA Power Networks, Revenue proposal, 31 October 2014, pp. 267-268.357 CEG, Materials cost escalation factors: a report for SA Power Networks, August 2014.358 CEG, Materials cost escalation factors: a report for SA Power Networks, August 2014, pp. 6-7.359 Jacobs, Nominal Material Cost Escalation Indices Forecast, September 2014.360 SA Power Networks, Revenue proposal, Attachment 20.3, CEG Materials cost escalation factors: a report for SA
Power Networks, August 2014, p. 1.
139 Attachment 6 – Capital expenditure | SA Power Networks' determination 2015–20
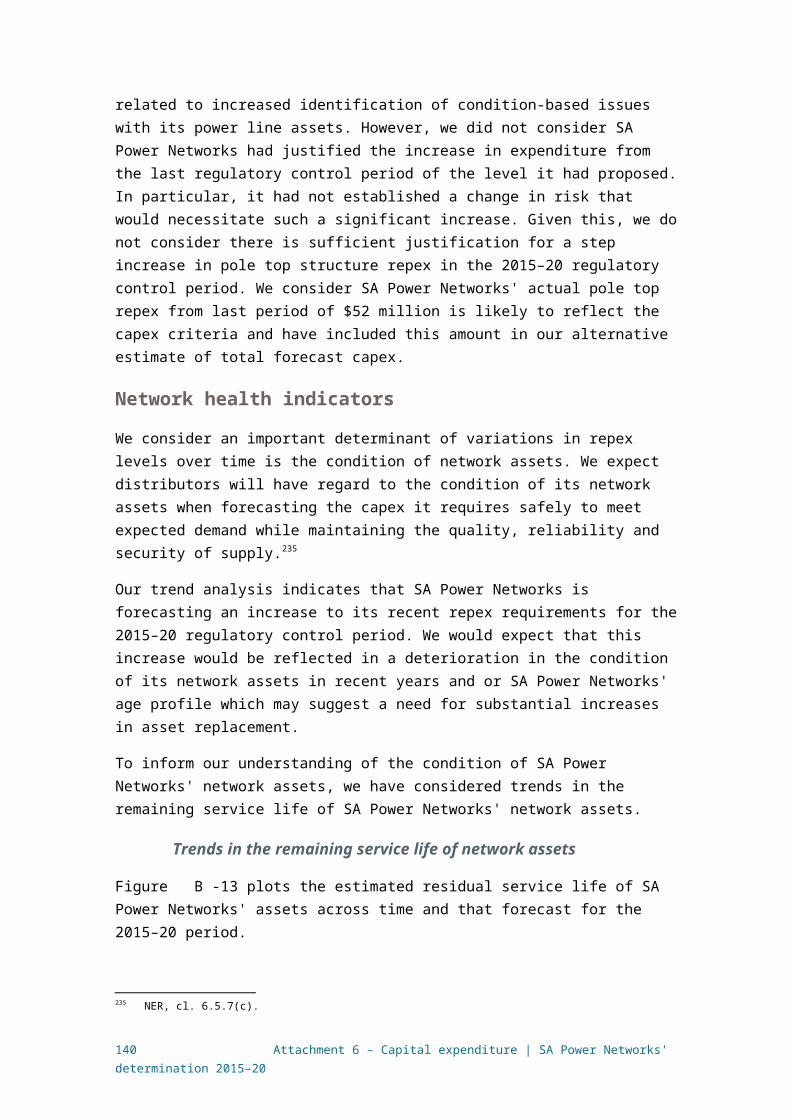
material cost escalation indices forecasts aggregated to SA Power Networks common asset classes.
Table D-17 Average annual nominal material cost escalation indices forecasts aggregated to SA Power Networks common asset classes
2015–16 2016–17 2017–18 2018–19 2019–20
Asset classes
Switchgear/Circuit Breakers
1.0298 1.0243 1.0236 1.0232 1.0235
Overhead Line Hardware 1.0321 1.0236 1.0219 1.0216 1.0221
Underground Hardware 1.0336 1.0322 1.0313 1.0312 1.0316
Insulators 1.0301 1.0289 1.0281 1.0281 1.0284
Revenue Meters 1.0281 1.0267 1.0265 1.0264 1.0266
Public Lighting Material 1.0255 1.0255 1.0255 1.0255 1.0255
Disconnectors/Fuses 1.0298 1.0243 1.0236 1.0232 1.0235
Protection Relays 1.0281 1.0267 1.0265 1.0264 1.0266
Electronic Component 1.0281 1.0267 1.0265 1.0264 1.0266
Communication Cable 1.0255 1.0255 1.0255 1.0255 1.0255
Other Secondary Systems
1.0281 1.0267 1.0265 1.0264 1.0266
Telecommunications Equipment)
1.0255 1.0255 1.0255 1.0255 1.0255
Oil 1.0440 1.0390 1.0360 1.0360 1.0370
Substation Transformers 1.0369 1.0278 1.0269 1.0263 1.0267
Pad mount Distribution
Transformers
1.0369 1.0278 1.0269 1.0263 1.0267
Pole mount Distribution
Transformers
1.0369 1.0278 1.0269 1.0263 1.0267
Copper Cable 1.0240 1.0206 1.0247 1.0241 1.0247
Aluminium Cable 1.0388 1.0333 1.0314 1.0303 1.0305
Copper Conductor 1.0214 1.0179 1.0233 1.0225 1.0233
Aluminium Conductor 1.0433 1.0354 1.0330 1.0314 1.0315
Stobie Poles 1.0485 1.0481 1.0472 1.0470 1.0475
Other 1.0321 1.0236 1.0219 1.0216 1.0221
Source: SA Power Networks, Revenue proposal, Attachment 20.3, CEG Materials cost escalation factors: a report
for SA Power Networks, August 2014, p. 1.
140 Attachment 6 – Capital expenditure | SA Power Networks' determination 2015–20
Jacobs stated that these asset classes are further aggregated to higher asset categories, and finally to an overall SA Power Networks material asset base using the actual capital expenditure profile from the 2013-14 base year as the basis for the proportional weightings.361
D.3 Assessment approachWe assessed SA Power Networks proposed real material cost escalators for the
purpose of assessing its proposed total capex forecast against the NER requirements. We must accept SA Power Networks capex forecast if we are satisfied it reasonably reflects the capex criteria.362 Relevantly, we must be satisfied those forecasts reasonably reflect a realistic expectation of cost inputs required to achieve the capex objectives.363
We have applied our approach as set out in our Expenditure Forecast Assessment Guideline (Guideline) to assessing the input price modelling approach to forecast materials cost.364 In the Guideline explanatory statement we stated that we had seen limited evidence to demonstrate that the commodity input weightings used by distributors to generate a forecast of the cost of material inputs have produced unbiased forecasts of the costs the distributors paid for manufactured materials.365 We considered it important that such evidence be provided because the changes in the prices of manufactured materials are not solely influenced by the changes in the raw materials that are used.366 As a result, the price of manufactured network materials may not be well correlated with raw material input costs. We expect distributors to demonstrate that their proposed approach to forecast manufactured material cost changes is likely to reasonably reflect changes in raw material input costs.
In our assessment of SA Power Networks proposed material cost escalation, we:
reviewed the CEG report commissioned by SA Power Networks367
reviewed the materials input cost model used by SA Power Networks
reviewed the approach to forecasting manufactured material costs in the context of electricity distributors mitigating such costs and producing unbiased forecasts, and
361 SAPN, Revenue proposal, Attachment 20.3, CEG Materials cost escalation factors: a report for SA Power Networks, August 2014, p. 16.
362 NER, clause 6.5.7(c).363 NER, clause 6.5.7(c)(3).364 AER, Better Regulation - Explanatory Statement Expenditure Forecast Assessment Guideline, November 2013,
pp. 50-51.365 AER, Better Regulation - Explanatory Statement Expenditure Forecast Assessment Guideline, November 2013, p.
50.366 AER, Better Regulation - Explanatory Statement Expenditure Forecast Assessment Guideline, November 2013, p.
50.367 CEG Materials cost escalation factors: a report for SA Power Networks, August 2014.
141 Attachment 6 – Capital expenditure | SA Power Networks' determination 2015–20
considered the submissions from Business SA, the Energy Consumers Coalition of South Australia368 and the Energy Users Association of Australia369 on this issue.370
D.4 Reasons We are not satisfied that SA Power Networks forecast is based on a sound and
robust methodology for the reasons outlined below. We therefore consider that it does not reasonably reflect the capex criteria.371 This criteria includes that the total forecast capex reasonably reflects a realistic expectation of cost inputs required to achieve the capex objectives.372 Accordingly, we have not accepted it as part of our alternative estimate in our preliminary decision on total forecast capex. We are satisfied that zero per cent real cost escalation is reasonably likely to reflect the capex criteria and this has been taken into account into our alternative estimate.
Materials input cost model
SA Power Networks materials input cost model does not demonstrate how and to what extent material inputs have affected the cost of inputs such as cables and transformers. In particular, it has provided no supporting evidence to substantiate how accurately SA Power Networks materials escalation forecasts reasonably reflected changes in prices it paid for assets in the past to assess the reliability of forecast materials prices.
In our Guideline, we requested that distributors demonstrate that their proposed approach to forecast materials cost changes reasonably reflected the change in prices they paid for physical inputs in the past. SA Power Networks proposal does not include supporting data or information which demonstrates movements or interlink-ages between changes in the input prices of commodities and the prices SA Power Networks paid for physical inputs. SA Power Networks material cost input model assumes a weighting of commodity inputs for each asset class but does not provide information which explains the basis for the weightings or that the weightings applied have produced unbiased forecasts of the costs of SA Power Networks assets. For these reasons, there is no basis on which we can conclude that the forecasts are reliable.
Materials input cost model forecasting
SA Power Networks has used its consultants' reports to estimate cost escalation factors in order to assist in forecasting future operating and capital expenditure. These cost escalation factors include commodity inputs related to capital expenditure. The consultants have adopted a high level approach hypothesising a relationship between these commodity inputs and the physical assets purchased by SA Power Networks. 368 Energy Consumers Coalition of SA (ECCSA), Submission on SAPN's regulatory
proposal 2015-20 , 31 January 2015 .369 Energy Users Association of Australia, Submission on SAPN's regulatory proposal
2015-20 , 30 January 2015 .370 Business SA - Submission on SAPN's regulatory proposal 2015-20 - 30 January
2015.371 NER, clause 6.5.7(c).372 NER, clause 6.5.7(c)(3).
142 Attachment 6 – Capital expenditure | SA Power Networks' determination 2015–20

Neither the consultants' reports nor SA Power Networks have adequately explained or quantified this relationship, particularly in respect to movements in the prices between the commodity inputs and the physical assets and the derivation of commodity input weightings for each asset class.
We recognise that active trading or futures markets to forecast prices of assets such as transformers are not available and that in order to forecast the prices of these assets a proxy forecasting method needs to be adopted. Nonetheless, that forecasting method must be reasonably reliable to estimate the prices of inputs used by distributors to provide network services. SA Power Networks has not provided any supporting information that indicates whether the forecasts have taken into account any material exogenous factors which may impact on the reliability of material input costs. Such factors may include changes in technologies which affect the weighting of commodity inputs, suppliers of the physical assets changing their sourcing for the commodity inputs, and the general volatility of exchange rates.
Materials input cost mitigation
We consider that there is potential for SA Power Networks to mitigate the magnitude of any overall input cost increases. This could be achieved by:
potential commodity input substitution by the electricity distributor and the supplier of the inputs. An increase in the price of one commodity input may result in input substitution to an appropriate level providing there are no technically fixed proportions between the inputs. Although there will likely be an increase in the cost of production for a given output level, the overall cost increase will be less than the weighted sum of the input cost increase using the initial input share weights due to substitution of the now relatively cheaper input for this relatively expensive input.
We are aware of input substitution occurring in the electricity industry during the late 1960's when copper prices increased, potentially impacting significantly on the cost of copper cables. Electricity distributor's cable costs were mitigated as relatively cheaper aluminium cables could be substituted for copper cables. We do recognise that the principle of input substitutability cannot be applied to all inputs, at least in the short term, because there are technologies with which some inputs are not substitutable. However, even in the short term there may be substitution possibilities between operating and capital expenditure, thereby potentially reducing the total expenditure requirements of an electricity distributor 373
the substitution potential between opex and capex when the relative prices of operating and capital inputs change.374 For example, SA Power Networks has not demonstrated whether there are any opportunities to increase the level of opex (e.g. maintenance costs) for any of its asset classes in an environment of increasing material input costs
the scale of any operation change to the electricity distributor's business that may impact on its capex requirements, including an increase in capex efficiency, and
373 NER, clause 6.5.7(e)(7).374 NER, clause 6.5.7(e)(6).
143 Attachment 6 – Capital expenditure | SA Power Networks' determination 2015–20
increases in productivity that have not been taken into account by SA Power Networks in forecasting its capex requirements.
By discounting the possibility of commodity input substitution throughout the 2015-20 regulatory control period, we consider that there is potential for an upward bias in estimating material input cost escalation by maintaining the base year cost commodity share weights.
Forecasting uncertainty
The NER requires that an electricity distributor's forecast capital expenditure reasonably reflects a realistic expectation of cost inputs required to achieve the capex objectives.375 We consider that there is likely to be significant uncertainty in forecasting commodity input price movements. The following factors have assisted us in forming this view:
recent studies which show that forecasts of crude oil spot prices based on futures prices do not provide a significant improvement compared to a ‘no-change’ forecast for most forecast horizons, and sometimes perform worse376
evidence in the economic literature on the usefulness of commodities futures prices in forecasting spot prices is somewhat mixed. Only for some commodities and for some forecast horizons do futures prices perform better than ‘no change’ forecasts377
the difficulty in forecasting nominal exchange rates (used to convert most materials which are priced in $US to $AUS). A review of the economic literature of exchange rate forecast models suggests a “no change” forecasting approach may be preferable to the forward exchange rate produced by these forecasting models.378
In its submission, the Energy Consumers Coalition of South Australia stated that the recent directly observed anomalies for movements in the price of oil, iron ore and the Australian dollar highlight the very speculative nature of developing materials
375 NER, clause 6.5.7(c)(3).376 R. Alquist, L. Kilian, R. Vigfusson, Forecasting the Price of Oil, Board of Governors of the Federal Reserve
System, International Finance Discussion Papers, Number 1022, July 2011 (also published as Alquist, Ron, Lutz Kilian, and Robert J. Vigfusson, 2013, Forecasting the Price of Oil, in Handbook of Economic Forecasting, Vol. 2, ed. by Graham Elliott and Allan Timmermann (Amsterdam: North Holland), pp. 68-69 and pp. 427–508) and International Monetary Fund, World Economic Outlook — Recovery Strengthens, Remains Uneven, Washington, April 2014, pp. 25-31.
377 International Monetary Fund, World Economic Outlook — Recovery Strengthens, Remains Uneven, Washington, April 2014, p. 27, Chinn, Menzie D., and Olivier Coibion, The Predictive Content of Commodity Futures, Journal of Futures Markets, 2014, Volume 34, Issue 7, p. 19 and pp. 607-636 and T. Reeve, R. Vigfusson, Evaluating the Forecasting Performance of Commodity Futures Prices, Board of Governors of the Federal Reserve System, International Finance Discussion Papers, Number 1025, August 2011, pp. 1 and 10.
378 R. Meese, K. Rogoff, (1983), Empirical exchange rate models of the seventies: do they fit out of sample?, Journal of International Economics, 14, B. Rossi, (2013), Exchange rate predictability, Journal of Economic Literature, 51(4), E. Fama, (1984), Forward and spot exchange rates, Journal of Monetary Economics, 14, K. Froot and R. Thaler, (1990), Anomalies: Foreign exchange, the Journal of Economic Perspectives, Vol. 4, No. 3, CEG, Escalation factors affecting expenditure forecasts, December 2013, and BIS Shrapnel, Real labour and material cost escalation forecasts to 2019/20, Australia and New South Wales, Final report, April 2014.
144 Attachment 6 – Capital expenditure | SA Power Networks' determination 2015–20
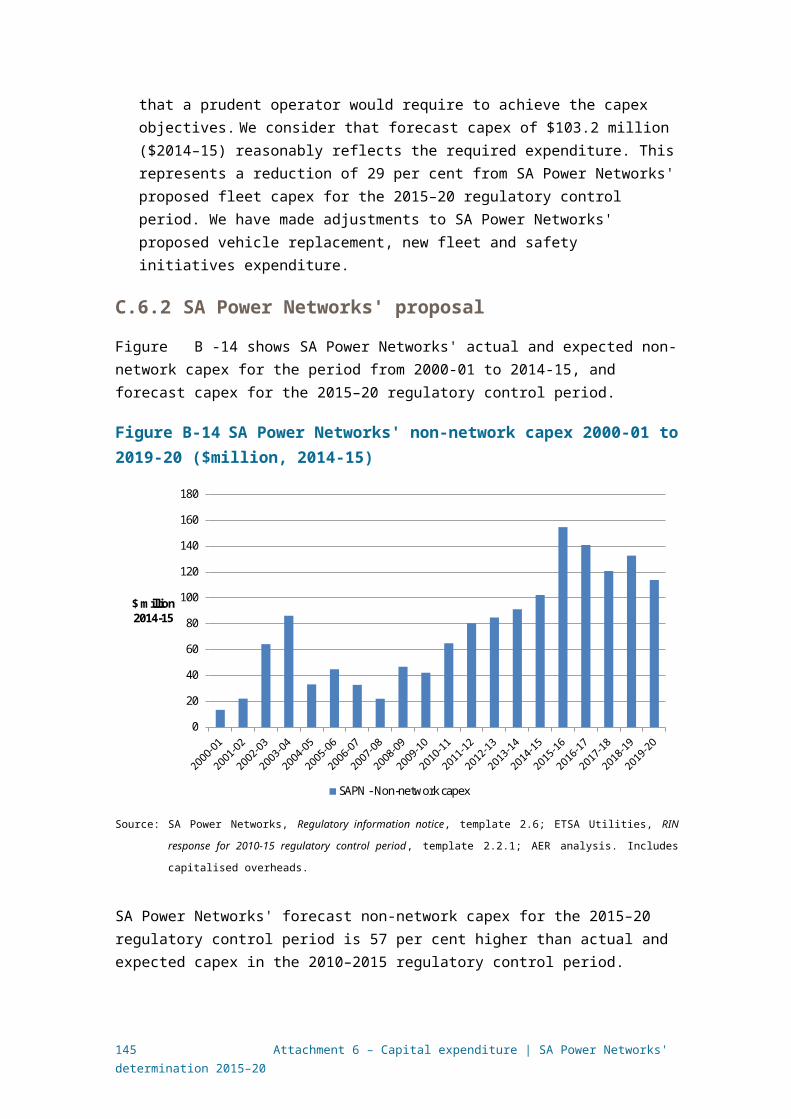
escalators.379 In their submissions, Business SA and the Energy Users Association of Australia both noted the significant recent fall in commodity prices.380
Strategic contracts with suppliers
We consider that electricity distributors can mitigate the risks associated with changes in material input costs by including hedging strategies or price escalation provisions in their contracts with suppliers of inputs (e.g. by including fixed prices in long term contracts). We also consider there is the potential for double counting where contract prices reflect this allocation of risk from the electricity distributor to the supplier, where a real escalation is then factored into forecast capex. In considering the substitution possibilities between operating and capital expenditure,381 we note that it is open to an electricity distributor to mitigate the potential impact of escalating contract prices by transferring this risk, where possible, to its operating expenditure.
Cost based price increases
Allowing individual material input costs that constitute cost escalation reflects more cost based price increases. We consider this cost based approach reduces the incentives for electricity distributors to manage their capex efficiently, and may instead incentivise electricity distributors to over forecast their capex. In taking into account the revenue and pricing principles, we note that this approach would be less likely to promote efficient investment.382 It also would not result in a capex forecast that was consistent with the nature of the incentives applied under the CESS and the STPIS to SA Power Networks as part of this decision.383
Selection of commodity inputs
The limited number of material inputs included in SA Power Networks material input escalation model may not be representative of the full set of inputs or input choices impacting on changes in the prices of assets purchased by SA Power Networks. SA Power Networks materials input cost model may also be biased to the extent that it may include a selective subset of commodities that are forecast to increase in price during the 2015-20 regulatory control period.
Commodities boom
The relevance of material input cost escalation post the 2009 commodities boom experienced in Australia when material input cost escalators were included in determining the approved capex allowance for electricity distributors is also relevant. We consider that the impact of the commodities boom has subsided and as a
379 Energy Consumers Coalition of SA (ECCSA), Submission on SAPN's regulatory proposal 2015-20 , 31 January 2015 , p. 92.
380 Business SA - Submission on SAPN's regulatory proposal 2015-20 - 30 January 2015, p. 31 and Energy Users Association of Australia, Submission on SAPN's regulatory proposal 2015-20 , 30 January 2015 , p. 10.
381 NER, clause 6.5.7(e)(7).382 NEL, Part 1, section 7.383 NER, clause 6.5.7(e)(8).
145 Attachment 6 – Capital expenditure | SA Power Networks' determination 2015–20

consequence the justification for incorporating material cost escalation in determining forecast capex has also diminished.
D.5 Review of consultant's reportsWe have reviewed the CEG report commissioned by SA Power Networks. We
consider that this review, along with our review of two other reports detailed below, provides further support for our position to not accept SA Power Networks proposed materials cost escalation.
CEG reports CEG provide the following quote from the International Monetary Fund (IMF) in
respect of futures markets:384
While futures prices are not accurate predictors of future spot prices, they nevertheless reflect current beliefs of market participants about forthcoming price developments.
This supports our view that there is a reasonable degree of uncertainty in the modelling of material input cost escalators to reliably and accurately estimate the prices of assets used by NSPs to provide network services. Whilst the IMF may conclude that commodity futures prices reflect market beliefs on future prices, there is no support from the IMF that futures prices provide an accurate predictor of future commodity prices.
In respect of forecasting electricity distributors future costs, CEG stated that:385
There is always a high degree of uncertainty associated with predicting the future. Although we consider that we have obtained the best possible estimates of the NSPs’ future costs at the present time, the actual magnitude of these costs at the time that they are incurred may well be considerably higher or lower than we have estimated in this report. This is a reflection of the fact that while futures prices and forecasts today may well be a very precise estimate of current expectations of the future, they are at best an imprecise estimate of future values.
This statement again is consistent with our view about the degree of the precision and accuracy of futures prices in respect of predicting electricity distributors future input costs.
CEG also acknowledge that its escalation of aluminium prices are not necessarily the prices paid for aluminium equipment by manufacturers. As an example, CEG referred to producers of electrical cable who purchase fabricated aluminium which has gone through further stages of production than the refined aluminium that is traded on the LME. CEG also stated that aluminium prices can be expected to be influenced by refined aluminium prices but these prices cannot be expected to move together in a ‘one-for-one’ relationship.386
384 CEG Materials cost escalation factors: a report for SA Power Networks, August 2014, pp. 5-6.385 CEG Materials cost escalation factors: a report for SA Power Networks, August 2014, p.11.386 CEG Materials cost escalation factors: a report for SA Power Networks, August 2014, p. 13.
146 Attachment 6 – Capital expenditure | SA Power Networks' determination 2015–20

GEG provided similar views for copper and steel futures. For copper, CEG stated that the prices quoted for copper are prices traded on the LME that meet the specifications of the LME but that there is not necessarily a 'one-for-one' relationship between these prices and the price paid for copper equipment by manufacturers.387 For steel futures, CEG stated that the steel used by electricity distributors has been fabricated, and as such, embodies labour, capital and other inputs (e.g. energy) and acknowledges that there is not necessarily a 'one-for one' relationship between the mill gate steel and the steel used by electricity distributors.388
These statements by CEG support our view that the input cost estimation models used by SA Power Networks has not demonstrated how and to what extent material inputs have affected the cost of intermediate outputs. We note, as emphasised by CEG, there is likely to be significant value adding and processing of the raw material before the physical asset is purchased by SA Power Networks.
CEG has provided data on historical indexed aluminium, copper, steel and crude oil actual (real) prices from July 2005 to December 2013 as well as forecast real prices from January 2014 to January 2021 which were used to determine its forecast escalation factors.389 For all four commodities, the CEG forecast indexed real prices showed a trend of higher prices compared to the historical trend. Aluminium and crude oil exhibited the greatest trend variance. Copper and steel prices were forecast to remain relatively stable whist aluminium and crude oil prices were forecast to rise significantly compared to the historical trend.
CEG was also commissioned by Ausgrid, Endeavour Energy, Essential Energy, ActewAGL and TasNetworks to estimate cost escalation factors.390 In its report to these distributors, CEG has provided further information to support our position to not accept SA Power Networks proposed materials cost escalation.
CEG acknowledge that forecasts of general cost movements (e.g. consumer price index or producer price index) can be used to derive changes in the cost of other inputs used by electricity distributors or their suppliers separate from material inputs (e.g. energy costs and equipment leases etc.).391 This is consistent with the Post-tax Revenue Model (PTRM) which reflects at least in part movements in an electricity distributor's intermediary input costs.
CEG acknowledge that futures prices will be very unlikely to exactly predict future spot prices given that all manner of unexpected events can occur.392 This is consistent with our view that there are likely to be a significant number of material exogenous factors that impact on the price of assets that are not captured by the material input cost models used by SA Power Networks.
Figures 1 and 2 of CEG’s report respectively show the variance between aluminium and copper prices predicted by the London Metals Exchange (LME) 3 month, 15
387 CEG Materials cost escalation factors: a report for SA Power Networks, August 2014, p. 13.388 CEG Materials cost escalation factors: a report for SA Power Networks, August 2014, p. 16.389 CEG Materials cost escalation factors: a report for SA Power Networks, August 2014, pp. 15, 17 and 20.390 CEG, Escalation factors affecting expenditure forecasts, December 2013.391 CEG, Escalation factors affecting expenditure forecasts, December 2013, p. 3.392 CEG, Escalation factors affecting expenditure forecasts, December 2013, pp. 4-5.
147 Attachment 6 – Capital expenditure | SA Power Networks' determination 2015–20
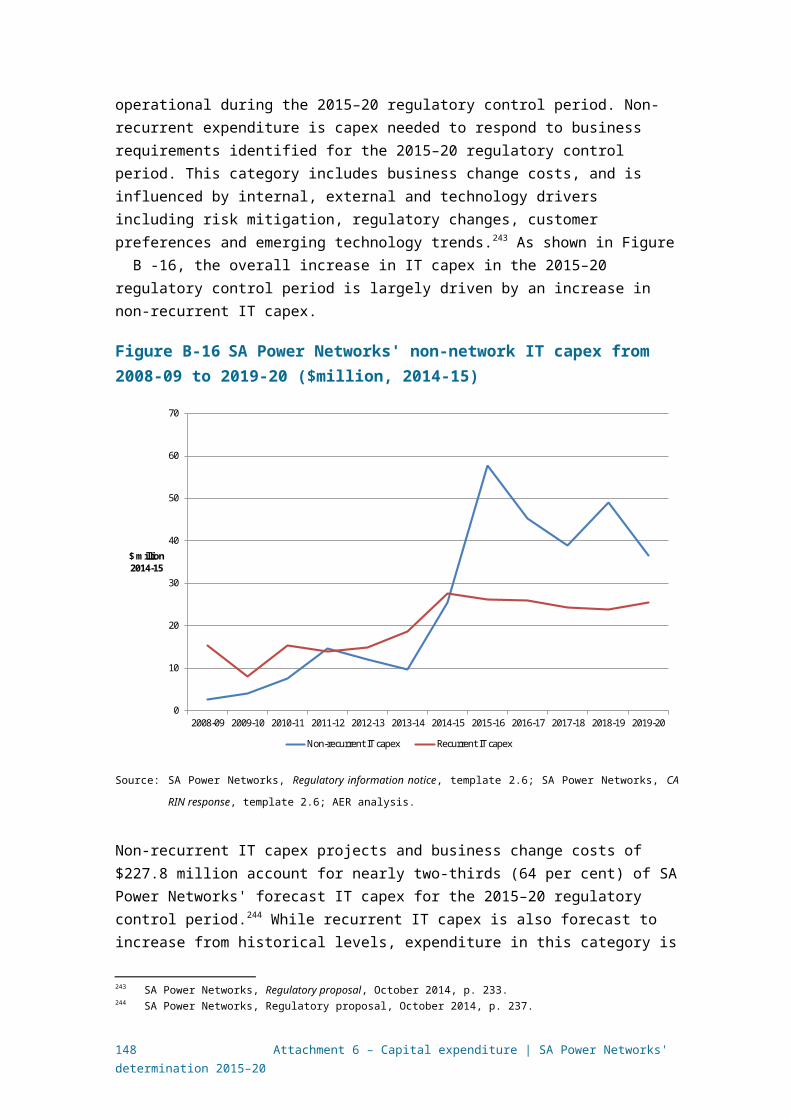
month and 27 month futures less actual prices between July 1993 and December 2013.393 Analysis of this data shows that the longer the futures projection period, the less accurate are LME futures in predicting actual commodity prices. Given the next regulatory control period covers a time span of 60 months we consider it reasonable to question the degree of accuracy of forecast futures commodity prices towards the end of this period.
Figures 1 and 2 also show that futures forecasts have a greater tendency towards over-estimating of actual aluminium and copper prices over the 20 year period (particularly for aluminium). The greatest forecast over-estimate variance was about 100 per cent for aluminium and 130 per cent for copper. In contrast, the greatest forecast under-estimate variance was about 44 per cent for aluminium and 70 per cent for copper.
In addition to our review of the CEG Reports, we have also received submissions from TransGrid and Jemena Gas Networks in respect to their revenue requirement assessments. We have considered the relevance of those submissions to the issues raised by SA Power Networks in order to arrive at a position that takes into account all available information. Our views on these reports are set out below. Overall, both these reports lend further support to our position to not accept SA Power Networks' proposed materials cost escalation.
SKM report SKM caution that there are a variety of factors that could cause business conditions
and results to differ materially from what is contained in its forward looking statements.394 This is consistent with our view that there are likely to be a significant number of material exogenous factors that impact on the cost of assets that are not captured by SA Power Networks material input cost models.
SKM stated it used the Australian CPI to account for those materials or cost items for equipment whose price trend cannot be rationally or conclusively explained by the movement of commodities prices.395
In its modelling of the exchange rate, SKM has in part adopted the longer term historical average of $0.80 USD/AUD as the long term forecast going forward.396 This is consistent with our view that longer term historical commodity prices should be considered when reviewing and forecasting future prices. In general, we consider that long term historical data has a greater number of observations and as a consequence is a more reliable predictor of future prices than a data time series of fewer observations.
SKM stated that the future price position from the LME futures contracts for copper and aluminium are only available for three years out to December 2016 and that in order to estimate prices beyond this data point, it is necessary to revert to economic forecasts as the most robust source of future price expectations.397 SKM
393 CEG, Escalation factors affecting expenditure forecasts, December 2013, pp. 5-6. 394 SKM, TransGrid Commodity Price Escalation Forecast 2013/14 - 2018/19, 9 December 2013, p. 4.395 SKM, TransGrid Commodity Price Escalation Forecast 2013/14 - 2018/19, 9 December 2013, p. 8.396 SKM, TransGrid Commodity Price Escalation Forecast 2013/14 - 2018/19, 9 December 2013, p. 9.397 SKM, TransGrid Commodity Price Escalation Forecast 2013/14 - 2018/19, 9 December 2013, p. 12.
148 Attachment 6 – Capital expenditure | SA Power Networks' determination 2015–20

also stated that LME steel futures are still not yet sufficiently liquid to provide a robust price outlook.398
SKM stated that in respect to the reliability of oil future contracts as a predictor of actual oil prices, futures markets solely are not a reliable predictor or robust foundation for future price forecasts. SKM also stated that future oil contracts tend to follow the current spot price up and down, with a curve upwards or downwards reflecting current (short term) market sentiment.399 SKM selected Consensus Economics forecasts as the best currently available outlook for oil prices throughout the duration of the next regulatory control period.400 The decision by SKM to adopt an economic forecast for oil rather than using futures highlights the uncertainty surrounding the forecasting of commodity prices.
BIS Shrapnel report BIS Shrapnel has forecast prices of gas distributor related materials to increase, in
part due to movements in the exchange rate. BIS Shrapnel are forecasting the Australian dollar to fall to US$0.77 from mid-2016 to mid-2018401. This is significantly lower than the exchange rate forecasts by SKM of between US$0.91 to US$0.85 from 2014-15 to 2018-19.402 CEG did not publish its exchange rate forecasts in its report but state that for the purposes of the report it sourced forward rates from Bloomberg until 2023.403 BIS Shrapnel stated that exchange rate forecasts are not authoritative over the long term.404
We consider the forecasting of foreign exchange movements during the next regulatory control period to be another example of the potential inaccuracy of modelling for material input cost escalation.
In its forecast for general materials such as stationary, office furniture, electricity, water, fuel and rent, BIS Shrapnel assumed that across the range of these items, the average price increase would be similar to consumer price inflation and that the appropriate cost escalator for general materials is the CPI.405 This treatment of general business inputs supports our view that where we cannot be satisfied that a forecast of real cost escalation for a specific material input is robust, and cannot determine a robust alternative forecast, zero per cent real cost escalation is reasonably likely to reflect the capex criteria and under the PTRM the electricity distributor's broad range of inputs are escalated annually by the CPI.
Comparison of independent expert's cost escalation factors398 SKM, TransGrid Commodity Price Escalation Forecast 2013/14 - 2018/19, 9 December 2013, p.16.399 SKM, TransGrid Commodity Price Escalation Forecast 2013/14 - 2018/19, 9 December 2013, p. 18.400 SKM, TransGrid Commodity Price Escalation Forecast 2013/14 - 2018/19, 9 December 2013, p. 20.401 BIS Shrapnel, Real Labour and Material Cost Escalation Forecasts to 2019/20 - Australia and New South Wales,
April 2014, p. 6.402 SKM, TransGrid Commodity Price Escalation Forecast 2013/14 - 2018/19, 9 December 2013, p. 10.403 SKM, TransGrid Commodity Price Escalation Forecast 2013/14 - 2018/19, 9 December 2013, p. 9.404 BIS Shrapnel, Real Labour and Material Cost Escalation Forecasts to 2019/20 - Australia and New South Wales,
April 2014, p. A-7.405 BIS Shrapnel, Real Labour and Material Cost Escalation Forecasts to 2019/20 - Australia and New South Wales,
April 2014, p. 48.
149 Attachment 6 – Capital expenditure | SA Power Networks' determination 2015–20

To illustrate the potential uncertainty in forecasting real material input costs, we have compared the material cost escalation forecasts derived by the consultants as shown in Table D-18.
Table D-18 Real material input cost escalation forecasts (per cent)
2015–16 (%)
2016–17 (%)
2017–18 (%)
2018–19 (%)
2019–20 (%)
Aluminium
CEG
SKM
BIS Shrapnel
Range (low to high)
2.9
4.69
1.4
1.4 to 4.69
2.1
4.88
5.6
4.88 to 5.6
1.7
3.09
3.9
3.09 to 3.9
1.5
4.42
11.0
1.5 to 11.0
1.5
2.97
-6.5
-6.5 to 1.5
Copper
CEG
SKM
BIS Shrapnel
Range (low to high)
-0.9
-0.17
-0.9
-0.9 to 0.17
-1.0
0.17
-1.5
-1.5 to 0.17
-0.2
-1.15
0.3
-1.15 to 0.3
-0.3
-0.16
9.3
-0.3 to 9.3
-0.2
-1.45
-8.7
-8.7 to -0.2
Steel
CEG
SKM
BIS Shrapnel1
Range (low to high)
3.1
2.84
5.1
2.84 to 5.1
0.5
2.45
1.0
1.0 to 2.45
0.1
-0.35
-0.2
-0.35 to 0.1
0.0
0.38
8.0
0.3 to 8.0
0.1
-1.11
-8.9
0.1 to -8.9
Oil
CEG
SKM
BIS Shrapnel2
Range (low to high)
1.6
-5.11
1.4
-5.11 to 1.6
1.3
-0.79
-1.1
-1.1 to 1.3
1.1
0.74
-0.2
-0.2 to 1.1
1.0
1.85
6.5
1.85 to 6.5
1.1
0.51
-6.2
-6.2 to 1.1
Source: SA Power Networks, Revenue proposal, Attachment 20.3, CEG Materials cost escalation factors: a report
for SA Power Networks, August 2014, pp. 15, 17, and 19, SKM, TransGrid Commodity Price Escalation
Forecast 2013/14 - 2018/19, 9 December 2013, p. 2 and BIS Shrapnel, Real Labour and Material Cost
Escalation Forecasts to 2019/20 - Australia and New South Wales, April 2014, p. iii.
1 Asian market price as BIS Shrapnel believes the Asia market is more appropriate.406
2 BIS Shrapnel have forecast plastics prices based on price changes in Nylon-11 and HDPE (Polyethylene).
BIS Shrapnel state that Castor Oil is the key raw material of Nylon-11 and because it does not have any
406 BIS Shrapnel, Real Labour and Material Cost Escalation Forecasts to 2019/20 - Australia and New South Wales, April 2014, p. 40.
150 Attachment 6 – Capital expenditure | SA Power Networks' determination 2015–20

historical data on Castor Oil, it has approximated Nylon-11 by using HDPE growth rates. HDPE
(Polyethylene) prices are proxied by BIS Shrapnel using Manufacturing Wages, General Materials, and
Thermoplastic Resin prices. BIS Shrapnel state that Thermoplastic Resin is primarily driven by Crude Oil.407
As Table D-18 shows, there is considerable variation between the consultant’s commodities escalation forecasts. The greatest margin of variation is 9.6 per cent for copper in 2018-19, where CEG has forecast a real price decrease of 0.3 per cent and BIS Shrapnel a real price increase of 9.3 per cent. BIS Shrapnel’s forecasts exhibit the greatest margin of variation but there also considerable variation between CEG and SKM’s forecasts. These forecast divergences between consultants further demonstrate the uncertainty in the modelling of material input cost escalators to reliably and accurately estimate the prices of intermediate outputs used by distributors to provide network services. This supports our view that SA Power Networks forecast real material cost escalators do not reasonably reflect a realistic expectation of the cost inputs required to achieve the capex objectives over the 2015–20 regulatory control period.408
D.6 Conclusions on materials cost escalationWe are not satisfied that SA Power Networks has demonstrated that the weightings
applied to the intermediate inputs have produced unbiased forecasts of the movement in the prices it expects to pay for its physical assets. In particular, SA Power Networks has not provided sufficient evidence to show that the changes in the prices of the assets they purchase are highly correlated to changes in raw material inputs.
CEG, in its reports to SA Power Networks and other electricity distributors, identified a number of factors which are consistent with our view that SA Power Networks input cost model has not demonstrated how and to what extent material inputs are likely to affect the cost of assets. Jacobs, in its report to SA Power Networks, acknowledged that the Australian CPI can be used to account for those materials or cost items in equipment for which the price trend cannot be rationally or conclusively explained by movement in commodity prices.409 CEG stated that futures prices are unlikely to exactly predict future spot prices given that all manner of unexpected events can occur.410 CEG also stated that while futures prices and forecasts today may well be a very precise estimate of current expectations of the future, they are at best an imprecise estimate of future values.411
Recent reviews of commodity price movements show mixed results for commodity price forecasts based on futures prices. Further, nominal exchange rates are in general extremely difficult to forecast and based on the economic literature of a review of exchange rate forecast models, a “no change” forecasting approach may be preferable.
407 BIS Shrapnel, Real Labour and Material Cost Escalation Forecasts to 2019/20 - Australia and New South Wales, April 2014, p. iii.
408 NER, clause 6.5.7(a).409 Jacobs, Nominal Material Cost Escalation Indices Forecast, September 2014, p.8.410 CEG, Escalation factors affecting expenditure forecasts, December 2013, pp. 4–5.411 CEG, Escalation factors affecting expenditure forecasts, December 2013, p. 13.
151 Attachment 6 – Capital expenditure | SA Power Networks' determination 2015–20
We are not satisfied that a forecast of real cost escalation for materials is robust. We consider that in the absence of a robust alternative forecast, then real cost escalation should not be applied in determining a distributor's required capital expenditure. We accept that there is uncertainty in estimating real cost changes but we consider the degree of the potential inaccuracy of commodities forecasts is such that there should be no escalation for the price of input materials used by SA Power Networks to provide network services.
In previous AER decisions, namely our Final Decisions for Envestra's Queensland and South Australian networks, we took a similar approach. This was on the basis that as all of Envestra's real costs are escalated annually by CPI under its tariff variation mechanism, CPI must inform the AER's underlying assumptions about Envestra's overall input costs. Consistent with this, we applied zero real cost escalation and by default Envestra's input costs were escalated by CPI in the absence of a viable and robust alternative. Likewise, for SA Power Networks, we consider that in the absence of a well-founded materials cost escalation forecast, escalating real costs annually by the CPI is the better alternative that will contribute to a total forecast capex that reasonably reflects the capex criteria.
The CPI can be used to account for the cost items for equipment whose price trend cannot be conclusively explained by the movement of commodities prices. This approach is consistent with the revenue and pricing principles of the NEL which provide that a regulated distributor should be provided with a reasonable opportunity to recover at least the efficient costs it incurs in providing direct control network services.412
D.7 Labour and construction escalatorsOur approach to real materials cost escalation does not affect the application of
labour and construction cost escalators, which will continue to apply to standard control services capital and operating expenditure.
We consider that labour and construction cost escalation more reasonably reflects a realistic expectation of the cost inputs required to achieve the opex and capex objectives.413 We consider that real labour and construction cost escalators can be more reliably and robustly forecast than material input cost escalators, in part because these are not intermediate inputs and for labour escalators, productivity improvements have been factored into the analysis (refer to the opex attachment).
Construction costs can be forecast with greater precision because the drivers (construction and manufacturing wages, plant equipment and other fabricated metal products, and plant and equipment hire) are reasonably transparent and can be predicted with some degree of accuracy.
Further details on our consideration of labour cost escalators are discussed in attachment 7.
412 NEL, section 7(2).413 NER, clauses 6.5.6(c)(3) and.6.5.7(c)(3).
152 Attachment 6 – Capital expenditure | SA Power Networks' determination 2015–20

153 Attachment 6 – Capital expenditure | SA Power Networks' determination 2015–20

E Predictive modelling approach and scenarios
This section provides a guide to our repex modelling process. It sets out:
the background to the repex modelling techniques
discussion of the data required to apply the repex model
detail on how this data was specified
description of how this data was collected and refined for inclusion in the repex model
the outcomes of the repex model under various input scenarios
This supports the detailed and multifaceted reasoning outlined in appendix A.
E.1 Predictive modelling techniquesIn late 2012 the AEMC published changes to the National Electricity and National Gas Rules.414 In light of these rule changes the AER undertook a “Better Regulation” work program, which included publishing a series of guidelines setting out our approach to regulation under the new rules.415
The expenditure forecast assessment Guideline describes our approach, assessment techniques and information requirements for setting efficient expenditure allowances for distributors.416 It lists predictive modelling as one of the assessment techniques the AER may employ when assessing a distributor's repex. We first developed and used our repex model in our 2009 review of the Victorian electricity distributor's 2011–15 regulatory proposals and have also used it subsequently.417
The technical underpinnings of the repex model are discussed in detail in the Replacement expenditure model handbook.418 At a basic level, the model predicts the volume of a distributor's assets that may need to be replaced over each of the next 20 years. This prediction is made by looking at the age of assets already in commission, and the time at which, on average, these assets would be expected to be replaced. The unit cost of replacing the assets is used to provide an estimate of replacement expenditure. The data used in the model is derived from the distributor’s regulatory information notice (RIN) responses and from the outcomes of the unit cost and replacement life benchmarking across all distribution businesses in the NEM. These processes are described below.
414 AEMC, Rule Determination, National Electricity Amendment (Economic Regulation of Network Service Providers) Rule 2012, 29 November 2012.
415 See AER Better regulation reform program web page at http://www.aer.gov.au/Better-regulation-reform-program.416 AER, Expenditure Forecast Assessment Guideline for Electricity Distribution, November 2013; AER, Expenditure
Forecast Assessment Guideline for Electricity Transmission, November 2013.417 AER Determinations for 2011–15 for CitiPower, Jemena, Powercor, SP AusNet, and United Energy.418 AER, Electricity network service providers, Replacement expenditure model handbook, November 2013.
154 Attachment 6 – Capital expenditure | SA Power Networks' determination 2015–20

E.2 Data specification processOur repex model requires the following input data on a distributor's network assets:
the age profile of network assets currently in commission
expenditure and replacement volume data of network assets
the mean and standard deviation of each asset’s replacement life (replacement life)
Given our intention to apply unit cost and replacement life benchmarking techniques, we defined the model’s input data around a series of prescribed network asset categories. We collected this information by issuing, in March 2014, two types of RINs:
1. "Reset RINs" which we issued to distributors requiring them to submit this information with their upcoming regulatory proposal
2. "Category analysis RINs" which we issued to all/other distributors in the NEM.
The two types of RIN requested the same historical asset data for use in our repex modelling. The Reset RIN also collected data corresponding to the distributors proposed forecast repex over the 2014–19 period. In both RINs, the templates relevant to repex are sheets 2.2 and 5.2.
For background, we note that in past determinations, our RINs did not specify standardised network asset subcategories for distributors to report against. Instead, we required the distributors to provide us data that adhered to broad network asset groups (e.g. poles, overhead conductors etc.). This allowed the distributor discretion as to how its assets were subcategorised within these groups. The limited prescription over asset types meant that drawing meaningful comparisons of unit costs and replacement lives across distributors was difficult.419
Our changed approach of adopting a standardised approach to network asset categories provides us with a dataset suitable for comparative analysis, and better equips us to assess the relative prices of capital inputs as required by the capex criteria.420
When we were formulating the standardised network assets, we aimed to differentiate the asset categorisations where material differences in unit cost and replacement life existed. Development of these asset subcategories involved extensive consultation with stakeholders, including a series of workshops, bilateral meetings and submissions on data templates and draft RINs.421
E.3 Data collection and refinement
419 The repex model has been applied in the Victorian 2011–15 and Aurora Energy 2012–17 distribution determinations; AER, Electricity network service providers Replacement expenditure model handbook, November 2013.
420 NER, clause 6.5.7(e)(6).421 See AER Expenditure forecast assessment guideline—Regulatory information notices for category analysis
webpage at http://www.aer.gov.au/node/21843.
155 Attachment 6 – Capital expenditure | SA Power Networks' determination 2015–20
The new RINs represent a shift in the data reporting obligations on distributors. Given this is the first period in which the distributors have had to respond to the new RINs, we undertook regular consultation with the distributors. This consultation involved collaborative and iterative efforts to refine the datasets to better align the data with what the AER requires to deploy our assessment techniques. We consider that the data refinement and consultation undertaken after the RINs were received, along with the extensive consultation carried out during the Better Regulation process provide us with reasonable assurance of the data's quality for use in this part of our analysis.
To aid distributors, an extensive list of detailed definitions was included as an appendix to the RINs. Where possible, these definitions included examples to assist distributors in deciding whether costs or activities should be included or excluded from particular categories. We acknowledge that, regardless of how extensive and exhaustive these definitions are, they cannot cater for all possible circumstances. To some extent, distributors needed to apply discretion in providing data. In these instances, distributors were required to clearly document their interpretations and assumptions in a “basis of preparation” statement accompanying the RIN submission.
Following the initial submissions, we assessed the basis of preparation statements that accompanied the RINs to determine whether the data submitted complied with the RINs. We took into account the shift in data reporting obligations under the new RINs when assessing the submissions. Overall, we considered that the repex data provided by all distributors was compliant. We did find a number of instances where the distributors’ interpretations did not accord with the requirements of the RIN but for the purpose of proceeding with our assessment of the proposals, these inconsistencies were not substantial enough for a finding of non-compliance with the NEL or NER requirements.422
Nonetheless, in order that our data was the most up to date and accurate, we did inform distributors, in detailed documentation, where the data they had provided was not entirely consistent with the RINs, and invited them to provide updated data. Refining the repex data was an iterative process, where distributors returned amended consolidated RIN templates until such time that the data submitted was fit for purpose.
E.4 Benchmarking repex asset dataAs outlined above, we required the following data on distributors' assets for our
repex modelling:
age profile of network assets currently in commission
expenditure, replacement volumes and failure data of network assets
the mean and standard deviation of each asset’s replacement life.
All NEM distributors provided this data in the Reset RINs and Category analysis RINs under standardised network asset categories.
422 NER, cl. 6.9.1.
156 Attachment 6 – Capital expenditure | SA Power Networks' determination 2015–20

To inform our expenditure assessment for the distributors currently undergoing revenue determinations,423 we compared their data to the data from all NEM distributors. We did this by using the reported expenditure and replacement volume data to derive benchmark unit costs for the standardised network asset categories. We also derived benchmark replacement lives (the mean and standard deviation of each asset’s replacement life) for the standardised network asset categories.
In this section we explain the data sets we constructed using all NEM distributors' data, and the benchmark unit costs and replacement lives we derived for the standardised network asset categories.
E.4.1 Benchmark data for each asset category
For each standardised network asset category where distributors provided data we constructed three sets of data from which we derived the following three sets of benchmarks:424
benchmark unit costs
benchmark means and standard deviations of each asset’s replacement life (referred to as "uncalibrated replacement lives" to distinguish these from the next category)
benchmark calibrated means and standard deviations of each asset’s replacement life.
Our process for arriving at each of the benchmarks was as follows. We calculated a unit cost for each NEM distributor in each asset category in which it reported replacement expenditure and replacement volumes. To do this:
We determined a unit cost for each distributor, in each year, for each category it reported under. To do this we divided the reported replacement expenditure by the reported replacement volume.
Then we determined a single unit cost for each distributor for each category it reported under. We first inflated the unit costs in each year using the CPI index.425 We then calculated a single unit cost. We did this by first weighting the unit cost from each year by the replacement volume in that year. We then divided the total of these expenditures by the total replacement volume number.
We formulated two sets of replacement life data for each NEM distributor:
The replacement life data all NEM distributors reported in their RINs.
The replacement life data we derived using the repex model for each NEM distributor. These are also called calibrated replacement lives. The repex model derives the replacement lives that are implied by the observed replacement practices of a distributor. That is, based on the data a distributor reported in the
423 NSW, ACT, SA and QLD distribution network service providers—Ausgrid, Endeavour Energy, Essential Energy, ActewAGL, SA Power Networks, Energex and Ergon Energy.
424 We did not derive benchmark data for some standardised asset categories where no values were reported by any distributors, or for categories distributors created outside the standardised asset categories.
425 We took into account whether the distributor reported on calendar or financial year basis.
157 Attachment 6 – Capital expenditure | SA Power Networks' determination 2015–20

RIN on its replacement expenditure and volumes over the most recent five years, and the age profile of its network assets currently in commission. The calibrated lives the repex model derives can differ from the replacement lives a distributor reports.
We derived the benchmarks for an asset category using each of the three data sets above. That is, we derived a set of benchmark unit costs, benchmark replacement lives, and benchmark calibrated replacement lives for an asset category. To differentiate the two sets of benchmarked replacement lives, we refer to the benchmarks based on the calibration process as 'benchmarked calibrated replacement lives' and those based on replacement lives reported by the NEM distributors as 'benchmarked uncalibrated replacement lives'. We applied the method outlined below to each of the three data sets.
We first excluded Ausgrid's data, since it reported replacement expenditure values as direct costs and overheads. Therefore these expenditures were not comparable to all other NEM distributors which reported replacement expenditure as direct costs only. We then excluded outliers by:426
calculating the average of all values for an asset category
determining the standard deviation of all values for an asset category
excluding values that were outside plus or minus one standard deviation from the average.
Using the data set excluding outliers we then determined the:
Average value:
o benchmark average unit cost
o benchmark average mean and standard deviation replacement life
o benchmark average calibrated mean and standard deviation replacement life.
One quartile better than the average value:
o benchmark first quartile unit cost (below the mean)
o benchmark third quartile uncalibrated mean replacement life (above the mean)
o benchmark third quartile calibrated mean replacement life (above the mean).
'Best' value:
o benchmark best (lowest) unit cost
426 For the benchmarked calibrated replacement lives we performed two additional steps on the data prior to this. We excluded any means where the distributor did not report corresponding replacement expenditure. This was because zero volumes led to the repex model deriving a large calibrated mean which may not reflect industry practice and may distort the benchmark observation. We also excluded any calibrated mean replacement lives above 90 years. Although the repex model can generate these large lives, observations of more than 90 years exceed the number of years reportable in the asset age profile.
158 Attachment 6 – Capital expenditure | SA Power Networks' determination 2015–20

o benchmark best (highest) uncalibrated mean replacement life
o benchmark best (highest) calibrated mean replacement life.427
E.5 Repex model scenariosAs noted above, our repex model uses an asset age profile, expected replacement
life information and the unit cost of replacing assets to develop an estimate of replacement volume and expenditure over a 20 year period.
The asset age profile data provided by the distributors is a fixed piece of data. That is, it is set, and not open to interpretation or subject to scenario testing.428 However, we have multiple data sources for replacement lives and unit costs, being the data provided by the distributors, data that can be derived from their performance over the last five years, and benchmark data from all distributors across the NEM. The range of different inputs allows us to run the model under a number of different scenarios, and develop a range of outcomes to assist in our decision making.
We have categorised three broad input scenarios under which the repex model may be run. These are explained in greater detail within our Replacement expenditure model handbook.429 They are:
(1) The Base scenario – the base scenario uses inputs provided by the distributor in their RIN response. Each distributor provided average replacement life data as part of this response. As the distributors did not explicitly provide an estimate of their unit cost, we have used the observed historical unit cost from the last five years and the forecast unit cost from the upcoming regulatory control period in the base scenario.
(2) The Calibrated scenario – the process of “calibrating” the expected replacement lives in the repex model is described in the AER’s replacement expenditure handbook.430 The calibration involves determining a replacement life and standard deviation that matches the distributor's recent historical level of replacement (in this case, the five years from 2010–11 to 2014–15). The calibrated scenario benchmarks the business to its own observed historical replacement practices.
(3) The Benchmarked scenarios – the benchmarked scenarios use unit cost and replacement life inputs from the category analysis benchmarks. These represent
427 We did not determine quartile or best values for the standard deviation and calibrated standard deviation replacement lives. This is because we used the benchmark average replacement lives (mean and standard derivation) for comparative analysis between the distributors. However, the benchmark quartile and best replacement life data was for use in the repex model sensitivity analysis. The repex model only requires the mean component of an asset's replacement life as an input. The repex model then assumes the standard deviation replacement life of an asset is the square root of the mean replacement life. The use of a square root for the standard deviation is explained in more detail in our Replacement expenditure model handbook; AER, Electricity network service providers, Replacement expenditure model handbook, November 2013.
428 It has been necessary for some distributors to make assumptions on the asset age profile to remove double counting. This is detailed at the end of this appendix.
429 AER, Electricity network service providers, Replacement expenditure model handbook, November 2013.430 AER, Electricity network service providers, Replacement expenditure model handbook, November 2013, pp. 20–
21.
159 Attachment 6 – Capital expenditure | SA Power Networks' determination 2015–20

the observed costs and replacement behaviour from distributors across the NEM. As noted above, we have made observations for an “average”, “first or third quartile” and “best performer” for each repex category, so there is no single "benchmarked" scenario, but a series of scenarios giving a range of different outputs.
The model also takes account of different wooden pole staking/stobie pole plating rate assumptions (see section E.3 for more information on this process). A full list of the scenario outcomes is provided in Figure E-7 and Figure E-8 below.
Figure E-7 Repex model outputs – replacement lives
Replacement lives
Base case (RIN) $4,109,602.84
Calibrated lives $487,433.07
Benchmarked uncalibrated average $4,364,299.17
Benchmarked uncalibrated third quartile $3,127,325.35
Benchmarked uncalibrated best $2,365,833.79
Benchmarked calibrated average $682,081.73
Benchmarked calibrated third quartile $556,547.57
Benchmarked calibrated best $396,735.81
Source: AER analysis, using historic unit cost
Figure E-8 Repex model outputs - unit costs
Unit cost
Benchmarked average $543,992.70
Benchmarked first quartile $369,861.37
Benchmarked best $285,947.72
Source: AER analysis, using calibrated replacement lives.
Data assumptions
Certain data points were not available for use in the model. For unit costs, this arose either because the distributor did incur any expenditure on an asset category in the 2010–15 regulatory control period (used to derive historical unit costs) or had not proposed any expenditure in the 2015–20 regulatory control period (used to derive forecast unit costs). If both these inputs were not available, we used the benchmarked average unit cost as a substitute input.
In addition, we did not use a calibrated asset replacement life where the distributor did not replace any assets during the 2010–15 regulatory control period. This is
160 Attachment 6 – Capital expenditure | SA Power Networks' determination 2015–20

because the calibration process relies on replacement volumes over the five year period to derive a mean and standard deviation, and using a value of zero may not be appropriate for this purpose. In the first instance, we substituted these values with the average calibrated replacement life of the broad asset group to which the asset subcategory belonged. Where this was not available, we used the benchmarked calibrated replacement life or the base case replacement life from the distributor.
Un-modelled repex
As detailed in the AER's repex handbook, the repex model is most suitable for asset categories and groups with a moderate to large asset population of relatively homogenous assets. It is less suitable for assets with small populations or those that are relatively heterogeneous. For this reason, we chose to exclude certain data from the modelling process, and did not use predictive modelling to directly assess these categories. We decided to exclude SCADA repex from the model for this reason. Expenditure on pole top structures was also excluded, as it is related to expenditure on overall pole replacement and modelling may result in double counting of replacement volumes. Other excluded categories are detailed in appendix A.3 of this preliminary decision.
E.6 The treatment of staked wooden poles and plated stobie poles
The staking of a wooden pole is the practice of attaching a metal support structure (a stake or bracket) to reinforce an aged wooden pole.431 The practice has been adopted by distributors as a low-cost option to extend the life of a wooden pole. These assets require special consideration in the repex model because, unlike most other asset types, they are not installed or replaced on a like for like basis. To understand why this requires special treatment, we have described below the normal like-for-like assumption used in the repex model, why staked poles do not fit well within this assumption, and how we adapt the model inputs to take account of this.
E.6.1 Like-for-like repex modelling
Replacement expenditure is normally considered to be on a like-for-like basis. When an asset is identified for replacement, it is assumed that the asset will be replaced with its modern equivalent, and not a different asset. For example, conductor rated to carry low voltage will be replaced with conductor of the same rating, not conductor rated for high voltage purposes.
The repex model predicts the volume of old assets that need to be replaced, not the volume of new assets that need to be installed. This is simple to deal with when an asset is replaced on a like-for-like basis – the old asset is simply replaced by a new 431 The equivalent practice for stobie poles is known as "plating", which similarly provides a low cost life extension.
SA Power Networks carries out this process. We applied the same process for modelling SA Power Networks' stobie pole plating data as we have for staked wooden poles. However, for simplicity, this section only refers to the staking process.
161 Attachment 6 – Capital expenditure | SA Power Networks' determination 2015–20
asset of the same kind. It follows that the volume of assets that needs to be replaced where like-for-like replacement is appropriate match the volume of new assets to be installed. The cost of replacing the volume of retired assets is the unit cost of the new asset multiplied by the volume of assets that need to be replaced.
E.6.2 Non-like-for-like replacement
Where old assets are commonly replaced with a different asset, we cannot simply assume the cost of the new asset will match the cost of the old asset's modern equivalent. As the repex model predicts the number of old assets that need to be replaced, it is necessary to make allowances for the cost of a different asset in determining the replacement cost. In running the repex model, the only category where this was significant was wooden poles (or stobie poles for SA Power Networks).
Staked and unstaked wooden poles
The life of a wooden pole may be extended by installing a metal stake to reinforce its base. Staked wooden poles are treated as a different asset in the repex model to unstaked poles. This is because staked and unstaked poles have different expected lives and different costs of replacement.
When a wooden pole needs to be replaced, it will either be staked or replaced with a new pole. The decision on which replacement type will be carried out is made by determining whether the stake will be effective in extending the pole's life, and is usually based on the condition of the pole base. If the wood at the base has deteriorated too far, staking will not be effective, and the pole will need to be replaced. If there is enough sound wood to hold the stake, the life of the pole can be extended, and a stake can be installed. Consequently, there are two possible asset replacements (and two associated unit costs) that may be made by the distributor – a new pole to replace the old one or nailing a stake the old pole.
The other non-like-for-like scenario related to staking is where an in-commission staked pole needs to be replaced. Staking is a one-off process. When a staked pole needs to be replaced, a new pole must be installed in its place. The cost of replacing an in-commission staked pole is the cost of a new pole.
Unit cost blending
We use a process of unit cost blending to account for the non-like-for-like asset categories.
For unstaked wooden poles that need to be replaced, there are two appropriate unit costs: the cost of a new pole; and the cost of staking an old pole. We have used a weighted average between the unit cost of staking and the unit cost of pole replacement to arrive at a blended unit cost.432 We ran the model under a variety of
432 For example, if a distributor replaces a pole with a new pole 50 per cent of the time, and stakes the pole the other 50 per cent of the time, the blended unit cost would be a straight average of the two unit costs. If the mix was 60:40, the unit cost would be weighted accordingly.
162 Attachment 6 – Capital expenditure | SA Power Networks' determination 2015–20

different weightings – including the observed staking rate of the business and observed best practice from the distributors in the NEM.
For SA Power Networks (stobie plating) and Ergon Energy, we adopted their own observed plating/staking ratio, respectively. Energex, however, exhibited a staking ratio of 24 per cent. This is lower than peer urban networks such as Ausgrid and ActewAGL, and, indeed, lower than Ergon Energy's staking rate of 46 per cent on its predominantly rural network. Energex does not appear to achieve significantly longer lives on its poles than these three distributors (the weighted calibrated replacement life of its pole assets group is 56 years, while the figure for Ausgrid is 59 years). By contrast, Essential Energy, which also has a low staking rate, achieves longer lives than the other distributors (the weighted calibrated replacement life of its pole assets group is 66 years). As such, it appears that Energex predominantly chooses to replace its wooden poles earlier than other distributors, and does not utilise staking to the same extent. We consider that Energex's staking rate is lower than would be expected, given the age at which its assets reach replacement age and the practices of its peers. Consequently, we have applied in our modelling a benchmarked rate equivalent to Ausgrid's staking rate of 47 per cent.
For staked wooden poles being replaced, in the first instance, we used historical data from the distributors on the proportion of different voltage staked wooden poles being replaced to approximate the volume of each new asset going forward.433 The unit cost of replacing a staked wooden pole is a weighted average based on the historical proportion of pole types replaced. Where historical data was not available, we used the asset age data to determine what proportion of the network each pole category represented, and used this information to weight the unit costs.
E.7 Calibrating staked wooden polesSpecial consideration also has to be given to staked wooden poles when finding
replacement lives. This is because historical volumes of replacements are used in calibration. The RIN responses provide us with information on the volume of new assets installed over the last five years. However, the model predicts the volume of old assets being replaced - so an adjustment needs to be made for the calibration process to function correctly. We sought this information directly from the distributors. It should be noted that staking of wooden poles is a relatively recent activity, and we have not observed a large number of historical replacements of these assets by the distributors.
For SA Power Networks' stobie pole plating, we did not apply the calibration process. This is because SA Power Networks has only carried out the plating process for the past ten years. SA Power Networks submits that the average replacement life of a plated stobie pole is around 20 years. Given it has no assets in commission that have reached this age, this asset is not suitable for calibration. We have utilised the base case replacement life submitted by SA Power Networks in all iterations of the model.
433 Poles with different maximum voltages have different unit costs. An assumption needs to be made to determine, for example, how many new ">1kv poles" and how many new "1kv-11kv" need to be installed to replace the staked wooden poles.
163 Attachment 6 – Capital expenditure | SA Power Networks' determination 2015–20
E.8 Wooden pole asset adjustment (Ergon Energy)Ergon Energy reported its staked wooden poles twice in its asset age profile: once as "staking of a wooden pole" and a second time under one of the six wooden pole categories. This resulted in the double counting of its wooden poles. Using the data "as is" in the repex model would result in the double counting of these assets. Consequently, we made an adjustment to Ergon Energy's wooden pole data to net out the double counted assets.
The adjustment required involves subtracting the total number of staked poles from the total number of wooden poles in commission. We decided to do carry out this adjustment proportionally across the wooden pole asset base. We also assumed that no new pole installed after 1985 would have required staking (or the number would be negligible) so the adjustment would be applied to the pre-1985 asset base.
To make this adjustment, the total number of wooden poles in commission (with an installation date of 1985 or before) was calculated. Then we found the proportion of the total that each category of wooden poles made up in each year. The total number of staked poles was multiplied by these proportions to give an adjustment figure. This figure was then subtracted from the asset age profile.
Our approach allocates the adjustment across each year of the age profile, rather than attempting to make targeted adjustments at particular years, or bias the adjustment in favour of older poles. Given the expected lives of wooden poles (50+ years), it is likely that a greater number of the stakings were carried out on the older poles in the asset base than newer poles (that is, a pole that is over 50 years old is more likely to be staked than a pole that is under 50). Assuming this is correct, applying a constant allocation of the staking to all pre-1985 poles may result in a greater number of newer poles being netted out and fewer old poles being netted out than we would expect in practice. Under this circumstance, we would expect the repex model to calculate a greater volume of replacements than it would if the adjustments were distributed with an asymmetric bias towards older poles. Consequently, the approach does not disadvantage Ergon Energy, as it is not likely to result in an underestimation of their replacement requirements, and is more likely to skew in favour of replacement.
164 Attachment 6 – Capital expenditure | SA Power Networks' determination 2015–20