Embed Size (px)
Citation preview

HE MOST SPECTACULAR fluctuations in mar-ketable securities prices in the era since World War IIhave been encountered since early 1970. The marketsfor both common stocks and bonds staged large rafflesbetween June 1970 and February 1971, after declin-ing in the spring of last year. At their zenith in June,high-grade bond yields reached levels never beforerecorded in U. S. financial annals. Stock pricesslumped to six-year lows in May. Capital market pes-simisin reached great extremes; some (though not all)observers foresaw a dearth of funds available for in-vestment extending far into the decade. Lower inter-est rates and higher stock prices have doubtlesscaused revision of such views, although the pace ofthe market changes makes reappraisal of long-runfinancing prospects difficult, Beyond that, the 1970experience raises questions about the causes of suchgyrations and their effects on the economy.
Cyclical Variations inInterest Rates and Stock Prices
Among the unusual features of financial markets in1970 was the delayed response of long-term interestrates to the business downturn. Whereas in previouspostwar business slowdowns, peaks in bond yields oc-curred promptly after business peaks or even pre-ceded them, three quarters elapsed after the businessdownturn in 1969 before long-term Treasury and cor-porate bond yields reached their peaks. Since then,the reductions in yields have been the greatest inamount of any comparable period since World WarII. Seasoned corporate Aaa bonds, for example, de-clined from a peak of 8.6 per cent in the week endingJune 26, 1970 to 7.1 per cent in the week endingMarch 5, 1971. Long-term U. S. government securitiesfell from a yield of 6.8 per cent to 5.9 per cent in thesame span of time. In a recent reversal, yields, es-
Capital Markets and Interest Rates in 1970
pecially on corporate new issues, have risen and otherlong-term interest rates have stopped declining.
Short-term interest rates displayed more typicalcyclical behavior, reaching highs at the beginning of1970, a quarter after the downturn in business activity,then falling rapidly with only one temporary reversalthroughout the year. The four- to six-month commer-cial paper rate, which was 9.08 per cent in the secondweek of January 1970, plummeted to 4.25 per centby early March 1971, Three-month U. S. Treasury billyields fell from 7.91 per cent to 3.35 per cent in thesame period.
Page 2
FEDERAL RESERVE BANK OF ST. LOUIS MARCN ~971
Stock prices underwent a broad retreat throughout1969 and early 1970. In Spring 1970, retreat threat-ened to turn into rout for a brief interval, as stockprices fell by 23 per cent between April 1. and May26. By the end of May, however, the market beganto regain composure. and since then, stock priceshave rebounded. i’he Standard and Poor’s Index of500 Stocks (1941-43 = 10), which reached a low of69.29 on May 26, 1970, climbed to 97.56 by earlyMarch 1971.
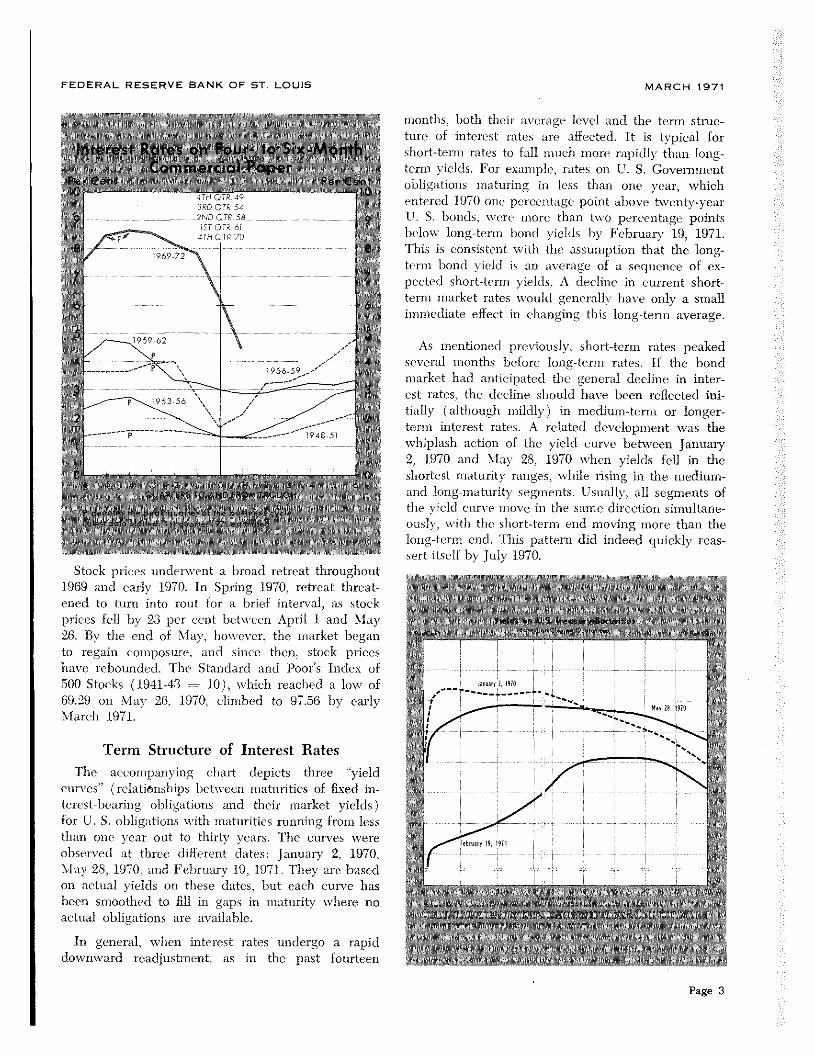
Term Structure of Interest RatesThe accompanying chart depicts three “yield
curves” (relationships betwecn maturities of fixed in-terest-bearing obligations and their market yields)for U. S. obligations with maturities running from lessthan one year out to thirty years. The curves wereobserved at three different dates: January 2, 1970,May 28, 1970, and February 19, 1971. They are basedon actual yields on these dates, hut each curve hasbeen smoothed to fill in gaps in maturity where noactual obligations are available.
In general, when interest rates undergo a rapiddownward readjustment, as in the past fourteen
months. both their average level and the term struc-ture of interest rates are affected. It is typical forshort—tenn rates to fall much more rapidly than long—term yields. For example, rates on U. S. Governmentohligations maturing in less than one year, whichentered 1970 one percentage point above twenty—yearU. 5. bonds, were more than two percentage pointsbelow long-term bond yields by February 19, 1971.This is consistent with the assumption that the long—term bond yield is an average of a sequence of ex-pected short-term yields. A decline in current short-term market rates would generally have only a smallimmediate effect in changing this long-term average.
As mentioned previously, short-term rates peakedseveral months before long-term rates. If the bondmarket had anticipated the general decline in inter-est rates, the decline should have been reflected ini-tially (although mildly) in medium—term or longer-term interest rates. A related development was thewhiplash action of the yield curve between January2, 1970 and May 28, 1970 when yields fell in theshortest niaturity ranges. while rising in the medium-and long—maturity segments. Usually, all segments ofthe yield curve move in the same direction simultane-ous1),, \\‘ith the short-term end moving more than thelong-term end. TIns pattern did indeed quickly reas-sert itself by July 1970.
Page 3

FEDERAL RESERVE BANK OF ST. LOUIS MARCH 1971
Inflation Expectations and Intercst Rates
The expectations interpretation of the yield curvehelps explain how some of the recent change in in-terest rates was transmitted through the maturityspectrum. Other considerations would explain how thegeneral level of interest mates is dctcnnined, A factorwhich may have contributed greatly to the high levelsof interest rates up to the 1970 peaks is anticipatedinflation. Interest rates on mien’ loans were adjustedupward to reflect the expected depreciation of thepurchasing power of the dollar during the period ofeach loan. Since borrowers expect to repay loans in
depreciated dollars, they were willing to offer higherinterest rates. Lenders, on the other hand, were will-ing to accept such terms only because high interestrates include an inflation premium that compensatesfor the expected reduction in the value of the dollar.
In other words, what borro\vers and lenders agreeupon is a nominal or market interest rate (Rn) which,when the premium for the expected percentage rateof inflation ( AP”) is subtracted, leaves a net interestrate (Rr) that represents both an acceptable rate ofreturn to the lender and cost to the borrower. Thisnet return, after allowing for anticipated inflation, iswhat some economists have labelled the “real” rate ofinterest.t That is, the real rate, Rr, equals Rn — AP°,
This interpretation of interest rate movements hasbeen incorporated in the interest rate equations ofthe St. Louis model.2 It has also beet) employed in arelated study of stock price determination.tm Thesestudies find that other factors influence real rates ofinterest, notably gro\vth in the money stock (currencyplus demand deposits) which exercises a short-livednegative effect (positive on stock prices), and growth
in real output, \vhich affects the real rate of interestpositively with a lag over a longer time span (nega-tive effect on stock prices). Corporate after-tax profitsalso have a positive impact, with a lag, on stock prices.Anticipated inflation, in the sense already described,has a powerful influence ii) these equations, tendingto drive average stock prices down and interest rates
up.’
~ Intucst Rates and Price 1 evd Clmangs 1952 69 thisReview (flecemher 1969), pp. 1&38.
2”A Monetanst Model for Economic Stabilization,” this Review(April 1970), PP. 7-25.
‘Fxpeetations, Money and the Stock Market,” this Review(lanuary 1971), pp. 16-31.
-‘‘l’he effect of anticipated inflation on stock prices runscounter to some interpretations of stocks as ‘hedges’’ againstinflation. The findings suggest that expected corporate earn~ings do not fully adjust to anticipated price advances. In-vestors apparently regard common stocks typically as mixtures
Most of the rise in bond yields from 1965 untilearly 1970 can he attributed to the escalation in theinflation premium. It appears, however, that inflationanticipations based on past price experience) cannotfully account for the high levels of interest rates (andlow levels of stock prices) in the second and thirdquarters of 1970. Correspondingly, in the first quarterof 1971, the interest rate equations forecast only amild decline in rates, by companson with the declineswhich have already occurred, Stock price forecastsare helow the current market average, although thedirection of change is being correctly predicted.Either inflation fears are now subsiding more rapidlythan these equations recognize, or some other factorsare at work pulling interest rates down.
Other Possible Explanations for RecentInterest Rate and Stock Price Movements
Apart from anticipated inflation, other factors mighthave exercised an influence on nominal interest rates
by altering the real rate of interest. Such factors in-clude special disturbances affecting either the supplyof money relative to the demand for money, or theflow of intended saving relative to intended invest-ment, In adtlition, there might have been sudden orunusual shifts among sectors in their borrowing orlending patterns, causing temporary adjustment prob-lems that could have been reflected in interest rates.Recent developments wiH be surveyed from each ofthese points of view.
Factors Affecting Demand for andSupply of Money and Near Monies
Rapid growth in monetary aggregates relative togrowth ii) demand for them should exert downwardpressure on interest rates — in the short run. The op-
posite short-run effect on rates occurs when the sup-
ply of monetary aggregates is growing less rapidly
than their demand.Monetary rates of change, both including and ex-
cluding net time deposits, reached lows hi the latterhalf of 1969, and thereafter reversed the downtrendsthat began in 1968.~Business activity began to recedeii) the third or fourth quarter of 1969. This represents
of fixed nominal income streams, like bonds, and earningsstreams that escalate with inflation. For this reason, theaverage price of all common stocks cannot be viewed simplyas the market valuation of real capital.
5Net timne deposits are total time deposits less large denomnina—tion CD’s. A similar statement could be made describingtIme mate of growth in money plus total time deposits, or evenbroader liquidity aggregates including savings arid loanshares and mutual savings bank deposits.
Page 4

FEDERAL RESERVE BANK OF ST. LOUIS MARCH 1971
a relatively earls’ turnaround in comparison withmonetary rates of change near previous postwar busi-
ness cycle peaks’ Frequently the lowest rates ofmonetary growth have come several months after the
business peak. Hemmee, the continued high level ofinterest rates in earl)? 1970 cannot he attributed tosluggish increases in the monetary aggregates in the
face of the business slowdown.
During the last half of 1970, when interest rates fellsharply, the large increase in negotiable CD’s was
C( nt nd r its of dhanl,e of nmo\ mng avenges gi’ e somewhitdifl erent results than ‘‘step” rates of change. Both are shownin chart above, The “step” method is generally used in thisBank’s reports. Changes in “steps” tendl to be preceded bypeaks and troughs in centered moving average rates ofchange.
a prominent feature of growth in monetary aggre-gates. Negotiable CD’s grew from $13.2 billion inJune 1970 to $27 billion in February 1971. Moneysupply plus all commercial hank time deposits in-creased at a 17.4 per cent annual rate in the sameperiod. Upward interest adjustments on CD’s (follow-ing suspension in June of Regulation Q interest ceil-ings on large CD’s of less than 90 days maturity),combined with a declining trend of interest rates oncompetitive assets such as commercial paper, Euro-dollars, and Treasury’ bills. made CD’s more attractivefor bsisinesses to hold.
There has also been a very substantial increase innet time deposits at commercial banks and savingsinstitutions. Between June 1970 and February 1971,these liquid assets grew by $43.1 billion. Over thesame tune span, money supply, defined as currencyplus demand deposits, rose at a 5.7 per cent annualrate. In comparison with the turnarounds in previousperiods of monetary expansion, the increased growthin the money stock relative to its low point in 1969has been moderate, but the recovery in growth ofmoney stock plus net time deposits has been rapid.
Some of this growth can he ascribed to “reintermne-diation” which occurs when interest rates decline oncompeting liquid assets. In addition, the decline inthese interest rates, especially in recent months, hasreceived a significant stimulus from expansionarymonetary policy. For example, reserves of memberbanks have increased at an annual rate of 14.3 percent since fast June. The recent high rates of growthin the broader aggregate of money plus net time de-posits reflect both the rapid expansion in bank re-serves and the sharp decline in interest rates onmarketable securities,
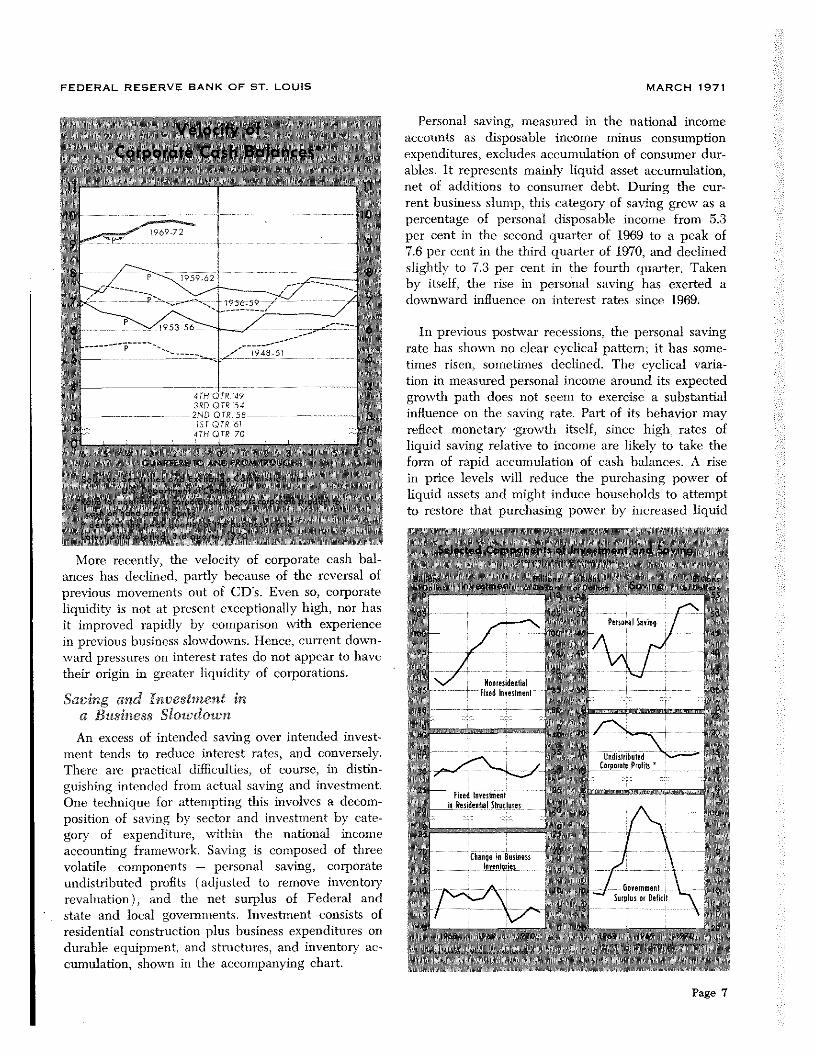
A useful, though crude, measure of the demand formoney balances in relation to income is the “incomevelocity of money” — the ratio of income to moneybalances. This ratio isan indicator of the turnoverrate of money balances in exchange for goods andservices. The following chart shows the ratio ofCNP to mone plus “net time deposits” (corn—mnercial bank time deposits excluding large dlenomi—nation CD’s) in postwar business recessions. Theamount of mnomiey balances demanded increases eithermore or less than proportionately with income or GNP.During much of the postwar period, the chart showsvelocity to have risen with each successive businesscycle. indicating a tendency for holders of nmoney amidnet time deposits to increase their spending on goodsand services faster than the groivth in their liquid
Page 5

FEDERAL RESERVE SANK OF ST. LOUIS
balances.7 Hosvever, during business slowdo~vns,velo-city falls — monetary assets increase relative to GNP.This happened in each of the recessions of 1949, 1954,1958, and 1961, and in 1970.
The decline in velocity during business slowdownsis typically associated with reductions in interd’st
rates.8 After the business trough is reached, interestrates rise and velocity tendls to recover. If the contra-cyclical rise in long-term interest rates in early 1970had been the result of a sudden rise in the demnandlfor niommey plus net time deposits, we should he ableto detect it in an abnormally sharp drop in velocity.9
Similarly, the rapid decline in interest rates would heassociated with an abnormally’ sharp rise in velocity— signifying a reduction in the dlemandl for money
plus mmet time tleposits. The dleerease in velocity dur-
7The rise imi velocity of money stock as conventionally deflnedlhas been greater than the rise in the velocity of money plus“net time deposits, especially in the last decade.
“Time rise in velocity between successive post World \Var IIbusiness cycles is associated with (and may, in part, he dsieto) successive higher levels of interest rates.
b&ssuming that unisitended variations in velocity are of negli-gible importance.
Page 6
MARCH 1971
ing the 1970 business contraction was not unusual bycomparison with postwar recessions. Nor has therebeen any evidence of an unusually sharp rise in veloc-ity in recent months. Except for possibly the fourthquarter, one may rule out sudden changes in thedemand for money plus net time deposits as a con-tributing factor to the abnormal behavior of interestrates since January 1970.10
The velocity of mnoney plus net timne deposits isperhaps too broad a measure, especially since it tendsto consist very largely of liquid assets held by house-holds, which exhibited none of the symptoms of aliquidity crisis in 1970. Some observers found suchsymptoms among business finns reacting to unfavor-able financial developments in 1970. The failure ofPenn Central Company sent liabilities of business fall-ures upward in midyear. Corporate profits sagged forfour quarters in a row beginning with third quarter1969. Liquidity positions of nonfinancial corporations,by a variety of yardsticks, were stretched thinner inmid-1970 than in any previous postxvar year. Thereis little evidence, however, that in 1970 a significantnumber of othenvise financially viable finns wereforced to close for liquidity reasons alone.
Velocity of nonfinancial corporate cash balancestends to decline during business contractions. The1970 decline was delayed until three quarters afterthe fourth quarter 1969 turning point in business ac-tivity. but it is not clear whether this was a cause or aresult of high interest rates. To he a cause of highinterest rates, one must assume the rise in corporatevelocity after the business peak was unintended, sothat corporations were attempting to improve theirliquidity positions. Much of what appears to be adecline during 1969 and early 1970 in corporate liq-uidity (rise in velocity) merely represents switchingfrom negotiable CD’s to commercial paper and gov-ernment securities. Such shifts wert’ a result of highinterest rates (and regulatory interest ceilings onCD’s ) , not a cause of high interest rates.
I “The General Motors strike of September—November, 1970nay have temporarily depressed the amnoumst of money de—
nmancled in the fourth dimmarter of 1970 by reducing outputand income below what it wouldl have othenvise been,This m’esponse would not l,e fully reflected in velocity, ifboth income and demand for money declined and moneystock were also reduced ‘Sr pernntted to grow less rapidly.lntem’est rates, therefore, eotsld have been forced downwardin the fourth quarter because of the eli ect of the strike, Inthe three months since the strike ‘yam settled, output growthhas recovered from its strike-induced low, but interest rateshave continued to fall. Other factors are evidently at workin redsrcing interest rates currently.
FEDERAL RESERVE BANK OF ST. LOUIS MARCH 1971
Saving and Investment ina Business Slowdown
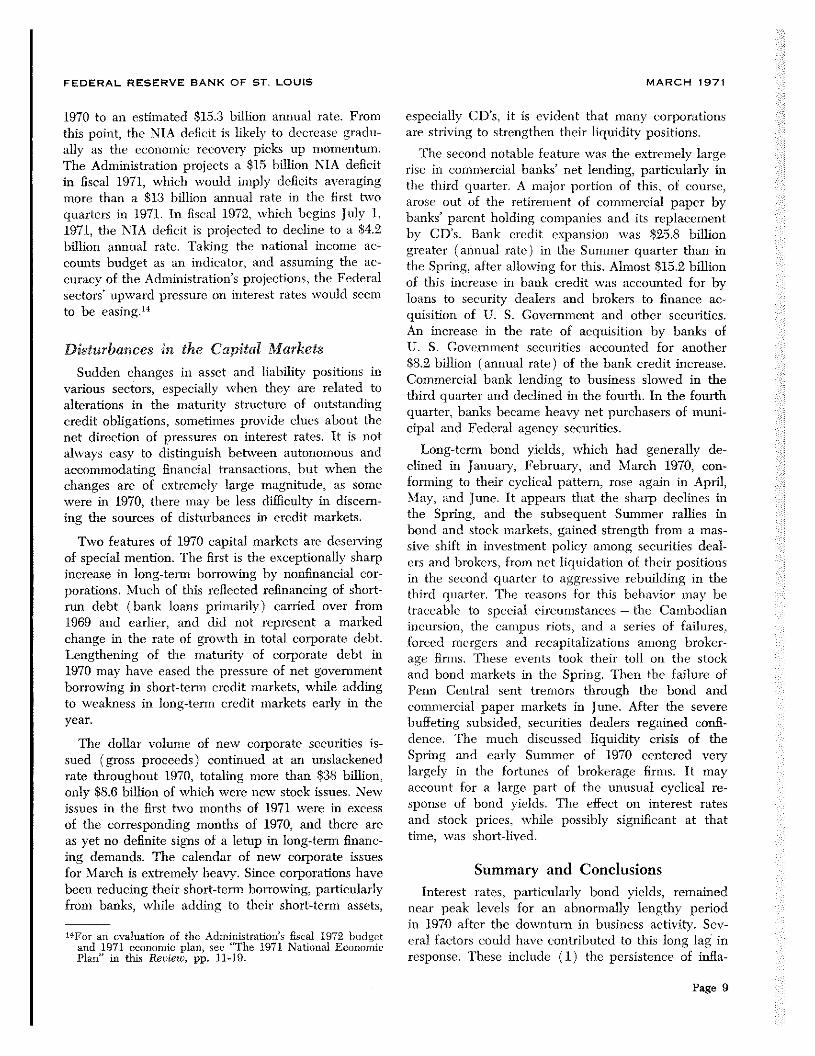
An excess of intended saving over intended invest-ment tends to reduce interest rates, and conversely.There are practical difficulties, of course, in distin-guishing intended from actual saving and investment.One technique for attempting this involves a decom-position of saving by sector and investment by cate-gory of expenditure, within the national incomeaccounting framework. Saving is composed of threevolatile components — personal saving, corporateundistributed profits (adjusted to remove inventoryrevaluation), and the net surplus of Federal andstate and local governments. Jnvestment consists ofresidential construction plus business expenditures ondurable equipment, and structures, and inventory ac-cumulation, shown in the accompanying chart.
Personal saving, measured in the national incomeaccounts as disposable income minus consumptionexpenditures, excludes accumulation of consumer dur-ables. It represents mainly liquid asset accumulation,net of additions to consumer debt. During the cur-rent business slump, this category of saving grew as apercentage of personal disposable income from 5.3per cent in the second quarter of 1969 to a peak of7.6 per cent in the third quarter of 1970, and declinedslightly to 7.3 per cent in the fourth quarter. Takenby itself, the rise in personal saving has exerted adownward influence on interest rates since 1969.
In previous postwar recessions, the personal savingrate has shown no clear cyclical pattern; it has some-times risen, sometimes declined. The cyclical varia-tion in measured personal income around its expectedgrosvth path does not seem to exercise a substantialinfluence on the saving rate. Part of its behavior mayreflect monetary ‘growth itself, since high rates ofliquid saving relative to income are likely to take theform of rapid accumulation of cash balances. A risein price levels will reduce the purchasing power ofliquid assets and might induce households to attemptto restore that purchasing power by increased liquid
More recently, the velocity of corporate cash bal-ances has declined, partly because of the reversal ofprevious movements out of CD’s. Even so, corporateliquidity is not at present exceptionally high, nor hasit improved rapidly by comparison with experiencein previous business slowdowns. Hence, current down-ward pressures on interest rates do not appear to havetheir origin in greater liquidity of corporations.
Page 7

FEDERAL RESERVE BANK OF ST. LOUIS MARCH 1971 ½
saving. Sustained inflation, on the other hand, buildsup anticipation of future price advances, which tendsto discourage liquid saving. Higher interest rates onliquidl assets, however, could compensate for antici-
pated inflation, and may have dlone so to somnc extent
in recent years.The rise in the personal saving rate that began in
the third quarter of 1969 appears to coincide withmore rapid monetary growth. Looking ahead, a sub-stantial decline in personal saving rates could occuras a result of lo~verinterest rates, slower monetary’growth or reduced inflation, especially if anticipatedinflation remnams high.
Investment in dwellings is generally regarded ashighly responsive to interest rate movements, ratherthan as a factor operating to exert strong pressure oninterest rates, especially pressure of a procyclical na-ture. High and rising mnortgage interest costs in 1969and early 1970 were reflected in declining residentialconstruction expenditures. Federal government sup-port of housing programs may have moderated thedecline. Since the second quarter, homebuilding ex-penditures have rebounded to an annual rate of $32billion, less than $2 billion below their 1969 peak.Prospects for a continuation of this resurgence havebeen bolstered by the recent declines in long-terminterest rates. These have enabled the Federal gov-ernment to reduce EllA and VA ceiling mortgageloan rates to 7 per cent from the 8½per cent level ofDecember 1969.
Capital expenditure plans in the business sectorsvere exceedingly bullish in the early stages of theeconomic sloxvdown. Initial anticipations called forplant and equipment outlays in 1970 to increase bysnore than 10 per cent over the previous year. Actual1970 business capital spending was only 8.6 per centgi-eater than in 1969. As the chart (p. 7) shows, busi-ness spending on equipment arid nonresidential struc-tures turned down after the thirdl quarter of 1970.Nevertheless, the early plant and equipnnent surveysfor 1970 mirrored the upward thrust of fixed invest-ment intentions at the outset of the 1969-70 slowdown,Coupled with declining profits, which reduced theability of corporations to finance capital spendingthrough retained earnings, the net pressure on inter-est rates of the corporate sector’s intended savingand fixed investment \vas undoubtedly upward inearly 1970.11 Capital spending plans were revised
~‘A $9.7 billion decline in inventory accumulation from thethird quarter (Sf 1969 to the first quarter of 1970 helpedofiset this pressure. In the second quarter, inventor)’ changereven’sed direction, and by the fourth quarter was increas-ing at a $3.6 billion annual rate,
Page 8
downsvard later in the year and corporate profits im-proved1, so that tIns pressure on interest rates waseased.’2 In the latest survey conducted by the De-partment of Commerce and SEC in Jamiuary andlFebruary, business planned to increase its 1971 spend-ing on plant and equipment by 4.3 per cent over the1970 level.
An important sector affecting capital marketsthrough flows of expendlitures relative to receipts isthe Fedleral Government. The Federal budget, on anational income accounts (NIA) basis, moved froma surplus at a $13.4 billion annual rate in the secondquarter of 1969 to a $14.2 billion rate of deficit in thesecond quarter of 1970. An increase in the Federalnet deficit usually occurs during business slowdoxvnsdue to reduced growth in tax revenues relative toexpenditures. Expiration of the surtax, retroactiveFederal pay increases, and increased social securitybenefits also contributed to the decrease in the netsurplus in early 1970.
The strong swing by the Federal Government froma net “saver to a net “tlissaver” position, primarilybetween the fourth quarter of 1969 and the secondquarter of 1970, coincides with the abnormally longlag in response of bond yields to a downturn inbusiness activity. A continuing large government defi-cit may not elevate interest rates, hut a rapid increasein the deficit, or decrease in the surplus, may exerttemporary upward pressure on interest rates. The de-clinic in long-tenn interest rates since mnidyear mnaytherefore represent a return to their typical cyclicalresponse as the Federal deficit passed its period ofmnost rapid increase.’-5
The Federal deficit (national income accountsbasis) increased somewhat in the fourth quarter of
121t is conceivable that some or even most of tile strength inearly capital expenditure plans for 1970 reflected inflationanticipations. Expected productivity of additional plant andequipment might even have declined throughout 1970. Lowarid falling levels of capacity utilization suggest that themarginal productivity of ne’v facilities may be decreasing;so also does the deceleration of growth in total real outputin the economy, which began in early 1968. It can beargued that the rate of growth in total output is an appmoxi-mnation to the expected return on physical inveshnent.
hi’The inimnediate impact of a sharp rise in the governmentdeficit need not be concentrated in the maturity ranges inwhich new government debt is being issued. The effectsmight register nnost heavily in another sector, if simultane-ously with heavy govermuent borrowing in one maturityregion, tile private sector is retiring debt in that range andincreasing its borrowing ins some other maturity region. Asdiscussed below, in 1970 corporations were retiring theirshort-term debt while increasing their long-term debt. Atthe same time the Federal government was borrowingheavily in the short-term end of the maturity range.
FEDERAL RESERVE BANK OF ST. LOUIS MARCH 1971
1970 to an estimated $15.3 bilhon annual rate. Fromthis point, the NIA deficit is likely to decrease gradu-ally as the economic recovery picks up momentum.The Administration projects a $15 billion NIA deficitin fiscal 1971, which would imply deficits averagingmore than a $13 billion annual rate in the first twoquarters in 1971. In fiscal 1972, which begins July 1,1971, the NIA deficit is projected to decline to a $4.2billion annual rate. Taking the national income ac-counts budget as an indicator, and assuming the ac-curacy of the Administration’s projections, the Federalsectors’ upward pressure on interest rates svould seemto be easing.”
Disturbances in the Capital Markets
Sudden changes in asset and liability positions invarious sectors, especially xvhen they are related toalterations in the maturity structure of outstandingcredit obligations, sometimes provide clues about thenet direction of pressures on interest rates. It is notalways easy to distinguish between autonomous andaccommodating financial transactions, but when thechanges are of extremely large magnitude, as somewere in 1970, there may be less difficulty in discern-ing the sources of disturbances in credit markets,
Two features of 1970 capital markets are deservingof special mention. The first is the exceptionally sharpincrease in long-term borrowing by nonfinancial cor-porations. Much of this reflected refinancing of short-run debt (bank loans primarily) carried over from1969 and earlier, and did not represent a markedchange in the rate of growth in total corporate debt.Lengthening of the maturity of corporate debt in1970 may have eased the pressure of net governmentborrowing in short-term credit markets, while addingto weakness in long-term credit markets early in theyear.
The dollar volnme of new corporate securities is-sued (gross proceeds) continued at an unslackenedrate throughout 1970, totaling more than $38 billion,only $8.6 billion of which were new stock issues, Newissues in the first txvo months of 1971 were in excessof the corresponding months of 1970, and there areas yet no definite signs of a letup in long-term financ-ing demands. The calendar of new corporate issuesfor March is extremely heavy. Since corporations havebeen reducing their short-term borrowing, particularlyfrom banks, while adding to their short-tenn assets,
~For an evaluation of the Administration’s fiscal 1972 budgetand 1971 economic plan, see “The 1971 National EconomicPlan” in this Review, pp. 11-19.
especially CD’s, it is evident that many corporationsare striving to strengthen their liquidity positions.
The second notable feature was the extremely largerise in commercial banks’ net lending, particularly inthe third quarter. A major portion of this, of course,arose out of the retirement of commercial paper bybanks’ parent holding companies and its replacementby CD’s. Bank credit expansion was $25.8 billiongreater (annual rate) in the Summer quarter than inthe Spring, after allowing for this. Almost $15.2 billionof this increase in bank credit was accounted for byloans to security dealers and brokers to finance ac-quisition of U. S. Government and other securities.An increase in the rate of acquisition by banks ofU. S. Government securities accounted for another$8.2 bilhon (annual rate) of the bank credit increase.Commercial bank lending to business slowed in thethird quarter and declined in the fourth. In the fourthquarter, banks became heavy net purchasers of muni-cipal and Federal agency securities.
Long-term bond yields, which had generally de-clined in January, February, and March 1970, con-forming to their cyclical pattern, rose again in April,May, and June. It appears that the sharp declines inthe Spring, and the subsequent Summer rallies inbond and stock mnarkets, gained strength from a mas-sive shift in investment policy amnong securities deal-ers and brokers, from net liquidation of their positionsin the second quarter to aggressive rebuilding in thethird quarter. The reasons for this behavior may betraceable to special circumstances — the Cambodianincursion, the campus riots, and a series of failures,forced mergers and recapitalizations among broker-age firms, These events took their toll on the stockand bond markets in the Spring. Then the failure ofPenn Central sent tremors through the bond andconnmercial paper markets in June. After the severebuffeting subsided, securities dealers regained confi-dence, The much discussed liquidity crisis of theSpring and early Summer of 1970 centered verylargely in the fortunes of brokerage firms. It mayaccount for a large part of the unusual cyclical re-sponse of bond yields. The effect on interest ratesand stock prices, while possibly significant at thattime, was short-lived.
Summary and ConclusionsInterest rates, particularly bond yields, remained
near peak levels for an abnormally lengthy periodin 1970 after the downturn in bnmsiness activity. Sev-eral factors could have contributed to this long lag inresponse. These include (1) the persistence of inrfla-
Page 9
FEDERAL RESERVE BANK OF ST. LOUIS MARCH 1971
tionarv anticipations; (2) the sharp rise in the Federaldeficit during fiscal 1970; (3) heavy long—term borrow-ing by corporations, coupled with exuberant capitalexpenditure programs early in the year; (4) the verygradual decline in real output growth, compared svith
previonns postwar recessions; (5) the financial prob-lems of securities dlealers, which were reflected in netliquidations of their securities inventory positions inthd’ Spring; and (6) special circumstances, such asthe Cambodian incursion amidl campus rioting. ThePenn Central crisis temporarily lifted interest rates inJune.
After the mid—year turnaround in bond yields, allinterest rates except yields on lower grade bonds wentinto a decline, which accelerated in the fourth quar-ter. In part, the fall in rates represented a return totheir typical behavior during cyclical downswings ineconomic activity. The drop in long-term and short-term rates continued, however, in the first txvo monthsof 1971, following the low point of the business slow-down that was reached in the fourth quarter of 1969.In February, three-month Treasury bills yielded less
than 4 per cent for the first time since 1967, and Aaacorporate bonds yielded less than 7 per cent for thefirst time since 1968.
Inasmuch as the high interest rates of tile last fewyears may well have been largely a reflection of infla-tion anticipations, it is possible that we are now wit-nessing a dramatic dlc’-csealation of these anticipations.A broader interpretation accepts such dc-escalation as
part of the story. It would, however, emphasize otherforces exerting dlownwardi pressure on interest rates
and upward pressure on common stock prices in re-cent months. These include (1) an improved financialoutlook among securities firnns; (2) the automobile
so-ike in the fourth qnmarter; and (3) reduced business
optimism regarding rates of return on physical invest-
ment (reflected in conservative 1971 plant and equip-
ment spending plamis andl sluggish short—term business
borrowing). An expansive nnonetary policy, especially
as displayed in the broader monetary aggregates, also
may have played a major role in the recent bond and
stock market rallies.
Page 10