Embed Size (px)
Citation preview

Capital One Securities 12th Annual Energy ConferenceDecember 6, 2017
Forward-Looking & Other Cautionary Statements
The following presentation includes forward-looking statements. These statements relate to future events, such as anticipated revenues, earnings, business strategies, competit ive posit ion or other aspects of our operations or operating results or the industries or markets in which we operate or participate in general, including our abil ity to consummate f inancial or strategic alternatives, projections regarding our rig count, capital expenditures and lease operating expenses, our abil ity to dri l l high value Merge wells, our abil ity to enhance current spacing assumptions in Merge and Woodford, our abil ity to execute on our development plan in the Merge, including our dri l l ing and leasing programs, projections regarding total production, average daily production, lease operating expenses, production taxes as a percentage of revenue, ad valorem taxes, cash G&A expenses and projected internal rates of return, and the results of our hedging program. Actual outcomes and results may differ materially from what is expressed or forecast in such forward-looking statements. These statements are not guarantees of future performance and involve certain risks, uncertainties and assumptions that may prove to be incorrect and are diff icult to predict such as oil and gas prices; operational hazards and dril l ing risks; potential fai lure to achieve, and potential delays in achieving, expected reserves or production levels from existing and future oil and gas development projects; our abil ity to identify and consummate acquisit ions and other growth opportunities, including acreage trades; unsuccessful exploratory activit ies; unsuccessful acquisit ions; unexpected cost increases or technical diff icult ies in constructing, maintaining or modifying company facil it ies; potential l iabil ity for remedial actions under existing or future environmental regulations or from pending or future l it igation; l imited access to capital or signif icantly higher cost of capital related to i l l iquidity or uncertainty in the domestic or international f inancial markets; an inabil ity to improve well spacing; general domestic and international economic and polit ical conditions, as well as changes in tax, environmental and other laws applicable to our business and other economic, business, competit ive and/or regulatory factors affecting our business generally as set forth in our f i l ings with the Securit ies and Exchange Commission (SEC). We caution you not to place undue reliance on our forward-looking statements, which are only as of the date of this presentation or as otherwise indicated, and we expressly disclaim any responsibil ity for updating such information.
2

Jones Energy Overview
3
Asset SummaryMerge• ~21,000 net acres• Production of ~5.6 Mboe/d [2]
Western Anadarko Basin• ~158,000 net acres• Production of ~15.8 Mboe/d [2]
Operations SummaryMerge• 24 wells spud, 13 wells online • 2-rig program • Delineation & HBP strategy
Western Anadarko Basin• Limited 4Q 2017 activity• Evaluating 2018 plans
JONENYSE Ticker
$1.02Class A Common
Share Price [1]
$149 Equity Market Cap
($mm) [1]
$853 Enterprise Value
($mm) [1]
99.7Common Stock
Outstanding (mm) [1]
[1] Market data as of December 4, 2017.[2] Net company production as of 12/4/2017.
Company H.Q.AUSTIN, TX
Western Anadarko BasinCLEVELAND
Eastern Anadarko BasinMERGE
Recent JONE Highlights
4
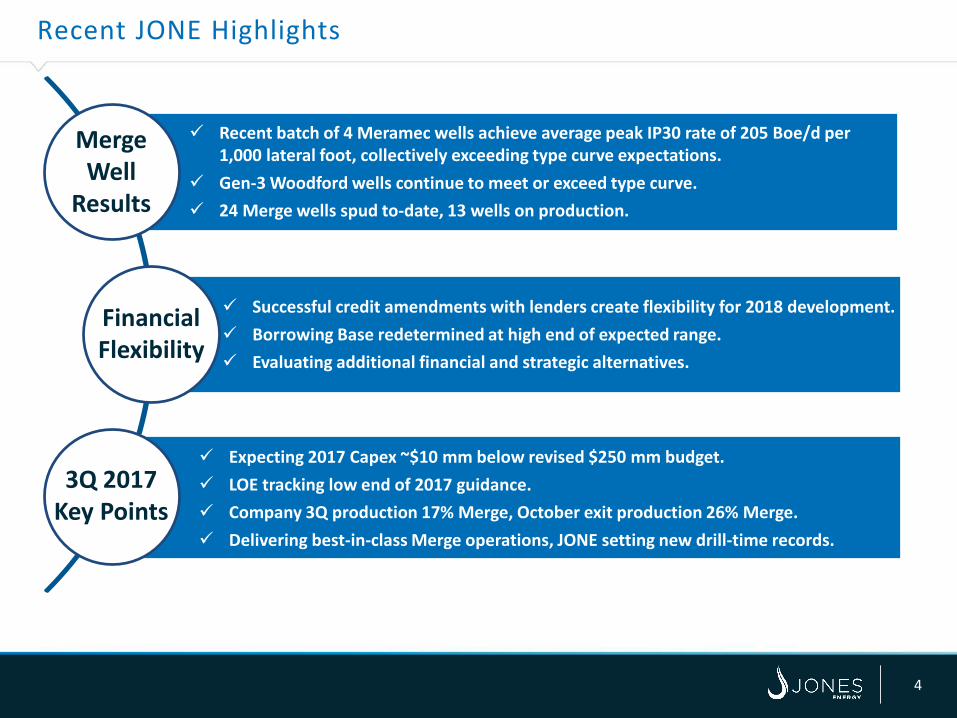
3Q 2017Key Points
FinancialFlexibility
Merge Well
Results
Recent batch of 4 Meramec wells achieve average peak IP30 rate of 205 Boe/d per 1,000 lateral foot, collectively exceeding type curve expectations.
Gen-3 Woodford wells continue to meet or exceed type curve. 24 Merge wells spud to-date, 13 wells on production.
Successful credit amendments with lenders create flexibility for 2018 development. Borrowing Base redetermined at high end of expected range. Evaluating additional financial and strategic alternatives.
Expecting 2017 Capex ~$10 mm below revised $250 mm budget. LOE tracking low end of 2017 guidance. Company 3Q production 17% Merge, October exit production 26% Merge. Delivering best-in-class Merge operations, JONE setting new drill-time records.
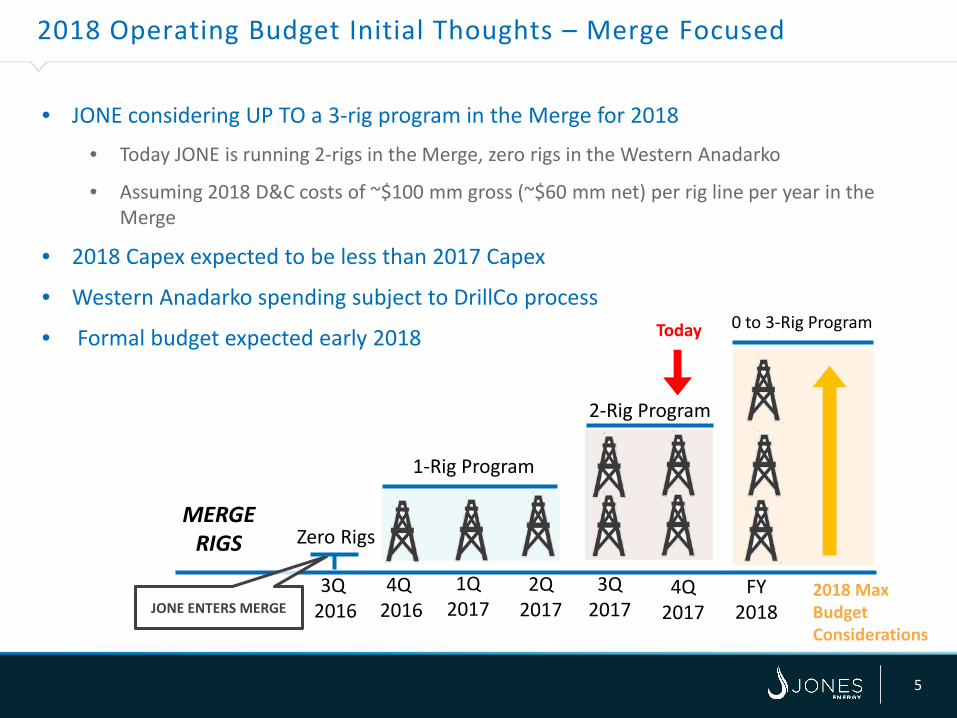
• JONE considering UP TO a 3-rig program in the Merge for 2018
• Today JONE is running 2-rigs in the Merge, zero rigs in the Western Anadarko
• Assuming 2018 D&C costs of ~$100 mm gross (~$60 mm net) per rig line per year in the Merge
• 2018 Capex expected to be less than 2017 Capex
• Western Anadarko spending subject to DrillCo process
• Formal budget expected early 2018
2018 Operating Budget Initial Thoughts – Merge Focused
5
MERGERIGS
Today
3Q 2016
1-Rig Program
2-Rig Program
0 to 3-Rig Program
4Q 2016
1Q2017
2Q2017
3Q2017
4Q2017
FY2018
2018 Max Budget Considerations
JONE ENTERS MERGE
Zero Rigs
JONE Overview of Eastern Anadarko Basin (STACK/Merge/SCOOP)
Silu
rian
Dev
onia
nM
issi
ssip
pian
Blackjack Creek
Hunton
Chester/Caney
Springer Sands
AtokaMorrow
Cherokee
Oswego
Big Lime
Penn
sylv
ania
n
Lower
Bois D’ Arc
Chimney Hill
Lower
Caney
Skinner
Prue
Anadarko Basin “Merge”Stratigraphic Column
Meramec
Osage/Sycamore
Woodford
Upper
Upper
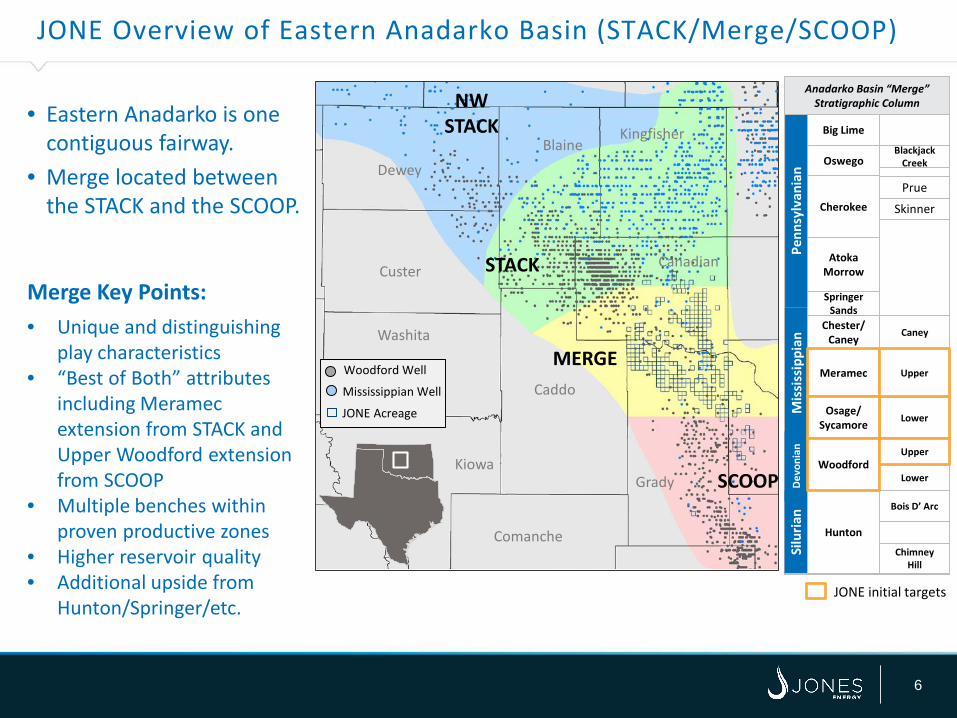
• Eastern Anadarko is one contiguous fairway.
• Merge located between the STACK and the SCOOP.
Merge Key Points:• Unique and distinguishing
play characteristics• “Best of Both” attributes
including Meramec extension from STACK and Upper Woodford extension from SCOOP
• Multiple benches within proven productive zones
• Higher reservoir quality• Additional upside from
Hunton/Springer/etc.JONE initial targets
STACK
NW STACK
MERGE
SCOOP
Mississippian Well
JONE Acreage
Woodford Well
DeweyBlaine
Caddo
Kiowa
Washita
Custer
Kingfisher
Grady
Comanche
Canadian
6
CLR Establishes SCOOP
2012-13
2011 2011-12
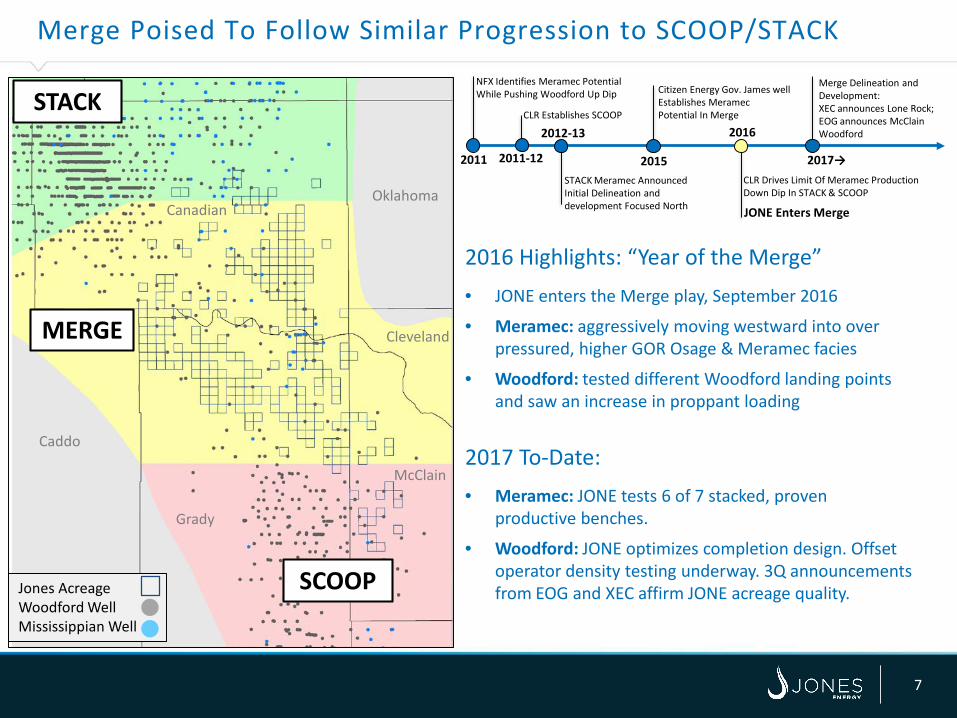
Merge Poised To Follow Similar Progression to SCOOP/STACK
7
NFX Identifies Meramec Potential While Pushing Woodford Up Dip
2015
Citizen Energy Gov. James well Establishes Meramec Potential In Merge
STACK Meramec AnnouncedInitial Delineation and development Focused North JONE Enters Merge
2016
Merge Delineation and Development:XEC announces Lone Rock; EOG announces McClainWoodford
CLR Drives Limit Of Meramec Production Down Dip In STACK & SCOOP
2017→
2016 Highlights: “Year of the Merge”• JONE enters the Merge play, September 2016
• Meramec: aggressively moving westward into over pressured, higher GOR Osage & Meramec facies
• Woodford: tested different Woodford landing points and saw an increase in proppant loading
2017 To-Date: • Meramec: JONE tests 6 of 7 stacked, proven
productive benches.
• Woodford: JONE optimizes completion design. Offset operator density testing underway. 3Q announcements from EOG and XEC affirm JONE acreage quality. Jones Acreage
Woodford Well Mississippian Well
STACK
MERGE
SCOOP
Grady
Caddo
CanadianOklahoma
Cleveland
McClain
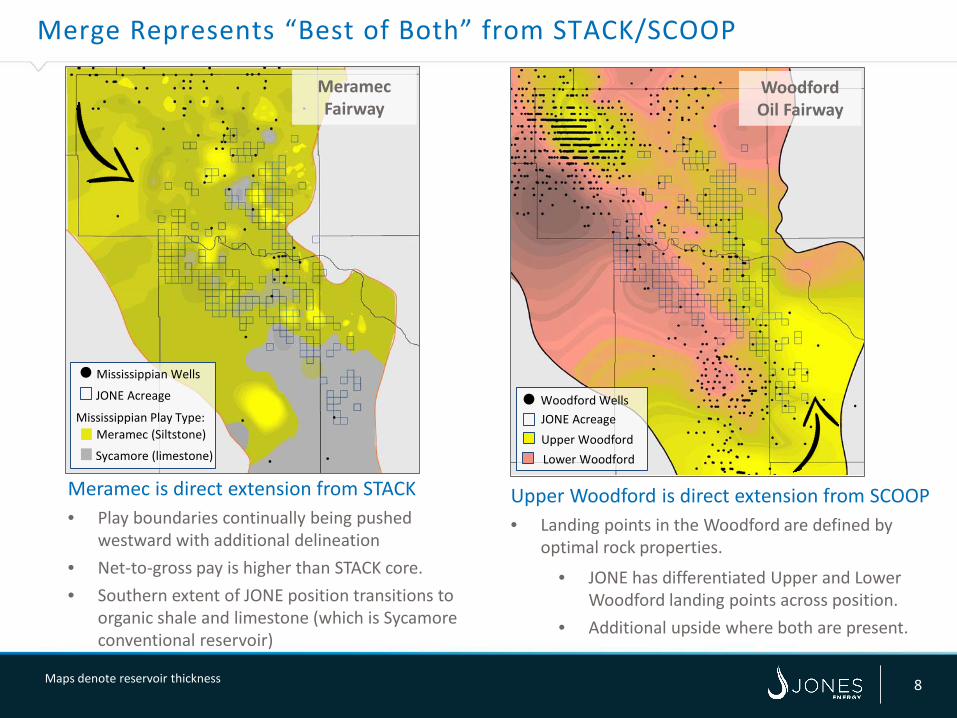
Merge Represents “Best of Both” from STACK/SCOOP
8
Meramec is direct extension from STACK• Play boundaries continually being pushed
westward with additional delineation • Net-to-gross pay is higher than STACK core. • Southern extent of JONE position transitions to
organic shale and limestone (which is Sycamore conventional reservoir)
Mississippian Play Type:
JONE Acreage
Meramec (Siltstone)
Sycamore (limestone)
Mississippian Wells
Meramec Fairway
Woodford Oil Fairway
JONE AcreageWoodford Wells
Upper Woodford
Maps denote reservoir thickness
Upper Woodford is direct extension from SCOOP• Landing points in the Woodford are defined by
optimal rock properties.
• JONE has differentiated Upper and Lower Woodford landing points across position.
• Additional upside where both are present.
Lower Woodford
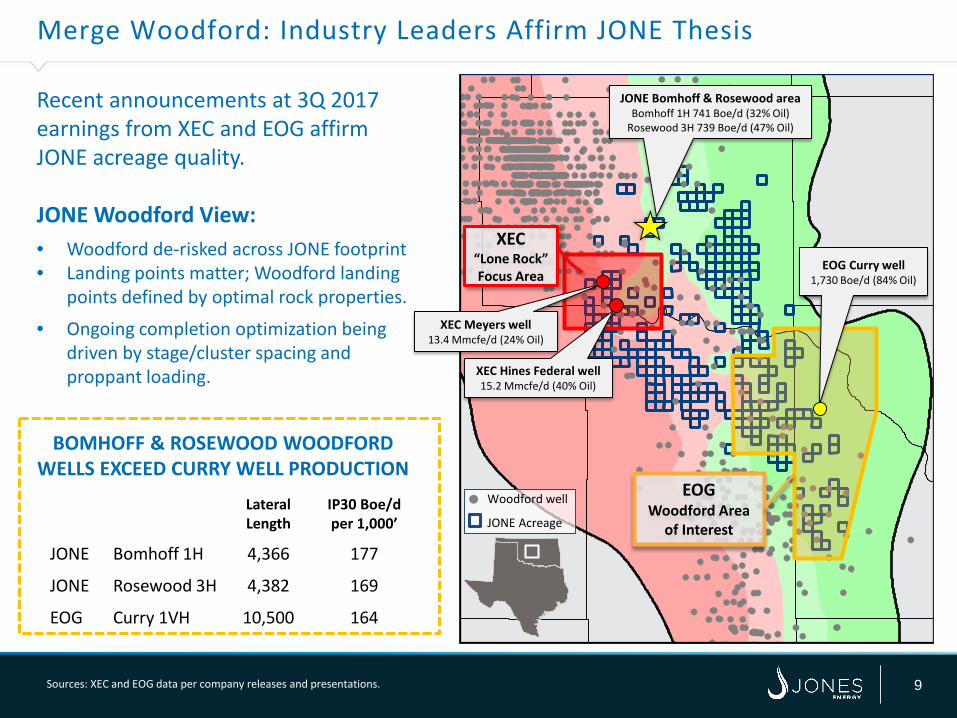
Merge Woodford: Industry Leaders Affirm JONE Thesis
9
Recent announcements at 3Q 2017 earnings from XEC and EOG affirm JONE acreage quality.
JONE Woodford View:• Woodford de-risked across JONE footprint• Landing points matter; Woodford landing
points defined by optimal rock properties.
• Ongoing completion optimization being driven by stage/cluster spacing and proppant loading.
BOMHOFF & ROSEWOOD WOODFORD WELLS EXCEED CURRY WELL PRODUCTION
EOG Woodford Area
of Interest
XEC Meyers well 13.4 Mmcfe/d (24% Oil)
XEC Hines Federal well15.2 Mmcfe/d (40% Oil)
EOG Curry well1,730 Boe/d (84% Oil)
XEC“Lone Rock”Focus Area
Woodford well
JONE AcreageLateral Length
IP30 Boe/d per 1,000’
JONE Bomhoff 1H 4,366 177
JONE Rosewood 3H 4,382 169
EOG Curry 1VH 10,500 164
JONE Bomhoff & Rosewood areaBomhoff 1H 741 Boe/d (32% Oil)
Rosewood 3H 739 Boe/d (47% Oil)
Sources: XEC and EOG data per company releases and presentations.
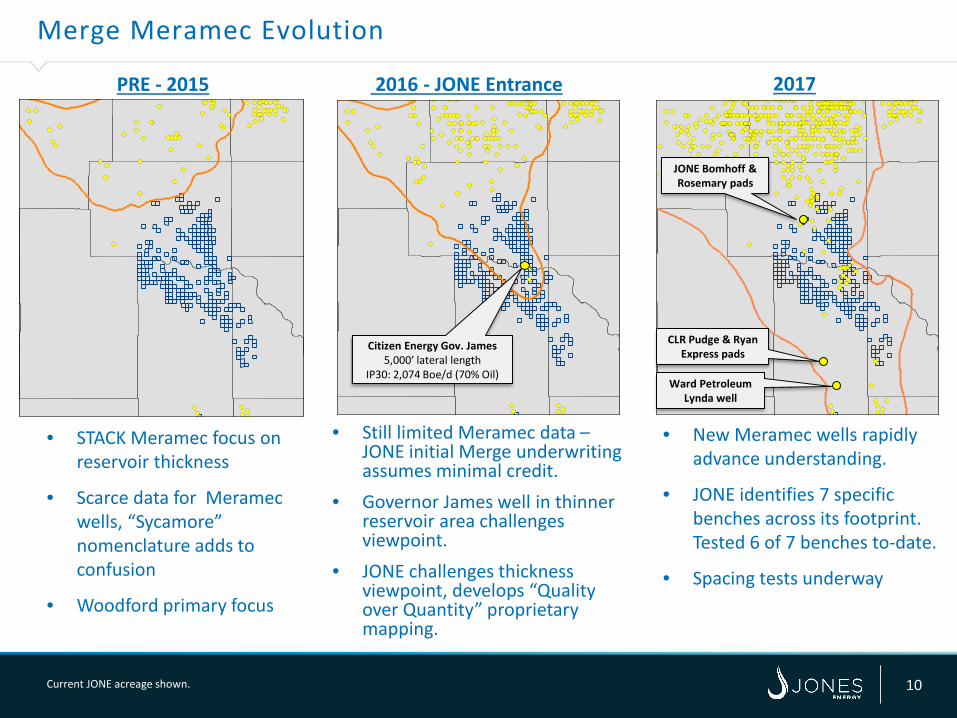
Merge Meramec Evolution
10
• STACK Meramec focus on reservoir thickness
• Scarce data for Meramec wells, “Sycamore” nomenclature adds to confusion
• Woodford primary focus
• Still limited Meramec data –JONE initial Merge underwriting assumes minimal credit.
• Governor James well in thinner reservoir area challenges viewpoint.
• JONE challenges thickness viewpoint, develops “Quality over Quantity” proprietary mapping.
• New Meramec wells rapidly advance understanding.
• JONE identifies 7 specific benches across its footprint. Tested 6 of 7 benches to-date.
• Spacing tests underway
PRE - 2015 2016 - JONE Entrance 2017
Current JONE acreage shown.
Citizen Energy Gov. James 5,000’ lateral length
IP30: 2,074 Boe/d (70% Oil)
JONE Bomhoff & Rosemary pads
CLR Pudge & Ryan Express pads
Ward Petroleum Lynda well
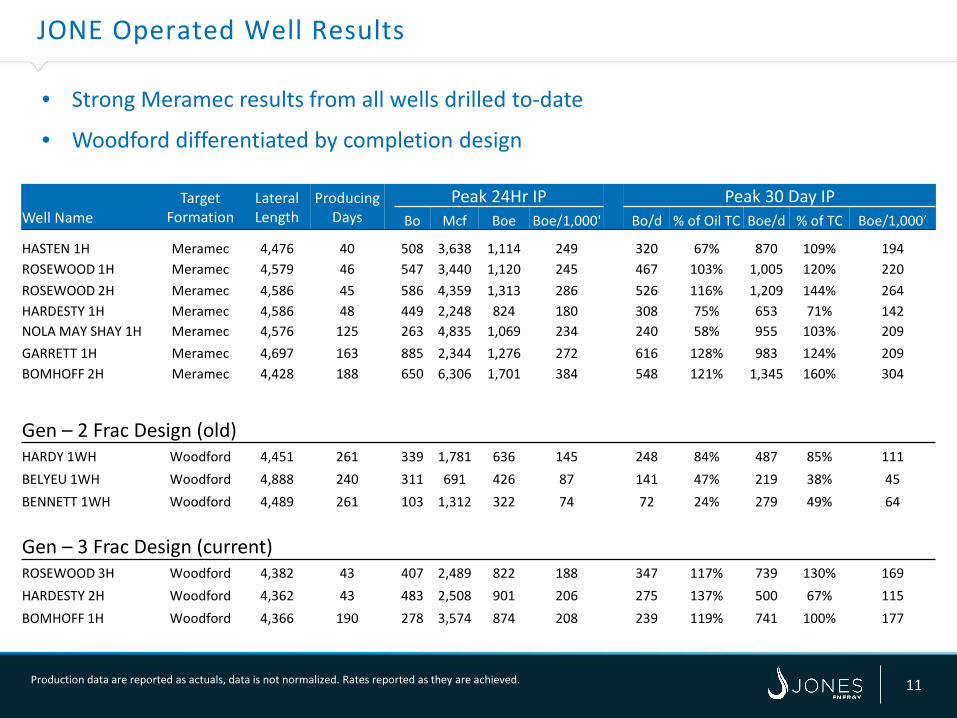
JONE Operated Well Results
11
Target Formation
Lateral Length
Producing Days
Peak 24Hr IP Peak 30 Day IPWell Name Bo Mcf Boe Boe/1,000' Bo/d % of Oil TC Boe/d % of TC Boe/1,000’
HASTEN 1H Meramec 4,476 40 508 3,638 1,114 249 320 67% 870 109% 194ROSEWOOD 1H Meramec 4,579 46 547 3,440 1,120 245 467 103% 1,005 120% 220ROSEWOOD 2H Meramec 4,586 45 586 4,359 1,313 286 526 116% 1,209 144% 264HARDESTY 1H Meramec 4,586 48 449 2,248 824 180 308 75% 653 71% 142NOLA MAY SHAY 1H Meramec 4,576 125 263 4,835 1,069 234 240 58% 955 103% 209GARRETT 1H Meramec 4,697 163 885 2,344 1,276 272 616 128% 983 124% 209BOMHOFF 2H Meramec 4,428 188 650 6,306 1,701 384 548 121% 1,345 160% 304
Gen – 2 Frac Design (old)HARDY 1WH Woodford 4,451 261 339 1,781 636 145 248 84% 487 85% 111BELYEU 1WH Woodford 4,888 240 311 691 426 87 141 47% 219 38% 45BENNETT 1WH Woodford 4,489 261 103 1,312 322 74 72 24% 279 49% 64
Gen – 3 Frac Design (current)ROSEWOOD 3H Woodford 4,382 43 407 2,489 822 188 347 117% 739 130% 169HARDESTY 2H Woodford 4,362 43 483 2,508 901 206 275 137% 500 67% 115BOMHOFF 1H Woodford 4,366 190 278 3,574 874 208 239 119% 741 100% 177
• Strong Meramec results from all wells drilled to-date
• Woodford differentiated by completion design
Production data are reported as actuals, data is not normalized. Rates reported as they are achieved.
CANADIAN
OKLAHOMA
GRADY
CADDO
MC CLAIN
Meramec WellWoodford Well
CLEVELAND
1
6
2
5
4
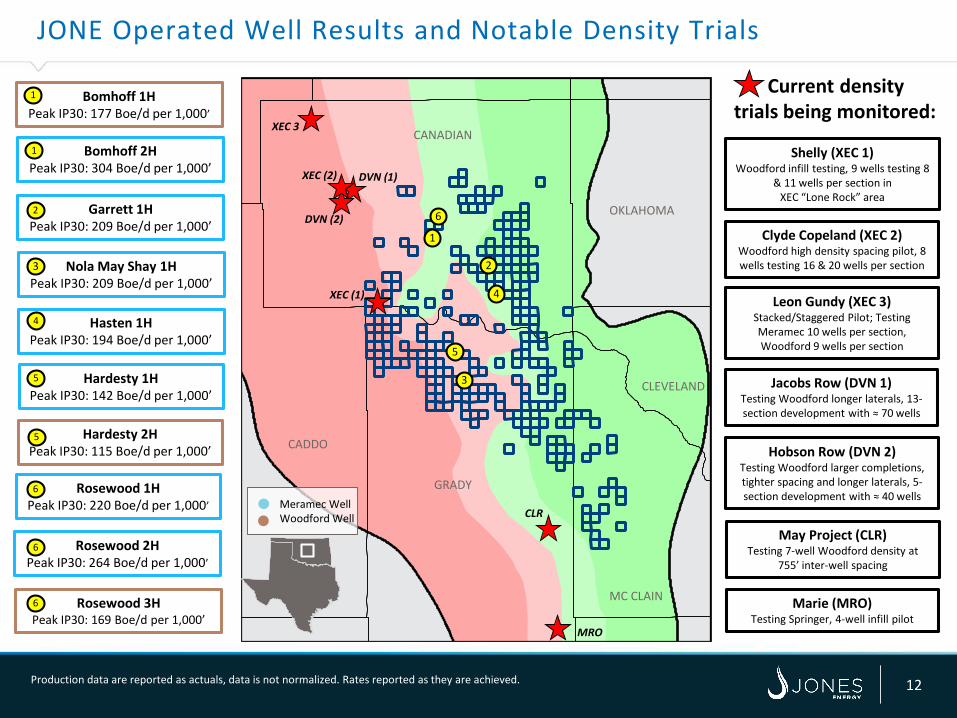
JONE Operated Well Results and Notable Density Trials
12Production data are reported as actuals, data is not normalized. Rates reported as they are achieved.
Current density trials being monitored:
CLR
DVN (1)
XEC 3
MRO
Bomhoff 2HPeak IP30: 304 Boe/d per 1,000’
Garrett 1HPeak IP30: 209 Boe/d per 1,000’
Rosewood 1HPeak IP30: 220 Boe/d per 1,000’
Rosewood 2HPeak IP30: 264 Boe/d per 1,000’
Rosewood 3HPeak IP30: 169 Boe/d per 1,000’
1
2
6
6
6
Bomhoff 1HPeak IP30: 177 Boe/d per 1,000’
Hardesty 2HPeak IP30: 115 Boe/d per 1,000’
1
5
Hasten 1HPeak IP30: 194 Boe/d per 1,000’ 4
Hardesty 1HPeak IP30: 142 Boe/d per 1,000’ 5
Nola May Shay 1HPeak IP30: 209 Boe/d per 1,000’ 3
3
DVN (2)
Leon Gundy (XEC 3)Stacked/Staggered Pilot; Testing Meramec 10 wells per section, Woodford 9 wells per section
Marie (MRO)Testing Springer, 4-well infill pilot
May Project (CLR)Testing 7-well Woodford density at
755’ inter-well spacing
Shelly (XEC 1)Woodford infill testing, 9 wells testing 8
& 11 wells per section in XEC “Lone Rock” area
Jacobs Row (DVN 1)Testing Woodford longer laterals, 13-section development with ≈ 70 wells
Hobson Row (DVN 2)Testing Woodford larger completions, tighter spacing and longer laterals, 5-section development with ≈ 40 wells
Clyde Copeland (XEC 2)Woodford high density spacing pilot, 8 wells testing 16 & 20 wells per section
XEC (2)
XEC (1)
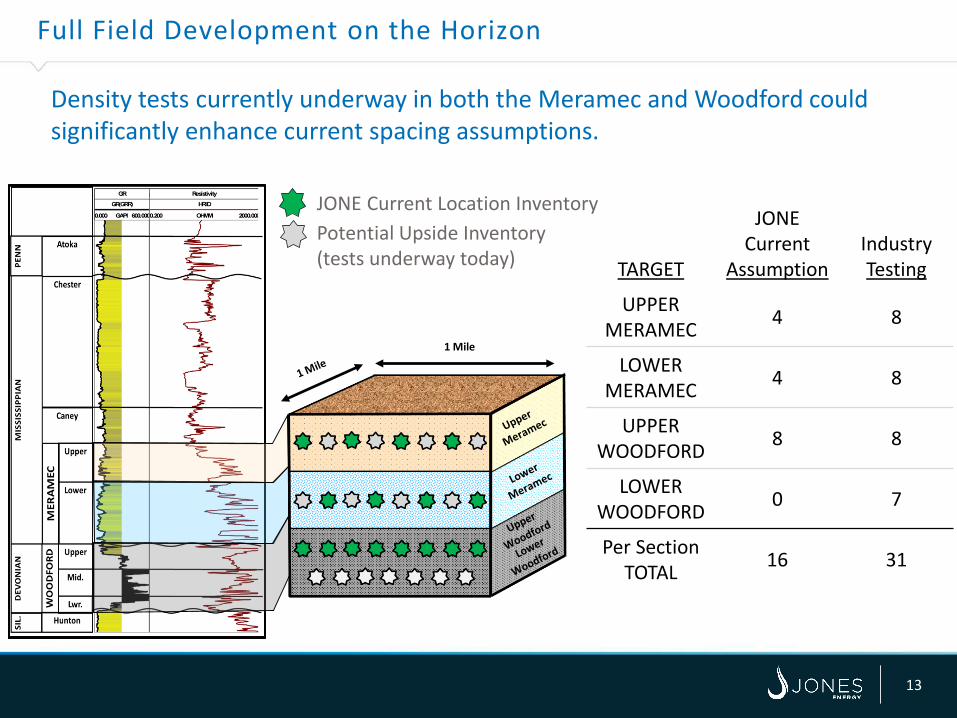
Full Field Development on the Horizon
13
JONE Current Location InventoryPotential Upside Inventory (tests underway today)
1 Mile
TARGET
JONE Current
AssumptionIndustryTesting
UPPER MERAMEC 4 8
LOWER MERAMEC 4 8
UPPER WOODFORD 8 8
LOWER WOODFORD 0 7
Per Section TOTAL 16 31
Density tests currently underway in both the Meramec and Woodford could significantly enhance current spacing assumptions.
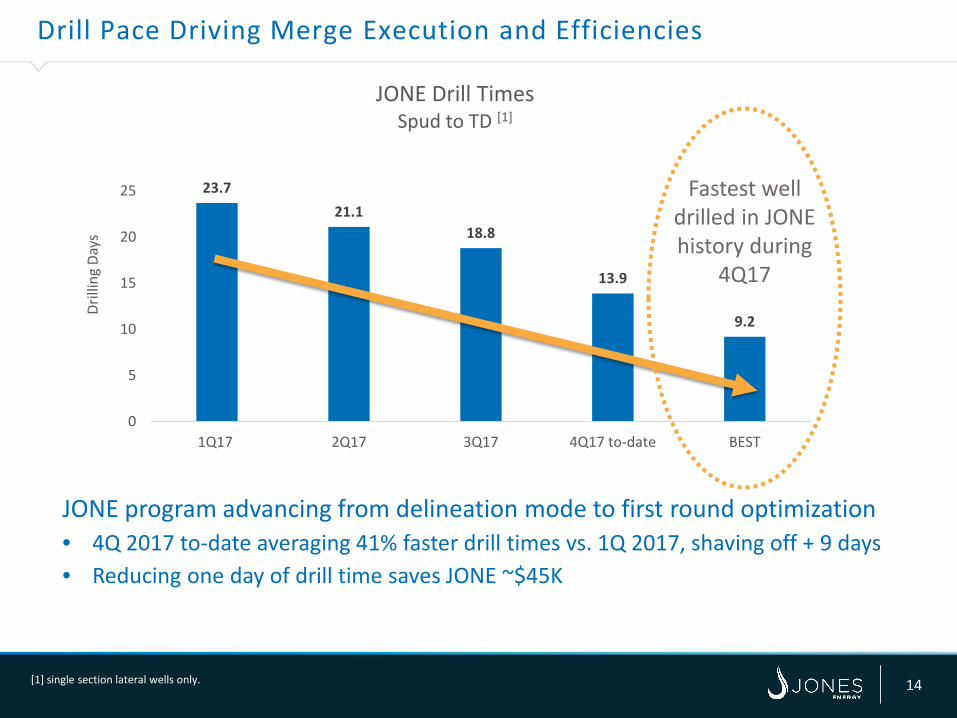
Drill Pace Driving Merge Execution and Efficiencies
14
JONE program advancing from delineation mode to first round optimization • 4Q 2017 to-date averaging 41% faster drill times vs. 1Q 2017, shaving off + 9 days • Reducing one day of drill time saves JONE ~$45K
23.721.1
18.8
13.9
9.2
0
5
10
15
20
25
1Q17 2Q17 3Q17 4Q17 to-date BEST
Drill
ing
Days
JONE Drill TimesSpud to TD [1]
Fastest well drilled in JONE history during
4Q17
[1] single section lateral wells only.
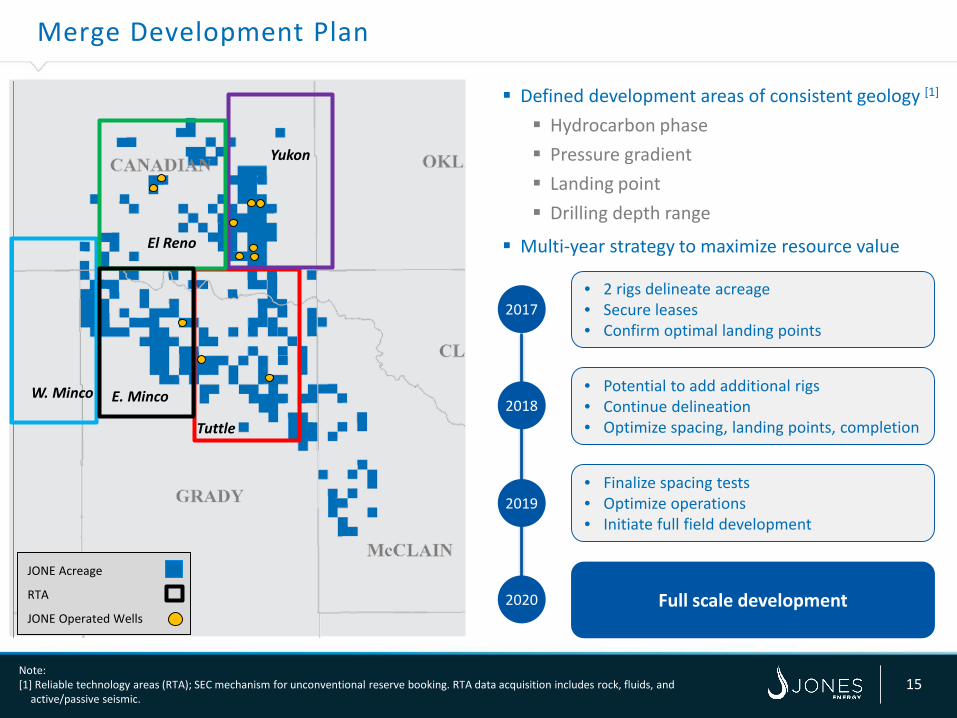
Merge Development Plan
15Note:[1] Reliable technology areas (RTA); SEC mechanism for unconventional reserve booking. RTA data acquisition includes rock, fluids, and
active/passive seismic.
2017
2018
2019
2020
• 2 rigs delineate acreage• Secure leases• Confirm optimal landing points
• Potential to add additional rigs• Continue delineation• Optimize spacing, landing points, completion
• Finalize spacing tests• Optimize operations• Initiate full field development
Full scale development
Defined development areas of consistent geology [1]
Hydrocarbon phase Pressure gradient Landing point Drilling depth range
Multi-year strategy to maximize resource value
JONE Acreage
RTA
JONE Operated Wells
Yukon
Tuttle
W. Minco
El Reno
E. Minco
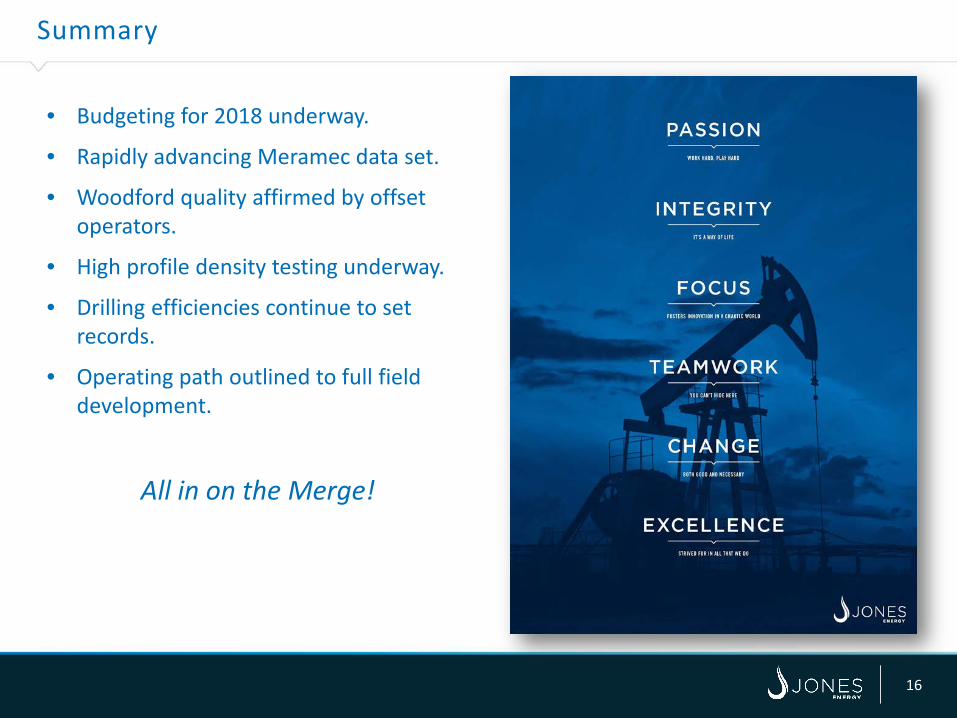
Summary
16
• Budgeting for 2018 underway.
• Rapidly advancing Meramec data set.
• Woodford quality affirmed by offset operators.
• High profile density testing underway.
• Drilling efficiencies continue to set records.
• Operating path outlined to full field development.
All in on the Merge!

APPENDIX
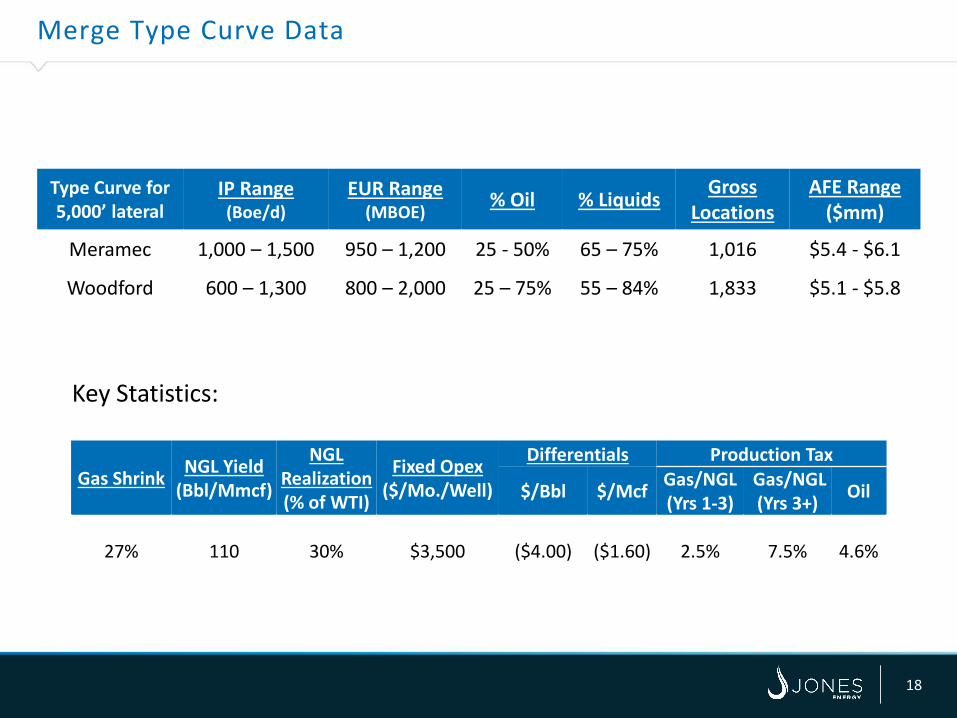
Merge Type Curve Data
18
Type Curve for 5,000’ lateral
IP Range(Boe/d)
EUR Range(MBOE)
% Oil % Liquids Gross Locations
AFE Range ($mm)
Meramec 1,000 – 1,500 950 – 1,200 25 - 50% 65 – 75% 1,016 $5.4 - $6.1
Woodford 600 – 1,300 800 – 2,000 25 – 75% 55 – 84% 1,833 $5.1 - $5.8
Key Statistics:
Gas Shrink NGL Yield (Bbl/Mmcf)
NGL Realization (% of WTI)
Fixed Opex($/Mo./Well)
Differentials Production Tax
$/Bbl $/Mcf Gas/NGL (Yrs 1-3)
Gas/NGL (Yrs 3+) Oil
27% 110 30% $3,500 ($4.00) ($1.60) 2.5% 7.5% 4.6%
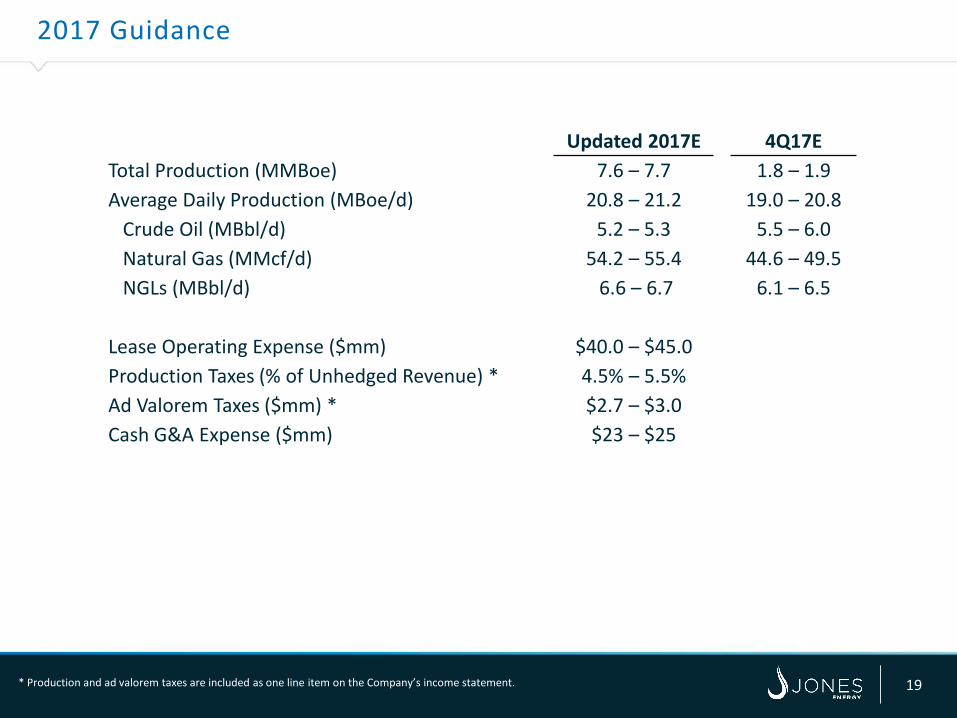
2017 Guidance
19
Updated 2017E 4Q17ETotal Production (MMBoe) 7.6 – 7.7 1.8 – 1.9Average Daily Production (MBoe/d) 20.8 – 21.2 19.0 – 20.8
Crude Oil (MBbl/d) 5.2 – 5.3 5.5 – 6.0Natural Gas (MMcf/d) 54.2 – 55.4 44.6 – 49.5NGLs (MBbl/d) 6.6 – 6.7 6.1 – 6.5
Lease Operating Expense ($mm) $40.0 – $45.0Production Taxes (% of Unhedged Revenue) * 4.5% – 5.5%Ad Valorem Taxes ($mm) * $2.7 – $3.0Cash G&A Expense ($mm) $23 – $25
* Production and ad valorem taxes are included as one line item on the Company’s income statement.
Hedge Position
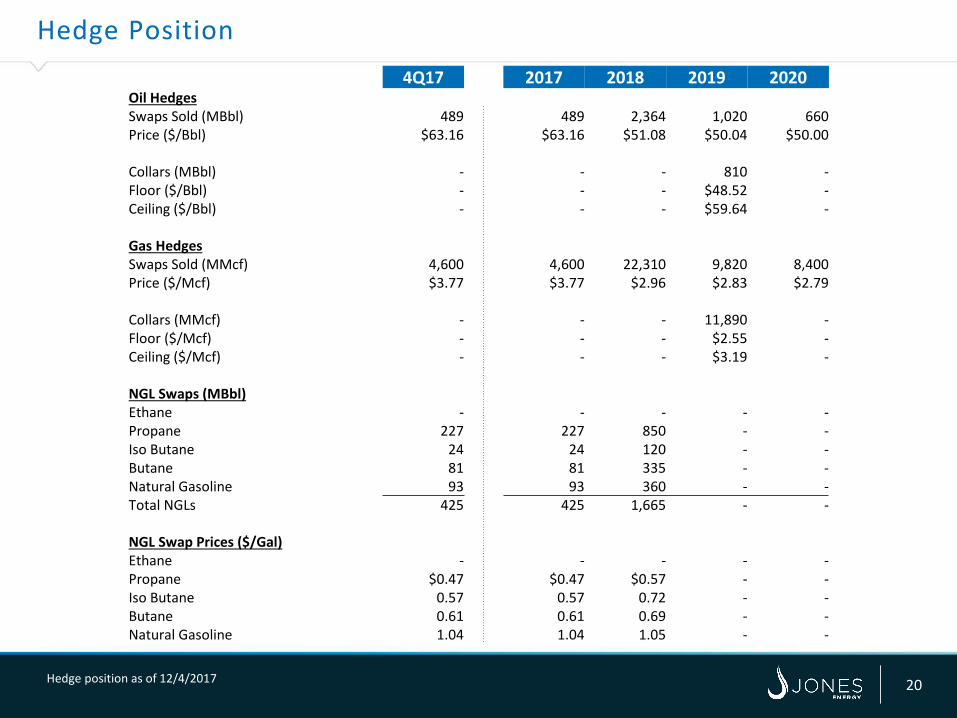
20Hedge position as of 12/4/2017
4Q17 2017 2018 2019 2020Oil HedgesSwaps Sold (MBbl) 489 489 2,364 1,020 660 Price ($/Bbl) $63.16 $63.16 $51.08 $50.04 $50.00
Collars (MBbl) - - - 810 -Floor ($/Bbl) - - - $48.52 -Ceiling ($/Bbl) - - - $59.64 -
Gas HedgesSwaps Sold (MMcf) 4,600 4,600 22,310 9,820 8,400 Price ($/Mcf) $3.77 $3.77 $2.96 $2.83 $2.79
Collars (MMcf) - - - 11,890 -Floor ($/Mcf) - - - $2.55 -Ceiling ($/Mcf) - - - $3.19 -
NGL Swaps (MBbl)Ethane - - - - -Propane 227 227 850 - -Iso Butane 24 24 120 - -Butane 81 81 335 - -Natural Gasoline 93 93 360 - -Total NGLs 425 425 1,665 - -
NGL Swap Prices ($/Gal)Ethane - - - - -Propane $0.47 $0.47 $0.57 - -Iso Butane 0.57 0.57 0.72 - -Butane 0.61 0.61 0.69 - -Natural Gasoline 1.04 1.04 1.05 - -
Experienced Management Team
21
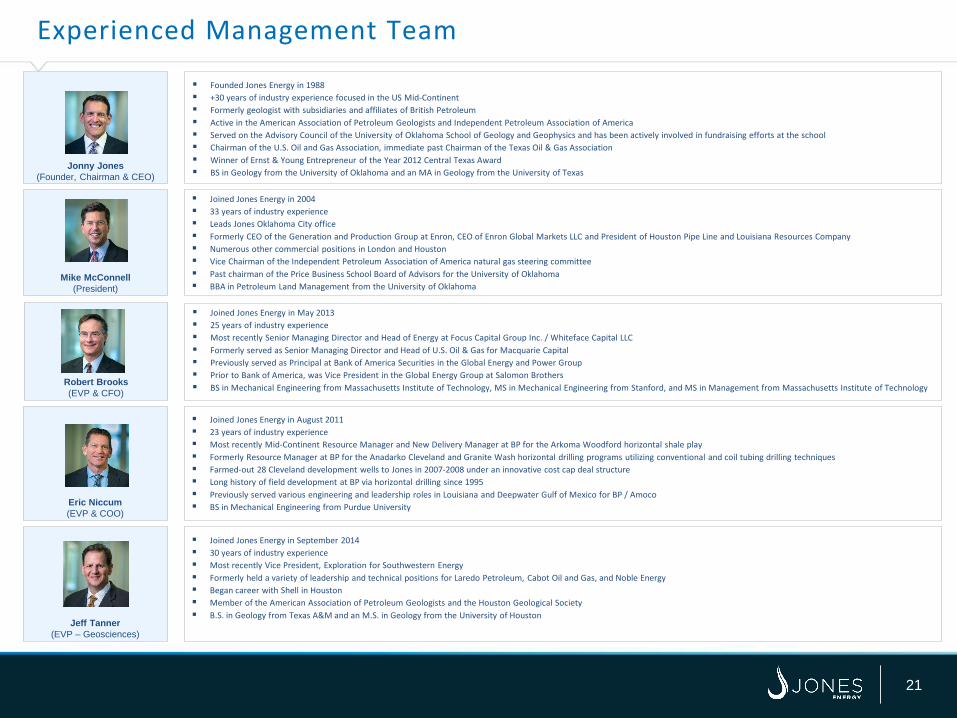
Eric Niccum(EVP & COO)
Joined Jones Energy in August 2011 23 years of industry experience Most recently Mid-Continent Resource Manager and New Delivery Manager at BP for the Arkoma Woodford horizontal shale play Formerly Resource Manager at BP for the Anadarko Cleveland and Granite Wash horizontal drilling programs utilizing conventional and coil tubing drilling techniques Farmed-out 28 Cleveland development wells to Jones in 2007-2008 under an innovative cost cap deal structure Long history of field development at BP via horizontal drilling since 1995 Previously served various engineering and leadership roles in Louisiana and Deepwater Gulf of Mexico for BP / Amoco BS in Mechanical Engineering from Purdue University
Jonny Jones(Founder, Chairman & CEO)
Founded Jones Energy in 1988 +30 years of industry experience focused in the US Mid-Continent Formerly geologist with subsidiaries and affiliates of British Petroleum Active in the American Association of Petroleum Geologists and Independent Petroleum Association of America Served on the Advisory Council of the University of Oklahoma School of Geology and Geophysics and has been actively involved in fundraising efforts at the school Chairman of the U.S. Oil and Gas Association, immediate past Chairman of the Texas Oil & Gas Association Winner of Ernst & Young Entrepreneur of the Year 2012 Central Texas Award BS in Geology from the University of Oklahoma and an MA in Geology from the University of Texas
Mike McConnell(President)
Joined Jones Energy in 2004 33 years of industry experience Leads Jones Oklahoma City office Formerly CEO of the Generation and Production Group at Enron, CEO of Enron Global Markets LLC and President of Houston Pipe Line and Louisiana Resources Company Numerous other commercial positions in London and Houston Vice Chairman of the Independent Petroleum Association of America natural gas steering committee Past chairman of the Price Business School Board of Advisors for the University of Oklahoma BBA in Petroleum Land Management from the University of Oklahoma
Robert Brooks(EVP & CFO)
Joined Jones Energy in May 2013 25 years of industry experience Most recently Senior Managing Director and Head of Energy at Focus Capital Group Inc. / Whiteface Capital LLC Formerly served as Senior Managing Director and Head of U.S. Oil & Gas for Macquarie Capital Previously served as Principal at Bank of America Securities in the Global Energy and Power Group Prior to Bank of America, was Vice President in the Global Energy Group at Salomon Brothers BS in Mechanical Engineering from Massachusetts Institute of Technology, MS in Mechanical Engineering from Stanford, and MS in Management from Massachusetts Institute of Technology
Jeff Tanner(EVP – Geosciences)
Joined Jones Energy in September 2014 30 years of industry experience Most recently Vice President, Exploration for Southwestern Energy Formerly held a variety of leadership and technical positions for Laredo Petroleum, Cabot Oil and Gas, and Noble Energy Began career with Shell in Houston Member of the American Association of Petroleum Geologists and the Houston Geological Society B.S. in Geology from Texas A&M and an M.S. in Geology from the University of Houston
Corporate Structure
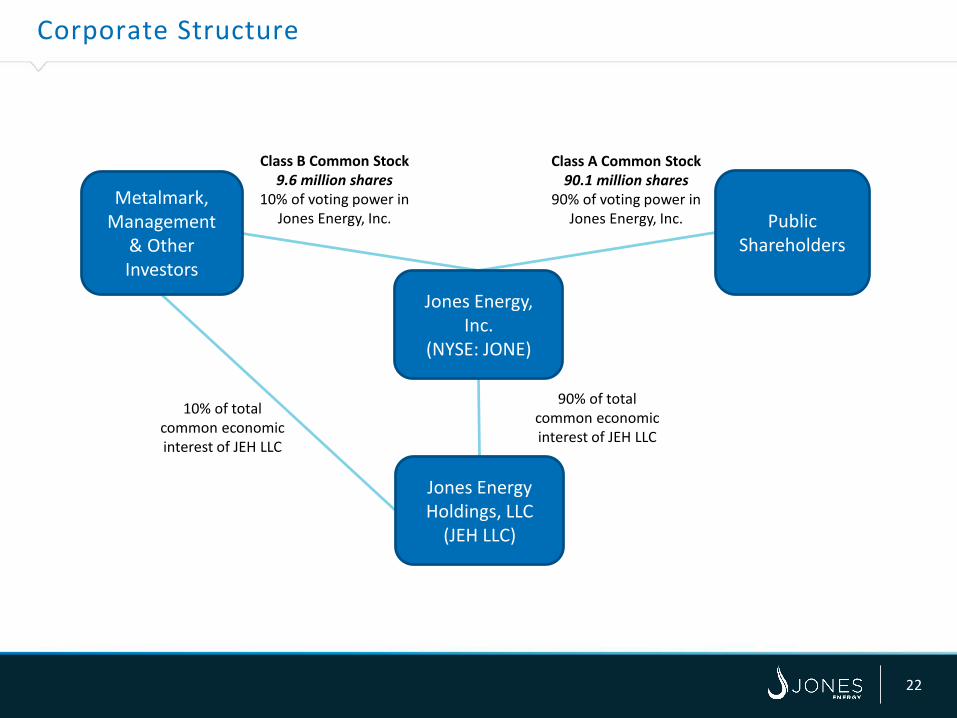
Jones Energy, Inc.
(NYSE: JONE)
Jones Energy Holdings, LLC
(JEH LLC)
Class A Common Stock90.1 million shares
90% of voting power in Jones Energy, Inc.
10% of total common economic interest of JEH LLC
90% of total common economic interest of JEH LLC
Metalmark,Management
& Other Investors
PublicShareholders
Class B Common Stock9.6 million shares
10% of voting power in Jones Energy, Inc.
22