Embed Size (px)
Citation preview

j o n e s e n e r g y + 2 0 1 3 a n n u a l r e p o r t
J O N E SJ O N E SO N EO N EJ O N E SO N E

2 0 1 3
Acquires Sabine’s Anadarko
assets for $193.5 million
1 9 2 3
A.V. Jones begins work for
Marland Oil Company
1 9 5 7
Jon Rex Jones joins his father
& brother in Albany
1 9 9 6
Jones Energy drills first horizontal
well in the Texas Panhandle
2 0 0 7
Sells Hansford Co. assets to
Laredo for $75 million
2 0 11
JV with Southridge to enter the
Arkoma Woodford Play
2 0 0 8
Sells Shattuck Field to Noble for
$292 million ($66 million net)
2 0 0 1
Sells Hoover Field to Newfield
for $25 million
1 9 8 8
Jonny Jones & Jones family
form Jones Energy
1 9 3 2
Jones & Stasney form partnership
and move to Albany, Texas
2 0 0 9
Acquires Crusader Energy Group
for $240.5 million
2 0 1 2
Acquires Chalker’s Cleveland
assets for $250 million
2 0 1 3
IPO’s on the New York Stock
Exchange (NYSE: JONE)

O N EF A M I L Y
JO
NE
S E
NE
RG
Y
n e a r l y a c e n t u r y o f f a m i l y l e g a c y i n o i l a n d g a s
Our CEO, Jonny Jones, founded our predecessor company in 1988
in continuation of his family’s long history in the oil and gas business,
which dates back to the 1920’s. This picture shows Jonny’s grandfather,
A.V. Jones, on the right, and his partner H.R. Stasney. A few years after
forming a partnership in 1932, Jones and Stasney moved to Albany,
Texas to work the shallow zones in West Central Texas.

20
13
AN
NU
AL
RE
PO
RT
T E A MO N E
p e o p l e a r e t h e m o s t i m p o r t a n t f a c t o r i n o u r s u c c e s s
Although we are part of an industry that focuses on assets as
the differentiator, we look at things differently. We strive to create
a team-oriented environment that maintains the touch and feel of
a family business, like the one we started 25 years ago.

Jones Energy is likely a very new
name to you. But in our family, oil
and gas has been running through
our veins for three generations.
The tradition that my grandfather
started in 1923, I chose to continue.
And in 1988, with an investment
of $3 million, I founded Jones as
a private E&P company. In 2013,
we took the logical next step and
entered the public market.
D E A R F E L L O W S H A R E H O L D E R S ,
3
A letter from Jonny Jones

a v e r a g e d a i l y p r o d u c t i o n
( m b o e / d )
e b i t d a x
( $ i n m i l l i o n s )p v - 1 0 o f p r o v e d r e s e r v e s
( $ i n m i l l i o n s )
4
18
16
14
12
10
8
6
4
2
0
2012 2013
13.3
17.0
250
200
150
100
50
0
135.
7
205.
0
1200
1000
600
800
400
200
0
782.
0
At Jones Energy, we create value by establishing
a leadership position in the regions where we
operate. We may not be the largest player, but
our goal is to deliver the best returns. We only
focus in areas where we can establish best-in-
class operations. In our main operating regions,
the Cleveland formation in the Anadarko Basin
and the Woodford formation in the Arkoma Basin,
we think we have accomplished that. We are
currently running 8 of our 10 rigs in the Cleveland
and are generating very attractive returns,
comparing favorably to the best US shale plays.
We see significant opportunity within our
existing footprint.
Our strategy continues to revolve around organic
and external growth. In 2013, we grew production
by 28% to 17.0 thousand barrels of oil equivalent
per day, and increased EBITDAX by over 50%.
The pre-tax present value or “PV-10” of our total
proved reserves also increased by 30% to over
$1 billion. In December 2013, we completed our
$193.5 million acquisition of assets from Sabine
Oil & Gas, increasing our core Cleveland acreage
by over 40%. We spud our first well on the Sabine
acreage just a matter of days after closing the
acquisition in December, and have integrated
these assets into our 2014 development plan.
Finally, in 2013, we also entered into a new
partnership with Vanguard Natural Resources
to drill Woodford wells, and closed on our sixth
agreement with BP in the Woodford.
2012 2013 2012 2013
1,01
7.0
28% GROWTH
51% GROWTH 30% GROWTH
A letter from Jonny Jones

JO
NE
S E
NE
RG
Y
O N EM I S S I O N
o u r m i s s i o n i s c l e a r
To be the premier Midcontinent E&P company, Jones Energy
is committed to utilizing its expertise to maximize value while
maintaining its culture of passion, integrity and focus.

O N EP U R P O S E
20
13
AN
NU
AL
RE
PO
RT
o u r g r o w t h w i l l b e p u r p o s e f u l a n d d e l i b e r a t e
We make this commitment to you: Regardless of our expansion
plans, our growth will be purposeful and deliberate – grounded in
our strategy to only operate where we can be best in class.

In 2014, we will continue to execute our tactical plans within the Anadarko and Arkoma basins. We see the potential for the Tonkawa formation in the Anadarko Basin to provide upside opportu-nities along with additional scale in the Woodford formation. We will continue to evaluate acquisition opportunities within our existing footprint, but may also pursue opportunities outside our core oper-ating area. But we make this commitment to you: Regardless of our expansion plans, our growth will be purposeful and deliberate – grounded in our strategy to only operate where we can be best in class. We will not overpay for assets. We will stay true to our tradition.
Since the company’s formation, Jones Energy has strived to be the premier E&P company in the US Midcontinent. As we enter our new chapter as a public company, this remains the foundation for all we do.
We started as a small family business over 25 years ago. Even today, my family and our management team own close to 30% of the outstanding shares. But our goal remains the same: to create long-term value for our shareholders. We think we have a wonderful foundation to deliver on that proposition.
We look forward to reporting our progress in the coming years. Thank you for your support.
Yours truly,
j o n n y j o n e s
Founder, Chairman & CEO Jones Energy
7
“Since the company’s formation, Jones Energy has strived to be the premier E&P company in the US Midcontinent. As we enter our new chapter as a public company, this remains the foundation for all we do.”
A letter from Jonny Jones

8
We are proud to be part of the small, but growing, oil and gas community in Austin, Texas. In fact, Jones Energy has been based in Austin since 1993. Being an engaged and contributing member of the Austin community is a responsibility that we take seriously. The Trail Foundation at Lady Bird Lake and the Juvenile Diabetes Research Foundation are two aspects of the Austin community that are dear to our hearts. In 2013, our employees took a day to get their hands dirty and help make Lady Bird Lake, one of the true crown jewels of the Austin community, even more beautiful. The impact we make on the Austin community does not end with what we do as an organization. We also encourage our employees to take time to be involved in
the issues in the community that matter most to them. We look forward to continuing our local community efforts in 2014.
“ w o r k h a r d , p l a y h a r d ” – this is an attitude we embrace at Jones. It fits Austin; a young, fit city that is constantly on the move. And it fits Jones. On day one, each Austin-based employee gets a complimentary gym membership. We encourage lunchtime workouts; we encourage physical activity of all kinds. We know fit employees with healthy lifestyles translate into better attitudes, better productivity and an energized workplace. In the end, what is good for our employees is good for Jones Energy. i t h e l p s u s w i n i n
e v e r y w a y , t o g e t h e r .
JONES ENERGYT R A I L
F O U N D A T I O N
A T L A D Y
B I R D L A K E
J U V E N I L E
D I A B E T E S
R E S E A R C H
F O U N D A T I O N

O N EC U L T U R E
JO
NE
S E
NE
RG
Y
w o r k h a r d , p l a y h a r d
This is an attitude we embrace at Jones Energy. We encourage
physical activity of all kinds, and make it a priority to do our part for
the Austin community. It helps us win in every way, together.

O N EF O C U S
20
13
AN
NU
AL
RE
PO
RT
115,076 N E T A C R E S
2,542 T O T A L D R I L L I N g
L O C A T I O N S
17,014B O E / D D A I L Y p R O D U C T I O N
O U R R E L E N T L E S S F O C U S O N E x E C U T I O N H A S B E E N K E Y
Focus is a word we use a lot at Jones Energy. It is a principle
that companies can often lose sight of. We consider our focus on one
area, the Midcontinent, for the past 25 years to be a
competitive advantage in itself.

1 1
Jones Energy has been operating in one area, the US Midcontinent, for over 25 years. Since our founding, we have drilled over 500 horizontal wells in nine target formations in the Midcontinent. In fact, 18 years ago we drilled our first horizontal well in the Brown Dolomite formation. Today, we are focused on two core areas in the US Midcontinent, the Cleveland formation within the Anadarko Basin, and the Woodford formation within the Arkoma Basin. In 2004, we drilled our first horizontal well in the Cleveland formation, which remains one of our core operating areas today. Since then, Jones Energy has drilled over 340 horizontal wells in the Cleveland, representing approximately 20% of all horizontal wells drilled in the formation, more than any other operator.
The ‘stacked pay’ nature of the Midcontinent has been a huge factor in our success over the past 25 years. We see substantial opportunity within the Cleveland and Woodford formations, but also see potential upside stemming from the Tonkawa and Marmaton formations. In fact, we plan to drill three Tonkawa test wells in 2014. We are excited about the opportunities within our existing asset base, and will continue to execute on our organicgrowth plans in 2014. We will remain open-minded when looking for opportunities to supplement our organic growth with acquisitions, but promise to be prudent when considering potential M&A. We will not to forget the success we have achieved over the past 25 years from focusing on the US Midcontinent.
A N A D A R K O B A S I N
Key Formation: ClevelandDrilling Locations: 1,731
Cleveland 4Q13 Daily Production: 10.8 MBoe/d
A R K O M A B A S I N
Key Formation: Woodford Drilling Locations: 811
Woodford 4Q13 Daily Production: 4.1 MBoe/d
A U S T I N O F F I C E

JonES EnErgy, InC.
Consolidated Statements of Operations
year Ended December 31,
(In thousands of dollars) 2013 2012
Operating revenues
oil and gas sales $ 258,063 $148,967other revenues 1,106 847 Total operating revenues 259,169 149,814
Operating costs and expenses
Lease operating 27,781 23,097Production taxes 12,865 5,583Exploration 1,710 356Depletion, depreciation and amortization 114,136 80,709Impairment of oil and gas properties 14,415 18,821Accretion of discount 608 533general and administrative (including non-cash
compensation expense) 31,902 15,875 Total operating expenses 203,417 144,974 operating income 55,752 4,840
Other income (expense)
Interest expense (30,774) (25,292)net gain (loss) on commodity derivatives (2,566) 16,684gain on bargain purchase - -gain (loss) on sales of assets (78) 1,162 other income (expense), net (33,418) (7,446) Income (loss) before income tax 22,334 (2,606)
Income tax provision
Current 85 - Deferred (156) 473 Total income tax provision (71) 473net income (loss) 22,405 (3,079)net income attributable to non-controlling interests 24,591 -net income (loss) attributable to controlling interests $ (2,186) $ (3,079)
Adjusted net income (1) $ 54,792 $ 29,411
EBITDAX (2) $ 204,997 $ 135,741
Production (MMBoe) 6.2 4.9Proved reserves (MMBoe) 89.0 85.3
(1) Adjusted net income is a supplemental non-GAAP financial measure that is used by management and external users of the Company’s consolidated financial statements. We define adjusted net income as net income excluding the impact of certain non-cash items including gains or losses on commodity derivative instruments not yet settled, impairment of oil and gas properties, non-cash compensation expense, and the gain on bargain purchase associated with the Southridge acquisition in 2011. For a reconciliation of adjusted net income to our net income, see Item 6. “Selected Financial Data –Non-GAAP financial measures” in our attached Form 10-K.
(2) EBITDAX is a supplemental non-GAAP financial measure that is used by management and external users of the Company’s consolidated financial statements. We define EBITDAX as earnings before interest expense, income taxes, depreciation, depletion and amortization, exploration expense, gains and losses from derivatives less the current period settlements of matured derivative contracts, and other items. For a reconciliation of EBITDAX to our net income, see Item 6. “Selected Financial Data –Non-GAAP financial measures” in our attached Form 10-K.

10-Kj o n e s e n e r g y
f o r m

UNITED STATESSECURITIES AND EXCHANGE COMMISSION
Washington, D.C. 20549
FORM 10-K� ANNUAL REPORT PURSUANT TO SECTION 13 OR 15(d) OF THE
SECURITIES EXCHANGE ACT OF 1934For the fiscal year ended: December 31, 2013
� TRANSITION REPORT PURSUANT TO SECTION 13 OR 15(d) OF THESECURITIES EXCHANGE ACT OF 1934
For the transition period from to Commission file number: 001-36006
Jones Energy, Inc.(Exact name of registrant as specified in its charter)
Delaware 80-0907968(State or other jurisdiction of (I.R.S. Employerincorporation or organization) Identification No.)
807 Las Cimas Parkway, Suite 350Austin, Texas 78746
(Address of principal executive offices) (Zip Code)Tel: (512) 328-2953
Registrant’s telephone number, including area codeSecurities registered pursuant to Section 12(b) of the Exchange Act:
Title of class Name of each exchange on which registered
Class A Common Stock, $0.001 par value New York Stock ExchangeSecurities registered pursuant to Section 12(g) of the Exchange Act: None
Indicate by check mark if the registrant is a well-known seasoned issuer, as defined in Rule 405 of the Securities Act.Yes � No �
Indicate by check mark if the registrant is not required to file reports pursuant to Section 13 or 15(d) of the Act.Yes � No �
Indicate by check mark whether the registrant (1) has filed all reports required to be filed by Section 13 or 15(d) of theSecurities Exchange Act of 1934 during the preceding 12 months (or for such shorter period that the registrant was requiredto file such reports), and (2) has been subject to such filing requirements for the past 90 days. Yes � No �
Indicate by check mark whether the registrant has submitted electronically and posted on its corporate website, if any,every Interactive Data File required to be submitted and posted pursuant to Rule 405 of Regulation S-T during the preceding12 months (or for such shorter period that the registrant was required to submit and post such files). Yes � No �
Indicate by check mark if disclosure of delinquent filers pursuant to Item 405 of Regulation S-K (§ 229.405 of thischapter) is not contained herein, and will not be contained, to the best of registrant’s knowledge, in definitive proxy orinformation statements incorporated by reference in Part III of this Form 10-K or any amendment to this Form 10-K. �
Indicate by check mark whether the registrant is a large accelerated filer, an accelerated filer, a non-accelerated filer, ora smaller reporting company. See the definitions of ‘‘large accelerated filer,’’ ‘‘accelerated filer’’ and ‘‘smaller reportingcompany’’ in Rule 12b-2 of the Exchange Act.
Large accelerated filer � Accelerated filer � Non-accelerated filer � Smaller reporting company �(Do not check if a
smaller reporting company)
Indicate by check mark whether the registrant is a shell company (as defined in Rule 12b-2 of the Exchange Act).Yes � No �
As of June 30, 2013, the last business day of the registrant’s most recently completed second fiscal quarter, there was nopublic market for the registrant’s common stock. The registrant’s common stock began trading on the New York StockExchange on July 24, 2013. The aggregate market value of the voting and non-voting common stock held by non-affiliates ofthe registrant computed as of December 31, 2013 based on the closing price of the Class A common stock on the New YorkStock Exchange on December 31, 2013 of $14.48 per share was $161.7 million.
There were 12,526,580 and 36,836,333 shares of the registrant’s Class A and Class B common stock, respectively,outstanding on March 5, 2014.
DOCUMENTS INCORPORATED BY REFERENCEPortions of the registrant’s definitive proxy statement for the 2014 Annual Meeting of Stockholders, to be filed no later
than 120 days after the end of the fiscal year, which we refer to as the Proxy Statement, are incorporated by reference intoPart III of this Annual Report on Form 10-K.

Cautionary Statement Regarding Forward-Looking Statements
The information in this Annual Report on Form 10-K (the ‘‘Annual Report’’), includes ‘‘forward-looking statements.’’ All statements, other than statements of historical fact included in this report,regarding our strategy, future operations, financial position, estimated revenues and losses, projectedcosts, prospects, plans and objectives of management are forward-looking statements. The words‘‘could,’’ ‘‘should,’’ ‘‘believe,’’ ‘‘anticipate,’’ ‘‘intend,’’ ‘‘estimate,’’ ‘‘expect,’’ ‘‘project’’ and similarexpressions are intended to identify forward-looking statements, although not all forward-lookingstatements contain such identifying words. These forward-looking statements are based on our currentexpectations and assumptions about future events and are based on currently available information asto the outcome and timing of future events. When considering forward-looking statements, you shouldkeep in mind the risk factors and other cautionary statements described under the heading ‘‘RiskFactors’’ included in this report. These forward-looking statements are based on management’s currentbelief, based on currently available information, as to the outcome and timing of future events, actionsand developments including:
• business strategy;
• estimated current and future net reserves and present value thereof;
• drilling and completion of wells including our identified drilling locations;
• cash flows and liquidity;
• financial strategy, budget, projections and operating results;
• oil, natural gas and NGLs realized prices;
• customers’ elections to reject ethane and include it as part of the natural gas stream;
• timing and amount of future production of oil and natural gas;
• availability and cost of drilling and production equipment;
• availability and cost of oilfield labor;
• the amount, nature and timing of capital expenditures, including future development costs;
• ability to fund our 2014 capital expenditure budget;
• availability and terms of capital;
• development results from our identified drilling locations;
• ability to generate returns and pursue opportunities;
• marketing of oil, natural gas and NGLs;
• property acquisitions;
• costs of developing our properties and conducting other operations;
• general economic conditions and the commodity price environment;
• effectiveness and extent of our risk management activities;
• estimates of future potential impairments;
• environmental liabilities;
• counterparty credit risk;
• governmental regulation and taxation of the oil and natural gas industry;
2

• developments in oil-producing and natural gas-producing countries;
• uncertainty regarding our future operating results;
• technology; and
• plans, objectives, expectations and intentions contained in this report that are not historical.
We caution you that these forward-looking statements are subject to all of the risks anduncertainties, most of which are difficult to predict and many of which are beyond our control, incidentto the exploration for and development and production of oil and natural gas. These risks include, butare not limited to, commodity price volatility, inflation, lack of availability of drilling and productionequipment and services, environmental risks, drilling and other operating risks, regulatory changes, theuncertainty inherent in estimating oil and natural gas reserves and in projecting future rates ofproduction, cash flow and access to capital, the timing of development expenditures, and the other risksdescribed under ‘‘Risk Factors’’ in this report.
Reserve engineering is a process of estimating underground accumulations of oil and natural gasthat cannot be measured in an exact way. The accuracy of any reserve estimate depends on the qualityof available data, the interpretation of such data and price and cost assumptions made by reservoirengineers. In addition, the results of drilling, testing and production activities may justify revisions ofestimates that were made previously. If significant, such revisions would change the schedule of anyfurther production and development drilling. Accordingly, reserve estimates may differ significantlyfrom the quantities of oil and natural gas that are ultimately recovered.
Should one or more of the risks or uncertainties described in this report occur, or shouldunderlying assumptions prove incorrect, our actual results and plans could differ materially from thoseexpressed in any forward-looking statements.
All forward-looking statements, expressed or implied, included in this report are expressly qualifiedin their entirety by this cautionary statement. This cautionary statement should also be considered inconnection with any subsequent written or oral forward-looking statements that we or persons acting onour behalf may issue.
Except as otherwise required by applicable law, we disclaim any duty to update any forward-looking statements, all of which are expressly qualified by the statements in this section, to reflectevents or circumstances after the date of this report.
References
Unless indicated otherwise in this Annual Report or the context requires otherwise, all referencesto ‘‘Jones Energy,’’ the ‘‘Company,’’ ‘‘our company,’’ ‘‘we,’’ ‘‘our’’ and ‘‘us’’ refer to Jones Energy, Inc.and its subsidiaries, including Jones Energy Holdings, LLC (‘‘JEH LLC’’). Jones Energy, Inc. (‘‘JONE’’)is a holding company whose sole material asset is an equity interest in JEH LLC.
3

PART 1
Item 1. Business
Organization
Jones Energy, Inc. was incorporated pursuant to the laws of the State of Delaware in March 2013to become a holding company for JEH LLC. As the sole managing member of JEH LLC, JonesEnergy, Inc. is responsible for all operational, management and administrative decisions relating toJEH LLC’s business and consolidates the financial results of JEH LLC and its subsidiaries. Pursuant tothe terms of a corporate reorganization that was completed in connection with the closing of JonesEnergy, Inc.’s initial public offering (‘‘IPO’’) on July 29, 2013, the pre-IPO owners of JEH LLCconverted their existing membership interests in JEH LLC into JEH LLC Units and amended theexisting LLC agreement to, among other things, modify its equity capital to consist solely of JEH LLCUnits and to admit Jones Energy, Inc. as the sole managing member of JEH LLC.
Jones Energy, Inc.’s certificate of incorporation authorizes two classes of common stock, Class Acommon stock and Class B common stock. Only Class A common stock was offered to investorspursuant to the IPO. The Class B common stock is held by the pre-IPO owners of JEH LLC and canbe exchanged (together with a corresponding number of JEH LLC Units) for shares of Class Acommon stock on a one-for-one basis, subject to customary conversion rate adjustments for stock splits,stock dividends and reclassifications and other similar transactions. Our Class A common stock hasbeen listed on the New York Stock Exchange (‘‘NYSE’’) since July 2013.
Overview
We are an independent oil and gas company engaged in the exploration, development, productionand acquisition of oil and natural gas properties in the Anadarko and Arkoma basins of Texas andOklahoma. Our Chairman and CEO, Jonny Jones, founded our predecessor company in 1988 incontinuation of his family’s long history in the oil and gas business, which dates back to the 1920’s. Wehave grown rapidly by leveraging our focus on low cost drilling and completions methods and ourhorizontal drilling expertise to develop our inventory and execute several strategic acquisitions. We haveaccumulated extensive knowledge and experience in developing the Anadarko and Arkoma basins,having concentrated our operations in the Anadarko basin for 25 years and applied our knowledge tothe Arkoma basin since 2011. We have drilled over 645 total wells, including over 460 horizontal wells,since our formation and delivered compelling rates of return over various commodity price cycles. Ouroperations are focused on horizontal drilling and completions within two distinct basins in the TexasPanhandle and Oklahoma:
• the Anadarko Basin—targeting the liquids-rich Cleveland, Granite Wash, Tonkawa andMarmaton formations; and
• the Arkoma Basin—targeting the Woodford shale formation.
We optimize returns through a disciplined emphasis on controlling costs and promoting operationalefficiencies, and we believe we are recognized as one of the lowest-cost drilling and completionoperators in the Cleveland and Woodford shale formations.
The Anadarko and Arkoma basins are among the most prolific and largest onshore producing oiland natural gas basins in the United States, enjoying multiple producing horizons and extensive wellcontrol demonstrated over seven decades of development. The formations we target are generallycharacterized by oil and liquids-rich natural gas content, extensive production histories, long-livedreserves, high drilling success rates and attractive initial production rates. We focus on formations inour operating areas that we believe offer significant development and acquisition opportunities and towhich we can apply our technical experience and operational excellence to increase proved reserves and
4

production to deliver attractive economic rates of return. Our goal is to build value through adisciplined balance between developing our current inventory of 2,542 gross identified drilling locationsand other opportunities within our existing asset base, and actively pursuing joint venture agreements,farm-out agreements, joint operating agreements and similar partnering agreements, which we refer toas joint development agreements, organic leasing and strategic acquisitions. In all of our jointdevelopment agreements, we control the drilling and completion of a well, which is the phase duringwhich we can leverage our operational expertise and cost discipline. Following completion, we in somecases may turn over operatorship to a partner during the production phase of a well. We believe theceding to us of drilling and completion operatorship in our areas of operation by several large oil andgas companies, including ExxonMobil and BP, reflects their acknowledgement of our low-cost, safe andefficient operations.
As of December 31, 2013, our total estimated proved reserves were 89.0 MMBoe, of which 56%were classified as proved developed reserves. Approximately 19% of our total estimated provedreserves as of December 31, 2013 consisted of oil, 37% consisted of NGLs, and 44% consisted ofnatural gas. As of December 31, 2013, our properties included 835 gross producing wells. For the threeyears ended December 31, 2013, we drilled 218 wells, substantially all of which we drilled as operator.The following table presents summary reserve, acreage and production data for each of our coreoperating areas:
Year EndedAs of December 31, 2013 December 31, 2013
Estimated Net Average Daily NetProved Reserves Acreage Production
% Oil and Gross Net % Oil andMMBoe NGLs(1) Acreage Acreage MBoe/d NGLs(1)
Anadarko basin:Cleveland . . . . . . . . . . . . . . . . . . . . . . . 57.5 62.3% 152,983 91,376 10.0 66.0%Granite Wash . . . . . . . . . . . . . . . . . . . . 2.4 39.0% 14,361 6,595 1.1 45.5%
Arkoma basin:Woodford . . . . . . . . . . . . . . . . . . . . . . . 26.2 46.3% 14,584 3,839 4.0 30.3%
Other . . . . . . . . . . . . . . . . . . . . . . . . . . . . 2.9 24.2% 36,609 13,266 1.9 34.5%
All properties . . . . . . . . . . . . . . . . . . . . 89.0 55.7% 218,537 115,076 17.0 52.8%
(1) Ethane is an NGL and is included in this percentage. Due to declines in ethane pricing andincreases in natural gas prices, beginning in December 2012, purchasers of our Woodfordproduction have been electing not to recover ethane from the natural gas stream and instead havebeen paying us based on the natural gas price for the ethane left in the gas stream. As a result ofthe increased energy content associated with the returned ethane and the absence of plantshrinkage, this ethane rejection has increased the incremental revenue and volumes that we receivefor our natural gas production relative to what we would have received if the ethane wasseparately recovered, but has reduced physical barrels of liquid ethane that we are selling.
5

The following table presents summary well and drilling location data for each of our keyformations for the date indicated:
As of December 31, 2013
IdentifiedProducing Drilling
Wells Locations(1)
Gross Net Gross Net
Anadarko basin:Cleveland . . . . . . . . . . . . . . . . . . . . . . . . . . . . . . . . . . 424 283 667 425Granite Wash . . . . . . . . . . . . . . . . . . . . . . . . . . . . . . . 20 14 33 16Tonkawa . . . . . . . . . . . . . . . . . . . . . . . . . . . . . . . . . . — — 209 123Marmaton . . . . . . . . . . . . . . . . . . . . . . . . . . . . . . . . . — — 371 209
Arkoma basin:Woodford . . . . . . . . . . . . . . . . . . . . . . . . . . . . . . . . . 127 49 811 98
Other . . . . . . . . . . . . . . . . . . . . . . . . . . . . . . . . . . . . . . 264 69 451 17
All properties . . . . . . . . . . . . . . . . . . . . . . . . . . . . . . . 835 415 2,542 888
(1) Our total identified drilling locations include 366 gross locations associated with provedundeveloped reserves as of December 31, 2013. We have estimated our drilling locationsbased on well spacing assumptions for the areas in which we operate and other criteria.See ‘‘Business—Development of Proved Undeveloped Reserves’’ and ‘‘Business—DrillingLocations’’ for more information regarding our proved undeveloped reserves and theprocesses and criteria through which these drilling locations were identified.
Our 2013 capital expenditures, excluding acquisitions, totaled $240 million, during which we drilled97 gross wells. We expect our 2014 capital expenditure budget to be approximately $350 million,$310 million of which we expect will be used to drill and complete wells. The remainder of the 2014capital expenditure budget is devoted to leasing and other discretionary expenditures. Please see‘‘Item 7. Management’s Discussion and Analysis of Financial Condition and Results of Operations—Liquidity and Capital Resources.’’ Assuming current market conditions and drilling success ratescomparable to our historical performance, we believe we will be able to fund all of our 2014 budgetedcapital expenditures with our cash flow from operations and projected availability under our seniorsecured revolving credit facility.
We currently have ten rigs running in our two core areas, eight in the Cleveland and two in theWoodford. We currently expect to allocate our 2014 capital expenditure budget as follows:
2014 CapitalExpenditure
Budget
(in millions)
Drilling and completion:Cleveland . . . . . . . . . . . . . . . . . . . . . . . . . . . . . . . . . . . . . . . . . . . $250Woodford . . . . . . . . . . . . . . . . . . . . . . . . . . . . . . . . . . . . . . . . . . 50Other . . . . . . . . . . . . . . . . . . . . . . . . . . . . . . . . . . . . . . . . . . . . . 10
Leasing . . . . . . . . . . . . . . . . . . . . . . . . . . . . . . . . . . . . . . . . . . . . . . . 20Other activities . . . . . . . . . . . . . . . . . . . . . . . . . . . . . . . . . . . . . . . . . . 20
All properties and activities . . . . . . . . . . . . . . . . . . . . . . . . . . . . . . . $350
6

Our Business Strategies
Our goal is to increase value by leveraging the operational expertise of our management andtechnical teams in our operating areas in order to achieve compelling economic returns and attractivereserve, production and cash flow growth. We seek to achieve this goal by executing the followingstrategies:
Grow Production and Reserves through Development of Our Multi-Year Inventory.
We intend to focus on development activities in our operating areas, which we believe to berepeatable, low-risk and low-cost, in order to grow our current level of production and proved reserves.We have extensive experience in the Anadarko and Arkoma basins, having drilled over 645 wells in thearea since 1988. We believe our historical drilling experience, together with the results of substantialindustry activity within our operating areas, helps reduce the risk and uncertainty associated withdrilling horizontal wells in these areas. As of December 31, 2013, we have identified 2,542 gross drillinglocations, which we believe will enable us to drill and develop our resource base over many years. Weexpect 100% of our development capital expenditures in 2014 to be dedicated to horizontal drilling.
Leverage Our Extensive Operational Expertise to Continually Reduce Costs and Enhance Returns.
Decades of experience in the Midcontinent region and emphasis on operational execution and costcontrol have allowed us to drill and complete wells at significantly lower cost than most other operatorsand, as a result, to realize compelling economic returns. For example in the Cleveland, over the pastseven years, we have been able to reduce our well spud-to-release time, which directly affects drillingcosts, from approximately 30 days to approximately 26 days. We seek to apply this expertise in otherprojects within our areas of operation to enhance their economic profile.
Execute Strategic Acquisitions, Joint Development Agreements, and Organic Leasing Where Our OperatingExperience Can Be Leveraged.
We have successfully increased our production and reserves through selective acquisitions, targetedjoint development agreements and organic leasing, and we intend to continue to evaluate acquisition,partnering and leasing opportunities in and around our areas of operation. We pursue jointdevelopment opportunities that complement our acquisition strategy by providing a capital efficient andrisk-lowering approach to securing and developing acreage and drilling locations that allows us to applyour expertise in the drilling and completion phase. In this regard, we have established long-termagreements with several large exploration and production companies such as BP, ConocoPhillips, DevonEnergy, ExxonMobil, Linn Energy, Vanguard Natural Resources and Samson, in which they havefarmed-out portions of their basin operations to us. We have drilled over 279 wells in connection withthese types of agreements, over 157 of which have been drilled in connection with an active 13-yeardrilling relationship with ExxonMobil. We also continue to seek new leasing opportunities to expandour acreage position and complement our existing drilling inventory, as we believe that targeted organicleasing around our existing acreage provides the ability for greater returns due to cost and operatingsynergies in overlapping areas of operation.
Focus on Exploiting Additional Upside Potential Within Our Portfolio.
We plan to continue exploiting our proved reserves to maximize production through variousenhanced recovery methods, such as optimizing frack design and number of stages. Furthermore, thestacked reservoirs within our asset base provide exposure to additional upside potential in severalemerging resource plays. Recently, offset operators have been pursuing the exploration of two newly-identified resource opportunities, the Tonkawa and Marmaton formations in the Anadarko basin. Wehave begun to assess the potential of these formations within our asset base and believe, based on
7

these results, we have approximately 580 potential drilling locations in the Tonkawa and Marmatonformations that provide us with additional resource potential. We plan to start to test the potential ofthe Tonkawa formation by drilling three pilot wells on our acreage in 2014. Further, our currentleasehold position provides longer term potential exposure to other prospective formations found in theAnadarko basin, including the Douglas, Cottage Grove, Cherokee Shale, Atoka Shale, Upper, Middleand Lower Morrow formations, and other prospective formations found in the Arkoma basin, includingthe Hartshorne, Spiro, Wapanuka, Cromwell and Caney Shale formations.
Maintain Operational Control Over Our Drilling and Completion Operations.
We operated substantially all of the wells that we drilled and completed during 2013, allowing usto effectively manage the timing and levels of our development spending, overall well costs andoperating costs. In addition, we expect to operate the drilling and completion phase on approximately71% of our 2,542 gross identified drilling locations. With over 78% of our acreage held by existingproduction, we also will not be required to expend significant capital to hold acreage in our portfolio.We believe that continuing to exercise a high degree of control over our acreage position will provideus with flexibility to manage our drilling program and optimize our returns and profitability.
Opportunistically Allocate Our Resources and Capital to Enhance Returns.
Our drilling inventory comprises oil, natural gas and NGLs, which enables us to adjust ourdevelopment approach based on prevailing commodity prices. Currently, we intend to capitalize on themore favorable liquids pricing environment by continuing to drill acreage with significant oil and NGLcomponents, where 100% of our 2014 drilling capital budget is focused. Within our existing portfolio,oil and NGLs account for approximately 56% of our proved reserves as of December 31, 2013. Inaddition, we expect that continuing to operate the substantial majority of our drilling locations willallow us to reallocate our capital and resources opportunistically in response to market conditions. Ourdisciplined focus on well-level returns in allocating our capital and resources has been a key componentof our ability to deliver successful results through various commodity price cycles over the last 25 years.
Competitive Strengths
We possess a number of competitive strengths that we believe will allow us to successfully executeour business strategy:
Geographic Focus in the Prolific U.S. Midcontinent.
Our operations are focused in the Midcontinent region, targeting liquids-rich opportunities in theAnadarko and Arkoma basins of Texas and Oklahoma. We generally focus on formations characterizedby oil and liquids-rich natural gas content, extensive production histories, long-lived reserves, highdrilling success rates, and attractive initial production rates. Furthermore, our areas of operation areproximate to well-developed natural gas and liquids midstream infrastructure and oilfield servicesproviders, which we believe reduces the risk of production delays and facilitates adequate takeawaycapacity. 100% of our 2014 drilling capital budget is devoted to the Anadarko and Arkoma basins inthe U.S. Midcontinent.
Multi-Year Drilling Inventory in Existing and Emerging Resource Plays.
Our drilling inventory consists of approximately 2,542 gross identified drilling locations in theAnadarko and Arkoma basins, and our development plans target locations that we believe are low-cost,provide attractive economics, present a low risk and support a relatively predictable production profile.As of December 31, 2013, we had identified 667 gross drilling locations in the Cleveland play, 811 grossdrilling locations in the Arkoma Woodford shale formation and 209 gross locations in the Tonkawa
8

formation. Our concentrated leasehold position has been delineated largely through drilling on ourCleveland leasehold, which we expanded substantially through our Chalker and Sabine acquisitions. Wehave also expanded through joint development agreements with large independent producers and majoroil and gas companies in the Cleveland and Woodford formations. In 2013, we drilled 97 gross wells, ascompared to 48 gross wells drilled in 2012, representing a 102% increase. Furthermore, we haveidentified additional locations in several emerging resource plays that we intend to explore and developin the coming years, including 33 gross locations in the Granite Wash formation, 209 gross locations inthe Tonkawa formation and 371 gross locations in the Marmaton formation.
Extensive Operational Expertise and Low-Cost Operating Structure.
Drilling horizontal wells has been our primary drilling approach for the last nine years. Havingdrilled over 460 horizontal wells in nine formations in our areas of operation since 1996, we haveestablished systematic protocols that we believe provide repeatable results. We also have establishedrelationships with oilfield service providers, vendors and crews, allowing for continued cost efficiencies.As an example, we have consistently drilled horizontal Cleveland wells at a meaningfully lower costthan most of our competition in the same area. Through our focus on drilling, completion andoperational efficiencies, we are able to effectively control costs and deliver attractive rates of returnand profitability.
Strong Financial Position and Conservative Policies.
We are committed to maintaining a conservative financial profile in order to preserve operationalflexibility and financial stability. We believe that our operating cash flow, together with projectedavailability under our senior secured revolving credit facility, provide us with the financial flexibility topursue acquisitions, joint development agreements and organic leasing opportunities. In addition, weintend to actively hedge our future production in order to reduce the impact of commodity pricevolatility on our cash flows. Each quarter, we typically review the production results from recentlydrilled wells and begin entering into commodity price hedges of up to 100% of expected productionfrom those wells in order to secure our rates of return for up to five years. As of December 31, 2013,we had over $680 million of notional value in existing hedges with the lenders under our creditfacilities.
High Caliber Management Team with Deep Operating Experience and a Proven Track Record.
The top four executives of our management team average more than 25 years of industryexperience. Furthermore, our management team averages over 20 years of industry experience and hasworked together developing assets for many years, resulting in a high degree of continuity. We haveassembled a strong technical staff of geoscientists, field operations managers and engineers withsignificant experience drilling horizontal wells and with fracture stimulation of unconventionalformations, which has resulted in a successful track record of reserve and production growth. Inaddition, our management team has extensive expertise and operational experience in the oil andnatural gas industry with a proven track record of successfully negotiating, executing and integratingacquisitions. Members of our management team have previously held positions with major and largeindependent oil and natural gas companies, including ExxonMobil, BP, Southwestern Energy, Samson,Marathon and Standard Oil.
Alignment of Management Team.
Our predecessor was founded in 1988 by our CEO, Jonny Jones, in continuation of his family’shistory in the oil and gas business, which dates back to the 1920’s. Jones family members and ourmanagement team currently control approximately 28% of our combined voting power and economic
9

interest. We believe the equity interests of our officers and directors align their interests and providesubstantial incentive to grow the value of our business.
Our Operations
Our areas of operations
We own leasehold interests in oil and natural gas producing properties, as well as in undevelopedacreage, substantially all of which are located in the Anadarko and Arkoma basins in Texas andOklahoma. The majority of our interests are in producing properties located in fields characterized bywhat we believe to be long-lived, predictable production profiles and repeatable developmentopportunities.
For a discussion of the risks inherent in oil and natural gas production, please read ‘‘RiskFactors—Drilling for and producing oil, natural gas and NGLs are high risk activities with manyuncertainties that could adversely affect our business, financial condition or results of operations.’’
Anadarko basin
Approximately 67% of our estimated proved reserves as of December 31, 2013 and approximately66% of our average daily net production for the year ended December 31, 2013 were located in theAnadarko basin. The Anadarko basin is one of the most prolific oil and natural gas producing basins inthe United States, covering approximately 50,000 square miles primarily in Oklahoma, but alsoincluding the upper Texas Panhandle, southwestern Kansas, and southeastern Colorado.
Our wells in this area produce oil, natural gas and NGLs from various formations at depths fromapproximately 7,000 feet to 12,000 feet. We drilled 73 gross (56 net) wells as operator in the Anadarkobasin in 2013. Our operations in the Anadarko basin are primarily focused on the Cleveland formationwhere we have 424 producing wells. We also have acreage in the Granite Wash, Tonkawa, Marmaton,Atoka shale and Cherokee shale formations located in the eastern portion of the Texas Panhandle andwestern Oklahoma. We intend to explore and develop the Tonkawa formation beginning in 2014, andbelieve that the Marmaton, Atoka shale and Cherokee shale formations provide longer-term potentialin the Anadarko basin.
On December 18, 2013, we acquired from Sabine Mid-Continent, LLC certain producing andundeveloped oil and gas assets in the Anadarko basin located in the Texas Panhandle and westernOklahoma for approximately $193.5 million, subject to customary closing adjustments. The acquiredSabine properties produced approximately 2,227 boe/day in the 14 day period in 2013 during which weowned the properties.
Producing Formations. Our production in the Anadarko basin is currently derived primarily fromthe following formations, where we have 444 gross (297 net) producing wells and where we haveidentified 700 gross (441 net) drilling locations as of December 31, 2013, of which 238 have provedundeveloped reserves attributed to them as of December 31, 2013. See ‘‘Drilling Locations’’ for moreinformation regarding the processes and criteria through which these drilling locations were identified.
• Cleveland Formation. Our Cleveland acreage is located in Ochiltree, Lipscomb and Hemphillcounties in Texas and Ellis county in Oklahoma. The Cleveland formation ranges from depths ofapproximately 7,000 feet to 8,800 feet and is characterized by a tight, shaly sand with lowpermeability that lends itself to improved recovery through enhanced drilling and completiontechniques.
As of December 31, 2013, we operated 322 gross (244 net) producing wells with workinginterests ranging from approximately 25% to 100% for our leasehold in the Cleveland formation.Our Cleveland properties contained 57.5 MMBoe of estimated net proved reserves as of
10

December 31, 2013, 62% of which are oil and NGLs, and generated an average daily netproduction of 10.9 MBoe/d for the month ended December 31, 2013. We have identified667 gross (425 net) drilling locations in the Cleveland formation as of December 31, 2013. Ofthese 667 locations, 523 locations (78%) are attributable to acreage that is currently held byproduction and 232 locations (35%) are attributable to proved undeveloped reserves as ofDecember 31, 2013. We are currently running 8 rigs in the Cleveland formation and plan tospend approximately $250 million drilling and completing wells there in 2014, representingapproximately 81% of our drilling and completion budget.
• Granite Wash Formation. Our Granite Wash acreage is located in Roberts, Hemphill andWheeler counties in Texas and Roger Mills, Beckham, Custer and Washita counties inOklahoma. The Granite Wash spans multiple zones from depths of approximately 9,000 feet to12,000 feet and is composed of tight, complex, quartz rich alluvial liquids-rich wash.
As of December 31, 2013, we operated 19 gross (13 net) producing wells in this formation withan average working interest of 75%. Our Granite Wash properties contained 2.4 MMBoe ofestimated net proved reserves as of December 31, 2013, approximately 39% of which are oil andNGLs. We have not allocated any capital expenditures to the Granite Wash formation in our2014 drilling budget. We have 33 gross (16 net) remaining drilling locations in the Granite Washformation as of December 31, 2013.
Additional Targeted Formations. We also own properties in the following formations of theAnadarko basin, where we have identified 580 gross (332 net) drilling locations as of December 31,2013, none of which have proved reserves attributed to them. See ‘‘Drilling Locations’’ for moreinformation regarding the processes and criteria through which these drilling locations were identified.
• Tonkawa Formation. As of December 31, 2013, we have identified 209 gross (123 net) drillinglocations in the Tonkawa formation in Lipscomb and Hemphill counties in Texas. In addition, wehave other properties in the Tonkawa formation located in Ellis and Roger Mills counties inOklahoma. The Tonkawa is a newly-targeted horizontal oil formation at depths of approximately6,000 feet to 8,000 feet and is characterized by fine to very fine-grained sandstone, ranging inthickness from 20 feet to 40 feet. We drilled our first horizontal Tonkawa well in May of 2010and drilled two additional horizontal wells in the formation under a farm-out with Samson thatis not part of our current leasehold. Beginning in the second quarter of 2014, we plan to drillthree additional test wells in different areas of the Company’s leasehold acreage in the Tonkawaformation.
• Marmaton Formation. As of December 31, 2013, we have identified 371 gross (209 net) drillinglocations in the Marmaton formation. Our properties in the Marmaton formation are allundeveloped and span three sub-formations: properties located in Ellis County, Oklahomacharacterized by fluvio-deltaic sands, properties located in Northeast Ochiltree and NorthwestLipscomb counties, Texas characterized by shallow marine sands, and properties located inOchiltree county, Texas characterized by algal reef complex. The Marmaton sand is a tight, shalysand with similar reservoir characteristics to the Cleveland. The Marmaton sand ranges inthickness from 40 feet to 80 feet while the reef ranges from 80 feet to 150 feet. We have notallocated any capital expenditures to the Marmaton formation in our 2014 drilling budget.
Future Potential Opportunities. Our current leasehold position provides longer term potentialexposure to other prospective formations in the Anadarko basin, including the Atoka, Cherokee,Douglas, Cottage Grove, Upper, Middle and Lower Morrow formations. As of December 31, 2013, theacreage associated with these opportunities is approximately 82% held by production. The Atoka andCherokee formations, in particular, have attractive geologic properties, and we may elect to pursuetheir development in the future.
11

Arkoma Basin
Approximately 29% of our estimated proved reserves as of December 31, 2013, and approximately19% of our average daily net production for December 2013, were located in the Arkoma basin. TheArkoma basin is a historically prolific, largely gas-prone basin extending from eastern Oklahoma intowestern Arkansas. The basin produces natural gas from multiple horizons, which range in depth from500 to 21,000 feet.
As of December 31, 2013, we operated approximately 66% of our properties in the Arkoma basinand produce primarily from the Woodford formation. Our current leasehold position also provideslonger term potential exposure to other prospective formations in the Arkoma basin, including theHartshorne, Spiro, Wapanuka, Cromwell and Caney formations.
• Woodford Shale Formation. Our properties in the Woodford shale formation are located in Atoka,Coal, Pittsburg and Hughes counties in eastern Oklahoma. The Woodford shale formationranges from depths of approximately 5,000 feet to 12,700 feet and is composed of 75 to 220 footthick black siliceous shale in our operating area. The Woodford shale in this area is prospectivefor natural gas with a high concentration of associated NGLs.
As of December 31, 2013, we operated 84 gross (44 net) producing wells in the formation withan average working interest of 52%. Our Woodford shale formation properties contained26.2 MMBoe of estimated net proved reserves as of December 31, 2013, 46% of which areNGLs, and generated an average daily net production of 3.3 MBoe/d for the month endedDecember 31, 2013. We drilled 13 gross (4 net) additional wells in the Woodford shaleformation in 2013. We have identified 811 gross (98 net) drilling locations in the Woodford shaleformation as of December 31, 2013, of which 13% have proved undeveloped reserves attributedto them as of December 31, 2013. We plan to spend approximately $50 million drilling andcompleting wells there in 2014, representing approximately 16% of our budgeted 2014 drillingcapital expenditures.
Drilling Locations
We have identified a total of 2,542 gross (888 net) drilling locations, all of which are horizontaldrilling locations. Of these 2,542 locations, 2,033 locations are attributable to acreage that is currentlyheld by production and approximately 366 (14%) are attributable to proved undeveloped reserves as ofDecember 31, 2013. In order to identify drilling locations, we apply geologic screening criteria based onthe presence of a minimum threshold of gross pay sand thickness in a section and then consider thenumber of sections and the appropriate well density to develop the applicable field. In making theseassessments, we include properties in which we hold operated and non-operated interests, as well asredevelopment opportunities. Once we have identified acreage that is prospective for the targetedformations, well placement is determined primarily by the regulatory spacing rules prescribed by thegoverning body in each of our operating areas. Wells drilled in the Cleveland formation adhere to128-acre spacing (5 wells per section) while wells in the Woodford shale formation are developed on80-acre and 120-acre spacing, depending on the area. Wells drilled in the Granite Wash formation weredeveloped on 128-acre or 213-acre spacing. Wells drilled in the Tonkawa and Marmaton formationsadhere to 160-acre spacing. We view the risk profiles for the Tonkawa and Marmaton formations asbeing higher than for our other drilling locations due to relatively less available production data anddrilling history.
Our identified drilling locations are scheduled to be drilled over many years. The ultimate timingof the drilling of these locations will be influenced by multiple factors, including oil, natural gas andNGL prices, the availability and cost of capital, drilling and production costs, the availability of drillingservices and equipment, drilling results, lease expirations, gathering systems, processing, marketing andpipeline transportation constraints, regulatory approvals and other factors. In addition, a number of our
12

identified drilling locations are associated with joint development agreements, and if we do not meetour obligation to drill the minimum number of wells specified in an agreement, we will lose the right tocontinue to develop certain acreage covered by that agreement. For a discussion of the risks associatedwith our drilling program, see ‘‘Risk Factors—Our identified drilling locations are scheduled to bedrilled over many years, making them susceptible to uncertainties that could materially alter theoccurrence or timing of their drilling, which in certain instances could prevent or delay associatedexpected production. In addition, we may not be able to raise the amount of capital that would benecessary to drill a substantial portion of our identified drilling locations.’’
Estimated Proved Reserves
The following table sets forth summary data with respect to our estimated net proved oil, naturalgas and NGLs reserves as of December 31, 2013, 2012 and 2011, which are based upon reserve reportsof Cawley, Gillespie & Associates, Inc., or Cawley Gillespie, our independent reserve engineers. CawleyGillespie’s reports were prepared consistent with the rules and regulations of the SEC regarding oil andnatural gas reserve reporting in effect during such periods. The summary data with respect to ourestimated net proved oil and natural gas reserves as of December 31, 2013 include the reservesattributable to the properties acquired in the Sabine acquisition.
As of December 31,
2013 2012 2011
Reserve Data:Estimated proved reserves:
Oil (MBbls) . . . . . . . . . . . . . . . . . . . . . . . . . . . 16,688 12,540 7,440Natural gas (MMcf) . . . . . . . . . . . . . . . . . . . . . 236,648 228,080 244,579NGLs (MBbls) . . . . . . . . . . . . . . . . . . . . . . . . . 32,915 34,746 34,606Total estimated proved reserves (MBoe)(1) . . . . . 89,045 85,299 82,809
Estimated proved developed reserves:Oil (MBbls) . . . . . . . . . . . . . . . . . . . . . . . . . . . 7,129 4,261 2,535Natural gas (MMcf) . . . . . . . . . . . . . . . . . . . . . 139,622 110,956 110,434NGLs (MBbls) . . . . . . . . . . . . . . . . . . . . . . . . . 19,101 16,320 14,021Total estimated proved developed reserves
(MBoe)(1) . . . . . . . . . . . . . . . . . . . . . . . . . . . 49,501 39,074 34,961Estimated proved undeveloped reserves:
Oil (MBbls) . . . . . . . . . . . . . . . . . . . . . . . . . . . 9,559 8,278 4,905Natural gas (MMcf) . . . . . . . . . . . . . . . . . . . . . 97,025 117,124 134,146NGLs (MBbls) . . . . . . . . . . . . . . . . . . . . . . . . . 13,814 18,426 20,586Total estimated proved undeveloped reserves
(MBoe)(1) . . . . . . . . . . . . . . . . . . . . . . . . . . . 39,544 46,225 47,849PV-10 (in millions)(2) . . . . . . . . . . . . . . . . . . . . . . $ 1,017 $ 782 $ 916Standardized measure (in millions)(3) . . . . . . . . . . 941 782 916
(1) One Boe is equal to six Mcf of natural gas or one Bbl of oil or NGLs based on anapproximate energy equivalency. This is a physical correlation and does not reflect a valueor price relationship between the commodities.
(2) PV-10 is a non-GAAP financial measure and generally differs from StandardizedMeasure, the most directly comparable GAAP financial measure, because it does notinclude the effect of income taxes on discounted future net cash flows. Neither PV-10 norStandardized Measure represents an estimate of the fair market value of our oil andnatural gas properties. The oil and gas industry uses PV-10 as a measure to compare therelative size and value of proved reserves held by companies without regard to the
13

specific tax characteristics of such entities. See ‘‘Reconciliation of PV-10 to StandardizedMeasure’’ below.
(3) Standardized measure is calculated in accordance with Statement of Financial AccountingStandards No. 69 Disclosures About Oil and Gas Producing Activities, as codified in ASCTopic 932, Extractive Activities—Oil and Gas. Prior to the reorganization that occurred in2013 in connection with the IPO of shares of its Class A common stock, the predecessorof Jones Energy, Inc. was a limited liability company that was not subject to entity-leveltaxation during the periods presented except for the Texas franchise tax. Accordingly,standardized measure for historical periods was not reduced for income taxes. However,upon consummation of the IPO, Jones Energy, Inc. became subject to entity-leveltaxation, which is reflected in the standardized measure as of December 31, 2013.
The following table sets forth the benchmark prices used to determine our estimated provedreserves for the periods indicated.
As of December 31,
2013 2012 2011
Oil, Natural Gas and NGLs Benchmark Prices:Oil (per Bbl)(1) . . . . . . . . . . . . . . . . . . . . . . . . . . . . . $96.78 $94.71 $96.19Natural gas (per MMBtu)(2) . . . . . . . . . . . . . . . . . . . . 3.67 2.76 4.12NGLs (per Bbl)(3) . . . . . . . . . . . . . . . . . . . . . . . . . . . 28.33 31.27 47.26
(1) Benchmark prices for oil reflect the unweighted arithmetic average first-day-of-the-monthprices for the prior 12 months using WTI Cushing posted prices. These prices wereutilized in the reserve reports prepared by Cawley Gillespie and in management’s internalestimates and are adjusted by well for content, quality, transportation fees, geographicaldifferentials, marketing bonuses or deductions and other factors affecting the pricereceived at the wellhead. As of December 31, 2013, 2012 and 2011, the average realizedprices for oil were $91.74, $90.74 and $92.04 per Bbl, respectively.
(2) Benchmark prices for natural gas in the table above reflect the unweighted arithmeticaverage first-day-of-the-month prices for the prior 12 months, respectively, using HenryHub prices. These prices were utilized in the reserve reports prepared by CawleyGillespie and in management’s internal estimates and are adjusted by well for content,quality, transportation fees, geographical differentials, marketing bonuses or deductionsand other factors affecting the price received at the wellhead. As of December 31, 2013,2012 and 2011, the average realized prices for natural gas were $3.13, $2.24 and $3.83 perMMBtu, respectively.
(3) Prices for NGLs in the table above reflect the average realized prices for the prior12 months. Benchmark prices for NGLs vary depending on the composition of the NGLbasket and current prices for the various components thereof, such as butane, ethane, andpropane, among others. Due to declines in ethane prices relative to natural gas prices,beginning in 2012, purchasers of our Woodford production have been electing not torecover ethane from the natural gas stream and instead are paying us based on thenatural gas price for the ethane left in the gas stream. As a result of the increased energycontent associated with the returned ethane and the absence of plant shrinkage, thisethane rejection has increased the incremental revenue and volumes that we receive forour natural gas product relative to what we would have received if the ethane wasseparately recovered, but has reduced physical barrels of liquid ethane that we are selling.
14

Reconciliation of PV-10 to Standardized Measure
PV-10 is derived from the Standardized Measure of discounted future net cash flows, which is themost directly comparable GAAP financial measure. PV-10 is a computation of the StandardizedMeasure of discounted future net cash flows on a pre-tax basis. PV-10 is equal to the StandardizedMeasure of discounted future net cash flows at the applicable date, before deducting future incometaxes, discounted at 10 percent. We believe that the presentation of PV-10 is relevant and useful toinvestors because it presents the discounted future net cash flows attributable to our estimated netproved reserves prior to taking into account future corporate income taxes, and it is a useful measurefor evaluating the relative monetary significance of our oil and natural gas properties. Further, investorsmay utilize the measure as a basis for comparison of the relative size and value of our reserves to othercompanies. We use this measure when assessing the potential return on investment related to our oiland natural gas properties. PV-10, however, is not a substitute for the Standardized Measure ofdiscounted future net cash flows. Our PV-10 measure and the Standardized Measure of discountedfuture net cash flows do not purport to represent the fair value of our oil and natural gas reserves.
The following table provides a reconciliation of PV-10 to the Standardized Measure of discountedfuture net cash flows at December 31, 2013, 2012 and 2011.
As of December 31,
2013 2012 2011
(in millions)
PV-10 . . . . . . . . . . . . . . . . . . . . . . . . . . . . . . . . . . . . . . . . . $1,017 $782 $916Present value of future income taxes discounted at 10% . . . . 76 — —
Standardized measure . . . . . . . . . . . . . . . . . . . . . . . . . . . . . $ 941 $782 $916
Prior to the IPO, the Company was not subject to federal income tax; hence no income taxes wereapplied to reserve values in the previous years.
Internal Controls
Our proved reserves are estimated at the well or unit level and compiled for reporting purposes byour corporate reservoir engineering staff, all of whom are independent from our operating teams. Wemaintain internal evaluations of our reserves in a secure reserve engineering database. The corporatereservoir engineering staff interacts with our internal petroleum engineers and geoscience professionalsin each of our operating areas and with operating, accounting and marketing employees to obtain thenecessary data for the reserves estimation process. Reserves are reviewed and approved internally byour senior management team on a semi-annual basis. We anticipate that the audit committee of ourboard of directors will conduct a similar review on an annual basis. We expect to have our reserveestimates evaluated by Cawley Gillespie, our independent third party reserve engineers, or anotherindependent reserve engineering firm, at least annually.
Our internal professional staff works closely with Cawley Gillespie, to ensure the integrity, accuracyand timeliness of data that is furnished to them for their reserve estimation process. We provide all ofthe reserve information maintained in our secure reserve engineering database to the externalengineers, as well as other pertinent data, such as geologic maps, well logs, production tests, materialbalance calculations, well performance data, operating procedures and relevant economic criteria. Wemake all requested information, as well as our pertinent personnel, available to the external engineersas part of their evaluation of our reserves. Various procedures are used to ensure the accuracy of thedata provided to our independent petroleum engineers, including review processes. Changes in reservesfrom the previous report are closely monitored. Reconciliation of reserves from the previous report,which includes an explanation of all significant changes, is reviewed by both the engineering
15

department and upper management, including our chief operating officer. Our independent petroleumengineers prepare our annual reserves estimates, whereas interim estimates are internally prepared.
Technology Used to Establish Proved Reserves
Under SEC rules, proved reserves are those quantities of oil and natural gas that by analysis ofgeoscience and engineering data can be estimated with reasonable certainty to be economicallyproducible from a given date forward from known reservoirs, and under existing economic conditions,operating methods and government regulations. The term ‘‘reasonable certainty’’ implies a high degreeof confidence that the quantities of oil and natural gas actually recovered will equal or exceed theestimate. Reasonable certainty can be established using techniques that have been proven effective byactual production from projects in the same reservoir or an analogous reservoir or by other evidenceusing reliable technology that establishes reasonable certainty. Reliable technology is a grouping of oneor more technologies (including computational methods) that has been field tested and has beendemonstrated to provide reasonably certain results with consistency and repeatability in the formationbeing evaluated or in an analogous formation.
To establish reasonable certainty with respect to our estimated proved reserves, our internalreserve engineers and Cawley Gillespie employed technologies that have been demonstrated to yieldresults with consistency and repeatability. The technologies and economic data used in the estimationof our proved reserves include, but are not limited to, electrical logs, radioactivity logs, core analyses,geologic maps and available downhole and production data, seismic data and well test data. Reservesattributable to producing wells with sufficient production history were estimated using appropriatedecline curves or other performance relationships. Reserves attributable to producing wells with limitedproduction history and for undeveloped locations were estimated using performance from analogouswells in the surrounding area and geologic data to assess the reservoir continuity. These wells wereconsidered to be analogous based on production performance from the same formation and completionusing similar techniques.
Qualifications of Responsible Technical Persons
Internal engineer. Eric Niccum, our Executive Vice President and Chief Operating Officer, is thetechnical person primarily responsible for overseeing the preparation of our reserves estimates.Mr. Niccum is also responsible for liaising with and oversight of our third party reserve engineer.Mr. Niccum is a graduate of Purdue University with a Bachelor of Science degree in MechanicalEngineering. He has 20 years of energy experience.
Cawley Gillespie. Cawley, Gillespie & Associates, Inc. is a Texas Registered Engineering Firm(F-693), made up of independent registered professional engineers and geologists. The firm hasprovided petroleum consulting services to the oil and gas industry for over 50 years. No director,officer, or key employee of Cawley Gillespie has any financial ownership in us or any of our affiliates.Cawley Gillespie’s compensation for the required investigations and preparation of its report is notcontingent upon the results obtained and reported, and Cawley Gillespie has not performed other workfor us that would affect its objectivity. The engineering audit presented in the Cawley Gillespie reportwas supervised by W. Todd Brooker, Senior Vice President at Cawley Gillespie. Mr. Brooker is anexperienced reservoir engineer having been a practicing petroleum engineer since 1989. He has morethan 23 years of experience in reserves evaluation and joined Cawley Gillespie as a reserve engineer in1992. He has a Bachelors of Science Degree in Petroleum Engineering from the University of Texas atAustin and is a Registered Professional Engineer in the State of Texas (License No. 83462).
16

Development of Proved Undeveloped Reserves
As of December 31, 2013, none of our proved undeveloped reserves at December 31, 2013 werescheduled to be developed on a date more than five years from the date the reserves were initiallybooked as proved undeveloped. However, certain of our proved undeveloped reserves are associatedwith joint development agreements with third parties that include obligations to drill a specifiedminimum number of wells in a time frame that is shorter than five years. If we do not meet ourobligation to drill the minimum number of wells specified in a joint development agreement, we willlose the right to continue to develop the undeveloped acreage covered by the agreement, which insome cases would result in a reduction in our proved undeveloped reserves. Historically, our drillingand development programs were substantially funded from our cash flow from operations. Ourexpectation is to continue to fund our drilling and development programs primarily from our cash flowfrom operations and projected availability under our senior secured revolving credit facility. Based onour current expectations of our cash flows and drilling and development programs, which includedrilling of proved undeveloped locations, we believe that we can fund the drilling of our currentinventory of proved undeveloped locations and our expansion activities in the next five years from ourcash flow from operations and, if needed, borrowings under our senior secured revolving credit facility.For a more detailed discussion of our liquidity position, please read ‘‘Management’s discussion andanalysis of financial condition and results of operations—Liquidity and capital resources.’’
Our proved undeveloped reserves have decreased from 46.2 MMBoe at December 31, 2012 to39.5 MMBoe at December 31, 2013 due to (i) the conversion of 5.1 MMBoe of proved undevelopedreserves to proved developed reserves; (ii) net negative revisions of 18.1 MMBoe, primarily due to theexpiration of the Company’s JDA with Southridge (15.5 MMBoe) and production performance in theCleveland (3.5 MMBoe); (iii) additions of 8.9 MMBoe from extensions and discoveries; and(iv) additions of 7.6 MMBoe for purchases of minerals in place. Proved undeveloped reserves declinedas a percentage of total reserves from 54% for the year ending December 31, 2012 to 44% for the yearending December 31, 2013. For the year ended December 31, 2013, we converted 5.1 MMBoe ofproved undeveloped reserves to proved developed reserves or 11% of total proved undevelopedreserves booked at December 31, 2012. We incurred approximately $104 million in capital to convertproved undeveloped reserves to proved developed reserves during the year ended December 31, 2013.Our 2013 capital expenditures, excluding acquisitions, totaled $240 million, during which we drilled97 gross wells. We expect our 2014 capital expenditure budget to be approximately $350 million,$310 million of which we expect to use to drill and complete wells. Costs of proved undevelopedreserve development in 2013 do not represent the total costs of these conversions, as additional costsmay have been recorded in previous years. Estimated future development costs relating to thedevelopment of 2013 year-end proved undeveloped reserves is $533 million.
17

Operating Data
The following table sets forth summary data regarding production volumes, average prices andaverage production costs associated with our sale of oil and natural gas for the periods indicated.
Year Ended December 31,
2013 2012 2011
Production and Operating Data:Net Production Volumes(1):
Oil (MBbls) . . . . . . . . . . . . . . . . . . . . . . . . . . . . 1,557 746 811Natural gas (MMcf) . . . . . . . . . . . . . . . . . . . . . . 17,575 14,066 11,443NGLs (MBbls) . . . . . . . . . . . . . . . . . . . . . . . . . . 1,724 1,773 1,215
Total (MBoe) . . . . . . . . . . . . . . . . . . . . . . . . . 6,210 4,863 3,933
Average net production (Boe/d) . . . . . . . . . . . . 17,014 13,287 10,775Average Sales Price(2):
Oil (per Bbl) . . . . . . . . . . . . . . . . . . . . . . . . . . . $ 93.22 $ 89.71 $ 90.96Natural gas (per Mcf) . . . . . . . . . . . . . . . . . . . . . 3.16 2.17 3.49NGLs (per Bbl) . . . . . . . . . . . . . . . . . . . . . . . . . 33.30 29.07 44.04Combined (per Boe) realized . . . . . . . . . . . . . . . . 41.56 30.63 42.53
Average Unit Costs per Boe:Lease operating expense . . . . . . . . . . . . . . . . . . . $ 4.47 $ 4.75 $ 5.48Production tax expense . . . . . . . . . . . . . . . . . . . . 2.07 1.15 1.36Depreciation, depletion and amortization . . . . . . . 18.38 16.60 17.52General and administrative expense(3) . . . . . . . . . 5.14 3.26 4.24
(1) The Lipscomb SE field constituted approximately 26% of our estimated proved reservesas of December 31, 2013. Our production from the Lipscomb SE field was 1,751 MBoeand 36 MBoe for the years ended December 31, 2013 and 2012, respectively. The 2013production was comprised of 858 MBbls of oil, 2,786 MMcf of natural gas and 430 MBblsof NGLs. The 2012 production was comprised of 17 MBbls of oil, 61 MMcf of natural gasand 9 MBbls of NGLs. The Lipscomb SE field was acquired in December 2012, thereforewe had no production from the field for the year ended December 31, 2011.
The Coalgate Woodford field constituted approximately 19% of our estimated provedreserves as of December 31, 2013. Our production from the Coalgate Woodford field was1,158 MBoe, 1,529 MBoe, and 675 MBoe for the years ended December 31, 2013, 2012and 2011, respectively. The 2013 production was comprised of 19 MBbls of oil,4,766 MMcf of natural gas and 345 MBbls of NGLs. The 2012 production was comprisedof 33 MBbls of oil, 4,357 MMcf of natural gas and 770 MBbls of NGLs. The 2011production was comprised of 10 MBbls of oil, 2,029 MMcf of natural gas and 327 MBblsNGLs.
(2) Prices do not include the effects of derivative cash settlements.
(3) General and administrative includes non-cash stock-based compensation of $13.6 million,$0.6 million and $1.1 million for the years ended December 31, 2013, 2012 and 2011,respectively. Excluding stock-based compensation from the above metric results in averagegeneral and administrative cost per Boe of $2.95, $3.15 and $3.95 for the years endedDecember 31, 2013, 2012 and 2011, respectively.
18

Drilling Activity
The following table sets forth information with respect to wells drilled and completed during theperiods indicated. The information should not be considered indicative of future performance, norshould a correlation be assumed between the number of productive wells drilled, quantities of reservesfound or economic value.
Year Ended December 31,
2013 2012 2011
Gross Net Gross Net Gross Net
Development Wells:Productive . . . . . . . . . . . . . . . . . . . . . . . . . 97 61 44 22 71 34Mechanical failure . . . . . . . . . . . . . . . . . . . — — 2 1 — —Dry . . . . . . . . . . . . . . . . . . . . . . . . . . . . . . — — — — — —
Exploratory Wells:Productive . . . . . . . . . . . . . . . . . . . . . . . . . — — — — — —Dry . . . . . . . . . . . . . . . . . . . . . . . . . . . . . . — — 2 1 2 1
Total Wells:Productive . . . . . . . . . . . . . . . . . . . . . . . . . 97 61 44 22 71 34Mechanical failure . . . . . . . . . . . . . . . . . . . — — 2 1 — —Dry . . . . . . . . . . . . . . . . . . . . . . . . . . . . . . — — 2 1 2 1
Total . . . . . . . . . . . . . . . . . . . . . . . . . . . 97 61 48 24 73 34
For the three years ended December 31, 2013, we had no developmental wells that were deemeddry wells and 4 gross (2 net) exploratory wells deemed dry wells. In this same period, we experienced atotal of 2 mechanical failures that were not reservoir related. As of December 31, 2013, there were32 gross (20 net) development wells in the process of drilling or completion. For the three years endedDecember 31, 2013, we drilled 191 gross (115 net) wells as operator with over a 99% success rate.
From January 1, 2013 through December 31, 2013, we successfully drilled 38 gross provedundeveloped wells and completed 29 gross proved undeveloped wells.
Productive Wells
The following table sets forth our total gross and net productive wells by oil or natural gascompletion as of December 31, 2013.
Oil Natural Gas Total
Gross Net Gross Net Gross Net
Operated(1) . . . . . . . . . . . . . . . . . . . . . . . . 175 137 312 233 487 370Non-operated . . . . . . . . . . . . . . . . . . . . . . . 57 14 291 31 348 45
Total . . . . . . . . . . . . . . . . . . . . . . . . . . . . 232 151 603 264 835 415
(1) Includes wells on which we act as contract operator.
Gross wells are the total number of producing wells in which we own an interest, and net wells arethe sum of our fractional working interests owned in gross wells.
Acreage Data
The following table sets forth certain information regarding the developed and undevelopedacreage in which we have an interest as of December 31, 2013 for each of our producing areas.
19

Acreage related to royalty, overriding royalty and other similar interests is excluded from this summary.Acreage that is prospective for the Tonkawa, Marmaton and other formations is included in these totalsas these formations overlie one another throughout much of our acreage. As of December 31, 2013,over 78% of our leasehold acreage was held by existing production.
Developed Acres Undeveloped Acres Total
Gross Net Gross Net Gross Net
Cleveland . . . . . . . . . . . . . 119,007 73,408 33,976 17,968 152,983 91,376Woodford(1) . . . . . . . . . . . 8,889 2,533 5,695 1,306 14,584 3,839Granite Wash . . . . . . . . . . 14,361 6,595 — — 14,361 6,595Other . . . . . . . . . . . . . . . . 21,610 7,534 14,999 5,732 36,609 13,266
All properties(2) . . . . . . . 163,867 90,070 54,670 25,006 218,537 115,076
(1) Excludes gross and net acreage associated with the joint development agreements withVanguard. Acreage associated with the Vanguard joint development agreement is assignedto us at the time the first well in each unit is pooled and/or drilled.
(2) Includes proved undeveloped reserves associated with joint development agreements withthird parties. If we do not meet our obligation to drill the minimum number of wellsspecified in a joint development agreement, we will lose the right to continue to developthe undeveloped acreage covered by the agreement, which would result in the loss of anyproved undeveloped reserves attributable to such undeveloped acreage. Please see ‘‘RiskFactors—If we do not fulfill our obligation to drill the minimum number of wellsspecified in our joint development agreements, we will lose the right to develop theundeveloped acreage associated with the agreement and any proved undeveloped reservesattributable to such undeveloped acreage.’’
Undeveloped acreage expirations
The following table sets forth the number of gross and net undeveloped acres as of December 31,2013 that will expire over the next three years by operating area unless production is established withinthe spacing units covering the acreage prior to the expiration dates or unless the existing leases arerenewed prior to expiration.
Expiring 2014 Expiring 2015 Expiring 2016
Gross Net Gross Net Gross Net
Cleveland . . . . . . . . . . . . . . . . . . . . . 6,048 2,766 5,545 4,232 3,585 2,442Woodford . . . . . . . . . . . . . . . . . . . . . 2,517 299 3,506 662 566 164Granite Wash . . . . . . . . . . . . . . . . . . — — — — — —Other . . . . . . . . . . . . . . . . . . . . . . . . 142 27 — — 854 437
All properties . . . . . . . . . . . . . . . . 8,707 3,092 9,051 4,894 5,005 3,043
A majority of the leases comprising the acreage set forth in the table above will expire at the endof their respective primary terms unless production from the acreage has been established prior to suchdate, in which event the lease will remain in effect until the cessation of production in commercialquantities. We also have options to extend some of our leases through payment of additional leasebonus payments prior to the expiration of the primary term of the leases. In addition, we may attemptto secure a new lease upon the expiration of certain of our acreage; however, there may be third partyleases that become effective immediately if our leases expire at the end of their respective terms andproduction has not been established prior to such date. We do not have any of our proved undevelopedreserves as of December 31, 2013 attributed to acreage whose lease expiration date precedes the
20
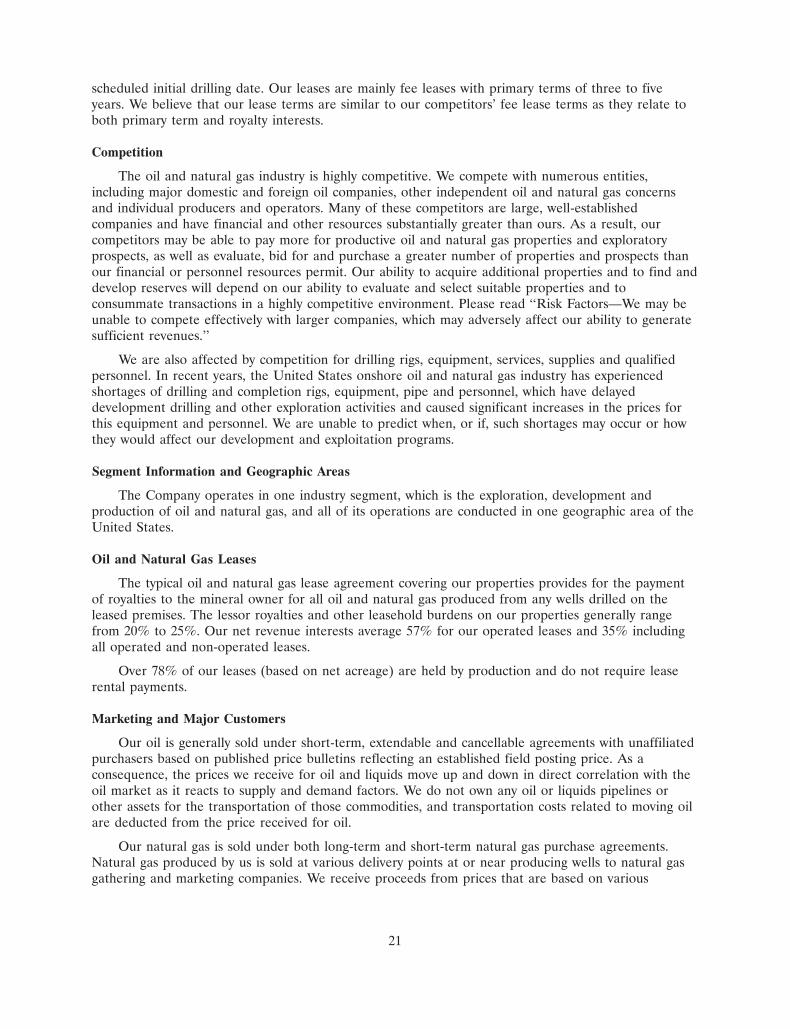
scheduled initial drilling date. Our leases are mainly fee leases with primary terms of three to fiveyears. We believe that our lease terms are similar to our competitors’ fee lease terms as they relate toboth primary term and royalty interests.
Competition
The oil and natural gas industry is highly competitive. We compete with numerous entities,including major domestic and foreign oil companies, other independent oil and natural gas concernsand individual producers and operators. Many of these competitors are large, well-establishedcompanies and have financial and other resources substantially greater than ours. As a result, ourcompetitors may be able to pay more for productive oil and natural gas properties and exploratoryprospects, as well as evaluate, bid for and purchase a greater number of properties and prospects thanour financial or personnel resources permit. Our ability to acquire additional properties and to find anddevelop reserves will depend on our ability to evaluate and select suitable properties and toconsummate transactions in a highly competitive environment. Please read ‘‘Risk Factors—We may beunable to compete effectively with larger companies, which may adversely affect our ability to generatesufficient revenues.’’
We are also affected by competition for drilling rigs, equipment, services, supplies and qualifiedpersonnel. In recent years, the United States onshore oil and natural gas industry has experiencedshortages of drilling and completion rigs, equipment, pipe and personnel, which have delayeddevelopment drilling and other exploration activities and caused significant increases in the prices forthis equipment and personnel. We are unable to predict when, or if, such shortages may occur or howthey would affect our development and exploitation programs.
Segment Information and Geographic Areas
The Company operates in one industry segment, which is the exploration, development andproduction of oil and natural gas, and all of its operations are conducted in one geographic area of theUnited States.
Oil and Natural Gas Leases
The typical oil and natural gas lease agreement covering our properties provides for the paymentof royalties to the mineral owner for all oil and natural gas produced from any wells drilled on theleased premises. The lessor royalties and other leasehold burdens on our properties generally rangefrom 20% to 25%. Our net revenue interests average 57% for our operated leases and 35% includingall operated and non-operated leases.
Over 78% of our leases (based on net acreage) are held by production and do not require leaserental payments.
Marketing and Major Customers
Our oil is generally sold under short-term, extendable and cancellable agreements with unaffiliatedpurchasers based on published price bulletins reflecting an established field posting price. As aconsequence, the prices we receive for oil and liquids move up and down in direct correlation with theoil market as it reacts to supply and demand factors. We do not own any oil or liquids pipelines orother assets for the transportation of those commodities, and transportation costs related to moving oilare deducted from the price received for oil.
Our natural gas is sold under both long-term and short-term natural gas purchase agreements.Natural gas produced by us is sold at various delivery points at or near producing wells to natural gasgathering and marketing companies. We receive proceeds from prices that are based on various
21

pipeline indices less any associated fees. For approximately 98% of our natural gas production, we arepaid for the extracted NGLs based on a negotiated percentage of the proceeds that are generated fromthe customer’s sale of the liquids, or based on other negotiated pricing arrangements. We do not ownany natural gas pipelines or other assets for the transportation of natural gas.
Recently, changes in NGL prices have altered market conditions. Due primarily to the large supplyof ethane on the market, the price of ethane has dropped significantly over the last year. For adiscussion of the effect of recent changes in NGL prices, see ‘‘Management’s Discussion and Analysisof Financial Condition and Results of Operations—Outlook.’’
During the year ended December 31, 2013, the largest purchasers were PVR Midstream,Unimark LLC, Mercuria, Valero, and Plains Marketing, which accounted for approximately 15%, 13%,13%, 13% and 6% of consolidated oil and gas sales, respectively. If we were to lose any one of ourcustomers, the loss could temporarily delay production and sale of our oil and natural gas in therelated producing region. If we were to lose any single customer, we believe we could identify asubstitute customer to purchase the impacted production volumes. However, if one or more of ourlarger customers ceased purchasing oil or natural gas altogether, the loss of such customer could have adetrimental effect on our production volumes in general and on our ability to find substitute customersto purchase our production volumes. For a discussion of the risks associated with the loss of keycustomers, please read ‘‘Risk factors—Our customer base is concentrated, and the loss of any one ofour key customers could, therefore, adversely affect our financial condition and results of operations.’’
Seasonality
Generally, but not always, the demand for natural gas decreases during the summer months andincreases during the winter months, resulting in seasonal fluctuations in the price we receive for ournatural gas production. Seasonal anomalies such as mild winters or hot summers sometimes lessen thisfluctuation.
Title to Properties
Prior to completing an acquisition of producing oil and natural gas properties, we perform titlereviews on significant leases, and depending on the materiality of properties, we may obtain a titleopinion or review previously obtained title opinions. As a result, title examinations have been obtainedon a significant portion of our properties.
As is customary in the oil and natural gas industry, we initially conduct only a cursory review ofthe titles to our properties on which we do not have proved reserves. Prior to the commencement ofdrilling operations on those properties, we conduct a thorough title examination and perform curativework with respect to significant defects. To the extent title opinions or other investigations reflect titledefects on those properties, we are typically responsible for curing any title defects at our expense. Wegenerally will not commence drilling operations on a property until we have cured any material titledefects on such property.
We conduct a portion of our operations through joint development agreements with third parties.Certain of our joint development agreements include drill-to-earn arrangements, whereby we areassigned title to properties from the third party after we complete wells and, in the case of certaincounterparties, after completion reports relating to the wells have been approved by regulatoryauthorities, whose approval may be delayed. Furthermore, certain of our joint development agreementsspecify that assignments are only to occur when the wells are capable of producing hydrocarbons inpaying quantities. These additional conditions to assignment of title may from time to time apply towells of substantial value.
22

We believe that we have satisfactory title to all of our material assets. Although title to theseproperties is subject to encumbrances in some cases, such as customary interests generally retained inconnection with the acquisition of real property, customary royalty interests and contract terms andrestrictions, liens under operating agreements, liens related to environmental liabilities associated withhistorical operations, liens for current taxes and other burdens, easements, restrictions and minorencumbrances customary in the oil and natural gas industry, we believe that none of these liens,restrictions, easements, burdens and encumbrances will materially detract from the value of theseproperties or from our interest in these properties or materially interfere with our use of theseproperties in the operation of our business. In addition, we believe that we have obtained sufficientrights-of-way grants and permits from public authorities and private parties for us to operate ourbusiness in all material respects as described in this Annual Report on Form 10-K.
Regulations
Our operations are substantially affected by federal, state and local laws and regulations. Inparticular, natural gas production and related operations are, or have been, subject to price controls,taxes and numerous other laws and regulations. All of the jurisdictions in which we own or operateproducing oil and natural gas properties have statutory provisions regulating the exploration for andproduction of oil and natural gas, including provisions related to permits for the drilling of wells,bonding requirements to drill or operate wells, the location of wells, the method of drilling and casingwells, the surface use and restoration of properties upon which wells are drilled, sourcing and disposalof water used in the drilling and completion process, and the abandonment of wells. Our operationsare also subject to various conservation laws and regulations. These include the regulation of the size ofdrilling and spacing units or proration units, the number of wells which may be drilled in an area, andthe unitization or pooling of wells, as well as regulations that generally prohibit the venting or flaring ofnatural gas, and impose certain requirements regarding the ratability or fair apportionment ofproduction from fields and individual wells. The effect of these regulations is to limit the amount of oiland natural gas that we can produce from our wells and limit the number of wells or locations at whichwe can drill, although we can apply for exceptions to such regulations or to have reductions in wellspacing. Moreover, each state generally imposes a production or severance tax with respect to theproduction and sale of oil, natural gas and NGLs within its jurisdiction.
Failure to comply with applicable laws and regulations can result in substantial penalties. Theregulatory burden on the industry increases the cost of doing business and affects profitability.Although we believe we are in substantial compliance with all applicable laws and regulations, suchlaws and regulations are frequently amended or reinterpreted. Therefore, we are unable to predict thefuture costs or impact of compliance. Additional proposals and proceedings that affect the oil andnatural gas industry are regularly considered by Congress and federal agencies, the states, and thecourts. We cannot predict when or whether any such proposals may become effective. Our competitorsin the oil and natural gas industry are subject to the same regulatory requirements and restrictions thataffect our operations.
Environmental Matters and Regulation
Our operations are subject to stringent and complex federal, state and local laws and regulationsthat govern the protection of the environment, as well as the discharge of materials into theenvironment. These laws and regulations may, among other things:
• require the acquisition of various permits before drilling commences;
• require the installation of pollution control equipment in connection with operations;
• restrict or prohibit our drilling and production activities during periods when such activitiesmight affect wildlife;
23

• place restrictions or regulations upon the types, quantities or concentrations of materials orsubstances used in our operations;
• restrict the types, quantities or concentrations of various substances that can be released into theenvironment or used in connection with drilling, production and transportation activities;
• limit or prohibit drilling activities on lands lying within wilderness, wetlands and other protectedareas; and
• require remedial measures to mitigate pollution from former and ongoing operations, such assite restoration, pit closure and plugging of abandoned wells.
These laws, rules and regulations may also restrict the rate of oil and natural gas production belowthe rate that would otherwise be possible. The regulatory burden on the oil and natural gas industryincreases the cost of doing business in the industry and consequently affects profitability. Additionally,federal, state and local lawmakers and agencies frequently revise environmental laws and regulations,and such changes could result in increased costs for environmental compliance, such as waste handling,permitting, or cleanup for the oil and natural gas industry and could have a significant impact on ouroperating costs.
The following is a summary of some of the existing laws, rules and regulations to which ourbusiness operations are subject.
Solid and Hazardous Waste Handling and Releases
The federal Resource Conservation and Recovery Act, or RCRA, and comparable state statutesregulate the generation, transportation, treatment, storage, disposal and cleanup of hazardous andnon-hazardous waste. Drilling fluids, produced waters, and most of the other wastes associated with theexploration, development, production and transportation of oil and gas are currently excluded fromregulation as hazardous wastes under RCRA. In the course of our operations, however, we generatesome industrial wastes, such as paint wastes, waste solvents, and waste oils, which may be regulated ashazardous wastes. Although a substantial amount of the waste generated in our operations areregulated as non-hazardous solid waste rather than hazardous waste, there is no guarantee that theEPA or individual states will not adopt more stringent requirements for the handling of non-hazardouswaste. Moreover, it is possible that certain oil and gas exploration and production wastes now classifiedas non-hazardous could be classified as hazardous wastes in the future. Any such change could result inan increase in our costs to manage and dispose of waste, which could have a material adverse effect onour results of operations and financial position.
The Comprehensive Environmental Response, Compensation and Liability Act, or CERCLA, alsoknown as ‘‘Superfund,’’ and comparable state laws and regulations impose liability without regard tofault or legality of the original conduct, on certain classes of persons with respect to the release intothe environment of substances designated under CERCLA as hazardous substances. These classes ofpersons, or so-called potentially responsible parties, or PRPs, include the current and past owners oroperators of a site where the release occurred and anyone who disposed or arranged for the disposal ofa hazardous substance released at the site. Under CERCLA, such persons may be subject to joint andseveral, strict liability for the costs of cleaning up the hazardous substances that have been releasedinto the environment, for damages to natural resources and for the costs of certain health studies.CERCLA also authorizes the U.S. Environmental Protection Agency, or the EPA, and, in someinstances, third parties to take actions in response to threats to public health or the environment and toseek to recover from the PRPs the costs of such action. Many states have adopted comparable or morestringent state statutes. In addition, it is not uncommon for neighboring landowners and other thirdparties to file claims for personal injury and property damage allegedly caused by the hazardoussubstances released into the environment.
24

Although CERCLA generally exempts ‘‘petroleum’’ from the definition of hazardous substance, inthe course of our operations, we have generated and will generate wastes that may fall withinCERCLA’s definition of hazardous substances and may have disposed of these wastes at disposal sitesowned and operated by others. We may also be the owner or operator of sites on which hazardoussubstances have been released. To our knowledge, neither we nor our predecessors have beendesignated as a PRP by the EPA under CERCLA; we also do not know of any prior owners oroperators of our properties that are named as PRPs related to their ownership or operation of suchproperties. In the event contamination is discovered at a site on which we are or have been an owneror operator or to which we sent hazardous substances, we could be liable for the costs of investigationand remediation and natural resources damages.
We currently own, lease, or operate numerous properties that have been used for oil and naturalgas exploration and production for many years. Although we believe we have utilized operating andwaste disposal practices that were standard in the industry at the time, hazardous substances, wastes orhydrocarbons may have been released on or under the properties owned or leased by us, or on orunder other locations, including offsite locations, where such substances have been taken for disposal.In addition, some of these properties have been operated by third parties or by previous owners oroperators whose treatment and disposal of hazardous substances, wastes, or hydrocarbons were notunder our control. These properties and the substances disposed or released on them may be subject tothe RCRA, CERCLA, and analogous state laws. Spills or other contamination required to beremediated has not required material capital expenditures to date. In the future, we could be requiredto remediate property, including groundwater, containing or impacted by previously disposed wastes(including wastes disposed or released by prior owners or operators, or property contamination,including groundwater contamination by prior owners or operators) or to perform remedial pluggingoperations to prevent future or mitigate existing contamination.
Clean Water Act
The Federal Water Pollution Control Act, or the Clean Water Act, and analogous state lawsimpose restrictions and strict controls with respect to the discharge of pollutants, including spills andleaks of produced water and other oil and natural gas wastes, into waters of the United States, a termbroadly defined. The discharge of pollutants into regulated waters is prohibited, except in accordancewith the terms of a permit issued by EPA or an analogous state agency. The Clean Water Act alsoprohibits the discharge of dredge and fill material in regulated waters, including wetlands, unlessauthorized by a permit issued by the U.S. Army Corps of Engineers. Federal and state regulatoryagencies can impose administrative, civil and criminal penalties, as well as require remedial ormitigation measures, for non-compliance with discharge permits or other requirements of the CleanWater Act and analogous state laws and regulations. In the event of an unauthorized discharge ofwastes, we may be liable for penalties and costs. The EPA has announced its intention to proposeregulations by 2014 under the Clean Water Act to develop standards for wastewater discharges fromhydraulic fracturing and other natural gas production activities.
Safe Drinking Water Act
The SDWA regulates, among other things, underground injection operations. Congress hasconsidered legislation which, if successful, would impose additional regulation under the SDWA uponthe use of hydraulic fracturing fluids. If enacted, such legislation could impose on our hydraulicfracturing operations permit and financial assurance requirements, requirements that we adhere toconstruction specifications, fulfill monitoring, reporting and recordkeeping obligations, and meetplugging and abandonment requirements. In addition to subjecting the injection of hydraulic fracturingto the SDWA regulatory and permitting requirements, the proposed legislation would require thedisclosure of the chemicals within the hydraulic fluids, which could make it easier for third parties
25

opposing hydraulic fracturing to initiate legal proceedings based on allegations that specific chemicalsused in the process could adversely affect ground water. In addition, the EPA has taken the positionthat hydraulic fracturing with fluids containing diesel fuel is subject to the Underground InjectionControl program in states in which EPA is the permitting authority and released permitting guidanceon the use of diesel fuel as an additive in hydraulic fracturing fluids in February 2014. The EPA hasalso commenced a study of the potential adverse effects that hydraulic fracturing may have on waterquality and public health, and a committee of the U.S. House of Representatives has commenced itsown investigation into hydraulic fracturing practices. The Department of Energy, at the direction of thePresident, also studied hydraulic fracturing and provided broad recommendations regarding bestpractices and other steps to enhance companies’ safety and environmental performance of hydraulicfracturing. If the pending or similar legislation is enacted or other new requirements or restrictionsregarding hydraulic fracturing are adopted as a result of these studies, we could incur substantialcompliance costs and the requirements could negatively impact our ability to conduct fracturingactivities on our assets.
Other Regulation of Hydraulic Fracturing
On November 23, 2011, the EPA announced that it was granting in part a petition to initiaterulemaking under the Toxic Substances Control Act, relating to chemical substances and mixtures usedin oil and gas exploration and production. Also, BLM is considering proposed rules regarding wellstimulation, chemical disclosures, and other requirements for hydraulic fracturing on federal and Indianlands. BLM released a proposed rule requiring the disclosure of chemicals used during hydraulicfracturing and addressing drilling plans, water management, and wastewater disposal on federal andIndian lands in May 2012. However, BLM pulled back its proposal in January 2013 after reviewingcomments and published an updated proposed rule on May 24, 2013. President Obama created theInteragency Working Group on Unconventional Natural Gas and Oil by Executive Order on April 13,2012, which is charged with coordinating and aligning federal agency research and scientific studies onunconventional natural gas and oil resources.
Hydraulic fracturing is also subject to regulation at the state and local levels. Several states haveproposed or adopted legislative or administrative rules regulating hydraulic fracturing operations. Forexample, the Railroad Commission of Texas, implementing a state law passed in June 2011, adoptedthe Hydraulic Fracturing Chemical Disclosure Rule on December 13, 2011. The rule requires publicdisclosure of chemicals in fluids used in the hydraulic fracturing process for drilling permits issued afterFebruary 1, 2012. Additionally, Texas has authorized the Texas Commission on Environmental Qualityto suspend water use rights for oil and gas users in the event of serious drought conditions and hasimposed more stringent emissions, monitoring, inspection, maintenance, and repair requirements onBarnett Shale operators to minimize Volatile Organic Compound, or VOC, releases. Other states thatwe operate in, including Louisiana and Oklahoma, have adopted similar chemical disclosure measures.Please see ‘‘Risk Factors—Federal and state legislative and regulatory initiatives relating to hydraulicfracturing and other oil and gas production activities as well as governmental reviews of such activitiescould result in increased costs, additional operating restrictions or delays, which could adversely affectour production’’ for a further discussion of state hydraulic fracturing regulation. In addition to statelaws, local land use restrictions, such as city ordinances, may restrict or prohibit the performance ofwell drilling in general and/or hydraulic fracturing in particular.
Oil Pollution Act
The primary federal law related to oil spill liability is the Oil Pollution Act, or the OPA, whichamends and augments oil spill provisions of the Clean Water Act and imposes certain duties andliabilities on certain ‘‘responsible parties’’ related to the prevention of oil spills and damages resultingfrom such spills in or threatening United States waters or adjoining shorelines. For example, operators
26

of certain oil and gas facilities must develop, implement and maintain facility response plans, conductannual spill training for certain employees and provide varying degrees of financial assurance. A liable‘‘responsible party’’ includes the owner or operator of a facility, vessel or pipeline that is a source of anoil discharge or that poses the substantial threat of discharge, or in the case of offshore facilities, thelessee or permittee of the area in which a discharging facility is located. OPA assigns strict joint andseveral liability, without regard to fault, to each liable party for oil removal costs and a variety of publicand private damages. Although defenses exist to the liability imposed by OPA, they are limited. In theevent of an oil discharge or substantial threat of discharge, we may be liable for costs and damages.
Air Emissions
Our operations may be subject to the Clean Air Act, or CAA, and comparable state and localrequirements for the control of emissions from sources of air pollution. Federal and state laws requirenew and modified sources of air pollutants to obtain permits prior to commencing construction. Majorsources of air pollutants are subject to more stringent, federally imposed requirements includingadditional permits. Federal and state laws designed to control hazardous (toxic) air pollutants, mightrequire installation of additional controls. Administrative enforcement actions for failure to complystrictly with air pollution regulations or permits are generally resolved by payment of monetary finesand correction of any identified deficiencies. Alternatively, regulatory agencies could bring lawsuits forcivil penalties or injunctions or require us to forego construction, modification or operation of certainair emission sources.
We may incur expenditures in the future for air pollution control equipment in connection withobtaining or maintaining operating permits and approvals for air emissions. For instance, on April 17,2012, the EPA released final rules that establish new air emission controls for oil and natural gasproduction and natural gas processing operations. The rules became effective on October 15, 2012.Specifically, the EPA’s rule package includes New Source Performance Standards to address emissionsof sulfur dioxide and volatile organic compounds, and a separate set of emission standards to addresshazardous air pollutants frequently associated with oil and natural gas production and processingactivities. The rules establish specific requirements regarding emissions from compressors, dehydrators,storage tanks and other production equipment in addition to leak detection requirements for naturalgas processing plants. In October 2012, several challenges to the EPA’s rules were filed by variousparties, including environmental groups and industry associations. In a January 16, 2013 unopposedmotion to hold this litigation in abeyance, the EPA indicated that it may reconsider some aspects of therules. The case remains in abeyance. EPA issued a final rule revising certain aspects of the rules onAugust 5, 2013 and has indicated that it may reconsider other aspects of the rules. Depending on theoutcome of such judicial proceedings and regulatory actions, the rules may be further modified orrescinded or the EPA may issue new rules. Additionally, on December 11, 2012, seven states submitteda notice of intent to sue the EPA to compel the agency to make a determination as to whetherstandards of performance limiting methane emissions from oil and gas sources are appropriate, and, ifso, to promulgate performance standards for methane emissions from the oil and gas sector, which wasnot addressed in the EPA rules that became effective on October 15, 2012. The notice of intent alsorequested the EPA issue emission guidelines for the control of methane emissions from existing oil andgas sources. These rules that took effect on October 15, 2012, as well as any modifications to theserules or additional rules, could require a number of modifications to our operations including theinstallation of new equipment.
Endangered Species and Migratory Birds
The Endangered Species Act, or ESA, restricts activities that may affect endangered or threatenedspecies or their habitats. Pursuant to the ESA, if a species is listed as threatened or endangered,restrictions may be imposed on activities adversely affecting that species or its habitat. Similar
27

protections are offered to migratory birds under the Migratory Bird Treaty Act. Criminal liability canattach for even an incidental taking of migratory birds, and the federal government recently issuedindictments under the Migratory Bird Treaty Act to several oil and gas companies after dead migratorybirds were found near reserve pits associated with drilling activities.
We conduct operations in areas where certain species that are listed as threatened or endangeredunder the ESA may be present. For example, our operations in Oklahoma overlap with the range ofthe American Burying Beetle, which is listed as endangered. The presence of endangered or threatenedspecies may force us to modify or terminate our operations in certain areas. Additionally, thedesignation of previously unidentified endangered or threatened species could cause us to incuradditional costs or become subject to operating restrictions or bans or limit future development activityin the affected areas. For example, the U.S. Fish and Wildlife Service proposed on December 11, 2012,to list the Lesser Prairie Chicken as a threatened species under the Endangered Species Act. Theperiod for the public to submit comments on this proposal initially was set to expire on March 11, 2013but, in response to requests submitted by federal congressmen, the Fish and Wildlife Service reopenedthe comment period on May 6, 2013. A final decision regarding whether to finalize the proposal isexpected by March 30, 2014. The listing of the Lesser Prairie Chicken, or any other species in areasthat we operate, could force us to incur additional costs and delay or otherwise limit our operations.
National Environmental Policy Act
Oil and natural gas exploration and production activities on federal lands may be subject to theNational Environmental Policy Act, or NEPA, which requires federal agencies, including theDepartment of Interior, to evaluate major agency actions having the potential to significantly impactthe environment. In the course of such evaluations, an agency will prepare an EnvironmentalAssessment that assesses the potential direct, indirect and cumulative impacts of a proposed projectand, if necessary, will prepare a more detailed Environmental Impact Statement that may be madeavailable for public review and comment. All of our current exploration and production activities, aswell as proposed exploration and development plans, on federal lands require governmental permitsthat are subject to the requirements of NEPA. This process has the potential to delay or imposeadditional conditions upon the development of oil and natural gas projects.
Climate Change
More stringent laws and regulations relating to climate change and greenhouse gases, or GHGs,may be adopted in the future and could cause us to incur material expenses in complying with them.Both houses of Congress have actively considered legislation to reduce emissions of GHGs, but nolegislation has yet passed. In the absence of comprehensive federal legislation on GHG emissioncontrol, the EPA has begun to regulate GHGs as pollutants under the CAA. The EPA has adoptedregulations affecting emissions of GHGs from motor vehicles and is also requiring permit review forGHGs from certain stationary sources that emit GHGs at levels above statutory and regulatorythresholds. In June 2010, the EPA adopted the Prevention of Significant Deterioration and Title VGreenhouse Gas Tailoring Rule, which sets regulatory emissions thresholds for stationary sources ofGHGs under the Prevention of Significant Deterioration (PSD) and Title V programs. PSD permittinghas been applicable to new and modified stationary sources that emit GHGs above statutory andregulatory thresholds since January 2, 2011. The EPA has announced its intent to consider lowering theTailoring Rule regulatory thresholds, which would likely subject additional stationary sources to GHGpermitting requirements under the PSD and Title V programs. We do not believe our operations arecurrently subject to these permitting requirements, but if our operations become subject to these orother similar requirements, we could incur significant costs to control our emissions and comply withregulatory requirements.
28

In addition, the EPA has adopted a mandatory GHG emissions reporting program that imposesreporting and monitoring requirements on various types of facilities and industries. On November 9,2010, the EPA issued final rules to expand its existing GHG reporting rule to include onshore oil andnatural gas production, processing, transmission, storage, and distribution facilities. Reporting was firstrequired in 2012 for emissions occurring in 2011. Our operations are not currently subject to thisprogram, but there is no guarantee that the EPA will not expand the program to additional sources andfacilities. Should we be required to report GHG emissions, it could require us to incur costs tomonitor, keep records of, and report emissions of GHGs.
The EPA has also proposed the first New Source Performance Standards (NSPS) for GHGemissions. The proposed GHG NSPS applies to carbon dioxide emissions from certain electric utilitygenerating units. This proposed NSPS does not regulate our operations, but if EPA were to promulgatea GHG NSPS applicable to our operations we could incur significant costs to control our emissions andcomply with regulatory requirements.
Because of the lack of any comprehensive legislative program addressing GHGs, there iscontinuing uncertainty regarding the further development of federal regulation of GHG-emittingsources. Additionally, more than 20 states, either individually or as part of regional initiatives, havebegun taking actions to control and/or reduce GHG emissions primarily through the planneddevelopment of GHG emission inventories and/or regional GHG cap and trade programs. Most ofthese cap and trade programs work by requiring major sources of emissions to acquire and surrenderemission allowances. The federal, regional and local regulatory initiatives also could adversely affect themarketability of the oil and natural gas we produce. The impact of such future programs cannot bepredicted, but we do not expect our operations to be affected any differently than other similarlysituated domestic competitors.
In addition to legislative and regulatory developments, plaintiffs have brought judicial actionsunder common law theories against greenhouse gas emitting companies in recent years. For example,municipal plaintiffs in Kivalina v. ExxonMobil Corporation, et al, alleged that the defendantcorporations’ contributions to global warming caused property damage associated with rising sea levels.Although the plaintiffs in Kivalina were ultimately unsuccessful, there is a continuing litigation riskassociated with greenhouse gas-emitting activities.
OSHA and Other Laws and Regulation
We are subject to the requirements of the federal Occupational Safety and Health Act, or OSHA,and comparable state statutes. These laws and the implementing regulations strictly govern theprotection of the health and safety of employees. The OSHA hazard communication standard, the EPAcommunity right- to- know regulations under the Title III of CERCLA and similar state statutesrequire that we organize and/or disclose information about hazardous materials used or produced inour operations and that this information be provided to employees, state and local governmentauthorities and citizens. We believe that we are in substantial compliance with these applicablerequirements and with other OSHA and comparable requirements.
We believe that we are in substantial compliance with all existing environmental laws andregulations applicable to our current operations and that our continued compliance with existingrequirements will not have a material adverse impact on our financial condition and results ofoperations. We did not incur any material capital expenditures for remediation or pollution controlactivities for the years ended December 31, 2013 or 2012. Additionally, we are not aware of anyenvironmental issues or claims that will require material capital expenditures during 2014 or that willotherwise have a material impact on our financial position or results of operations in the future.However, we cannot assure you that the passage of more stringent laws and regulations in the futurewill not have a negative impact our business activities, financial condition or results of operations.
29

Offices
We currently lease approximately 31,000 square feet of office space in Austin, Texas at 807 LasCimas Parkway, Austin, Texas 78746, where our principal offices are located. The primary lease expiresin April 2017. We also lease field offices in Canadian, Texas and McAlester, Oklahoma.
Employees
As of December 31, 2013, we had 91 employees, including 31 technical (geosciences, engineering,land), 22 field operations, 29 corporate (finance, accounting, planning, business development, IT, officemanagement) and 9 management. None of these employees are represented by labor unions or coveredby any collective bargaining agreement. We consider our relations with our employees to besatisfactory. From time to time we utilize the services of independent contractors to perform variousfield and other services as needed.
Available information
We are required to file annual, quarterly and current reports, proxy statements and otherinformation with the SEC. Our reports filed with the SEC are made available to read and copy at theSEC’s Public Reference Room at 100 F Street, N.E., Washington, D.C., 20549. You may obtaininformation about the Public Reference Room by contacting the SEC at 1-800-SEC-0330. Reports filedwith the SEC are also made available on its website at www.sec.gov.
Our common stock is listed and traded on the New York Stock Exchange under the symbol‘‘JONE.’’ Our reports, proxy statements and other information filed with the SEC can also be inspectedand copied at the New York Stock Exchange, 20 Broad Street, New York, New York 10005.
Through our website, www.jonesenergy.com, you can access, free of charge, electronic copies of allof the documents that we file with the SEC, including our annual reports on Form 10-K, quarterlyreports on Form 10-Q and current reports on Form 8-K, as well as any amendments to these reports.
Item 1A. Risk Factors
Our business involves a high degree of risk. If any of the following risks, or any risks describedelsewhere in this Annual Report on Form 10-K, were actually to occur, our business, financial condition orresults of operations could be materially adversely affected and the trading price of our shares could declineresulting in the loss of part or all of your investment. The risks described below are not the only ones facingus. Additional risks not presently known to us or which we currently consider immaterial may also adverselyaffect us.
Drilling for and producing oil, natural gas and NGLs are high risk activities with many uncertainties thatcould adversely affect our business, financial condition or results of operations.
Our future financial condition and results of operations will depend on the success of ourexploration, exploitation, development and production activities. Our oil, natural gas and NGLsexploitation, development and production activities are subject to numerous risks beyond our control,including the risk that drilling will not result in commercially viable oil and natural gas production. Ourdecisions to purchase, explore, develop or otherwise exploit locations or properties will depend in parton the evaluation of information obtained through geophysical and geological analyses, production dataand engineering studies, the results of which are often inconclusive or subject to varying interpretations.In addition, our cost of drilling, completing and operating wells is often uncertain before drilling
30

commences. Further, many factors may curtail, delay or cancel our scheduled drilling projects, includingthe following:
• delays imposed by or resulting from compliance with regulatory and contractual requirementsand related lawsuits, which may include limitations on hydraulic fracturing or the discharge ofgreenhouse gases;
• pressure or irregularities in geological formations;
• shortages of or delays in obtaining equipment and qualified personnel;
• equipment failures or accidents;
• fires and blowouts;
• adverse weather conditions, such as hurricanes, blizzards and ice storms;
• declines in oil, natural gas and NGL prices;
• limited availability of financing at acceptable rates;
• title problems; and
• limitations in the market for oil, natural gas and NGLs.
Part of our strategy involves using some of the latest available horizontal drilling and completion techniques,which involve risks and uncertainties in their application.
Our operations involve utilizing some of the latest drilling and completion techniques as developedby us and our service providers. Risks that we face while drilling include, but are not limited to, thefollowing:
• landing our wellbore in the desired drilling zone;
• staying in the desired drilling zone while drilling horizontally through the formation;
• running our casing the entire length of the wellbore; and
• running tools and other equipment consistently through the horizontal wellbore.
Risks that we face while completing our wells include, but are not limited to, the following:
• the ability to fracture stimulate the planned number of stages;
• the ability to run tools the entire length of the wellbore during completion operations; and
• the ability to successfully clean out the wellbore after completion of the final fracture stimulationstage.
The results of our drilling in new or emerging formations are more uncertain initially than drillingresults in areas that are more developed and have a longer history of established production. Newer oremerging formations and areas have limited or no production history and, consequently, we are morelimited in assessing future drilling results in these areas.
The value of our undeveloped acreage could decline if drilling results are unsuccessful.
The success of our horizontal drilling and completion techniques can only be evaluated over timeas more wells are drilled and production profiles are established over a sufficiently long time period. Ifour drilling results are less than anticipated or we are unable to execute our drilling program becauseof capital constraints, lease expirations, access to gathering systems, declines in oil, natural gas andNGL prices and/or other factors, the return on our investment in these areas may not be as attractive
31

as we anticipate. Further, as a result of any of these developments we could incur material write-downsof our oil and gas properties and the value of our undeveloped acreage could decline in the future.
Our business requires substantial capital expenditures, and we may be unable to obtain needed capital orfinancing on satisfactory terms or at all.
Our exploration, exploitation, development and acquisition activities require substantial capitalexpenditures. Our total capital expenditures for 2013 were $240 million and our budgeted capitalexpenditures for 2014 are $350 million. Historically, we have funded development and operatingactivities primarily through a combination of equity capital raised from a private equity partner and ourinitial public offering, through borrowings under our bank credit facilities and through internaloperating cash flows. We intend to finance the majority of our capital expenditures predominantly withcash flows from operations. If necessary, we may also access capital through proceeds from potentialasset dispositions, borrowings under our credit facilities and the issuance of debt and equity securities.Our cash flow from operations and access to capital are subject to a number of variables, including:
• the estimated quantities of our oil, natural gas and NGL reserves;
• the amount of oil, natural gas and NGLs we produce from existing wells;
• the prices at which we sell our production;
• the costs of developing and producing our oil, natural gas and NGL reserves;
• take-away capacity;
• our ability to acquire, locate and produce new reserves;
• the ability and willingness of banks to lend to us; and
• our ability to access the equity and debt capital markets.
If our cash flow from operations is not sufficient to fund our capital expenditure budget, we mayhave limited ability to obtain the additional capital necessary to conduct our operations at expectedlevels. Our senior secured revolving credit facility and our second lien term loan facility may restrictour ability to obtain new debt financing. We may not be able to obtain debt or equity financing onterms favorable to us, or at all. The failure to obtain additional financing could result in a curtailmentof our operations relating to exploration and development of our prospects, which in turn could lead toa decline in our oil, natural gas and NGLs production or reserves, and in some areas a loss ofproperties.
External financing may be required in the future to fund our growth. We may not be able toobtain additional financing, and financing under our senior secured revolving credit facility and oursecond lien term loan facility may not be available in the future. Without additional capital resources,we may be unable to pursue and consummate acquisition opportunities as they become available, andwe may be forced to limit or defer our planned oil, natural gas and NGLs development program, whichwill adversely affect the recoverability and ultimate value of our oil, natural gas and NGLs properties,in turn negatively affecting our business, financial condition and results of operations.
The development of our proved undeveloped reserves in our areas of operation may take longer and mayrequire higher levels of capital expenditures than we currently anticipate. Therefore, our undeveloped reservesmay not be ultimately developed or produced.
Approximately 44% of our total estimated proved reserves were classified as proved undevelopedas of December 31, 2013. Development of these reserves may take longer and require higher levels ofcapital expenditures than we currently anticipate. In addition, declines in commodity prices could causeus to reevaluate our development plans and delay or cancel development. Delays in the development of
32

our reserves or increases in costs to drill and develop such reserves will reduce the future net revenuesestimated for such reserves and may result in some projects becoming uneconomic. In addition, delaysin the development of reserves could cause us to have to reclassify our proved reserves as unprovedreserves.
A substantial or extended decline in oil, natural gas or NGL prices may adversely affect our business,financial condition or results of operations and our ability to meet our capital expenditure obligations andfinancial commitments.
The price we receive for our oil, natural gas and NGLs heavily influences our revenue,profitability, access to capital and future rate of growth. Oil and natural gas are commodities and,therefore, their prices are subject to wide fluctuations in response to relatively minor changes in supplyand demand. The markets for oil, natural gas and NGLs historically have been volatile and will likelycontinue to be volatile in the future. The prices we receive for our production and the levels of ourproduction depend on numerous factors beyond our control. These factors include the following:
• regional and worldwide economic conditions impacting the supply and demand for oil, naturalgas and NGLs;
• the actions of the Organization of Petroleum Exporting Countries;
• the price and quantity of imports of foreign oil, natural gas and NGLs;
• political conditions regionally, domestically or in other oil and gas-producing regions;
• the level of domestic and global oil and natural gas exploration and production;
• the level of domestic and global oil and natural gas inventories;
• localized supply and demand fundamentals and transportation availability;
• weather conditions and natural disasters;
• domestic, local and foreign governmental regulations and taxes;
• speculation as to the future price of oil, natural gas and NGLs and the speculative trading of oil,natural gas and NGLs;
• trading prices of futures contracts;
• price and availability of competitors’ supplies of oil, natural gas and NGLs;
• technological advances affecting energy consumption;
• the price and availability of alternative fuels; and
• the impact of energy conservation efforts.
NGLs are made up of ethane, propane, isobutane, butane and natural gasoline, all of which havedifferent uses and different pricing characteristics. NGLs comprised 28% of our 2013 production, andwe realized an average price of $33.30 per barrel. An extended decline in NGL prices could materiallyand adversely affect our future business, financial condition and results of operations.
Substantially all of our production is sold to purchasers under contracts with market-based prices.Lower oil, natural gas and NGL prices will reduce our cash flows and the present value of our reserves.If oil, natural gas and NGL prices deteriorate, we anticipate that the borrowing base under our seniorsecured revolving credit facility, which is revised periodically, may be reduced, which would negativelyimpact our borrowing ability. Additionally, prices could reduce our cash flows to a level that wouldrequire us to borrow to fund our capital budget. Lower oil, natural gas and NGL prices may alsoreduce the amount of oil, natural gas and NGLs that we can produce economically. Substantial
33

decreases in oil, natural gas and NGL prices could render uneconomic a significant portion of ouridentified drilling locations. This may result in significant downward adjustments to our estimatedproved reserves. As a result, a substantial or extended decline in oil, natural gas or NGL prices maymaterially and adversely affect our future business, financial condition, results of operations, liquidity orability to finance planned capital expenditures.
Unless we replace our reserves, our reserves and production will naturally decline, which would adverselyaffect our business, financial condition and results of operations.
Unless we conduct successful development and acquisition activities or acquire propertiescontaining proved reserves, our proved reserves will decline as those reserves are produced. Producingoil and natural gas reservoirs generally are characterized by declining production rates that varydepending upon reservoir characteristics and other factors. Our future oil, natural gas and NGLreserves and production, and therefore our cash flows and income, are highly dependent on our successin efficiently developing our current reserves and economically finding or acquiring additionalrecoverable reserves. We may not be able to develop, find or acquire additional reserves to replace ourcurrent and future production at acceptable costs. If we are unable to replace our current and futureproduction, the value of our reserves will decrease, and our business, financial condition and results ofoperations will be adversely affected.
Our identified drilling locations are scheduled to be drilled over many years, making them susceptible touncertainties that could materially alter the occurrence or timing of their drilling, which in certain instancescould prevent or delay associated expected production. In addition, we may not be able to raise the amount ofcapital that would be necessary to drill a substantial portion of our identified drilling locations.
Our management team has identified and scheduled certain drilling locations as an estimation ofour future multi-year drilling activities on our existing acreage. These drilling locations represent asignificant part of our growth strategy. Our drilling locations are in various stages of evaluation, rangingfrom a location that is ready to drill to a location that will require substantial additional interpretation.There is no way to predict in advance of drilling and testing whether any particular location will yieldoil, natural gas or NGLs in sufficient quantities to recover drilling or completion costs or to beeconomically viable. Similarly, the use of technologies and the study of producing fields in the samearea of producing wells will not enable us to know conclusively prior to drilling whether oil or naturalgas will be present or, if present, whether oil or natural gas will be present in sufficient quantities to beeconomically viable. Even if sufficient quantities of oil or natural gas exist, we may damage thepotentially productive hydrocarbon bearing formation or experience mechanical difficulties whiledrilling or completing the well, resulting in a reduction in production from or abandonment of the well.If we drill additional wells that we identify as dry holes in our current and future drilling locations, ourdrilling success rate may decline and materially harm our business. In addition, our ability to drill anddevelop these drilling locations depends on a number of uncertainties, including oil, natural gas andNGL prices, the availability and cost of capital, drilling and production costs, the availability of drillingservices and equipment, drilling results, lease expirations, gathering systems, marketing and pipelinetransportation constraints, regulatory approvals and other factors. In addition, a number of ouridentified drilling locations are associated with joint development agreements and if we do not meetour obligation to drill the minimum number of wells specified in an agreement, we will lose the right tocontinue to develop certain acreage covered by that agreement. Because of the uncertainty inherent inthese factors, we do not know if the numerous drilling locations we have identified will ever be drilledor if we will be able to produce oil, natural gas or NGLs from these or any other drilling locations. Inaddition, unless production is established within the spacing units covering the undeveloped acres onwhich some of the potential locations are obtained, the leases for such acreage will expire.
34

If commodity prices decrease, we may be required to take write-downs of the carrying values of our properties.
Accounting rules require that we periodically review the carrying value of our properties forpossible impairment. Based on prevailing commodity prices and specific market factors andcircumstances at the time of prospective impairment reviews, and the continuing evaluation ofdevelopment plans, production data, economics and other factors, we may be required to write downthe carrying value of our properties. A write-down constitutes a non-cash charge to earnings. Suchimpairment may also result in a reduction in proved reserves, thereby increasing future depletioncharges per unit of production. We may incur impairment charges and related reductions in provedreserves in the future, which could have a material adverse effect on our results of operations for theperiods in which such charges are taken.
Our estimated oil, natural gas and NGLs reserve quantities and future production rates are based on manyassumptions that may prove to be inaccurate. Any significant inaccuracies in these reserve estimates or theunderlying assumptions will materially affect the quantities and present value of our reserves.
Numerous uncertainties are inherent in estimating quantities of oil, natural gas and NGL reserves.Our estimates of our proved reserve quantities are based upon our reserve report as of December 31,2013. Reserve estimation is a subjective process of evaluating underground accumulations of oil, naturalgas and NGLs that cannot be measured in an exact manner. Reserves that are ‘‘proved reserves’’ arethose estimated quantities of oil, natural gas and NGLs that geological and engineering datademonstrate with reasonable certainty are recoverable in future years from known reservoirs underexisting economic and operating conditions and that relate to projects for which the extraction ofhydrocarbons must have commenced or the operator must be reasonably certain will commence withina reasonable time.
The process of estimating oil, natural gas and NGL reserves is complex, requiring significantdecisions and assumptions in the evaluation of available geological, engineering and economic data foreach reservoir, and these reports rely upon various assumptions, including assumptions regarding futureoil, natural gas and NGL prices, production levels, and operating and development costs. As a result,estimated quantities of proved reserves and projections of future production rates and the timing ofdevelopment expenditures may prove to be inaccurate. Quantities of proved reserves are estimatedbased on pricing conditions in existence during the period of assessment and costs at the end of theperiod of assessment. Changes to oil, natural gas and NGL prices in the markets for such commoditiesmay have the impact of shortening the economic lives of certain fields, because it becomes uneconomicto produce all recoverable reserves on such fields, which reduces proved property reserve estimates.
Over time, we may make material changes to reserve estimates taking into account the results ofactual drilling and production. Any significant variance in our assumptions and actual results couldgreatly affect our estimates of reserves, the economically recoverable quantities of oil, natural gas andNGLs attributable to any particular group of properties, the classifications of reserves based on risk ofrecovery, and estimates of the future net cash flows. In addition, changes in future production costassumptions could have a significant effect on our proved reserve quantities.
If we do not fulfill our obligation to drill minimum numbers of wells specified in our joint developmentagreements, we will lose the right to develop the undeveloped acreage associated with the agreement and anyproved undeveloped reserves attributable to such undeveloped acreage.
If we do not meet our obligation to drill the minimum number of wells specified in a jointdevelopment agreement, we will lose the right to continue to develop the undeveloped acreage coveredby the agreement, which would result in the loss of any proved undeveloped reserves attributable tosuch undeveloped acreage.
35
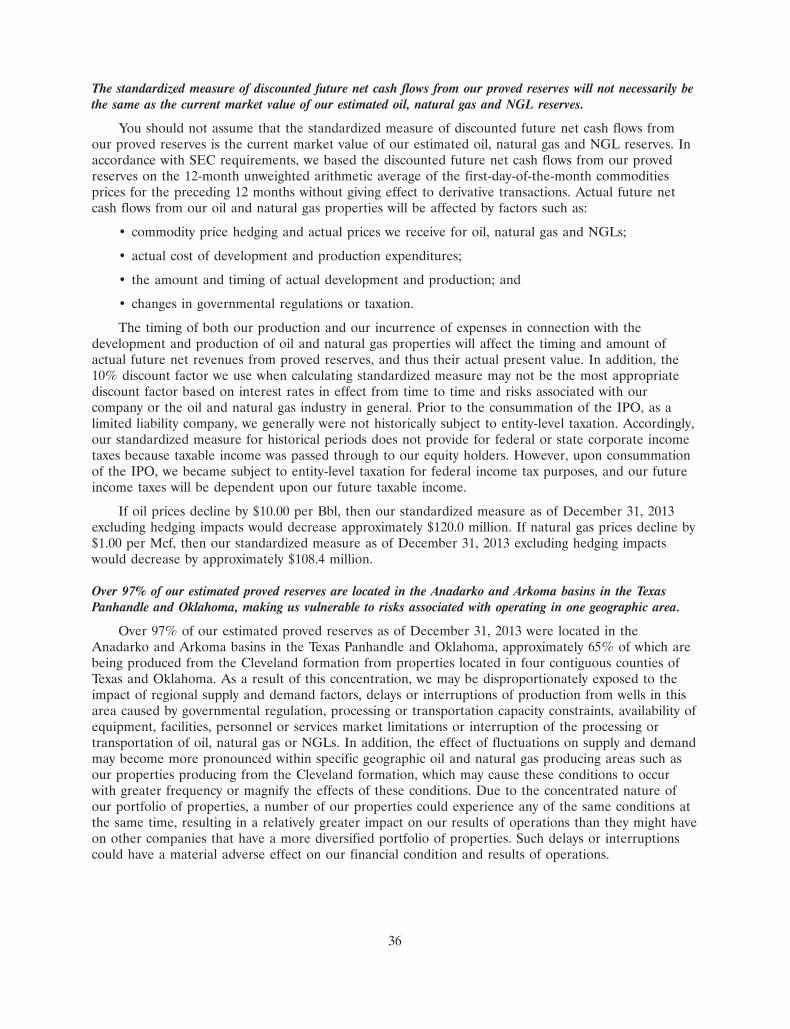
The standardized measure of discounted future net cash flows from our proved reserves will not necessarily bethe same as the current market value of our estimated oil, natural gas and NGL reserves.
You should not assume that the standardized measure of discounted future net cash flows fromour proved reserves is the current market value of our estimated oil, natural gas and NGL reserves. Inaccordance with SEC requirements, we based the discounted future net cash flows from our provedreserves on the 12-month unweighted arithmetic average of the first-day-of-the-month commoditiesprices for the preceding 12 months without giving effect to derivative transactions. Actual future netcash flows from our oil and natural gas properties will be affected by factors such as:
• commodity price hedging and actual prices we receive for oil, natural gas and NGLs;
• actual cost of development and production expenditures;
• the amount and timing of actual development and production; and
• changes in governmental regulations or taxation.
The timing of both our production and our incurrence of expenses in connection with thedevelopment and production of oil and natural gas properties will affect the timing and amount ofactual future net revenues from proved reserves, and thus their actual present value. In addition, the10% discount factor we use when calculating standardized measure may not be the most appropriatediscount factor based on interest rates in effect from time to time and risks associated with ourcompany or the oil and natural gas industry in general. Prior to the consummation of the IPO, as alimited liability company, we generally were not historically subject to entity-level taxation. Accordingly,our standardized measure for historical periods does not provide for federal or state corporate incometaxes because taxable income was passed through to our equity holders. However, upon consummationof the IPO, we became subject to entity-level taxation for federal income tax purposes, and our futureincome taxes will be dependent upon our future taxable income.
If oil prices decline by $10.00 per Bbl, then our standardized measure as of December 31, 2013excluding hedging impacts would decrease approximately $120.0 million. If natural gas prices decline by$1.00 per Mcf, then our standardized measure as of December 31, 2013 excluding hedging impactswould decrease by approximately $108.4 million.
Over 97% of our estimated proved reserves are located in the Anadarko and Arkoma basins in the TexasPanhandle and Oklahoma, making us vulnerable to risks associated with operating in one geographic area.
Over 97% of our estimated proved reserves as of December 31, 2013 were located in theAnadarko and Arkoma basins in the Texas Panhandle and Oklahoma, approximately 65% of which arebeing produced from the Cleveland formation from properties located in four contiguous counties ofTexas and Oklahoma. As a result of this concentration, we may be disproportionately exposed to theimpact of regional supply and demand factors, delays or interruptions of production from wells in thisarea caused by governmental regulation, processing or transportation capacity constraints, availability ofequipment, facilities, personnel or services market limitations or interruption of the processing ortransportation of oil, natural gas or NGLs. In addition, the effect of fluctuations on supply and demandmay become more pronounced within specific geographic oil and natural gas producing areas such asour properties producing from the Cleveland formation, which may cause these conditions to occurwith greater frequency or magnify the effects of these conditions. Due to the concentrated nature ofour portfolio of properties, a number of our properties could experience any of the same conditions atthe same time, resulting in a relatively greater impact on our results of operations than they might haveon other companies that have a more diversified portfolio of properties. Such delays or interruptionscould have a material adverse effect on our financial condition and results of operations.
36

Our customer base is concentrated, and the loss of any one of our key customers could, therefore, adverselyaffect our financial condition and results of operations.
Historically, we have been dependent on a few customers for a significant portion of our revenue.For the year ended December 31, 2013 purchases by our top four customers accounted forapproximately 15%, 13%, 13% and 13%, respectively, of our total oil, natural gas and NGL sales. Thisconcentration of customers may increase our overall exposure to credit risk, and customers will likelybe similarly affected by changes in economic and industry conditions. To the extent that any of ourmajor purchasers reduces their purchases of oil, natural gas or NGLs or defaults on their obligations tous, our financial condition and results of operations could be adversely affected.
We may be unable to make attractive acquisitions or successfully integrate acquired businesses, and anyinability to do so may disrupt our business and hinder our ability to grow.
In the future we may make acquisitions of businesses that complement or expand our currentbusiness. We may not be able to identify attractive acquisition opportunities. Even if we do identifyattractive acquisition opportunities, we may not be able to complete the acquisition or do so oncommercially acceptable terms.
In addition, our senior secured revolving credit facility and our second lien term loan facilityimpose certain limitations on our ability to enter into mergers or combination transactions. Our seniorsecured revolving credit facility and our second lien term loan facility also limit our ability to incurcertain indebtedness, which could indirectly limit our ability to engage in acquisitions of businesses.
Any acquisition involves potential risks, including, among other things:
• the validity of our assumptions about estimated proved reserves, future production, commodityprices, revenues, capital expenditures, operating expenses and costs;
• an inability to successfully integrate the assets we acquire;
• an inability to obtain satisfactory title to the assets we acquire;
• a decrease in our liquidity by using a significant portion of our available cash or borrowingcapacity to finance acquisitions;
• a significant increase in our interest expense or financial leverage if we incur additional debt tofinance acquisitions;
• the assumption of unknown liabilities, losses or costs for which we obtain no or limitedindemnity or other recourse;
• the diversion of management’s attention from other business concerns;
• an inability to hire, train or retain qualified personnel to manage and operate our growingassets; and
• the occurrence of other significant changes, such as impairment of oil and natural gas properties,goodwill or other intangible assets, asset devaluation or restructuring charges.
Our decision to acquire a property will depend in part on the evaluation of data obtained fromproduction reports and engineering studies, geophysical and geological analyses and seismic data andother information, the results of which are often inconclusive and subject to various interpretations.
The success of any completed acquisition, including the Sabine acquisition, will depend on ourability to integrate effectively the acquired assets into our existing operations. The process ofintegrating acquired assets may involve unforeseen difficulties and may require a disproportionateamount of our managerial and financial resources. In addition, even if we successfully integrate an
37

acquisition, it may not be possible to realize the full benefits we may expect in estimated provedreserves, production volume, cost savings from operating synergies or other benefits anticipated froman acquisition or realize these benefits within the expected time frame. Anticipated benefits of anacquisition may be offset by operating losses relating to changes in commodity prices in oil and naturalgas industry conditions, risks and uncertainties relating to the exploratory prospects of the combinedassets or operations, or an increase in operating or other costs or other difficulties. If we fail to realizethe benefits we anticipate from an acquisition, our results of operations may be adversely affected.
Deficiencies of title to our leased interests could significantly affect our financial condition.
It is our practice, in acquiring oil and natural gas leases or undivided interests in oil and naturalgas leases or other developed rights, not to incur the expense of retaining lawyers to examine the titleto the mineral interest to be acquired. Rather, we rely upon the judgment of oil and natural gas leasebrokers or landmen who perform the fieldwork in examining records in the appropriate governmentalor county clerk’s office to determine mineral ownership before we acquire an oil and gas lease or otherdeveloped rights in a specific mineral interest.
Prior to the drilling of an oil or gas well, it is the normal practice in our industry for the operatorof the well to obtain a drilling title opinion from a qualified title attorney to ensure there are noobvious title defects on the property on which the well is to be located. The title attorney wouldtypically research documents that are of record, including liens, taxes and all applicable contracts thatburden the property. Frequently, as a result of such examinations, certain curative work must beundertaken to correct defects in the marketability of the title, and such curative work entails expense.Our failure to completely cure any title defects may invalidate our title to the subject property andadversely impact our ability in the future to increase production and reserves. Additionally, because aless strenuous title review is conducted on lands where a well has not yet been scheduled, undevelopedacreage has greater risk of title defects than developed acreage. Any title defects or defects inassignment of leasehold rights in properties in which we hold an interest may adversely impact ourability in the future to increase production and reserves, which could have a material adverse effect onour business, financial condition and results of operations.
We conduct a substantial portion of our operations through joint development agreements withthird parties. Certain of our joint development agreements include drill-to-earn arrangements, wherebywe are assigned title to properties from the third party after we complete wells and, in the case ofcertain counterparties, after completion reports relating to the wells have been approved by regulatoryauthorities whose approval may be delayed. Furthermore, certain of our joint development agreementsspecify that assignments are only to occur when the wells are capable of producing hydrocarbons inpaying quantities. These additional conditions to assignment of title may from time to time apply towells of substantial value. If one of our counterparties assigned title to a well in which we had earnedan interest (according to our joint development agreement) to a third party, our title to such a wellcould be adversely impacted. In addition, if one of our counterparties becomes a debtor in abankruptcy proceeding, or is placed into receivership, or enters into an assignment for the benefit ofcreditors, after we had earned ownership of, but before we had received title to, a well, certaincreditors of the counterparty may have rights in that well that would rank prior to ours.
Our hedging strategy may be ineffective in reducing the impact of commodity price volatility from our cashflows, which could result in financial losses or could reduce our income.
To achieve more predictable cash flow and to reduce our exposure to adverse fluctuations in theprices of oil, natural gas and NGLs, we enter into commodity derivative contracts for a significantportion of our oil, natural gas and NGLs production that could result in both realized and unrealizedhedging losses. The extent of our commodity price exposure is related largely to the effectiveness andscope of our commodity derivative contracts. For example, some of the commodity derivative contracts
38

we utilize are based on quoted market prices, which may differ significantly from the actual prices werealize in our operations for oil, natural gas and NGLs. In addition, our senior secured revolving creditfacility and our second lien term loan facility limit the aggregate notional volume of commodities thatcan be covered under commodity derivative contracts we can enter into and, as a result, we willcontinue to have direct commodity price exposure on the unhedged portion of our production volumes.For the years ending December 31, 2014, 2015, 2016 and 2017, approximately 38%, 59%, 69% and73%, respectively, of our estimated total oil, natural gas and NGL production, based on our reservereport as of December 31, 2013, will not be covered by commodity derivative contracts.
Our policy has been to hedge a significant portion of our estimated oil, natural gas and NGLsproduction. However, our price hedging strategy and future hedging transactions will be determined atour discretion. We are not under an obligation to hedge a specific portion of our production. Theprices at which we hedge our production in the future will be dependent upon commodity prices at thetime we enter into these transactions, which may be substantially higher or lower than current oil,natural gas and NGLs prices. Accordingly, our price hedging strategy may not protect us fromsignificant declines in oil, natural gas and NGL prices received for our future production. Conversely,our hedging strategy may limit our ability to realize cash flows from commodity price increases. It isalso possible that a larger percentage of our future production will not be hedged as compared withpast years, which would result in our oil and natural gas revenues becoming more sensitive tocommodity price changes.
In addition, our actual future production may be significantly higher or lower than we estimate atthe time we enter into commodity derivative contracts for such period. If the actual amount is higherthan we estimate, we will have greater commodity price exposure than we intended. If the actualamount is lower than the notional amount of our commodity derivative contracts, we might be forcedto satisfy all or a portion of our commodity derivative contracts without the benefit of the cash flowfrom our sale or purchase of the underlying physical commodity, substantially diminishing our liquidity.There may be a change in the expected differential between the underlying commodity price in thecommodity derivative contract and the actual price received, which may result in payments to ourderivative counterparty that are not offset by our receipt of payments for our production in the field.
As a result of these factors, our commodity derivative activities may not be as effective as weintend in reducing the volatility of our cash flows, and in certain circumstances may actually increasethe volatility of our cash flows.
Our hedging transactions expose us to counterparty credit risk.
Our hedging transactions expose us to risk of financial loss if a counterparty fails to perform undera derivative contract. Disruptions in the financial markets could lead to sudden changes in acounterparty’s liquidity, which could impair their ability to perform under the terms of the derivativecontract. We are unable to predict sudden changes in a counterparty’s creditworthiness or ability toperform. Even if we do accurately predict sudden changes, our ability to negate the risk may be limiteddepending upon market conditions. Currently our entire hedge portfolio is hedged directly with banksin our credit agreements, thus allowing hedging without any margin requirements.
During periods of falling commodity prices, our hedge receivable positions generally increase,which increases our counterparty credit exposure. If the creditworthiness of our counterpartiesdeteriorates and results in their nonperformance, we could incur a significant loss.
39

The adoption of the Dodd-Frank Wall Street Reform and Consumer Protection Act, or the Dodd-Frank Act,could have an adverse effect on our ability to use derivatives to reduce the effect of commodity price risk,interest rate and other risks associated with our business.
We use commodity derivatives to manage our commodity price risk. The U.S. Congress adoptedcomprehensive financial reform legislation that, among other things, establishes comprehensive federaloversight and regulation of over-the-counter derivatives and many of the entities that participate in thatmarket. Although the Dodd-Frank Act was enacted on July 21, 2010, the Commodity Futures TradingCommission, or the CFTC, and the SEC, along with certain other regulators, must promulgate finalrules and regulations to implement many of its provisions relating to over-the-counter derivatives.While some of these rules have been finalized, some have not and, as a result, the final form andtiming of the implementation of the new regulatory regime affecting commodity derivatives remainsuncertain.
In particular, on October 18, 2011, the CFTC adopted final rules under the Dodd-Frank Actestablishing position limits for certain energy commodity futures and options contracts andeconomically equivalent swaps, futures and options. The position limit levels set the maximum amountof covered contracts that a trader may own or control separately or in combination, net long or short.The final rules also contained limited exemptions from position limits which would be phased in overtime for certain bona fide hedging transactions and positions. The CFTC’s original position limits rulewas challenged in court by two industry associations and was vacated and remanded by a federaldistrict court. Since that time, the CFTC has reproposed the rule in substantially the same form as therule that was vacated by the court, but with certain non-substantive changes in response to the court’sdecision. The CFTC has sought comment on the position limits rule as reproposed, but has yet to issueits final rule. The CFTC also has withdrawn its appeal of the court order vacating the original positionlimits rule.
If these or similar position limits go into effect in the future, the timing of implementation of thefinal rules, their applicability to, and impact on, us and the ultimate success of any legal challenge totheir validity remain uncertain, and they could have a material adverse impact on us by affecting theprices of or market for commodities relevant to our operations and/or by reducing the availability to usof commodity derivatives.
The Dodd-Frank Act also imposes a number of other new requirements on certainover-the-counter derivatives and subjects certain swap dealers and major swap participants to significantnew regulatory requirements, which in certain cases may cause them to conduct their activities throughnew entities that may not be as creditworthy as our current counterparties, all of which may have amaterial adverse effect on us. The impact of this regulatory regime on the availability, pricing andterms and conditions of commodity derivatives remains uncertain, but the final requirements could havea materially adverse effect on our ability to hedge our exposure to commodity prices.
If we reduce our use of derivatives as a result of the Dodd-Frank Act, the regulations promulgatedunder it and the changes to the nature of the derivatives markets, our results of operations maybecome more volatile and our cash flows may be less predictable, which could adversely affect ourability to plan for and fund capital expenditures. In addition, the Dodd-Frank Act was intended, inpart, to reduce the volatility of commodity prices, which some legislators attributed to speculativetrading in derivatives and commodity contracts related to oil, natural gas and NGLs. Our revenuecould, therefore, be adversely affected if commodity prices were to decrease.
Certain federal income tax deductions currently available with respect to oil and natural gas exploration anddevelopment may be eliminated as a result of future legislation.
From time to time, legislation is introduced that would, if enacted, make significant changes toU.S. tax laws. These proposed changes have included repealing many tax incentives and deductions that
40

are currently used by U.S. oil and gas companies and imposing new fees. Among others, proposedchanges have included: elimination of the ability to fully deduct intangible drilling costs in the yearincurred; repeal of the percentage depletion deduction for oil and gas properties; repeal of thedomestic manufacturing tax deduction for oil and gas companies; increase in the geological andgeophysical cost amortization period for independent producers; and implementation of a fee onnon-producing federal oil and gas leases. The passage of legislation containing some or all of theseprovisions or any other similar change in U.S. federal income tax law could eliminate or postponecertain tax deductions that are currently available to us with respect to oil and natural gas explorationand development, and any such change could have a material adverse effect on our business, financialcondition and results of operations.
We may be unable to compete effectively with larger companies, which may adversely affect our ability togenerate sufficient revenues.
The oil and natural gas industry is intensely competitive, and we compete with other companiesthat have greater resources than us. Many of our larger competitors not only drill for and produce oiland natural gas, but also engage in refining operations and market petroleum and other products on aregional, national or worldwide basis. These companies may have a greater ability to continue drillingactivities during periods of low oil, natural gas and NGL prices, to contract for drilling equipment, tosecure trained personnel, and to absorb the burden of present and future federal, state, local and otherlaws and regulations. The oil and natural gas industry has periodically experienced shortages of drillingrigs, equipment, pipe and personnel, which has delayed development drilling and other exploitationactivities and has caused significant price increases. Competition has been strong in hiring experiencedpersonnel, particularly in the engineering and technical, accounting and financial reporting, tax andland departments. In addition, competition is strong for attractive oil and natural gas producingproperties, oil and natural gas companies, and undeveloped leases and drilling rights. Any inability tocompete effectively with larger companies could have a material adverse impact on our financialcondition and results of operations.
The oil and natural gas industry is characterized by rapid and significant technologicaladvancements and introductions of new products and services using new technologies. As others use ordevelop new technologies, we may be placed at a competitive disadvantage or competitive pressuresmay force us to implement those new technologies at substantial costs. In addition, other oil andnatural gas companies may have greater financial, technical, and personnel resources that allow them toenjoy technological advantages and may in the future allow them to implement new technologies beforewe can. We may not be able to respond to these competitive pressures and implement new technologieson a timely basis or at an acceptable cost. If one or more of the technologies we use now or in thefuture were to become obsolete or if we are unable to use the most advanced commercially availabletechnology, our business, financial condition and results of operations could be materially adverselyaffected.
We participate in oil and gas leases with third parties who may not be able to fulfill their commitments to ourprojects.
We frequently own less than 100% of the working interest in the oil and gas leases on which weconduct operations, and other parties will own the remaining portion of the working interest. Financialrisks are inherent in any operation where the cost of drilling, equipping, completing and operating wellsis shared by more than one person. We could be held liable for joint activity obligations of otherworking interest owners, such as nonpayment of costs and liabilities arising from the actions of otherworking interest owners. In addition, declines in oil, natural gas and NGL prices may increase thelikelihood that some of these working interest owners, particularly those that are smaller and lessestablished, are not able to fulfill their joint activity obligations. A partner may be unable or unwilling
41

to pay its share of project costs, and, in some cases, a partner may declare bankruptcy. In the event anyof our project partners do not pay their share of such costs, we would likely have to pay those costs,and we may be unsuccessful in any efforts to recover these costs from our partners, which couldmaterially adversely affect our financial position.
The unavailability or high cost of drilling rigs, equipment, supplies, personnel and oil field services as well asfees for the cancellation of such services could adversely affect our ability to execute development andexploitation plans on a timely basis and within budget, and consequently could adversely affect our anticipatedcash flow.
We utilize third-party services to maximize the efficiency of our operation. The cost of oil fieldservices typically fluctuates based on demand for those services. We may not be able to contract forsuch services on a timely basis, or the cost of such services may not remain at a satisfactory oraffordable level. Shortages or the high cost of drilling rigs, equipment, supplies or personnel, includinghydraulic fracturing equipment, supplies and personnel necessary for horizontal drilling, could delay oradversely affect our development and exploitation operations, which could have a material adverseeffect on our financial condition and results of operations.
Our business depends in part on pipelines, transportation and gathering systems and processingfacilities owned by others. Any limitation in the availability of those facilities could interfere with ourability to market our oil, natural gas and NGLs production and could harm our business.
The marketability of our oil, natural gas and NGLs production depends in part on the availability,proximity and capacity of pipelines and other transportation methods, such as trucks, gathering systemsand processing facilities owned by third parties. The amount of oil, natural gas and NGLs that can beproduced and sold is subject to curtailment in certain circumstances, such as pipeline interruptions dueto scheduled and unscheduled maintenance, excessive pressure, physical damage or lack of contractedcapacity on such systems. Also, the transfer of our oil, natural gas and NGLs on third-party pipelinesmay be curtailed or delayed if it does not meet the quality specifications of the pipeline owners. Ouraccess to transportation options, including trucks owned by third parties, can also be affected by U.S.federal and state regulation of oil and gas production and transportation, general economic conditionsand changes in supply and demand. The curtailments arising from these and similar circumstances maylast from a few days to several months. In many cases, we are provided only with limited, if any, noticeas to when these circumstances will arise and their duration. Any significant curtailment in gatheringsystem or transportation or processing facility capacity could reduce our ability to market our oil,natural gas and NGLs production and harm our business.
We may incur substantial losses and be subject to substantial liability claims as a result of our oil and naturalgas operations. Additionally, we may not be insured for, or our insurance may be inadequate to protect usagainst, these risks.
We are not insured against all risks. Losses and liabilities arising from uninsured and underinsuredevents could materially and adversely affect our business, financial condition or results of operations.We may elect not to obtain insurance if we believe that the cost of available insurance is excessiverelative to the risks presented. In addition, pollution and environmental risks generally are not fullyinsurable. Our oil and natural gas exploration and production activities are subject to all of theoperating risks associated with drilling for and producing oil and natural gas, including the possibilityof:
• environmental hazards, such as uncontrollable flows of oil, natural gas, brine, well fluids, toxicgas or other pollution into the environment, including groundwater contamination;
• adverse weather conditions and natural disasters;
42

• abnormally pressured formations;
• facility or equipment malfunctions;
• mechanical difficulties, such as stuck oilfield drilling and service tools and casing collapse;
• fires, explosions and ruptures of pipelines;
• personal injuries and death; and
• terrorist attacks targeting oil and natural gas related facilities and infrastructure.
Any of these risks could adversely affect our ability to conduct operations or result in substantiallosses to us as a result of:
• injury or loss of life;
• damage to and destruction of property, natural resources and equipment;
• pollution and other environmental damage and associated clean-up responsibilities;
• regulatory investigations, penalties or other sanctions;
• suspension of our operations; and
• repair and remediation costs.
We are subject to complex federal, state, local and other laws and regulations that could adversely affect thecost, manner or feasibility of conducting our operations.
Our oil and natural gas exploration and production operations are subject to complex and stringentlaws and regulations. In order to conduct our operations in compliance with these laws and regulations,we must obtain and maintain numerous permits, approvals and certificates from various federal, stateand local governmental authorities. Failure or delay in obtaining regulatory approvals or drillingpermits could have a material adverse effect on our ability to develop our properties, and receipt ofdrilling permits with onerous conditions could increase our compliance costs. In addition, regulationsregarding conservation practices and the protection of correlative rights affect our operations bylimiting the quantity of oil, natural gas and NGLs we may produce and sell.
We are subject to federal, state and local laws and regulations as interpreted and enforced bygovernmental authorities possessing jurisdiction over various aspects of the exploration, production andtransportation of oil, natural gas and NGLs, as well as safety matters. Legal requirements arefrequently changed and subject to interpretation, and we are unable to predict the ultimate cost ofcompliance with these requirements or their ultimate effect on our operations. We may be required tomake significant expenditures to comply with governmental laws and regulations. The discharge of oil,natural gas, NGLs or other pollutants into the air, soil or water may give rise to significant liabilities onour part to the government, and third parties and may require us to incur substantial costs forremediation.
See ‘‘Item 1. Business—Regulations’’ for a further description of the laws and regulations thataffect us.
Our ability to pursue our business strategies may be adversely affected if we incur costs and liabilities due toa failure to comply with environmental regulations or a release of hazardous substances into the environment.
We may incur significant costs and liabilities as a result of environmental requirements applicableto the operation of our wells, gathering systems and other facilities. These costs and liabilities could
43

arise under a wide range of federal, state and local environmental laws and regulations, including, forexample:
• the Clean Air Act, or CAA, and comparable state laws and regulations that impose obligationsrelated to air emissions;
• the Clean Water Act and Oil Pollution Act, or OPA, and comparable state laws and regulationsthat impose obligations related to discharges of pollutants into regulated bodies of water;
• the Resource Conservation and Recovery Act, or RCRA, and comparable state laws that imposerequirements for the handling and disposal of waste from our facilities;
• the Comprehensive Environmental Response, Compensation, and Liability Act, or CERCLA,and comparable state laws that regulate the cleanup of hazardous substances that may have beenreleased at properties currently or previously owned or operated by us or at locations to whichwe have sent waste for disposal;
• the Environmental Protection Agency’s, or EPA’s, community right to know regulations underthe Title III of CERCLA and comparable state laws that require that we organize and/ordisclose information about hazardous materials used or produced in our operations;
• the Occupational Safety and Health Act, or OSHA, which establishes workplace standards forthe protection of the health and safety of employees, including the implementation of hazardcommunications programs designed to inform employees about hazardous substances in theworkplace, potential harmful effects of these substances, and appropriate control measures;
• the National Environmental Policy Act, or NEPA, which requires federal agencies to evaluatemajor agency actions having the potential to significantly impact the environment and which mayrequire the preparation of Environmental Assessments and more detailed Environmental ImpactStatements that may be made available for public review and comment;
• the Migratory Bird Treaty Act, which implements various treaties and conventions between theUnited States and certain other nations for the protection of migratory birds and, pursuant towhich the taking, killing, or possessing of migratory birds is unlawful without a permit, therebypotentially requiring the implementation of operating restrictions or a temporary, seasonal, orpermanent ban on operations in affected areas; and
• the Endangered Species Act, or ESA, and analogous state laws, which seek to ensure thatactivities do not jeopardize endangered or threatened animals, fish and plant species, nor destroyor modify the critical habitat of such species.
We may incur significant delays, costs and liabilities as a result of federal, state and localenvironmental, health and safety requirements applicable to exploration, development and productionactivities. These laws and regulations may require us to obtain a variety of permits or otherauthorizations governing our air emissions, water discharges, waste disposal or other environmentalimpacts associated with drilling, production and product transportation pipelines or other operations;regulate the sourcing and disposal of water used in the drilling, fracturing and completion processes;limit or prohibit drilling activities in certain areas and on certain lands lying within wilderness,wetlands, frontier and other protected areas; require remedial action to prevent or mitigate pollutionfrom former operations such as plugging abandoned wells or closing earthen pits; and/or imposesubstantial liabilities for spills, pollution or failure to comply with regulatory filing requirements. Inaddition, these laws and regulations are complex, change frequently and have tended to becomeincreasingly stringent over time. Failure to comply with these laws and regulations may trigger a varietyof administrative, civil and criminal enforcement measures, including the assessment of monetarypenalties, the imposition of remedial requirements, and the issuance of orders enjoining futureoperations. Certain environmental statutes, including the RCRA, CERCLA, the federal OPA and
44

analogous state laws and regulations, impose strict joint and several liability for costs required to cleanup and restore sites where petroleum or hazardous substances or other waste products have beendisposed of or otherwise released. More stringent laws and regulations, including laws related toclimate change and greenhouse gases, may be adopted in the future. The trend of more expensive andstringent environmental legislation and regulations applied to the oil and natural gas industry couldcontinue, resulting in increased costs of doing business and consequently affecting profitability.Moreover, it is not uncommon for neighboring landowners and other third parties to file claims forpersonal injury and property damage allegedly caused by the release of hazardous substances or otherwaste products into the environment. We are also subject to many other environmental requirementsdelineated in ‘‘Business—Environmental Matters and Regulation.’’
Federal and state legislative and regulatory initiatives relating to hydraulic fracturing and other oil and gasproduction activities as well as governmental reviews of such activities could result in increased costs,additional operating restrictions or delays, which could adversely affect our production.
Hydraulic fracturing is an important and common practice that is used to stimulate production ofnatural gas and/or oil from dense subsurface rock formations. The process involves the injection ofwater, sand and chemicals under pressure into the formation to fracture the surrounding rock andstimulate production. We routinely utilize hydraulic fracturing techniques in many of our oil andnatural gas drilling and completion programs. The process is typically regulated by state oil and naturalgas commissions. However, the EPA recently asserted federal regulatory authority over certainhydraulic fracturing activities involving diesel under the federal Safe Drinking Water Act, or SDWA, instates where EPA is the permitting authority and released guidance in February 2014 on regulatoryrequirements for companies that plan to conduct hydraulic fracturing using diesel in those states. Inaddition, on November 23, 2011, the EPA announced that it was granting in part a petition to initiaterulemaking under the Toxic Substances Control Act, relating to chemical substances and mixtures usedin oil and gas exploration and production. Congress has also considered legislation to provide forfederal regulation of hydraulic fracturing and to require disclosure of the chemicals used in thefracturing process.
Some states, including those in which we operate, have adopted, and other states are consideringadopting, regulations that could impose more stringent permitting, disclosure and well constructionrequirements on hydraulic fracturing operations under certain circumstances. For example, Texasadopted a law in June 2011 requiring disclosure to the Railroad Commission of Texas, or TRRC, andthe public of certain information regarding the components of the fluids used in the hydraulicfracturing process. On December 13, 2011, the TRRC finalized regulations requiring public disclosureof chemicals in fluids used in the hydraulic fracturing process for drilling permits issued afterFebruary 1, 2012. In addition, on October 20, 2011, Louisiana adopted new regulations for hydraulicfracturing operations in the state. These new regulations require hydraulic fracturing operators topublicly disclose the volume of hydraulic fracturing fluid, the type, trade name, supplier and volume ofadditives, and a list of chemical compounds contained in the additive, along with its maximumconcentration, subject to certain trade secret protections. However, trade secret chemicals must beidentified by their chemical family. The mandatory disclosure of information regarding the constituentsof hydraulic fracturing fluids could make it easier for third parties opposing the hydraulic fracturingprocess to initiate legal proceedings based upon allegations that specific chemicals used in thefracturing process could adversely affect the environment. In addition, the Oklahoma CorporationCommission has adopted rules prohibiting water pollution resulting from hydraulic fracturingoperations and requiring disclosure of chemicals used in hydraulic fracturing.
Texas has also authorized the Texas Commission on Environmental Quality to suspend water userights for oil and gas users in the event of serious drought conditions and has imposed more stringentemissions, monitoring, inspection, maintenance, and repair requirements on Barnett Shale operators to
45

minimize Volatile Organic Compound, or VOC, releases. Also, Louisiana requires operators tominimize releases of gases into the open air after hydraulic fracturing in certain urban areas.
In addition to state laws, local land use restrictions, such as city ordinances, may restrict orprohibit the performance of well drilling in general and/or hydraulic fracturing in particular. In theevent state, local, or municipal legal restrictions are adopted in areas where we are currentlyconducting operations, or in the future plan to conduct operations, we may incur additional costs tocomply with such requirements that may be significant in nature, experience delays or curtailment inthe pursuit of exploration, development, or production activities, and perhaps even be precluded fromdrilling wells.
There are also certain governmental reviews either underway or being proposed that focus onenvironmental aspects of hydraulic fracturing practices. The White House Council on EnvironmentalQuality is coordinating an administration-wide review of hydraulic fracturing practices, and a committeeof the United States House of Representatives has conducted an investigation of hydraulic fracturingpractices. Furthermore, a number of federal agencies are analyzing, or have been requested to review, avariety of environmental issues associated with hydraulic fracturing. The EPA is conducting a study ofthe potential environmental effects of hydraulic fracturing on drinking water and groundwater. TheEPA released its first progress report on this study in December 2012 and expects to release a finaldraft report for public comment and peer review in 2014. Moreover, the EPA announced onOctober 20, 2011 that it is launching a study of wastewater resulting from hydraulic fracturing activitiesand plans to propose pretreatment standards this year. In addition, the U.S. Department of Energy’sNatural Gas Subcommittee of the Secretary of Energy Advisory Board conducted a review of hydraulicfracturing issues and practices and made recommendations to better protect the environment fromdrilling using hydraulic fracturing completion methods. These ongoing or proposed studies, dependingon their degree of pursuit and any meaningful results obtained, could spur initiatives to further regulatehydraulic fracturing under the Safe Drinking Water Act, the Toxic Substances Control Act, or otherstatutory and/or regulatory mechanisms. President Obama created the Interagency Working Group onUnconventional Natural Gas and Oil by Executive Order on April 13, 2012, which is charged withcoordinating and aligning federal agency research and scientific studies on unconventional oil andnatural gas resources.
Also, the U.S. Department of the Interior’s Bureau of Land Management, or BLM, is consideringrules regarding well stimulation, chemical disclosures and other requirements for hydraulic fracturingon federal and Indian lands. BLM released a proposed rule requiring the disclosure of chemicals usedduring hydraulic fracturing and addressing drilling plans, water management and wastewater disposal,on federal and Indian lands in May 2012. However, BLM pulled back its proposal in January 2013 afterreviewing comments and published an updated proposed rule on May 24, 2013.
Further, on April 17, 2012, the EPA released final rules to subject all oil and gas operations(production, processing, transmission, storage and distribution) to regulation under the New SourcePerformance Standards, or NSPS, and National Emission Standards for Hazardous Air Pollutants, orNESHAPS, programs. These rules became effective on October 15, 2012. The EPA rules also includeNSPS standards for completions of hydraulically-fractured gas wells. These standards include thereduced emission completion techniques developed in the EPA’s Natural Gas STAR program along withpit flaring of gas not sent to the gathering line. The standards will be applicable to newly drilled andfractured wells as well as existing wells that are refractured. Further, the regulations under NESHAPSinclude maximum achievable control technology, or MACT, standards for those glycol dehydrators andstorage vessels at major sources of hazardous air pollutants not currently subject to MACT standards.In October 2012, several challenges to the EPA’s rules were filed by various parties, includingenvironmental groups and industry associations. In a January 16, 2013 unopposed motion to hold thislitigation in abeyance, the EPA indicated that it may reconsider some aspects of the rules. EPA issued afinal rule revising certain aspects of the rules on August 5, 2013. Depending on the outcome of such
46

judicial proceedings and regulatory actions, the rules may be further modified or rescinded or the EPAmay issue new rules. We are currently evaluating the effect these rules will have on our business.Additionally, on December 11, 2012, seven states submitted a notice of intent to sue the EPA tocompel the agency to make a determination as to whether standards of performance limiting methaneemissions from oil and gas sources are appropriate, and, if so, to promulgate performance standards formethane emissions from the oil and gas sector, which was not addressed in the EPA rules that becameeffective on October 15, 2012. The notice of intent also requested the EPA issue emission guidelinesfor the control of methane emissions from existing oil and gas sources. Increased regulation andattention given to the hydraulic-fracturing process could lead to greater opposition, including litigation,to oil and gas production activities using hydraulic-fracturing techniques. Additional legislation orregulation could also lead to operational delays or increased operating costs in the production of oiland natural gas, including from the developing shale formations, or could make it more difficult toperform hydraulic fracturing. The adoption of any federal, state or local laws or the implementation ofregulations regarding hydraulic fracturing could potentially cause a decrease in the completion of newoil and gas wells, increased compliance costs and time, which could adversely affect our financialposition, results of operations and cash flows.
Climate change legislation or regulations restricting emissions of greenhouse gases could result in increasedoperating costs and reduced demand for the oil, natural gas and NGLs we produce.
In December 2009, the EPA officially published its findings that emissions of carbon dioxide,methane and other greenhouse gases, or GHGs, present an endangerment to public health and theenvironment because emissions of such gases are, according to the EPA, contributing to warming of theearth’s atmosphere and other climatic changes. Based on its findings, the EPA has begun adopting andimplementing regulations to restrict emissions of GHGs under existing provisions of the federal CleanAir Act, including one rule that requires a reduction in emissions of GHGs from motor vehicles andanother that regulates emissions of GHGs from certain large stationary sources. Since January 2, 2011,the EPA has required new or modified stationary sources that emit GHGs at levels above regulatoryand statutory thresholds to apply for a Prevention of Significant Deterioration, or PSD, permit underthe Clean Air Act. The EPA set the current regulatory thresholds in its ‘‘Tailoring Rule,’’ which wasintended to avoid the need for large numbers of relatively small GHG-emitting sources to obtain apermit under the Clean Air Act. The EPA has also indicated that it may revise its Tailoring Rulecarbon dioxide equivalent thresholds downward in a future rulemaking, which would likely subjectadditional stationary sources to GHG permitting requirements.
The EPA has also proposed GHG New Source Performance Standards under the Clean Air Actfor certain electric utility generating units and may propose GHG NSPS for additional sourcecategories in the future. In addition, on October 30, 2009, the EPA published a final rule requiring thereporting of GHG emissions from specified large GHG emission sources in the United States. OnNovember 9, 2010, the EPA issued final rules to expand its existing GHG reporting rule to includeonshore oil and natural gas production, processing, transmission, storage and distribution facilities withreporting of GHG emissions from such facilities required on an annual basis. The first reports weredue in 2012 for emissions occurring in 2011.
In addition, the U.S. Congress has from time to time considered adopting legislation to reduceemissions of GHGs and almost one-half of the states have already taken legal measures to reduceemissions of GHGs primarily through the planned development of GHG emission inventories and/orregional GHG cap and trade programs. The adoption of legislation or regulatory programs to reduceemissions of GHGs could require us to incur increased operating costs, such as costs to purchase andoperate emissions control systems, to acquire emissions allowances or comply with new regulatory orreporting requirements. Any such legislation or regulatory programs could also increase the cost ofconsuming, and thereby reduce demand for, the oil, natural gas and NGLs we produce. Consequently,
47

legislation and regulatory programs to reduce emissions of GHGs could have an adverse effect on ourbusiness, financial condition and results of operations.
In addition, there has been public discussion that climate change may be associated with extremeweather conditions such as more intense hurricanes, thunderstorms, tornados and snow or ice storms,as well as rising sea levels. Another possible consequence of climate change is increased volatility inseasonal temperatures. Some studies indicate that climate change could cause some areas to experiencetemperatures substantially colder than their historical averages. Extreme weather conditions caninterfere with our production and increase our costs and damage resulting from extreme weather maynot be fully insured. However, at this time we are unable to determine the extent to which climatechange may lead to increased storm or weather hazards affecting our operations.
We may face unanticipated water and other waste disposal costs.
We may be subject to regulation that restricts our ability to discharge water produced as part ofour gas production operations. Productive zones frequently contain water that must be removed inorder for the gas to produce, and our ability to remove and dispose of sufficient quantities of waterfrom the various zones will determine whether we can produce gas in commercial quantities. Theproduced water currently is transported from the lease and injected into disposal wells. The availabilityof disposal wells with sufficient capacity to receive all of the water produced from our wells may affectour ability to produce our wells. Also, the EPA expects to issue new standards regarding the disposal ofwastewater from hydraulic fracturing into publicly owned treatment facilities this year. Therefore, thecost to transport and dispose of that water, including the cost of complying with regulations concerningwater disposal, may reduce our profitability.
In the event water produced from our projects fails to meet the quality requirements of applicableregulatory agencies, our wells produce water in excess of the applicable volumetric permit limits, thedisposal wells fail to meet the requirements of all applicable regulatory agencies, or we are unable tosecure access to disposal wells with sufficient capacity to accept all of the produced water, we may haveto shut in wells, reduce drilling activities, or upgrade facilities for water handling or treatment. Thecosts to dispose of this produced water may increase if any of the following occur:
• we cannot obtain future permits from applicable regulatory agencies;
• water of lesser quality or requiring additional treatment is produced;
• our wells produce excess water;
• new laws and regulations require water to be disposed in a different manner; or
• costs to transport the produced water to the disposal wells increase.
Increases in interest rates could adversely affect our business.
Our business and operating results can be harmed by factors such as the availability, terms of andcost of capital, increases in interest rates or a reduction in credit rating. These changes could cause ourcost of doing business to increase, limit our ability to pursue acquisition opportunities, reduce our cashflow available for drilling and place us at a competitive disadvantage. For example, as of December 31,2013, we had approximately $77 million of total available borrowing capacity under our revolving creditfacility, subject to compliance with financial covenants. The impact of a 1.0% increase in interest rateson an assumed borrowing of the full $575 million available under our credit facilities would result inincreased annual interest expense of approximately $6.0 million and a corresponding decrease in ournet income. Recent and continuing disruptions and volatility in the global financial markets may lead toa contraction in credit availability impacting our ability to finance our operations. A significantreduction in our cash flows from operations or the availability of credit could materially and adverselyaffect our ability to achieve our planned growth and operating results.
48

We conduct a substantial portion of our operations through farm-outs, areas of mutual interest and other jointdevelopment agreements. These agreements subject us to additional risks that could have a material adverseeffect on the success of these operations, our financial position and our results of operations.
We conduct a substantial portion of our operations through joint development agreements withthird parties, including ExxonMobil and Vanguard Natural Resources. We may also enter into otherjoint development agreements in the future. These third parties may have obligations that areimportant to the success of the joint development agreement, such as the obligation to contributecapital or pay carried or other costs associated with the joint development agreement. The performanceof these third party obligations, including the ability of the third parties to satisfy their obligationsunder these arrangements, is outside our control. If these parties do not satisfy their obligations underthese arrangements, our business may be adversely affected.
Our joint development agreements may involve risks not otherwise present when exploring anddeveloping properties directly, including, for example:
• our joint development partners may share certain approval rights over major decisions;
• our joint development partners may not pay their share of the joint development agreementobligations, leaving us liable for their share of joint development liabilities;
• we may incur liabilities as a result of an action taken by our joint development partners;
• our joint development partners may be in a position to take actions contrary to our instructionsor requests or contrary to our policies or objectives; and
• disputes between us and our joint development partners may result in delays, litigation oroperational impasses.
The risks described above, the failure to continue our joint ventures or to resolve disagreementswith our joint development partners could adversely affect our ability to transact the business of suchjoint development, which would in turn negatively affect our financial condition and results ofoperations.
The Jones family and Metalmark Capital, our primary private equity investor, control a significant percentageof Jones Energy, Inc.’s voting power and have the ability to take actions that may conflict with your interests.
As of December 31, 2013, the Jones family and Metalmark Capital held approximately 74.7% ofthe combined voting power of Jones Energy, Inc. Although the Jones family and Metalmark Capital areentitled to act separately in their own respective interests with respect to their ownership interests inJones Energy, Inc., the Jones family and Metalmark Capital will have the ability to elect all of themembers of our board of directors, and thereby control our management and affairs. In addition, theJones family and Metalmark Capital have significant influence over all matters that require approval byour stockholders, including mergers and other material transactions.
The loss of senior management or technical personnel could adversely affect our operations.
Our success will depend to a large extent upon the efforts and abilities of our executive officersand key operations personnel. The loss of the services of one or more of these key employees couldhave a material adverse effect on us. We do not maintain insurance against the loss of any of theseindividuals. Our business will also be dependent upon our ability to attract and retain qualifiedpersonnel. Acquiring and keeping these personnel could prove more difficult or cost substantially morethan estimated. This could cause us to incur greater costs, or prevent us from pursuing ourdevelopment and exploitation strategy as quickly as we would otherwise wish to do.
49

If we fail to develop or maintain an effective system of internal controls, we may not be able to report ourfinancial results accurately or prevent fraud.
We have had limited accounting personnel to execute our accounting processes and limited othersupervisory resources with which to address our internal control over financial reporting. As such, wehave not maintained an effective control environment to ensure that the design and execution of ourcontrols has consistently resulted in effective review of our financial statements and supervision byappropriate individuals. As a result of these factors, certain material misstatements in our annualfinancial statements were discovered and brought to the attention of our management by ourindependent registered public accounting firm for correction. These material misstatements includedcertain errors in our annual financial statements for the years ended 2010, 2011 and 2012, includingout-of-period adjustments and errors in the calculation of our depreciation, depletion and amortizationexpense and our asset retirement obligations. We and our independent registered public accountingfirm concluded that these control deficiencies constituted a material weakness in our controlenvironment. A material weakness is a control deficiency, or a combination of control deficiencies, ininternal control over financial reporting, such that there is a reasonable possibility that a materialmisstatement of our annual or interim financial statements will not be prevented or detected on atimely basis. The control deficiencies described above, at varying degrees of severity, contributed to thematerial weakness in the control environment as further described below.
In 2010 and 2011, we did not maintain effective controls to ensure that correct inputs and formulasin spreadsheets were used in our calculation of depreciation, depletion and amortization, or DD&A,expense. In 2012, the lack of effective controls over last-minute journal entries and use of final adjustedproduction data resulted in the misstatement of DD&A. For each of these periods, effective controlswere not adequately designed or consistently operating to ensure that key computations were properlyreviewed before the amounts were recorded in our accounting records. The above identified controldeficiencies resulted in audit adjustments to our consolidated financial statements during 2010, 2011,and 2012.
In December 2012, we were notified by the Oklahoma Tax Commission that sales tax had not beenremitted on tangible property conveyed as part of the sale of a number of oil and gas properties.Consequently, tax expense for periods prior to 2012 was understated. In 2013, we identified Oklahomaregulations regarding the payment of interest on accrued royalties which had not been recorded. Wedetermined the amount of interest payable and recognized additional interest expense which wasincorporated into our Consolidated Statements of Operations, as revised. The lack of Oklahoma legaland tax expertise on our staff led to these oversights. Management is reviewing the internal controlweakness related to these omissions to determine the proper organizational structure in response.
Effective internal controls are necessary for us to provide reliable financial reports, prevent fraudand to operate successfully as a publicly traded company. To comply with the requirements of being apublicly traded company, we may need to implement additional financial and management controls,reporting systems and procedures and hire additional accounting, finance, tax and legal staff. Ourefforts to develop and maintain our internal controls may not be successful, and we may be unable tomaintain effective controls over our financial processes and reporting in the future or to comply withour obligations under Section 404 of the Sarbanes-Oxley Act of 2002, which we refer to as Section 404.For example, Section 404 will require us, among other things, to annually review and report on, andour independent registered public accounting firm to attest to, the effectiveness of our internal controlsover financial reporting. We must comply with Section 404 (except for the requirement for an auditor’sattestation report) beginning with our fiscal year ending December 31, 2014. Any failure to develop,implement or maintain effective internal controls or to improve our internal controls could harm ouroperating results or cause us to fail to meet our reporting obligations. Given the difficulties inherent inthe design and operation of internal controls over financial reporting, we can provide no assurance asto our conclusions about the effectiveness of our internal controls, and we may incur significant costs in
50

our efforts to comply with Section 404. If one or more material weaknesses persist or if we fail toestablish and maintain effective internal control over financial reporting, our ability to accurately reportour financial results could be adversely affected. Ineffective internal controls could also subject us toregulatory scrutiny and a loss of confidence in our reported financial information, which could have anadverse effect on our business.
For as long as we are an emerging growth company, we will not be required to comply with certain disclosurerequirements that apply to other public companies.
In April 2012, President Obama signed into law the Jumpstart Our Business Startups Act (the‘‘JOBS Act’’). For as long as we remain an ‘‘emerging growth company’’ as defined in the JOBS Act,we may take advantage of certain exemptions from various reporting requirements that are applicableto other public companies that are not emerging growth companies, including not being required toprovide an auditor’s attestation report on management’s assessment of the effectiveness of our systemof internal control over financial reporting pursuant to Section 404 of the Sarbanes-Oxley Act andreduced disclosure obligations regarding executive compensation in our periodic reports. We willremain an emerging growth company for up to five years, although we will lose that status sooner if wehave more than $1.0 billion of revenues in a fiscal year, have more than $700 million in market valueof our Class A common stock held by non-affiliates, or issue more than $1.0 billion of non-convertibledebt over a three-year period.
To the extent that we rely on any of the exemptions available to emerging growth companies, youwill receive less information about our executive compensation and internal control over financialreporting than issuers that are not emerging growth companies.
We are subject to cyber security risks. A cyber incident could occur and result in information theft, datacorruption, operational disruption or financial loss.
The oil and gas industry has become increasingly dependent on digital technologies to conductcertain exploration, development, production, processing and distribution activities. For example, wedepend on digital technologies to interpret seismic data, manage drilling rigs, production equipmentand gathering and transportation systems, conduct reservoir modeling and reserves estimation andprocess and record financial and operating data. As an oil and natural gas producer, we face varioussecurity threats, including cyber-security threats. Cyber-security attacks in particular are increasing andinclude, but are not limited to, malicious software, attempts to gain unauthorized access to data, andother electronic security breaches that could lead to disruptions in critical systems, unauthorized releaseof confidential or otherwise protected information and corruption of data. Although to date we havenot experienced any material losses related to cyber-security attacks, we may suffer such losses in thefuture. Moreover, the various procedures and controls we use to monitor and protect against thesethreats and to mitigate our exposure to such threats may not be sufficient in preventing security threatsfrom materializing. If any of these events were to materialize, they could lead to losses of sensitiveinformation, critical infrastructure, personnel or capabilities essential to our operations and could havea material adverse effect on our reputation, financial position, results of operations or cash flows.
Loss of our information and computer systems could adversely affect our business.
We are heavily dependent on our information systems and computer based programs, including ourwell operations information, seismic data, electronic data processing and accounting data. If any of suchprograms or systems were to fail or create erroneous information in our hardware or software networkinfrastructure, possible consequences include our loss of communication links, inability to find, produce,process and sell oil, natural gas and NGLs and inability to automatically process commercialtransactions or engage in similar automated or computerized business activities. Any such consequencecould have a material adverse effect on our business.
51

We will be required to make payments under the Tax Receivable Agreement for certain tax benefits it mayreceive (or be deemed to receive), and the amounts of such payments could be significant.
We entered into the Tax Receivable Agreement with JEH LLC and the pre-IPO owners. Thisagreement generally provides for the payment by us of 85% of the amount of cash savings, if any, inU.S. federal, state and local income tax or franchise tax that we actually realize (or are deemed torealize in certain circumstances) as a result of (i) the tax basis increases resulting from the pre-IPOowners’ exchange of JEH LLC Units with JONE for shares of Class A common stock (or resultingfrom a sale of JEH LLC Units for cash) and (ii) imputed interest deemed to be paid by us as a resultof, and additional tax basis arising from, any payments we make under the Tax Receivable Agreement.In addition, payments we make under the Tax Receivable Agreement will be increased by any interestaccrued from the due date (without extensions) of the corresponding tax return.
The payment obligations under the Tax Receivable Agreement are our obligations and notobligations of JEH LLC. For purposes of the Tax Receivable Agreement, cash savings in tax generallyare calculated by comparing our actual tax liability to the amount we would have been required to payhad we not been able to utilize any of the tax benefits subject to the Tax Receivable Agreement. Theterm of the Tax Receivable Agreement will continue until all such tax benefits have been utilized orexpired, unless we exercise our right to terminate the Tax Receivable Agreement by making thetermination payment specified in the agreement.
The actual increase in tax basis, as well as the amount and timing of any payments under the TaxReceivable Agreement, will vary depending upon a number of factors, including the timing of theexchanges of JEH LLC Units, the price of Class A common stock at the time of each exchange, theextent to which such exchanges are taxable, the amount and timing of the taxable income we generatein the future and the tax rate then applicable, and the portion of our payments under the TaxReceivable Agreement constituting imputed interest or depletable, depreciable or amortizable basis. Weexpect that the payments that we will be required to make under the Tax Receivable Agreement couldbe substantial.
The payments under the Tax Receivable Agreement will not be conditioned upon a holder of rightsunder the Tax Receivable Agreement having a continued ownership interest in either JEH LLC or us.
In certain cases, payments under the Tax Receivable Agreement may be accelerated and/or significantly exceedthe actual benefits, if any, we realize in respect of the tax attributes subject to the Tax Receivable Agreement.
If we elect to terminate the Tax Receivable Agreement early or it is terminated early due tocertain mergers or other changes of control, we would be required to make an immediate paymentequal to the present value of the anticipated future tax benefits subject to the Tax ReceivableAgreement, which calculation of anticipated future tax benefits will be based upon certain assumptionsand deemed events set forth in the Tax Receivable Agreement, including the assumption that we havesufficient taxable income to fully utilize such benefits and that any JEH LLC Units that the pre-IPOOwners or their permitted transferees own on the termination date are deemed to be exchanged on thetermination date. Any early termination payment may be made significantly in advance of the actualrealization, if any, of such future benefits. In these situations, our obligations under the Tax ReceivableAgreement could have a substantial negative impact on our liquidity and could have the effect ofdelaying, deferring or preventing certain mergers, asset sales, other forms of business combinations orother changes of control due to the additional transaction cost a potential acquirer may attribute tosatisfying such obligations.
Payments under the Tax Receivable Agreement will be based on the tax reporting positions that wewill determine. The holders of rights under the Tax Receivable Agreement will not reimburse us for anypayments previously made under the Tax Receivable Agreement if such basis increases or other benefitsare subsequently disallowed, except that excess payments made to any pre-IPO Owner will be netted
52

against payments otherwise to be made, if any, to such pre-IPO owner after our determination of suchexcess. As a result, in such circumstances, we could make payments that are greater than its actual cashtax savings, if any, and may not be able to recoup those payments, which could adversely affect ourliquidity.
Item 1B. Unresolved Staff Comments
None.
Item 2. Properties
The information required by Item 2. is contained in Item 1. Business.
Item 3. Legal Proceedings
We are from time to time subject to, and are presently involved in, litigation or other legalproceedings arising out of the ordinary course of business. None of these legal proceedings areexpected to have a material adverse effect on our financial condition, results of operations or cash flow.With respect to these proceedings, our management believes that we will either prevail, have adequateinsurance coverage or have established appropriate reserves to cover potential liabilities. Any costs thatmanagement estimates may be paid related to these proceedings or claims are accrued when theliability is considered probable and the amount can be reasonably estimated. There can be noassurance, however, as to the ultimate outcome of any of these matters, and if all or substantially all ofthese legal proceedings were to be determined adversely to us, there could be a material adverse effecton our financial condition, results of operations and cash flow.
Items 4. Mine Safety Disclosures
Not applicable.
53

Part II
Item 5. Market for Registrant’s Common Equity, Related Stockholder Matters and Issuer Purchasesof Equity Securities
Our common stock is listed on the New York Stock Exchange (‘‘NYSE’’) under the symbol‘‘JONE.’’
The following table sets forth the range of high and low sales prices of our common stock asreported by the NYSE for the third and fourth quarters of 2013:
2013
High Low
3rd Quarter(1) . . . . . . . . . . . . . . . . . . . . . . . . . . . . . . . . . . . . . . $17.10 $13.604th Quarter . . . . . . . . . . . . . . . . . . . . . . . . . . . . . . . . . . . . . . . . . 18.14 13.15
(1) Represents the period from July 24, 2013, the date on which our common stock begantrading on the NYSE, through December 31, 2013.
On March 5, 2014, the last sale price of our common stock, as reported on the NYSE, was $15.04per share. As of March 5, 2014, there were 12,526,580 shares of Class A common stock outstandingheld by approximately 6 stockholders of record and 36,836,333 shares of Class B common stockoutstanding held by approximately 11 stockholders of record.
Dividend Policy
We have not paid any dividends and do not anticipate declaring or paying any cash dividends toholders of our Class A common stock in the foreseeable future. We currently intend to retain futureearnings, if any, to finance the growth of our business. Our future dividend policy is within thediscretion of our board of directors and will depend upon then existing conditions, including our resultsof operations, financial condition, capital requirements, investment opportunities, statutory restrictionson our ability to pay dividends and other factors our board of directors may deem relevant. In addition,our senior secured revolving credit facility and our second lien term loan facility prohibit us frompaying dividends.
54

11MAR201401095112
Stock Performance Graph
The following stock performance graph and related information shall not be deemed ‘‘solicitingmaterial’’ or to be ‘‘filed’’ with the SEC, nor shall such information be incorporated by reference intoany future filing under the Securities Act of 1933, as amended (the ‘‘Securities Act’’), or the SecuritiesExchange Act of 1934, as amended (the ‘‘Exchange Act’’), except to the extent that we specificallyincorporate such information by reference into such a filing. The graph and information is included forhistorical comparative purposes only and should not be considered indicative of future stockperformance.
The graph compares the cumulative total shareholder return to Jones Energy, Inc.’s commonstockholders as compared to the cumulative total returns on the Standard & Poor’s 500 index (‘‘theS&P 500 Index’’) and the Standard and Poor’s 500 Oil & Gas Exploration & Production Index(‘‘S&P 500 O&G E&P Index’’) since the time of our IPO. The graph was prepared assuming $100 wasinvested in our common stock at its initial public offering price of $15.00 per share and invested in theS&P 500 Index and the S&P 500 O&G E&P Index on July 24, 2013 at the closing price on such dateand tracked through December 31, 2013.
$80
$85
$90
$95
$100
$105
$110
$115
24-Jul-13 31-Aug-13 30-Sep-13 31-Oct-13 30-Nov-13 31-Dec-13
JONE S&P 500 S&P O&G E&P Index
55

Securities Authorized for issuance Under Equity Compensation Plans
The following table presents the securities authorized for issuance under the Jones Energy, Inc.2013 Omnibus Incentive Plan (the ‘‘LTIP’’) as of December 31, 2013.
Number of SharesNumber of Shares to be Weighted-Average Remaining Available forIssued Upon Exercise of Exercise Price of Future Issuance under
Outstanding Options, Outstanding Options, Equity CompensationPlan Category Warrants and Rights Warrants and Rights ($) Plans
Equity compensation plan approvedby security holders(1) . . . . . . . . . . — — 3,823,420(2)
Equity compensation plans notapproved by security holders . . . . . — — —
Total . . . . . . . . . . . . . . . . . . . . . . . — — 3,823,420
(1) Our 2013 Omnibus Incentive Plan (the ‘‘LTIP’’) was approved by our board of directors in July2013 and took effect on July 29, 2013. The LTIP was also approved by our shareholders at theAnnual Meeting of Shareholders on July 10, 2013.
(2) The LTIP may consist of the following components: restricted stock, stock options, performanceawards, restricted stock units, bonus stock awards, stock appreciation rights, cash awards, dividendequivalents, and other share-based awards. The LTIP limits the number of shares that may bedelivered pursuant to awards to 3,850,000 shares of our Class A common stock. On August 30,2013, pursuant to the terms of the LTIP, our board of directors approved an award of 6,645 sharesof restricted Class A common stock to each of the four non-employee directors of JONE, or26,580 shares of restricted stock in the aggregate.
Issuer Purchases of Equity Securities
None.
Sales of Unregistered Equity Securities
None.
Item 6. Selected Financial Data
The following table sets forth selected financial data of Jones Energy, Inc. and its predecessor forthe years ended December 31, 2013, 2012, 2011 and 2010. This information should be read inconnection with ‘‘Item 7. Management’s Discussion and Analysis of Financial Condition and Results of
56

Operations’’ and ‘‘Item 8. Financial Statements and Supplementary Data’’ presented elsewhere in thisreport.
Year Ended December 31,
2013 2012 2011 2010(in thousands except per share data)
Operating revenuesOil and gas sales . . . . . . . . . . . . . . . . . . . . . . . . . . . . . . . $258,063 $148,967 $167,261 $ 97,523Other revenues . . . . . . . . . . . . . . . . . . . . . . . . . . . . . . . . 1,106 847 1,022 933
Total operating revenues . . . . . . . . . . . . . . . . . . . . 259,169 149,814 168,283 98,456
Operating costs and expensesLease operating . . . . . . . . . . . . . . . . . . . . . . . . . . . . . . . 27,781 23,097 21,548 16,296Production taxes . . . . . . . . . . . . . . . . . . . . . . . . . . . . . . . 12,865 5,583 5,333 2,206Exploration . . . . . . . . . . . . . . . . . . . . . . . . . . . . . . . . . . . 1,710 356 780 4,208Depletion, depreciation and amortization . . . . . . . . . . . . . 114,136 80,709 68,906 48,008Impairment of oil and gas properties . . . . . . . . . . . . . . . . 14,415 18,821 31,970 10,727Accretion of discount . . . . . . . . . . . . . . . . . . . . . . . . . . . 608 533 413 490General and administrative (including non-cash
compensation expense) . . . . . . . . . . . . . . . . . . . . . . . . 31,902 15,875 16,679 11,423
Total operating expenses . . . . . . . . . . . . . . . . . . . . 203,417 144,974 145,629 93,358
Operating income . . . . . . . . . . . . . . . . . . . . . . . . . 55,752 4,840 22,654 5,098
Other income (expense)Interest expense . . . . . . . . . . . . . . . . . . . . . . . . . . . . . . . (30,774) (25,292) (21,994) (12,575)Net gain (loss) on commodity derivatives . . . . . . . . . . . . . (2,566) 16,684 34,490 23,758Gain on bargain purchase . . . . . . . . . . . . . . . . . . . . . . . . — — 26,208 —Gain (loss) on sales of assets . . . . . . . . . . . . . . . . . . . . . . (78) 1,162 (859) 8,644
Other income (expense), net . . . . . . . . . . . . . . . . . (33,418) (7,446) 37,845 19,827
Income (loss) before income tax . . . . . . . . . . . . . . 22,334 (2,606) 60,499 24,925
Income tax provisionCurrent . . . . . . . . . . . . . . . . . . . . . . . . . . . . . . . . 85 — — —Deferred . . . . . . . . . . . . . . . . . . . . . . . . . . . . . . . (156) 473 173 145
Total income tax provision . . . . . . . . . . . . . . . . . . . (71) 473 173 145
Net income (loss) . . . . . . . . . . . . . . . . . . . . . . . . . . . . . . 22,405 (3,079) 60,326 24,780Net income attributable to non-controlling interests . . . . . 24,591 — — —
Net income (loss) attributable to controlling interests . . . . $ (2,186) $ (3,079) $ 60,326 $ 24,780
Earnings per share:Basic and diluted . . . . . . . . . . . . . . . . . . . . . . . . . . . $ (0.17)
Weighted average shares outstanding:Basic and diluted . . . . . . . . . . . . . . . . . . . . . . . . . . . 12,500
Other Supplementary Data:EBITDAX(1) . . . . . . . . . . . . . . . . . . . . . . . . . . . . . . . $204,997 $135,741 $127,960 $ 74,771Adjusted net income(2) . . . . . . . . . . . . . . . . . . . . . . . . 54,792 29,411 34,894 17,599
(1) EBITDAX is a non-GAAP financial measure. For a definition of EBITDAX and a reconciliationof EBITDAX to our net income, see ‘‘—Non-GAAP Financial Measures’’ below.
57

(2) Adjusted net income is a non-GAAP financial measure. For a definition of adjusted net incomeand a reconciliation of adjusted net income to our net income, see ‘‘—Non-GAAP FinancialMeasures’’ below.
Year Ended December 31,
2013 2012 2011 2010(in thousands of dollars)
Statement of Cash Flow DataNet cash flow provided by operating activities . . . . . $ 163,896 $ 84,550 $ 120,217 $ 44,624Net cash used in investing activities . . . . . . . . . . . . . (383,600) (337,636) (318,963) (90,785)Net cash provided by financing activities . . . . . . . . . 219,798 270,676 186,322 49,200
Net increase (decrease) in cash . . . . . . . . . . . . . . . . $ 94 $ 17,590 $ (12,424) $ 3,039
As of December 31,
2013 2012 2011 2010(in thousands of dollars)
Balance Sheet DataCash and cash equivalents . . . . . . . . . . . . . . . . . . . $ 23,820 $ 23,726 $ 6,136 $ 18,560Other current assets . . . . . . . . . . . . . . . . . . . . . . . 106,459 74,886 88,546 49,742
Total current assets . . . . . . . . . . . . . . . . . . . . . . 130,279 98,612 94,682 68,302Property and equipment, net . . . . . . . . . . . . . . . . . 1,315,995 1,010,742 743,575 495,613Other long-term assets . . . . . . . . . . . . . . . . . . . . . 41,705 41,332 42,878 21,379
Total assets . . . . . . . . . . . . . . . . . . . . . . . . . . . . $1,487,979 $1,150,686 $881,135 $585,294
Current liabilities . . . . . . . . . . . . . . . . . . . . . . . . . $ 179,668 $ 93,421 $108,494 $ 60,938Long-term debt . . . . . . . . . . . . . . . . . . . . . . . . . . 658,000 610,000 415,000 225,000Other long-term liabilities . . . . . . . . . . . . . . . . . . . 26,187 18,865 11,733 14,907Total stockholders’ / members’ equity . . . . . . . . . . . 624,124 428,400 345,908 284,449
Total liabilities and stockholders’ / members’equity . . . . . . . . . . . . . . . . . . . . . . . . . . . . . . $1,487,979 $1,150,686 $881,135 $585,294
Non-GAAP financial measures
EBITDAX is a supplemental non-GAAP financial measure that is used by management andexternal users of our consolidated financial statements, such as industry analysts, investors, lenders andrating agencies.
We define EBITDAX as earnings before interest expense, income taxes, depreciation, depletionand amortization, exploration expense, gains and losses from derivatives less the current periodsettlements of matured derivative contracts and the other items described below. EBITDAX is not ameasure of net income as determined by United States generally accepted accounting principles, orGAAP. Management believes EBITDAX is useful because it allows them to more effectively evaluateour operating performance and compare the results of our operations from period to period andagainst our peers without regard to our financing methods or capital structure. We exclude the itemslisted above from net income in arriving at EBITDAX because these amounts can vary substantiallyfrom company to company within our industry depending upon accounting methods and book values ofassets, capital structures and the method by which the assets were acquired. EBITDAX has limitationsas an analytical tool and should not be considered as an alternative to, or more meaningful than, netincome as determined in accordance with GAAP or as an indicator of our liquidity. Certain itemsexcluded from EBITDAX are significant components in understanding and assessing a company’sfinancial performance, such as a company’s cost of capital and tax structure, as well as the historicalcosts of depreciable assets. Our presentation of EBITDAX should not be construed as an inferencethat our results will be unaffected by unusual or non-recurring items. Our computations of EBITDAXmay not be comparable to other similarly titled measures of other companies.
58

The following table sets forth a reconciliation of net income (loss) as determined in accordancewith GAAP to EBITDAX for the periods indicated:
Year Ended December 31,
2013 2012 2011 2010(in thousands of dollars)
Reconciliation of EBITDAX to net incomeNet income (loss) . . . . . . . . . . . . . . . . . . . . . . . . . . . . $ 22,405 $ (3,079) $ 60,326 $ 24,780Interest expense (excluding amortization of deferred
financing costs) . . . . . . . . . . . . . . . . . . . . . . . . . . . . 28,097 21,748 19,054 10,610Exploration expense . . . . . . . . . . . . . . . . . . . . . . . . . . . 1,710 356 780 4,208Income taxes . . . . . . . . . . . . . . . . . . . . . . . . . . . . . . . . (71) 473 173 145Amortization of deferred financing costs . . . . . . . . . . . . 2,677 3,544 2,940 1,965Depreciation and depletion . . . . . . . . . . . . . . . . . . . . . 114,136 80,709 68,906 48,008Impairment of oil and natural gas properties . . . . . . . . . 14,415 18,821 31,970 10,727Accretion expense . . . . . . . . . . . . . . . . . . . . . . . . . . . . 608 533 413 490Other non-cash charges . . . . . . . . . . . . . . . . . . . . . . . . 79 129 (59) 390Stock compensation expense . . . . . . . . . . . . . . . . . . . . . 10,838 570 1,134 —Other compensation expense . . . . . . . . . . . . . . . . . . . . 2,719 — — —Net (gain) loss on derivative contracts . . . . . . . . . . . . . . 2,566 (16,684) (34,490) (23,758)Current period settlements of matured derivative
contracts . . . . . . . . . . . . . . . . . . . . . . . . . . . . . . . . . 5,209 29,783 2,162 5,850Amortization of deferred revenue . . . . . . . . . . . . . . . . . (469) — — —Gain on bargain purchase . . . . . . . . . . . . . . . . . . . . . . — — (26,208) —Loss (gain) on sales of assets . . . . . . . . . . . . . . . . . . . . 78 (1,162) 859 (8,644)
EBITDAX . . . . . . . . . . . . . . . . . . . . . . . . . . . . . . . . . . $204,997 $135,741 $127,960 $ 74,771
Adjusted Net Income and Adjusted Earnings per Share are supplemental non-GAAP financialmeasures that are used by management and external users of the Company’s consolidated financialstatements.
We define Adjusted Net Income as net income excluding the impact of certain non-cash itemsincluding gains or losses on commodity derivative instruments not yet settled, impairment of oil and gasproperties, non-cash compensation expense, and the gain on bargain purchase associated with theSouthridge acquisition in 2011. We define Adjusted Earnings per Share as earnings per share plus thatportion of the components of adjusted net income allocated to the controlling interests divided byweighted average shares outstanding. We believe adjusted net income and adjusted earnings per shareare useful to investors because they provide readers with a more meaningful measure of ourprofitability before recording certain items for which the timing or amount cannot be reasonablydetermined. However, these measures are provided in addition to, not as an alternative for, and shouldbe read in conjunction with, the information contained in our financial statements prepared inaccordance with GAAP. Our computations of adjusted net income and adjusted earnings per share maynot be comparable to other similarly titled measures of other companies.
59

The following table provides a reconciliation of net income (loss) as determined in accordancewith GAAP to adjusted net income for the periods indicated.
Year Ended December 31,
2013 2012 2011 2010(in thousands except per share data)
Net income (loss) . . . . . . . . . . . . . . . . . . . . . . . . . . . . . . . $ 22,405 $ (3,079) $ 60,326 $ 24,780Net (gain) loss on derivative contracts . . . . . . . . . . . . . . 2,566 (16,684) (34,490) (23,758)Current period settlements of matured derivative
contracts . . . . . . . . . . . . . . . . . . . . . . . . . . . . . . . . . . 5,209 29,783 2,162 5,850Impairment of oil and gas properties . . . . . . . . . . . . . . . 14,415 18,821 31,970 10,727Non-cash stock compensation expense . . . . . . . . . . . . . . 10,838 570 1,134 —Other non-cash compensation expense . . . . . . . . . . . . . . 2,719 — — —Gain on bargain purchase . . . . . . . . . . . . . . . . . . . . . . . — — (26,208) —Tax impact(1) . . . . . . . . . . . . . . . . . . . . . . . . . . . . . . . . (3,360) — — —
Adjusted net income . . . . . . . . . . . . . . . . . . . . . . . . . . . . $ 54,792 $ 29,411 $ 34,894 $ 17,599
Adjusted net income attributable to non-controllinginterests . . . . . . . . . . . . . . . . . . . . . . . . . . . . . . . . . . . . (51,182)
Adjusted net income attributable to controlling interests . . . $ 3,610
Earnings per share (basic and diluted) . . . . . . . . . . . . . . . $ (0.17)Net (gain) loss on derivative contracts . . . . . . . . . . . . . . 0.43Current period settlements of matured derivative
contracts . . . . . . . . . . . . . . . . . . . . . . . . . . . . . . . . . . (0.01)Impairment of oil and gas properties . . . . . . . . . . . . . . . 0.29Non-cash stock compensation expense . . . . . . . . . . . . . . 0.02Other non-cash compensation expense . . . . . . . . . . . . . . —Tax impact . . . . . . . . . . . . . . . . . . . . . . . . . . . . . . . . . . (0.27)
Adjusted earnings per share (basic and diluted) . . . . . . . . . $ 0.29
Effective tax rate on net income attributable to controllinginterests . . . . . . . . . . . . . . . . . . . . . . . . . . . . . . . . . . . . 36.9%
(1) In arriving at adjusted net income, the tax impact of the adjustments to net income is determinedby applying the appropriate tax rate to each adjustment and then allocating the tax impact betweenthe controlling and non-controlling interests.
Item 7. Management’s Discussion and Analysis of Financial Condition and Results of Operations
The following discussion and analysis of our financial condition and results of operations should beread in conjunction with our Consolidated Financial Statements and the Notes to Consolidated FinancialStatements appearing elsewhere in this Annual Report on Form 10-K. The following discussion contains‘‘forward-looking statements’’ that are based on management’s current expectations, estimates andprojections about our business and operations, and that involve risks and uncertainties. Our actual resultsmay differ materially from those currently anticipated and expressed in such forward-looking statements as aresult of a number of factors, including those we discuss under ‘‘Risk Factors,’’ ‘‘Cautionary StatementRegarding Forward-Looking Statements’’ and elsewhere in this report.
Overview
Jones Energy, Inc. is an independent oil and gas company engaged in the exploration,development, production and acquisition of oil and natural gas properties in the Anadarko and Arkoma
60

basins of Texas and Oklahoma. We have drilled over 645 total wells, including over 460 horizontalwells, since our formation. We optimize returns through a disciplined emphasis on controlling costs andpromoting operational efficiencies, and we believe we are recognized as one of the lowest-cost drillingand completion operators in the Cleveland and Woodford shale formations.
As of December 31, 2013, our total estimated proved reserves were 89.0 MMBoe, of which 56%were classified as proved developed reserves. Approximately 19% of our total estimated provedreserves as of December 31, 2013 consisted of oil, 37% consisted of NGLs, and 44% consisted ofnatural gas.
Outlook
We have identified 2,542 additional gross drilling locations in our areas of operation for 2014 andbeyond, which we believe will enable us to drill and develop our resource base for many years. Webelieve that the commodity pricing environment will remain challenging for 2014, particularly fornatural gas and NGLs. However, we believe that our drilling and completion cost efficiencies and ourexisting drilling inventory position us to continue generating attractive economic rates of return and toseek complementary acquisition and joint development opportunities.
Our 2013 capital expenditures, excluding acquisitions, totaled $240 million, during which we drilled97 gross wells. We expect our 2014 capital expenditure budget to be approximately $350 million,$310 million of which is expected to be used to drill and complete wells. The remainder of the 2014capital expenditure budget is devoted to leasing and other discretionary expenditures. Please see‘‘Item 7. Management’s Discussion and Analysis of Financial Condition and Results of Operations—Liquidity and Capital Resources.’’ Assuming current market conditions and drilling success ratescomparable to our historical performance, we believe we will be able to fund all of our 2014 budgetedcapital expenditures with our cash flow from operations and projected availability under our seniorsecured revolving credit facility.
We currently have ten rigs running in our two core areas, eight in the Cleveland and two in theWoodford. We currently expect to allocate our 2014 capital expenditure budget as follows:
2014 CapitalExpenditure
Budget
(in millions)
Drilling and completion:Cleveland . . . . . . . . . . . . . . . . . . . . . . . . . . . . . . . . . . . . . . . . . . . $250Woodford . . . . . . . . . . . . . . . . . . . . . . . . . . . . . . . . . . . . . . . . . . 50Other . . . . . . . . . . . . . . . . . . . . . . . . . . . . . . . . . . . . . . . . . . . . . 10
Leasing . . . . . . . . . . . . . . . . . . . . . . . . . . . . . . . . . . . . . . . . . . . . . . . 20Other activities . . . . . . . . . . . . . . . . . . . . . . . . . . . . . . . . . . . . . . . . . . 20
All properties and activities . . . . . . . . . . . . . . . . . . . . . . . . . . . . . . . $350
NGLs are made up of ethane, propane, isobutane, butane and natural gasoline, all of which havedifferent uses and different pricing characteristics. Realized monthly pricing for NGLs, which comprised36% of our 2012 production and 28% of our 2013 production, has recently approached five-year lows,principally due to oversupply in the market. Under our sale contracts in the Anadarko basin, we aregenerally paid market rates for the NGLs we produce, so the lower pricing has resulted in lower NGLrevenues. However, under our sale contracts in the Arkoma Woodford, purchasers of NGLs have theability to bypass the separate purchase of ethane below specified price thresholds and to purchase theethane as part of a wet gas stream. Beginning in December 2012, purchasers have made this electionand are paying wet natural gas prices for the gas stream produced from our Arkoma Woodford
61

properties, which has resulted in increased natural gas production volumes and higher revenue from theethane as an incremental energy component of net natural gas than we would receive were it soldseparately at current prices. Although these elections can be made on a monthly basis and are entirelyoutside of our control, we anticipate, based on current forward price curves, that these purchasers willcontinue their elections to reject ethane and include it as part of the natural gas stream, which wouldhave the effect of increasing our natural gas production volumes and decreasing NGL productionvolumes, in each case, by the amount of ethane rejected. Ethane constituted approximately 50% and14% of our Woodford NGL production as of December 31, 2012 and December 31, 2013, respectively.A further or extended decline in NGL prices, or in oil or natural gas prices, could materially andadversely affect our financial position, our results of operations, the quantities of hydrocarbon reservesthat we can economically produce and our access to capital.
Basis of Presentation
We consider and report all of our operations as one segment.
Sources of our revenues
We derive our revenue from the production and sale of oil, natural gas and NGLs. Our revenuesare a function of oil, natural gas, and NGL production volumes sold and average sales prices receivedfor those volumes. We recognize revenues when the product is delivered at a fixed or determinableprice, title has transferred and collectability is reasonably assured and evidenced by a contract. Ourrevenues do not include the effects of our hedging activities and may vary substantially from period toperiod as a result of changes in production volumes or commodity prices.
Hedging
Due to the inherent volatility in oil and gas prices, we use commodity derivative instruments, suchas collars, swaps and puts to hedge price risk associated with a significant portion of our anticipated oil,natural gas and NGL production. These instruments allow us to reduce, but not eliminate, the potentialeffects of variability in cash flow from operations due to fluctuations in commodity prices. Theinstruments provide only partial price protection against declines in oil and gas prices, and maypartially limit our potential gains from future increases in prices. None of these instruments are usedfor trading purposes. We do not speculate on commodity prices but rather attempt to hedge physicalproduction by individual hydrocarbon product in order to protect returns. The only counterparties toour derivatives are current or former lenders under our senior secured revolving credit facility andpotential hedge positions are reviewed on a monthly basis. This eliminates potential margin calls inexecution and limits our credit exposure to these particular lenders. We have not designated any of ourderivative contracts as fair value or cash flow hedges. The changes in fair value of the contracts areincluded in net income. We record such derivative instruments as assets or liabilities in the statementsof financial position. During the year ended December 31, 2013, approximately 79% of our totalproduction for oil, natural gas and NGLs was hedged. As of December 31, 2013, approximately 35% ofour total forecasted production from proved reserves through 2018 was hedged, and the notional valueof our hedge position was over $680 million. We do not anticipate any substantial changes in ourhedging policy.
62

Our open positions as of December 31, 2013 were as follows:
Year Ending December 31,
2014 2015 2016 2017 2018
Oil positions(1):Swaps:
Hedged volume (MBbl) . . . . . . . . . . . . . . . . . . . . . . . . 1,773 1,271 946 625 —Weighted average price ($/Bbl) . . . . . . . . . . . . . . . . . . . $ 91.12 $ 89.27 $87.49 $84.92 —
Natural gas positions(2):Swaps:
Hedged volume (MMcf) . . . . . . . . . . . . . . . . . . . . . . . . 13,940 10,663 8,450 6,860 —Weighted average price ($/Mcf) . . . . . . . . . . . . . . . . . . $ 4.87 $ 4.89 $ 5.00 $ 4.50 —
NGL positions(3):Swaps:
Hedged volume (MBbl) . . . . . . . . . . . . . . . . . . . . . . . . 1,273 686 238 42 —Weighted average price ($/Bbl) . . . . . . . . . . . . . . . . . . . $ 29.27 $ 32.05 $49.82 $64.39 —
Basis positions(4):Swaps:
Hedged volume (MMcf) . . . . . . . . . . . . . . . . . . . . . . . . 7,260 4,350 1,000 — —Weighted average price ($/Mcf) . . . . . . . . . . . . . . . . . . $ (0.35) $ (0.33) $(0.28) — —
(1) The oil derivatives are settled based on the month’s average daily NYMEX price of West TexasIntermediate Light Sweet Crude.
(2) The natural gas derivatives are settled based on the NYMEX gas futures price for the calculationperiod.
(3) The NGL derivatives are settled based on the month’s average daily price of Mont Belvieu andConway ethane, propane, isobutane, butane and natural gasoline.
(4) The basis swap derivatives are settled based on the differential between the NYMEX gas futuresprice and the ANR Pipeline Co. Oklahoma price, the CenterPoint Energy Gas Transmission Co.east price, the Natural Gas Pipeline Co. of America Texok zone price, the Northern NaturalGas Co. demarcation price or the Panhandle Eastern Pipe Line Co. Texas/Oklahoma price.
Principal components of our cost structure
Lease operating expenses. These are daily costs incurred to bring oil and natural gas out of theground and to the market, together with the daily costs incurred to maintain our producing properties.Such costs also include maintenance, repairs and workover expenses related to our oil and gasproperties. Lease operating expenses include both a portion of costs that are fixed in nature, such asinfrastructure costs, as well as variable costs resulting from additional well maintenance and productionenhancements. As production increases, our average lease operating expense per barrel of oilequivalent is typically reduced because fixed costs do not increase proportionately with production.
Exploration. Exploration expense consists of geological and geophysical costs, seismic costs,amortization of unproved leasehold costs, and the costs to drill exploratory wells that do not findproved reserves.
Depreciation, depletion and amortization. Under the successful efforts accounting method that weemploy, we capitalize all costs associated with our acquisition, successful exploration, and alldevelopment efforts within cost centers classified by producing field. We then systematically expense thecosts in each field on a units-of-production basis based on proved oil and natural gas reserve quantities.
63

We calculate depletion on (i) all capitalized costs, other than the cost of investments in unprovedproperties and major development projects for which proved reserves cannot yet be assigned, lessaccumulated amortization; and (ii) the estimated plugging and abandonment costs, net of estimatedsalvage values. We calculate depreciation on the cost of fixed assets related to our pipelines and otherfixed assets over the estimated useful lives.
Impairment of oil and gas properties. This is the cost to reduce the carrying value of each field ofproved and unproved oil and gas properties to no more than the fair value of the particular field.
Accretion of discount. Accretion of discounts are related to our obligation for retirement of oiland gas wells and facilities. We record these liabilities when we place the assets in service, usingdiscounted present values of the estimated future obligation. We then record accretion of the liabilitiesas they approach maturity.
General and administrative. These are costs incurred for overhead, including payroll and benefitsfor our corporate staff, costs of maintaining our headquarters, costs of managing our production anddevelopment operations, audit and other fees for professional services and legal compliance.
Interest and other. The primary component of this line item is the interest paid to lenders. Wefinance a portion of our working capital requirements and capital expenditures with borrowings underour senior secured revolving credit facility and our second lien term loan facility. As a result, we incurinterest expense that is affected by both fluctuations in interest rates and our financing decisions. Thisclassification also includes the amortization of capitalized loan acquisition costs and bank feesassociated with the debt and commitment fees on undrawn portions of our revolving credit facilities.
64

Results of Operations
The following table summarizes our revenues, expenses and production data for the periodsindicated.
Years Ended December 31, Years Ended December 31,(in thousands of dollars except for production, 2013 2012 Change 2012 2011 Changesales price and average cost data)Revenues:
Oil . . . . . . . . . . . . . . . . . . . . . . . . $145,146 $ 66,921 $ 78,225 $ 66,921 $ 73,769 $ (6,848)Natural gas . . . . . . . . . . . . . . . . . . 55,511 30,503 25,008 30,503 39,983 (9,480)NGLs . . . . . . . . . . . . . . . . . . . . . . 57,406 51,543 5,863 51,543 53,509 (1,966)
Total oil and gas . . . . . . . . . . . . . 258,063 148,967 109,096 148,967 167,261 (18,294)Other . . . . . . . . . . . . . . . . . . . . . . 1,106 847 259 847 1,022 (175)
Total operating revenues . . . . . 259,169 149,814 109,355 149,814 168,283 (18,469)
Costs and expenses:Lease operating . . . . . . . . . . . . . . . 27,781 23,097 4,684 23,097 21,548 1,549Production taxes . . . . . . . . . . . . . . . 12,865 5,583 7,282 5,583 5,333 250Exploration . . . . . . . . . . . . . . . . . . 1,710 356 1,354 356 780 (424)Depletion, depreciation and
amortization . . . . . . . . . . . . . . . . 114,136 80,709 33,427 80,709 68,906 11,803Impairment of oil and gas properties 14,415 18,821 (4,406) 18,821 31,970 (13,149)Accretion of discount . . . . . . . . . . . 608 533 75 533 413 120General and administrative . . . . . . . 31,902 15,875 16,027 15,875 16,679 (804)
Total costs and expenses . . . . . . 203,417 144,974 58,443 144,974 145,629 (655)
Operating income . . . . . . . . . . 55,752 4,840 50,912 4,840 22,654 (17,814)
Other income (expenses):Interest expense . . . . . . . . . . . . . . . (30,774) (25,292) (5,482) (25,292) (21,994) (3,298)Net gain (loss) on commodity
derivatives . . . . . . . . . . . . . . . . . (2,566) 16,684 (19,250) 16,684 34,490 (17,806)Gain on bargain purchase . . . . . . . . — — — 26,208 (26,208)Gain (loss) on sales of assets . . . . . . (78) 1,162 (1,240) 1,162 (859) 2,021
Total other income (expense) . . (33,418) (7,446) (25,972) (7,446) 37,845 (45,291)
Income before income tax . . . . . . . . 22,334 (2,606) 24,940 (2,606) 60,499 (63,105)Income tax provision . . . . . . . . . . . . . (71) 473 (544) 473 173 300
Net income (loss) . . . . . . . . . . . . . . . 22,405 (3,079) 25,484 (3,079) 60,326 (63,405)Net income (loss) attributable to
non-controlling interests . . . . . . . . . 24,591 — 24,591 — — —
Net income (loss) attributable tocontrolling interests . . . . . . . . . . . . $ (2,186) $ (3,079) $ 893 $ (3,079) $ 60,326 $(63,405)
65

Years Ended December 31, Years Ended December 31,
2013 2012 Change 2012 2011 Change
Net production volumes:Oil (MBbls) . . . . . . . . . . . . . . . . . . . . . . 1,557 746 811 746 811 (65)Natural gas (MMcf) . . . . . . . . . . . . . . . . 17,575 14,066 3,509 14,066 11,443 2,623NGLs (MBbls) . . . . . . . . . . . . . . . . . . . . 1,724 1,773 (49) 1,773 1,215 558
Total (MBoe) . . . . . . . . . . . . . . . . . . . 6,210 4,863 1,347 4,863 3,933 930Average net (Boe/d) . . . . . . . . . . . . . . 17,014 13,287 3,727 13,287 10,775 2,512
Average sales price, unhedged:Oil (per Bbl), unhedged . . . . . . . . . . . . . $ 93.22 $ 89.71 $ 3.51 $ 89.71 $ 90.96 $ (1.25)Natural gas (per Mcf), unhedged . . . . . . . 3.16 2.17 0.99 2.17 3.49 (1.32)NGLs (per Bbl), unhedged . . . . . . . . . . . 33.30 29.07 4.23 29.07 44.04 (14.97)
Combined (per Boe) realized,unhedged . . . . . . . . . . . . . . . . . . . . 41.56 30.63 10.93 30.63 42.53 (11.90)
Average sales price, hedged:Oil (per Bbl), hedged . . . . . . . . . . . . . . . $ 87.86 $ 87.30 $ 0.56 $ 87.30 $ 99.02 $(11.72)Natural gas (per Mcf), hedged . . . . . . . . 3.93 3.76 0.17 3.76 2.48 1.28NGLs (per Bbl), hedged . . . . . . . . . . . . . 33.26 34.22 (0.96) 34.22 46.41 (12.19)
Combined (per Boe) realized, hedged . 42.40 36.76 5.64 36.76 41.98 (5.22)
Average costs (per BOE):Lease operating . . . . . . . . . . . . . . . . . . . $ 4.47 $ 4.75 $(0.28) $ 4.75 $ 5.48 $ (0.73)Production taxes . . . . . . . . . . . . . . . . . . . 2.07 1.15 0.92 1.15 1.36 (0.21)Depletion, depreciation and amortization . 18.38 16.60 1.78 16.60 17.52 (0.92)General and administrative . . . . . . . . . . . 5.14 3.26 1.88 3.26 4.24 (0.98)
Results of Operations—Year ended December 31, 2013 as compared to year ended December 31, 2012
Operating revenues
Oil and gas sales. Oil and gas sales increased by $109.1 million (73.2%) to $258.1 million for theyear ended December 31, 2013, as compared to $149.0 million for the year ended December 31, 2012.The majority of the increase (69.3%) was due to higher crude oil production volumes with theremainder of the increase being attributable to higher natural gas production volumes combined withhigher prices for all products. Average daily production increased 28.0% to 17,014 Boe per day for theyear ended December 31, 2013 as compared to 13,287 Boe per day for the year ended December 31,2012. Crude oil production increased 108.7% from 746 MBbls for the year ended December 31, 2012to 1,557 MBbls for the year ended December 31, 2013, primarily resulting from the wells acquired fromChalker, which generally have an oil production rate that is higher than our average historicalCleveland wells, combined with an increase in the number of wells drilled in 2013. Natural gasproduction increased 24.9% from 14,066 MMcf for the year ended December 31, 2012 to 17,575 MMcffor the year ended December 31, 2013, due to new wells added through drilling and the Chalkeracquisition. The average realized oil price, excluding the effects of commodity derivative instruments,increased from $89.71 per Bbl to $93.22 per Bbl, or 3.9%, year over year. The average realized naturalgas price, excluding the effects of commodity derivative instruments, increased from $2.17 per Mcf to$3.16 per Mcf, or 45.6%, year over year. The average realized natural gas liquids price, excluding theeffects of commodity derivative instruments, increased from $29.07 per Bbl to $33.30 per Bbl, or 14.6%.
Costs and expenses
Lease operating. Lease operating expense increased by $4.7 million (20.3%) to $27.8 million forthe year ended December 31, 2013, as compared to $23.1 million for the year ended December 31,
66

2012. The increase occurred in correlation with the 28.0% increase in production volumes. On a perunit basis, lease operating expense decreased by $0.28 per Boe or 5.9%, from $4.75 to $4.47 per Boe,for the year ended December 31, 2013 as compared to the year ended December 31, 2012. On anoverall basis, lease operating expense increased due to new wells coming on line and higher compressorand salt water disposal expenses associated with the Chalker wells (as compared to our historical set ofwells); however, on a per unit basis, lease operating expense decreased as the Chalker properties havean initial production rate that is higher than our average historical Cleveland well.
Production taxes. Production taxes increased by $7.3 million (130.4%) to $12.9 million for the yearended December 31, 2013, as compared to $5.6 million for the year ended December 31, 2012. Overallproduction taxes increased in conjunction with the 73.2% increase in revenue; however, the averageeffective rate increased from 3.7% for the year ended December 31, 2012 to 5.0% for the year endedDecember 31, 2013. Production taxes were at a higher rate during 2013 due to the acquisition anddrilling of the Chalker properties in Texas, which imposes a higher initial tax rate (7.5%) thanOklahoma (1%), where many of our other properties are located.
Exploration. Exploration expense increased from $0.4 million for the year ended December 31,2012 to $1.7 million for the year ended December 31, 2013. The increase was related to seismicexpenses incurred in the Arkoma.
Depreciation, depletion and amortization. Depreciation, depletion and amortization increased by$33.4 million (41.4%) to $114.1 million for the year ended December 31, 2013, as compared to$80.7 million for the year ended December 31, 2012. The increase was primarily the result of continueddrilling activity and the acquisition of the Chalker properties at the end of 2012. On a per unit basis,depletion expense increased $1.78 per Boe or 10.7% from $16.60 per Boe for the year endedDecember 31, 2012 as compared to $18.38 per Boe for the year ended December 31, 2013. The perunit increase resulted from the acquisition of the Chalker and Sabine properties, the write off ofproved undeveloped reserves attributable to the Southridge joint development agreement, and thehigher cost to drill wells in 2013 compared to historical wells. The write-off of the Southridge reserveswill increase depletion expense per Boe, provided all other inputs are constant.
Impairment of oil and gas properties. We had impairment charges on oil and gas properties of$14.4 million for the year ended December 31, 2013 as compared to impairment charges of$18.8 million for the year ended December 31, 2012. In the fourth quarter of 2013, the Companyrecorded an impairment charge of $14.4 million related to its unproved Southridge properties. As theCompany did not drill the required number of wells by October 31, 2013 necessary to keep its jointdevelopment agreement with Southridge in effect, the Company lost its right to drill the undevelopedacreage and associated unproved reserves. In 2012, all of the impairment charges related to inactivefields and minor plays, where the Company did not have any development. None of the 2013 chargeswere in the Cleveland formation.
General and administrative. General and administrative expenses increased by $16.0 million(100.6%) to $31.9 million for the year ended December 31, 2013, as compared to $15.9 million for theyear ended December 31, 2012. Of this increase, $10.8 million related to stock compensation expense(of which $9.6 million was related to the immediate vesting of certain shares on the IPO date) and$2.7 million related to a one-time non-cash distribution to management related to the Monarchincentive plan. 2012 includes $0.6 million of stock compensation expense. Excluding these non-cashitems, general and administrative expenses increased $3.0 million (19.6%) to $18.3 million for the yearended December 31, 2013, as compared to $15.3 million for the year ended December 31, 2012. Theincrease in cash general and administrative expense is attributable to an increase in salaries andbenefits due to an increase in headcount to support our increased drilling activity, which was partiallyoffset by an increase in overhead reimbursements, and an increase in professional fees incurred as aresult of being a public company for a portion of 2013. On a per unit basis, cash general and
67

administrative expenses decreased from $3.15 per Boe for the year ended December 31, 2012 to$2.95 per Boe for the year ended December 31, 2013. The increase in activity resulting from drillingand the acquisition of the Chalker properties significantly increased production (28.0% on a Boe basis)but did not result in a proportional increase in general and administrative expenses.
Interest and other. Interest and other financing expenses increased by $5.5 million (21.7%) to$30.8 million for the year ended December 31, 2013, as compared to $25.3 million for the year endedDecember 31, 2012. Of the total expense, interest paid under our bank debt totaled $26.3 million and$20.6 million for the years ended December 31, 2013 and 2012, respectively. We increased our debt atthe end of 2012 to fund the Chalker acquisition. In July 2013, a majority of this was paid down withthe proceeds from the initial public offering. At the end of 2013, we increased our debt again to fundthe Sabine acquisition. Our average debt outstanding for the year ended December 31, 2013 was$544.9 million as compared to $428.1 million for the year ended December 31, 2012 and the weightedaverage interest rate incurred on the outstanding borrowings was 4.82% and 4.96%, respectively.
Gain (loss) on commodity derivatives. We had a net loss on commodity derivatives of $2.6 millionfor the year ended December 31, 2013 as compared to a net gain of $16.7 million for the year endedDecember 31, 2012. The decrease is attributable to increases in crude oil and natural gas prices yearover year (crude oil prices averaged $97.97 during 2013 as compared to $94.20 during 2012 and naturalgas prices averaged $3.65 in 2013 as compared to $2.79 in 2012) combined with increases in futurecrude oil prices from 2012 to 2013 as compared to decreases in future crude oil prices from 2011 to2012. The 12-month forward prices at December 31, 2013 for crude oil averaged $95.66 per Bbl ascompared to $93.09 per Bbl at December 31, 2012, while the 12-month forward prices at December 31,2012 averaged $93.09 per Bbl as compared to $98.77 per Bbl at December 31, 2011.
Gain (loss) on sales of assets. The gain on sales of assets decreased from $1.2 million for the yearended December 31, 2012 to a loss of $0.1 million for the year ended December 31, 2013, due to thesale of properties in the North Barnett Shale during the first quarter of 2012 compared with nosignificant sales of properties in 2013.
Income taxes. The provision for income taxes calculated for 2013 reflects our reorganization andrecapitalization which occurred in connection with the Company’s initial public offering. Following theIPO, the Company is subject to federal and state income and franchise taxes, while only the Texasfranchise tax applied to JEH LLC prior to the IPO. The income tax expense decreased from$0.5 million for the year ended December 31, 2012 to a benefit of $0.1 million for the year endedDecember 31, 2013. The 2012 income tax expense solely reflected the Texas franchise tax liability forJEH LLC. The 2013 income tax benefit included a benefit for federal income taxes reduced by theTexas franchise tax expense. The non-controlling interest was allocated its proportionate share of theTexas franchise tax expense incurred during 2013.
Results of Operations—Year ended December 31, 2012 as compared to year ended December 31, 2011
Operating Revenues
Oil and gas sales. Our oil and gas sales decreased by $18.3 million (10.9%) to $149.0 millionduring the year ended December 31, 2012, as compared to $167.3 million for the year endedDecember 31, 2011. The revenue decrease was primarily due to lower commodity prices for natural gasand NGLs and lower oil production volumes. Realized average natural gas prices, without derivatives,decreased 37.8% during the year, falling to $2.17 per Mcf in 2012 from $3.49 per Mcf in 2011. Realizedaverage NGL prices, without derivatives, decreased 34.0%, falling to $29.07 per Bbl in 2012 from$44.04 per Bbl in 2011. Oil production declined to 746 MBbls in 2012 from 811 MBbls, a decrease of8.0%, as we pursued more wet gas prospects in 2012, increasing natural gas and NGL production by22.9% and 45.9%, respectively.
68

Costs and Expenses
Lease operating. Our lease operating expense increased by approximately $1.6 million (7.4%) to$23.1 million during the year ended December 31, 2012, as compared to $21.5 million for the yearended December 31, 2011. This increase was primarily due to an increase in the number of operatedwells due to continued drilling activity. On a per unit basis, lease operating expense decreased$0.73 per Boe to $4.75 per Boe in 2012 from $5.48 per Boe in 2011, due to the emphasis on drillingliquids-rich prospects, which increased the overall productivity of our properties, as the increase in theproduction of natural gas and NGLs offset the decline in oil production.
Production taxes. Our production taxes increased by $0.3 million to $5.6 million (5.7%) during theyear ended December 31, 2012, as compared to $5.3 million during the year ended December 31, 2011.Although total revenues decreased, the increase in production tax expense was primarily due to anincrease in the backlog of wells at the Railroad Commission of Texas, or TRRC, waiting for approval oftax rate reductions. We currently estimate that we have approximately $1.9 million in pending taxreductions with the TRRC.
Exploration. Exploration expenses decreased by $0.4 million to $0.4 million (50.0%) during theyear ended December 31, 2012, as compared to the $0.8 million during the year ended December 31,2011. The decrease was primarily due to no dry hole cost charged to expense in 2012.
Depreciation, depletion and amortization. Depreciation, depletion and amortization increased by$11.8 million to $80.7 million (17.1%) for the year ended December 31, 2012, as compared to$68.9 million for the year ended December 31, 2011. This was primarily a result of an increase inproduction and continued drilling activity. On a per unit basis, depletion expense decreased to$16.60 per Boe for 2012, compared to $17.52 per Boe for 2011 as overall production increased.
Impairment of oil and gas properties. Our impairment of oil and gas properties decreased by$13.2 million to $18.8 million for the year ended December 31, 2012, as compared to $32.0 million forthe year ended December 31, 2011. Our impairment charges relate to inactive fields and minor plays,which we are not currently developing. None of these charges were in the Cleveland or Woodford shaleformations. In 2011, impairment charges related to these fields, along with a number of sales of minorproperties, significantly reduced the remaining carrying values of these fields, thereby reducing furtherimpairment.
General and administrative. Our general and administrative expenses decreased by $0.8 million to$15.9 million (4.8%) during the year ended December 31, 2012, as compared to $16.7 million duringthe year ended December 31, 2011. The decrease was attributable to decreases in stock compensationexpenses and legal expenses in 2012 versus 2011, partially offset by an increase in staff. On a per unitbasis, general and administrative expense decreased in 2012 to $3.26 per Boe from $4.24 per Boe, dueto an increase in production without a commensurate rise in expense.
Interest and other. Our interest and other financing expenses increased by $3.3 million to$25.3 million (15.0%) during the year ended December 31, 2012, as compared to $22.0 million duringthe year ended December 31, 2011, primarily due to an $81.9 million increase in average outstandingdebt for 2012 as compared to the prior year. The increase in average outstanding debt was primarilyused to finance the Chalker acquisition and continued drilling activity.
Gain on commodity derivatives. Our net gain on commodity derivatives decreased by $17.8 millionto $16.7 million during the year ended December 31, 2012, as compared to $34.5 million during theyear ended December 31, 2011. The 2012 results include gains attributable to a drop in crude oilprices, compounded by an increase in oil production volumes hedged. The 12-month forward prices atDecember 31, 2012 for crude oil averaged $93.22 per Bbl, while the 12-month forward prices atDecember 31, 2011 averaged $98.77 per Bbl. These gains were reduced by higher gas prices, year over
69

year. The 12-month forward prices at December 31, 2012 for natural gas averaged $3.54 per MMBtu,while the 12-month forward prices at December 31, 2011 averaged $3.25 per MMBtu. The 2011 netgain was primarily attributable to a decrease in natural gas prices. The 12-month forward prices atDecember 31, 2011 for natural gas averaged $3.25 per MMBtu, while the 12-month forward prices atDecember 31, 2010 averaged $4.55 per MMBtu.
Gain (loss) on sales of assets. Our gain (loss) on sales of assets increased from a loss of$0.9 million during the year ended December 31, 2011 to a gain of $1.2 million during the year endedDecember 31, 2012, primarily due to the sale in 2012 of properties in the North Barnett Shale at a gaincompared to less significant sales of properties in 2011.
Liquidity and Capital Resources
Historically, our primary sources of liquidity have been private and public sales of our equity,borrowings under bank credit facilities and cash flows from operations. Our primary use of capital hasbeen for the exploration, development and acquisition of oil and gas properties. As we pursue reservesand production growth, we continually consider which capital resources, including equity and debtfinancings, are available to meet our future financial obligations, planned capital expenditure activitiesand liquidity requirements. Our future ability to grow proved reserves and production will be highlydependent on the capital resources available to us. We strive to maintain financial flexibility in order tomaintain substantial borrowing capacity under our senior secured revolving credit facility, facilitatedrilling on our undeveloped acreage positions and permit us to selectively expand our acreagepositions. Depending on the timing and concentration of the development of our non-proved locations,we may be required to generate or raise significant amounts of capital to develop all of our potentialdrilling locations should we endeavor to do so. In the event our cash flows are materially less thananticipated and other sources of capital we historically have utilized are not available on acceptableterms, we may curtail our capital spending. Our balance sheet at December 31, 2013 reflects a workingcapital deficit as we use the available balance of the borrowing base under our senior secured revolvingcredit facility to manage cash flow. The available borrowing base of $77.0 million exceeds the workingcapital deficit of $49.4 million.
Our 2014 capital budget will be primarily focused on the development of existing core areas in theCleveland and Woodford plays through exploitation and development. The ultimate amount of capitalwe will expend may fluctuate materially based on market conditions, the economic returns beingrealized and the success of our drilling results as the year progresses. We expect to fund our entire2014 capital budget with cash flows from operations and borrowings under our senior secured revolvingcredit facility. If necessary, we may also access capital through proceeds from potential assetdispositions and the future issuance of debt and/or equity securities.
The amount, timing and allocation of capital expenditures are largely discretionary and withinmanagement’s control. If oil and gas prices decline to levels below our acceptable levels, or costsincrease to levels above our acceptable levels, we may choose to defer a portion of our budgetedcapital expenditures until later periods in order to achieve the desired balance between sources anduses of liquidity and prioritize capital projects that we believe have the highest expected returns andpotential to generate near-term cash flow. We may also increase our capital expenditures significantlyto take advantage of opportunities we consider to be attractive. Because leases covering less than 3%of our core property acreage are set to expire through December 31, 2014, and all but 50 PUDlocations currently are held by production, we have the ability to materially decrease our drilling andrecompletion budget in response to market conditions with low risk of losing significant acreage. Weconsistently monitor and adjust our projected capital expenditures in response to success or lack ofsuccess in drilling activities, changes in prices, availability of financing, drilling and acquisition costs,industry conditions, the timing of regulatory approvals, the availability of rigs, contractual obligations,internally generated cash flow and other factors both within and outside our control.
70

The following table summarizes our cash flows for the years ended December 31, 2011, 2012 and2013:
Year Ended December 31,
2013 2012 2011
(in thousands)
Net cash provided by operating activities . . . . . . $ 163,896 $ 84,550 $ 120,217Net cash used in investing activities . . . . . . . . . . (383,600) (337,636) (318,963)Net cash provided by financing activities . . . . . . 219,798 270,676 186,322
Net increase (decrease) in cash . . . . . . . . . . . . . $ 94 $ 17,590 $ (12,424)
Cash Flow Provided by Operating Activities
Net cash provided by operating activities was $163.9 million for the year ended December 31, 2013as compared to cash provided by operating activities of $84.6 million for the year ended December 31,2012. The increase in operating cash flows was primarily due to a $109.1 million increase in oil and gasrevenues for the year ended December 31, 2013 as compared to the year ended December 31, 2012.The increase in revenue was primarily driven by a 108.7% increase in oil production volumes as aresult of drilling and the Chalker acquisition in the fourth quarter of 2012, combined with increases incrude oil and natural gas prices and other volumes. The increase in cash flow was offset by increasedcapital spending resulting from an increase in drilling activity from four rigs running at December 31,2012 to ten rigs running at December 31, 2013.
Net cash provided by operating activities was $84.6 million for the year ended December 31, 2012as compared to cash provided by operations of $120.2 million for the year ended December 31, 2011.The decrease in operating cash flows in 2012 compared to 2011 was primarily due to the decrease of$18.3 million in revenues year over year on relatively flat operating expenses. While productionincreased, the 37.8% drop in realized average natural gas prices and the 34.0% decline in realizedaverage NGL prices primarily drove the decrease in revenues. The reduction in net cash provided byoperating activities also stemmed from changes in working capital. Receivables from joint interestowners declined $13.1 million due to the Company retaining a higher working interest ownership inwells being drilled and a reduction in the number of active drilling rigs. In addition, oil and gas salespayable decreased $8.4 million.
Our operating cash flows are sensitive to a number of variables, the most significant of which isthe volatility of oil and gas prices. For additional information on the impact of changing prices on ourfinancial position, see ‘‘Item 7A. Quantitative and Qualitative Disclosures about Market Risk.’’
Cash Flow Used in Investing Activities
Net cash used in investing activities was $383.6 million for the year ended December 31, 2013 ascompared to cash used in investing activities of $337.6 million for the year ended December 31, 2012.The increase was primarily driven by higher capital expenditures which increased $117.5 million duringthe year ended December 31, 2013 as compared to the year ended December 31, 2012 due to anincrease in drilling activity. The increase in capital expenditures was partially offset by the decrease inacquisitions as the purchase price of the Sabine acquisition ($193.5 million) at the end of 2013 was lessthan that of the Chalker acquisition ($253.5 million) at the end of 2012. Additionally, cash flows fromcurrent period settlements of our commodity derivatives instruments decreased by $21.1 million for theyear ended December 31, 2013 as compared to the year ended December 31, 2012 as a result of anincrease in crude oil and natural gas prices. Finally, we received cash proceeds of $9.2 million from thesale of North Barnett properties in the first quarter of 2012, and experienced no meaningful sales ofproperties occurring during the year ended December 31, 2013.
71
We had net cash used in investing activities of $337.6 million for the year ended December 31,2012 as compared to cash used in investing of $319.0 million for the year ended December 31, 2011.The increase in cash used in investing activities was primarily related to the Chalker acquisition in 2012which was larger than the Southridge acquisition in 2011. This incremental acquisition investment waspartially offset by a decline in net drilling and equipment expenditures and an increase in gains realizedthrough commodity derivatives in 2012.
We expect our 2014 capital expenditures to be approximately $350 million, which is a 46% increaseover the $240 million incurred for 2013. Expenditures for development and exploration of oil and gasproperties are the primary use of our capital resources. Our capital budget may be adjusted as businessconditions warrant. The amount, timing and allocation of capital expenditures is largely discretionaryand within our control. If oil and natural gas prices decline or costs increase significantly, we coulddefer a significant portion of our budgeted capital expenditures until later periods to prioritize capitalprojects that we believe have the highest expected returns and potential to generate near-term cashflows. We routinely monitor and adjust our capital expenditures in response to changes in prices,availability of financing, drilling and acquisition costs, industry conditions, the timing of regulatoryapprovals, the availability of rigs, the degree of success in drilling activities, contractual obligations,internally generated cash flows and other factors both within and outside our control.
Cash Flow Provided by Financing Activities
Net cash provided by financing activities was $219.8 million for the year ended December 31, 2013as compared to net cash provided by financing activities of $270.7 million for the year endedDecember 31, 2012. The decrease in cash flows provided by financing activities was primarily due to netborrowings of $47.3 million during 2013 as compared to $185.7 million during 2012. The net proceedsfrom the initial public offering of our Class A common stock of $172.5 million (net of expenses) in thethird quarter of 2013 were used to repay debt of $167.0 million during the year ended December 31,2013.
Net cash provided by financing activities was $270.7 million during the year ended December 31,2012 as compared to cash provided by financing of $186.3 million during the year ended December 31,2011. The increase in cash flows provided by financing activities was primarily due to an $85.0 millioncontribution of new equity capital by our existing owners for preferred units. Borrowings under ourcredit facility, net of repayments, remained relatively unchanged at $185.7 million in 2012 and$186.3 million in 2011.
Credit Facilities
Senior Secured Revolving Credit Facility. JEH LLC has a $1 billion senior secured revolving creditfacility with Wells Fargo Bank, N.A. as the administrative agent, and a syndicate of lenders. Availabilityunder the senior secured revolving credit facility is subject to a borrowing base, which is currently$575 million. The senior secured revolving credit facility matures in November 2017. As ofDecember 31, 2013, JEH LLC had borrowings of $498 million outstanding under the senior securedrevolving credit facility. JEH LLC’s obligations under the senior secured revolving credit facility areguaranteed by Jones Energy, Inc. and JEH LLC’s domestic subsidiaries and are secured by substantiallyall of its and their assets (other than equity interests of JEH LLC held by Jones Energy, Inc.).
The borrowing base under our senior secured revolving credit facility was redetermined by thelenders on December 18, 2013, which was deemed to be the redetermination scheduled for August 1,2013, and will be redetermined on April 1, 2014 and semi-annually thereafter on February 1 andAugust 1 of each year. JEH LLC and the administrative agent (acting at the direction of lendersholding at least 662⁄3% of the outstanding loans and letter of credit obligations) may each request oneunscheduled borrowing base redetermination between each scheduled redetermination. In addition, the
72

lenders may elect to redetermine the borrowing base upon the occurrence of certain defaults under ourmaterial operating agreements or upon the cancellation or termination of certain of our jointdevelopment agreements. The borrowing base will also be reduced in certain circumstances as a resultof our issuance of unsecured notes by an amount equal to 25% of the principal amount of unsecurednotes issued in excess of $400 million, our termination of certain hedging positions and ourconsummation of certain asset sales.
If the aggregate outstanding principal amount of the revolving loans under the senior securedrevolving credit facility exceeds the borrowing base as a result of a scheduled or interim adjustment ofthe borrowing base, we must prepay revolving loans in an amount equal to such excess and, if necessaryto eliminate such excess, cash collateralize outstanding letters of credit within 90 days following thedate the adjustment occurs or the date we receive notice thereof (with at least one-half of theprepayment to be paid or deposited within 45 days following such date). However, if such a borrowingbase deficiency results from a permitted disposition of oil and gas properties, we must make suchprepayment and/or deposit of cash collateral on the date we receive cash proceeds as a result of suchdisposition, and if such a borrowing base deficiency results from certain terminations or modificationsof hedge positions, we must immediately make such prepayment and/or deposit of cash collateral.Otherwise, all unpaid principal and interest is due at maturity.
On January 29, 2014, JEH LLC entered into an Eighth Amendment (the ‘‘Eighth Amendment’’) tothe senior secured revolving credit facility. The Eighth Amendment amends the senior securedrevolving credit facility to, among other things, (1) reduce the commitment fee and interest rate marginapplicable to loans under the senior secured revolving credit facility, (2) increase the basket availablefor issuance of senior unsecured notes from $300 million to $500 million, (3) provide additionalflexibility with respect to entrance into derivative arrangements in anticipation of acquisitions of oil andgas properties and (4) provide for a guarantee of JEH LLC’s obligations under the senior securedrevolving credit facility by Jones Energy, Inc. The foregoing description of the Eighth Amendment isnot complete and is qualified by reference to the complete document, which is attached hereto asExhibit 10.20 and is incorporated herein by reference.
Interest on loans under our senior secured revolving credit facility is calculated at a base rate(being at JEH LLC’s option, either (i) the per annum rate appearing on Reuters Screen LIBOR01Page, or the LIBO Rate, for the applicable interest period or (ii) the greatest of (x) the prime rateannounced by Wells Fargo Bank, N.A., (y) the federal funds rate plus 0.50% and (z) the one-monthadjusted LIBO Rate plus 1.00%, plus a margin ranging from 0.50% to 2.50% based on the actualamount borrowed compared to the borrowing amount and the base rate selected. JEH LLC is alsorequired to pay a quarterly commitment fee on the unused portion of the aggregate commitments ofthe lenders, at a rate per annum of either 0.375% or 0.50%, depending on our utilization of theborrowing base.
The senior secured revolving credit facility contains various covenants that, among other things,limit our ability to:
• incur indebtedness;
• grant liens on our assets;
• pay dividends or distributions or redeem any of our equity interests, or prepay any of the secondlien term loans (with an exception allowing us to repay the second lien term loans from theproceeds of the issuance of senior unsecured notes);
• make certain investments, loans and advances;
• merge into or with or consolidate with any other person, or dispose of all or substantially all ofour property to any other person;
73

• engage in certain asset dispositions;
• enter into transactions with affiliates;
• grant negative pledges or agree to restrict dividends or distributions from subsidiaries;
• allow gas imbalances, take-or-pay or certain other prepayments with respect to oil and gasproperties; and
• enter into certain derivative arrangements.
The senior secured revolving credit facility also contains a covenant which restricts the ability of JonesEnergy, Inc. to (i) hold any assets, (ii) incur, create, assume, or suffer to exist any debt or any otherliability or obligation, (iii) create, make or enter into any investment or (iv) engage in any other activityor operation other than, among other exceptions described therein, its ownership of equity interests inJEH LLC and the activities of a passive holding company and assets and operations incidental thereto(including the maintenance of cash and reserves for the payment of taxes, franchises, and otheroperational costs and expenses).
Jones Energy, Inc. and its consolidated subsidiaries are also required under the senior securedrevolving credit facility to maintain the following financial ratios:
• a total leverage ratio, consisting of consolidated debt to EBITDAX, of not greater than 4.00 to1.00 as of the last day of any fiscal quarter; and
• a current ratio, consisting of consolidated current assets, including the unused amounts of thetotal commitments, to consolidated current liabilities, of not less than 1.0 to 1.0 as of the lastday of any fiscal quarter.
We believe that we are in compliance with the terms of our senior secured revolving credit facility.If an event of default exists under the credit agreement, the lenders will be able to accelerate theobligations outstanding under the credit agreement and exercise other rights and remedies. Our seniorsecured revolving credit facility contains customary events of default, including a change of control, asdefined in the senior secured revolving credit facility.
Second Lien Term Loan Facility. In addition, JEH LLC has a $160 million second lien term loanfacility with Wells Fargo Energy Capital, Inc., as the administrative agent, and a syndicate of lenders.The second lien term loan facility matures in May 2018. JEH LLC currently has $160 million in loansoutstanding under the second lien facility. An intercreditor agreement governs the relationship betweenthe lenders under the senior secured revolving credit facility and the lenders under the second lienterm loan facility.
The principal amount of the loans borrowed under the second lien term loan facility is due in fullon the maturity date. Interest on our second lien term loan facility is calculated at a base rate (being,at JEH LLC’s option, either (i) the LIBO Rate for the applicable interest period (but in any event notless than 2.00%) or (ii) the greatest of (x) the prime rate announced by Wells Fargo Bank, N.A.,(y) the federal funds rate plus 0.50% and (z) the one-month adjusted LIBO Rate plus 1.00%, plus amargin of either 6.0% or 7.0% based on the base rate selected.
Our second lien term loan facility contains various restrictive covenants that are similar to those inour senior secured revolving credit facility.
Off-Balance Sheet Arrangements
At December 31, 2013, we did not have any off-balance sheet arrangements.
74

Contractual Obligations
The following table summarizes our contractual obligations as of December 31, 2013:
Payments Due by Period
Less thanTotal 1 Year 1 - 3 Years 4 - 5 Years Thereafter
(dollars in thousands)
Long-term debt obligations . . . . . . . . . . . . . . . $658,000 $ — $498,000 $160,000 $ —Interest expense . . . . . . . . . . . . . . . . . . . . . . . 121,556 29,691 86,774 5,090 —Drilling rig commitments . . . . . . . . . . . . . . . . . 19,727 19,727 — — —Commodity derivative obligations . . . . . . . . . . . 10,855 10,665 190 — —Operating lease obligations . . . . . . . . . . . . . . . 1,637 586 1,051 — —Asset retirement obligations, discounted . . . . . . 10,963 2,590 812 493 7,068
Total . . . . . . . . . . . . . . . . . . . . . . . . . . . . . . . . $799,283 $63,259 $586,827 $165,583 $7,068
Critical Accounting Policies and Estimates
The discussion and analysis of our financial condition and results of operations are based upon ourconsolidated financial statements, which have been prepared in accordance with accounting principlesgenerally accepted in the United States, or GAAP. As used herein, the following acronyms have thefollowing meanings: ‘‘FASB’’ means the Financial Accounting Standards Board; the ‘‘Codification’’refers to the Accounting Standards Codification, the collected accounting and reporting guidancemaintained by the FASB; ‘‘ASC’’ means Accounting Standards Codification and is generally followed bya number indicating a particular section of the Codification; and ‘‘ASU’’ means Accounting StandardsUpdate, followed by an identification number, which are the periodic updates made to the Codificationby the FASB.
The preparation of our consolidated financial statements requires us to make estimates andassumptions that affect our reported results of operations and the amount of reported assets, liabilitiesand proved oil and natural gas reserves. Some accounting policies involve judgments and uncertaintiesto such an extent that there is reasonable likelihood that materially different amounts could have beenreported under different conditions or if different assumptions had been used. Actual results may differfrom the estimates and assumptions used in the preparation of our consolidated financial statements.Described below are the most significant policies we apply in preparing our consolidated financialstatements, some of which are subject to alternative treatments under GAAP. We also describe themost significant estimates and assumptions we make in applying these policies.
Use of Estimates. The preparation of consolidated financial statements in conformity with GAAPrequires management to make estimates and assumptions that affect the reported amounts of assetsand liabilities and disclosure of contingent assets and liabilities at the date of the consolidated financialstatements and the amounts of revenues and expenses reported for the period then ended.
Reserves. Reserve estimates significantly impact depreciation and depletion expense and thecalculation of potential impairments of oil and gas properties. Under the SEC rules, proved reservesare those quantities of oil and gas, which, by analysis of geoscience and engineering data, can beestimated with reasonable certainty to be economically producible from a given date forward, fromknown reservoirs, and under existing economic conditions, operating methods, and governmentregulations. The term ‘‘reasonable certainty’’ implies a high degree of confidence that the quantities ofoil and natural gas actually recovered will equal or exceed the estimate. Reasonable certainty can beestablished using techniques that have been proven effective by actual production from projects in thesame reservoir or an analogous reservoir or by other evidence using reliable technology that establishesreasonable certainty. Reliable technology is a grouping of one or more technologies (including
75

computational methods) that has been field tested and has been demonstrated to provide reasonablycertain results with consistency and repeatability in the formation being evaluated or in an analogousformation.
Probable reserves are those additional reserves that are less certain to be recovered than provedreserves but which, together with proved reserves, are as likely as not to be recovered. Whendeterministic methods are used, it is as likely as not that actual remaining quantities recovered willexceed the sum of estimated proved plus probable reserves. When probabilistic methods are used, thereshould be at least a 50% probability that the actual quantities recovered will equal or exceed theproved plus probable reserves estimates.
Possible reserves are those additional reserves that are less certain to be recovered than probablereserves. When deterministic methods are used, the total quantities ultimately recovered from a projecthave a low probability of exceeding proved plus probable plus possible reserves. When probabilisticmethods are used, there should be at least a 10% probability that the total quantities ultimatelyrecovered will equal or exceed the proved plus probable plus possible reserves estimates.
Reserves were calculated using an unweighted arithmetic average of commodity prices in effect onthe first day of each month within the twelve-month period ending on the date as of which theapplicable estimate is presented. These prices were adjusted for quality, transportation fees,geographical differentials, marketing bonuses or deductions and other factors affecting the pricereceived at the wellhead.
Periodic revisions to the estimated reserves and related future cash flows may be necessary as aresult of a number of factors, including reservoir performance, new drilling, oil and natural gas prices,cost changes, technological advances, new geological or geophysical data or other economic factors.Accordingly, reserve estimates are generally different from the quantities of oil and natural gas that areultimately recovered. We cannot predict the amounts or timing of future reserve revisions. If suchrevisions are significant, they could significantly affect future amortization of capitalized costs and resultin impairment of assets that may be material.
Property and Equipment. Oil and gas producing activities are accounted for using the successfulefforts method of accounting. Under the successful efforts method, lease acquisition costs and alldevelopment costs, including unsuccessful development wells, are capitalized.
Unproved Properties—Acquisition costs associated with the acquisition of non-producing leaseholdsare recorded as unproved leasehold costs and capitalized as incurred. These consist of costs incurred inobtaining a mineral interest or right in a property, such as a lease in addition to options to lease,broker fees, recording fees and other similar costs related to activities in acquiring properties.Leasehold costs are classified as unproved until proved reserves are discovered, at which time relatedcosts are transferred to proved oil and gas properties.
Exploration Costs—Exploration costs, other than exploration drilling costs, are charged to expenseas incurred. These costs include seismic expenditures and other geological and geophysical costs,amortization of unproved leasehold costs, and lease rentals. The costs of drilling exploratory wells andexploratory-type stratigraphic wells are initially capitalized pending determination of whether the wellhas discovered proved commercial reserves. If the exploratory well is determined to be unsuccessful,the cost of the well is transferred to expense.
Proved Oil and Gas Properties—Costs incurred to obtain access to proved reserves and to providefacilities for extracting, treating, gathering, and storing oil, gas and NGLs are capitalized. All costsincurred to drill and equip successful exploratory wells, development wells, development-typestratigraphic test wells, and service wells, including unsuccessful development wells, are capitalized.
76

Impairment—The capitalized costs of proved oil and gas properties are reviewed at least annuallyfor impairment, whenever events or changes in circumstances indicate that the carrying amount of along-lived asset or asset group exceeds its fair market value and is not recoverable. The determinationof recoverability is based on comparing the estimated undiscounted future net cash flows from aproducing field to the carrying value of the assets. If the future undiscounted cash flows, based onestimates of anticipated production and future oil and natural gas prices and operating costs, are lowerthan the carrying cost, the carrying cost of the field assets is reduced to fair value. For our proved oiland gas properties, we estimate fair value by discounting the projected future cash flows at anappropriate risk-adjusted discount rate.
Unproved leasehold costs are assessed at least annually to determine whether they have beenimpaired. Individually significant properties are assessed for impairment on a property-by-propertybasis, while individually insignificant unproved leasehold costs may be assessed in the aggregate. Ifunproved leasehold costs are found to be impaired, an impairment allowance is provided and a loss isrecognized in the statement of operations.
Depreciation, Depletion and Amortization—Depreciation, depletion and amortization, or DD&A, ofcapitalized costs of proved oil and gas properties is computed using the unit-of-production methodbased upon estimated proved reserves. Assets are grouped for DD&A purposes on the basis of areasonable aggregation of properties producing from or expected to be developed in a basin orformation. The reserve base used to calculate DD&A for leasehold acquisition costs and the cost toacquire proved properties is the sum of proved developed reserves and proved undeveloped reserves.The reserve base used to calculate DD&A for drilling, completion and well equipment costs, whichinclude development costs and successful exploration drilling costs, includes only proved developedreserves.
Sales—Sales of significant portions of a proved field are charged to income as incurred. Gain orloss on the sale is recognized to the extent of the difference between the net proceeds received and theremaining carrying value of the properties sold. Proceeds from the sale of insignificant portions of alarger proved field are accounted for as a recovery of costs, thereby reducing the carrying value of thefield until such value reaches zero. For sales of entire working interests in unproved properties, gain orloss is recognized to the extent of the difference between the proceeds received and the net carryingvalue of the property. Proceeds from sales of partial interests in unproved properties are accounted foras a recovery of costs unless the proceeds exceed the entire cost of the property.
Revenue Recognition. We recognize oil, gas and NGL revenues when products are delivered at afixed or determinable price, title has transferred and collectability is reasonably assured (sales method).Oil and natural gas sold is not significantly different from our share of production.
Derivative Financial Instruments. We use derivative contracts to hedge the effects of fluctuations inthe prices of oil, natural gas and NGLs. We record such derivative instruments as assets or liabilities inthe statements of financial position (see Note 4, ‘‘Fair Value Measurement,’’ in the Notes toConsolidated Financial Statements for further information on fair value). Estimating the fair value ofderivative financial instruments requires management to make estimates and judgments regardingvolatility and counterparty credit risk. We use net presentation of derivative assets and liabilities whensuch assets and liabilities are with the same counterparty and allowed under the ISDA tradingagreement with such counterparty.
We have not designated any of our derivative contracts as fair value or cash flow hedges. Thechanges in fair value of the contracts are included in net income in the period of the change as ‘‘Netgain (loss) on commodity derivatives.’’
Share-Based Compensation. We measure and record compensation expense for all share-basedpayment awards to employees and directors based on estimated grant-date fair values. Compensation
77

costs for share-based awards are recognized over the requisite service period based on the grant-datefair value. Prior to our IPO, we were not publicly traded, and did not have a listed price with which tocalculate fair value. We have historically and consistently calculated fair value using combined valuationmodels including an enterprise valuation approach; an income approach, utilizing future discounted andundiscounted cash flows; and a market approach, taking into consideration peer group analysis ofpublicly traded companies, and when available, actual cash transactions in our common stock.
Acquisitions. Acquisitions are accounted for as purchases and, accordingly, the results ofoperations are included in our statement of operations from the closing date of the acquisition.Purchase prices are allocated to acquired assets and assumed liabilities, if any, based on their estimatedfair value at the time of the acquisition. We have historically and consistently calculated fair value usingcombined valuation models including an enterprise valuation approach; an income approach, utilizingfuture discounted and undiscounted cash flows; and a market approach, taking into consideration peergroup analysis of publicly traded companies.
Asset Retirement Obligations. We recognize as a liability an asset retirement obligation, or ARO,associated with the retirement of a tangible long-lived asset in the period in which it is incurred orbecomes determinable (as defined by the standard), with an associated increase in the carrying amountof the related long-lived asset. The cost of the tangible asset, including the initially recognized assetretirement cost, is depreciated over the useful life of the asset and accretion expense is recognized overtime as the discounted liability is accreted to its expected settlement value. We measure the fair valueof the ARO using expected future cash outflows for abandonment discounted generally at our cost ofcapital at the time of recognition.
Estimating the future ARO requires management to make estimates and judgments regardingtiming and existence of a liability, as well as what constitutes adequate restoration. Inherent in the fairvalue calculation are numerous assumptions and judgments including the ultimate costs, inflationfactors, credit adjusted discount rates, timing of settlement and changes in the legal, regulatory,environmental and political environments. To the extent future revisions to these assumptions impactthe fair value of the existing ARO liability, a corresponding adjustment is made to the related asset.
Recent Accounting Pronouncements
In December 2011, the Financial Accounting Standards Board, or the FASB, issued an AccountingStandards Update, or ASU, that requires an entity to disclose information about offsetting and relatedarrangements to enable users of its financial statements to understand the effect of those arrangementson its financial position. The ASU requires disclosure of both gross information and net informationabout both instruments and transactions eligible for offset in the statement of financial position andinstruments and transactions subject to an agreement similar to a master netting arrangement. Thesedisclosure requirements are effective for interim and annual periods beginning after January 1, 2013.We have provided all required disclosures for the periods presented as they pertain to its commodityderivative instruments (see Note 4, ‘‘Fair Value Measurement’’ in Item 8. Financial Statements andSupplementary Data). These disclosure requirements did not affect our operating results, financialposition, or cash flows.
Item 7A. Quantitative and Qualitative Disclosures about Market Risk
We are exposed to certain market risks that are inherent in our financial statements that arise inthe normal course of business. We may enter into derivative instruments to manage or reduce marketrisk, but do not enter into derivative agreements for speculative purposes.
We do not designate these or future derivative instruments as hedges for accounting purposes.Accordingly, the changes in the fair value of these instruments are recognized currently in earnings.
78

Commodity price risk and hedges
Our principal market risk exposure is to oil, natural gas and NGL prices, which are inherentlyvolatile. As such, future earnings are subject to change due to fluctuations in such prices. Realizedprices are primarily driven by the prevailing prices for oil and regional spot prices for natural gas andNGLs. We have used, and expect to continue to use, oil, natural gas and NGL derivative contracts toreduce our risk of price fluctuations of these commodities. Pursuant to our risk management policy, weengage in these activities as a hedging mechanism against price volatility associated with projectedproduction levels. The fair value of our oil, natural gas and NGL derivative contracts at December 31,2013 was a net asset of $23.4 million.
As of December 31, 2013, we have hedged approximately 35% of our total forecasted productionfrom proved reserves through December 31, 2018. For information regarding the terms of these hedges,please see ‘‘—Basis of presentation—Hedging’’ above. The production hedged thereby is consistentwith the anticipated monthly production levels in the December 31, 2013 reserve report prepared byCawley Gillespie, which is based on prices, costs and other assumptions required by SEC rules. Ouractual production will vary from the amounts estimated in this reserve report, perhaps materially.Please read ‘‘Risk factors—Our estimated oil and natural gas reserve quantities and future productionrates are based on many assumptions that may prove to be inaccurate. Any material inaccuracies inthese reserve estimates or the underlying assumptions will materially affect the quantities and presentvalue of our reserves.’’
Counterparty and customer credit risk
Joint interest receivables arise from billings to entities that own partial interests in the wells weoperate. These entities participate in our wells primarily based on their ownership in leases on whichwe drill. We are also subject to credit risk due to concentration of our oil and natural gas receivableswith several significant customers. The inability or failure of these significant customers to meet theirobligations or their insolvency or liquidation may adversely affect our financial results. In addition, ouroil and natural gas derivative arrangements expose us to credit risk in the event of nonperformance bycounterparties.
While we do not typically require our partners, customers and counterparties to post collateral andwe do not have a formal process in place to evaluate and assess the credit standing of our partners orcustomers for oil and gas receivables and the counterparties on our derivative instruments, we doevaluate the credit standing of such parties as we deem appropriate under the circumstances. Thisevaluation may include reviewing a party’s credit rating, latest financial information and, in the case ofa customer with which we have receivables, their historical payment record, and undertaking the duediligence necessary to determine creditworthiness. The counterparties on our derivative instrumentscurrently in place are lenders under the revolving credit facility with investment grade ratings. We arenot permitted under the terms of the revolving credit facility to enter into derivative instruments withcounterparties outside of the banks who are lenders under the revolving credit facility. As a result, anyfuture derivative instruments will be with these or other lenders under the revolving credit facility whowill also likely carry investment grade ratings.
Interest rate risk
We are subject to market risk exposure related to changes in interest rates on our indebtedness.The terms of the senior secured revolving credit facility and the second lien term loan provide forinterest on borrowings at a floating rate equal to prime, LIBOR or federal funds rate plus marginsranging from 0.50% to 2.50% on the revolver and 6.0-7.0% on the term loan depending on the baserate used and the amount of the loan outstanding in relation to the borrowing base. During the year
79

ended December 31, 2013, borrowings under the senior secured revolving credit facility and second lienterm loan bore interest at a weighted average rate of 3.01% and 9.19%, respectively.
Item 8. Financial Statements and Supplementary Data
Our consolidated financial statements and supplementary financial data are included in thisAnnual Report beginning on page F-1.
Item 9. Changes in and Disagreements with Accountants on Accounting and Financial Disclosure
None.
Item 9A. Controls and Procedures
Evaluation of Disclosure Controls and Procedures
As required by Rule 13a-15(b) of the Exchange Act, we have evaluated, under the supervision andwith the participation of our management, including our principal executive officer and principalfinancial officer, the effectiveness of the design and operation of our disclosure controls and procedures(as defined in Rules 13a-15(e) and 15d-15(e) under the Exchange Act) as of the end of the periodcovered by this report. Our disclosure controls and procedures are designed to provide reasonableassurance that the information required to be disclosed by us in reports that we file under theExchange Act is accumulated and communicated to our management, including our principal executiveofficer and principal financial officer, as appropriate, to allow timely decisions regarding requireddisclosure and is recorded, processed, summarized and reported within the time periods specified in therules and forms of the SEC. In light of the previously identified material weakness described below andthe insufficient time to test the operational effectiveness of our new processes and controls, ourprincipal executive officer and principal financial officer have concluded that our disclosure controlsand procedures were not effective at the reasonable assurance level as of December 31, 2013.
Changes in Internal Control over Financial Reporting
Prior to the completion of our initial public offering, we were a private company with limitedaccounting personnel to adequately execute our accounting processes and limited other supervisoryresources with which to address our internal control over financial reporting. In previous years, we havenot maintained an effective control environment in that the design and execution of our controls hasnot consistently resulted in effective review of our financial statements and supervision by appropriateindividuals. The lack of adequate staffing levels resulted in insufficient time spent on review andapproval of certain information used to prepare our financial statements. We concluded that thesecontrol deficiencies, although varying in severity, constitute a material weakness in our controlenvironment.
Management has taken steps to address the causes of our audit adjustments and to improve ourinternal control over financial reporting, including the implementation of new accounting processes andcontrol procedures and the identification of gaps in our skills base and expertise of the staff required tomeet the financial reporting requirements of a public company. Since July 2010, we have hired threeaccounting managers along with a number of degreed staff accountants. This team has enabled us toexpedite our month-end close process, thereby facilitating the timely preparation of financial reports.Likewise, we strengthened our internal control environment through the addition of skilled accountingpersonnel. We continue to hire incremental qualified staff as needed in conjunction with acomprehensive review of our internal controls and formalization of our review and approval processes.We have designed but not fully implemented new processes and controls to remediate the materialweakness identified. There have been no changes in internal control over financial reporting during thequarter ended December 31, 2013 that have materially affected, or are reasonably likely to materially
80

affect, our internal control over financial reporting. In the fourth quarter of 2013 we initiated our SOXimplementation process and hired a consulting firm to assist us in documenting our processes andcontrols. Initial testing of our controls will commence in the first quarter of 2014. As of December 31,2013, insufficient time has elapsed to test the operational effectiveness of these new controls, and assuch, we are unable to conclude the material weakness has been remediated.
Management’s Assessment of Internal Control over Financial Reporting
The SEC, as required by Section 404 of the Sarbanes-Oxley Act, adopted rules requiring everypublic company that files reports with the SEC to include a management report on such company’sinternal control over financial reporting in its annual report. Pursuant to the Jumpstart Our BusinessStartups Act of 2012 (the ‘‘JOBS Act’’), our independent registered public accounting firm will not berequired to attest to the effectiveness of our internal control over financial reporting pursuant toSection 404 of the Sarbanes-Oxley Act of 2002 for up to five years or through such earlier date that weare no longer an ‘‘emerging growth company’’ as defined in the JOBS Act. This Annual Report onForm 10-K does not include a report of management’s assessment regarding internal control overfinancial reporting or an attestation report of our independent registered public accounting firm due toa transition period established by SEC rules applicable to newly public companies. Our managementwill be required to provide an assessment of the effectiveness of our internal control over financialreporting as of December 31, 2014.
Item 9B. Other Information
None.
81

PART III
Item 10. Directors, Executive Officers and Corporate Governance
The information called for by this Item 10 is incorporated herein by reference to the definitiveProxy Statement to be filed by the registrant pursuant to Regulation 14A of the General Rules andRegulations under the Exchange Act not later than 120 days after the end of the fiscal year covered bythis Annual Report on Form 10-K.
Item 11. Executive Compensation
The information called for by this Item 11 is incorporated herein by reference to the definitiveProxy Statement to be filed by the registrant pursuant to Regulation 14A of the General Rules andRegulations under the Exchange Act not later than 120 days after the end of the fiscal year covered bythis Annual Report on Form 10-K.
Item 12. Security Ownership of Certain Beneficial Owners and Management and Related StockholderMatters
The information called for by this Item 12 is incorporated herein by reference to the definitiveProxy Statement to be filed by the registrant pursuant to Regulation 14A of the General Rules andRegulations under the Exchange Act not later than 120 days after the end of the fiscal year covered bythis Annual Report on Form 10-K.
Item 13. Certain Relationships and Related Transactions, and Director Independence
The information called for by this Item 13 is incorporated herein by reference to the definitiveProxy Statement to be filed by the registrant pursuant to Regulation 14A of the General Rules andRegulations under the Exchange Act not later than 120 days after the end of the fiscal year covered bythis Annual Report on Form 10-K.
Item 14. Principal Accounting Fees and Services
The information called for by this Item 14 is incorporated herein by reference to the definitiveProxy Statement to be filed by the registrant pursuant to Regulation 14A of the General Rules andRegulations under the Exchange Act not later than 120 days after the end of the fiscal year covered bythis Annual Report on Form 10-K.
82

PART IV
Item 15. Exhibits, Financial Statement Schedules
(a) The following documents are filed as part of this report or incorporated by reference:
(1) Financial Statements. Our consolidated financial statements are included under Part II,Item 8 of this Annual Report. For a listing of these statements and accompanying footnotes, see‘‘Index to Consolidated Financial Statements’’ on page F-1 of this Annual Report.
(2) Financial Statement Schedules. All schedules have been omitted because they are eithernot applicable, not required or the information called for therein appears in the consolidatedfinancial statements or notes thereto.
(3) Exhibits. The exhibits required to be filed by this Item 15 are set forth in the ExhibitIndex accompanying this Annual Report on Form 10-K.
83

EXHIBIT INDEX
Exhibit No. Description
2.1 Purchase and Sale Agreement by and between Chalker Energy Partners II, LLC, thelisted participating owners and Jones Energy Holdings, LLC, dated November 28, 2012(incorporated by reference to Exhibit 10.7 to the Company’s Registration Statement onForm S-1, File No. 333-188896, filed on June 7, 2013).
2.2* Purchase and Sale Agreement by and between Sabine Mid-Continent LLC, as seller, andJones Energy Holdings, LLC, as purchaser, dated as of November 22, 2013.
3.1 Amended and Restated Certificate of Incorporation of Jones Energy, Inc. (incorporatedby reference to Exhibit 3.1 to the Company’s Current Report on Form 8-K filed onJuly 30, 2013).
3.2 Amended and Restated Bylaws of Jones Energy, Inc. (incorporated by reference toExhibit 3.2 to the Company’s Current Report on Form 8-K filed on July 30, 2013).
4.1 Form of Class A common stock Certificate (incorporated by reference to Exhibit 4.2 tothe Company’s Registration Statement on Form S-1, File No. 333-188896, filed onJune 7, 2013).
4.2 Registration Rights and Stockholders Agreement, dated as of July 29, 2013 (incorporatedby reference to Exhibit 10.5 to the Company’s Current Report on Form 8-K filed onJuly 30, 2013).
10.1 Third Amended and Restated Limited Liability Company Agreement of Jones EnergyHoldings, LLC (incorporated by reference to Exhibit 10.1 to the Company’s CurrentReport on Form 8-K filed on July 30, 2013).
10.2 Exchange Agreement, dated as of July 29, 2013, by and among Jones Energy, Inc., JonesEnergy Holdings, LLC and the members of Jones Energy Holdings, LLC party thereto(incorporated by reference to Exhibit 10.3 to the Company’s Current Report onForm 8-K filed on July 30, 2013).
10.3 Tax Receivable Agreement, dated as of July 29, 2013, by and among Jones Energy, Inc.,Jones Energy Holdings, LLC and the members of Jones Energy Holdings, LLC partythereto (incorporated by reference to Exhibit 10.4 to the Company’s Current Report onForm 8-K filed on July 30, 2013).
10.4† Jones Energy, Inc. 2013 Omnibus Incentive Plan, effective as of July 29, 2013(incorporated by reference to Exhibit 10.6 to the Company’s Current Report onForm 8-K filed on July 30, 2013).
10.5† Jones Energy, Inc. Short Term Incentive Plan, effective as of July 29, 2013 (incorporatedby reference to Exhibit 10.7 to the Company’s Current Report on Form 8-K filed onJuly 30, 2013).
10.6† Form of Director Restricted Stock Award Agreement (incorporated by reference toExhibit 10.1 to the Company’s Current Report on Form 8-K filed on September 4, 2013).
10.7† Form of Employee Restricted Stock Award Agreement (incorporated by reference toExhibit 10.2 to the Company’s Current Report on Form 8-K filed on September 4, 2013).
10.8† Jones Energy, LLC Executive Deferral Plan (incorporated by reference to Exhibit 10.1 tothe Company’s Current Report on Form 8-K filed on October 23, 2013).
84

Exhibit No. Description
10.9† Jones Energy Holdings, LLC Monarch Equity Plan (incorporated by reference toExhibit 10.8 to the Company’s Registration Statement on Form S-1, File No. 333-188896,filed on May 28, 2013).
10.10 Form of Indemnification Agreement (incorporated by reference to Exhibit 10.5 to theCompany’s Registration Statement on Form S-1, File No. 333-188896, filed on June 7,2013).
10.11 Credit Agreement, dated as of December 31, 2009, among Jones Energy Holdings, LLC,as borrower, Wells Fargo Bank N.A., as administrative agent, and the lenders partythereto (incorporated by reference to Exhibit 10.9 to the Company’s RegistrationStatement on Form S-1, File No. 333-188896, filed on May 28, 2013).
10.12 Agreement and Amendment No. 1 to Credit Agreement (First Lien) (incorporated byreference to Exhibit 10.10 to the Company’s Registration Statement on Form S-1, FileNo. 333-188896, filed on May 28, 2013).
10.13 Master Assignment, Agreement and Amendment No. 2 to Credit Agreement(incorporated by reference to Exhibit 10.11 to the Company’s Registration Statement onForm S-1, File No. 333-188896, filed on May 28, 2013).
10.14 Master Assignment, Agreement and Amendment No. 3 to Credit Agreement(incorporated by reference to Exhibit 10.12 to the Company’s Registration Statement onForm S-1, File No. 333-188896, filed on May 28, 2013).
10.15 Agreement and Amendment No. 4 to Credit Agreement (First Lien) (incorporated byreference to Exhibit 10.13 to the Company’s Registration Statement on Form S-1, FileNo. 333-188896, filed on May 28, 2013).
10.16 Master Assignment, Agreement and Amendment No. 5 to Credit Agreement(incorporated by reference to Exhibit 10.14 to the Company’s Registration Statement onForm S-1, File No. 333-188896, filed on May 28, 2013).
10.17 Waiver and Amendment No. 6 to Credit Agreement (incorporated by reference toExhibit 10.15 to the Company’s Registration Statement on Form S-1, FileNo. 333-188896, filed on May 28, 2013).
10.18 Waiver, Agreement and Amendment No. 7 to Credit Agreement and Amendment toGuarantee and Collateral Agreement (incorporated by reference to Exhibit 10.24 to theCompany’s Registration Statement on Form S-1, File No. 333-188896, filed on June 17,2013).
10.19* Borrowing Base Increase Agreement, dated as of December 18, 2013, among JonesEnergy Holdings, LLC, as borrower, certain subsidiaries of Jones Energy Holdings, LLC,as guarantors, Wells Fargo Bank, N.A., as administrative agent, and the lenders partythereto.
10.20* Agreement and Amendment No. 8 to Credit Agreement dated as of January 29, 2014,among Jones Energy Holdings, LLC, as borrower, Jones Energy, Inc., JonesEnergy, LLC and Nosley Assets, LLC, as guarantors, Wells Fargo Bank, N.A., asadministrative agent, and the lenders party thereto.
10.21* Guarantee and Collateral Agreement, dated as of January 29, 2014, between JonesEnergy, Inc., as guarantor, and Wells Fargo Bank, N.A., as administrative agent.
85

Exhibit No. Description
10.22 Second Lien Credit Agreement, dated as of December 31, 2009, among Jones EnergyHoldings, LLC, as borrower, Wells Fargo Energy Capital, Inc., as administrative agent,and the lenders party thereto (incorporated by reference to Exhibit 10.16 to theCompany’s Registration Statement on Form S-1, File No. 333-188896, filed on May 28,2013).
10.23 Agreement and Amendment No. 1 to Second Lien Credit Agreement (incorporated byreference to Exhibit 10.17 to the Company’s Registration Statement on Form S-1, FileNo. 333-188896, filed on May 28, 2013).
10.24 Agreement and Amendment No. 2 to Second Lien Credit Agreement (incorporated byreference to Exhibit 10.18 to the Company’s Registration Statement on Form S-1, FileNo. 333-188896, filed on May 28, 2013).
10.25 Agreement and Amendment No. 3 to Second Lien Credit Agreement (incorporated byreference to Exhibit 10.19 to the Company’s Registration Statement on Form S-1, FileNo. 333-188896, filed on May 28, 2013).
10.26 Agreement and Amendment No. 4 to Second Lien Credit Agreement (incorporated byreference to Exhibit 10.20 to the Company’s Registration Statement on Form S-1, FileNo. 333-188896, filed on May 28, 2013).
10.27 Agreement and Amendment No. 5 to Second Lien Credit Agreement (incorporated byreference to Exhibit 10.21 to the Company’s Registration Statement on Form S-1, FileNo. 333-188896, filed on May 28, 2013).
10.28 Waiver and Amendment No. 6 to Second Lien Credit Agreement (incorporated byreference to Exhibit 10.22 to the Company’s Registration Statement on Form S-1, FileNo. 333-188896, filed on May 28, 2013).
10.29 Waiver, Agreement and Amendment No. 7 to Second Lien Credit Agreement(incorporated by reference to Exhibit 10.25 to the Company’s Registration Statement onForm S-1, File No. 333-188896, filed on June 17, 2013).
21.1* List of Subsidiaries of Jones Energy, Inc.
23.1* Consent of PricewaterhouseCoopers LLP.
23.2* Consent of Cawley Gillespie & Associates, Inc.
31.1* Rule 13a-14(a)/15d-14(a) Certification of Jonny Jones (Principal Executive Officer).
31.2* Rule 13a-14(a)/15d-14(a) Certification of Robert J. Brooks (Principal Financial Officer).
32.1* Section 1350 Certification of Jonny Jones (Principal Executive Officer).
32.2* Section 1350 Certification of Robert J. Brooks (Principal Financial Officer).
99.1* Summary Report of Cawley, Gillespie & Associates, Inc. for reserves as of December 31,2013
101.INS** XBRL Instance Document.
101.SCH** XBRL Taxonomy Extension Schema Document.
101.CAL** XBRL Taxonomy Extension Calculation Linkbase Document.
101.DEF** XBRL Taxonomy Extension Definition Linkbase Document.
101.LAB** XBRL Taxonomy Extension Label Linkbase Document.
86

Exhibit No. Description
101.PRE** XBRL Taxonomy Extension Presentation Linkbase Document.
*—filed herewith
**—furnished herewith
†—Management contract or compensatory plan or arrangement required to be filed as an exhibit tothis 10-K pursuant to Item 15(b).
87

SIGNATURES
Pursuant to the requirements of the Securities Exchange Act of 1934, the registrant has dulycaused this report to be signed on its behalf by the undersigned thereunto duly authorized.
JONES ENERGY, INC.(registrant)
Date: March 14, 2014 By: /s/ JONNY JONES
Name: Jonny JonesTitle: Chief Executive Officer
Pursuant to the requirements of the Securities Exchange Act of 1934, this report has been signedbelow by the following persons on behalf of the registrant and in the capacities indicated.
Name Title Date
Chairman of the Board of Directors/s/ JONNY JONESand Chief Executive Officer (Principal March 14, 2014
Jonny Jones Executive Officer)
/s/ MIKE S. MCCONNELLDirector and President March 14, 2014
Mike S. McConnell
Executive Vice President and Chief/s/ ROBERT J. BROOKSFinancial Officer (Principal Accounting March 14, 2014
Robert J. Brooks and Financial Officer)
/s/ HOWARD I. HOFFENDirector March 14, 2014
Howard I. Hoffen
/s/ GREGORY D. MYERSDirector March 14, 2014
Gregory D. Myers
/s/ HALBERT S. WASHBURNDirector March 14, 2014
Halbert S. Washburn
/s/ ALAN D. BELLDirector March 14, 2014
Alan D. Bell
88

GLOSSARY OF OIL AND NATURAL GAS TERMS
The terms and abbreviations defined in this section are used throughout this Annual Report onForm 10K:
‘‘AMI’’—Area of mutual interest, typically referring to a contractually defined area under a jointdevelopment agreement whereby parties are subject to mutual participatory rights and restrictions.
‘‘Basin’’—A large natural depression on the earth’s surface in which sediments generally broughtby water accumulate.
‘‘Bbl’’—One stock tank barrel, of 42 U.S. gallons liquid volume, used herein in reference to crudeoil, condensate or NGLs.
‘‘Boe’’—Barrels of oil equivalent, with 6,000 cubic feet of natural gas being equivalent to one barrelof oil.
‘‘Boe/d’’—Barrels of oil equivalent per day.
‘‘British thermal unit (BTU)’’—The heat required to raise the temperature of one pound of waterby one degree Fahrenheit.
‘‘Completion’’—The process of treating a drilled well followed by the installation of permanentequipment for the production of oil or natural gas, or in the case of a dry hole, the reporting ofabandonment to the appropriate agency.
‘‘Condensate’’—Liquid hydrocarbons associated with the production of a primarily natural gasreserve.
‘‘Developed acreage’’—The number of acres that are allocated or assignable to productive wells orwells capable of production.
‘‘Developed reserves’’—Reserves of any category that can be expected to be recovered (i) throughexisting wells with existing equipment and operating methods or in which the cost of the requiredequipment is relatively minor when compared to the cost of a new well; and (ii) through installedextraction equipment and infrastructure operational at the time of the reserves estimate if theextraction is by means not involving a well.
‘‘Development well’’—A well drilled within the proved area of a natural gas or oil reservoir to thedepth of a stratigraphic horizon known to be productive.
‘‘Dry hole’’—A well found to be incapable of producing hydrocarbons in sufficient quantities suchthat proceeds from the sale of such production do not exceed production expenses and taxes.
‘‘Economically producible’’—A resource which generates revenue that exceeds, or is reasonablyexpected to exceed, the costs of the operation.
‘‘Exploratory well’’—A well drilled to find and produce oil or natural gas reserves not classified asproved, to find a new reservoir in a field previously found to be productive of oil or natural gas inanother reservoir or to extend a known reservoir.
‘‘Farm-in or farm-out’’—An agreement under which the owner of a working interest in an oil ornatural gas lease assigns the working interest or a portion of the working interest to another party whodesires to drill on the leased acreage. Generally, the assignee is required to drill one or more wells inorder to earn its interest in the acreage. The assignor usually retains a royalty or reversionary interestin the lease. The interests received by an assignee is a ‘‘farm-in’’ while the interest transferred by theassignor is a ‘‘farm-out.’’
89

‘‘Field’’—An area consisting of a single reservoir or multiple reservoirs all grouped on, or relatedto, the same individual geological structural feature or stratigraphic condition.
‘‘Formation’’—A layer of rock which has distinct characteristics that differ from nearby rock.
‘‘Fracture stimulation’’—A process whereby fluids mixed with proppants are injected into a wellboreunder pressure in order to fracture, or crack open, reservoir rock, thereby allowing oil and/or naturalgas trapped in the reservoir rock to travel through the fractures and into the well for production.
‘‘Gross acres or gross wells’’—The total acres or well, as the case may be, in which a workinginterest is owned.
‘‘Horizontal drilling’’—A drilling technique used in certain formations where a well is drilledvertically to a certain depth and then drilled at a right angle within a specified interval.
‘‘Joint development agreement’’—Includes joint venture agreements, farm-in and farm-outagreements, joint operating agreements and similar partnering arrangements.
‘‘MBbl’’—One thousand barrels of oil, condensate or NGLs.
‘‘MBoe’’—One thousand barrels of oil equivalent, determined using the equivalent of six Mcf ofnatural gas to one Bbl of crude oil.
‘‘Mcf’’—One thousand cubic feet of natural gas.
‘‘MMBoe’’—One million barrels of oil equivalent.
‘‘MMBtu’’—One million British thermal units.
‘‘MMcf’’—One million cubic feet of natural gas.
‘‘Net acres or net wells’’—The sum of the fractional working interest owned in gross acres or grosswells. An owner who has 50% interest in 100 acres owns 50 net acres.
‘‘Net revenue interest’’—An owner’s interest in the revenues of a well after deducting proceedsallocated to royalty and overriding interests.
‘‘Possible reserves’’—Additional reserves that are less certain to be recognized than probablereserves.
‘‘Probable reserves’’—Additional reserves that are less certain to be recognized than proved reservesbut which, in sum with proved reserves, are as likely as not to be recovered.
‘‘Productive well’’—A well that is found to be capable of producing hydrocarbons in sufficientquantities such that proceeds from the sale of the production exceed production expenses and taxes.
‘‘Prospect’’—A specific geographic area which, based on supporting geological, geophysical or otherdata and also preliminary economic analysis using reasonably anticipated prices and costs, is consideredto have potential for the discovery of commercial hydrocarbons.
‘‘Proved developed non-producing’’—Hydrocarbons in a potentially producing horizon penetrated bya wellbore, the production of which has been postponed pending installation of surface equipment orgathering facilities, or pending the production of hydrocarbons from another formation penetrated bythe wellbore. The hydrocarbons are classified as proved but non-producing reserves.
‘‘Proved developed reserves’’—Proved reserves that can be expected to be recovered through existingwells and facilities and by existing operating methods.
‘‘Proved reserves’’—Reserves of oil and natural gas that have been proved to a high degree ofcertainty by analysis of the producing history of a reservoir and/or by volumetric analysis of adequategeological and engineering data.
90

‘‘Proved undeveloped reserves (PUD)’’—Proved reserves that are expected to be recovered from newwells on undrilled acreage or from existing wells where a relatively major expenditure is required forrecompletion.
‘‘Recompletion’’—The process of re-entering an existing wellbore that is either producing or notproducing and completing new reservoirs in an attempt to establish or increase existing production.
‘‘Reserves’’—Estimated remaining quantities of oil and natural gas and related substancesanticipated to be economically producible as of a given date by application of development projects toknown accumulations.
‘‘Reservoir’’—A porous and permeable underground formation containing a natural accumulation ofproducible oil and/or natural gas that is confined by impermeable rock or water barriers and isindividual and separate from other reservoirs.
‘‘Royalty interest’’—An interest in an oil and natural gas property entitling the owner to a share ofoil or gas production free of production costs.
‘‘Spacing’’—The distance between wells producing from the same reservoir. Spacing is oftenexpressed in terms of acres, e.g., 40-acre spacing, and is often established by regulatory agencies.
‘‘Spud’’—The commencement of drilling operations of a new well.
‘‘Standardized measure of discounted future net cash flows’’—The present value of estimated futurenet revenues to be generated from the production of proved reserves, determined in accordance withthe regulations of the Securities and Exchange Commission, without giving effect to non-propertyrelated expenses such as general and administrative expenses, debt service, future income tax expensesor depreciation, depletion and amortization; discounted using an annual discount rate of 10%.
‘‘Trend’’—A region of oil and/or natural gas production, the geographic limits of which have notbeen fully defined, having geological characteristics that have been ascertained through supportinggeological, geophysical or other data to contain the potential for oil and/or natural gas reserves in aparticular formation or series of formations.
‘‘Unconventional formation’’—A term used in the oil and natural gas industry to refer to aformation in which the targeted reservoirs generally fall into one of three categories: (1) tight sands,(2) coal beds, or (3) oil and gas shales. The reservoirs tend to cover large areas and lack the readilyapparent traps, seals and discrete hydrocarbon-water boundaries that typically define conventionalreservoirs. These reservoirs generally require fracture stimulation treatments or other special recoveryprocesses in order to produce economic flow rates
‘‘Undeveloped acreage’’—Lease acreage on which wells have not been drilled or completed to apoint that would permit the production of commercial quantities of oil and natural gas, regardless ofwhether such acreage contains proved reserves.
‘‘Wellbore’’—The hole drilled by the bit that is equipped for oil or gas production on a completedwell. Also called well or borehole.
‘‘Working interest’’—The right granted to the lessee of a property to explore for and to produce andown oil, gas, or other minerals and receive a share of the production. The working interest owners bearthe exploration, development, and operating costs of the property.
91

Index to Financial Statements
Report of Independent Registered Public Accounting Firm . . . . . . . . . . . . . . . . . . . . . . . . . . . . F-2
Consolidated Financial Statements
Balance Sheets . . . . . . . . . . . . . . . . . . . . . . . . . . . . . . . . . . . . . . . . . . . . . . . . . . . . . . . . . . . . F-3
Statements of Operations . . . . . . . . . . . . . . . . . . . . . . . . . . . . . . . . . . . . . . . . . . . . . . . . . . . . F-4
Statement of Changes in Stockholders’ / Members’ Equity . . . . . . . . . . . . . . . . . . . . . . . . . . . . F-5
Statements of Cash Flows . . . . . . . . . . . . . . . . . . . . . . . . . . . . . . . . . . . . . . . . . . . . . . . . . . . . F-6
Notes to the Consolidated Financial Statements . . . . . . . . . . . . . . . . . . . . . . . . . . . . . . . . . . . . F-7
Supplemental Information on Oil and Gas Producing Activities . . . . . . . . . . . . . . . . . . . . . . . . . F-31
Supplemental Quarterly Financial Information . . . . . . . . . . . . . . . . . . . . . . . . . . . . . . . . . . . . . F-35
F-1

Report of Independent Registered Public Accounting Firm
To the Board of Directors and Stockholders of Jones Energy, Inc.:
In our opinion, the accompanying consolidated balance sheets and the related consolidatedstatements of operations, changes in stockholders’ / members’ equity, and cash flows present fairly, inall material respects, the financial position of Jones Energy, Inc. and its subsidiaries at December 31,2013 and 2012 and the results of their operations and their cash flows for each of the three years in theperiod ended December 31, 2013 in conformity with accounting principles generally accepted in theUnited States of America. These financial statements are the responsibility of the Company’smanagement. Our responsibility is to express an opinion on these financial statements based on ouraudits. We conducted our audits of these statements in accordance with the standards of the PublicCompany Accounting Oversight Board (United States). Those standards require that we plan andperform the audit to obtain reasonable assurance about whether the financial statements are free ofmaterial misstatement. An audit includes examining, on a test basis, evidence supporting the amountsand disclosures in the financial statements, assessing the accounting principles used and significantestimates made by management, and evaluating the overall financial statement presentation. We believethat our audits provide a reasonable basis for our opinion.
/s/ PricewaterhouseCoopers LLPHouston, TexasMarch 14, 2014
F-2

Jones Energy, Inc
Consolidated Balance Sheets
December 31, 2013 and 2012
December 31, December 31,2013 2012(in thousands of dollars)
AssetsCurrent assets
Cash . . . . . . . . . . . . . . . . . . . . . . . . . . . . . . . . . . . . . . . . . . . . . . . . . . . . . . $ 23,820 $ 23,726Restricted Cash . . . . . . . . . . . . . . . . . . . . . . . . . . . . . . . . . . . . . . . . . . . . . . 45 —Accounts receivable, net
Oil and gas sales . . . . . . . . . . . . . . . . . . . . . . . . . . . . . . . . . . . . . . . . . . . . 51,233 29,684Joint interest owners . . . . . . . . . . . . . . . . . . . . . . . . . . . . . . . . . . . . . . . . . 42,481 21,876Other . . . . . . . . . . . . . . . . . . . . . . . . . . . . . . . . . . . . . . . . . . . . . . . . . . . 1,459 4,590
Commodity derivative assets . . . . . . . . . . . . . . . . . . . . . . . . . . . . . . . . . . . . . . 8,837 17,648Other current assets . . . . . . . . . . . . . . . . . . . . . . . . . . . . . . . . . . . . . . . . . . . 2,392 1,088Deferred tax assets . . . . . . . . . . . . . . . . . . . . . . . . . . . . . . . . . . . . . . . . . . . . 12 —
Total current assets . . . . . . . . . . . . . . . . . . . . . . . . . . . . . . . . . . . . . . . . . 130,279 98,612Oil and gas properties, net, at cost under the successful efforts method . . . . . . . . . . 1,312,551 1,007,344Other property, plant and equipment, net . . . . . . . . . . . . . . . . . . . . . . . . . . . . . . 3,444 3,398Commodity derivative assets . . . . . . . . . . . . . . . . . . . . . . . . . . . . . . . . . . . . . . . 25,398 25,199Other assets . . . . . . . . . . . . . . . . . . . . . . . . . . . . . . . . . . . . . . . . . . . . . . . . . . 15,006 16,133Deferred tax assets . . . . . . . . . . . . . . . . . . . . . . . . . . . . . . . . . . . . . . . . . . . . . 1,301 —
Total assets . . . . . . . . . . . . . . . . . . . . . . . . . . . . . . . . . . . . . . . . . . . . . . $1,487,979 $1,150,686
Liabilities and Stockholders’ / Members’ EquityCurrent liabilities
Trade accounts payable . . . . . . . . . . . . . . . . . . . . . . . . . . . . . . . . . . . . . . . . . $ 89,430 $ 38,036Oil and gas sales payable . . . . . . . . . . . . . . . . . . . . . . . . . . . . . . . . . . . . . . . . 66,179 45,860Accrued liabilities . . . . . . . . . . . . . . . . . . . . . . . . . . . . . . . . . . . . . . . . . . . . . 10,805 5,255Commodity derivative liabilities . . . . . . . . . . . . . . . . . . . . . . . . . . . . . . . . . . . 10,664 4,035Deferred tax liabilities . . . . . . . . . . . . . . . . . . . . . . . . . . . . . . . . . . . . . . . . . . — 61Asset retirement obligations . . . . . . . . . . . . . . . . . . . . . . . . . . . . . . . . . . . . . . 2,590 174
Total current liabilities . . . . . . . . . . . . . . . . . . . . . . . . . . . . . . . . . . . . . . 179,668 93,421Long-term debt . . . . . . . . . . . . . . . . . . . . . . . . . . . . . . . . . . . . . . . . . . . . . . . . 658,000 610,000Deferred revenue . . . . . . . . . . . . . . . . . . . . . . . . . . . . . . . . . . . . . . . . . . . . . . 14,531 —Commodity derivative liabilities . . . . . . . . . . . . . . . . . . . . . . . . . . . . . . . . . . . . . 190 7,657Asset retirement obligations . . . . . . . . . . . . . . . . . . . . . . . . . . . . . . . . . . . . . . . 8,373 9,332Deferred tax liabilities . . . . . . . . . . . . . . . . . . . . . . . . . . . . . . . . . . . . . . . . . . . 3,093 1,876
Total liabilities . . . . . . . . . . . . . . . . . . . . . . . . . . . . . . . . . . . . . . . . . . . . 863,855 722,286
Commitments and contingencies (Note 10)Stockholders’ / members’ equity
Members’ equity . . . . . . . . . . . . . . . . . . . . . . . . . . . . . . . . . . . . . . . . . . . . . . — 428,400Class A common stock, $0.001 par value; 12,526,580 shares issued and outstanding 13 —Class B common stock, $0.001 par value; 36,836,333 shares issued and outstanding 37 —Additional paid-in-capital . . . . . . . . . . . . . . . . . . . . . . . . . . . . . . . . . . . . . . . . 173,169 —Retained earnings (deficit) . . . . . . . . . . . . . . . . . . . . . . . . . . . . . . . . . . . . . . . (2,186) —
Stockholders’ / members’ equity . . . . . . . . . . . . . . . . . . . . . . . . . . . . . . . . . . . . . 171,033 428,400Non-controlling interest . . . . . . . . . . . . . . . . . . . . . . . . . . . . . . . . . . . . . . . . . . 453,091 —
Total stockholders’ / members’ equity . . . . . . . . . . . . . . . . . . . . . . . . . . . . 624,124 428,400
Total liabilities and stockholders’ / members’ equity . . . . . . . . . . . . . . . . . . . $1,487,979 $1,150,686
The accompanying notes are an integral part of these consolidated financial statements.
F-3

Jones Energy, Inc.
Consolidated Statements of Operations
Years Ended December 31, 2013, 2012 and 2011
Year Ended December 31,
2013 2012 2011(in thousands except per share data)
Operating revenuesOil and gas sales . . . . . . . . . . . . . . . . . . . . . . . . . . . . . . . . . . . . . . . $258,063 $148,967 $167,261Other revenues . . . . . . . . . . . . . . . . . . . . . . . . . . . . . . . . . . . . . . . . 1,106 847 1,022
Total operating revenues . . . . . . . . . . . . . . . . . . . . . . . . . . . . . . 259,169 149,814 168,283
Operating costs and expensesLease operating . . . . . . . . . . . . . . . . . . . . . . . . . . . . . . . . . . . . . . . 27,781 23,097 21,548Production taxes . . . . . . . . . . . . . . . . . . . . . . . . . . . . . . . . . . . . . . . 12,865 5,583 5,333Exploration . . . . . . . . . . . . . . . . . . . . . . . . . . . . . . . . . . . . . . . . . . . 1,710 356 780Depletion, depreciation and amortization . . . . . . . . . . . . . . . . . . . . . 114,136 80,709 68,906Impairment of oil and gas properties . . . . . . . . . . . . . . . . . . . . . . . . 14,415 18,821 31,970Accretion of discount . . . . . . . . . . . . . . . . . . . . . . . . . . . . . . . . . . . 608 533 413General and administrative (including non-cash compensation
expense) . . . . . . . . . . . . . . . . . . . . . . . . . . . . . . . . . . . . . . . . . . . 31,902 15,875 16,679
Total operating expenses . . . . . . . . . . . . . . . . . . . . . . . . . . . . . . 203,417 144,974 145,629
Operating income . . . . . . . . . . . . . . . . . . . . . . . . . . . . . . . . . . . 55,752 4,840 22,654
Other income (expense)Interest expense . . . . . . . . . . . . . . . . . . . . . . . . . . . . . . . . . . . . . . . (30,774) (25,292) (21,994)Net gain (loss) on commodity derivatives . . . . . . . . . . . . . . . . . . . . . (2,566) 16,684 34,490Gain on bargain purchase . . . . . . . . . . . . . . . . . . . . . . . . . . . . . . . . — — 26,208Gain (loss) on sales of assets . . . . . . . . . . . . . . . . . . . . . . . . . . . . . . (78) 1,162 (859)
Other income (expense), net . . . . . . . . . . . . . . . . . . . . . . . . . . . (33,418) (7,446) 37,845
Income (loss) before income tax . . . . . . . . . . . . . . . . . . . . . . . . 22,334 (2,606) 60,499
Income tax provisionCurrent . . . . . . . . . . . . . . . . . . . . . . . . . . . . . . . . . . . . . . . . . . 85 — —Deferred . . . . . . . . . . . . . . . . . . . . . . . . . . . . . . . . . . . . . . . . . (156) 473 173
Total income tax provision . . . . . . . . . . . . . . . . . . . . . . . . . . . . (71) 473 173
Net income (loss) . . . . . . . . . . . . . . . . . . . . . . . . . . . . . . . . . . . . . . 22,405 (3,079) 60,326Net income attributable to non-controlling interests . . . . . . . . . . . . . 24,591 — —
Net income (loss) attributable to controlling interests . . . . . . . . . . . . $ (2,186) $ (3,079) $ 60,326
Earnings per share:Basic and diluted . . . . . . . . . . . . . . . . . . . . . . . . . . . . . . . . . . . . . $ (0.17)
Weighted average shares outstanding:Basic and diluted . . . . . . . . . . . . . . . . . . . . . . . . . . . . . . . . . . . . . 12,500
The accompanying notes are an integral part of these consolidated financial statements.
F-4

Jones Energy, Inc.
Statement of Changes in Stockholders’ / Members’ Equity
Years Ended December 31, 2013, 2012 and 2011
Common StockAdditional TotalClass A Class B Members’ Paid-in- Retained Non-controlling Stockholders’ /
Shares Value Shares Value Equity Capital Deficit Interest Members’ Equity(amounts in thousands)Balance at December 31, 2010 . . . . . . . . . . — $— — $— $ 284,449 $ — $ — $ — $284,449Stock-compensation expense . . . . . . . . . . . — — — — 1,134 — — — 1,134Net income . . . . . . . . . . . . . . . . . . . . . — — — — 60,326 — — — 60,326
Balance at December 31, 2011 . . . . . . . . . . — — — — 345,909 — — — 345,909Issuance of Class C preferred units . . . . . . . — — — — 85,000 — — — 85,000Stock-compensation expense . . . . . . . . . . . — — — — 570 — — — 570Net income (loss) . . . . . . . . . . . . . . . . . . — — — — (3,079) (3,079)
Balance at December 31, 2012 . . . . . . . . . . — — — — 428,400 — — — 428,400Issuance of common stock . . . . . . . . . . . . 12,500 13 36,836 37 — — — — 50Proceeds from the sale of common stock . . . . — — — — — 172,431 — — 172,431Reclassification of members’ contributions . . . — — — — (464,037) — — 464,037 —Stock-compensation expense . . . . . . . . . . . — — — — 10,100 738 — — 10,838Distribution to members . . . . . . . . . . . . . . — — — — (10,000) — — — (10,000)Net income . . . . . . . . . . . . . . . . . . . . . — — — — 35,537 — (2,186) (10,946) 22,405
Balance at December 31, 2013 . . . . . . . . . . 12,500 $13 36,836 $37 $ — $173,169 $(2,186) $453,091 $624,124
The accompanying notes are an integral part of these consolidated financial statements.
F-5

Jones Energy, Inc.
Consolidated Statements of Cash Flows
Years Ended December 31, 2013, 2012 and 2011
Year Ended December 31,
2013 2012 2011(in thousands of dollars)Cash flows from operating activitiesNet income (loss) . . . . . . . . . . . . . . . . . . . . . . . . . . . . . . . . . . . . . . . . . . $ 22,405 $ (3,079) $ 60,326Adjustments to reconcile net income (loss) to net cash provided by operating
activitiesExploration expense . . . . . . . . . . . . . . . . . . . . . . . . . . . . . . . . . . . . . . . — — 478Depletion, depreciation, and amortization . . . . . . . . . . . . . . . . . . . . . . . . . 114,136 80,709 68,906Impairment of oil and gas properties . . . . . . . . . . . . . . . . . . . . . . . . . . . . 14,415 18,821 31,970Accretion of discount . . . . . . . . . . . . . . . . . . . . . . . . . . . . . . . . . . . . . . 608 533 413Amortization of debt issuance costs . . . . . . . . . . . . . . . . . . . . . . . . . . . . . 2,677 3,544 2,940Stock compensation expense . . . . . . . . . . . . . . . . . . . . . . . . . . . . . . . . . . 10,838 570 1,134Other non-cash compensation expense (Note 9) . . . . . . . . . . . . . . . . . . . . . 2,719 — —Amortization of deferred revenue . . . . . . . . . . . . . . . . . . . . . . . . . . . . . . (469) — —Gain on commodity derivatives . . . . . . . . . . . . . . . . . . . . . . . . . . . . . . . . 2,566 (16,684) (34,490)Gain on bargain purchase price . . . . . . . . . . . . . . . . . . . . . . . . . . . . . . . . — — (26,208)(Gain) loss on sales of assets . . . . . . . . . . . . . . . . . . . . . . . . . . . . . . . . . 78 (1,162) 859Deferred income tax provision . . . . . . . . . . . . . . . . . . . . . . . . . . . . . . . . (156) 473 173Other—net . . . . . . . . . . . . . . . . . . . . . . . . . . . . . . . . . . . . . . . . . . . . . 79 129 (59)Changes in assets and liabilities
Accounts receivable . . . . . . . . . . . . . . . . . . . . . . . . . . . . . . . . . . . . . . (41,481) 11,568 (32,593)Other assets . . . . . . . . . . . . . . . . . . . . . . . . . . . . . . . . . . . . . . . . . . . 163 1,873 (3,360)Accounts payable and accrued liabilities . . . . . . . . . . . . . . . . . . . . . . . . 35,318 (12,745) 49,728
Net cash provided by operations . . . . . . . . . . . . . . . . . . . . . . . . . . . . 163,896 84,550 120,217
Cash flows from investing activitiesAdditions to oil and gas properties . . . . . . . . . . . . . . . . . . . . . . . . . . . . . . . (197,618) (125,493) (157,046)Acquisition of properties . . . . . . . . . . . . . . . . . . . . . . . . . . . . . . . . . . . . . . (193,496) (249,007) (168,480)Proceeds from sales of assets . . . . . . . . . . . . . . . . . . . . . . . . . . . . . . . . . . . 1,607 9,158 6,747Acquisition of other property, plant and equipment . . . . . . . . . . . . . . . . . . . . (1,634) (969) (1,735)Current period settlements of matured derivative contracts . . . . . . . . . . . . . . . 7,586 28,675 1,551Change in restricted cash . . . . . . . . . . . . . . . . . . . . . . . . . . . . . . . . . . . . . (45) — —
Net cash used in investing . . . . . . . . . . . . . . . . . . . . . . . . . . . . . . . . (383,600) (337,636) (318,963)
Cash flows from financing activitiesProceeds from issuance of long-term debt . . . . . . . . . . . . . . . . . . . . . . . . . . 220,000 233,243 316,500Repayment under long-term debt . . . . . . . . . . . . . . . . . . . . . . . . . . . . . . . . (172,000) (38,243) (126,500)Payment of debt issuance costs . . . . . . . . . . . . . . . . . . . . . . . . . . . . . . . . . . (683) (9,324) (3,678)Issuance of preferred units . . . . . . . . . . . . . . . . . . . . . . . . . . . . . . . . . . . . — 85,000 —Proceeds from sale of common stock, net of expenses of $15.1 million . . . . . . . 172,481 — —
Net cash provided by financing . . . . . . . . . . . . . . . . . . . . . . . . . . . . . 219,798 270,676 186,322
Net increase (decrease) in cash . . . . . . . . . . . . . . . . . . . . . . . . . . . . . 94 17,590 (12,424)
CashBeginning of period . . . . . . . . . . . . . . . . . . . . . . . . . . . . . . . . . . . . . . . . . 23,726 6,136 18,560
End of period . . . . . . . . . . . . . . . . . . . . . . . . . . . . . . . . . . . . . . . . . . . . . $ 23,820 $ 23,726 $ 6,136
Supplemental disclosure of cash flow informationCash paid for interest . . . . . . . . . . . . . . . . . . . . . . . . . . . . . . . . . . . . . . . . $ 25,414 $ 20,759 $ 18,151Change in accrued additions to oil and gas properties . . . . . . . . . . . . . . . . . . 41,945 3,355 26,774Noncash acquisition of oil and gas properties . . . . . . . . . . . . . . . . . . . . . . . . — 2,918 —Current additions to ARO . . . . . . . . . . . . . . . . . . . . . . . . . . . . . . . . . . . . 1,516 662 4,077Noncash distributions to members (Note 9) . . . . . . . . . . . . . . . . . . . . . . . . . 10,000 — —
The accompanying notes are an integral part of these consolidated financial statements.
F-6

Jones Energy, Inc.
Notes to Consolidated Financial Statements
1. Organization and Description of Business
Organization
Jones Energy, Inc. (the ‘‘Company’’) was formed in March 2013 as a Delaware corporation tobecome a publicly-traded entity and the holding company of Jones Energy Holdings, LLC (‘‘JEH’’). Asthe sole managing member of JEH, Jones Energy, Inc. is responsible for all operational, managementand administrative decisions relating to JEH’s business and consolidates the financial results of JEHand its subsidiaries.
JEH was formed as a Delaware limited liability company on December 16, 2009 throughinvestments made by the Jones family and through private equity funds managed by Metalmark Capitaland Wells Fargo Energy Capital. JEH acts as a holding company of operating subsidiaries that own andoperate assets that are used in the exploration, development, production and acquisition of oil andnatural gas properties.
Pursuant to the terms of a corporate reorganization that was completed in connection with theclosing of Jones Energy, Inc.’s initial public offering (‘‘IPO’’) on July 29, 2013, the pre-IPO owners ofJEH converted their existing membership interests in JEH into JEH Units and amended theexisting LLC agreement to, among other things, modify its equity capital to consist solely of JEH Unitsand to admit Jones Energy, Inc. as the sole managing member of JEH. Jones Energy, Inc.’s certificateof incorporation authorizes two classes of common stock, Class A common stock and Class B commonstock. Only Class A common stock was offered to investors pursuant to the IPO. The Class B commonstock is held by the pre-IPO owners of JEH and can be exchanged (together with a correspondingnumber of JEH Units) for shares of Class A common stock on a one-for-one basis, subject tocustomary conversion rate adjustments for stock splits, stock dividends and reclassifications and othersimilar transactions. The Class B common stock has no economic rights but entitles its holder to onevote on all matters to be voted on by the Company’s stockholders generally. As a result of the IPO, thepre-IPO owners retained 74.7% of the total economic interest in JEH, but with no voting rights ormanagement power over JEH, resulting in the Company reporting this ownership interest as anon-controlling interest. Prior to the IPO, JEH owned the controlling interest in the Company; henceall of the net income (loss) earned prior to the IPO date is reflected in the net income (loss)attributable to non-controlling interests on the Consolidated Statement of Operations for the yearended December 31, 2013.
Description of Business
The Company is engaged in the acquisition, exploration, and production of oil and natural gasproperties in the mid-continent United States. The Company’s assets are located within two distinctbasins in the Texas Panhandle and Oklahoma, the Anadarko Basin and the Arkoma Basin, and areowned by JEH and its operating subsidiaries. The Company is headquartered in Austin, Texas.
Revision of Previously Issued Financial Statements
We identified an error in our previously issued financial statements which would have beenmaterial to our fourth quarter of 2013 if recorded as an out of period adjustment in such period.Therefore we have revised our Consolidated Statement of Operations for the years endedDecember 31, 2012 and 2011 to record $0.6 million and $0.8 million, respectively of additional interestexpense on obligations that are unrelated to our credit agreements discussed in Note 6. As a result, netincome decreased for the years ended December 31, 2012 and 2011 by $0.6 million and $0.8 million,
F-7

Jones Energy, Inc.
Notes to Consolidated Financial Statements (Continued)
1. Organization and Description of Business (Continued)
respectively. The balance sheet impacts of the revision are increases in accrued liabilities and decreasesin members’ equity of $0.6 million and $1.4 million at December 31, 2011 and 2012, respectively. Theserevisions had no impact on our net cash provided by operations in our Consolidated Statement of CashFlows. We have determined that these errors are not material to our consolidated financial statementsfor the years ended December 31, 2012 and 2011.
2. Significant Accounting Policies
Basis of Presentation
The accompanying financial statements have been prepared in accordance with accountingprinciples generally accepted in the United States of America (‘‘GAAP’’). All significant intercompanytransactions and balances have been eliminated in consolidation. The financial statements reported forDecember 31, 2013, 2012 and 2011, and the years then ended include the Company and all of itssubsidiaries.
Segment Information
The Company operates in one industry segment, which is the exploration, development andproduction of oil and natural gas, and all of its operations are conducted in one geographic area of theUnited States.
Use of Estimates
In preparing the accompanying financial statements, management has made certain estimates andassumptions that affect the reported amounts of assets and liabilities, disclosure of contingent liabilities,and the reported amounts of revenue and expenses during the reporting period. Actual results coulddiffer from these estimates. Changes in estimates are recorded prospectively.
Significant assumptions are required in the valuation of proved oil and natural gas reserves, whichaffect the Company’s estimates of depletion expense, impairment, and the allocation of value in ourbusiness combinations. Significant assumptions are also required in the Company’s estimates of the netgain or loss on commodity derivative assets and liabilities, fair value associated with businesscombinations, and asset retirement obligations (‘‘ARO’’).
Financial Instruments
Cash, accounts receivable and accounts payable are recorded at cost. The fair value of accountsreceivable and accounts payable are not materially different from their carrying amounts because of theshort-term nature of these instruments. The carrying values of outstanding balances under theCompany’s credit agreements represent fair value because the agreements have variable interest rates,which are reflective of the Company’s credit risk. Derivative instruments are recorded at fair value, asdiscussed below.
Cash
Cash and cash equivalents include highly liquid investments with a maturity of three months orless. At times, the amount of cash on deposit in financial institutions exceeds federally insured limits.
F-8

Jones Energy, Inc.
Notes to Consolidated Financial Statements (Continued)
2. Significant Accounting Policies (Continued)
Management monitors the soundness of the financial institutions and believes the Company’s risk isnegligible.
Accounts Receivable
Accounts receivable—Oil and gas sales consist of uncollateralized accrued revenues due undernormal trade terms, generally requiring payment within 30 to 60 days of production. Accountsreceivable—Joint interest owners consist of uncollateralized joint interest owner obligations due within30 days of the invoice date. Accounts receivable—Other consist primarily of severance tax refunds duefrom state agencies. No interest is charged on past-due balances. The Company routinely assesses therecoverability of all material trade, joint interest and other receivables to determine their collectability,and reduces the carrying amounts by a valuation allowance that reflects management’s best estimate ofthe amounts that may not be collected. As of December 31, 2013 and 2012, the Company did not havesignificant allowances for doubtful accounts.
Concentration of Risk
Substantially all of the Company’s accounts receivable are related to the oil and gas industry. Thisconcentration of entities may affect the Company’s overall credit risk in that these entities may beaffected similarly by changes in economic and other conditions. As of December 31, 2013, 79% ofAccounts receivable—Oil and gas sales are due from 8 purchasers and 77% of Accounts receivable—Joint interest owners are due from 5 working interest owners. As of December 31, 2012, 92% ofAccounts receivable—Oil and gas sales were due from 8 purchasers, and 72% of 2012 Accountsreceivable—Joint interest owners were due from 5 working interest owners. If any or all of thesesignificant counterparties were to fail to pay amounts due to the Company, the Company’s financialposition and results of operations could be materially and adversely affected.
Dependence on Major Customers
The Company maintains a portfolio of crude oil and natural gas marketing contracts with large,established refiners and oil and gas purchasers. During the year ended December 31, 2013, the largestpurchasers were PVR Midstream, Unimark LLC, Mercuria, Valero, and Plains Marketing, whichaccounted for approximately 15%, 13%, 13%, 13% and 6% of consolidated oil and gas sales,respectively. During the year ended December 31, 2012, the largest purchasers were Unimark LLC,Mercuria, PVR Midstream, and Plains Marketing, which accounted for approximately 24%, 18%, 18%and 15% of consolidated oil and gas sales, respectively. During the year ended December 31, 2011, thelargest purchasers were Plains Marketing, PVR Midstream, Unimark LLC, and Valero Marketing,which accounted for approximately 27%, 22%, 13% and 9% of consolidated oil and gas sales,respectively.
Management believes that there are alternative purchasers and that it may be necessary toestablish relationships with such new purchasers. However, there can be no assurance that theCompany can establish such relationships and that those relationships will result in an increasednumber of purchasers. Although the Company is exposed to a concentration of credit risk, managementbelieves that all of the Company’s purchasers are credit worthy.
F-9

Jones Energy, Inc.
Notes to Consolidated Financial Statements (Continued)
2. Significant Accounting Policies (Continued)
Dependence on Suppliers
The Company’s industry is cyclical, and from time to time, there is a shortage of drilling rigs,equipment, services, supplies and qualified personnel. During these periods, the costs and deliverytimes of rigs, equipment, services and supplies are substantially greater. If the unavailability or highcost of drilling rigs, equipment, services, supplies or qualified personnel were particularly severe in itsareas of operation, the Company could be materially and adversely affected. Management believes thatthere are potential alternative providers of drilling and completion services and that it may becomenecessary to establish relationships with new contractors. However, there can be no assurance that theCompany can establish such relationships and that those relationships will result in increasedavailability of drilling rigs or other services, or that they could be obtained on the same terms.
Oil and Gas Properties
The Company accounts for its oil and natural gas exploration and production activities under thesuccessful efforts method of accounting. Oil and gas properties consisted of the following atDecember 31, 2013 and 2012:
2013 2012(in thousands of dollars)
Mineral interests in propertiesUnproved . . . . . . . . . . . . . . . . . . . . . . . . . . . . . . . . . . . $ 114,457 $ 137,254Proved . . . . . . . . . . . . . . . . . . . . . . . . . . . . . . . . . . . . . 958,816 737,558
Wells and equipment and related facilities . . . . . . . . . . . . . 609,748 389,727
1,683,021 1,264,539Less: Accumulated depletion and impairment . . . . . . . . . . (370,470) (257,195)
Net oil and gas properties . . . . . . . . . . . . . . . . . . . . . $1,312,551 $1,007,344
Costs to acquire mineral interests in oil and natural gas properties are capitalized. Costs to drilland equip development wells and the related asset retirement costs are capitalized. The costs to drilland equip exploratory wells are capitalized pending determination of whether the Company hasdiscovered proved commercial reserves. If proved commercial reserves are not discovered, such drillingcosts are charged to expense. In some circumstances, it may be uncertain whether proved commercialreserves have been found when drilling has been completed. Such exploratory well drilling costs maycontinue to be capitalized if the anticipated reserve quantity is sufficient to justify its completion as aproducing well and sufficient progress in assessing the reserves and the economic and operatingviability of the project is being made. In 2013, we had no material capitalized costs associated withexploratory wells. As of December 31, 2012, there were no costs capitalized in connection withexploratory wells in progress.
The Company capitalizes interest on expenditures for significant exploration and developmentprojects that last more than six months while activities are in progress to bring the assets to theirintended use. The Company did not capitalize any interest in 2013 as no projects lasted more than sixmonths. During the year ended December 31, 2012, the Company capitalized $0.1 million in interest.Costs incurred to maintain wells and related equipment are charged to expense as incurred.
F-10

Jones Energy, Inc.
Notes to Consolidated Financial Statements (Continued)
2. Significant Accounting Policies (Continued)
On the sale or retirement of a proved field, the cost and related accumulated depletion,depreciation and amortization are eliminated from the field accounts, and the resultant gain or loss isrecognized.
Capitalized amounts attributable to proved oil and gas properties are depleted by theunit-of-production method over proved reserves, using the unit conversion ratio of six thousand cubicfeet of gas to one barrel of oil equivalent. Depletion of the costs of wells and related equipment andfacilities, including capitalized asset retirement costs, net of salvage values, is computed using proveddeveloped reserves. The reserve base used to calculate depreciation, depletion, and amortization forleasehold acquisition costs and the cost to acquire proved properties is the sum of proved developedreserves and proved undeveloped reserves. Depletion of oil and gas properties amounted to$113.3 million, $79.9 million and $68.2 million for the years ended December 31, 2013, 2012 and 2011,respectively.
The Company reviews its proved oil and natural gas properties, including related wells andequipment, for impairment by comparing expected undiscounted future cash flows at a producing fieldlevel to the net capitalized cost of the asset. If the future undiscounted cash flows, based on theCompany’s estimate of future commodity prices, operating costs, and production, are lower than thenet capitalized cost, the capitalized cost is reduced to fair value. Fair value is calculated by discountingthe future cash flows at an appropriate risk-adjusted discount rate. Due to the significant assumptionsassociated with the inputs and calculations described, the fair value of oil and gas properties used inestimating impairment represents a nonrecurring Level 3 measurement. The Company incurredimpairment charges of $18.8 million and $19.8 million related to its proved oil and natural gasproperties and equipment in 2012 and 2011, respectively. No impairments of proved properties wererecorded in 2013.
The Company evaluates its unproved properties for impairment on a property-by-property basis.The Company’s unproved property consists of acquisition costs related to its undeveloped acreage. TheCompany reviews the unproved property for indicators of impairment based on the Company’s currentexploration plans with consideration given to results of any drilling and seismic activity during theperiod and known information regarding exploration activity by other companies on adjacent blocks. Inthe fourth quarter of 2013, the Company recorded an impairment charge of $14.4 million related to itsunproved Southridge properties. As the Company did not drill the required number of wells byOctober 31, 2013 necessary to keep its joint development agreement with Southridge in effect, theCompany lost its right to the undeveloped acreage. The Company incurred no impairment chargesrelated to its unproved properties in 2012. In 2011, the Company incurred a $12.2 million impairmentcharge related to its unproven properties in fields which were not expected to produce natural gas witha sufficiently high liquid content reducing the economic return of those fields. These charges representnonrecurring Level 3 measurements. Impairment of oil and gas properties charges are recorded on theConsolidated Statement of Operations.
On the sale of an entire interest in an unproved property, gain or loss on the sale is recognized,taking into consideration the amount of any recorded impairment if the property had been assessedindividually. If a partial interest in an unproved property is sold, the amount received is treated as areduction of the cost of the interest retained.
F-11

Jones Energy, Inc.
Notes to Consolidated Financial Statements (Continued)
2. Significant Accounting Policies (Continued)
Other Property, Plant and Equipment
Other property, plant and equipment consisted of the following at December 31, 2013 and 2012:
2013 2012(in thousands of dollars)
Leasehold improvements . . . . . . . . . . . . . . . . . . . . . . . . . . . . . . $ 1,060 $ 983Furniture, fixtures, computers and software . . . . . . . . . . . . . . . . . 2,491 2,204Vehicles . . . . . . . . . . . . . . . . . . . . . . . . . . . . . . . . . . . . . . . . . . 835 719Aircraft . . . . . . . . . . . . . . . . . . . . . . . . . . . . . . . . . . . . . . . . . . 910 1,295Other . . . . . . . . . . . . . . . . . . . . . . . . . . . . . . . . . . . . . . . . . . . . 134 134
5,430 5,335Less: Accumulated depreciation and amortization . . . . . . . . . . . . (1,986) (1,937)
Net other property, plant and equipment . . . . . . . . . . . . . . . . $ 3,444 $ 3,398
Other property, plant and equipment is depreciated on a straight-line basis over the estimateduseful lives of the property, plant and equipment, which range from three years to ten years.Depreciation and amortization of other property, plant and equipment amounted to $0.8 million,$0.8 million and $0.7 million during the years ended December 31, 2013, 2012 and 2011, respectively.
Oil and Gas Sales Payable
Oil and gas sales payable represents amounts collected from purchasers for oil and gas sales, whichare due to other revenue interest owners. Generally, the Company is required to remit amounts dueunder these liabilities within 60 days of receipt.
Commodity Derivatives
The Company records its commodity derivative instruments on the Consolidated Balance Sheet aseither an asset or liability measured at its fair value. Changes in the derivative’s fair value arerecognized currently in earnings, unless specific hedge accounting criteria are met. During the yearsended December 31, 2013, 2012 and 2011, the Company elected not to designate any of its commodityprice risk management activities as cash flow or fair value hedges. The changes in the fair values ofoutstanding financial instruments are recognized as gains or losses in the period of change.
Although Jones does not designate its commodity derivative instruments as cash-flow hedges,management uses those instruments to reduce the Company’s exposure to fluctuations in commodityprices related to its natural gas and oil production. Net gains and losses, at fair value, are included onthe Consolidated Balance Sheet as current or noncurrent assets or liabilities based on the anticipatedtiming of cash settlements under the related contracts. Changes in the fair value of commodityderivative contracts are recorded in earnings as they occur and are included in other income (expense)on the Consolidated Statement of Operations. See Note 4, ‘‘Fair Value Measurement,’’ for disclosureabout the fair values of commodity derivative instruments.
Asset Retirement Obligations
The Company’s asset retirement obligations consist of future plugging and abandonment expenseson oil and natural gas properties. The Company estimates an ARO for each well in the period in which
F-12

Jones Energy, Inc.
Notes to Consolidated Financial Statements (Continued)
2. Significant Accounting Policies (Continued)
it is incurred based on estimated present value of plugging and abandonment costs, increased by aninflation factor to the estimated date that the well would be plugged. The resulting liability is recordedby increasing the carrying amount of the related long-lived asset. The liability is then accreted to itsthen-present value each period and the capitalized cost is depleted over the useful life of the relatedasset. If the liability is settled for an amount other than the recorded amount, a gain or loss isrecognized. The ARO is classified as current or noncurrent based on the expect timing of payments. Asummary of the Company’s ARO for the years ended December 31, 2013 and 2012 is as follows:
2013 2012(in thousands of dollars)
ARO liability at beginning of year . . . . . . . . . . . . . . . . . . . . . . . . $ 9,506 $9,563Liabilities incurred(1) . . . . . . . . . . . . . . . . . . . . . . . . . . . . . . . . . 1,515 662Accretion of discount . . . . . . . . . . . . . . . . . . . . . . . . . . . . . . . . . 608 596Liabilities settled due to sale of related properties . . . . . . . . . . . . (271) (927)Liabilities settled due to plugging and abandonment . . . . . . . . . . . (702) (388)Change in estimate . . . . . . . . . . . . . . . . . . . . . . . . . . . . . . . . . . 307 —
ARO liability at end of year . . . . . . . . . . . . . . . . . . . . . . . . . . . . 10,963 9,506Less: Current portion of ARO at end of year . . . . . . . . . . . . . . . (2,590) (174)
Total long-term ARO at end of year . . . . . . . . . . . . . . . . . . . . . . $ 8,373 $9,332
(1) Includes $824 related to wells acquired (see Note 3, ‘‘Acquisition of Properties’’).
Revenue Recognition
Revenues from the sale of crude oil, natural gas, and natural gas liquids are recognized when theproduct is delivered at a fixed or determinable price, title has transferred, collectability is reasonablyassured and evidenced by a contract. The Company follows the ‘‘sales method’’ of accounting for its oiland natural gas revenue, so it recognizes revenue on all crude oil, natural gas, and natural gas liquidssold to purchasers. A receivable or liability is recognized only to the extent that the Company has animbalance on a specific property greater than the expected remaining proved reserves.
Production Costs
Production costs, including compressor rental, pumpers’ salaries, saltwater disposal, ad valoremtaxes, insurance, repairs and maintenance, expensed workovers and other operating expenses areexpensed as incurred and included in lease operating expense on the Consolidated Statement ofOperations.
Exploration Expenses
Exploration expenses include dry hole costs, lease extensions, delay rentals and geological andgeophysical costs.
Income Taxes
Following its IPO on July 29, 2013, the Company began recording a federal and state income taxliability associated with its status as a corporation. No provision for federal income taxes was recorded
F-13

Jones Energy, Inc.
Notes to Consolidated Financial Statements (Continued)
2. Significant Accounting Policies (Continued)
prior to the IPO because the taxable income or loss was includable in the income tax returns of theindividual partners and members. The Company is also subject to state income taxes. The State ofTexas includes in its tax system a franchise tax applicable to the Company and an accrual for franchisetaxes is included in the financial statements when appropriate.
Income taxes are accounted for under the asset and liability method, which requires recognition ofdeferred tax assets and liabilities for the expected future tax consequences of events that have beenincluded in the financial statements. Under this method, deferred tax assets and liabilities aredetermined based on the differences between the financial statements and tax basis of assets andliabilities using enacted tax rates in effect for the year in which differences are expected to berecovered or settled pursuant to the provisions of ASC 740—Income Taxes. The effect of a change intax rates on deferred tax assets and liabilities is recognized in income in the period that includes theenactment date.
The Company records a valuation allowance if it is deemed more likely than not that all or aportion of its deferred income tax assets will not be realized. In addition, income tax rules andregulations are subject to interpretation and the application of those rules and regulations requirejudgment by the Company and may be challenged by the taxation authorities. The Company followsASC 740-10-25, which requires the use of a two-step approach for recognizing and measuring taxbenefits taken or expected to be taken in a tax return and disclosures regarding uncertainties in incometax positions. Only tax positions that meet the more likely than not recognition threshold arerecognized. The Company’s policy is to include any interest and penalties recorded on uncertain taxpositions as a component of income tax expense. The Company’s unrecognized tax benefits or relatedinterest and penalties are immaterial.
Tax Receivable Agreement
In conjunction with the IPO, the Company entered into a Tax Receivable Agreement (‘‘TRA’’) withJEH and the pre-IPO owners. Upon any exchange of JEH—Units and Class B common stock of theCompany held by JEH’s pre-IPO owners for Class A common stock of the Company, the TRAprovides for the payment by the Company, directly to such exchanging owners, of 85% of the amountof cash savings in income or franchise taxes that the Company realizes as a result of (i) the tax basisincreases resulting from the exchange of JEH Units for shares of Class A common stock (or resultingfrom a sale of JEH Units for cash) and (ii) imputed interest deemed to be paid by the Company as aresult of, and additional tax basis arising from, any payments the Company makes under the TRA. TheCompany will retain the benefit of the remaining 15% of the cash savings. Liabilities under the TRAwill be recognized upon the exchange of shares. As of December 31, 2013, there have been noexchanges and no liability is recorded on the Consolidated Balance Sheet.
Comprehensive Income
The Company has no elements of comprehensive income other than net income.
Statement of Cash Flows
The Company presents its cash flows using the indirect method.
F-14

Jones Energy, Inc.
Notes to Consolidated Financial Statements (Continued)
2. Significant Accounting Policies (Continued)
Related Party Transactions
In the years ended December 31, 2013, 2012 and 2011, the Company paid an annualadministration fee to Metalmark of $0.7 million. This amount was charged to expense. As a result ofthe IPO, this fee is no longer payable to Metalmark.
On May 7, 2013, the Company entered into a natural gas sale and purchase agreement withMonarch Natural Gas, LLC, or Monarch, under which Monarch has the first right to gather the naturalgas the Company produces from the Chalker properties, process the NGLs from this natural gasproduction and market the processed natural gas and extracted NGLs. Under the Monarch agreement,the Company is paid a specified percentage of the value of the NGLs extracted and sold by Monarch,based on a set liquids recovery percentage, and the amount received from the sale of the residue gas,after deducting a fixed volume for fuel, lost and unaccounted for gas. For the year ended December 31,2013, the Company produced approximately 0.8 MMBoe of natural gas and NGLs from the Chalkerproperties that became subject to the Monarch agreement. The initial term of the agreement runs for10 years from the effective date of September 1, 2013. At the time the Company entered into theagreement, Metalmark Capital owned approximately 81% of the outstanding equity interests ofMonarch. In addition, Metalmark Capital beneficially owns in excess of five percent of the Company’soutstanding equity interests and two of our directors, Howard I. Hoffen and Gregory D. Myers, aremanaging directors of Metalmark Capital. In connection with the Company’s entering into the Monarchagreement, Monarch issued to JEH equity interests in Monarch having a deemed value of $15 million.JEH assigned $2.4 million of the Monarch equity interests to Jonny Jones, the Company’s chiefexecutive officer and chairman of the board, and reserved $2.6 million of the Monarch equity intereststo a benefit plan established for certain of the Company’s officers, including Mike McConnell, RobertBrooks and Eric Niccum. The remaining $10 million of Monarch equity was distributed to certain ofthe pre-IPO owners, which include Metalmark Capital, Wells Fargo, the Jones family entities, andcertain of the Company’s officers and directors, including Jonny Jones, Mike McConnell, RobertBrooks and Eric Niccum.
Stock Compensation
JEH implemented a management incentive plan effective January 1, 2010, that providedmembership-interest awards in JEH to members of senior management (‘‘management units’’). Themanagement unit grants awarded prior to the initial filing of the registration statement in March 2013had a dual vesting schedule. Sixty percent of the units awarded vested in five equal annual installments,with the remaining 40% vesting upon a company restructuring event, including the IPO. All grantsawarded after the initial registration statement have a single vesting structure of five equal annualinstallments and were valued at the IPO price, adjusted for equivalent shares. Both the vested andunvested management units were converted into JEH Units and shares of Class B common stock at theIPO date. At December 31, 2013, there were 457,150 unvested JEH Units and shares of Class Bcommon stock that will become convertible into a like number of shares of Class A common stockupon vesting.
Under the Jones Energy, Inc. 2013 Omnibus Incentive Plan, established in conjunction with theCompany’s IPO, the Company reserved 3,850,000 shares of Class A common stock for director andemployee stock-based compensation awards. As of December 31, 2013 no such awards had been issuedor granted to any of the Company’s employees.
F-15

Jones Energy, Inc.
Notes to Consolidated Financial Statements (Continued)
2. Significant Accounting Policies (Continued)
On September 4, 2013, the Company granted each of the four outside members of the Board ofDirectors 6,645 shares of restricted Class A common stock under the Jones Energy, Inc. 2013 OmnibusIncentive Plan. The fair value of the restricted stock grants was based on the value of the Company’sClass A common stock on the date of grant and is expensed on a straight-line basis over the one-yearvesting period.
Refer to Note 7, ‘‘Stock-based Compensation,’’ for additional information regarding themanagement units and restricted stock awards.
Business Combinations
For acquisitions of working interests that are accounted for as business combinations, the results ofoperations are included in the Consolidated Statement of Operations from the date of acquisition.Purchase prices are allocated to assets acquired based on their estimated fair values at the time ofacquisition. Fair value is the price that would be received to sell an asset or would be paid to transfer aliability in an orderly transaction between market participants at the measurement date. The fair valuemeasurement is based on the assumptions of market participants and not those of the reporting entity.Therefore, entity-specific intentions do not impact the measurement of fair value. The fair value of oiland natural gas properties is determined using a risk-adjusted after-tax discounted cash flow analysisbased upon significant inputs including: 1) oil and gas prices, 2) projections of estimated quantities ofoil and natural gas reserves, including those classified as proved, probable and possible, 3) projectionsof future rates of production, 4) timing and amount of future development and operating costs,5) projected reserve recovery factors, and 6) weighted average cost of capital.
Recent Accounting Developments
The following recently issued accounting pronouncement has been adopted by the Company:
Offsetting Assets and Liabilities
In December 2011, the Financial Accounting Standards Board (‘‘FASB’’), issued authoritativeguidance requiring entities to disclose both gross and net information about instruments andtransactions eligible for offset arrangement. In January 2013, FASB issued an update to the previouslyissued guidance with the purpose of clarifying the scope of the disclosures about the offsetting assetsand liabilities. The additional disclosures enable users of the financial statements to evaluate the effector potential effect of netting arrangements on an entity’s financial position. These disclosurerequirements are effective for interim and annual periods beginning after January 1, 2013. TheCompany has provided all required disclosures for the periods presented as they pertain to itscommodity derivative instruments (see Note 4, ‘‘Fair Value Measurement’’). These disclosurerequirements did not affect the Company’s operating results, financial position, or cash flows.
3. Acquisition of Properties
On December 18, 2013, JEH closed on the purchase of certain oil and natural gas propertieslocated in Texas and western Oklahoma from Sabine Mid-Continent, LLC, for an adjusted purchaseprice of $193.5 million (referred to herein as the ‘‘Sabine acquisition’’ or ‘‘Sabine’’), subject tocustomary closing adjustments. The acquired assets include both producing properties and undeveloped
F-16

Jones Energy, Inc.
Notes to Consolidated Financial Statements (Continued)
3. Acquisition of Properties (Continued)
acreage. The purchase was financed with borrowings under the senior secured credit facility. Thepurchase price was allocated as follows:
(in thousands of dollars)
Oil and gas propertiesUnproved . . . . . . . . . . . . . . . . . . . . . . . . . . . . . . . . . . . . . . . . . . . . . $ 39,596Proved . . . . . . . . . . . . . . . . . . . . . . . . . . . . . . . . . . . . . . . . . . . . . . . . 154,724
Asset retirement obligations . . . . . . . . . . . . . . . . . . . . . . . . . . . . . . . . . . (824)
Total purchase price . . . . . . . . . . . . . . . . . . . . . . . . . . . . . . . . . . . . $193,496
This acquisition qualified as a business combination under ASC 805. The valuation to determinethe fair value was principally based on the discounted cash flows of the producing and undevelopedproperties, including projected drilling and equipment costs, recoverable reserves, production streams,future prices and operating costs, and risk-adjusted discount rates reflective of the current market. Thedetermination of fair value is dependent on factors as of the acquisition date and the final adjustmentsto the purchase price, which when they occur, may result in an adjustment to the value of the acquiredproperties reflected in the consolidated financial statements. Any such adjustment may be material.
In connection with the closing, approximately $24 million of the purchase price was placed in anescrow account. This amount represented the allocated value of the Sabine properties that hadunresolved title defects claimed by JEH. In the event one or more title defects are not cured by Sabine,the affected property will be reconveyed to Sabine and the Company will receive an amount of cashfrom the escrow account equal to the allocated value of the reconveyed property. A correspondingadjustment to the allocation of the Sabine purchase price will be made at such time.
The unaudited pro forma results presented below have been prepared to include the effect of theSabine acquisition on our results of operations for the year ended December 31, 2013. The unauditedpro forma results do not purport to represent what our actual results of operations would have been ifthe acquisition had been completed on January 1, 2013 or to project our results of operations for anyfuture date or period.
Year EndedDecember 31,
2013PostAcquisition(1) Pro Forma(in thousands of dollars)
(unaudited) (unaudited)
Total operating revenue . . . . . . . . . . . . . . . . . . . . . . . . . $1,365 $308,773Total operating expenses . . . . . . . . . . . . . . . . . . . . . . . . 291 229,648Operating income . . . . . . . . . . . . . . . . . . . . . . . . . . . . . 1,074 79,125Net income . . . . . . . . . . . . . . . . . . . . . . . . . . . . . . . . . . 1,074 45,778
(1) Represents revenues and expenses for the post acquisition period of December 18, 2013to December 31, 2013 included in the Consolidated Statement of Operations.
On December 20, 2012, JEH acquired certain oil and natural gas properties located in Texas for apurchase price of $251.9 million (referred to herein as the ‘‘Chalker acquisition’’ or ‘‘Chalker’’). Theacquired assets included both producing properties and undeveloped acreage. The purchase was
F-17

Jones Energy, Inc.
Notes to Consolidated Financial Statements (Continued)
3. Acquisition of Properties (Continued)
financed with additional equity capital and borrowings under the senior secured credit facility. In thesecond quarter of 2013, the Company made a final determination with the sellers as to the purchaseprice adjustments resulting in a final purchase price of $253.5 million. The final purchase price wasallocated as follows:
(in thousands of dollars)
Oil and gas propertiesUnproved . . . . . . . . . . . . . . . . . . . . . . . . . . . . . . . . . . . . . . . . . . . . . $ 71,264Proved . . . . . . . . . . . . . . . . . . . . . . . . . . . . . . . . . . . . . . . . . . . . . . . . 182,493
Asset retirement obligations . . . . . . . . . . . . . . . . . . . . . . . . . . . . . . . . . . (293)
Total purchase price . . . . . . . . . . . . . . . . . . . . . . . . . . . . . . . . . . . . $253,464
This acquisition qualified as a business combination under ASC 805. The valuation to determinethe fair value was principally based on the discounted cash flows of the producing and undevelopedproperties, including projected drilling and equipment costs, recoverable reserves, production streams,future prices and operating costs, and risk-adjusted discount rates reflective of the current market.
The unaudited pro forma results presented below have been prepared to include the effect of theChalker acquisition on our results of operations for the year ended December 31, 2012. The unauditedpro forma results do not purport to represent what our actual results of operations would have been ifthe acquisition had been completed on January 1, 2012 or to project our results of operations for anyfuture date or period.
Year EndedDecember 31,
2012
Pro Forma(in thousands of dollars)(unaudited)
Total operating revenue . . . . . . . . . . . . . . . . . . . . . . . . . . . . . . . . . . . $194,685Total operating expenses . . . . . . . . . . . . . . . . . . . . . . . . . . . . . . . . . . . 161,053Operating income . . . . . . . . . . . . . . . . . . . . . . . . . . . . . . . . . . . . . . . . 33,632Net income . . . . . . . . . . . . . . . . . . . . . . . . . . . . . . . . . . . . . . . . . . . . 25,713
On April 14, 2011, Jones Energy acquired certain oil and natural gas properties located inOklahoma for a purchase price of $154.1 million. The acquisition included both producing andundeveloped properties. The purchase was financed with additional borrowings under the seniorsecured credit facility. The purchase price was allocated as follows:
(in thousands of dollars)
Oil and gas properties . . . . . . . . . . . . . . . . . . . . . . . . . . . . . . . . . . . . . . $154,225Asset retirement obligations . . . . . . . . . . . . . . . . . . . . . . . . . . . . . . . . . . (167)
Total purchase price . . . . . . . . . . . . . . . . . . . . . . . . . . . . . . . . . . . . . . $154,058
This acquisition qualified as a business combination under ASC 805. The Company recorded atotal fair value of $180.3 million ($154.1 million for producing properties and $26.2 million forundeveloped property). The total resulted in a bargain purchase gain of $26.2 million, which wasrecorded in the Consolidated Statement of Operations. The valuation to determine the fair value was
F-18

Jones Energy, Inc.
Notes to Consolidated Financial Statements (Continued)
3. Acquisition of Properties (Continued)
principally based on the discounted cash flows of the both the producing and undeveloped properties,including projected drilling and equipment costs, recoverable reserves, production streams, future pricesand operating costs, and risk-adjusted discount rates reflective of the current market. The recognizedgain was the difference between the net fair value and the consideration paid the seller.
Management believes the bargain purchase gain resulted from the fact that the seller, who retaineda 50% ownership interest in the undeveloped properties, benefitted from the Company’s availableliquidity that would enable accelerated development of the prospect.
The following income statement line items present the pro forma results as if these properties hadbeen acquired on January 1, 2010:
Year EndedDecember 31,
2011
Pro Forma(in thousands of dollars)(unaudited)
Total operating revenue . . . . . . . . . . . . . . . . . . . . . . . . . . . . . . . . . . . $176,884Total operating expenses . . . . . . . . . . . . . . . . . . . . . . . . . . . . . . . . . . . 150,197Operating income . . . . . . . . . . . . . . . . . . . . . . . . . . . . . . . . . . . . . . . . 26,687Net income . . . . . . . . . . . . . . . . . . . . . . . . . . . . . . . . . . . . . . . . . . . . 62,408
4. Fair Value Measurement
Fair Value of Financial Instruments
The Company determines fair value amounts using available market information and appropriatevaluation methodologies. Fair value is the price that would be received to sell an asset or would bepaid to transfer a liability in an orderly transaction between market participants at the measurementdate. Considerable judgment is required in interpreting market data to develop the estimates of fairvalue. The use of different market assumptions and/or estimation methods may have a material effecton the estimated fair value amounts.
The Company enters into a variety of derivative financial instruments, which may includeover-the-counter instruments, such as natural gas, crude oil, and natural gas liquid contracts. TheCompany utilizes valuation techniques that maximize the use of observable inputs, where available. Iflisted market prices or quotes are not published, fair value is determined based upon a market quote,adjusted by other market-based or independently sourced market data, such as trading volume,historical commodity volatility, and counterparty-specific considerations. These adjustments may includeamounts to reflect counterparty credit quality, the time value of money, and the liquidity of the market.
Counterparty credit valuation adjustments are necessary when the market price of an instrument isnot indicative of the fair value as a result of the credit quality of the counterparty. Generally, marketquotes assume that all counterparties have low default rates and equal credit quality. Therefore, anadjustment may be necessary to reflect the quality of a specific counterparty to determine the fair valueof the instrument. The Company currently has all derivative positions placed and held by members ofits lending group, which have strong credit quality.
F-19

Jones Energy, Inc.
Notes to Consolidated Financial Statements (Continued)
4. Fair Value Measurement (Continued)
Liquidity valuation adjustments are necessary when the Company is not able to observe a recentmarket price for financial instruments that trade in less active markets. Exchange traded contracts arevalued at market value without making any additional valuation adjustments; therefore, no liquidityreserve is applied.
Valuation Hierarchy
Fair value measurements are grouped into a three-level valuation hierarchy. The valuationhierarchy is based upon the transparency of inputs to the valuation of an asset or liability as of themeasurement date. A financial instrument’s categorization within the hierarchy is based upon the inputthat requires the highest degree of judgment in the determination of the instrument’s fair value. Thethree levels are defined as follows:
Level 1 Pricing inputs are based on published prices in active markets for identicalassets or liabilities as of the reporting date. The Company does not classifyany of its financial instruments in Level 1.
Level 2 Pricing inputs include quoted prices for similar assets and liabilities inactive markets, and inputs that are observable for the asset or liability,either directly or indirectly, as of the reporting date. Contracts that are nottraded on a recognized exchange or are tied to pricing transactions forwhich forward curve pricing is readily available are classified asLevel 2 instruments. These include natural gas, crude oil and some naturalgas liquids price swaps and natural gas basis swaps.
Level 3 Pricing inputs include significant inputs that are generally unobservablefrom objective sources. The Company classifies natural gas liquid swapsand basis swaps for which future pricing is not readily available asLevel 3. The Company obtains estimates from independent third partiesfor its open positions and subjects those to the credit adjustment criteriadescribed above.
F-20

Jones Energy, Inc.
Notes to Consolidated Financial Statements (Continued)
4. Fair Value Measurement (Continued)
The financial instruments carried at fair value as of December 31, 2013 and 2012, by consolidatedbalance sheet caption and by valuation hierarchy, as described above are as follows:
December 31, 2013
Fair Value Measurements Using
(Level 1) (Level 2) (Level 3) Total(in thousands of dollars)
Commodity Price HedgesCurrent assets . . . . . . . . . . . . . . . . . . . . . . . $— $ 8,837 $ — $ 8,837Long-term assets . . . . . . . . . . . . . . . . . . . . . — 25,967 (569) 25,398Current liabilities . . . . . . . . . . . . . . . . . . . . . — 10,188 476 10,664Long-term liabilities . . . . . . . . . . . . . . . . . . . — — 190 190
December 31, 2012
Fair Value Measurements Using
(Level 1) (Level 2) (Level 3) Total(in thousands of dollars)
Commodity Price HedgesCurrent assets . . . . . . . . . . . . . . . . . . . . . . . $— $17,648 $ — $17,648Long-term assets . . . . . . . . . . . . . . . . . . . . . — 24,756 443 25,199Current liabilities . . . . . . . . . . . . . . . . . . . . . — 2,992 1,043 4,035Long-term liabilities . . . . . . . . . . . . . . . . . . . — 6,739 918 7,657
The following table represents quantitative information about Level 3 inputs used in the fair valuemeasurement of the Company’s commodity derivative contracts as of December 31, 2013.
Quantitative Information About Level 3 Fair Value Measurements
Commodity Price Hedges Fair Value Valuation Technique Unobservable Input Range
Natural gas liquid swaps . . . $(1,235) Use a discounted cash flow Natural gas liquid futures $9.24 - $83.06 per barrelapproach using inputs includingforward price statements fromcounterparties
Significant increases/decreases in natural gas liquid futures in isolation would result in asignificantly lower/higher fair value measurement. The following table presents the changes in theLevel 3 financial instruments for the years ended December 31, 2013 and 2012. Changes in fair valueof Level 3 instruments represent changes in gains and losses for the periods that are reported in otherincome (expense). New contracts entered into during the year are generally entered into at no cost with
F-21

Jones Energy, Inc.
Notes to Consolidated Financial Statements (Continued)
4. Fair Value Measurement (Continued)
changes in fair value from the date of agreement representing the entire fair value of the instrument.Transfers between levels are evaluated at the end of the reporting period.
(in thousands of dollars)
Balance at January 1, 2012, net . . . . . . . . . . . . . . . . . . . . . . . . . . . . . . . . $(2,083)Purchases . . . . . . . . . . . . . . . . . . . . . . . . . . . . . . . . . . . . . . . . . . . . . . . . (2,352)Settlements . . . . . . . . . . . . . . . . . . . . . . . . . . . . . . . . . . . . . . . . . . . . . . . —Transfers to Level 2 . . . . . . . . . . . . . . . . . . . . . . . . . . . . . . . . . . . . . . . . . 2,370Transfers to Level 3 . . . . . . . . . . . . . . . . . . . . . . . . . . . . . . . . . . . . . . . . . 834Changes in fair value . . . . . . . . . . . . . . . . . . . . . . . . . . . . . . . . . . . . . . . . (288)
Balance at December 31, 2012, net . . . . . . . . . . . . . . . . . . . . . . . . . . . . . . (1,519)Purchases . . . . . . . . . . . . . . . . . . . . . . . . . . . . . . . . . . . . . . . . . . . . . . . . (1,095)Settlements . . . . . . . . . . . . . . . . . . . . . . . . . . . . . . . . . . . . . . . . . . . . . . . (210)Transfers to Level 2 . . . . . . . . . . . . . . . . . . . . . . . . . . . . . . . . . . . . . . . . . (753)Changes in fair value . . . . . . . . . . . . . . . . . . . . . . . . . . . . . . . . . . . . . . . . 2,342
Balance at December 31, 2013, net . . . . . . . . . . . . . . . . . . . . . . . . . . . . . . $(1,235)
Transfers from Level 3 to Level 2 represent all of the Company’s natural gas basis swaps for whichobservable forward curve pricing information has become readily available. In 2012, transfers toLevel 3 represented natural gas liquid swaps or basis swaps that were classified as Level 2 in 2011 butdue to the unavailability of forward prices in 2012, were classified as Level 3 in 2012. The purchasesrepresent natural gas liquid swaps that the Company entered into in 2013 that do not have observableforward curve pricing information.
Offsetting Assets and Liabilities
As of December 31, 2013, the counterparties to our commodity derivative contracts consisted of sixfinancial institutions. All of our counterparties or their affiliates are also lenders under our creditfacility. Therefore, we are not generally required to post additional collateral under our derivativeagreements.
Our derivative agreements contain set-off provisions that state that in the event of default or earlytermination, any obligation owed by the defaulting party may be offset against any obligation owed tothe defaulting party.
F-22

Jones Energy, Inc.
Notes to Consolidated Financial Statements (Continued)
4. Fair Value Measurement (Continued)
We adopted the guidance requiring disclosure of both gross and net information about financialinstruments eligible for netting in the balance sheet under our derivative agreements. The followingtable presents information about our commodity derivative contracts that are netted on ourConsolidated Balance Sheet as of December 31, 2013 and December 31, 2012:
Net AmountsGross of Assets / Gross Amounts
Gross Amounts Amounts Liabilities Notof Recognized Offset in the Presented in Offset in the
Assets / Balance the Balance BalanceLiabilities Sheet Sheet Sheet Net Amount(in thousands of dollars)
December 31, 2013Commodity derivative
contractsAssets . . . . . . . . . . . . . . . . $ 38,071 $(6,035) $ 32,036 $ 2,199 $ 34,235Liabilities . . . . . . . . . . . . . . (14,347) 6,035 (8,312) (2,542) (10,854)
December 31, 2012Commodity derivative
contractsAssets . . . . . . . . . . . . . . . . $ 49,200 $(7,831) $ 41,369 $ 1,478 $ 42,847Liabilities . . . . . . . . . . . . . . (17,928) 7,831 (10,097) (1,595) (11,692)
Nonfinancial Assets and Liabilities
Assets and liabilities acquired in business combinations are recorded at their fair value on the dateof acquisition. Significant Level 3 assumptions associated with the calculation of future cash flows usedin the analysis of fair value of the oil and gas property acquired include the Company’s estimate offuture commodity prices, production costs, development expenditures, production, risk-adjusteddiscount rates, and other relevant data. Additionally, fair value is used to determine the inception valueof the Company’s AROs. The inputs used to determine such fair value are primarily based upon costsincurred historically for similar work, as well as estimates from independent third parties for costs thatwould be incurred to restore leased property to the contractually stipulated condition. Additions to theCompany’s ARO represent a nonrecurring Level 3 measurement.
The Company reviews its proved oil and gas properties for impairment purposes by comparing theexpected undiscounted future cash flows at a producing field level to the unamortized capitalized costof the asset. No significant impairment charges on the Company’s proved properties were recordedduring the year ended December 31, 2013. During 2012 and 2011, unamortized capitalized costs ofcertain properties were higher than their expected undiscounted future cash flows due primarily todownward reserve revisions, drilling of marginal or uneconomic wells, or development dry holes incertain producing fields. As a result, the Company recorded charges of $18.8 million and $19.8 millionduring the years ended December 31, 2012 and 2011, respectively.
Additionally, the Company reviews its unproved properties for indicators of impairment based onthe Company’s current exploration plans. In the fourth quarter of 2013, the Company recorded animpairment charge of $14.4 million related to the Southridge properties. As the Company did not drillthe required number of wells by October 31, 2013 necessary to keep its joint development agreementwith Southridge in effect, the Company lost its right to the undeveloped acreage and associatedreserves. The Company incurred no impairment charges related to its unproved properties in 2012. In
F-23

Jones Energy, Inc.
Notes to Consolidated Financial Statements (Continued)
4. Fair Value Measurement (Continued)
2011, the Company incurred a $12.2 million impairment charge related to its unproven properties infields which were not expected to produce natural gas with a sufficiently high liquid content. With lownatural gas prices during that period, the lack of natural gas liquids reduced the economic return ofthose fields and as a result, the Company had no intentions to continue development of those fields.
Impairment charges are recorded on the Consolidated Statement of Operations. Significantassumptions associated with the calculation of future cash flows used in the impairment analysis includethe Company’s estimate of future commodity prices, production costs, development expenditures,production, risk-adjusted discount rates, and other relevant data. As such, the fair value of oil and gasproperties used in estimating impairment represents a nonrecurring Level 3 measurement.
5. Derivative Instruments and Hedging Activities
The Company had various commodity derivatives in place to offset uncertain price fluctuationsthat could affect its future operations as of December 31, 2013 and 2012, as follows:
Hedging Positions
December 31, 2013
Weighted FinalLow High Average Expiration
Oil swaps . . . . . . . . . . . . . Exercise price $ 81.70 $ 102.84 $ 89.03Barrels per month 29,000 161,613 96,149 December 2017
Natural gas swaps . . . . . . . Exercise price $ 3.88 $ 6.90 $ 4.26mmbtu per month 510,000 1,290,000 830,275 December 2017
Basis swaps . . . . . . . . . . . Contract differential $ (0.43) $ (0.11) $ (0.34)mmbtu per month 320,000 690,000 467,037 March 2016
Natural gas liquids swaps . Exercise price $ 6.72 $ 95.24 $ 32.98Barrels per month 2,000 118,000 46,646 December 2017
December 31, 2012
Weighted FinalLow High Average Expiration
Oil swaps . . . . . . . . . . . . . Exercise price $ 81.00 $ 104.45 $ 89.60Barrels per month 24,000 143,116 89,323 December 2017
Natural gas swaps . . . . . . . Exercise price $ 3.52 $ 6.90 $ 4.96mmbtu per month 430,000 1,110,000 767,053 December 2017
Basis swaps . . . . . . . . . . . Contract differential $ (0.65) $ (0.03) $ (0.31)mmbtu per month 320,000 850,000 484,615 March 2016
Natural gas liquids swaps . Exercise price $ 6.72 $ 97.13 $ 33.81Barrels per month 2,000 144,973 55,616 December 2017
F-24

Jones Energy, Inc.
Notes to Consolidated Financial Statements (Continued)
5. Derivative Instruments and Hedging Activities (Continued)
The Company recognized a net loss on derivative instruments of $2.6 million for the year endedDecember 31, 2013 and net gains of $16.7 million and $34.5 million for the years ended December 31,2012 and 2011, respectively.
6. Long-Term Debt
The Company entered into two credit agreements dated December 31, 2009, with Wells FargoBank N.A, the Senior Secured Revolving Credit Facility (the ‘‘Revolver’’) and the Second Lien TermLoan (the ‘‘Term Loan’’) which were subsequently amended on November 18, 2011, November 5, 2012,December 20, 2012, June 12, 2013, December 18, 2013 and January 29, 2014. In connection with theNovember 2012 amendment, the maturity date of the Revolver was extended to November 5, 2017 andthe maturity date of the Term loan was extended to May 5, 2018. In connection with the June 2013amendment, the borrowing base on the Revolver was increased to $500.0 million and subsequentlyincreased to $575.0 million on December 18, 2013 in conjunction with the Sabine acquisition. TheCompany’s oil and gas properties are pledged as collateral against these credit agreements.
Terms of the Revolver require the Company to pay interest on the loan on the earlier of theLondon InterBank Offered Rate (LIBOR) tranche maturity date or three months, with the entireprincipal and interest due on the loan maturity date. Borrowings may be drawn on the principalamount up to the maximum available credit amount. Interest on the Revolver is calculated at a baserate (LIBOR or prime), plus a margin of 0.50% to 2.50% based on the actual amount borrowedcompared to the borrowing base amount and the base rate selected. For the year ended December 31,2013, the average interest rate under the Revolver was 3.01% on an average outstanding balance of$384.9 million. For the year ended December 31, 2012, the average interest rate under the Revolverwas 3.30% on an average outstanding balance of $306.8 million.
Terms of the Term Loan require the Company to pay interest on the loan every three months withthe principal and interest due on the loan maturity date of May 5, 2018. Interest on the Term Loan iscalculated at a base rate (LIBOR, prime, or federal funds), plus a margin of 6% to 7% based on thebase rate selected. As of December 31, 2013, the average interest rate was 9.19% on an averageoutstanding balance of $160.0 million. As of December 31, 2012, the average interest rate was 9.16%on an average outstanding balance of $121.3 million.
Total interest and commitment fees under the two facilities were $27.0 million, $21.2 million and$18.2 million for the years ended December 31, 2013, 2012 and 2011, respectively.
In connection with the IPO, the Company used the net proceeds to repay outstanding borrowingsunder the Revolver of $167.0 million.
The Revolver and Term Loans are categorized as Level 3 in the valuation hierarchy as the debt isnot publicly traded and no observable market exists to determine the fair value; however, the carryingvalue of the Revolver and Term Loans approximate fair value, as they are subject to short-term floatinginterest rates that approximate the rates available to the Company for those periods.
The Revolver and Term Loans include covenants that require, among other things, restrictions onasset sales, distributions to members, and additional indebtedness, and the maintenance of certainfinancial ratios, including leverage, proven reserves to debt, and current ratio. The Company was incompliance with these covenants at December 31, 2013.
F-25

Jones Energy, Inc.
Notes to Consolidated Financial Statements (Continued)
7. Stock-based Compensation
JEH granted membership-interest awards in JEH to members of senior management(‘‘management units’’) under a management incentive plan prior to the IPO. These awards had variousvesting schedules, and a portion of the management units vested in a lump sum at the IPO date. Boththe vested and unvested management units were converted into JEH Units and shares of Class Bcommon stock at the IPO date. As of December 31, 2013, there were 457,150 unvested JEH Units andshares of Class B common stock. The Units/shares will become convertible into a like number of sharesof Class A common stock upon vesting. The following table summarizes information related to theUnits/shares held by management:
Weighted AverageGrant Date Fair Value
JEH Units per Share
Unvested at January 1, 2013 . . . . . . . . . . . . . . . . . . . 710,767 $ 3.62Granted . . . . . . . . . . . . . . . . . . . . . . . . . . . . . . . . . 911,654 $15.00Forfeited . . . . . . . . . . . . . . . . . . . . . . . . . . . . . . . . . (167,239) $ 3.62Vested . . . . . . . . . . . . . . . . . . . . . . . . . . . . . . . . . . (998,032) $ 9.96
Unvested at December 31, 2013 . . . . . . . . . . . . . . . . 457,150 $12.46
Stock compensation expense associated with the management units for the years endedDecember 31, 2013, 2012 and 2011 was $10.7 million, $0.6 million and $1.1 million, respectively, and isincluded in general and administrative expenses on the Company’s Consolidated Statement ofOperations.
On September 4, 2013, the Company granted restricted stock awards to non-employee members ofthe Board of Directors. Each of the four directors was awarded 6,645 restricted shares of Class Acommon stock, contingent on the director serving as a director of the Company for a one-year serviceperiod from the date of grant. The fair value of the awards was based on the value of the Company’sClass A common stock on the date of grant. The total value of the awards to the directors is as follows:
Weighted AverageRestricted Grant Date Fair Value
Stock Awards per Share
Unvested at January 1, 2013 . . . . . . . . . . . . . . . . . — —Granted . . . . . . . . . . . . . . . . . . . . . . . . . . . . . . . 27 $15.05Forfeited . . . . . . . . . . . . . . . . . . . . . . . . . . . . . . . — —Vested . . . . . . . . . . . . . . . . . . . . . . . . . . . . . . . . . — —
Unvested at December 31, 2013 . . . . . . . . . . . . . . 27 $15.05
Stock compensation expense associated with the Board of Directors awards for the year endedDecember 31, 2013 was $0.1 million and is included in general and administrative expenses on theCompany’s Consolidated Statement of Operations.
8. Earnings per Share
Basic earnings per share (‘‘EPS’’) is computed by dividing net income (loss) attributable tocontrolling interests by the weighted-average number of shares of Class A common stock outstandingduring the period. Class B common stock is not included in the calculation of earnings per share
F-26

Jones Energy, Inc.
Notes to Consolidated Financial Statements (Continued)
8. Earnings per Share (Continued)
because they are not participating securities and have no economic interest in the Company. Dilutedearnings per share takes into account the dilutive effect of potential common stock that could be issuedby the Company in conjunction with stock awards that have been granted to directors and employees.On September 4, 2013 (the ‘‘grant date’’), the Company granted to its directors restricted shares ofClass A common stock, which vest on the first anniversary of the grant date. In accordance withASC 260, Earnings Per Share, awards of nonvested shares shall be considered outstanding as of thegrant date for purposes of computing diluted EPS even though their exercise is contingent uponvesting. For the year ended December 31, 2013, the directors’ restricted shares of Class A commonstock were excluded from the diluted calculation, as their inclusion would have been anti-dilutive as theCompany was in a net loss position. The following is a calculation of the basic and diluted weighted-average number of shares of Class A common stock outstanding and EPS for the year endedDecember 31, 2013. Net income (loss) and the weighted average number of shares of Class A commonstock outstanding is based on the actual days in which the shares were outstanding for the period fromJuly 29, 2013, the closing date of the IPO, to December 31, 2013.
December 31, 2013(in thousands, except per share data)
Income (numerator):Net income (loss) attributable to controlling interests . . . . . . . . . $(2,186)
Weighted-average shares (denominator):Weighted-average number of shares of Class A common stock—
basic and diluted . . . . . . . . . . . . . . . . . . . . . . . . . . . . . . . . . . 12,500
Earnings (loss) per share:Basic and diluted . . . . . . . . . . . . . . . . . . . . . . . . . . . . . . . . . . . $ (0.17)
Anti-dilutive restricted shares of Class A common stock . . . . . . . . . 27
9. Monarch Investment
On May 7, 2013, the Company entered into a marketing agreement with Monarch NaturalGas, LLC (‘‘Monarch’’), a company related through common ownership, for the sale to Monarch ofnatural gas produced from certain properties. In connection with that agreement, Monarch issued tothe Company equity interests in its parent, Monarch Natural Gas Holdings, LLC, having an estimatedfair value of $15.0 million. Contemporaneous with the execution of the marketing agreement and theissuance of the equity interests, the Company distributed 67% or $10 million of the Monarch equityinterests to the Company’s owners pro rata based on equity contributions and approximately 16% ofthe interests to a member of management. The remaining approximately 17% of the equity interestswere reserved for distribution to management through an incentive plan. The Company recognized$0.3 million of compensation expense during the year ended December 31, 2013 in connection with theincentive plan. In addition, the Company recorded deferred revenue of $15.0 million which is beingamortized on an estimated units-of-production basis commencing in September 2013, the first month ofproduction sales to Monarch. The Company amortized $0.5 million of the deferred revenue balanceduring the year ended December 31, 2013 and is recorded in other revenues on the Company’sConsolidated Statement of Operations.
F-27

Jones Energy, Inc.
Notes to Consolidated Financial Statements (Continued)
10. Commitments and Contingencies
Lease obligations
The Company leases approximately 31,000 square feet of office space in Austin, TX under anoperating lease arrangement. Future minimum payments for noncancellable operating leases extendingbeyond one year at December 31, 2013 are as follows:
(in thousands of dollars)
Years Ending December 31,2014 . . . . . . . . . . . . . . . . . . . . . . . . . . . . . . . . . . . . . . . . . . . . . . . . . . . . . $ 5862015 . . . . . . . . . . . . . . . . . . . . . . . . . . . . . . . . . . . . . . . . . . . . . . . . . . . . . 4822016 . . . . . . . . . . . . . . . . . . . . . . . . . . . . . . . . . . . . . . . . . . . . . . . . . . . . . 4582017 . . . . . . . . . . . . . . . . . . . . . . . . . . . . . . . . . . . . . . . . . . . . . . . . . . . . . 147Thereafter . . . . . . . . . . . . . . . . . . . . . . . . . . . . . . . . . . . . . . . . . . . . . . . . —
$1,673
Rent expense under operating leases was $0.8 million, $0.8 million and $0.7 million for the yearsended December 31, 2013, 2012 and 2011, respectively.
Litigation
The Company is subject to legal proceedings and claims that arise in the ordinary course of itsbusiness. The Company believes that the final disposition of such current matters will not have amaterial adverse effect on its financial position, results of operations, or liquidity.
11. Benefit Plans
The Company established a 401(k) tax-deferred savings plan (the ‘‘Plan’’) for the benefit ofemployees. The Plan is a defined contribution plan and the Company may match a portion of employeecontributions. For the years ended December 31, 2013 and 2012, $0.3 million and $0.2 million werecontributed, respectively, to the Plan.
In 2013, the Company established a 409A tax-deferred savings plan for the benefit of keyemployees. This plan is a defined contribution plan, and the Company may match a portion ofemployee contributions. For the year ended December 31, 2013, the Company made a negligiblecontribution to this plan.
12. Income Taxes
Following its IPO, the Company began recording a federal and state income tax liability associatedwith its status as a corporation. Prior to the IPO, the Company only recorded a provision for Texasfranchise tax as the Company’s taxable income or loss was includable in the income tax returns of theindividual partners and members.
The Company will recognize a tax liability on its share of pre-tax book income, exclusive of thenon-controlling interest. JEH is not subject to income tax at the federal level and only recognizes Texas
F-28

Jones Energy, Inc.
Notes to Consolidated Financial Statements (Continued)
12. Income Taxes (Continued)
franchise tax expense. The following table summarizes the tax provision for the years endedDecember 31, 2013, 2012 and 2011:
Year Ended December 31,
2013 2012 2011(in thousands of dollars)
Current tax expenseFederal . . . . . . . . . . . . . . . . . . . . . . . . . . . . . . . . . . . . . . . . . . . . . . . . . . . $ 85 $ — $ —State . . . . . . . . . . . . . . . . . . . . . . . . . . . . . . . . . . . . . . . . . . . . . . . . . . . . . — — —
Total current expense . . . . . . . . . . . . . . . . . . . . . . . . . . . . . . . . . . . . . . . . . . 85 — —
Deferred tax expense (benefit)Federal . . . . . . . . . . . . . . . . . . . . . . . . . . . . . . . . . . . . . . . . . . . . . . . . . . . (1,260) — —State . . . . . . . . . . . . . . . . . . . . . . . . . . . . . . . . . . . . . . . . . . . . . . . . . . . . . 1,104 473 173
Total deferred expense (benefit) . . . . . . . . . . . . . . . . . . . . . . . . . . . . . . . . . . . (156) 473 173
Total tax expense (benefit) . . . . . . . . . . . . . . . . . . . . . . . . . . . . . . . . . . . . . . (71) 473 173
Tax benefit attributable to controlling interests . . . . . . . . . . . . . . . . . . . . . . . . (1,223) — —Tax expense attributable to non-controlling interests . . . . . . . . . . . . . . . . . . . . 1,152 473 173
Total tax expense (benefit) . . . . . . . . . . . . . . . . . . . . . . . . . . . . . . . . . . . . . . $ (71) $473 $173
For the years ended December 31, 2012 and 2011, the reported taxes relate solely to the Texasfranchise tax liability of JEH.
A reconciliation of the Company’s provision for income taxes as reported and the amountcomputed by multiplying income before taxes, less non-controlling interest, by the U.S. federal statutoryrate of 35%:
December 31, 2013(in thousands of dollars)
Provision calculated at federal statutory income tax rate:Net income before taxes . . . . . . . . . . . . . . . . . . . . . . . . . . . . . . . . . . . . . . . . . . . $22,334Statutory rate . . . . . . . . . . . . . . . . . . . . . . . . . . . . . . . . . . . . . . . . . . . . . . . . . . . 35%
Income tax expense computed at statutory rate . . . . . . . . . . . . . . . . . . . . . . . . . . . 7,817Less: Non-controlling interests . . . . . . . . . . . . . . . . . . . . . . . . . . . . . . . . . . . . . (9,009)
Income tax benefit attributable to controlling interests . . . . . . . . . . . . . . . . . . . . (1,192)State and local income taxes, net of federal benefit . . . . . . . . . . . . . . . . . . . . . . . . (49)Other . . . . . . . . . . . . . . . . . . . . . . . . . . . . . . . . . . . . . . . . . . . . . . . . . . . . . . . . . 18
Tax benefit attributable to controlling interests . . . . . . . . . . . . . . . . . . . . . . . . (1,223)Tax expense attributable to non-controlling interests . . . . . . . . . . . . . . . . . . . . . . . 1,152
Total income tax benefit . . . . . . . . . . . . . . . . . . . . . . . . . . . . . . . . . . . . . . . . $ (71)
For the years ended December 31, 2012 and 2011, the calculation is not applicable as theCompany was not subject to federal income taxes prior to the IPO.
F-29

Jones Energy, Inc.
Notes to Consolidated Financial Statements (Continued)
12. Income Taxes (Continued)
The Company is subject to federal, state and local income and franchise taxes. As such, deferredincome taxes result from temporary differences between the carrying amounts of assets and liabilities ofthe Company for financial reporting purposes and the amounts used for income tax purposes. Deferredtax assets and liabilities are measured using enacted tax rates in effect in the years in which thosetemporary differences are expected to reverse.
Significant components of the Company’s deferred tax assets and deferred tax liabilities consistedof the following:
As of December 31,
2013 2012(in thousands of dollars)
Deferred tax assetsInvestment in consolidated subsidiary JEH . . . . . . . . . . . . . . . $ 526 $ —Net operating loss . . . . . . . . . . . . . . . . . . . . . . . . . . . . . . . . . 649 —Alternative minimum tax credits . . . . . . . . . . . . . . . . . . . . . . . 86 —State deferred tax asset . . . . . . . . . . . . . . . . . . . . . . . . . . . . . 52 —
Total deferred tax assets . . . . . . . . . . . . . . . . . . . . . . . . . . . 1,313 —
Deferred tax liabilitiesState deferred tax liability . . . . . . . . . . . . . . . . . . . . . . . . . . . 3,093 1,936
Total deferred tax liabilities . . . . . . . . . . . . . . . . . . . . . . . . . 3,093 1,936
Net deferred tax assets (liabilities) . . . . . . . . . . . . . . . . . . . . . . . (1,780) (1,936)Valuation allowance . . . . . . . . . . . . . . . . . . . . . . . . . . . . . . . . . — —
Net deferred tax assets (liabilities) . . . . . . . . . . . . . . . . . . . . $(1,780) $(1,936)
The Company has a federal net operating loss carry-forward totaling $1.8 million and state netoperating loss carry-forward of $0.4 million, both expiring in 2033. No valuation allowance has beenrecorded as management believes that there is sufficient future taxable income to fully utilize itsdeferred tax assets. This future taxable income will arise from reversing temporary differences due tothe excess of the book carrying value of oil and gas properties over their corresponding tax basis. TheCompany may elect to capitalize intangible drilling costs, rather than expensing these costs, in order toprevent an operating loss carry-forward from expiring unused.
Separate federal and state income tax returns are filed for Jones Energy, Inc. and Jones EnergyHoldings, LLC. JEH’s Texas franchise tax returns are subject to audit for 2009, 2010, 2011, and 2012.The tax years 2010 through 2013 remain open to examination by the major taxing jurisdictions to whichthe Company is subject. The Company is not currently under audit in any other major taxingjurisdiction.
Accounting for uncertainty in income taxes prescribes a recognition threshold and measurementmethodology for the financial statement recognition and measurement of a tax position taken orexpected to be taken in a tax return. As of December 31, 2013 and December 31, 2012 there was nomaterial liability or expense for the periods then ended recorded for payments of interest and penaltiesassociated with uncertain tax positions or material unrecognized tax positions and the Company’sunrecognized tax benefits were not material.
F-30

Jones Energy, Inc.Supplemental Information on Oil and Gas Producing Activities (Unaudited)
Costs Incurred
Costs incurred for oil and gas property acquisitions, exploration and development for the last threeyears are as follows:
2013 2012 2011(in thousands of dollars)
Property acquisitions:Unproved . . . . . . . . . . . . . . . . . . . . . . . . . . . . . $ 51,266 $ 69,725 $ —Proved . . . . . . . . . . . . . . . . . . . . . . . . . . . . . . . 142,230 182,200 168,480
Exploration . . . . . . . . . . . . . . . . . . . . . . . . . . . . . 1,710 356 780Development . . . . . . . . . . . . . . . . . . . . . . . . . . . . 240,412 125,493 156,628Asset retirement costs . . . . . . . . . . . . . . . . . . . . . . 1,822 662 418
Total costs incurred . . . . . . . . . . . . . . . . . . . . . . $437,440 $378,436 $326,306
Capitalized Costs
Capitalized costs for our oil and gas properties consisted of the following at the end of each of thefollowing years:
2013 2012(in thousands)
Unproved properties . . . . . . . . . . . . . . . . . . . . . . . . . . . . $ 114,457 $ 137,254Proved properties . . . . . . . . . . . . . . . . . . . . . . . . . . . . . . . 1,568,564 1,127,285
1,683,021 1,264,539Accumulated depletion and impairment . . . . . . . . . . . . . . . (370,470) (257,195)
Net capitalized costs . . . . . . . . . . . . . . . . . . . . . . . . . . . . . $1,312,551 $1,007,344
Reserves
Users of this information should be aware that the process of estimating quantities of proved andproved developed oil and gas reserves (including natural gas liquids) is very complex, requiringsignificant subjective decisions in the evaluation of all available geological, engineering and economicdata for each reservoir. The data for a given reservoir also may change substantially over time as aresult of numerous factors, including additional development activity, evolving production history andcontinual reassessment of the viability of production under varying economic conditions. Consequently,material revisions to existing reserve estimates may occur from time to time.
The following tables set forth the Company’s total proved reserves and the changes in theCompany’s total proved reserves. These reserve estimates are based in part on reports prepared byCawley, Gillespie & Associates, Inc. (‘‘Cawley Gillespie’’), independent petroleum engineers, utilizingdata compiled by us. In preparing its reports, Cawley Gillespie evaluated properties representing all ofthe Company’s proved reserves at December 31, 2013, 2012 and 2011. The Company’s proved reservesare located onshore in the United States. There are many uncertainties inherent in estimating provedreserve quantities, and projecting future production rates and the timing of future developmentexpenditures. In addition, reserve estimates of new discoveries are more imprecise than those ofproperties with production history. Accordingly, these estimates are subject to change as additionalinformation becomes available. Proved reserves are the estimated quantities of natural gas, natural gasliquids and oil that geoscience and engineering data demonstrate with reasonable certainty to beeconomically producible in future years from known oil and natural gas reservoirs under existing
F-31

economic conditions, operating methods and government regulations at the end of the respective years.Proved developed reserves are those reserves expected to be recovered through existing wells withexisting equipment and operating methods.
Crude Oil NGL Natural Gas Total(MBbls) (MBbls) (MMcf) (MBoe)(1)
Estimated Proved ReservesDecember 31, 2010 . . . . . . . . . . . . . . . . . . . . . . . . . . . . . 5,991 9,953 108,634 34,050
Extensions and discoveries . . . . . . . . . . . . . . . . . . . . . . 2,419 7,881 50,310 18,685Production . . . . . . . . . . . . . . . . . . . . . . . . . . . . . . . . . . (811) (1,215) (11,438) (3,932)Purchases of minerals in place . . . . . . . . . . . . . . . . . . . . 378 18,182 117,489 38,142Sales of minerals in place . . . . . . . . . . . . . . . . . . . . . . . (114) (201) (2,688) (763)Revisions of previous estimates . . . . . . . . . . . . . . . . . . . (423) 6 (17,728) (3,372)
December 31, 2011 . . . . . . . . . . . . . . . . . . . . . . . . . . . . . 7,440 34,606 244,579 82,810
Extensions and discoveries . . . . . . . . . . . . . . . . . . . . . . 286 1,766 11,727 4,007Production . . . . . . . . . . . . . . . . . . . . . . . . . . . . . . . . . . (742) (1,770) (13,980) (4,842)Purchases of minerals in place . . . . . . . . . . . . . . . . . . . . 6,056 5,799 36,842 17,995Sales of minerals in place . . . . . . . . . . . . . . . . . . . . . . . (8) (53) (309) (113)Revisions of previous estimates . . . . . . . . . . . . . . . . . . . (492) (5,602) (50,779) (14,557)
December 31, 2012 . . . . . . . . . . . . . . . . . . . . . . . . . . . . . 12,540 34,746 228,080 85,300
Extensions and discoveries . . . . . . . . . . . . . . . . . . . . . . 3,786 5,710 39,799 16,129Production . . . . . . . . . . . . . . . . . . . . . . . . . . . . . . . . . . (1,557) (1,724) (17,575) (6,210)Purchases of minerals in place . . . . . . . . . . . . . . . . . . . . 3,275 4,418 35,023 13,530Sales of minerals in place . . . . . . . . . . . . . . . . . . . . . . . — — 583 97Revisions of previous estimates . . . . . . . . . . . . . . . . . . . (1,356) (10,235) (49,262) (19,801)
December 31, 2013 . . . . . . . . . . . . . . . . . . . . . . . . . . . . . 16,688 32,915 236,648 89,045
Revision of previous estimates
For the year ended December 31, 2013, the Company had net negative revisions of 19,801 MBoe,of which 15,518 MBoe was related to the expiration of the Company’s JDA with Southridge. Theremaining net negative revisions of 4,283 MBoe were due to a combination of production performancein the Cleveland and Woodford, prices and other changes.
For the year ended December 31, 2012, the Company had net negative revisions of 14,557 MBoeprimarily due to the removal of certain proved undeveloped reserves in the Atoka formation,production performance in the Woodford formation and decreased gas prices in the Cleveland.
For the year ended December 31, 2011, the Company had net negative revisions of 3,372 MBoeprimarily due to the removal of certain proved undeveloped reserves in the Granite Wash, Cleveland,and Atoka formations due to decreased gas prices. This was partially offset by the addition of certain
F-32

proved undeveloped reserves in the more liquid-rich area of the Cleveland formation due to increasedoil prices.
Crude Oil NGL Natural Gas Total(MBbls) (MBbls) (MMcf) (MBoe)(1)
Estimated Proved ReservesDecember 31, 2011
Proved developed . . . . . . . . . . . . . . . . 2,535 14,020 110,433 34,961Proved undeveloped . . . . . . . . . . . . . . 4,905 20,586 134,146 47,849
Total proved reserves . . . . . . . . . . . . . 7,440 34,606 244,579 82,810
December 31, 2012Proved developed . . . . . . . . . . . . . . . . 4,262 16,320 110,956 39,075Proved undeveloped . . . . . . . . . . . . . . 8,278 18,426 117,124 46,225
Total proved reserves . . . . . . . . . . . . . 12,540 34,746 228,080 85,300
December 31, 2013Proved developed . . . . . . . . . . . . . . . . 7,129 19,101 139,623 49,501Proved undeveloped . . . . . . . . . . . . . . 9,559 13,814 97,025 39,544
Total proved reserves . . . . . . . . . . . . . 16,688 32,915 236,648 89,045
(1) Barrels of oil equivalent determined using the ratio of six Mcf of natural gas to one Bblof crude oil or natural gas liquids.
Standardized Measure of Discounted Future Net Cash Flows Relating to Proved Oil and Gas Reserves
The following information was developed utilizing procedures prescribed by FASB AccountingStandards Codification Topic 932, Extractive Industries—Oil and Gas (Topic 932). The ‘‘standardizedmeasure of discounted future net cash flows’’ should not be viewed as representative of the currentvalue of our proved oil and gas reserves. It and the other information contained in the following tablesmay be useful for certain comparative purposes, but should not be solely relied upon in evaluating theCompany or its performance.
In reviewing the information that follows, the following factors should be taken into account:
• future costs and sales prices will probably differ from those required to be used in thesecalculations;
• actual production rates for future periods may vary significantly from the rates assumed in thecalculations;
• future tax rates, deductions and credits are calculated under current laws, which may change infuture years;
• a 10% discount rate may not be reasonable relative to risk inherent in realizing future net oiland natural gas revenues.
Under the standardized measure, future cash inflows were estimated by using the average of thehistorical unweighted first-day-of-the-month prices of oil and natural gas for the prior twelve monthperiods ended December 31, 2013, 2012 and 2011. Future cash inflows do not reflect the impact ofopen hedge positions. Future cash inflows were reduced by estimated future development andproduction costs based on year-end costs in order to arrive at net cash flows. Use of a 10% discountrate, first-day-of-the-month prices and year-end costs are required by ASC 932.
F-33

In general, management does not rely on the following information in making investment andoperating decisions. Such decisions are based upon a wide range of factors, including estimates ofprobable as well as proved reserves and varying price and cost assumptions considered morerepresentative of a range of possible outcomes.
The standardized measure of discounted future net cash flows from the Company’s estimatedproved oil and natural gas reserves follows:
2013 2012 2011(in thousands)
Future cash inflows . . . . . . . . . . . . . . . . . . . . . . . . . . . . . . . . . $3,213,718 $2,746,767 $ 3,279,260Less related future:
Production costs . . . . . . . . . . . . . . . . . . . . . . . . . . . . . . . (734,974) (612,054) (648,035)Development costs . . . . . . . . . . . . . . . . . . . . . . . . . . . . . . (549,343) (529,692) (556,302)Income tax expenses . . . . . . . . . . . . . . . . . . . . . . . . . . . . (129,497) — —
Future net cash flows . . . . . . . . . . . . . . . . . . . . . . . . . . . . . . . 1,799,904 1,605,021 2,074,92310% annual discount for estimated timing of cash flows . . . . . . (859,395) (823,001) (1,159,116)
Standardized measure of discounted future net cash flows . . . . . $ 940,509 $ 782,020 $ 915,807
A summary of the changes in the standardized measure of discounted future net cash flowsapplicable to proved natural gas and crude oil reserves follows:
2013 2012 2011(in thousands)
Balance, beginning of period . . . . . . . . . . . . . . . . . . . . . . . . . . . . $ 782,020 $ 915,807 $ 354,507
Net change in sales and transfer prices, net of production expenses 77,280 (336,855) 133,740Changes in estimated future development costs . . . . . . . . . . . . . . . (9,706) 67,495 3,391Sales and transfers of oil and gas produced during the period . . . . (224,739) (119,931) (139,600)Net change due to extensions and discoveries . . . . . . . . . . . . . . . . 239,844 37,723 298,299Net change due to purchases of minerals in place . . . . . . . . . . . . . 149,619 197,740 230,687Net change due to sales of minerals in place . . . . . . . . . . . . . . . . . (337) (1,578) (10,969)Net change due to revisions in quantity estimates . . . . . . . . . . . . . (168,438) (144,901) (48,425)Previously estimated development costs incurred during the period . 110,783 99,513 83,287Net change in income taxes . . . . . . . . . . . . . . . . . . . . . . . . . . . . . (76,965) — —Accretion of discount . . . . . . . . . . . . . . . . . . . . . . . . . . . . . . . . . 59,621 91,581 35,451Other . . . . . . . . . . . . . . . . . . . . . . . . . . . . . . . . . . . . . . . . . . . . . 1,527 (24,574) (24,561)
Balance, end of period . . . . . . . . . . . . . . . . . . . . . . . . . . . . . . . . . $ 940,509 $ 782,020 $ 915,807
F-34

Supplemental Quarterly Financial Information (Unaudited)
Following is a summary of the Company’s results of operations by quarter for the years endedDecember 31, 2013 and 2012.
2013
First Second Third Fourth FullQuarter Quarter Quarter Quarter Year(in thousands except per share data)
Revenues . . . . . . . . . . . . . . . . . . . . . . . . . . . . . . $55,480 $64,526 $ 68,851 $ 70,312 $259,169Operating income . . . . . . . . . . . . . . . . . . . . . . . . 18,047 20,251 12,095 5,359 55,752Net income (loss) . . . . . . . . . . . . . . . . . . . . . . . . (1,452) 48,417 (15,483) (9,077) 22,405Net income (loss) attributable to non-controlling
interests . . . . . . . . . . . . . . . . . . . . . . . . . . . . . (14,623) (7,751) 24,591Net loss attributable to controlling interests . . . . . (860) (1,326) (2,186)Basic and diluted earnings per share . . . . . . . . . . $ (0.07) $ (0.11) $ (0.17)
2012
First Second Third Fourth FullQuarter Quarter Quarter Quarter Year
Revenues . . . . . . . . . . . . . . . . . . . . . . . . . . . . . . $42,797 $31,354 $ 31,935 $ 43,728 $149,814Operating income (loss) . . . . . . . . . . . . . . . . . . . 12,989 1,852 (324) (9,677) 4,840Net income (loss) . . . . . . . . . . . . . . . . . . . . . . . . 15,323 26,803 (24,527) (20,678) (3,079)
Supplemental Quarterly Financial Information (Unaudited)
We identified an error in our previously issued financial statements which would have beenmaterial to our fourth quarter of 2013 if recorded as an out of period adjustment in such period.Therefore, we have revised our Supplemental Quarterly Financial Information for the quarters endedMarch 31, 2012, June 30, 2012, September 30, 2012, December 31, 2012, March 31, 2013, June 30, 2013and September 30, 2013 to reflect additional interest expense on obligations that are unrelated to ourcredit agreements discussed in Note 6. These revisions had the effect of:
• decreasing net income (loss) by $0.1 million, $0.1 million, $0.2 million, $0.2 million, $0.2 million,$0.2 million, and $0.3 million for the quarters ended March 31, 2012, June 30, 2012,September 30, 2012, December 31, 2012, March 31, 2013, June 30, 2013 and September 30,2013, respectively;
• decreasing net income (loss) attributable to non-controlling interests by $0.2 million, for each ofthe quarters ended March 31, 2013, June 30, 2013 and September 30, 2013; and
• decreasing net loss attributable to controlling interests by $39 thousand for the quarter endedSeptember 30, 2013.
We have determined that these errors are not material to any of our previously issued interim orannual consolidated financial statements, therefore, no restatements have been made to the 2013quarterly financial statements included in our previously filed Form 10-Qs for this matter. Additionally,revisions to the three month period ended March 31, 2013, the three and six month periods endedJune 30, 2013 and the three and nine month periods ended September 30, 2013 will be made whenthey are next filed in the Company’s quarterly financial statements on Form 10-Q for the quartersending March 31, 2014, June 30, 2014 and September 30, 2014, respectively.
F-35

FORWARD-LOOKING STATEMENT:
This annual report contains forward-looking statements within the meaning of Section 27A of the Securities Act of 1933 and Section 21E of the Securities Exchange Act of 1934. All statements, other than statements of historical facts, included in this annual report that address activities, events or developments that the Company expects, believes or anticipates will or may occur in the future are forward-looking statements. Without limiting the generality of the foregoing, forward-looking statements contained in this annual report specifically include the expectations of plans, strategies, objectives and anticipated operating results of the Company, including guidance regarding the Company’s drilling program and ability to achieve favorable pricing for future acquisitions. These statements are based on certain assumptions made by the Company based on management’s experience and perception of historical trends, current conditions, anticipated future developments and other factors believed to be appropriate. Such statements are subject to a number of assumptions, risks and uncertainties, many of which are beyond the control of the Company, which may cause actual results to differ materially from those implied or expressed by the forward-looking statements and are described in further detail in the Company’s Annual Report on Form 10-K. Any forward-looking statement speaks only as of the date on which such statement is made and the Company undertakes no obligation to correct or update any forward-looking statement, whether as a result of new information, future events or otherwise, except as required by applicable law.
MANAGEMENT:
Jonny Jones, Founder, Chairman & Chief Executive OfficerMike S. McConnell, Director & President Robert J. Brooks, Executive Vice President & Chief Financial OfficerEric Niccum, Executive Vice President & Chief Operating Officer Jody Crook, Sr. Vice President – Acquisitions Kristel Franklin, Sr. Vice President – AssetsHal Hawthorne, Sr. Vice President – New VenturesStephen Roberts, Sr. Vice President – Drilling & Completions Todd Wehner, Sr. Vice President & Chief Accounting Officer
BOARD OF DIRECTORS:
Jonny Jones, ChairmanAlan D. Bell, Director Howard I. Hoffen, DirectorMike S. McConnell, Director Gregory D. Myers, Director Hal Washburn, Director
CORPORATE HEADQUARTERS:
Jones Energy, Inc.807 Las Cimas Parkway, Suite 350Austin, Texas 78746Phone: 512.328.2953Fax: 512.328.5394
TRANSFER AGENT:
American Stock Transfer & Trust Company59 Maiden LaneNew York, New York 10038www.amstock.com STOCK EXCHANGE:
Common stock traded on the New York Stock Exchange under the symbol: JONE FORM 10-K:
For an additional copy of the Annual Report on Form 10-K, please contact: Jones Energy, Inc.Investor Relations DepartmentPhone: 512.328.2953Email: [email protected] WEBSITE ADDRESS:
www.jonesenergy.com ANNUAL MEETING:
The Annual Meeting for Jones Energy, Inc. shareholders will be held at our corporate headquarters in Austin, Texas on May 22, 2014.

J O N E S E N E R g Y, I N C .
8 0 7 l a s c i m a s p a r k w a y , s u i t e 3 5 0
a u s t i n , t e x a s 7 8 7 4 6