Embed Size (px)
Citation preview

capital region air quality management frameworkfor nitrogen dioxide (no2),
Sulphur dioxide (So2),
fine particulate matter (pm2.5)
and ozone (o3)

management of ambient air quality in the capital region is complex. this framework applies a cumulative effects management approach, which is regional, integrated, collaborative and future-focused.

3
contents
4 Executive Summary
11 Introduction
17 The Current System
22 Framework Principles and Conceptual Approach
31 Assignment of Ambient Air Quality Levels
37 Framework Responses to Ambient Air Quality Levels
43 Components of the Capital Region Air Quality Management Framework
57 Enabling the Framework
60 References
61 Appendix A: Terminology
67 Appendix B: Trends in the Capital Region
70 Appendix C: Technical Supporting Document Summary

4
executive summary
Since 2007, alberta environment and Sustainable resource development has been working collaboratively with stakeholders to develop cumulative effects management frameworks that address intensifying pressures of population growth and economic and industrial development. the frameworks set down strategies for managing growth pressures on air, land and water over the coming decades.
in 2010, alberta environment and Sustainable resource development called upon stakeholders to develop an ambient air quality management framework for the capital region. the capital region is defined by the boundary of edmonton capital region Board including elk island national park. the region includes 25 municipalities and has a strong industrial base including refining, chemical manufacturing and electric power generation, and is a potential area of growth for bitumen upgrading. individual activities, such as cars, trucks, home heating and activities in urban centers also have a signficant impact on ambient air quality. these activities generate four main air contaminants of concern: nitrogen dioxide, sulphur dioxide, fine particulate matter and ozone. increases in air pollution can lead to increases in negative health effects. Small increases in air pollution over a short period of time can increase symptoms of pre-existing illness among those at risk.
to bring together expertise and knowledge of the unique air quality pressures, conditions and requirements of the capital region, a multi-stakeholder Steering committee was created. this committee included municipalities, industry, non-governmental organizations, airsheds and federal and provincial governments. the Capital Region Air Quality Management Framework describes a shared vision of ambient air quality management in the capital region, which uses the triple-bottom line approach to support social and economic development and the environment. terminology specific to this framework is defined in appendix a.
the management approach of this framework is depicted in the following figure.
•contaminants of concern are chosen
•triggers, limits and action levels are set
•monitoring is ongoing and used to assess air quality
•mitigative management actions, as needed, in response to triggers and limits
Air Contaminants of Concern,
Triggers, Limits and Action Levels
Monitoring
Management Actions and Adaptation

5
AIR ConTAmInAnTS oF ConCERn
this ambient air quality management framework addresses the complex issues of primary and secondary pollutants in the air. primary pollutants are emitted directly from a source. Secondary pollutants are formed when other pollutants, such as primary pollutants, interact in the atmosphere.
ambient concentrations of nitrogen dioxide in the capital region are caused by the combustion of fuel for vehicles, home heating or the combustion of coal, oil and natural gas for industrial processes. Such activities as coal combustion, petroleum refining, chemical production and metals manufacturing contribute to the release of sulphur dioxide. fine particulate matter is emitted directly (primary particulate matter) or formed in the atmosphere from precursor emissions. ground level ozone is formed through complex chemical reactions between precursor emissions of volatile organic compounds and nitrogen oxides in the presence of heat and sunlight or by stratospheric intrusion. these contaminants can also enter the capital region from transboundary sources. at certain concentrations, these substances may lead to effects to human and ecosystem health.
monIToRIng
monitoring is conducted by airsheds, municipalities, industry and alberta environment and Sustainable resource development in accordance with the Alberta Air Monitoring Directive. alberta environment and Sustainable resource development analyzes the ambient data collected from the current monitoring structure, calculates the annual average and the upper range of the hourly data for individual monitoring stations, and assigns an ambient air quality level to each station. the assessment takes into account any limitations of current technology and will adapt as the monitoring network in the capital region is revised and updated.
6
PRoACTIvE AmBIEnT AIR QuALITy mAnAgEmEnT
the framework enhances existing provincial and federal initiatives and regulatory processes for maintaining and improving our ambient air quality and addressing the unique pressures, conditions and requirements of the capital region.
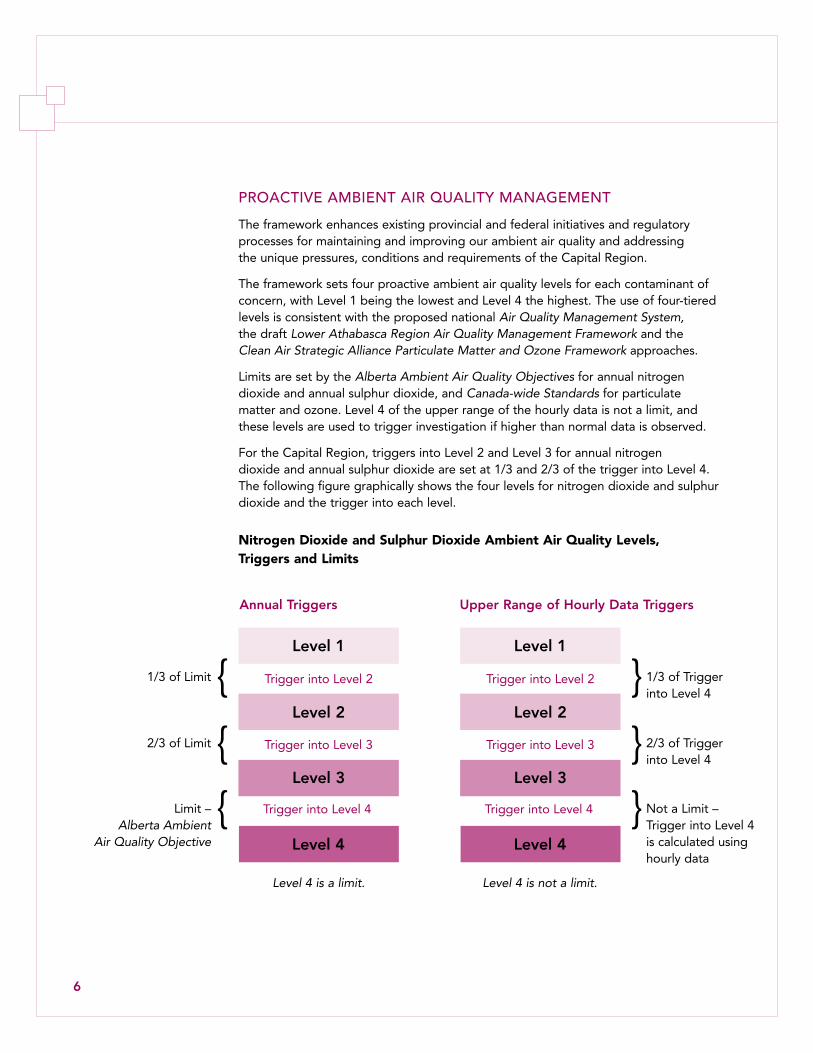
the framework sets four proactive ambient air quality levels for each contaminant of concern, with level 1 being the lowest and level 4 the highest. the use of four-tiered levels is consistent with the proposed national Air Quality Management System, the draft Lower Athabasca Region Air Quality Management Framework and the Clean Air Strategic Alliance Particulate Matter and Ozone Framework approaches.
limits are set by the Alberta Ambient Air Quality Objectives for annual nitrogen dioxide and annual sulphur dioxide, and Canada-wide Standards for particulate matter and ozone. level 4 of the upper range of the hourly data is not a limit, and these levels are used to trigger investigation if higher than normal data is observed.
for the capital region, triggers into level 2 and level 3 for annual nitrogen dioxide and annual sulphur dioxide are set at 1/3 and 2/3 of the trigger into level 4. the following figure graphically shows the four levels for nitrogen dioxide and sulphur dioxide and the trigger into each level.
Nitrogen Dioxide and Sulphur Dioxide Ambient Air Quality Levels, Triggers and Limits
Level 1
Level 2
Level 3
Level 4
1/3 of limit trigger into level 2
trigger into level 3
trigger into level 4
{
{2/3 of limit
limit – Alberta Ambient
Air Quality Objective
{
Level 1
Level 2
Level 3
Level 4
1/3 of trigger into level 4
trigger into level 2
trigger into level 3
trigger into level 4
2/3 of trigger into level 4
not a limit – trigger into level 4 is calculated using hourly data
{
{{
Upper Range of Hourly Data Triggers
Level 4 is a limit. Level 4 is not a limit.
Annual Triggers

7
Triggers for Management Actions for Each Contaminant of Concern
Level Level
Fine Particulate Matter (24 hour)1
Ozone (8 hour)1
Annual Average Nitrogen Dioxide
Annual Average Sulphur Dioxide
1 Baseline monitoring and data gathering avoid or minimize degradation wherever reasonable or possible
Trigger into Level 2
15 µg/m3 See note 2 below
15 µg/m3 8 µg/m3
2 Surveillance actions early indication of emerging air quality issues, time to react and plan
Trigger into Level 3
20 µg/m3 58 ppb 30 µg/m3 13 µg/m3
3 management plan identify pressures and implement management actions required to prevent Alberta Ambient Air Quality Objectives being reached
Trigger into Level 4
30 µg/m3 65 ppb 45 µg/m3 20 µg/m3
4 (Limit) mandatory plan to reduce below Canada-wide Standards
emission reductions required, with mandatory compliance and approval implications
the Clean Air Strategic Alliance Particulate Matter and Ozone Framework also uses four ambient air quality levels (or action levels) and triggers (surveillance trigger, planning trigger and exceedance trigger). the limit is the Canada-wide Standards for particulate matter and ozone (see figure on page 36).
management actions associated with the lower levels provide time to address ambient concentrations, and by management response, to avoid reaching the annual air quality limits for nitrogen dioxide, sulphur dioxide, fine particulate matter, and ozone. each higher level is prescribed by successively more stringent management actions, compliance tools and timelines. the table below describes the triggers for management actions for each contaminant of concern.
1action triggers for pm2.5 are based on a 24-hour average, and achievement is based on the 98th percentile ambient measured annually, averaged over three consecutive years. action trigger levels for ozone are based on an eight-hour average, and achievement is based on the fourth highest measurement annually, averaged over three consecutive years.
2for ozone, alberta environment and Sustainable resource development will determine on an annual basis which areas of the province are in baseline and which are in surveillance.

8
triggers for investigation are specifically for the upper range of the hourly data for nitrogen dioxide and sulphur dioxide.
the assessment of the upper range of one year of hourly data is intended as a regional evaluation of nitrogen dioxide and sulphur dioxide, and is not intended to replace the Alberta Ambient Air Quality Objectives. alberta environment and Sustainable resource development will continue to respond to local hourly exceedances of Alberta Ambient Air Quality Objectives through the regulatory compliance system.
the framework adds to the evaluation of the hourly data by using the triggers in the following table to help select management actions that can be taken to reduce the likelihood of reaching the hourly Alberta Ambient Air Quality Objectives for nitrogen dioxide and sulphur dioxide.
Triggers for Investigation
Level Level
Upper Range of Hourly Data – Nitrogen Dioxide
Upper Range of Hourly Data – Sulphur Dioxide
1 avoid or minimize degradation wherever reasonable or possible.
Trigger into Level 2
64 µg/m3 37 µg/m3
2 early indication of emerging air quality issues, time to react and plan.
Trigger into Level 3
126 µg/m3 76 µg/m3
3 identify pressures and implement management actions required to prevent Alberta Ambient Air Quality Objectives being reached.
Trigger into Level 4
190 µg/m3 113 µg/m3
4 (Not a Limit)
investigation required to understand and manage localized emissions.

9
FRAmEwoRk ComPonEnTS
the monitoring and Verification component uses the current monitoring structure and annually assesses the nitrogen dioxide, sulphur dioxide, fine particulate matter and ozone data gathered from ambient air monitoring stations. a preliminarY aSSeSSment assigns an ambient air quality level to each station. rare events or natural circumstances that cannot be controlled through emissions management (e.g., forest fires) are understood as part of the annual assessment. regional and local inVeStigationS follow and use key tools, such as air dispersion modelling and forecasting trends, to compare measured ambient air quality levels against expectations for the region, including growth scenarios and understanding of future changes. this component is linked with the deliVerY of management actionS component, which involves choosing/assigning management actions from a suite of tools presented in the framework. the eValuation component has both annual and detailed processes to determine the effectiveness of the management actions. reporting occurs for transparency and to give assurance to stakeholders. reports are presented to the public using a number of mechanisms including State of the Environment reporting, Assessment Summary Reports and other Status Reports. communication is a key component involved at every stage of this adaptive and flexible process.
the framework uses the guiding principles to define roles and responsibilities for stakeholders.
10
EnABLIng ThE FRAmEwoRk
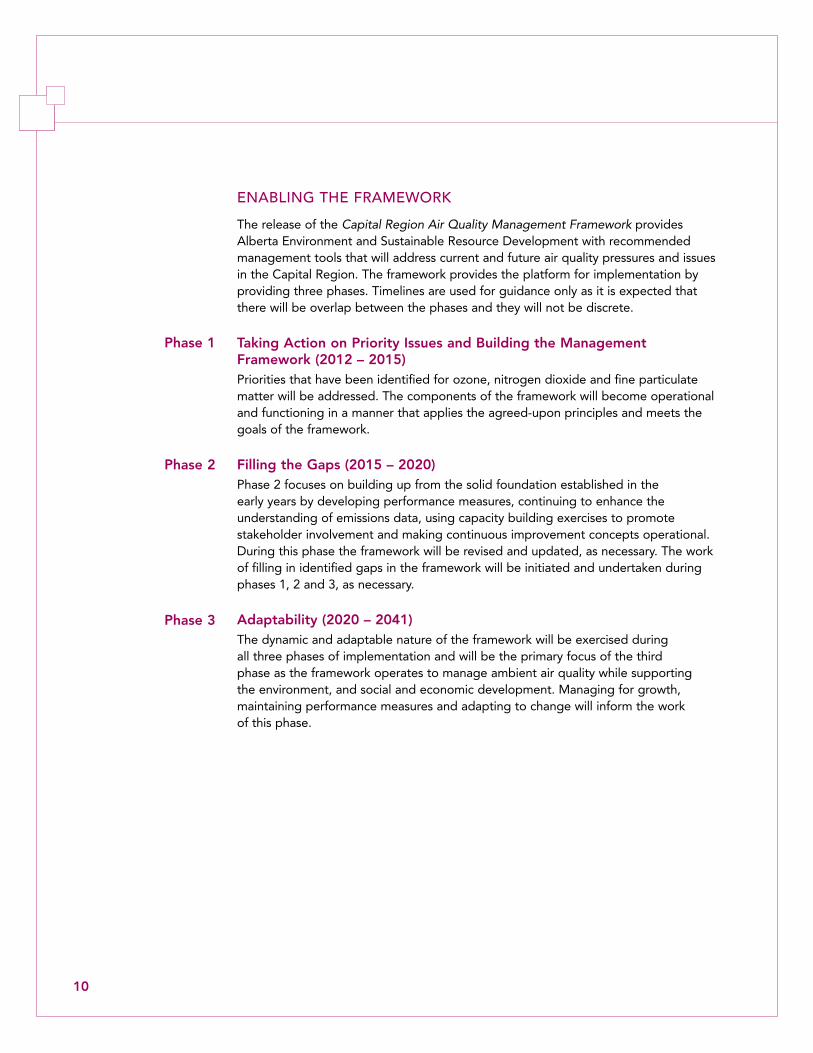
the release of the Capital Region Air Quality Management Framework provides alberta environment and Sustainable resource development with recommended management tools that will address current and future air quality pressures and issues in the capital region. the framework provides the platform for implementation by providing three phases. timelines are used for guidance only as it is expected that there will be overlap between the phases and they will not be discrete.
Taking Action on Priority Issues and Building the Management Framework (2012 – 2015)priorities that have been identified for ozone, nitrogen dioxide and fine particulate matter will be addressed. the components of the framework will become operational and functioning in a manner that applies the agreed-upon principles and meets the goals of the framework.
Filling the Gaps (2015 – 2020)phase 2 focuses on building up from the solid foundation established in the early years by developing performance measures, continuing to enhance the understanding of emissions data, using capacity building exercises to promote stakeholder involvement and making continuous improvement concepts operational. during this phase the framework will be revised and updated, as necessary. the work of filling in identified gaps in the framework will be initiated and undertaken during phases 1, 2 and 3, as necessary.
Adaptability (2020 – 2041)the dynamic and adaptable nature of the framework will be exercised during all three phases of implementation and will be the primary focus of the third phase as the framework operates to manage ambient air quality while supporting the environment, and social and economic development. managing for growth, maintaining performance measures and adapting to change will inform the work of this phase.
Phase 1
Phase 2
Phase 3

11
introduction
the Capital Region Air Quality Management Framework describes a cumulative effects approach for managing ambient air quality in the capital region. there are four contaminants of concern: nitrogen dioxide, sulphur dioxide, fine particulate matter and ozone. using a flexible, proactive and adaptable approach will help to ensure that management actions are taken prior to issues arising. the framework uses four ambient air quality levels and sets management and investigation triggers, which signal the need for specific action at regional or local scale before pollutants may become harmful to human or environmental health. regional outcomes will in this way remain achievable even as operational and development plans, technology and scientific understanding change over time.
the many conversations taking place about ambient air quality in the capital region were brought together in a multi-stakeholder capital region air forum, which included municipalities, industry, non-governmental organizations, airsheds and federal and provincial governments. at the air forum, a Steering committee was convened to bring together expertise and knowledge of the unique pressures, conditions and requirements of the capital region. the Steering committee began its collaborative work in January 2011 and have presented progress at subsequent air forums. the framework describes a shared vision of ambient air quality management in the capital region, which uses the triple-bottom line approach to support social and economic development and the environment. the Steering committee identified the need for a technical group to provide scientific and technical support. the technical Work group prepared appendix c, which summarizes the technical aspects of this framework. further detail is available in the Technical Supporting Document for the Capital Region Air Quality Management Framework. the next stage of the work will be the implementation of the framework components.
the primary audience for the framework is the stakeholders who are currently involved in ambient air quality management in the capital region. the framework will inform the North Saskatchewan Regional Plan process as it unfolds. members of the public may be interested in the framework’s plan for coordinated action on current and future ambient air quality.
ambient air quality is impacted by complex chemical interactions between pollutants. Some pollutants that contribute to ambient air quality issues in the capital region are considered to be “primary” or emitted directly from a source. other pollutants are “secondary” or are formed when other pollutants (including primary pollutants) react in the atmosphere. oxides of nitrogen, and sulphur dioxide are primary pollutants. fine particulate matter can be both a primary and a secondary pollutant. Secondary fine particulate matter is formed from precursor emissions such as sulphur dioxide, nitrogen oxides, volatile organic compounds and ammonia. ozone is a secondary pollutant and is formed when volatile organic compounds and nitrogen oxides combine in the presence of sunlight.

12
the framework applies a cumulative effects management approach, which is regional, integrated, collaborative and future-focused. the Capital Region Air Quality Management Framework targets primary and secondary pollutants and ambient air quality pressures from point and non-point sources in the capital region. consistent with national and provincial policies, industrial emissions are expected to be minimized through the application of best management practices and principles of continuous improvement. ambient air quality will be proactively managed through this approach because the triggers and limits are tied to tiered management actions.
goALS AnD InTEnTIonS
• use a cumulative effects management approach that complements existing initiatives and regulatory requirements to manage nitrogen dioxide, sulphur dioxide, fine particulate matter and ozone in the capital region.
• provide clarity for all emitters, early in their design cycle, about operating requirements for emissions management that may be necessary to respond to cumulative impacts of the contaminants of concern.
• define and share responsibility among stakeholders for appropriate air quality management responses to established triggers and limits.
DESCRIPTIon oF ThE CAPITAL REgIon AIR mAnAgEmEnT AREA
the capital region is defined by the boundary of the edmonton capital region Board including elk island national park, as shown in figure 1. Within this area there are 25 municipalities including the city of edmonton, fort Saskatchewan, Spruce grove, leduc and St. albert. the edmonton census metropolitan area (cma) is the sixth largest metropolitan area in canada by population, with 1,176,300 residents. the region is also home to the alexander first nation, paul first nation and enoch cree nation communities. in addition to the developed area within the region, there are large areas of cropland and a number of large lakes including Wabamun and cooking lakes. the north Saskatchewan river traverses the region, and is the primary water source for municipal and industrial use. the region has a strong industrial base including refining, chemical manufacturing and electric power generation, and is a potential area of growth for bitumen upgrading.

13
Figure 1 Map of the Capital Region

14
ConTAmInAnTS oF ConCERn In ThE CAPITAL REgIon
air emissions in the region come from transboundary, urban, rural, agricultural, industrial, and natural sources. emissions are expressed here as words and symbols as some readers may be more familiar with one form of expression. examples of emissions released to the air in the capital region include a mixture of hydrogen sulphide (h2S), hydrocarbons and ammonia (nh3), sulphur dioxide (So2) and oxides of nitrogen (nox). these emissions contribute in various degrees to the four contaminants of concern in the capital region, which are sulphur dioxide, nitrogen dioxide (no2), fine particulate matter (pm2.5) and ground level ozone (o3). information on ambient air concentrations is available on the websites of the monitoring organizations located in the capital region and on the clean air Strategic alliance website:
• alberta environment and Sustainable resource development: www.environment.gov.ab.ca
• caSa data Warehouse: www.casadata.org• fort air partnership: www.fortair.org• lehigh Station: www.lehighinland.com/inland• Strathcona industrial association: www.sia.ab.ca• West central airshed Society: www.wcas.ca
these organizations report regularly on their monitoring results and summarize their activities and initiatives within the region. alberta environment and Sustainable resource development analyzes ambient data and reports on air quality through the State of the Environment reporting process, described on the ministry’s website.
as noted, the predominant ground-level air contaminants of concern for the capital region are:
• nitrogen dioxide• sulphur dioxide• fine particulate matter• ground level ozone.
anthropogenic emissions of nitrogen dioxide are mainly the result of combustion processes, such as the combustion of fuel for vehicles, home heating or the combustion of coal, oil and natural gas for industrial processes. in sunlight, nitrogen dioxide can lead to the formation of ozone, nitric acid (hno3) and nitrate-containing particles. emissions of nitrogen dioxide may also result from its use in industrial processes.
natural sources of sulphur dioxide include decaying organic matter, while anthropogenic activities that lead to the release of sulphur dioxide in the capital region are primarily from coal combustion, upstream and downstream petroleum operations, chemical production and metal manufacturing.
fine particulate matter refers to airborne particles with an aerodynamic diameter of 2.5 micrometers or less. it is either emitted directly (primary particulate matter) or formed in the atmosphere from precursor emissions (secondary particulate matter). important precursors of secondary particulate matter are oxides of nitrogen, sulphur dioxide, ammonia and volatile organic compounds (Vocs).
ozone is formed through complex chemical reactions in the atmosphere, between precursor emissions of volatile organic compounds and oxides of nitrogen, in the presence of heat and sunlight.

15
PoLICy ConTExT
provincial-level efforts towards cumulative effects management began in earnest with the Land-use Framework, and on april 5, 2011 the first draft regional plan, the Lower Athabasca Regional Plan, was released. experience gained during development of the draft Lower Athabasca Region Air Quality Management Framework confirmed that a comprehensive understanding of air quality and a framework for place-based issues management is essential for the land-use Secretariat’s planning process.
in 2007, the government of alberta committed to addressing growth pressure and cumulative effects in the capital region, including development of Growing Forward: Capital Region Growth Plan (currently being implemented by 24 municipalities, through the capital region Board), and development of a series of environmental management frameworks and implementation actions.
managing air emissions through ambient air quality outcomes aligns with:
• the elements and principles from the Alberta Land-use Framework and draft Lower Athabasca Regional Plan frameworks
• recommendations from the clean air Strategic alliance
• alberta’s renewed Clean Air Strategy now being developed by the government of alberta
• An Emissions Management Framework for the Alberta Electricity Sector Report to Stakeholders
• the proposed national Air Quality Management System.
the recommended approach of the clean air Strategic alliance defines triggers based on ambient concentrations (outcomes) and then associates management actions with those outcomes.
management action on ambient air quality is considered necessary in the capital region because ozone in the capital region currently exceeds the planning trigger under the Clean Air Strategic Alliance Particulate Matter and Ozone Management Framework. it is anticipated that the proposed national Air Quality Management System will introduce Canadian Ambient Air Quality Standards that are more stringent than the Canada-wide Standards. the Capital Region Ozone Management Plan is in place for the capital region to help ensure that no exceedances of the Canada-wide Standards will occur in the edmonton census metropolitan area for ozone and to avoid future exceedances of ozone concentrations over the planning trigger.
16
ACknowLEDgEmEnTS
Steering Committee Members
randall Barrett (chair) – alberta environment and Sustainable resource developmentnadine Blaney – fort air partnership (alternate: melanie larsen)claude chamberland – northeast capital industrial association (alternate: todd Schneider)laurie danielson – northeast capital industrial association (alternate: darcy Walberg)peter forristal – Strathcona industrial associationKristina friesen – environmental non-governmental organizations (eco-air)ahmed idriss – electrical generation (capital power/ transalta)myles Kitagawa – environmental non-governmental organizations (toxics Watch)Brent Korobanik – individual facilities not affiliated with a regional industry groupmike mellross – city of edmonton (alternate: mark Brostrom)peter noble – Strathcona industrial associationgary redmond – alberta capital airshedal Schulz – chemistry industry association of canada (alternate: Yolanta leszczynski)Bob Scotten – West central airshed SocietyKarina thomas – alberta healthJocelyn thrasher-haug – Strathcona county (alternate: Jeff hutton)corinna Watt – environment canada (alternate: rachel mintz)lynn Wyton – alberta enterprise and advanced education
Alberta Environment and Sustainable Resource Development Secretariat
lisa avis tim Jantziemegan mallonterri traversmaria Vavro
Technical Work Group
Yayne-abeba aklilu (co-chair) – alberta environment and Sustainable resource developmentahmed idriss (co-chair) – capital powerpatrick anderson – West central airshed Societylisa avis – alberta environment and Sustainable resource developmentrandall Barrett – alberta environment and Sustainable resource developmentclaude chamberland – northeast capital industrial associationlaurie danielson – northeast capital industrial associationpeter forristal – Strathcona industrial associationcurtis mooney – environment canadapeter noble – Strathcona industrial associationWally Qiu – alberta environment and Sustainable resource developmentdarcy Walberg – northeast capital industrial association
Administrative Support
margaret Bateman – calder Batemanrenata coderre – coderre and company fox design – graphic designnancy mackenzie – Writer and editor

17
AIR monIToRIng In ThE CAPITAL REgIon
ambient air quality may vary depending on the measurement location relative to emission sources, topography, land cover, meteorology, amount of atmospheric chemical reactions, mixing or amount of deposition. the factors affecting monitoring in the capital region are varied and can change over time. monitoring ambient air quality in the capital region provides information about the impact on air quality from sources of emissions. the collected data provides information on air quality trends and determines whether the Alberta Ambient Air Quality Objectives and the Canada-wide Standards for air quality are met at the monitoring stations.
Some areas in the region have well-established ambient monitoring networks collecting data on a number of contaminants. the monitoring organizations that operate multiple stations in a regional network have undergone, or are currently conducting, an evaluation of their networks. many of the agencies responsible for controlling monitoring in the region are evolving their programs to keep pace with changing stresses on air quality and the varying information requirements.
ambient air quality monitoring stations in the capital region are operated by various agencies.
• alberta environment and Sustainable resource development (eSrd) operates three stations within edmonton.
• fort air partnership (fap) and West central airshed Society (WcaS) are airsheds within the region that operate a network of monitors to the northeast and west of edmonton, respectively.
• Strathcona industrial association (Sia) operates a network of monitors in east edmonton and in Strathcona county.
• there are a number of monitoring stations operated full or part time by single industrial facilities within the region.
the two forms of analyzers widely used for monitoring the four contaminants of concern in the capital region are passive air samplers and continuous air analyzers. passive air samplers are inexpensive and are affected by fewer logistical challenges that constrain continuous air analyzers, such as a need for ongoing electrical power and mobility. passive air samplers provide monthly average concentrations and are best used as an indicator for spatial information of pollutant concentrations. passive air samplers cannot measure fine particulate matter. in contrast, continuous air analyzers provide higher resolution data that are typically reported as one-hour averages. these analyzers, however, have more limited deployment opportunities as they require more maintenance, are costly and have logistical constraints. the distribution of continuous monitoring in the capital region is illustrated in figure 2. table 1 lists the monitoring stations that monitor nitrogen dioxide, sulphur dioxide, fine particulate matter and ozone on a continuous basis.
the current system

18
all monitoring stations are required to operate in accordance with the Alberta Air Monitoring Directive. Stations operated by alberta environment and Sustainable resource development and airsheds archive data into the publicly accessible clean air Strategic alliance electronic data warehouse. once a year these stations are audited, analyzed and reported on through the State of the Environment reporting process.
Figure 2 Location of Air Monitoring Stations Equipped with Continuous Analyzers
Alberta Environment and Sustainable Resource Development

19
Table 1 Continuous Ambient Air Quality Monitors in the Capital Region
Monitoring StationParameters Monitored*
NO2 SO2 PM2.5 O3
Beverly (Sia) •
Bruderheim (fap) • • • •
edmonton central (eSrd) • • •
edmonton east (eSrd) • • • •
edmonton South (eSrd) • • • •
elk island (national park) (fap) • • • •
elmjay (Sia) •
fort Saskatchewan (fap) • • • •
genesee (WcaS) • • • •
gold Bar (Sia) • •
lamont county (fap) • • • •
lehigh cement (lehigh) • • •
meadows (WcaS) • •
range road 220 (fap) • •
redwater – industrial (fap) • • •
ross creek (fap) • •
Scotford 2 (fap) •
Sherwood park (Sia) • •
tomahawk (WcaS) • • • •
Wagner (WcaS) • • • •
*This table lists only those parameters that are the focus of this framework. The stations listed in this table monitor more than these four parameters.
Legend
> eSrd – operated by alberta environment and Sustainable resource development
> fap – operated by fort air partnership
> lehigh – operated by lehigh cement
> Sia – operated by Strathcona industrial association
> WcaS – operated by West central airshed Society

20
CuRREnT REguLAToRy AnD non-REguLAToRy APPRoACh
currently, proponents or operators of industrial and municipal facilities assess the effects of cumulative emissions from natural, transboundary, non-point and industrial sources as part of environmental impact assessments and applications for operating approvals or their renewal.
the mechanisms listed in table 2 provide the regulatory and non-regulatory context for air quality management in the capital region, and for effective management it is important that they are aligned. regulators use these mechanisms along with applicable performance standards and modelling guidelines to identify appropriate mitigation and define allowable releases of regulated substances from each facility. Both regulatory and non-regulatory mechanisms are tools to manage point and non-point sources.
Table 2 Regulatory and Non-regulatory Mechanisms for Managing Air Emissions and Effects
Mechanisms Jurisdiction
Provincial
Acts
Environmental Protection and Enhancement Act (EPEA) alberta
Alberta Land Stewardship Act alberta
Regulations
approvals, source monitoring requirements, emissions reporting requirements
alberta (EPEA)
compliance and enforcement alberta (EPEA)
Guidelines
Alberta Ambient Air Quality Objectives alberta
Policies
Land-use Framework alberta
Acid Deposition Management Framework alberta
An Emissions Management Framework for the Alberta Electricity Sector Report to Stakeholders
alberta
Clean Air Strategic Alliance Particulate Matter and Ozone Management Framework
alberta
Industrial Release Limits Policy alberta

21
Mechanisms Jurisdiction
Strategies
Clean Air Strategy (in development) alberta
Responsible Actions: A Plan for Alberta’s Oil Sands alberta
Federal
Acts
Canadian Environmental Protection Act canada
Regulations
Draft Air Quality Management System canada
Regional Plans
North Saskatchewan Regional Plan (not developed yet) alberta
Place-based
Growing Forward: Capital Region Growth Plan capital region
Capital Region Ozone Management Plan capital region
Odour Management Protocol industrial heartland
Municipal
Strategies
municipal sustainability plans municipalities
incentives, public education, communication and awareness programs
municipalities
transportation planning municipalities
Acts
Municipal Government Act municipalities
Bylaws
community standards bylaws municipalities
zoning bylaws municipalities
traffic bylaws municipalities

22
the capital region air Steering committee was tasked with applying the principles and concepts of the draft Lower Athabasca Region Air Quality Management Framework to the capital region. the conceptual approach of that framework is to identify contaminants of concern, triggers, limits and action levels, and associated mitigative and adaptive management approaches to achieve desired environmental outcomes. air quality is most frequently described in relation to objectives or standards against which the ambient concentration of the substance can be compared. this framework outlines how to address air quality with respect to the Alberta Ambient Air Quality Objectives for nitrogen dioxide and sulphur dioxide, and Canada-wide Standards for fine particulate matter and ozone.
there are two drivers that have guided development of the framework. the first is the need to build on provincial environmental protection and management policies and emission minimization practices. the second is the need to adopt a cumulative effects management approach in the capital region for holistically managing ambient air quality.
the Capital Region Air Quality Management Framework confirms that the province will continue to require industrial sources of the four contaminants of concern to employ pollution prevention and emission minimization principles as outlined in the current regulatory and non-regulatory approach.
CumuLATIvE EFFECTS mAnAgEmEnT AnD mAnAgEmEnT FRAmEwoRkS
the government of alberta has made a commitment to cumulative effects management, which focuses on the achievement of outcomes, understanding the effects of multiple development pressures (existing and new), assessing risk, collaborative work with shared responsibility for action, and improved integration of economic, environmental and social considerations. it follows an adaptive management model where decision-makers learn from experience and new information and adapt to changing social expectations and demands. performance management, along with pollution prevention principles, is essential to providing information on environmental conditions and identifying the need for any adjustments and changes on an ongoing basis. the development of management frameworks is an important way to accomplish this shift to a cumulative effects management approach.
the management framework approach is depicted in figure 3.
framework principles and conceptual approach

23
•contaminants of concern are chosen
•triggers, limits and action levels are set
•monitoring is ongoing and used to assess air quality
•mitigative management actions, as needed, in response to triggers and limits
Air Contaminants of Concern,
Triggers, Limits and Action Levels
Monitoring
Management Actions and Adaptation
Figure 3 Management Framework Approach
guIDIng PRInCIPLES
the following are guiding principles that form a foundation for the management framework. during implementation these principles will be used to set measureable criteria to ensure the goals of the framework are met.
Shared Ownership • Stakeholders share ownership of the concepts, management approach and intent
of the framework and in this way demonstrate their partnership commitment to take appropriate action that will maintain and improve ambient air quality in the capital region.
Accountability • provides a process to manage the impact of development in a sustainable manner.
• clearly communicates the cumulative effects management approach and expectations for managing emissions.
• uses a triple bottom line approach (social, economic and environment) to apply effective ambient air quality management that is able to maintain, protect and sustain healthy ecosystems, and support the health of albertans.
> helps ensure certainty and economic viability.
> helps to ensure that management actions will return conditions below the limits defined in this framework.
24
Collaborative and Transparent Administration• augments existing regulations, policies, management actions and initiatives.
• continues to engage stakeholders in the conversation about managing air quality emissions.
• aims for a shared agreement for implementation.
> assists stakeholders to develop the capacity to perform their responsibilities in a timely manner.
> has a process to align framework updates with other policies being developed or revised at a regional, provincial or national level.
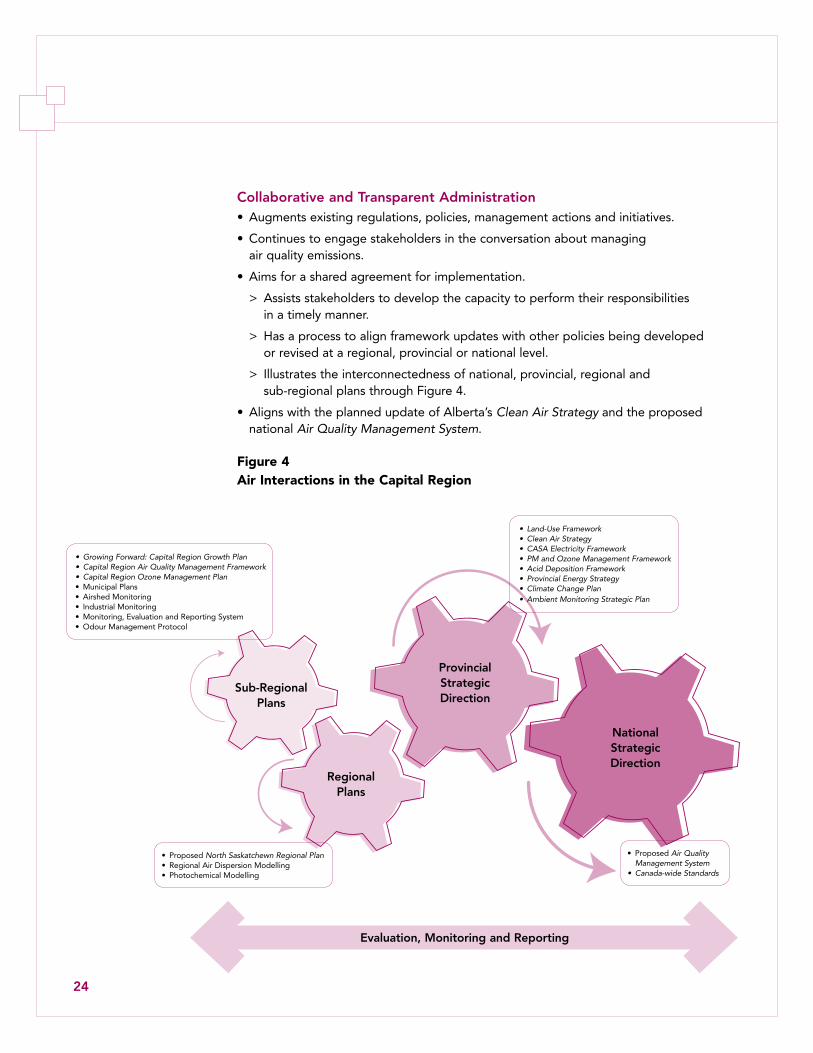
> illustrates the interconnectedness of national, provincial, regional and sub-regional plans through figure 4.
• aligns with the planned update of alberta’s Clean Air Strategy and the proposed national Air Quality Management System.
Figure 4 Air Interactions in the Capital Region
Sub-Regional Plans
Regional Plans
Provincial Strategic Direction
National Strategic Direction
• Growing Forward: Capital Region Growth Plan• Capital Region Air Quality Management Framework• Capital Region Ozone Management Plan• municipal plans• airshed monitoring• industrial monitoring• monitoring, evaluation and reporting System• odour management protocol
• proposed North Saskatchewn Regional Plan• regional air dispersion modelling• photochemical modelling
• proposed Air Quality Management System
• Canada-wide Standards
• Land-Use Framework• Clean Air Strategy• CASA Electricity Framework• PM and Ozone Management Framework• Acid Deposition Framework• Provincial Energy Strategy• Climate Change Plan• Ambient Monitoring Strategic Plan
Evaluation, Monitoring and Reporting

25
Knowledge-based• provides the opportunity to move to more efficient, environmentally sound
processes as science-based work indicates the need.
• encourages and recognizes solutions that reduce the number of anthropogenic impacts on ambient air quality.
• uses clearly defined and consistently followed decision-making criteria and processes.
Dynamic• provides a process to maintain and improve ambient air quality in the
capital region.
• uses a triple bottom line approach to provide stakeholder voice throughout development and implementation of the framework.
• meets existing policy expectations related to pollution prevention and ambient air quality limits.
• emphasizes reversing trends and avoiding reaching limits.
• is flexible and recognizes that there is no “one size fits all” management action that can effectively deal with the potential range of air quality issues.
• is proactive, future-oriented and responsive.
• Seeks continuous improvement through the application of practicable control technology to prevent pollution, stringent control technology as needed to meet ambient air quality objectives, and operational excellence.
• considers capital stock turnover and implementation of continuous improvements in planning management responses.

26
LEvELS, TRIggERS, AnD LImITS
to proactively manage air quality, ambient air quality levels, triggers and limits are set for substances of concern within a specific region. ambient air quality limits are determined by existing standards and objectives, such as the Alberta Ambient Air Quality Objectives and Canada-wide Standards. ambient air quality triggers are ambient concentration values set lower than the ambient air quality limit. ambient air quality levels signal the need to assess the ambient air quality to determine if there is an issue and if a management response is needed. the appropriate management response may include steps to collect more data to understand the ambient air quality, or actions to reduce emissions and prevent ambient concentrations from reaching unacceptable concentrations.
Alberta Ambient Air Quality Objectives are established for both short-term and long-term ambient concentrations of nitrogen dioxide and sulphur dioxide; however, a framework to proactively maintain ambient concentrations below the Alberta Ambient Air Quality Objectives is required that meets place-based outcomes. ambient concentrations of fine particulate matter and ozone are managed through the Clean Air Strategic Alliance Particulate Matter and Ozone Management Framework, which sets action triggers. currently, the planning trigger for ozone is exceeded in the edmonton census metropolitan area, and a management plan was prepared in response. a proactive approach to managing air quality is intended to:
• provide a pollution prevention approach that seeks to increase economic efficiency associated with health, environment and development within the area and reduce the need to retrofit or restore to manage a pollutant after it is formed.
• inform regulatory needs to help ensure that development can continue while maintaining, protecting and sustaining healthy ecosystems and the health of albertans, and meeting regional outcomes.
the framework defines four levels of ambient air quality relative to the Alberta Ambient Air Quality Objectives and Canada-wide Standards.

27
oThER ConCEPTS
Point and Non-point Sourcesthe Capital Region Air Quality Management Framework addresses point source emissions as well as emissions from non-point sources.
point source pollution is a term used to describe emissions from a single discharge source that can be easily identified. non-point source pollution is subtle and gradual, caused by the release of pollutants from many different and diffuse sources, largely managed in alberta by a mixture of municipal, provincial and federal initiatives, and associated with activities such as industry, transportation, urbanization and agriculture. management of non-point source pollution is usually addressed through new source product standards. management of in-use non-point source emitters is inherently complex: it is an inter-governmental and cross-jurisdictional issue.
the contribution of point and non-point sources of emissions come together in the capital region to contribute to ambient concentrations and must be understood to ensure that appropriate actions are taken.
Benefits of cumulative effects management are that cumulative sources in the region are examined and understood. the framework adds the opportunity for collective direction and commitment among the stakeholders to manage point and non-point sources and for coordinating management actions already underway. these opportunities allow for more overall effective and efficient management.
Monitoring and Place-based Managementthis framework applies place-based management actions to manage ambient air quality. By offering a suite of management tools for operators to choose from, the place-based response can be tailored to specific issues.
the framework characterizes local air quality by describing ambient air concentrations based on air monitoring station and location. While the monitoring network may be modified (through such initiatives as the Ambient Air Monitoring Strategy or network rationalization exercises undertaken by the regional monitoring organizations), the adaptable, place-based nature of the Capital Region Air Quality Management Framework enables it to accommodate these changes in the air monitoring network and still maintain the integrity of the monitoring data.

28
Alberta Ambient Air Quality Objectivesthe Alberta Ambient Air Quality Objectives are intended to protect both environmental and human health to an extent technically and economically feasible; they must also be socially and politically acceptable. a number of factors are considered when setting the objectives, including the following:
• adverse health effects: When considering the effects of substances on our health a number of factors are considered, including:
> What are the assessment endpoints?
> Who are the sensitive subpopulations?
> What are the no observed adverse effect level and the lowest observed adverse effect level for the substance under consideration?
• adverse ecosystem effects: When considering ecosystem effects one must also have an understanding of the assessment endpoints and what the sensitive subpopulations are (species that are most affected). With vegetation, information on acute effects (exposures to high concentrations for short terms, generally up to 24 hours) and chronic effects (recurring exposures to lower concentrations over long terms, generally months or longer) are considered.
• technological and economic factors: is appropriate monitoring (source and/or ambient) and control technology available? What is the cost of achieving various ambient objective levels?
in some cases, this approach represents a balance between the desire to achieve the best health and environmental protection possible and the feasibility and costs of reducing the emissions that contribute to elevated levels of pollution in ambient air. Where this is the case, it is even more important that objectives are not exceeded and management actions at the lower levels are sufficiently rigorous to prevent polluting up to the objectives.
alberta environment and Sustainable resource development uses a multi-stakeholder process to prioritize substances and to review Alberta Ambient Air Quality Objectives. the multi-stakeholder consultative process involves government departments, the scientific community, environmental organizations, industry and the general public. the multi-stakeholder group then recommends new or revisions to existing objectives for alberta environment and Sustainable resource development to consider and implement. table 3 shows the Alberta Ambient Air Quality Objectives for nitrogen dioxide, sulphur dioxide, fine particulate matter and ozone as of time of publication of this document. current values can be found at www.environment.alberta.ca/0994.html. assessment reports providing scientific and technical information on the substances can be found at www.environment.alberta.ca/01005.html.

29
Table 3 Alberta Ambient Air Quality Objectives for Nitrogen Dioxide, Sulphur Dioxide, Fine Particulate Matter and Ozone
Averaging Time Objective or Standard Basis for Alberta Ambient Air Quality Objective Value
Nitrogen Dioxide (NO2)
1 hour 300 µg/m3
159 ppbrespiratory effects
annual 45 µg/m3
24 ppbVegetation
Sulphur Dioxide (SO2)
1 hour 450 µg/m3
172 ppbpulmonary function
24 hour 125 µg/m3
48 ppbadopted from european union
30 days 30 µg/m3
11 ppbused for passive monitoring
annual 20 µg/m3
8 ppbadopted from european union – ecosystems
Fine Particulate Matter (PM2.5)
24 hour 30 µg/m3 adopted from Canada-wide Standards: achievement to be based on the 98th percentile ambient measurement annually, averaged over 3 consecutive years
Ozone (O3)
1 hour 160 µg/m3
82 ppbpulmonary function
8 hour 127 µg/m3
65 ppbadopted from Canada-wide Standards: achievement to be based on the 4th highest measurement annually, averaged over 3 consecutive years
µg/m3 = microgram per cubic metre ppb = part per billion by weight

30
Canada-wide Standards for Particulate Matter and Ozonein 2000, the canadian council of ministers of the environment published Canada-wide Standards for Particulate Matter and Ozone. these standards are based on the principles of continuous improvement, pollution prevention and keeping clean areas clean. the standards represent an important step towards the long-term goal of minimizing the risks of particulate matter and ozone on human health and the environment. they balance the achievement of the best health and environmental protection possible and the feasibility and costs of reducing the pollutant emissions that contribute to particulate matter and ground-level ozone in ambient air. current values can be found on the canadian council of ministers of the environment website.
Management of Alberta Ambient Air Quality Objective Exceedancesa number of sources can cause an Alberta Ambient Air Quality Objective exceedance, including transboundary, anthropogenic and natural emission sources. Whenever an Alberta Ambient Air Quality Objective is exceeded, alberta environment and Sustainable resource development is notified by either the monitoring organization or industry, as appropriate. alberta environment and Sustainable resource development assesses the source and cause of the exceedance. if corrective action is required, alberta environment and Sustainable resource development ensures this compliance function takes place.
this regulatory response to manage any exceedances of air quality objectives is established and will not be affected by the Capital Region Air Quality Management Framework. this framework will result in more proactive and tiered responses using region-wide ambient air quality triggers. the framework enhances regional responses and applies place-based management actions to prevent exceedances of annual Ambient Air Quality Objectives for nitrogen oxides and sulphur dioxide; and exceedances of Canada-wide Standards for particulate matter and ozone.

31
the purpose of assigning ambient air quality levels to air quality monitoring stations is to identify where ambient concentrations of nitrogen dioxide, sulphur dioxide, fine particulate matter and ozone are in relation to the defined ambient air quality triggers and limits.
ambient air quality levels for the contaminants of concern are based on Alberta Ambient Air Quality Objectives for nitrogen dioxide and sulphur dioxide and Canada-wide Standards for fine particulate matter and ozone.
the framework defines four ambient air quality levels for each contaminant of concern. level 1 is the lowest level and level 4 is the highest level. the use of four levels is consistent with the proposed national Air Quality Management System and the Clean Air Strategic Alliance Particulate Matter and Ozone Management Framework.
ambient air quality levels are assigned to individual monitoring stations based on annual average and upper range of hourly data for nitrogen dioxide and sulphur dioxide, and 24-hour fine particulate matter and eight-hour ozone (see appendix B for achievement metrics and trends). it is possible for a station to be assigned an air quality level and need management actions one year, then fall below the ambient air quality level the next year. in this case, the management actions will still be carried out; however, the actions may be modified accordingly. management actions are meant to be flexible and will take into consideration the concentration trends, the air monitoring station in question and the magnitude above the trigger.
nITRogEn DIoxIDE AnD SuLPhuR DIoxIDE
the ambient air quality data for nitrogen dioxide and sulphur dioxide will be analyzed using two methods, and triggers are proposed for each method:
1. Annual Average this assessment identifies any systematic or reoccurring issues that are evident in annual average concentrations. the Alberta Ambient Air Quality Objectives determine level 4, which is an ambient air quality limit.
2. Upper Range of the Hourly Data (represented by the annual 99th percentile of the hourly data). this assessment examines episodic events. the levels are determined by analyzing ambient concentrations for each calendar year and assessing the determined value against regional triggers. level 4 is not an ambient air quality limit and is determined by a calculation that is described in appendix c.
management responses can be tailored to prevent reaching either the annual or hourly Alberta Ambient Air Quality Objectives. the ambient air quality levels are determined by assessing both the annual average and upper range of the hourly monitoring data over the year. the triggers and limits are consistent across the region, but management responses and tools are place-based to deal with specific circumstances. table 4 summarizes the approach and management intent for nitrogen dioxide and sulphur dioxide.
assignment of ambient air quality levels

32
Table 4 Ambient Air Quality Levels and Management Intent for Nitrogen Dioxide and Sulphur Dioxide
Definition Management Intent
Level 1
ambient air quality well below the Alberta Ambient Air Quality Objectives
avoid or minimize degradation wherever reasonable or possible
Level 2
ambient air quality well below the Alberta Ambient Air Quality Objectives
early indication of emerging air quality issues, time to react and plan
Level 3
ambient air quality below but approaching the Alberta Ambient Air Quality Objectives
identify pressures and implement management actions required to prevent Alberta Ambient Air Quality Objectives being reached
Level 4
Upper Range of the Hourly Data: hourly ambient air quality showing increasing trends or higher than normal peaks
investigation required to understand and manage localized emissions
Annual Average: ambient air quality exceeds the Alberta Ambient Air Quality Objectives
emission reductions required, with mandatory compliance and approval implications

33
Annual Average: Ambient Air Quality Triggers and Limits for Nitrogen Dioxide and Sulphur Dioxideevaluation of the annual average ambient concentrations will occur after the yearly data is gathered for each monitoring station. the limit, which is not a pollute-up-to level, but a marker for stringent management actions, is level 4, and level 4 is set at the Alberta Ambient Air Quality Objective for nitrogen dioxide and sulphur dioxide.
the ambient air quality triggers into levels 2 and 3 are set at 1/3 and 2/3 of the Alberta Ambient Air Quality Objectives to provide time to plan and implement management actions to prevent the ambient concentrations from reaching level 4. revisions to national or provincial objectives or standards, such as the Alberta Ambient Air Quality Objectives, will result in a revised air quality limit for level 4. the associated ambient air quality triggers will then be assessed to ensure they are appropriate and that there is sufficient time to respond with management actions.
the annual average ambient air quality triggers and limits are shown in table 5.
Table 5 Annual Ambient Air Quality Triggers and Limits for Nitrogen Dioxide and Sulphur Dioxide
Description NO2 SO2
Triggers into Level 1
ambient air Quality trigger for level 1 Below 15 µg/m3 8 ppb
Below 8 µg/m3
3 ppb
Triggers into Level 2
ambient air Quality trigger for level 2(1/3 of limit)
15 µg/m3 8 ppb
8 µg/m3 3 ppb
Triggers into Level 3
ambient air Quality trigger for level 3 (2/3 of limit)
30 µg/m3 16 ppb
13 µg/m3 5 ppb
Triggers into Level 4
ambient air Quality limit 45 µg/m3 24 ppb
20 µg/m3 8 ppb

34
Upper Range of the Hourly Data: Air Quality Triggers for Nitrogen Dioxide and Sulphur Dioxidethe assessment of the upper range of one year of hourly data is intended for assessing regional triggers for nitrogen dioxide and sulphur dioxide and is not intended to replace the Alberta Ambient Air Quality Objectives. alberta environment and Sustainable resource development will continue to respond to local exceedances of Alberta Ambient Air Quality Objectives through the regulatory compliance system.
the framework adds to the evaluation of the hourly data by using the triggers in table 6 to analyze the upper range of the hourly data. this analysis is done to identify actions that can be taken to reduce the likelihood of reaching the hourly Alberta Ambient Air Quality Objectives for nitrogen dioxide and sulphur dioxide. this analysis can help in selecting management actions to prevent reaching hourly Alberta Ambient Air Quality Objectives in localized areas within the region.
the method used to assess the upper range of the hourly data will be the annual 99th percentile statistical measure that is considered indicative of the upper range or peak of the data (see appendix c).
Table 6 Upper Range of the Hourly Data: Ambient Air Quality Triggers for Nitrogen Dioxide and Sulphur Dioxide
Description NO2 SO2
Triggers into Level 1
ambient air Quality trigger for level 1 Below 64 µg/m3 34 ppb
Below 37 µg/m3
14 ppb
Triggers into Level 2
ambient air Quality trigger for level 2(1/3 of level 4)
64 µg/m3 34 ppb
37 µg/m3
14 ppb
Triggers into Level 3
ambient air Quality trigger for level 3 (2/3 of level 4)
126 µg/m3 67 ppb
76 µg/m3 29 ppb
Triggers into Level 4*
ambient air Quality trigger for level 4 190 µg/m3 101 ppb
113 µg/m3 43 ppb
*Level 4 is not a limit

35
PARTICuLATE mATTER AnD ozonE ACTIon TRIggERS AnD ACTIon LEvELS
the Clean Air Strategic Alliance Particulate Matter and Ozone Management Framework defines a series of action triggers and action levels, including the achievement metric, for fine particulate matter and ozone to help ensure that the Canada-wide Standards are not exceeded.
management actions associated with the lower levels are intended to provide time to address ambient concentrations to avoid exceeding the Canada-wide Standards. the stringency of management actions and associated implementation timelines will increase if the ambient concentrations pass into a higher level. fine particulate matter and ozone are included in this framework so that stakeholders have a coordinated and holistic approach for managing air quality in the capital region.
changes could occur in the framework when the proposed national Air Quality Management System is released. this framework will be adaptable to respond and accommodate future modifications.
figure 5 summarizes the action triggers and action levels from the Clean Air Strategic
Alliance Particulate Matter and Ozone Management Framework.

36
Mandatory Plan to Reduce
Below CWS
Management Plan
Surveillance Actions
Baseline Monitoring and Data Gathering
ACTION LEVELS
exceedance trigger pm2.5: 30 µg/m3
ozone: 65 ppb
planning trigger pm2.5: 20 µg/m3
ozone: 58 ppb
Surveillance trigger pm2.5: 15 µg/m3
ozone: See note2 below.
AC
TIO
N T
RIG
GE
RS1
Stri
ngen
t M
anag
emen
t To
ols
Flex
ible
Man
agem
ent
Too
ls
1action triggers for pm2.5 are based on a 24-hour average, and achievement is based on the 98th percentile ambient measured annually, averaged over three consecutive years. action trigger levels for ozone are based on an eight-hour average, and achievement is based on the fourth highest measurement annually, averaged over three consecutive years.
2for ozone, alberta environment and Sustainable resource development will determine on an annual basis which areas of the province are in baseline and which are in surveillance.
Figure 5 Action Levels for Particulate Matter and Ozone
Ex
ISTI
NG
RE
GU
LATO
Ry A
ND
MA
NA
GE
ME
NT
TOO
LS

37
framework responses to ambient air quality levels
alberta environment and Sustainable resource development will lead air quality analysis in the region. once ambient air quality levels are known and the primary sources and spatial extent have been defined, the need for management action will be determined. alberta environment and Sustainable resource development will collaborate with stakeholders to choose and implement appropriate management actions from table 7 in the framework. if, upon analysis, the ambient air quality is placed into a level due to natural events (such as wildfire) or transboundary transport, this will be taken into consideration when management actions are chosen. if natural sources are deemed to be the main influence of ambient concentrations at a particular station, no additional management action may be required.
REgIonAL mAnAgEmEnT RESPonSE
of the four ambient air quality levels, level 1 is the lowest and level 4 the highest. management actions associated with the lower levels are intended to provide time to address ambient concentrations to avoid reaching the higher levels. management responses accumulate as the need for response moves from level 1 up through each level to level 4; responses for each level include all of the responses from the preceding level(s). the stringency of management actions, compliance tools, and associated implementation timelines increase if the ambient concentrations pass into higher levels.
ambient air quality triggers for nitrogen dioxide and sulphur dioxide are set for the annual average and upper range of the hourly data. triggers are set lower than the ambient air quality limit. action levels and triggers for fine particulate matter and ozone are set lower than the Canada-wide Standards.
LEvEL 1 RESPonSE: monIToRIng AnD REPoRTIng
Sulphur Dioxide and Nitrogen Dioxideif management actions are deemed necessary, steps would be taken as outlined on pages 37-40. alberta environment and Sustainable resource development will continue to manage ambient air quality:
• to avoid or minimize degradation wherever reasonable or possible• using existing management approaches, applying policies such as pollution
prevention, continuous improvement and use of appropriate technology.
the primary goal at this level is ongoing monitoring of ambient air quality levels. therefore, no additional analytical or management activities are required in level 1, although alberta environment and Sustainable resource development, airsheds or other parties may wish, at their discretion, to undertake additional monitoring or data assessment activities. this could extend to areas where there is currently no monitoring in place.
Fine Particulate Matter and Ozone• Same as for sulphur dioxide and nitrogen dioxide.• address alberta’s initiatives for continuous improvement and keeping clean
areas clean.

38
LEvEL 2 RESPonSE: unDERSTAnDIng PRESSuRES AnD ConDITIonS
as in level 1, and
Sulphur Dioxide and Nitrogen Dioxide• if management actions are deemed necessary, alberta environment and Sustainable
resource development will:
> consider the ambient air quality levels and magnitude of trends as well as the type, location and number of air monitoring stations measuring those trends.
> evaluate the need for and placement of additional monitoring stations.
> define implementation timelines, tools and public, stakeholders and different levels of government to be involved in management responses.
Fine Particulate Matter and Ozone• if the Surveillance action level for fine particulate matter or ozone is exceeded,
steps will be taken by alberta environment and Sustainable resource development, with the support of the affected airsheds as appropriate, to help ensure that the sources of elevated ambient concentrations are determined and that trends in ambient concentrations are analyzed and monitored.
• the focus at the Surveillance level is on ensuring that the ambient air quality monitoring and information required to assess the region’s ongoing air quality is in place, and that, where possible, steps are taken to maintain or improve air quality.
• these actions address alberta’s initiatives for continuous improvement and keeping clean areas clean.
• information gathered at this level could include emission levels, trends and forecasts.

39
LEvEL 3 RESPonSE: TAkE ACTIon on PRESSuRES AnD PREvEnT REAChIng AIR QuALITy LImITS
as in level 2, and
Sulphur Dioxide and Nitrogen Dioxide• required management actions for level 3 are intended to prevent air quality
limits from being reached. actions may involve use of an array of tools described in table 7.
• alberta environment and Sustainable resource development will identify the urgency of and need for management response, stakeholder involvement, and implementation according to the tool selected.
• roles and responsibilities for alberta environment and Sustainable resource development, public, stakeholders and different levels of government are described starting on page 53.
Fine Particulate Matter and Ozone• if the management plan level for fine particulate matter or ozone is exceeded,
a management plan with actions appropriate to the ambient concentrations, trends and contextual factors will be developed and implemented by stakeholders from the source and receptor areas. alberta environment and Sustainable resource development or the affected airsheds, as appropriate, may coordinate the development of a plan. if this is not done within two years, alberta environment and Sustainable resource development may impose a plan.
• for fine particulate matter, in addition to responses listed above, the decision as to the content and actions under the management plan should take into account the following:
> areas where ambient concentrations are in the higher end of the management range
> in areas where ambient concentrations are indicating a significant upward trend, or where contextual factors indicate a need for action, a more stringent management plan will be developed and implemented
> in areas where ambient concentrations are in the lower end of the range, are indicating a significant downward trend, or contextual factors indicate little or no additional action is required, a less stringent management plan will be developed and implemented. it is possible that the activities laid out in the Surveillance level would be considered sufficient in some cases.

40
LEvEL 4 RESPonSE
as in level 3, and
Sulphur Dioxide and Nitrogen Dioxide
Upper Range of Hourly Data: Increase Understanding and Management of Localized Emissions
• if an hourly level 4 trigger for nitrogen dioxide and/or sulphur dioxide is exceeded, the response will be geared toward applying additional resources to understanding and managing localized emissions.
Annual Average: Implement Emission Reductions
• in level 4, there is an exceedance of at least one of the parameters so that the annual Alberta Ambient Air Quality Objective for nitrogen dioxide and/or for sulphur dioxide is exceeded, and management actions are required so these exceedances no longer occur. if lower Alberta Ambient Air Quality Objectives are adopted and exceedances occur as a result, then time will be required to respond to those circumstances.
• if an annual level 4 limit (Alberta Ambient Air Quality Objective) is exceeded for nitrogen dioxide and/or sulphur dioxide, it is likely indicative of impacts from cumulative regional contributions and in this case, management actions will be regional in nature. in this level, decreasing emissions in the region should be examined as a means of improving air quality.
• alberta environment and Sustainable resource development will identify the timelines for achieving reduction.
Fine Particulate Matter and Ozone• if the Canada-wide Standards for Particulate Matter and Ozone are exceeded,
alberta environment and Sustainable resource development will develop and implement a management plan containing measures to reduce ambient concentrations to below the numeric Canada-wide Standards.

41
mITIgATIvE mAnAgEmEnT ACTIonS AnD TooLS
the influences on ambient air quality levels at each monitoring station will be assessed annually. this information will be used to identify the appropriate management actions and which stakeholders would be most appropriate to engage.
When mitigative management actions are required, alberta environment and Sustainable resource development will collaborate with stakeholders to identify and implement the appropriate management action. this will include identifying the public, stakeholders and different levels of government to be involved in the plan as well as the timelines required to achieve the reductions necessary to move below air quality levels, triggers, or limits.
management actions may require amendments to existing approvals and these amendments would be made in accordance with existing authority under the Environmental Protection and Enhancement Act including director-initiated amendments to monitoring or reporting requirements, or amendments arising from unforeseeable effects. assurance of the plans, and communication of progress with public, stakeholders and different levels of government (e.g., status of response and forecasts), will be required for all levels.
actions become more stringent as the ambient air quality level increases. management actions include a range of tools with varying degrees of rigour and are meant to be flexible to consider either more or less stringent action depending on the concentration trends and the magnitude above an ambient air quality trigger or action trigger. if trends are downward, or the concentration level is just above an ambient air quality trigger or action trigger, actions taken may not need to be extensive; whereas if there are upward trends or the level is approaching the next ambient air quality trigger or action trigger, actions taken may be more significant.
table 7 lists the potential measures and tools from the least to most restrictive tools that would typically be used at the lower and highest air quality levels, respectively. depending on the specific situation, alberta environment and Sustainable resource development and the parties involved may choose the tools that are deemed most effective, and some tools may be more appropriate in certain levels. it is understood that any regulatory agency (municipal, provincial or federal) can move forward management tools from any level in table 7 since it is within their jurisdiction to do so. the list of management actions in table 7 is not exhaustive and it is recognized that there are other management actions available to other agencies, such as the federal government (e.g., proposed Base level industrial emission requirements (Bliers), transportation, emission fuel standards) that will be considered when selecting appropriate management tools for the region.
management tools in table 7 could be applied to manage regional and local issues, as indicated by annual average and upper range of hourly data trigger levels; however, management of upper range of hourly data triggers will focus on investigation and understanding of local sources. therefore the tools listed at the bottom of table 7 are geared toward annual average exceedance of a limit, hence, not to be applied to the upper range of hourly data triggers. though not exhaustive, the comprehensive list of options in table 7 could be considered as a flexible range of options for managing air quality.

42
an appropriate timeframe to design, plan and implement measures and tools will be recognized, considered and adopted so that the proactive intention of the triggers and levels is maintained.
Table 7 Potential Management Actions and Tools
Least to Most Restrictive Tools
• education and awareness
• additional regional monitoring is optional (assessed collaboratively by the environmental and community associations and alberta environment and Sustainable resource development)
• approval conditions to participate in airsheds, regional initiatives
• air quality modelling
• ambient air quality management plan
• monitoring networks (continuous, passive)
• first nations bylaws
• municipal programs, planning, and policies
• Vehicle emission programs for in-use vehicles
• memorandum of understanding
• facility continuous improvement plans
• economic instruments, including tools to incent
• municipal bylaws
• codes of practice
• revise policies, plans and performance standards for new or existing sources
• environmental protection order
• enforcement orders and fines
• approval conditions or restrictions
• regional planning: mechanisms for managing non-regulated sources
• emission reduction plans
• regional growth plans
• regional emissions or concentration limits for specified substances
• more stringent performance standards or regulations
• director-initiated approval amendments (in accordance with authority under EPEA)
• emission reduction requirements
• restrictions on further industrial emission sources
43
components of the capital region air quality management framework
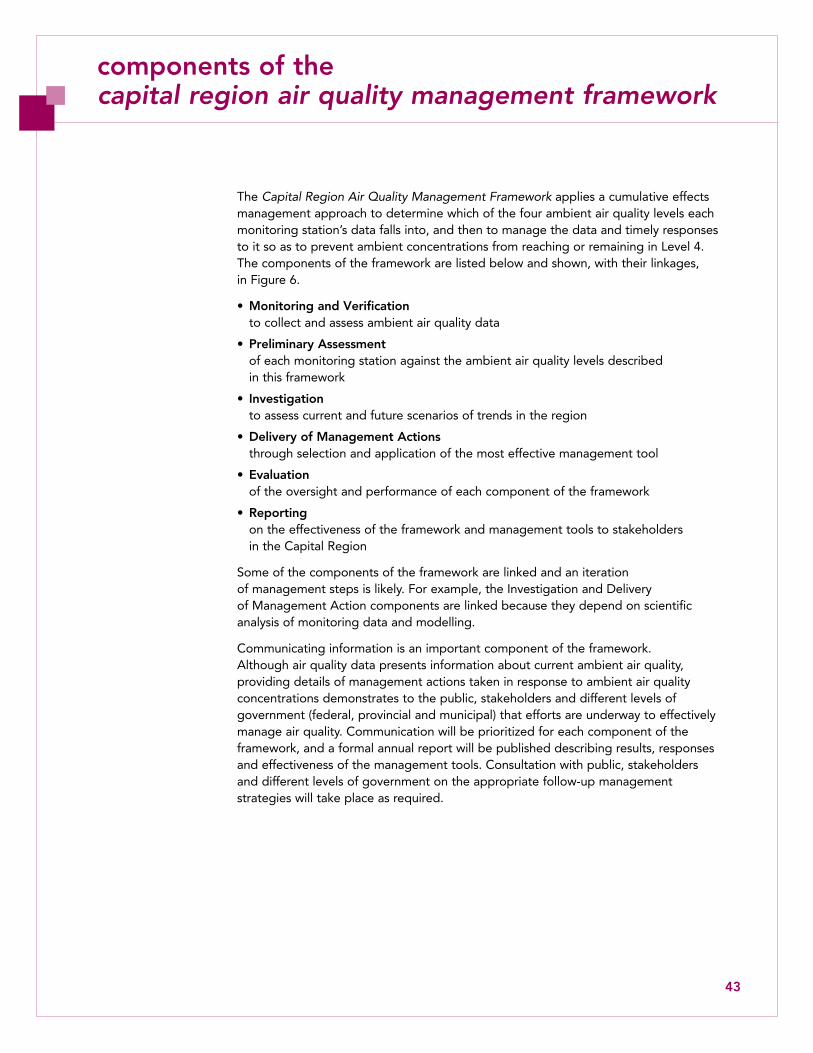
the Capital Region Air Quality Management Framework applies a cumulative effects management approach to determine which of the four ambient air quality levels each monitoring station’s data falls into, and then to manage the data and timely responses to it so as to prevent ambient concentrations from reaching or remaining in level 4. the components of the framework are listed below and shown, with their linkages, in figure 6.
• Monitoring and Verification to collect and assess ambient air quality data
• Preliminary Assessment of each monitoring station against the ambient air quality levels described in this framework
• Investigation to assess current and future scenarios of trends in the region
• Delivery of Management Actions through selection and application of the most effective management tool
• Evaluation of the oversight and performance of each component of the framework
• Reporting on the effectiveness of the framework and management tools to stakeholders in the capital region
Some of the components of the framework are linked and an iteration of management steps is likely. for example, the investigation and delivery of management action components are linked because they depend on scientific analysis of monitoring data and modelling.
communicating information is an important component of the framework. although air quality data presents information about current ambient air quality, providing details of management actions taken in response to ambient air quality concentrations demonstrates to the public, stakeholders and different levels of government (federal, provincial and municipal) that efforts are underway to effectively manage air quality. communication will be prioritized for each component of the framework, and a formal annual report will be published describing results, responses and effectiveness of the management tools. consultation with public, stakeholders and different levels of government on the appropriate follow-up management strategies will take place as required.

44
Figure 6 Components of the Framework
MONITORING (ongoing)
VERIFICATION (assess monitoring data)
PRELIMINARy ASSESSMENT
(determine level)
INVESTIGATION (assess current and
future Scenarios)
DELIVERy OF MANAGEMENT
ACTIONS (flexible response & tools)
EVALUATE (framework)
REPORTING (results and response)
Notify Stakeholders
Engage Stakeholders
yESNO
Assemble Stakeholders
linked
annual
Action Required?

45
monIToRIng AnD vERIFICATIon
the Capital Region Air Quality Management Framework specifies that any air quality monitoring station in the planning region that reaches an ambient air quality level, trigger or limit will generate a response. the degree of investigation, analysis and action associated with the management response is tailored to the:
• type and location of air monitoring station
• averaging time
• ambient air quality trigger or limit
• trend analysis (rate of increase or variability of the parameter)
• substance being detected and possible sources.
continuous monitoring stations in the capital region were not classified as industry, community or background as they were in the draft Lower Athabasca Region Air Quality Management Framework because of the complexity and variety of sources of emissions (see appendix c). Sources impacting stations will be evaluated on a case-by-case basis.
the framework uses the current monitoring structure and the data gathered from ambient air monitoring stations throughout the region will be assessed annually by alberta environment and Sustainable resource development. this assessment will take into account any limitations of current technology. the ambient air quality will be assessed using the agreed-upon methodology (appendix c) for nitrogen dioxide, sulphur dioxide, fine particulate matter and ozone, and described according to the monitoring station influences and what is measured.
alberta environment and Sustainable resource development will analyze the ambient air quality data collected over a one-year period from the monitoring organization networks, and calculate the annual average and the upper range of the hourly data, as applicable, in order to determine how each station’s data falls into the ambient air quality levels outlined in the framework in the preliminary assessment. the quality controlled monitoring data will be used to determine whether the corresponding ambient air quality levels, triggers and limits for nitrogen dioxide or sulphur dioxide, or action triggers and levels for fine particulate matter and ozone, are exceeded. ambient air quality levels will be assigned to individual monitoring stations following the annual assessment.
nitrogen dioxide, sulphur dioxide, fine particulate matter and ozone episodes will be analyzed at monitoring stations to interpret the primary influence. a particular episode, or several episodes occurring over a certain period or area, may require modelling and emissions inventory data to determine what the primary influence is (or influences are) to ambient air quality levels.
Communicationfor this component, it is important to develop shared understanding with stakeholders of the desired future state of integrated monitoring, evaluation and reporting required to successfully implement this framework.

46
PRELImInARy ASSESSmEnT
a preliminary assessment assigns an ambient air quality level to each station. the method for ascribing the levels is described in appendix c.
once the ambient air monitoring data is verified, each station is assessed against the ambient air quality levels, triggers and limits for nitrogen dioxide or sulphur dioxide, or action levels, triggers and for fine particulate matter and ozone. this includes ensuring that rare events or natural circumstances that cannot be controlled through emissions management (e.g., forest fires) are understood as part of the annual assessment.
the assessment procedures for nitrogen dioxide and sulphur dioxide were developed by the technical Work group and are available in appendix c.
the assessment procedure for particulate matter and ozone has been performed and refined by alberta environment and Sustainable resource development since 2004. data completeness criteria and rounding conventions are taken from the Canada-wide Standards for Particulate Matter and Ozone and the Clean Air Strategic Alliance Particulate Matter and Ozone Management Framework. alberta environment and Sustainable resource development will continue to perform this analysis on an annual basis.
Communicationthe assessment of ambient air quality data in the capital region will be performed by alberta environment and Sustainable resource development on an annual basis for each ambient air monitoring station. the assessment will be completed each year by the end of the calendar year and communicated with stakeholders. communication materials will include:
• an overview of the air monitoring stations locations
• the time period covered in the analysis
• the contaminant of concern in the region
• the averaging time
• the ambient air quality level, trigger or limit for each monitoring station
• a summary of environmental conditions and trends at each monitoring station
• an overview of methodology used for the analysis.

47
InvESTIgATIon
Regional Investigationa regional investigation reviews ambient air quality levels against expectations for the region, including growth scenarios and understanding of future changes. development occurring within the region will contribute to ambient concentrations of nitrogen dioxide, sulphur dioxide, fine particulate matter and ozone. modelling predictions will be used to understand whether the ambient concentrations are trending as predicted. this assessment will help determine the extent of the investigation and whether plans and initiatives are having their anticipated effects on ambient concentrations. if ambient concentrations are increasing faster than expected, or in areas where increases were not predicted, these factors will assist in determining management actions.
Local Investigationinvestigations of monitoring stations that reach ambient air quality levels, triggers or limits will be done with identified stakeholders and will involve forecasting trends and understanding future operational and development plans of the primary influence (or influences) to ambient air quality levels. if a station is influenced by several sources, such as industrial, municipal or transboundary, then attributing the contributions to ambient concentrations becomes more challenging. in such cases, all relevant public, stakeholders and different levels of government would be involved.
Stations influenced by transboundary sources provide an indication of the ambient air quality entering and exiting (depending on wind direction) an airshed or, on a larger scale, entering or exiting the region. in the capital region, due to potential development, the cumulative effects of regional emissions may be impacted by transboundary sources. if longer-term trends lead to ambient air quality triggers or limits being reached, a wider range of public, stakeholders and different levels of government would likely be involved and regional initiatives would be needed to address the increasing ambient concentrations. When stations are on first nations traditional lands, the appropriate landholders will be involved.
air quality modelling is an important investigation assessment tool used to describe temporal and spatial considerations of future scenarios and of the effectiveness of management tools already in place. the investigation and delivery of management actions components are therefore linked; both depend on scientific analysis of monitoring data and modelling. iterations between these two components will make the framework more robust.
Communication
Scientific data analysis and air quality modelling activities to support the framework will be conducted in a transparent and shared manner with stakeholders. as part of implementation of the framework, a work plan to increase knowledge of ambient air quality influences and impacts in the capital region will be developed, and a group will be tasked with advancing the work plan and being the central source for communicating scientific data analysis and air quality modelling information to stakeholders in the capital region.

48
Air Quality Modelling: A Tool for Assessment and Planningair quality modelling is a valuable tool in assessment and planning. Benefits of air quality modelling include its ability to:
• complement monitoring to provide additional information• relate emissions and sources to ambient air concentrations• predict into the future by using forecasted emissions• focus resources to identify and investigate potential issues for further action.
as part of the Capital Region Air Quality Management Framework, air quality modelling will be used to evaluate:
• industrial and municipal growth plans• policy• impact of emissions into air on ambient air quality• current and planned monitoring• emission reduction plans.
air quality modelling results will be used as an investigative tool for assessment and planning. measured data will be used to determine ambient air quality levels for a given area or station. table 8 outlines the minimum air quality modelling activity required for each management framework level.
Table 8 Minimum Required Assessment and Planning for Each Management Framework Level
Assessment and Planning
Level 1
• evaluate and understand the use of various air quality models for the region
Level 2
• assess model performance using monitoring data• refine and update emissions inventory for all known sources• assemble forecasted emissions (e.g., growth or decline) to determine monitoring needs
and determine urgency of management actions• use air quality modelling to assess the adequacy of current monitoring and to identify
additional monitoring needs
Level 3
• as in level 2, but also:• assess potential source(s) impacting ambient air quality for current state
and forecasted emissions
Level 4
Upper Range of Hourly Data:• as in level 3 and increase understanding and management of localized emissions Annual Average:• as in level 3, but also:• understand relative effectiveness of reduction plans

49
air quality modelling will continue to be conducted for new projects as required per existing regulations. in addition, air quality modelling can provide information on the cumulative impact of emissions on the regional air quality. in order to conduct representative air quality modelling, it is critical to utilize the most current and comprehensive emission inventories and appropriate meteorological information.
limitations surrounding air quality modelling are primarily related to inputs to air quality models, as well as the algorithms used to simulate the real world. these limitations include:
• availability and accuracy of emission data
• sufficiency, coverage and accuracy of meteorology
• limitations associated with trying to mathematically represent the real world
• modelling cannot be used to assess compliance with an ambient objective due to associated uncertainties in predicting concentrations.
two air quality modelling platforms are proposed for the framework:
Dispersion modelling is used to understand how emitted substances are dispersed through, and deposited out of, the atmosphere. this type of air quality modelling considers emission characteristics (such as release rate), and atmospheric factors affecting the dispersion, dilution and deposition. dispersion modelling is used to simulate the transport and dispersion of emitted pollutants, such as nitrogen dioxide and sulphur dioxide. it is currently undertaken by proponents and operators as part of environmental impact assessments and Environmental Enhancement and Protection Act applications to evaluate the effect of proposed facilities or modifications to existing facilities on ambient air concentrations. dispersion modelling will continue as part of the regulatory process and results will be considered by alberta environment and Sustainable resource development in the context of the framework.
Photochemical modelling considers photochemical transformations in addition to the dispersion of pollutants and simulates the change of pollutant concentrations in the atmosphere by characterizing the chemical and physical processes in the atmosphere. this type of air quality modelling can be used to analyze secondary pollutants (substances not emitted but formed subsequently in the plume through chemical processes), such as ozone and secondary particulate matter. photochemical modelling is not currently part of any alberta regulatory requirements that proponents or operators must undertake. it is primarily used for planning and management purposes over a large geographical area.

50
DELIvERy oF mAnAgEmEnT ACTIonS
in addition to the measures described in table 7, the framework recognizes that analysis of future plans is required to address the need for and urgency of management actions. a key tool for this type of analysis is air quality modelling. ambient air monitoring data will be used to determine the level and modelling data will be used to understand the relative impact of future plans on, and trends in, ambient concentrations.
the investigation and delivery of management actions sections are particularly linked and both depend on scientific analysis of monitoring data and modelling. it is anticipated that iterations are likely between these two steps.
once it is determined that management actions are necessary, alberta environment and Sustainable resource development will:
• help to ensure that necessary regulatory or management changes are undertaken.
• work with stakeholders to identify the appropriate parties to be involved in the development and implementation of management actions. there will be shared responsibility amongst these parties to make sure the actions are taken.
• provide oversight for actions being taken by other stakeholders. regionally-coordinated responses will provide transparency to both stakeholders and the public that management actions will result in an improvement of air quality.
Communicationtransparent and accountable action to maintain ambient air quality in the capital region requires an understanding of the effectiveness of management actions implemented in the capital region. the timeline for implementation of the management actions, and the environmental benefits potentially realized by the management actions, could vary considerably from action-to-action. regular updates will be published to report on the effectiveness of the action, and as decided by alberta environment and Sustainable resource development and the stakeholder implementing the action.

51
EvALuATIon
the effectiveness of the framework will be determined using annual and detailed evaluation processes. an annual overview, which will be made public, will report on the effectiveness of the oversight role and on the performance of each component of the framework. this overview will hold all stakeholders accountable and will benefit the framework by adapting from lessons learned as implementation proceeds.
a timeline for the detailed evaluation will be specific to each management action. this detailed evaluation will be undertaken to determine:
• the effectiveness of the management action chosen to address ambient air quality pressures in the capital region
• whether improvement to ambient air quality is realized by the application of these tools
• if outcomes for the capital region are being met.
Communicationthe current practice of annual reporting by monitoring organizations will continue as will alberta environment and Sustainable resource development’s analysis of ambient data collected through their monitoring networks. the results will continue to be available through the State of the Environment reporting process.
the annual overview will describe each component at a high level, with a focus on timelines, pace and priority of actions.
the detailed evaluation will report progress, priority and timelines of the specific management action, and any adaptations of the management actions that occurred to incorporate new information.

52
REPoRTIng
Several communication materials will be prepared to provide transparency and assurance to the stakeholders and the public that efforts are underway to effectively manage ambient air quality. assessment results (i.e., ambient air quality levels assigned) as well as details on the influencing source(s) and the type of responsive management activities used will be communicated regularly to the public, stakeholders and different levels of government through the following reporting procedures.
• State of the Environment reporting will communicate the status of the ambient air quality and any management actions initiated by the framework or other initiatives or management frameworks.
• Assessment Summary Report: the preliminary assessment procedure outlined on page 46 will take place on an annual basis, starting each year in march (or when ambient data is available) and finishing by the end of the calendar year. a summary report of the assessment results will be completed annually.
> this report will be a one-to-five page summary, detailing the results of the nitrogen dioxide, sulphur dioxide, fine particulate matter and ozone ambient episode analysis and assignment of ambient air quality levels to monitoring stations in the capital region. the report will include data from all available ambient air monitoring stations in the region that meet the data completeness criteria described in appendix c. if management actions have been chosen by alberta environment and Sustainable resource development by the end of the calendar year, these will also be included in the report; however, it is more likely that management actions will be chosen through collaboration with relevant stakeholders.
> the Assessment Summary Report will be public and available online through alberta environment and Sustainable resource development’s website. forecasts of trends in air concentrations due to future development and planned initiatives or standards will help provide transparency and confidence in how the framework is actively managing air quality. these may also be provided, when appropriate, in the annual Assessment Summary Report.
> a technical report detailing results and procedures of the annual episode analysis will be shared with any interested stakeholders upon request.
• Status Report: following the collaboration process, details on the chosen management actions and an implementation plan will be provided in a Status Report.
> this report will be completed within six months to one year following the release of the Assessment Summary Report. the Status Report will be made available online through the alberta environment and Sustainable resource development website.
> Status Reports will be completed annually to report on the implementation status of management actions and any new actions prescribed through subsequent annual assessments.
> details on any other activities or programs taking place in the capital region that relate to continuous improvement and keeping clean areas clean will also be presented in the Status Report.
> forecasts of trends in air concentrations due to future development and planned initiatives or standards will help provide transparency and confidence in how the framework is actively managing air quality.
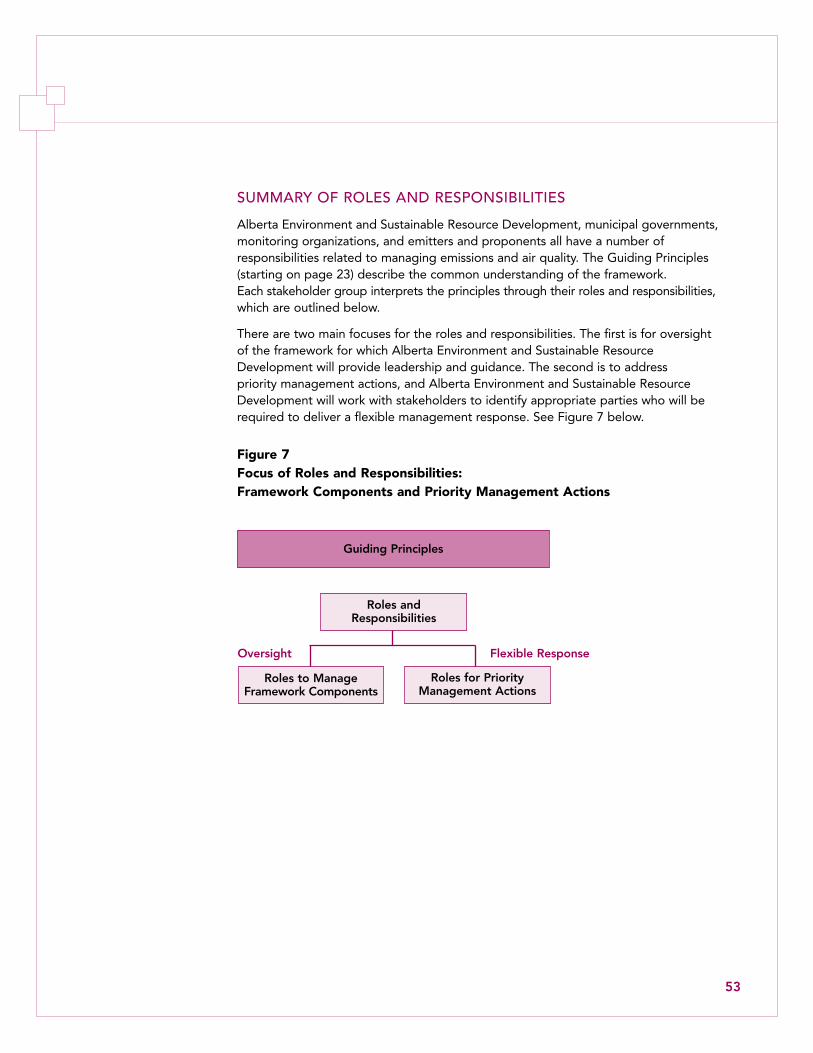
53
SummARy oF RoLES AnD RESPonSIBILITIES
alberta environment and Sustainable resource development, municipal governments, monitoring organizations, and emitters and proponents all have a number of responsibilities related to managing emissions and air quality. the guiding principles (starting on page 23) describe the common understanding of the framework. each stakeholder group interprets the principles through their roles and responsibilities, which are outlined below.
there are two main focuses for the roles and responsibilities. the first is for oversight of the framework for which alberta environment and Sustainable resource development will provide leadership and guidance. the second is to address priority management actions, and alberta environment and Sustainable resource development will work with stakeholders to identify appropriate parties who will be required to deliver a flexible management response. See figure 7 below.
Figure 7 Focus of Roles and Responsibilities: Framework Components and Priority Management Actions
Flexible Response
Roles to Manage Framework Components
Roles for Priority Management Actions
Roles and Responsibilities
Guiding Principles
Oversight

54
Alberta Environment and Sustainable Resource Developmentas regulator, alberta environment and Sustainable resource development will have two roles.
1. ensuring that necessary regulatory or management changes are undertaken.
2. Serving in an oversight role for actions being taken by other parties. regionally coordinated responses will provide transparency to stakeholders and the public about the management actions that will result in an improvement of air quality.
alberta environment and Sustainable resource development will also:
• conduct an annual review and assessment of air quality data and assign ambient air quality levels to air monitoring stations
• determine the need for management actions through forecasting further development (spatial, temporal)
• assess management actions implemented through other frameworks or initiatives to determine impacts on air quality
• house emission inventories for point and non-point sources in the capital region
• help to align this framework’s roles with those described in the Clean Air Strategic Alliance Particulate Matter and Ozone Management Framework
• work with stakeholders to
> identify stakeholder roles
> help to ensure stakeholder inclusion in management actions
> consider the use of a multi-stakeholder process, if required by the framework
> communicate to stakeholders about the implementation status, emissions data, and selected management response
> select or recommend management tools, if required, to manage air quality.

55
Municipal Governmentsroles and responsibilities for municipal governments with respect to the framework are to:
• actively participate on regional air quality multi-stakeholder groups to bring the municipal perspective, as required
• participate in air quality management response, if identified, which could include roles to:
> provide recommendations and advice regarding how management tools and actions could fit within existing environmental and sustainability plans or how plans could be adapted or created to incorporate recommendations
> bring forward recommendations from the implementation of the framework to municipal departments and councils, if necessary
• report on progress of implementation, as required
• provide emissions data and technical support to alberta environment and Sustainable resource development, as required, such as:
> growth and transportation scenarios and related data
> interpretation of air quality modelling and assessment of how current and planned operations influence local air quality
• collaborate to develop key messages related to air quality management and provide input into communication and engagement tools to help ensure the consistency of communication in the region.
Monitoring Organizationsthe main role of the monitoring organizations in the framework will be data management for input into the ambient air quality assessment. more specifically, the roles and responsibilities are to:
• manage air monitoring networks according to airshed monitoring plans, taking into account the goals of this framework as resources permit
• compile and submit ambient air quality data
• ensure that data gathered has gone through appropriate quality assurance and control procedures
• actively participate on regional air quality multi-stakeholder groups to bring forward the airshed perspective
• collaborate to develop key messages about air quality management as related to implementation of this framework
• provide input into alberta environment and Sustainable resource development-led communication and engagement tools to help ensure the consistency of communication in the region.

56
Emitters and Proponentsroles and responsibilities for emitters and proponents with respect to the framework are to:
• actively participate on regional air quality multi-stakeholder groups to bring forward their perspectives
• participate in airsheds and other regional initiatives for ambient air monitoring
• conduct air quality modelling and assess how current and planned operations influence local air quality
• provide emissions data to alberta environment and Sustainable resource development, as required
• participate in air quality management response, if identified
• report on progress of implementation, as required
• collaborate to develop key messages related to air quality management and provide input to communication and engagement tools to ensure the consistency of communication in the region.
Non-governmental Organizationsroles and responsibilities for non-governmental organizations with respect to the framework are to:
• actively participate on regional air quality multi-stakeholder groups to bring the non-governmental organization perspective
• collaborate in developing the air quality management response
• collaborate to develop key messages related to air quality management and provide input into communication and engagement tools
• carry out compatible air quality initiatives, as appropriate.

57
enabling the framework
alberta environment and Sustainable resource development will provide leadership for the work going forward to enable the implementation of the framework. to do so, the intention is to build an implementation platform to house processes, regional coordination and oversight. alberta environment and Sustainable resource development will oversee the calculation to assign ambient air quality levels for each monitoring station for nitrogen dioxide and sulphur dioxide and will adopt the provincial process to calculate the action levels for fine particulate matter and ozone.
ImPLEmEnTATIon PLATFoRm
the implementation platform will apply a triple-bottom line approach to the cumulative effects management of ambient air quality in the capital region. this work will require collaboration of stakeholders to provide the following types of support.
• provide knowledge and perspective of their cohort, or band of people bounded by common interest, rather than individual interests, and provide information back to their cohort.
• provide (or enable) access to relevant knowledge and resources needed to support implementation, and any work groups required.
• generating issues and questions to be addressed by a technical work group as required.
> review data and perform analysis, prepare findings and recommendations.
> identify gaps and future requirements for analysis to refine deliverables.
• provide strategic advice regarding air issues and air quality management in the capital region and have an active interest in air issues management in the capital region.
• collaborate to develop key messages related to air quality management and provide input into communication and engagement tools to help ensure the consistency of communication in the region.
• develop measureable criteria, based on the principles of this framework, for assessing the success of implementation.
• meet regularly to help ensure that the measurable criteria are applied to the ongoing implementation work.
• develop a multi-year work plan to increase knowledge of priority issues identified in the capital region during implementation.
• Support the group tasked with advancing a work plan to increase knowledge of ambient air quality influences and impacts in the capital region and communicate scientific data analysis and air quality modelling information to stakeholders in the capital region.
the Steering committee assumes that implementation of the framework will be through three broad and overlapping phases that address priorities, strategies and pacing. each phase will have stages or tasks that will be described in the multi-year work plan that will inform the implementation platform. timelines are provided below for guidance, however it is not to be assumed each phase is discrete as there will be overlap between the phases.

58
PhASE 1: TAkIng ACTIon on PRIoRITy ISSuES AnD BuILDIng ThE mAnAgEmEnT FRAmEwoRk (2012 – 2015)
Success for 2012 – 2015 will be achieved by taking action on priority issues that have been identified, and by building the management components so that the framework is operational and functioning in a manner that applies the principles and meets the desired goals for the region.
the following priorities are identified for the capital region based on recent assessment of the contaminants of concern.
• ozone: has exceeded the planning trigger for the edmonton census metropolitan area.
• nitrogen dioxide: is in level 2 and 3 for both annual and upper range of the hourly data.
• fine particulate matter: has exceeded the Surveillance trigger, and it is anticipated it will exceed the planning trigger as new standards are adopted and monitoring equipment is upgraded
• Sulphur dioxide: is currently not a priority for ambient air quality and is in level 1 and 2 for both annual and upper range of the hourly data.
phase 1 will involve work to ensure that the components of the framework are operational and functioning in a manner that applies the principles and meets the goals for the region.
• ongoing implementation work is transparent and proceeding at the appropriate pace and annual reports are published. the following plans could help meet objectives for this phase:
> the Capital Region Ozone Management Plan, to address the ozone priority issue
> communication and engagement, to expand stakeholder understanding and participation
> evaluation of current monitoring and current conditions, to guide future work
> understanding of initiatives already underway.
• develop a process to align with other policies being developed or revised at a regional, provincial or national level.

59
PhASE 2: FILLIng ThE gAPS (2015 – 2020)
Success for 2015 – 2020 will be achieved by building on the solid foundation established in phase 1. this phase takes advantage of the dynamic nature of the framework, working to adapt and improve the components and filling in any gaps that have been noted. alberta environment and Sustainable resource development will continue to oversee the work required to take action on priority issues. other work for phase 2 includes the following.
• develop performance measures for the framework components.
• continue to develop integrated monitoring, evaluation and reporting protocols.
• review and revise the framework as necessary.
> use this opportunity to continue to align with other policies being developed or revised at a regional, provincial or national level.
• continue to enhance understanding of emissions data and contributors that influence ambient air quality in the capital region.
• establish regional collaboration and use capacity building exercises to promote the ability of stakeholders to undertake management responsibilities defined in the framework.
• make continuous improvement concepts operational and apply triple bottom line analysis.
PhASE 3: ADAPTABILITy (2020 – 2041)
Success for phase 3 will be achieved as stakeholders continue to share responsibility for the framework, adapting it as necessary to ensure it sustainably supports the environment, social and economic development, and manages for growth. other work for phase 3 includes the following.
• maintain performance measures.
• conduct ongoing monitoring, evaluation and reporting processes and adjustments as required.
• continue to enhance understanding of emissions data and contributors that influence ambient air quality in the capital region.
• maintain regional collaboration among stakeholders.
• continuous improvement is adapted and reviewed as new information comes available.

60
• alberta energy. 2008. Launching Alberta’s Energy Future: Provincial Energy Strategy. edmonton: alberta energy.
• alberta environment and Sustainable resource development. 2010. State of the Environment Reports. www.environment.alberta.ca/02498.html. accessed march 14, 2012.
. 1989. Alberta Air Monitoring Directive. . 2000. industrial release limits policy. . 2007. Analyzing Exceedances of the Canada-wide Standard for Particulate Matter and Ozone and the CASA Framework Triggers. . 2008. Alberta Acid Deposition Management Framework. . 2008. Alberta’s 2008 Climate Change Strategy. . 2011. Lower Athabasca Region Air Quality Management Framework. . 2011. Alberta Ambient Air Quality Objectives. . 2012. technical Supporting document for the Capital Regional Air Quality Management Framework.
• alberta environment and alberta energy. 1991. Clean Air Strategy for Alberta. edmonton: alberta environment and alberta energy.
• alberta treasury Board. 2009. Responsible Actions: A Plan for Alberta’s Oil Sands. edmonton: alberta treasury Board.
• canadian council of ministers of the environment. 2000. Canada-wide Standards for Particulate Matter and Ozone. Quebec city: canadian council of ministers of the environment.
. 2011. draft Air Quality Management System. www.ccme.ca/ourwork/air.html?category_id=146#490. accessed february 21, 2012.
• capital airshed partnership. 2008. The Capital Region Ozone Management Plan. edmonton: alberta capital airshed alliance
• capital region Board. 2009. Growing Forward: Capital Region Growth Plan. edmonton: capital region Board.
• clean air Strategic alliance. 2003. An Emissions Management Framework for the Alberta Electricity Sector Report to Stakeholders. edmonton: caSa.
. 2003. CASA Particulate Matter and Ozone Management Framework. edmonton: caSa. . 2009. Ambient Air Monitoring Strategy for Alberta.
• government of alberta. 2008. Land-use Framework. edmonton: government of alberta.
. 2010. Environmental Protection and Enhancement Act. . 2010. Municipal Government Act. . 2011. Alberta Land Stewardship Act. . 2011. Draft Lower Athabasca Regional Plan.
• government of canada. 1999. Canadian Environmental Protection Act. ottawa: department of Justice.
• united States environmental protection agency (uS epa) website at www.epa.gov.
references

61
ABBREvIATIonS AnD ACRonymS
• caSa – clean air Strategic alliance
• ccme – canadian council of ministers of the environment
• cma – census metropolitan area
• cWS – Canada-wide Standards
• eSrd – alberta environment and Sustainable resource development
• hno3 – nitric acid
• h2S – hydrogen Sulphide
• nh3 – ammonia
• no – nitric oxide
• no2 – nitrogen dioxide
• nox – nitrogen oxides (nox is often used to indicate the family of nitrogen oxide compounds)
• o3 – ozone
• pm – particulate matter, pm2.5 refers to fine particulate matter (smaller than 2.5 microns)
• ppb – parts per billion
• So2 – Sulphur dioxide
• µg/m3 – micrograms per cubic metre
• uS epa – united States environmental protection agency
• Vocs – Volatile organic compounds
appendix a – terminology

62
gLoSSARy
Action Level
a level of the Clean Air Strategic Alliance Particulate Matter and Ozone Management Framework, e.g. baseline monitoring and data gathering, surveillance actions, management plan or mandatory plan to reduce below the Canada-wide Standards.
Action Trigger
the ambient concentration that triggers an area into a specified action level under the Clean Air Strategic Alliance Particulate Matter and Ozone Management Framework.
Air Quality
the composition of air, with respect to quantities of pollutants therein, and/or a measure of the health-related and visual characteristics of the air; used most frequently in connection with standards against which the contribution of the particular source can be compared.
Air Quality Management System
the proposed national Air Quality Management System (aQmS) is a comprehensive approach for reducing air pollution in canada. it is the product of an unprecedented collaboration by the federal, provincial and territorial governments and stakeholders. it is currently under development and when implemented the aQmS will include:
• canadian ambient air Quality Standards (caaQS)
• air zone air quality management and regional airshed coordination that covers the entire country and helps to better manage both local emissions and transboundary flows
• Base level industrial emissions requirements (Bliers).
Air Quality Objective
a numerical concentration, value or narrative statement which is intended to provide protection of the environment and human health to the extent that is technically and economically feasible, and is socially and politically acceptable.
Airshed
an airshed is a geographic area that, because of emissions, topography, climate and meteorology, typically experiences similar air quality.
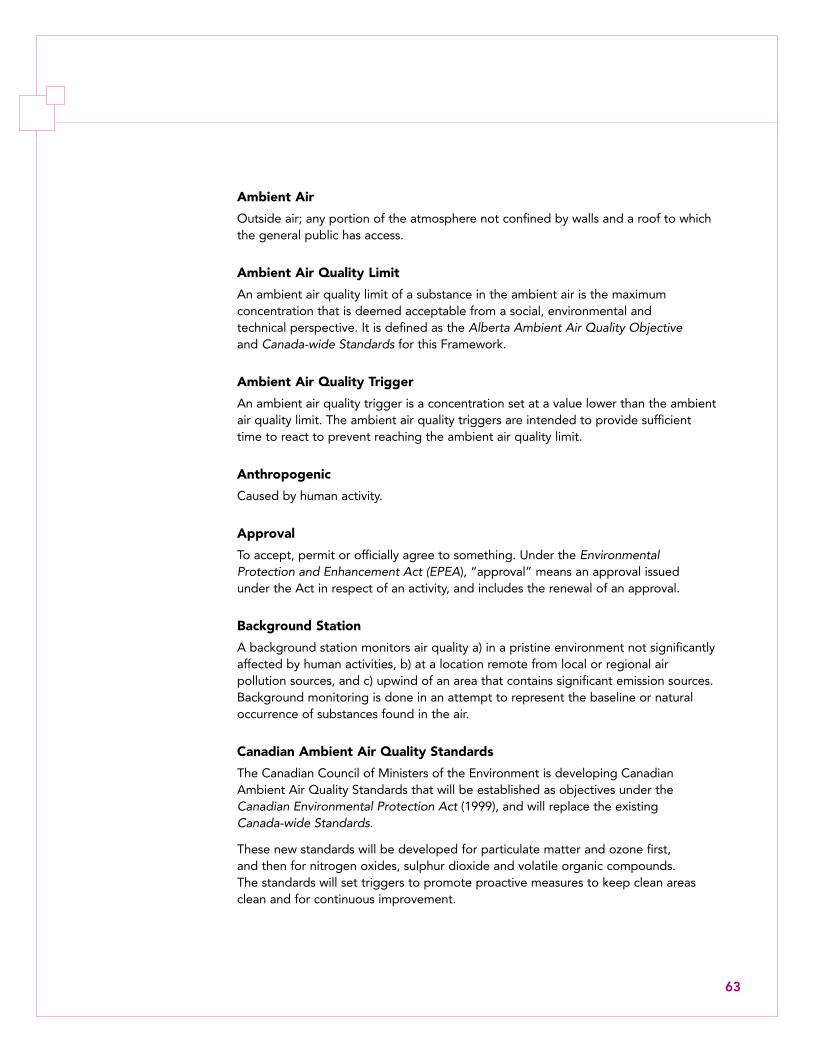
63
Ambient Air
outside air; any portion of the atmosphere not confined by walls and a roof to which the general public has access.
Ambient Air Quality Limit
an ambient air quality limit of a substance in the ambient air is the maximum concentration that is deemed acceptable from a social, environmental and technical perspective. it is defined as the Alberta Ambient Air Quality Objective and Canada-wide Standards for this framework.
Ambient Air Quality Trigger
an ambient air quality trigger is a concentration set at a value lower than the ambient air quality limit. the ambient air quality triggers are intended to provide sufficient time to react to prevent reaching the ambient air quality limit.
Anthropogenic
caused by human activity.
Approval
to accept, permit or officially agree to something. under the Environmental Protection and Enhancement Act (EPEA), “approval” means an approval issued under the act in respect of an activity, and includes the renewal of an approval.
Background Station
a background station monitors air quality a) in a pristine environment not significantly affected by human activities, b) at a location remote from local or regional air pollution sources, and c) upwind of an area that contains significant emission sources. Background monitoring is done in an attempt to represent the baseline or natural occurrence of substances found in the air.
Canadian Ambient Air Quality Standards
the canadian council of ministers of the environment is developing canadian ambient air Quality Standards that will be established as objectives under the Canadian Environmental Protection Act (1999), and will replace the existing Canada-wide Standards.
these new standards will be developed for particulate matter and ozone first, and then for nitrogen oxides, sulphur dioxide and volatile organic compounds. the standards will set triggers to promote proactive measures to keep clean areas clean and for continuous improvement.

64
Canada-wide Standards
Canada-wide Standards are inter-governmental agreements developed under the canadian council of ministers of the environment to address environmental protection and health risk issues. for our purposes the standards for fine particulate matter and ozone are used. the standards represent a commitment to reducing the concentrations of fine particulate matter and ozone in ambient air.
Continuous Monitoring
continuous monitoring involves monitoring the quality of the ambient air on a continuous basis. this can provide the greatest resolution but may be costly due to capital and operating expenses. data from continuous monitoring can be stored in different time blocks, such as one-hour averages or five-minute averages. typically, fine particulate matter and gases such as o3 and So2 are continuously monitored. continuous monitoring can be carried out on a long-term or temporary basis.
Cumulative Effects
cumulative effects are the combined effects of past, present and foreseeable human activities over time on the environment, economy and society in a particular place. the combination of activities can produce effects that are different in scale, nature or extent from the effects of individual activities alone. (www.environment.alberta.ca/0890.html)
Land-use Framework
in december 2008, the government of alberta released its Land-use Framework. its purpose is to manage growth, not stop it, and to sustain alberta’s growing economy, but balance this with albertans’ social and environmental goals. the Land-use Framework will leave local decision-making authority with the same officials who currently exercise it. however, in the future, these decisions will have to be consistent with regional plans. accordingly, the Land-use Framework consists of seven basic strategies to improve land-use decision-making in alberta. (www.landuse.alberta.ca/aboutlanduseframework/default.aspx)
Management
the process of addressing, dealing or controlling emission sources through the planning, monitoring, regulating of emissions or emission reduction programs.
Nitrogen Dioxide (NO2)
toxic pungent reddish-brown gas formed by the reaction of atmospheric ozone with the nitric oxide produced from combustion.

65
Nitrogen Oxides (Oxides of Nitrogen, NOx)
a general term pertaining to compounds of no, no2, and other oxides of nitrogen. nitrogen oxides are typically created during combustion processes, and are major contributors to smog formation and acid deposition.
Ozone (O3)
refers to an oxygen compound (o3) occurring in the form of a gas in the atmosphere at ground-level.
Particulate Matter (Fine Particulate Matter, PM2.5)
refers to airborne particles that are 2.5 microns or less in diameter.
Passive Monitoring
passive monitoring involves exposing a reactive surface to the air, which results in transfer of the pollutant by diffusion from the air to the monitor surface. the exposed surfaces are analyzed to determine the pollutant concentration. the sampling rate for some passive monitors is adjusted based on wind speed, temperature and humidity.
Primary Pollutant
a primary pollutant is one that is emitted into the atmosphere directly from the source of the pollutant and retains the same chemical form.
Regional Monitoring
regional stations are strategically located to represent areas with multiple emission sources.
Regional Plans/Planning
in the context of the Land-use Framework, the government of alberta will create seven land-use regions and will develop land-use plans for each of these regions. the regional plans will integrate provincial policies at the regional level, set out regional land-use objectives and provide the context for land-use decision making within the region, and reflect the uniqueness of the landscape and priorities of each region. municipalities and provincial government departments will be required to comply with regional plans in their decision making. (Alberta Land-use Framework, Strategy 1)
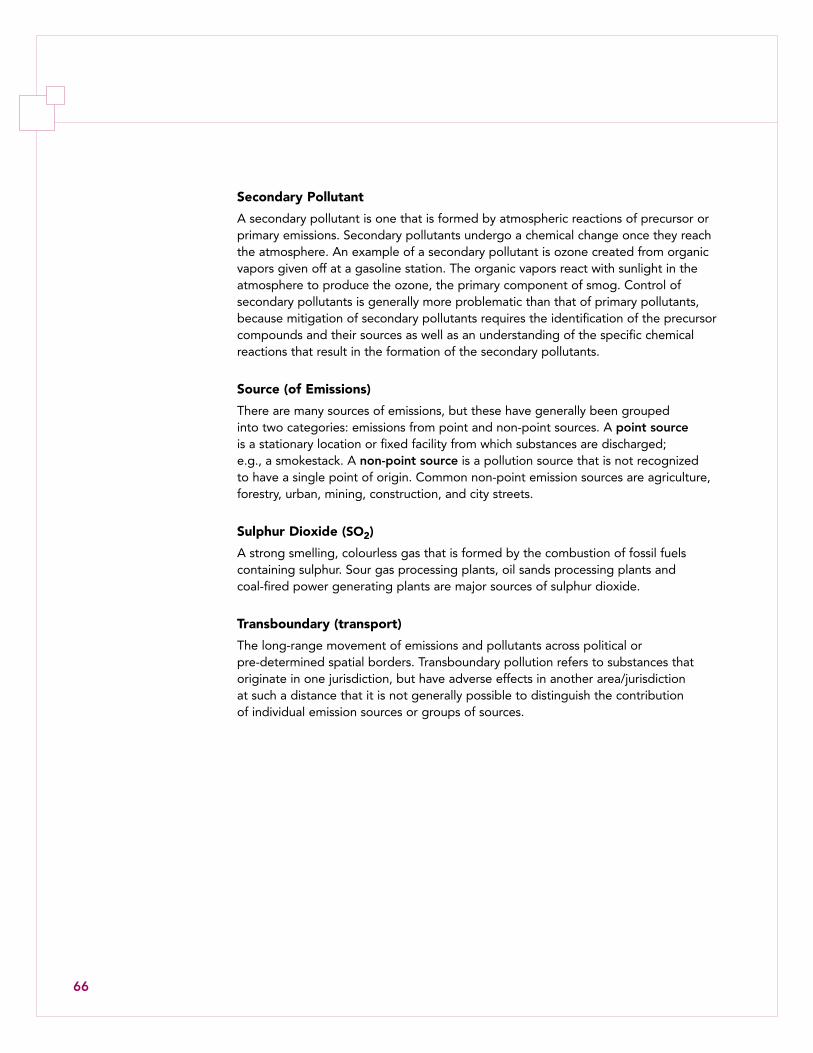
66
Secondary Pollutant
a secondary pollutant is one that is formed by atmospheric reactions of precursor or primary emissions. Secondary pollutants undergo a chemical change once they reach the atmosphere. an example of a secondary pollutant is ozone created from organic vapors given off at a gasoline station. the organic vapors react with sunlight in the atmosphere to produce the ozone, the primary component of smog. control of secondary pollutants is generally more problematic than that of primary pollutants, because mitigation of secondary pollutants requires the identification of the precursor compounds and their sources as well as an understanding of the specific chemical reactions that result in the formation of the secondary pollutants.
Source (of Emissions)
there are many sources of emissions, but these have generally been grouped into two categories: emissions from point and non-point sources. a point source is a stationary location or fixed facility from which substances are discharged; e.g., a smokestack. a non-point source is a pollution source that is not recognized to have a single point of origin. common non-point emission sources are agriculture, forestry, urban, mining, construction, and city streets.
Sulphur Dioxide (SO2)
a strong smelling, colourless gas that is formed by the combustion of fossil fuels containing sulphur. Sour gas processing plants, oil sands processing plants and coal-fired power generating plants are major sources of sulphur dioxide.
Transboundary (transport)
the long-range movement of emissions and pollutants across political or pre-determined spatial borders. transboundary pollution refers to substances that originate in one jurisdiction, but have adverse effects in another area/jurisdiction at such a distance that it is not generally possible to distinguish the contribution of individual emission sources or groups of sources.

67
Ozone in the Capital Region After Removing Natural, Background and Transboundary Influences (ppb)
appendix b – trends in the capital region
PM2.5 in the Capital Region After Removing Natural, Background and Transboundary Influences (µg/m3)
0
25
50
75
LamontFortSaskatchewan
Elk IslandGeneseeTomahawkEdmontonSouth
EdmontonNW
EdmontonEast
EdmontonCentral
0
25
50
75 07-09
06-08
05-07
04-06
03-05
02-04
01-03LamontFt. SaskElk IslandGeneseeTomahawkEdm SouthEdm NWEdm EastEdm Central
2001
-200
320
02-2
004
2003
-200
520
04-2
006
2005
-200
720
06-2
008
2007
-200
9
2001
-200
320
02-2
004
2003
-200
520
04-2
006
2005
-200
720
06-2
008
2007
-200
9
2001
-200
320
02-2
004
2003
-200
520
04-2
006
2005
-200
720
06-2
008
2007
-200
9
2001
-200
320
02-2
004
2003
-200
520
04-2
006
2005
-200
720
06-2
008
2007
-200
9
2003
-200
520
04-2
006
2005
-200
720
06-2
008
2007
-200
9
2002
-200
420
03-2
005
2004
-200
620
05-2
007
2006
-200
820
07-2
009
2001
-200
320
02-2
004
2003
-200
520
04-2
006
2005
-200
720
06-2
008
2007
-200
9
2002
-200
420
03-2
005
2004
-200
620
05-2
007
2006
-200
820
07-2
009
Management Planning Action Level
Mandatory Plan to Reduce Below CWS Action Level
Surveillance Action Level
CWS Exceedance Trigger Planning Trigger
0
5
10
15
20
25
30
LamontFortSaskatchewan
Elk IslandGeneseeTomahawkEdmontonSouth
EdmontonNW
EdmontonEast
EdmontonCentral
0
5
10
15
20
25
30 07-09
06-08
05-07
04-06
03-05
02-04
01-03LamontFt. SaskElk IslandRedwaterGeneseeTomahawkEdm McIntyreEdm SouthEdm NWEdm EastEdm Central
2001
-200
320
02-2
004
2003
-200
520
04-2
006
2005
-200
720
06-2
008
2007
-200
9
Management Planning Action Level
Mandatory Plan to Reduce Below CWS Action Level
Surveillance Action Level
CWS Exceedance Trigger
07-09
06-08
05-07
04-06
03-05
02-04
01-03
EdmontonMcIntyre
RedwaterIndustrial
2001
-200
320
02-2
004
2003
-200
520
04-2
006
2005
-200
720
06-2
008
2007
-200
9
2001
-200
320
02-2
004
2003
-200
520
04-2
006
2006
-200
820
07-2
009
2006
-200
820
07-2
009
2001
-200
320
02-2
004
2003
-200
520
04-2
006
2005
-200
720
06-2
008
2007
-200
9
2004
-200
620
05-2
007
2006
-200
820
07-2
009
2005
-200
720
06-2
008
2007
-200
9
2002
-200
420
03-2
005
2004
-200
620
05-2
007
2006
-200
820
07-2
009
2001
-200
320
02-2
004
2003
-200
520
04-2
006
2005
-200
720
06-2
008
2007
-200
9
2003
-200
520
04-2
006
2005
-200
720
06-2
008
2007
-200
9
Base Action Level
Planning Trigger
Surveillance Trigger
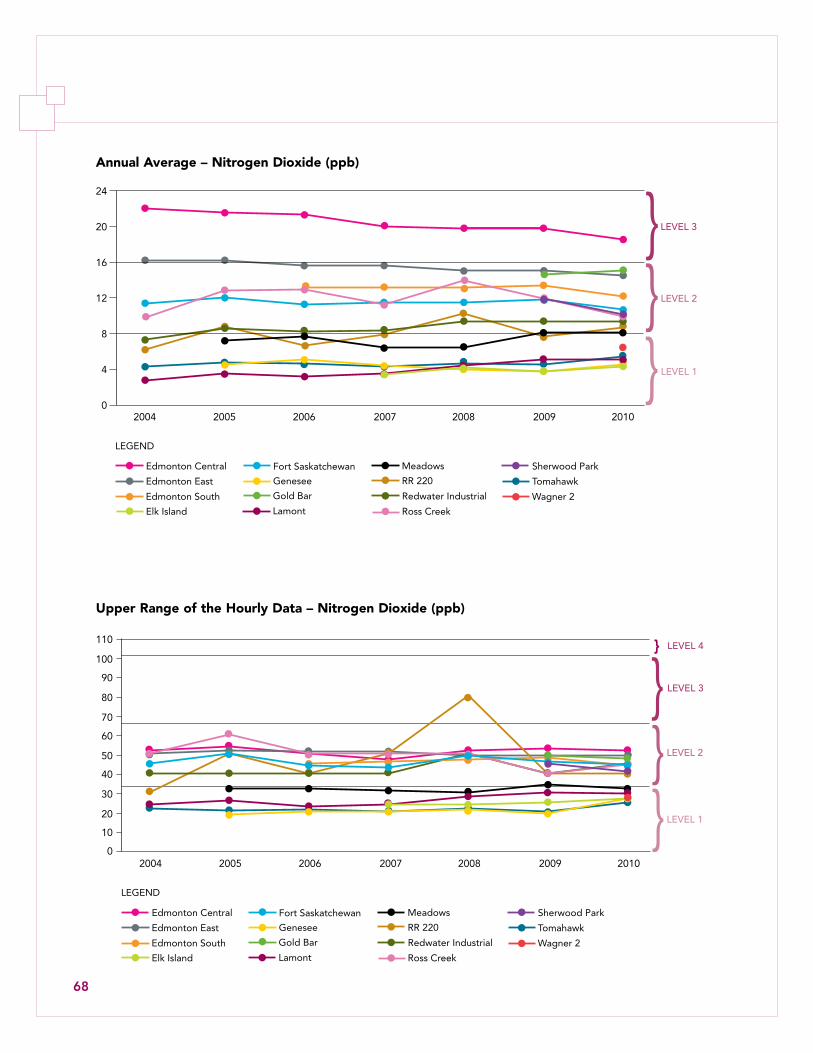
68
Annual Average – Nitrogen Dioxide (ppb)
Upper Range of the Hourly Data – Nitrogen Dioxide (ppb)
0
4
8
12
16
20
24 Wagner 2
Tomahawk
Sherwood Park
Ross Creek
Redwater Industrial
RR 220
Meadows
Lamont
Gold Bar
Genesee
Ft. Sask
Elk Island
Edm S
Edm E
Edm Central
20-1020-0920-0820-0720-0620-0520-04
0
4
8
12
16
20
24
2010200920082007200620052004
LEVEL 3
LEVEL 2
LEVEL 1
Edmonton East
Edmonton Central
Edmonton South
Fort Saskatchewan
Elk Island
Genesee
Lamont
Gold Bar Redwater Industrial
Meadows
RR 220
Ross Creek
Tomahawk
Sherwood Park
Wagner 2
LEGEND
0
10
20
30
40
50
60
70
80
90
100
110
0102030405060708090
100110 Wagner 2
Tomahawk
Sherwood Park
Ross Creek
Redwater Industrial
RR 220
Meadows
Lamont
Gold Bar
Genesee
Ft. Sask
Elk Island
Edm S
Edm E
Edm Central
20-1020-0920-0820-0720-0620-0520-04
2010200920082007200620052004
LEVEL 1
Edmonton East
Edmonton Central
Edmonton South
Fort Saskatchewan
Elk Island
Genesee
Lamont
Gold Bar Redwater Industrial
Meadows
RR 220
Ross Creek
Tomahawk
Sherwood Park
Wagner 2
LEGEND
LEVEL 2
LEVEL 3
LEVEL 4

69
Annual Average – Sulphur Dioxide (ppb)
Upper Range of the Hourly Data – Sulphur Dioxide (ppb)
0
1
2
3
4
5
6
7 Wagner 2
Tomahawk
Sherwood Park
Scotford 2
Ross Creek
Redwater
RR 220
Meadows
Lamont
Gold Bar
Genesee
Ft. Sask
Elmjay
Elk Island
Edm S
Edm E
Beverly
20-1020-0920-0820-0720-0620-0520-04
0
2
3
4
5
2010200920082007200620052004
LEVEL 3
LEVEL 2
LEVEL 1
Edmonton East
Beverly
Edmonton South
Elmjay
Elk Island
Fort Saskatchewan
Gold Bar
Genesee RR 220
Lamont
Meadows
Redwater Industrial
Scotford 2
Ross Creek
Sherwood Park
LEGEND
Wagner 2
Tomahawk
6
7
1
8
Edmonton East
Beverly
Edmonton South
Elmjay
Elk Island
Fort Saskatchewan
Gold Bar
Genesee RR 220
Lamont
Meadows
Redwater Industrial
Scotford 2
Ross Creek
Sherwood Park
LEGEND
Wagner 2
Tomahawk
0
10
20
30
40
50
60
70
80
90
100
110
2010200920082007200620052004
LEVEL 1
LEVEL 4
0102030405060708090
100110120130140 Wagner 2
Tomahawk
Sherwood Park
Scotford 2
Ross Creek
Redwater
RR 220
Meadows
Lamont
Gold Bar
Genesee
Ft. Sask
Elmjay
Elk Island
Edm S
Edm E
Beverly
20-1020-0920-0820-0720-0620-0520-04
120
130
140
LEVEL 2
LEVEL 3

70
appendix c – technical supporting document summary
the purpose of the capital region technical Work group was to provide scientific and technical support to the Steering committee. this appendix summarizes the work of the technical Work group as it relates to the development of the numerical triggers and to several technical aspects of the framework that were considered. further detail is available in the Technical Supporting Document for the Capital Region Air Quality Management Framework.
ChARACTERIzATIon oF monIToRIng In ThE CAPITAL REgIon
the draft Lower Athabasca Region Air Quality Management Framework classified ambient air monitoring stations in that region to determine which management tool would be most effective for actions taken as a result of data collected at each type of monitoring station (i.e., industrial or community stations). the technical Work group was asked to determine whether ambient air monitoring stations within the capital region could also be classified by type.
monitoring of ambient nitrogen dioxide, sulphur dioxide, fine particulate matter and ozone in the capital region is conducted by passive air samplers and continuous air analyzers. When the technical Work group examined monitoring data in the capital region for the contaminants of concern (nitrogen dioxide, sulphur dioxide, fine particulate matter and ozone) as defined in the framework, it was determined that emissions impacting the monitoring sites most likely originated from a variety of different sources.
as a result, monitoring stations within the capital region were not classified for this framework, and sources impacting the stations will be considered on a station-by-station basis. the recommended approach for implementing the Capital Region Air Quality Management Framework was to assign management actions in response to the measured impact at each monitoring station.

71
TRIggER DEvELoPmEnT FoR nITRogEn DIoxIDE AnD SuLPhuR DIoxIDE
the technical Work group examined the implications of applying the same methodology in the capital region that was used to develop trigger values for the lower athabasca region. the findings determined that the methodology would work for the capital region. the draft Lower Athabasca Region Air Quality Management Framework four-level management approach was adopted for each of the contaminants of concern covered by the capital region framework. the four-level management concept is also consistent with the approaches identified in the proposed national Air Quality Management System and the Clean Air Strategic Alliance Particulate Matter and Ozone Management Framework. the latter is adopted in this framework to address fine particulate matter and ozone.
Criteria for Data Completeness ambient air quality monitoring stations occasionally have disruptions in data acquisition due to planned maintenance, power outages or equipment failures. in addition, monitoring requirements may change over time resulting in monitoring stations being decommissioned, moved or added. due to these circumstances, the ambient air quality data set may not be 100 per cent complete for any given calendar year of operation at a single monitoring site. therefore the technical Work group developed data completeness criteria to be able to work with available data and develop triggers for the capital region.
an annual data set of one-hour average concentrations at a monitoring station is considered complete when each season (spring, summer, fall and winter), contains valid hourly data for at least 75 per cent of the time. if all four seasons meet these criteria, then data for the station for the particular year is considered complete. this is consistent with the approach used for the alberta air quality modelling guidelines when monitoring data are considered for background information. this completeness criteria was considered for each individual station in operation at the time of this trigger development process.

72
Triggers for the Annual Assessment annual triggers assess annual average concentrations for each station for each contaminant of concern. the annual assessment identifies any systematic or recurring issues that are evident in the annual average concentrations.
the annual trigger development methodology for the capital region is identical to that used for the draft Lower Athabasca Region Air Quality Management Framework. the annual assessment highlights areas where management action may be needed. there were no scientific reasons identified to justify a move away from what was done in the draft Lower Athabasca Region Air Quality Management Framework.
annual assessment methodology in the capital region includes three triggers (into level 2, level 3 and level 4). the trigger into level 4 uses the annual nitrogen dioxide and sulphur dioxide Alberta Ambient Air Quality Objectives. the objective is interpreted as a limit because regulatory action can be taken when that value is exceeded. the current (april 2011) annual objectives are:
• nitrogen dioxide = 45 µg/m3 (24 ppb)
• Sulphur dioxide = 20 µg/m3 (8 ppb)
the triggers and limit for the annual assessment are determined using equation 1.
Equation 1
triggern = aaaQo x n
Where:
triggern is the nth trigger, n ranges from 1 to 3 indicating the trigger number.the number 3 in the equation represents the total number of triggers in the management approach. aaaQo is the annual Alberta Ambient Air Quality Objective for the contaminant being assessed.
note that trigger1 is the trigger into level 2 and trigger3 is a limit for the annual assessment. these concepts are illustrated in figure c-1.
3

73
Figure C-1 Triggers and Limit Associated with Annual Assessment Methodology
annual assessment limits and triggers are presented in table c-1. the results of the annual assessment are presented in table c-2 and table c-3. a blank in the table indicates that a complete dataset was not available. the monitoring stations within the city of edmonton were identified as being in level 2 or level 3 for nitrogen dioxide. all other monitoring stations were in level 2 or level 1. for sulphur dioxide, with the exception of a single fence-line station, all monitoring stations were in level 1.
Table C-1 Annual Assessment Limit and Trigger Values
Level 1
Level 2
Level 3
Level 4
trigger1 = aaaQo xtrigger into level 2
trigger into level 3
trigger into level 4
{
{{
1 3
2 3trigger2 = aaaQo x
trigger3 = aaaQo
Trigger Values
Substance Level 2 Level 3 Level 4
nitrogen dioxide 8 ppb 16 ppb 24 ppb
Sulphur dioxide 3 ppb 5 ppb 8 ppb

74
Table C-2 Results of Nitrogen Dioxide Annual Assessment for the Capital Region
Table C-3 Results of Sulphur Dioxide Annual Assessment for the Capital Region
year Ed
mo
nto
n C
entr
al
Ed
mo
nto
n E
ast
Ed
mo
nto
n So
uth
Elk
Isla
nd
Fort
Sas
katc
hew
an
Gen
esee
Lam
ont
Mea
do
ws
Ran
ge
Ro
ad 2
20
Red
wat
er
Ro
ss C
reek
Tom
ahaw
k
Wag
ner
Sher
wo
od
Par
k
Go
ld B
ar
2004 3 3 2 1 1 1 2 1
2005 3 3 2 1 1 1 2 2 2 1
2006 3 2 2 2 1 1 1 1 2 2 1
2007 3 2 2 1 2 1 1 1 1 2 2 1
2008 3 2 2 1 2 1 1 1 2 2 2 1
2009 3 2 2 1 2 1 1 2 1 2 2 1 2 2
2010 3 2 2 1 2 1 1 2 2 2 2 1 1 2 2
year Ed
mo
nto
n E
ast
Ed
mo
nto
n So
uth
Elk
Isla
nd
Fort
Sas
katc
hew
an
Gen
esee
Lam
ont
Mea
do
ws
Ran
ge
Ro
ad 2
20
Red
wat
er
Ro
ss C
reek
Sco
tfo
rd
Tom
ahaw
k
Wag
ner
Sher
wo
od
Par
k
Elm
jay
Go
ld B
ar
Bev
erly
2004 1 1 1 1 2 1 1
2005 1 1 1 1 1 1 2 1 1
2006 1 1 1 1 1 1 1 1 1
2007 1 1 1 1 1 1 1 2 1 1 1
2008 1 1 1 1 1 1 1 1 2 1 1 1
2009 1 1 1 1 1 1 1 1 2 1 1 1 1 1 1 1
2010 1 1 1 1 1 1 1 1 3 1 1 1 1 1 1 1 1

75
Upper Range of Hourly Data Assessmentthe technical Work group looked at four methods for the hourly assessment. this appendix presents the method selected by the Steering committee, which is based on the approach used in the draft Lower Athabasca Region Air Quality Management Framework, modified to apply to the capital region. a detailed description of this modification is outlined in the Technical Supporting Document for the Capital Region Air Quality Management Framework. the capital region methodology took a different approach to processing the monitoring data used to determine the triggers associated with the upper range of the hourly assessment. these differences are primarily: data completeness criteria, number of years used, data precision criteria and monitoring stations included.
the upper range of hourly data assessment allows for the examination of episodic events. triggers for the hourly assessment method are determined using equation 2.
Equation 2
Where:
triggern is the nth trigger, n ranges from 1 to 3, p is the 99th percentile, max is the maximum one hour concentration,m equals the number of years multiplied by the number of stations for a complete data set,aaaQo is the one-hour average Alberta Ambient Air Quality Objective for the contaminant being assessed.
the ratio of p to max is calculated for data collected at each station for each of the years being considered. the resulting levels and associated triggers are illustrated in figure c-2.
triggern = (( 1 ∑( p ) ) x aaaQo) x n3m
m
i=1max i

76
Figure C-2 Triggers and Limit Associated with Annual Assessment Methodology
the assessment methodology involved determining 99th percentile hourly ambient concentrations for each calendar year and assessing the determined value against the appropriate triggers. hourly assessment trigger values are presented in table c-4. results of the assessment using this method are presented in table c-5 and table c-6. a blank in the table indicates that a complete dataset was not available.
Table C-4 Hourly Assessment Trigger Values
Level 1
Level 2
Level 3
Level 4
trigger1 = trigger3 xtrigger into level 2
trigger into level 3
trigger into level 4
{
{{
1 3
2 3trigger2 = trigger3 x
trigger3 = (( 1 ∑( p ) ) x aaaQo)m
m
i=1max i
Trigger Values
Substance Level 2 Level 3 Level 4
nitrogen dioxide 34 ppb 67 ppb 101 ppb
Sulphur dioxide 14 ppb 29 ppb 43 ppb

77
Table C-5 Results of Nitrogen Dioxide Hourly Assessment for the Capital Region
Table C-6 Results of Sulphur Dioxide Hourly Assessment for the Capital Region
year Ed
mo
nto
n C
entr
al
Ed
mo
nto
n E
ast
Ed
mo
nto
n So
uth
Elk
Isla
nd
Fort
Sas
katc
hew
an
Gen
esee
Lam
ont
Mea
do
ws
Ran
ge
Ro
ad 2
20
Red
wat
er
Ro
ss C
reek
Tom
ahaw
k
Wag
ner
Sher
wo
od
Par
k
Go
ld B
ar
2004 2 2 2 1 1 2 2 1
2005 2 2 2 1 1 1 2 2 2 1
2006 2 2 2 2 1 1 1 2 2 2 1
2007 2 2 2 1 2 1 1 1 2 2 2 1
2008 2 2 2 1 2 1 1 1 3 2 2 1
2009 2 2 2 1 2 1 1 1 2 2 2 1 2 2
2010 2 2 2 1 2 1 1 1 2 2 2 1 1 2 2
year Ed
mo
nto
n E
ast
Ed
mo
nto
n So
uth
Elk
Isla
nd
Fort
Sas
katc
hew
an
Gen
esee
Lam
ont
Mea
do
ws
Ran
ge
Ro
ad 2
20
Red
wat
er
Ro
ss C
reek
Sco
tfo
rd
Tom
ahaw
k
Wag
ner
Sher
wo
od
Par
k
Elm
jay
Go
ld B
ar
Bev
erly
2004 1 1 1 1 4 1 1
2005 1 1 2 1 1 1 4 1 1
2006 1 1 2 1 2 1 4 1 1
2007 1 1 1 1 1 1 1 4 1 1 1
2008 1 1 1 1 1 1 1 1 4 1 1 1
2009 1 1 1 1 1 1 1 1 4 1 1 1 2 1 1 2
2010 1 1 1 1 1 1 1 1 4 1 1 1 1 2 1 1 1

78
REmovIng TRAnSBounDARy AnD nATuRAL nITRogEn DIoxIDE
the Steering committee tasked the technical Work group with exploring the influence of transboundary and naturally occurring nitrogen dioxide in the capital region. the purpose of this exercise was to determine if it was necessary to remove data collected during a period of significant influence from sources not controlled by management actions. Such nitrogen dioxide sources can include background, transboundary, or natural episodic influences. the technical Work group determined that the most pronounced natural source of nitrogen dioxide, an air contaminant primarily associated with combustion, would be forest fires. forest fires produce a number of pollutants, including fine particulate matter and nitrogen dioxide, which can be transported into the capital region. therefore, nitrogen dioxide data collected during periods affected by forest fires were removed from the capital region dataset using the Canada-wide Standard achievement determination for particulate matter. Sample days impacted by multiple sources (which make it difficult to determine event origin) and those impacted by local anthropogenic sources were not removed. to explore the influence of forest fire emissions on nitrogen dioxide concentration within the capital region, nitrogen dioxide concentrations collected on days identified as being impacted by forest fire emissions were removed. for data collected in 2010, analysis for achievement determination was not complete at the time of this exercise. due to the forest fires that occurred from august 18 to 22, an assumption was made that these days were suitable for removal. for each day identified as impacted by forest fires, a full day (24 hours) of nitrogen dioxide data were removed. the method used to remove data is outlined in Technical Supporting Document for the Capital Region Air Quality Management Framework.
the nitrogen dioxide data set, with forest fire impacted sample days removed, was then used in the trigger calculations outlined on pages 75 to 76. only two changes within the trigger calculations were observed as a result of the data removal: an increase in the 99th percentile at tomahawk in 2004 and genesee in 2010. these increases in 99th percentile values may indicate that lower nitrogen dioxide values were removed from the data set. this being said, the resulting changes were small enough not to affect the overall trigger calculations. the annual and upper range of hourly data levels assessments were also performed and remained unchanged. the results imply that the forest fires impacting the capital region are not significant contributors to peak nitrogen dioxide. as a result technical Work group concluded that the removal of transboundary and natural events in the assessment of nitrogen dioxide is not warranted.
alberta environment and Sustainable resource development. 2007. Analyzing Exceedances of the Canada-wide Standard for Particulate Mattter and Ozone and the CASA Framework Triggers. edmonton: monitoring and evaluation Branch.

this framework provides management tools that will address current and future air quality pressures and issues in the capital region.
June 2012
iSBn no. 978-1-4601-0065-3
For more information, or to order additional copies, contact:alberta environment and Sustainable resource developmentinformation centremain floor, 9820 - 106 Streetedmonton, aB t5K 2J6toll-free: dial 310-0000 and the phone numbertelephone: 780-427-2700www.environment.alberta.ca
this document is printed on chlorine-free paper made from 100 per cent post-consumer fibre. in choosing this paper, alberta environment and Sustainable resource development saved 10,725 litres of water, prevented 233 kilograms of greenhouse gas emissions, conserved 6 trees and diverted 128 kilograms of waste from alberta landfills. the paper was produced using wind power, which prevented 128 kilograms of air emissions and saved the use of 62 cubic metres of natural gas.


![[DRAFT] Environmental Management Framework - … · [DRAFT] Environmental Management Framework ... Management System ... Contaminated land and spoil management, Biodiversity, Greenhouse](https://img.pdfslide.net/doc/110x75/5b1425c97f8b9a4d7c8b81fb/draft-environmental-management-framework-draft-environmental-management.jpg)