Embed Size (px)
Citation preview
Capitol Region Watershed District 2010 Monitoring Report
Prepared by:
Capitol Region Watershed District 1410 Energy Park Drive, Suite 4
St. Paul, MN 55108 651.644.8888
www.capitolregionwd.org
April 13, 2011

“Our mission is to protect, manage, and improve the water resources of the Capitol Region Watershed District.”
April 13, 2011 Dear Stakeholders and Interested Parties: I am pleased to provide to you a copy of our 2010 Monitoring Report. The Capitol Region Watershed District’s (CRWD) 2010 monitoring program was enhanced by the contributions of numerous agencies and individuals including: St. Paul Public Works, Anne Weber and Pat Cahonous, assistance with city storm sewer monitoring; Ramsey County Public Works, Terry Noonan and Lewis Soukup for the lake monitoring data; and Metropolitan Council Environmental Services, for lab analysis on water samples. The CRWD established a water quality monitoring program in 2004. Prior to this, there were limited data on stormwater in CRWD. These data are necessary to assess achievement of water quality standards, evaluate BMP programs, identify water quality problem areas, calibrate computer models, and perform trend analysis. In addition, most of the stormwater in CRWD flows to the Mississippi River, where it affects aquatic life. Monitoring storm water can help determine what CRWD is exporting to the River. In 2010, CRWD operated 16 baseline stormwater monitoring stations. Ten of the stations were full water quality monitoring stations. These stations are located near the outlet of major sub-watersheds and data from these stations will be used to track water quality in the District. I would also like to recognize staff who prepared this report. Matt Loyas, Melissa Baker, and Britta Suppes had a major role in collecting, analyzing and reporting the data. Bob Fossum and Anna Eleria assisted with the analysis and report development. Andrea Bolks, Peter Brumm, Chris Lundeen, Selina Pradhan, and Carrie Robertson assisted with data collection. All of the supporting data are stored in a database maintained by the CRWD. The 2010 Monitoring Report, along with previous years’ reports, is also available at the District’s website: www.capitolregionwd.org. If you have any questions pertaining to the enclosed report do not hesitate to contact me or our staff at 651.644.8888. Sincerely, Mark Doneux Administrator enc: 2010 Capitol Region Watershed District Monitoring Report
1410 Energy Park Dr., Suite 4 St. Paul, MN 55108 Phone: (651) 644-8888 Fax: (651) 644-8894 www.capitolregionwd.org
Capitol Region Watershed District


Table of Contents Acronyms .....................................................................................................................................…i Definitions......................................................................................................................................iii List of Figures .................................................................................................................................v List of Tables ............................................................................................................................…vii 1. Executive Summary ...............................................................................................................…1 2. Introduction ............................................................................................................................…3 3. Baseline Stormwater Monitoring
a. Monitoring Locations.................................................................................................…7 b. Monitoring and Analysis Methods...............................................................................9 c. Summary of Results .....................................................................................................17 d. Detailed Results
i. Como Subwatershed ........................................................................................45 ii. East Kittsondale Subwatershed ........................................................................49
iii. Phalen Creek Subwatershed .............................................................................53 iv. St. Anthony Park Subwatershed ......................................................................57 v. Trout Brook Subwatershed ..............................................................................63
vi. Lake McCarrons Subwatershed .......................................................................71 4. Lake Monitoring
a. Introduction ..................................................................................................................75 b. Methods........................................................................................................................76 c. Results ..........................................................................................................................77
5. Conclusions and Recommendations ........................................................................................87 References......................................................................................................................................91 Appendices
A. Detailed Subwatershed Data i. Como Subwatershed ........................................................................................95
ii. East Kittsondale Subwatershed ......................................................................105 iii. Phalen Creek Subwatershed ...........................................................................112 iv. St. Anthony Park Subwatershed ....................................................................118 v. Trout Brook Subwatershed ............................................................................128
vi. Lake McCarrons Subwatershed .....................................................................148 B. Metals Standards Based on Hardness ..........................................................................157 C. Reference Tables .........................................................................................................161 D. Special Report:
2005‐2010 Monitoring Data Summary for Total Pollutant Loads ..............................163
Capitol Region Watershed District 2010 Monitoring Report i
Acronyms and Abbreviations ac Acre AHUG Arlington Hamline Underground BMP Best Management Practice cBOD 5-day Carbonaceous Biochemical Oxygen Demand Cd Cadmium cf Cubic feet cfs Cubic feet per second cfu Colony forming unit chl-a Chlorophyll-a Cl Chloride Cr Chromium CRWD Capitol Region Watershed District Cu Copper DO Dissolved Oxygen E. coli Escherichia coli EPA Environmental Protection Agency ft Foot GP ha
Gottfried’s Pit Hectare
FWA Flow-Weighted Average IBI Index of Biological Integrity IDDE Illicit Discharge Detection and Elimination in Inch kg Kilogram L Liter lb Pound m Meter MCES Metropolitan Council Environmental Services mg Milligram mL Milliliter MnDOT Minnesota Department of Transportation MPCA Minnesota Pollution Control Agency MPN Most probable number MS4 Municipal Separate Storm Sewer System NA NCHF
Not Available North Central Hardwood Forest
NH3 Ammonia Ni Nickel NO2 Nitrite
Capitol Region Watershed District 2010 Monitoring Report ii
NO3 Nitrate NOAA National Oceanic and Atmospheric Administration Ortho-P Ortho-phosphate Pb Lead PCBs Polychlorinated biphenyls RCD Ramsey Conservation District RCPW Ramsey County Public Works s Second TB Trout Brook TBI Trout Brook Storm Sewer Interceptor TDS Total Dissolved Solids TKN Total Kjeldahl Nitrogen TMDL TP
Total Maximum Daily Load Total Phosphorus
TSS Total Suspended Solids VSS Volatile Suspended Solids Zn Zinc
Capitol Region Watershed District 2009 Monitoring Report iii
Definitions Acute exposure – in water quality standards, the minimum concentration of a chemical to which an organism may be exposed for a short time period without experiencing adverse effects. Baseflow – water flowing through the pipe during non-storm events, usually at a relatively constant, slow velocity. Best Management Practice – Technique, measure, or structural control that is used for a given set of conditions to manage the quantity and improve the quality of stormwater runoff in the most cost effective manner. Chronic exposure – in water quality standards, the minimum concentration of a chemical to which an organism may be exposed for an extended period of time without experiencing adverse effects. Composite sample – a water sample that is made up of several samples taken at spaced intervals. Discharge – rate of flow in pipe or stream, expressed as a volume per unit time, most commonly cubic feet per second (cfs). Epilimnion – in a lake, the top layer of water, characterized in the summer by warm, circulating water. MPCA lake standards are based on water sampled from this layer. Eutrophic – a water body with high biological productivity. These lakes have murky water and an extensive macrophyte population. Algal blooms are common. Flow-weighted concentration – the total pollutant load divided by total flow, often expressed as mg/L. Grab sample – a water sample that is obtained by taking a single sample. Hardness – the concentration of salts (e.g. calcium carbonate, magnesium carbonate) in a water sample. Hypereutrophic – a waterbody with excessive biological productivity. These lakes have very murky water, frequent algal blooms and fish kills, foul odor, and rough fish. Illicit Discharge – Any discharge to the municipal separate storm sewer system that is not composed entirely of stormwater, except for discharges allowed under a NPDES permit or water used for firefighting operations (EPA). Impaired Waters – Waters that are not meeting their designated uses because of excess pollutants violating water quality standards (from the MPCA website). Load – the total volume of pollutant, often expressed in lbs or kg.
Capitol Region Watershed District 2009 Monitoring Report iv
Mesotrophic – a waterbody that has intermediate biological productivity. These lakes have moderately clear water, late-summer algal blooms, moderate macrophyte populations, and occasional fish kills. Normalized Pollutant Yield – This normalized yield accounts for temporal and spatial precipitation differences by dividing the pollutant yield by the number of inches of water runoff (water yield) in a subwatershed over a given period of time. It is expressed as pounds per acre per inch of runoff. Oligotrophic – a waterbody that has low biological productivity, and is characterized by clear water, few macrophytes, and salmonid fish. Secchi depth – a measure of the transparency of lake water. Storm flow – water flowing through the pipe during storm events. Storm flow usually occurs for a short amount of time, and has a high velocity. Stormwater – water that is not infiltrated into the soil during and following a rainfall event. Yield – the amount of pollutant produced per land area, often expressed as lbs/acre or kg/ha.

Capitol Region Watershed District 2010 Monitoring Report v
List of Figures Figure 1. Capitol Region Watershed District ........................................................................................5 Figure 2. Mississippi River Reference Site and 2010 CRWD Monitoring Sites ..................................8 Figure 3. Total Discharge at CRWD Monitoring Sites, 2005 – 2010.................................................19 Figure 4. Storm and Base Discharge CRWD Monitoring Sites, 2010 ................................................20 Figure 5. Total Water Yield at CRWD Monitoring Sites, 2005-2010 ................................................21 Figure 6. Flow-Weighted Average TSS Concentrations at CRWD Monitoring Sites, 2005-2010 ....25 Figure 7. Flow-Weighted Average TP Concentrations at CRWD Monitoring Sites, 2005-2010 ......26 Figure 8. Storm and Base TSS Loads at CRWD Monitoring Sites, 2010 ..........................................27 Figure 9. Storm and Base TP Loads at CRWD Monitoring Sites, 2010 ............................................28 Figure 10. TSS Yields at CRWD Monitoring Sites ............................................................................29 Figure 11. Normalized TSS Yields at CRWD Monitoring Sites ........................................................30 Figure 12. Normalized TSS Yields Across CRWD Monitored Subwatersheds .................................31 Figure 13. TP Yields at CRWD Monitoring Sites ..............................................................................32 Figure 14. Normalized TP Yields at CRWD Monitoring Sites ..........................................................33 Figure 15. Normalized TP Yields Across CRWD Monitored Subwatersheds ...................................34 Figure 16. TSS Yields at Metro-Area Tributaries and CRWD Subwatershed Outlets .......................35 Figure 17. TP Yields at Metro-Area Tributaries and CRWD Subwatershed Outlets .........................36 Figure 18. Sampling Sites in the Como Lake Subwatershed ..............................................................47 Figure 19. Sampling Sites in the East Kittsondale Subwatershed ......................................................51 Figure 20. Sampling Sites in the Phalen Creek Subwatershed.......... .................................................55 Figure 21. Sampling Sites in the St. Anthony Park Subwatershed .....................................................59 Figure 22. Sampling Sites in the Trout Brook Subwatershed .............................................................67 Figure 23. Lake McCarrons Subwatershed .........................................................................................73 Figure 24. Historical Growing Season Secchi Depth Averages .........................................................80 Figure 25. Historical Growing Season Average Chl-a Concentrations ..............................................80 Figure 26. Historical Growing Season Average TP Concentrations ..................................................81 Figure 27. 2010 and Historical Growing Season Secchi Depth Averages .........................................81 Figure 28. 2010 and Historical Growing Season Chl-a Averages ......................................................82 Figure 29. 2010 and Historical Growing Season TP Averages ..........................................................82 Figure 30. Como Lake Growing Season Secchi Depths, and TP and Chl-a Averages .....................83 Figure 31. Crosby Lake Growing Season Secchi Depths, and TP and Chl-a Averages....................84 Figure 32. Lake McCarrons Growing Season Secchi Depths, and TP and Chl-a Averages .............85 Figure 33. Loeb Lake Growing Season Secchi Depths, and TP and Chl-a Averages .......................86 Figure 34. 2010 Como 7 Level, Velocity, and Discharge ..................................................................97 Figure 35. 2010 Como 7 Level, Discharge, and Rain .........................................................................98 Figure 36. 2010 Golf Course Pond Outlet Level, Velocity, and Discharge .......................................99 Figure 37. 2010 Golf Course Pond Outlet Level, Discharge, and Rain ............................................100 Figure 38. 2010 East Kittsondale Level, Velocity, and Discharge ...................................................107 Figure 39. 2010 East Kittsondale Level, Discharge, and Rain .........................................................108 Figure 40. 2010 Phalen Creek Level, Velocity, and Discharge ........................................................113 Figure 41. 2010 Phalen Creek Level, Discharge, and Rain ..............................................................114 Figure 42. 2010 Sarita Outlet Level, Velocity, and Discharge .........................................................119 Figure 43. 2010 Sarita Outlet Level, Discharge, and Rain ...............................................................120
Capitol Region Watershed District 2010 Monitoring Report vi
Figure 44. 2010 St. Anthony Park Level, Velocity, and Discharge ..................................................123 Figure 45. 2010 St. Anthony Park Level, Discharge, and Rain ........................................................124 Figure 46. 2010 Trout Brook – West Branch Level, Velocity, and Discharge .................................129 Figure 47. 2010 Trout Brook – West Branch Level, Discharge, and Rain .......................................130 Figure 48. 2010 Trout Brook – East Branch Level, Velocity, and Discharge ..................................135 Figure 49. 2010 Trout Brook – East Branch Level, Discharge, and Rain ........................................136 Figure 50. 2010 Trout Brook Outlet Level, Velocity, and Discharge ..............................................140 Figure 51. 2010 Trout Brook Outlet Level, Discharge, and Rain .....................................................141 Figure 52. Water Level Elevation and Precipitation at Arlington-Jackson
Stormwater Pond, 2010 ....................................................................................................145 Figure 53. Water Level Elevation and Precipitation at Sims-Agate Stormwater Pond, 2010 ..........146 Figure 54. Water Level Elevation and Precipitation at Westminster-Mississippi
Stormwater Pond, 2010 ....................................................................................................147 Figure 55. 2010 Villa Park Level, Velocity, and Discharge .............................................................149 Figure 56. 2010 Villa Park Level, Discharge, and Rain ...................................................................120 Figure 57. Water Level and Discharge at Lake McCarrons Outlet, 2010 ........................................153
Capitol Region Watershed District 2010 Monitoring Report vii
List of Tables Table 1. Sites Monitored in 2010 .....................................................................................................10 Table 2. Analysis Method, Reporting Limit, and Holding Times for Water Chemistry Parameters
Analyzed by MCES Laboratory.........................................................................................11 Table 3. Surface Water Quality Standards ........................................................................................15 Table 4. NSQD Stormwater Pollutant Median Values ....................................................................16 Table 5. CRWD Monitoring Season Rainfall Amounts ..................................................................18 Table 6. CRWD Total Monitoring Days ..........................................................................................18 Table 7. 2010 Monitoring Results Summary ...................................................................................24 Table 8. Pollutant Standards and Average Concentrations at Monitoring Sites and in the
Mississippi River ...............................................................................................................35 Table 9. 2010 Metals Concentrations at CRWD Sites and in the Mississippi River .......................37 Table 10. 2010 Baseflow Grab E. coli Concentrations at CRWD Baseline Sites ...........................38 Table 11. 2010 Stormflow Grab E. coli Concentrations at CRWD Baseline Sites .........................39 Table 12. CRWD 2010 Median Stormwater Data versus NSQD Median Data ..............................41 Table 13. 2005 – 2010 Como 7 Subwatershed Monitoring Results ................................................46 Table 14. 2005 – 2010 East Kittsondale Monitoring Results ..........................................................50 Table 15. 2005 – 2010 Phalen Creek Monitoring Results ...............................................................54 Table 16. 2005 – 2010 St. Anthony Park Monitoring Results .........................................................58 Table 17. 2005 – 2010 Sarita Monitoring Results ...........................................................................59 Table 18. Average Pond Elevations in Trout Brook Stormwater Ponds, 2006 - 2010.......... ..........64 Table 19. 2005 – 2010 Trout Brook - West Branch Monitoring Results ........................................66 Table 20. 2006 – 2010 Trout Brook - East Branch Monitoring Results ..........................................67 Table 21. 2005 – 2010 Trout Brook Outlet Monitoring Results ......................................................68 Table 22. 2006 – 2010 Results for the Villa Park Subwatershed ....................................................72 Table 23. Deep and Shallow Lake Water Quality Standards ...........................................................75 Table 24. 2010 and Historical Water Quality Average Concentrations ..........................................77 Table 25. 2010 Como 7 Subwatershed Laboratory Data .................................................................95 Table 26. 2010 Como 7 Subwatershed Loading ............................................................................101 Table 27. 2010 East Kittsondale Subwatershed Laboratory Data .................................................105 Table 28. 2010 East Kittsondale Subwatershed Loading ..............................................................109 Table 29. 2010 Phalen Creek Laboratory Data ..............................................................................112 Table 30. 2010 Phalen Creek Loading ...........................................................................................115 Table 31. 2010 St. Anthony Park Laboratory Data .......................................................................122 Table 32. 2010 St. Anthony Park Loading ....................................................................................115 Table 33. 2010 Trout Brook – West Branch Laboratory Data ......................................................128 Table 34. 2010 Trout Brook – West Branch Loading ...................................................................131 Table 35. 2010 Trout Brook – East Branch Laboratory Data ........................................................134 Table 36. 2010 Trout Brook – East Branch Loading .....................................................................137 Table 37. 2010 Trout Brook Outlet Laboratory Data ....................................................................139 Table 38. 2010 Trout Brook Outlet Loading .................................................................................142 Table 39. 2010 Villa Park Laboratory Data ...................................................................................148 Table 40. 2010 Villa Park Loading ................................................................................................151 Table 41. 2010 Metals Standards Based on Average Hardness .....................................................158
Capitol Region Watershed District 2010 Monitoring Report viii
Table 42. 2010 Data Collection Efficiency at CRWD Monitoring Sites .......................................161 Table 43. 2010 Epilimnetic Data and Growing Season Averages .................................................162

Capitol Region Watershed District 2010 Monitoring Report 1
Chapter 1 Executive Summary Since 2005, the Capitol Region Watershed District (CRWD) has been monitoring stormwater quality and quantity from its 41-square mile watershed in Saint Paul, Roseville, Maplewood, Falcon Heights and Lauderdale, which eventually drains to the Mississippi River. The watershed district is highly urbanized with 245,000 residents and at least 42% impervious land cover. CRWD is a special purpose unit of local government established in 1998 whose mission is to protect, manage and improve the water resources of the District. Essential to accomplishing this mission, CRWD has developed and implemented a monitoring program to assess stormwater water quality and quantity in various subwatersheds and the four lakes located within CRWD. Throughout the year in 2010, CRWD collected water quality and flow data from storm sewers, stormwater ponds, and lakes at 16 stormwater sites. Of those 16 sites, ten sites were full monitoring stations where both water quality and flow data were collected. Four major subwatersheds in CRWD; East Kittsondale, Phalen Creek, Saint Anthony Park, and Trout Brook, had full monitoring stations. The other full monitoring stations collected data from portions of two major subwatersheds, Saint Anthony Park and Trout Brook. Como 7, Villa Park, Trout Brook – West Branch, and Trout Brook – East Branch are located within Trout Brook subwatershed while Sarita is located within the Saint Anthony Park subwatershed. Samples were collected during both baseflow (dry weather) and stormflow (wet weather) and were analyzed for a suite of water quality parameters including nutrients, sediment, metals, and bacteria. Of the remaining sites, two were flow-only stations at Como Lake and Lake McCarrons and three were water level recording stations at three stormwater ponds located in the Trout Brook subwatershed and one pond located in the Villa Park subwatershed. Ramsey County Public Works Department (RCPW) monitored water quality of the four lakes in CRWD on a monthly or bi-monthly basis from May through September. The lakes were monitored for a suite of water quality parameters including nutrients, sediment, water clarity, and chlorophyll a. 2010 was a record-breaking year for precipitation based on historical normal rainfall averages (Midwest Climate Center, 2010). Compared to other monitoring years, 2010 had the highest recorded rainfall totals. Five monitoring sites were monitored throughout the entire year and collected an average of 355 days of data each. These five sites were located in three of the four major subwatersheds. Sites not monitored for the entire year collected an average of 205 days of data each. In general, CRWD major subwatersheds had greater flow and higher phosphorus and sediment loads and yields in 2010 than in previous years. Trout Brook subwatershed generated the highest discharge and TP and TSS loads in CRWD with Phalen Creek and St. Anthony Park subwatersheds producing the next highest TP and TSS loads. Most of this pollutant loading occurred during storms rather during dry weather conditions. On a per acre basis, the water export was highest from Phalen Creek subwatershed compared to the other major subwatersheds. Trout Brook subwatershed had the second highest water yield. In terms of pollutant concentrations and yields, East Kittsondale had the highest flow-weighted average TP and TSS

Capitol Region Watershed District 2010 Monitoring Report 2
concentrations of all sites in 2010, but the concentrations were moderate in comparison to other monitoring years. In East Kittsondale, land use and activities produced higher pollutant loading per acre of land and per inch of runoff than other subwatersheds. For the most part, stormwater runoff from CRWD was more polluted for TP and TSS than the Mississippi River and minimally impacted streams in this ecoregion with CRWD monitoring sites having higher flow-weighted average concentrations. While East Kittsondale subwatershed had the highest TP and TSS flow-weighted average concentrations, Trout Brook subwatershed had the lowest flow-weighted concentrations. Besides phosphorus and sediment being pollutants of concern in CRWD, metals and bacteria issues were identified in 2010. During storm events, the average lead and copper concentrations at all monitoring sites except one were higher than the state standards. Average zinc concentrations during storms at five monitoring sites were higher than the state standard. Nearly all samples from every site during storm events in 2010 exceeded the maximum standard for E. coli bacteria with many concentrations much higher than the maximum standard, with the highest being 72,700 mpn/100mL. Conversely, during dry weather, all monitoring sites except East Kittsondale met the maximum standard for E. coli bacteria. However, beginning in late May, all dry weather E. coli samples at East Kittsondale were consistently below the maximum standard. It was at this time that the source of high bacteria concentrations was identified and eliminated by the city of Saint Paul. E. coli concentrations immediately dropped at this time, and no other dry weather bacteria samples have been found to exceed the standard. In comparison to stormwater from other urbanized areas in the country, CRWD had higher median concentrations for numerous pollutants including bacteria, total suspended solids, total phosphorus, total Kjeldahl nitrogen, copper and lead. Median concentrations of ammonia, nitrate+nitrite and cadmium were lower in CRWD than in other urban communities. Because of the extremely wet monitoring season, all four lakes experienced increased total phosphorus and chlorophyll a concentrations, which was especially apparent in Crosby Lake. However, Como Lake was the only lake that did not meet the state eutrophication standard, which is based on total phosphorus and chlorophyll a concentrations and water clarity (Secchi depth). Based on the results and findings of the 2010 monitoring program, CRWD makes several recommendations for 2011. CRWD will continue to document illicit discharges, collect additional water quality data, and work with the City of Saint Paul to eliminate other potential sources of pollution. CRWD will also further investigate the data from the six years of monitoring better identify relationships between portions of the subwatersheds, the variations from year to year, and the differences in discharge and pollutant loading between baseflow and stormflow. CRWD will also begin to identify important portions of unmonitored subwatersheds to consider new long-term monitoring sites.
Capitol Region Watershed District 2010 Monitoring Report 3
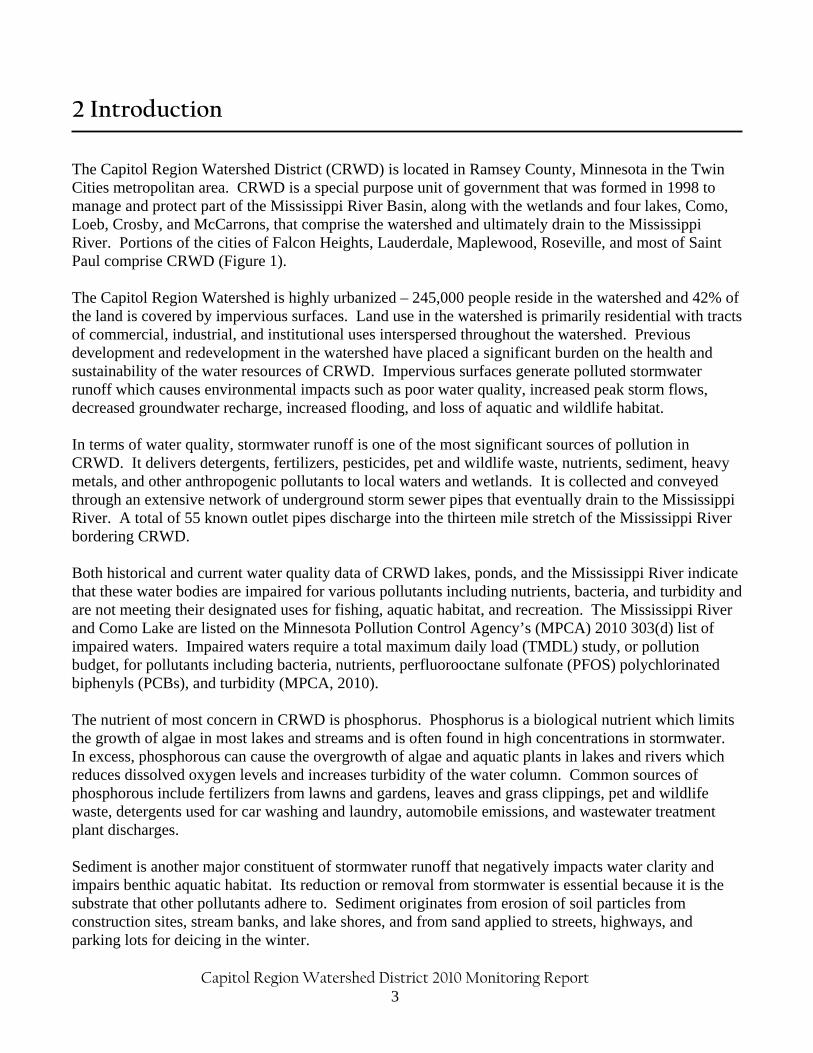
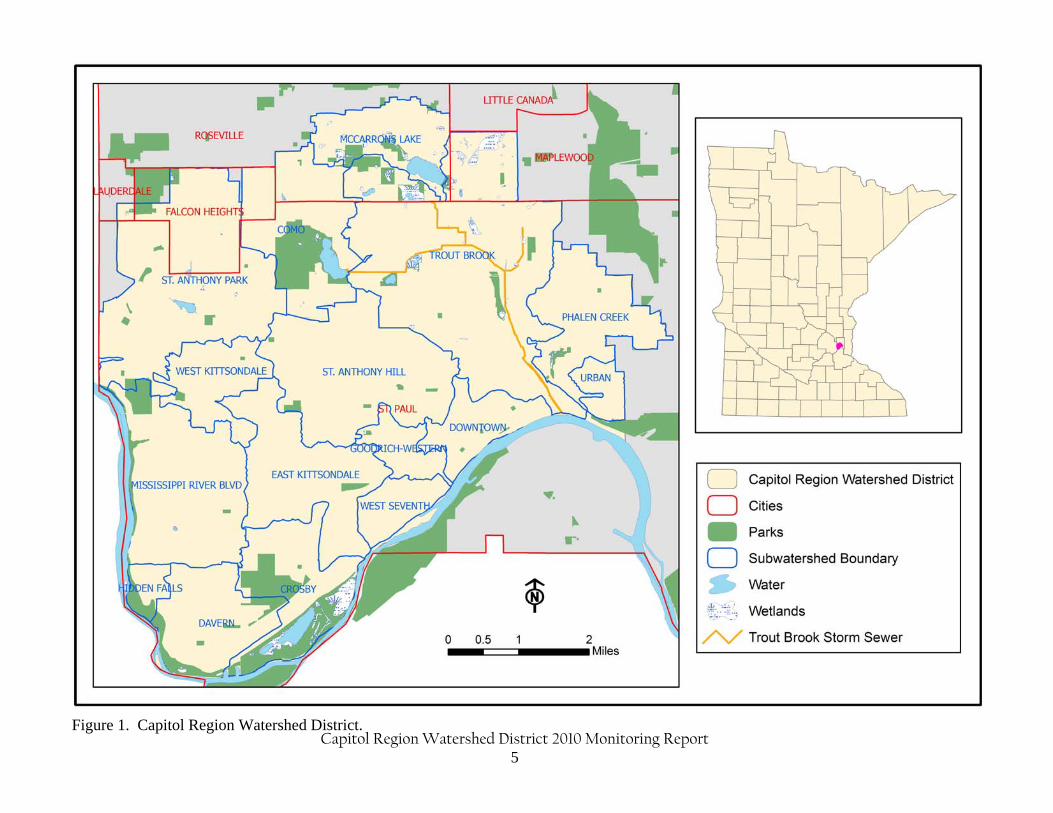
2 Introduction The Capitol Region Watershed District (CRWD) is located in Ramsey County, Minnesota in the Twin Cities metropolitan area. CRWD is a special purpose unit of government that was formed in 1998 to manage and protect part of the Mississippi River Basin, along with the wetlands and four lakes, Como, Loeb, Crosby, and McCarrons, that comprise the watershed and ultimately drain to the Mississippi River. Portions of the cities of Falcon Heights, Lauderdale, Maplewood, Roseville, and most of Saint Paul comprise CRWD (Figure 1). The Capitol Region Watershed is highly urbanized – 245,000 people reside in the watershed and 42% of the land is covered by impervious surfaces. Land use in the watershed is primarily residential with tracts of commercial, industrial, and institutional uses interspersed throughout the watershed. Previous development and redevelopment in the watershed have placed a significant burden on the health and sustainability of the water resources of CRWD. Impervious surfaces generate polluted stormwater runoff which causes environmental impacts such as poor water quality, increased peak storm flows, decreased groundwater recharge, increased flooding, and loss of aquatic and wildlife habitat. In terms of water quality, stormwater runoff is one of the most significant sources of pollution in CRWD. It delivers detergents, fertilizers, pesticides, pet and wildlife waste, nutrients, sediment, heavy metals, and other anthropogenic pollutants to local waters and wetlands. It is collected and conveyed through an extensive network of underground storm sewer pipes that eventually drain to the Mississippi River. A total of 55 known outlet pipes discharge into the thirteen mile stretch of the Mississippi River bordering CRWD. Both historical and current water quality data of CRWD lakes, ponds, and the Mississippi River indicate that these water bodies are impaired for various pollutants including nutrients, bacteria, and turbidity and are not meeting their designated uses for fishing, aquatic habitat, and recreation. The Mississippi River and Como Lake are listed on the Minnesota Pollution Control Agency’s (MPCA) 2010 303(d) list of impaired waters. Impaired waters require a total maximum daily load (TMDL) study, or pollution budget, for pollutants including bacteria, nutrients, perfluorooctane sulfonate (PFOS) polychlorinated biphenyls (PCBs), and turbidity (MPCA, 2010). The nutrient of most concern in CRWD is phosphorus. Phosphorus is a biological nutrient which limits the growth of algae in most lakes and streams and is often found in high concentrations in stormwater. In excess, phosphorous can cause the overgrowth of algae and aquatic plants in lakes and rivers which reduces dissolved oxygen levels and increases turbidity of the water column. Common sources of phosphorous include fertilizers from lawns and gardens, leaves and grass clippings, pet and wildlife waste, detergents used for car washing and laundry, automobile emissions, and wastewater treatment plant discharges. Sediment is another major constituent of stormwater runoff that negatively impacts water clarity and impairs benthic aquatic habitat. Its reduction or removal from stormwater is essential because it is the substrate that other pollutants adhere to. Sediment originates from erosion of soil particles from construction sites, stream banks, and lake shores, and from sand applied to streets, highways, and parking lots for deicing in the winter.
Capitol Region Watershed District 2010 Monitoring Report 4
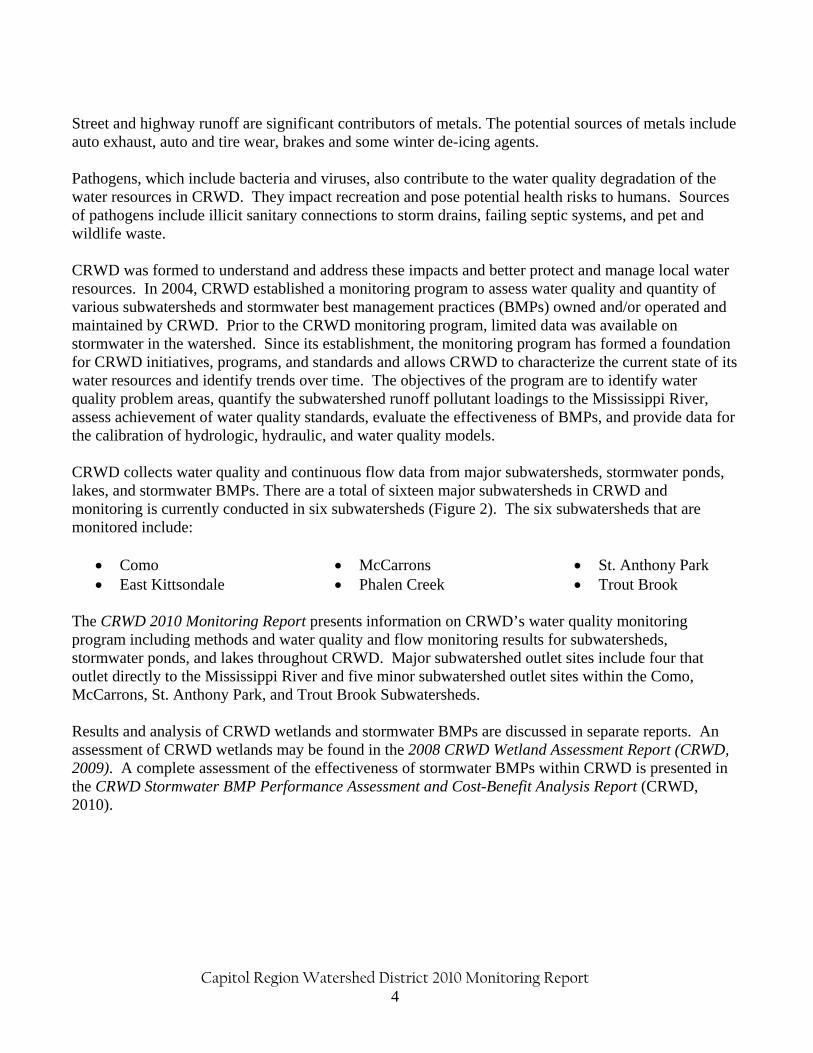
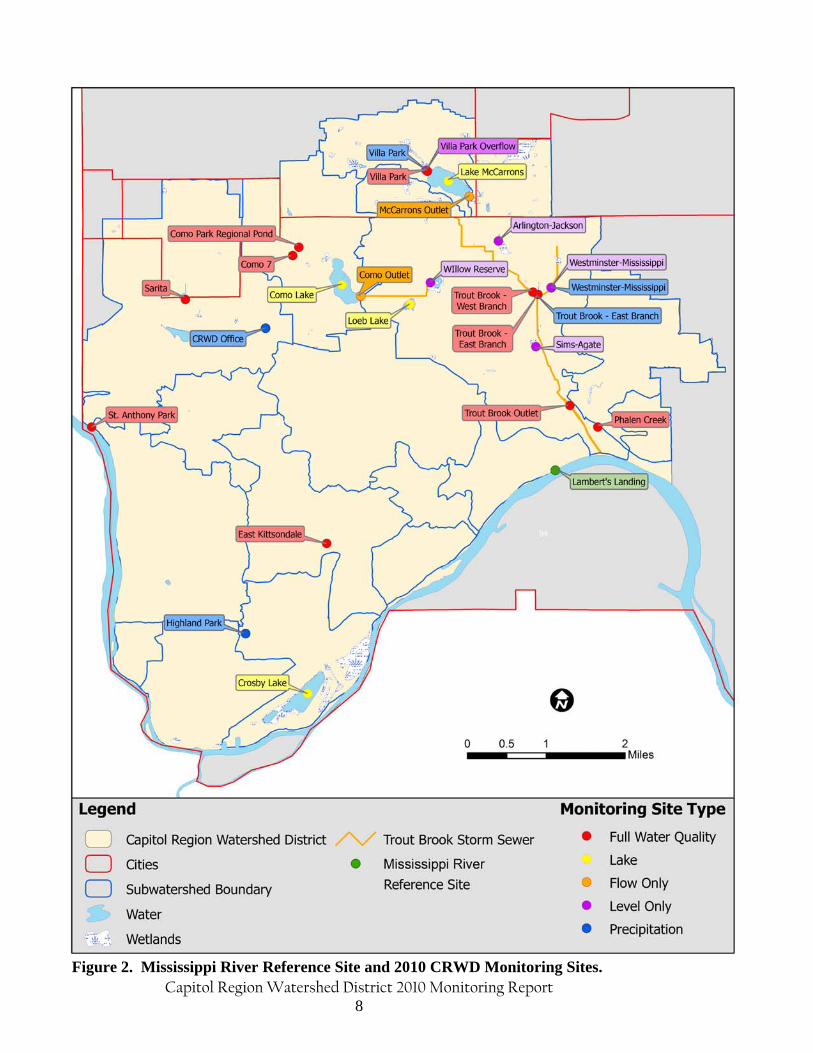
Street and highway runoff are significant contributors of metals. The potential sources of metals include auto exhaust, auto and tire wear, brakes and some winter de-icing agents. Pathogens, which include bacteria and viruses, also contribute to the water quality degradation of the water resources in CRWD. They impact recreation and pose potential health risks to humans. Sources of pathogens include illicit sanitary connections to storm drains, failing septic systems, and pet and wildlife waste. CRWD was formed to understand and address these impacts and better protect and manage local water resources. In 2004, CRWD established a monitoring program to assess water quality and quantity of various subwatersheds and stormwater best management practices (BMPs) owned and/or operated and maintained by CRWD. Prior to the CRWD monitoring program, limited data was available on stormwater in the watershed. Since its establishment, the monitoring program has formed a foundation for CRWD initiatives, programs, and standards and allows CRWD to characterize the current state of its water resources and identify trends over time. The objectives of the program are to identify water quality problem areas, quantify the subwatershed runoff pollutant loadings to the Mississippi River, assess achievement of water quality standards, evaluate the effectiveness of BMPs, and provide data for the calibration of hydrologic, hydraulic, and water quality models. CRWD collects water quality and continuous flow data from major subwatersheds, stormwater ponds, lakes, and stormwater BMPs. There are a total of sixteen major subwatersheds in CRWD and monitoring is currently conducted in six subwatersheds (Figure 2). The six subwatersheds that are monitored include:
Como East Kittsondale
McCarrons Phalen Creek
St. Anthony Park Trout Brook
The CRWD 2010 Monitoring Report presents information on CRWD’s water quality monitoring program including methods and water quality and flow monitoring results for subwatersheds, stormwater ponds, and lakes throughout CRWD. Major subwatershed outlet sites include four that outlet directly to the Mississippi River and five minor subwatershed outlet sites within the Como, McCarrons, St. Anthony Park, and Trout Brook Subwatersheds. Results and analysis of CRWD wetlands and stormwater BMPs are discussed in separate reports. An assessment of CRWD wetlands may be found in the 2008 CRWD Wetland Assessment Report (CRWD, 2009). A complete assessment of the effectiveness of stormwater BMPs within CRWD is presented in the CRWD Stormwater BMP Performance Assessment and Cost-Benefit Analysis Report (CRWD, 2010).
Capitol Region Watershed District 2010 Monitoring Report 5
Figure 1. Capitol Region Watershed District.

Capitol Region Watershed District 2010 Monitoring Report 6

Capitol Region Watershed District 2010 Monitoring Report 7
3 Stormwater Monitoring 3a Monitoring Locations In 2010, CRWD collected water quality and quantity data at sixteen stormwater sites in the District: ten full water quality stations, two flow-only stations, and four level logger sites (Figure 2). Also, six precipitation stations collected rainfall data across the watershed. The ten full water quality stations were located at:
1) Upper watershed of the St. Anthony Park subwatershed as it drains through the Sarita Wetland (Sarita),
2) St. Anthony Park subwatershed (St. Anthony Park), 3) East Kittsondale subwatershed (East Kittsondale), 4) Phalen Creek subwatershed (Phalen Creek), 5) Como 7 subwatershed, two stations located in the upper Como subwatershed 6) East Branch of the Trout Brook Storm Sewer Interceptor (Trout Brook – East Branch), 7) West Branch of the Trout Brook Storm Sewer Interceptor (Trout Brook – West Branch), 8) Outlet of the Trout Brook Storm Sewer Interceptor (Trout Brook Outlet) 9) Villa Park Wetland outlet, located in the western watershed of the Lake McCarrons subwatershed
(Villa Park) (Figure 1). Four of the full water quality stations (2, 3, 4, and 8) are positioned at or near the outlets of subwatersheds which drain directly to the Mississippi River. The remaining five full water quality stations are minor subwatersheds located within the Como, Lake McCarrons, St. Anthony Park, and Trout Brook Subwatersheds. Two flow-only stations are operated at the outlets of Como Lake and Lake McCarrons to determine the amount of discharge from the lakes into the Trout Brook Storm Sewer Interceptor. A flow-only station is also operated at the emergency overflow structure for the Villa Park Wetland. Level logger stations are also operated at three of five storm ponds in the Trout Brook subwatershed and the data is used to calibrate and update models for the Trout Brook Storm Sewer Interceptor. The storm ponds monitored are Arlington-Jackson, Sims-Agate, and Westminster-Mississippi (Figure 2). The Arlington-Arkwright and Willow Reserve storm ponds were not monitored. Six precipitation gauges were placed throughout the watershed. There are located at Highland Park, the CRWD office, the Villa Park site, Saint Paul Fire Station No. 1, the Trout Brook - East Branch monitoring site, and at the Westminster-Mississippi storm pond (Figure 2). CRWD also obtains precipitation data reported by the University of Minnesota Climatological Observatory and the National Weather Service.
Capitol Region Watershed District 2010 Monitoring Report 8
Figure 2. Mississippi River Reference Site and 2010 CRWD Monitoring Sites.
Capitol Region Watershed District 2010 Monitoring Report 9
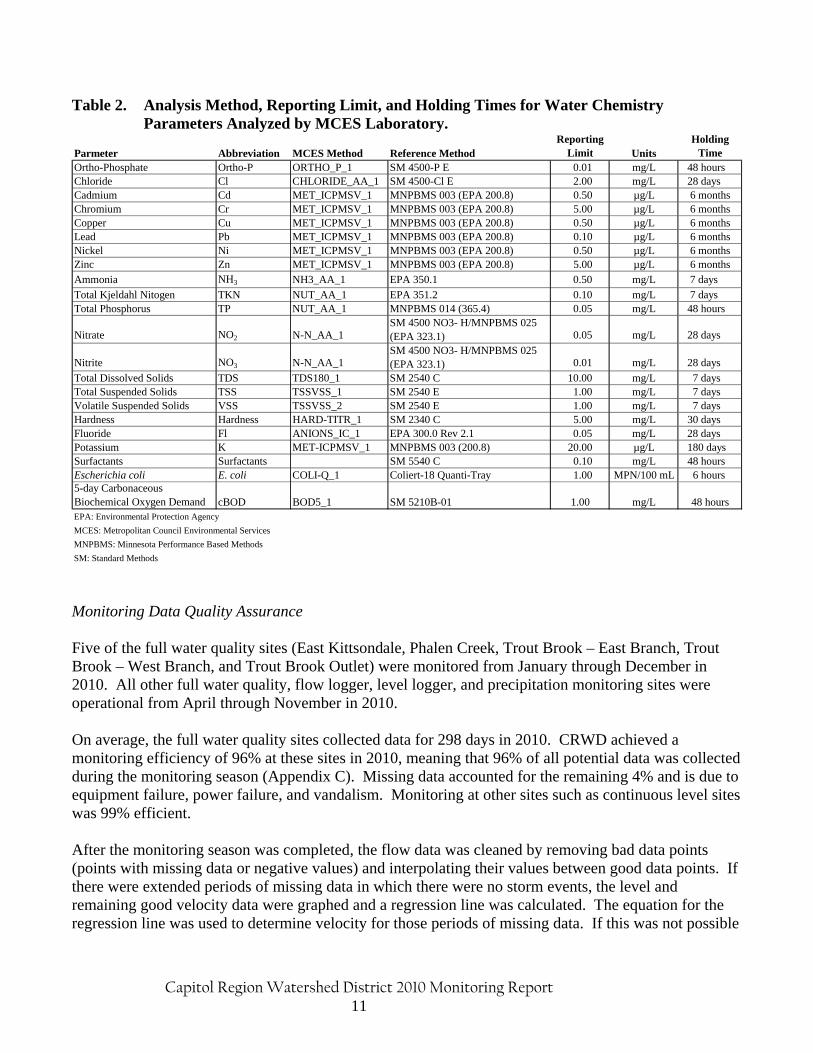
3b Monitoring and Analysis Methods Data Collection Methods Full water quality stations consisted of an area-velocity sensor and an automated water sampler. Area-velocity sensors measured and recorded water depth and velocity every 10 minutes. This data was used to calculate discharge or flow at the site. When the water reaches a specified depth or velocity, the sampler was enabled to collect water samples. A sample was collected after a specified volume of water passed through the site in order to collect samples over the entire hydrograph. This provides a better representation of stormwater quality throughout the entirety of a storm or base flow event rather than taking a single grab sample. These individual samples are combined to produce a single composite sample. Depending on the sampler size (compact or full), the sampler can take up to 48 (for a compact sampler) or 96 (for a full size sampler) discrete samples during an event. Water quality samples were collected during storm events at the nine full water quality sites. With the exception of Sarita, sites also have constant baseflow or other flow during dry weather periods. Composite samples of this dry weather flow were also taken at these sites twice a month from April through October. During the winter, monthly grab samples were taken at all of the full water quality sites except for the Como 7 and Sarita sites. Bacteria grab samples were taken at all sites, time and weather permitting, during storm events. At the eight sites with baseflow, samples were collected twice a month during dry weather from April through October and monthly during the winter. After sample collection, water quality samples were delivered to the Metropolitan Council Environmental Services (MCES) Laboratory for analysis. The chemical parameters, method of analysis, and holding times are listed in Table 2. If the lab analysis occurred after the holding time of a given chemical parameter had expired, that chemical parameter was not analyzed. Water samples for Escherichia coli (E. coli) were grab samples collected directly into sterilized containers during storm events and dry weather flow. Carbonaceous biochemical oxygen demand (cBOD) was also analyzed in water quality samples collected at the four subwatershed outlet sites (East Kittsondale, Phalen Creek, St. Anthony Park, and Trout Brook Outlet) during storm events and dry weather flow. The two flow-only stations positioned at the outlets of Como Lake and Lake McCarrons use two different methods to collect and determine discharge data. Flow at the outlet of Como Lake is regulated by a wooden weir in a manhole. A level sensor is placed on the upstream side of the weir and when the level recorded exceeds the distance between the sensor and the weir, it indicates that the structure is experiencing outflow. The volume was then calculated based on the dimensions of the weir and the periods of recorded outflow. At the Lake McCarrons outlet, an area-velocity sensor connected to a data logger collects and records water depth and velocity every ten minutes. This data was used to calculate discharge at the site. Level logger stations were operated at three storm ponds within the Trout Brook subwatershed (Figure 2, Table 1). These data are used to track pond level in relationship to precipitation and are also used to
Capitol Region Watershed District 2010 Monitoring Report 10
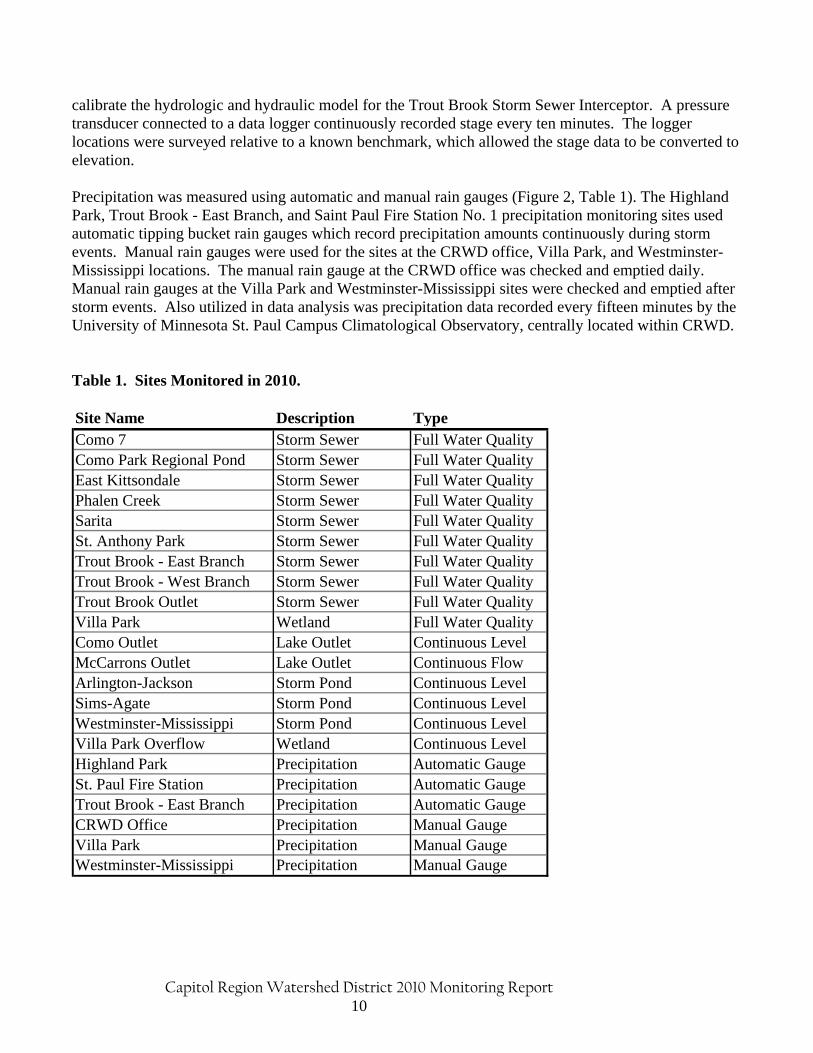
calibrate the hydrologic and hydraulic model for the Trout Brook Storm Sewer Interceptor. A pressure transducer connected to a data logger continuously recorded stage every ten minutes. The logger locations were surveyed relative to a known benchmark, which allowed the stage data to be converted to elevation. Precipitation was measured using automatic and manual rain gauges (Figure 2, Table 1). The Highland Park, Trout Brook - East Branch, and Saint Paul Fire Station No. 1 precipitation monitoring sites used automatic tipping bucket rain gauges which record precipitation amounts continuously during storm events. Manual rain gauges were used for the sites at the CRWD office, Villa Park, and Westminster-Mississippi locations. The manual rain gauge at the CRWD office was checked and emptied daily. Manual rain gauges at the Villa Park and Westminster-Mississippi sites were checked and emptied after storm events. Also utilized in data analysis was precipitation data recorded every fifteen minutes by the University of Minnesota St. Paul Campus Climatological Observatory, centrally located within CRWD. Table 1. Sites Monitored in 2010. Site Name Description TypeComo 7 Storm Sewer Full Water QualityComo Park Regional Pond Storm Sewer Full Water QualityEast Kittsondale Storm Sewer Full Water QualityPhalen Creek Storm Sewer Full Water QualitySarita Storm Sewer Full Water QualitySt. Anthony Park Storm Sewer Full Water QualityTrout Brook - East Branch Storm Sewer Full Water QualityTrout Brook - West Branch Storm Sewer Full Water QualityTrout Brook Outlet Storm Sewer Full Water QualityVilla Park Wetland Full Water QualityComo Outlet Lake Outlet Continuous LevelMcCarrons Outlet Lake Outlet Continuous FlowArlington-Jackson Storm Pond Continuous LevelSims-Agate Storm Pond Continuous LevelWestminster-Mississippi Storm Pond Continuous LevelVilla Park Overflow Wetland Continuous LevelHighland Park Precipitation Automatic GaugeSt. Paul Fire Station Precipitation Automatic GaugeTrout Brook - East Branch Precipitation Automatic GaugeCRWD Office Precipitation Manual GaugeVilla Park Precipitation Manual GaugeWestminster-Mississippi Precipitation Manual Gauge
Capitol Region Watershed District 2010 Monitoring Report 11
Table 2. Analysis Method, Reporting Limit, and Holding Times for Water Chemistry Parameters Analyzed by MCES Laboratory.
Parmeter Abbreviation MCES Method Reference MethodReporting
Limit UnitsHolding
TimeOrtho-Phosphate Ortho-P ORTHO_P_1 SM 4500-P E 0.01 mg/L 48 hoursChloride Cl CHLORIDE_AA_1 SM 4500-Cl E 2.00 mg/L 28 days Cadmium Cd MET_ICPMSV_1 MNPBMS 003 (EPA 200.8) 0.50 µg/L 6 monthsChromium Cr MET_ICPMSV_1 MNPBMS 003 (EPA 200.8) 5.00 µg/L 6 monthsCopper Cu MET_ICPMSV_1 MNPBMS 003 (EPA 200.8) 0.50 µg/L 6 monthsLead Pb MET_ICPMSV_1 MNPBMS 003 (EPA 200.8) 0.10 µg/L 6 monthsNickel Ni MET_ICPMSV_1 MNPBMS 003 (EPA 200.8) 0.50 µg/L 6 monthsZinc Zn MET_ICPMSV_1 MNPBMS 003 (EPA 200.8) 5.00 µg/L 6 monthsAmmonia NH3 NH3_AA_1 EPA 350.1 0.50 mg/L 7 days
Total Kjeldahl Nitogen TKN NUT_AA_1 EPA 351.2 0.10 mg/L 7 daysTotal Phosphorus TP NUT_AA_1 MNPBMS 014 (365.4) 0.05 mg/L 48 hours
Nitrate NO2 N-N_AA_1SM 4500 NO3- H/MNPBMS 025 (EPA 323.1) 0.05 mg/L 28 days
Nitrite NO3 N-N_AA_1SM 4500 NO3- H/MNPBMS 025 (EPA 323.1) 0.01 mg/L 28 days
Total Dissolved Solids TDS TDS180_1 SM 2540 C 10.00 mg/L 7 daysTotal Suspended Solids TSS TSSVSS_1 SM 2540 E 1.00 mg/L 7 daysVolatile Suspended Solids VSS TSSVSS_2 SM 2540 E 1.00 mg/L 7 daysHardness Hardness HARD-TITR_1 SM 2340 C 5.00 mg/L 30 daysFluoride Fl ANIONS_IC_1 EPA 300.0 Rev 2.1 0.05 mg/L 28 daysPotassium K MET-ICPMSV_1 MNPBMS 003 (200.8) 20.00 µg/L 180 daysSurfactants Surfactants SM 5540 C 0.10 mg/L 48 hoursEscherichia coli E. coli COLI-Q_1 Coliert-18 Quanti-Tray 1.00 MPN/100 mL 6 hours5-day Carbonaceous Biochemical Oxygen Demand cBOD BOD5_1 SM 5210B-01 1.00 mg/L 48 hoursEPA: Environmental Protection Agency
MCES: Metropolitan Council Environmental Services
MNPBMS: Minnesota Performance Based Methods
SM: Standard Methods Monitoring Data Quality Assurance Five of the full water quality sites (East Kittsondale, Phalen Creek, Trout Brook – East Branch, Trout Brook – West Branch, and Trout Brook Outlet) were monitored from January through December in 2010. All other full water quality, flow logger, level logger, and precipitation monitoring sites were operational from April through November in 2010. On average, the full water quality sites collected data for 298 days in 2010. CRWD achieved a monitoring efficiency of 96% at these sites in 2010, meaning that 96% of all potential data was collected during the monitoring season (Appendix C). Missing data accounted for the remaining 4% and is due to equipment failure, power failure, and vandalism. Monitoring at other sites such as continuous level sites was 99% efficient. After the monitoring season was completed, the flow data was cleaned by removing bad data points (points with missing data or negative values) and interpolating their values between good data points. If there were extended periods of missing data in which there were no storm events, the level and remaining good velocity data were graphed and a regression line was calculated. The equation for the regression line was used to determine velocity for those periods of missing data. If this was not possible
Capitol Region Watershed District 2010 Monitoring Report 12
or there were storm events during this time, the data was left as missing. CRWD checked the lab data for quality and suspect erroneous and outlier parameter values were flagged. Total Discharge and Pollutant Load Calculations For all full water quality monitoring sites, total discharge, total phosphorus (TP), and total suspended solids (TSS) loads were calculated from stage, flow, and water quality data. Discharge and pollutant loads were calculated for each base, storm, and illicit discharge at every site as well as total discharge and loads for the entire monitoring season. The majority of monitoring season totals does not reflect total annual discharges and loads as additional flow and pollutant loading does occur during unmonitored months. At some locations monitoring equipment cannot be operated during the winter months as monitoring equipment may be damaged by freezing temperatures and ice formation. Total discharge and pollutant loads for the Como 7 subwatershed includes data from the Como 7 monitoring site as well as the outlet for the Como Park Regional Pond. Outflow from the pond discharges into the storm sewer just downstream of the Como 7 monitoring site. Analysis of the combined Como 7 and Como Park Regional Pond Outlet site data was done in accordance as all other full water quality monitoring sites. Total discharge and pollutant loads for Villa Park also takes into account any discharge flowing through an emergency overflow near the outlet of the wetland system. Total Flow and Pollutant Load Calculations Total discharge for each event was calculated using Isco Flowlink® software. The time interval was determined for each event. Discharge for every 10 minute time interval across the event was summed to produce a single total discharge for that particular event. Total TP and TSS loads were calculated for each interval using the following equation:
Pollutant Load (lbs) = (Interval Q) * (Pollutant EMC (mg/L)) *
28.316 (L/cf) * 1 (lb) / 453,592 (mg)
Where Q = discharge (cf) EMC = Event Mean Concentration (mg/L)
Total discharge and pollutant load subtotals were calculated for each event type (i.e. base, storm, illicit discharge, and other) for the entire monitoring season. Event discharge and TP and TSS loads for each event type were summed to produce total discharge and pollutant loads for the monitoring season.
Flow Weighted Average (FWA) Concentration Calculations TP and TSS event concentrations were used to calculate TP and TSS loads for the corresponding sampled event interval. For those event intervals in which samples were not collected, an average concentration for TP or TSS was applied. The average concentration is the average of all samples
Capitol Region Watershed District 2010 Monitoring Report 13
collected, unless otherwise noted in the lab tables for each monitoring site, for a given event type (i.e. storm, base, illicit discharge, or other flow event) for the entire monitoring season. Flow weighted averages (FWA) for TP and TSS were also calculated for each flow type for the entire monitoring season (i.e. storm flow-weighted average TP/TSS concentration) as well as for all interval types for the entire monitoring season (total flow weighted average). FWA concentrations take into account the differences between base and stormflow, as pollutant concentrations tend to be higher during storm events. However, storm events generally account for less of the total discharge. FWA concentrations for TP and TSS for each flow type were calculated using the following equation:
Flow Type (Base, Storm, Illicit Discharge) FWA TP or TSS (mg/L) = (Interval TP or TSS Load (lbs) * 453,592 (mg/lb)) / (Interval Discharge (cf) * 28.32 (L/cf))
Total FWAs for TP and TSS for the entire monitoring season were calculated using the following equation:
FWA TP or TSS (mg/L) =
(Total TP or TSS Load (lbs) * 453,592 (mg/lb)) / (Total Discharge (cf) */ 28.32 (L/cf))
Pollutant Yield and Normalized Pollutant Yield Calculations To make useful and valid comparisons of stormwater monitoring data between full water quality monitoring sites and between years, the data was normalized to eliminate the influence of subwatershed size and annual precipitation. Yields for total discharge and total TP and TSS loads for each full water quality monitoring site were calculated. This allows for site-by-site comparisons of the monitoring data by removing the influence of drainage area. Water yields were calculated using the following equation:
Water Yield (cf/ac) = Total Discharge (cf) / Subwatershed Area (ac)
Pollutant yields for TP and TSS were calculated using the following equation:
TP or TSS Yield (lbs/ac) = Total TP or TSS Load (lbs) / Subwatershed Area (ac)
The total TP and TSS load data was also normalized to account for temporal and spatial differences in precipitation. By removing the influence of year-to-year variation in precipitation, trends of pollutants loads are more easily recognizable. Normalized pollutant yields were calculated in two steps. First, inches of runoff was calculated for each full water quality monitoring site. The amount of runoff was calculated using the following equation:
Runoff (in) = (Water Yield (cf/ac) / (1 ac / 43,560 ft²)) * (12 in / 1 ft) Next the normalized TP and TSS yield was calculated. Normalized TP and TSS yields were calculated using the following equation:

Capitol Region Watershed District 2010 Monitoring Report 14
Normalized TP or TSS Yield (lbs/ac/in) =
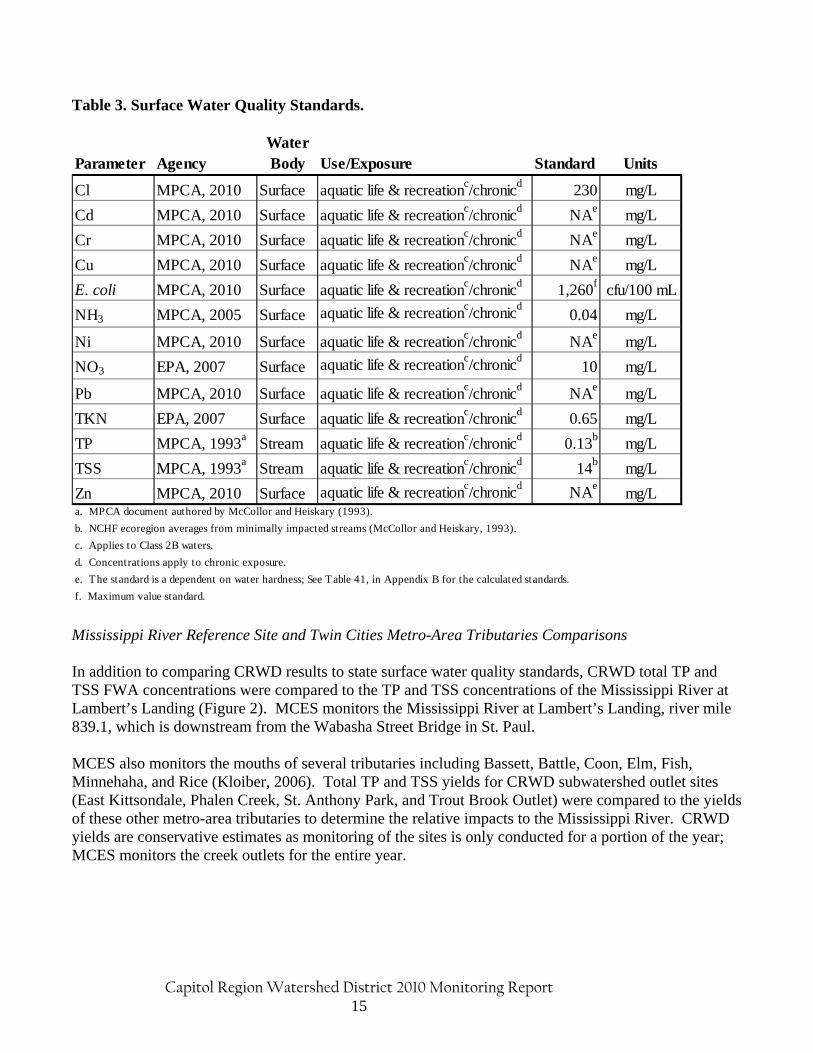
(Total TP or TSS Load (lbs) / Subwatershed Area (ac)) / Runoff (in) Federal and State Surface Water Quality Standards Comparison There are no federal or state water quality standards for stormwater. The Minnesota Pollution Control Agency (MPCA) and the U.S. Environmental Protection Agency (EPA) have established surface water quality standards for only certain water quality parameters. Regardless, since CRWD’s stormwater flows into the Mississippi River, it is useful to compare the stormwater data to surface water quality standards, which serve as a benchmark to consider for each pollutant (Table 3). TP and TSS Standards Because the MPCA has not established stream standards for TSS and TP, the data was compared to the average TP and TSS values in minimally impacted streams in the North Central Hardwoods Forest (NCHF) ecoregion (McCollor and Heiskary, 1993). The standards used are listed in Table 3. When comparing CRWD TP and TSS concentrations to water quality standards, FWA concentrations were used. Chronic Metals Standards State water quality standards for chronic exposure to metals, are based on a function of hardness as outlined in Minnesota Rule 7050.0222 for Class 2B waters. Class 2B waters are waters used for the purpose of aquatic life and recreation that are not protected for drinking water. These standards are set at the lowest concentration of a chemical for which chronic exposure will cause harm to aquatic organisms. In order to make comparisons between CRWD metals data to state standards and other reference locations, calculation of the state standards was completed. Bacteria Standard For E. coli bacteria, the following standard applies: no less than five samples taken during one of those months shall exceed a geometric mean of 126 cfu/100mL; no more than ten percent of all samples taken during one of those calendar months shall exceed 1,260 cfu/100mL. The E. coli bacteria standard only applies during the months of April through November. Because CRWD collects a limited number of samples each month (one or two samples) and typically cannot meet the full monitoring requirements of the E. coli standard, CRWD compares individual E. coli monitoring results to the maximum value of the standard, 1,260 cfu/100mL. This comparison provides a benchmark only for comparing CRWD bacteria data and does not imply whether or not the full bacteria standard is being met. The MCES lab measures E. coli as the most probable number per 100 milliliters of water (mpn/100mL). Research shows that mpn/100mL is comparable to cfu/100mL (Massa et al., 2001).
Capitol Region Watershed District 2010 Monitoring Report 15
Table 3. Surface Water Quality Standards.
Parameter AgencyWater Body Use/Exposure Standard Units
Cl MPCA, 2010 Surface aquatic life & recreationc/chronicd 230 mg/L
Cd MPCA, 2010 Surface aquatic life & recreationc/chronicd NAe mg/L
Cr MPCA, 2010 Surface aquatic life & recreationc/chronicd NAe mg/L
Cu MPCA, 2010 Surface aquatic life & recreationc/chronicd NAe mg/L
E. coli MPCA, 2010 Surface aquatic life & recreationc/chronicd 1,260f cfu/100 mL
NH3 MPCA, 2005 Surface aquatic life & recreationc/chronicd 0.04 mg/L
Ni MPCA, 2010 Surface aquatic life & recreationc/chronicd NAe mg/L
NO3 EPA, 2007 Surface aquatic life & recreationc/chronicd 10 mg/L
Pb MPCA, 2010 Surface aquatic life & recreationc/chronicd NAe mg/L
TKN EPA, 2007 Surface aquatic life & recreationc/chronicd 0.65 mg/L
TP MPCA, 1993a Stream aquatic life & recreationc/chronicd 0.13b mg/L
TSS MPCA, 1993a Stream aquatic life & recreationc/chronicd 14b mg/L
Zn MPCA, 2010 Surface aquatic life & recreationc/chronicd NAemg/L
e. The standard is a dependent on water hardness; See Table 41, in Appendix B for the calculated standards.
f. Maximum value standard.
b. NCHF ecoregion averages from minimally impacted streams (McCollor and Heiskary, 1993).
a. MPCA document authored by McCollor and Heiskary (1993).
c. Applies to Class 2B waters.
d. Concentrations apply to chronic exposure.
Mississippi River Reference Site and Twin Cities Metro-Area Tributaries Comparisons In addition to comparing CRWD results to state surface water quality standards, CRWD total TP and TSS FWA concentrations were compared to the TP and TSS concentrations of the Mississippi River at Lambert’s Landing (Figure 2). MCES monitors the Mississippi River at Lambert’s Landing, river mile 839.1, which is downstream from the Wabasha Street Bridge in St. Paul. MCES also monitors the mouths of several tributaries including Bassett, Battle, Coon, Elm, Fish, Minnehaha, and Rice (Kloiber, 2006). Total TP and TSS yields for CRWD subwatershed outlet sites (East Kittsondale, Phalen Creek, St. Anthony Park, and Trout Brook Outlet) were compared to the yields of these other metro-area tributaries to determine the relative impacts to the Mississippi River. CRWD yields are conservative estimates as monitoring of the sites is only conducted for a portion of the year; MCES monitors the creek outlets for the entire year.
Capitol Region Watershed District 2010 Monitoring Report 16
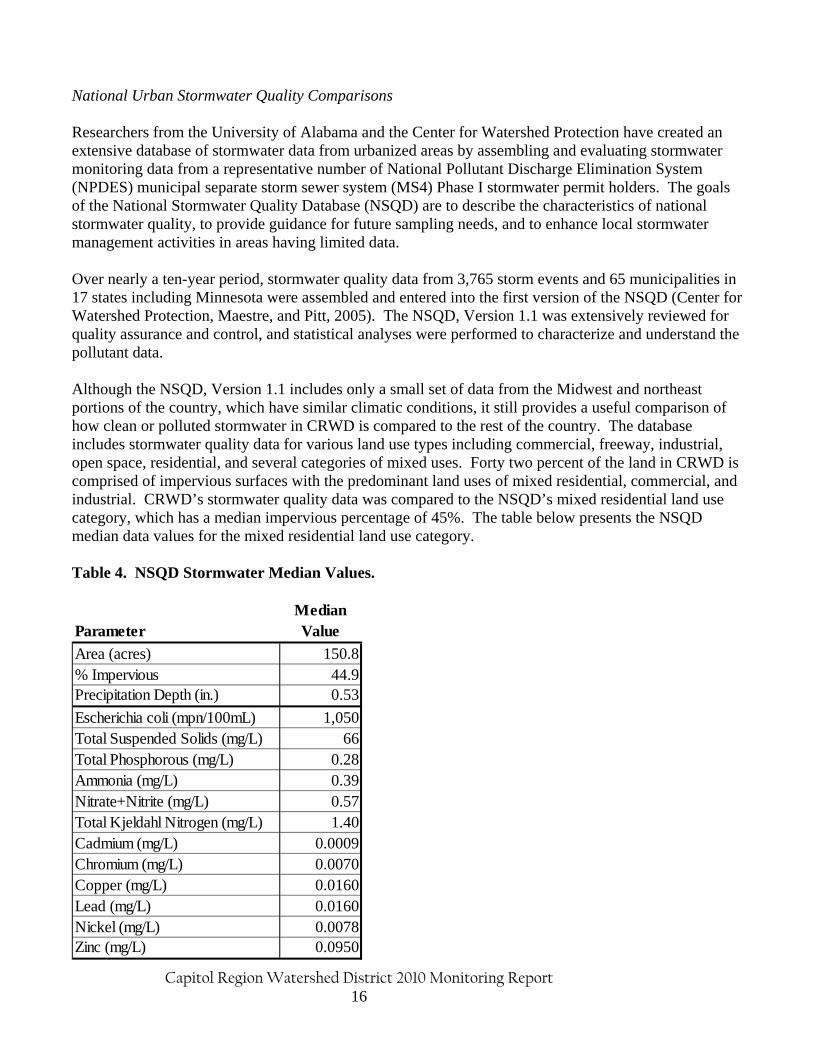
National Urban Stormwater Quality Comparisons Researchers from the University of Alabama and the Center for Watershed Protection have created an extensive database of stormwater data from urbanized areas by assembling and evaluating stormwater monitoring data from a representative number of National Pollutant Discharge Elimination System (NPDES) municipal separate storm sewer system (MS4) Phase I stormwater permit holders. The goals of the National Stormwater Quality Database (NSQD) are to describe the characteristics of national stormwater quality, to provide guidance for future sampling needs, and to enhance local stormwater management activities in areas having limited data. Over nearly a ten-year period, stormwater quality data from 3,765 storm events and 65 municipalities in 17 states including Minnesota were assembled and entered into the first version of the NSQD (Center for Watershed Protection, Maestre, and Pitt, 2005). The NSQD, Version 1.1 was extensively reviewed for quality assurance and control, and statistical analyses were performed to characterize and understand the pollutant data. Although the NSQD, Version 1.1 includes only a small set of data from the Midwest and northeast portions of the country, which have similar climatic conditions, it still provides a useful comparison of how clean or polluted stormwater in CRWD is compared to the rest of the country. The database includes stormwater quality data for various land use types including commercial, freeway, industrial, open space, residential, and several categories of mixed uses. Forty two percent of the land in CRWD is comprised of impervious surfaces with the predominant land uses of mixed residential, commercial, and industrial. CRWD’s stormwater quality data was compared to the NSQD’s mixed residential land use category, which has a median impervious percentage of 45%. The table below presents the NSQD median data values for the mixed residential land use category. Table 4. NSQD Stormwater Median Values.
ParameterMedian Value
Area (acres) 150.8% Impervious 44.9Precipitation Depth (in.) 0.53
Escherichia coli (mpn/100mL) 1,050Total Suspended Solids (mg/L) 66Total Phosphorous (mg/L) 0.28Ammonia (mg/L) 0.39Nitrate+Nitrite (mg/L) 0.57Total Kjeldahl Nitrogen (mg/L) 1.40Cadmium (mg/L) 0.0009Chromium (mg/L) 0.0070Copper (mg/L) 0.0160Lead (mg/L) 0.0160Nickel (mg/L) 0.0078Zinc (mg/L) 0.0950
Capitol Region Watershed District 2010 Monitoring Report 17
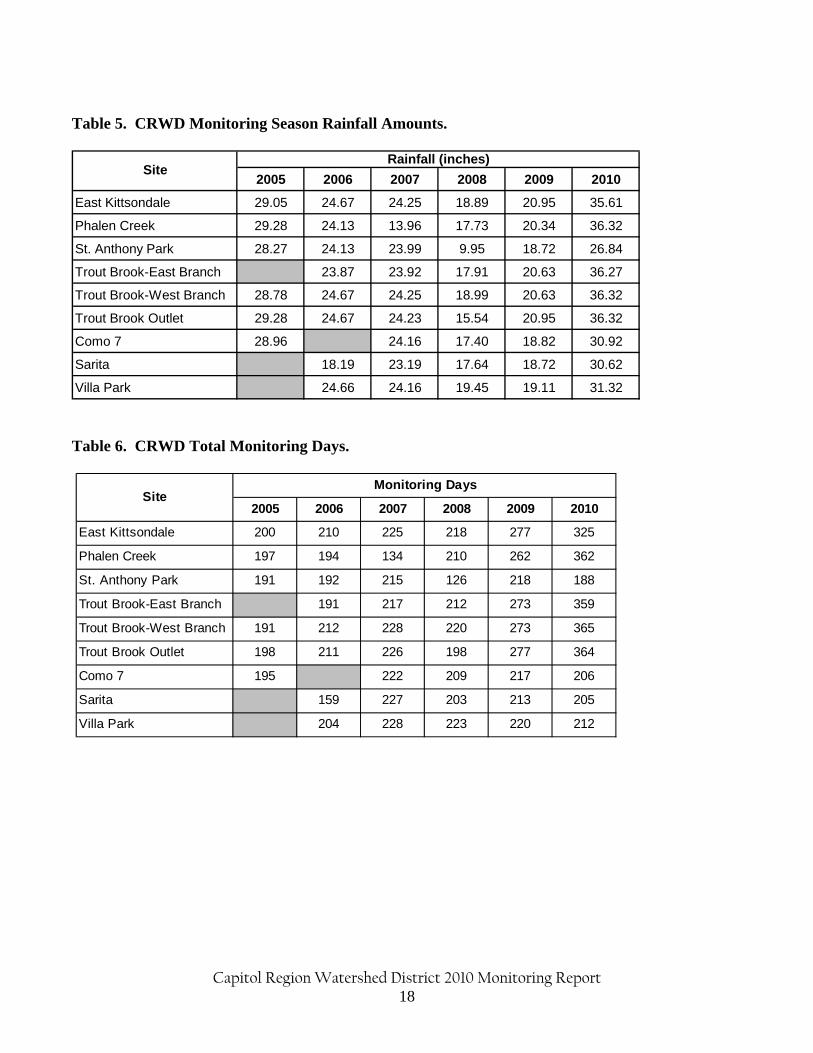
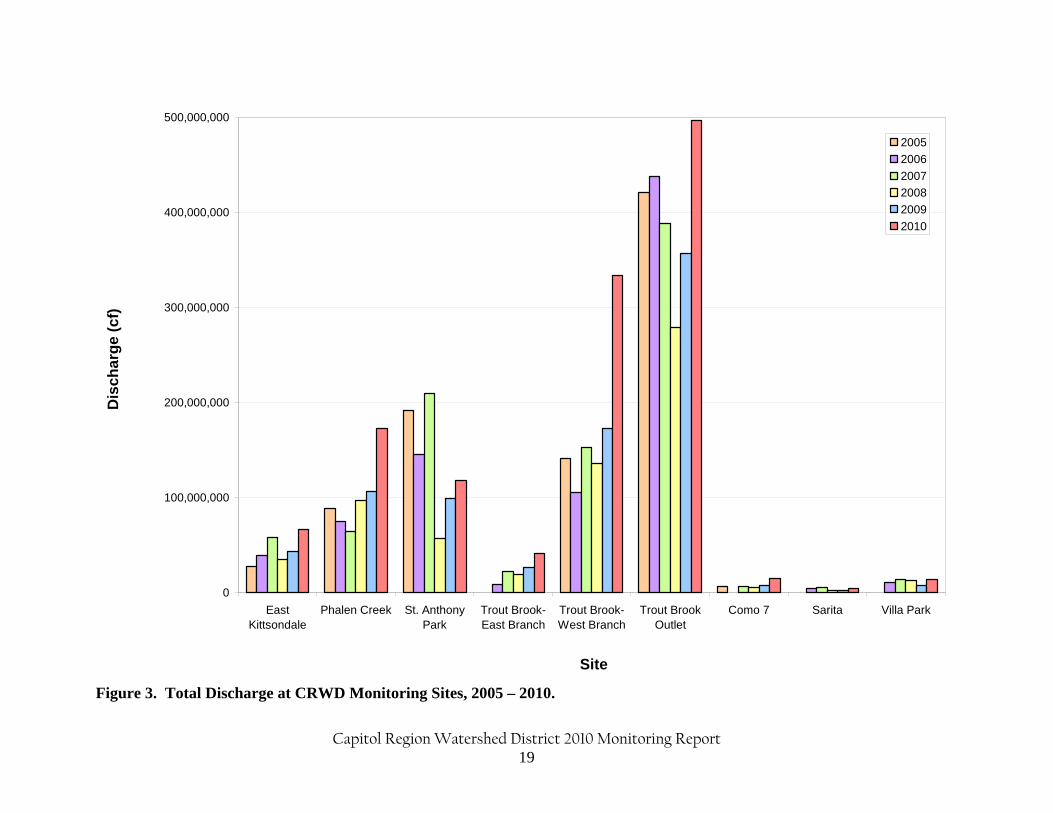
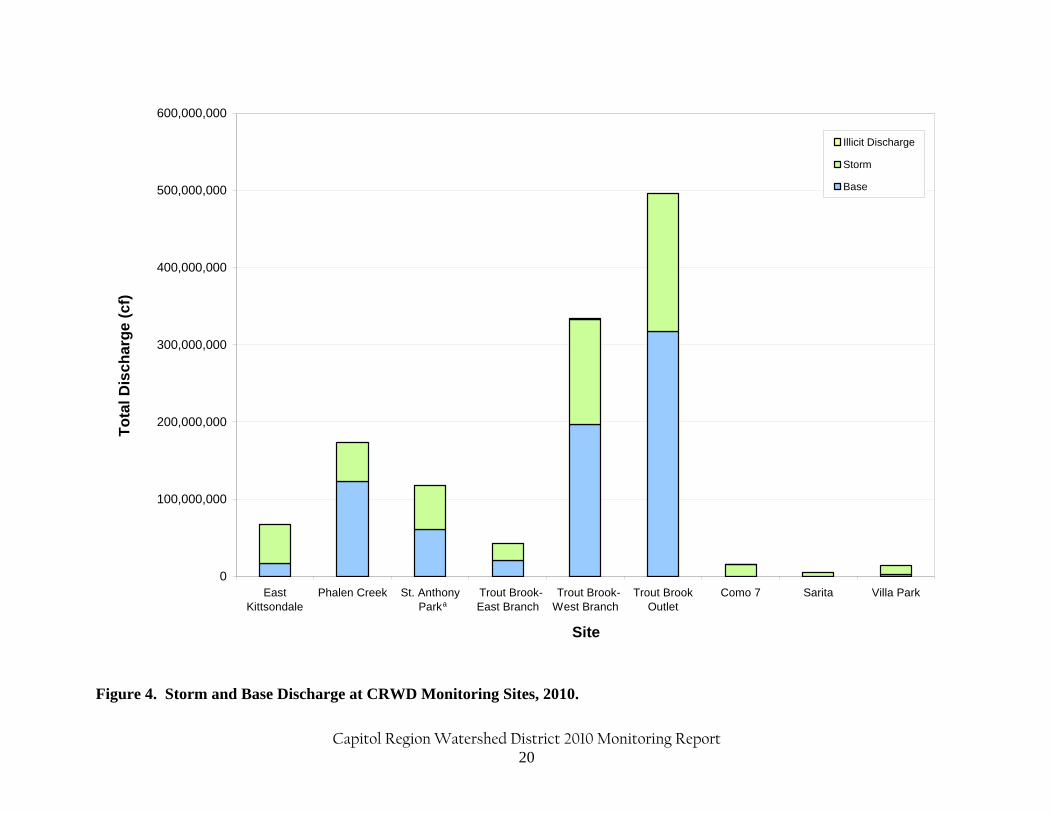
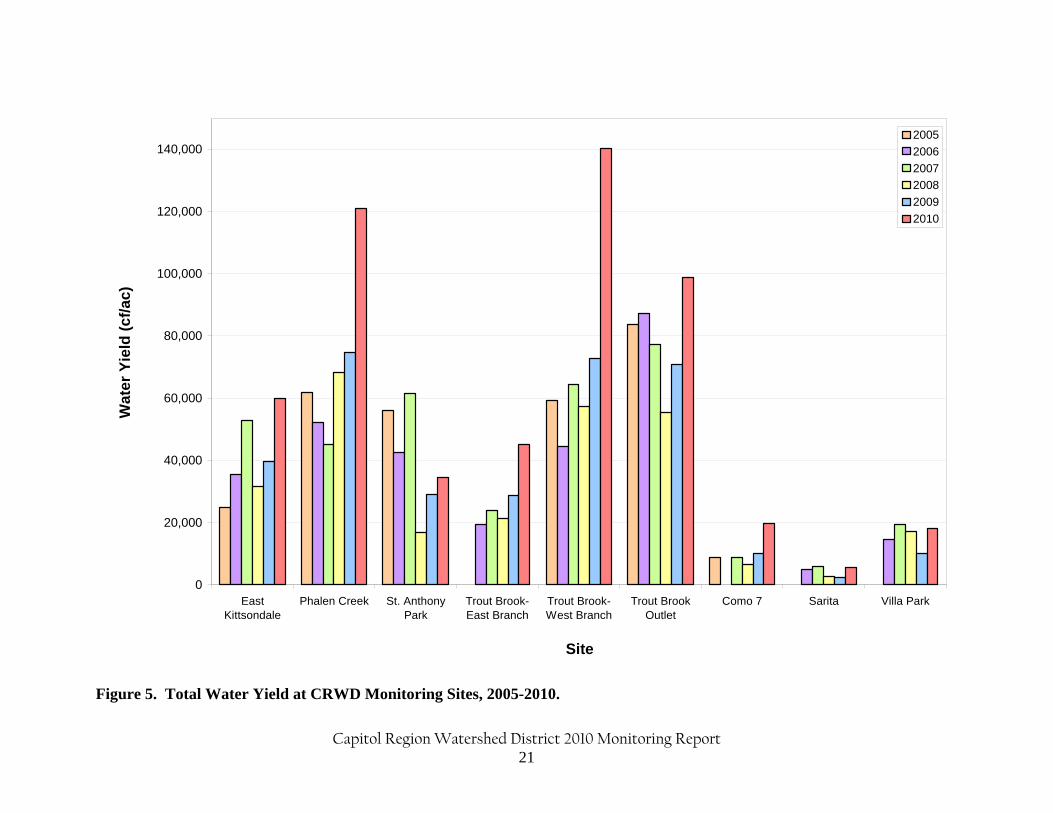
3c Summary of Results Precipitation totals measured in Capitol Region Watershed District were above-average in 2010, based on 30-year normal averages (NWS, 2010). The months of June and August had the most rain. January and February were the driest of months in 2010. Total measured rainfall amounts were similar among all of the sites and were higher for sites monitored throughout the year. (Table 5). In general, CRWD stormwater monitoring sites had greater flow and greater total phosphorus (TP) and total suspended solids (TSS) loads than other years. This can be attributed to a longer monitoring period at most sites and a greater amount of runoff. The highest total TP and TSS loads were generated from the Trout Brook Outlet subwatershed with Trout Brook-West Branch and Phalen Creek having the second and third highest pollutant loads. Trout Brook-West Branch generated the highest TP yield (lbs/ac), and had the second highest TSS yield behind the Phalen Creek subwatershed. The normalized pollutant yields (lbs/ac/ inch of runoff) for both TP and TSS were highest at East Kittsondale. Compared to the Mississippi River at Lamberts Landing, CRWD sites were generally more concentrated in pollutants. CRWD sites also exceeded several water quality standards for other nutrients and metals. Compared to other metro-area tributaries, CRWD sites generally produced more pollutants per acre. Bacteria concentrations exceeded the maximum standard at all sites during stormflow. Water Quantity Trout Brook Outlet and Trout Brook - West Branch subwatersheds once again exported the greatest volumes of water during the 2010 monitoring season with 497 million and 334 million cubic feet (cf), respectively (Figure 3). The minor subwatershed sites, Como 7, Sarita, and Villa Park, exported the least amount of water because their drainage areas are only a portion of the major subwatershed in which they reside. For five of the subwatersheds, Phalen Creek, Saint Anthony Park, Trout Brook – East Branch, Trout Brook-West Branch, and Trout Brook Outlet, baseflow accounted for more than 50% of the total discharge. Stormflow comprised a majority of total discharge from the East Kittsondale, Como 7, Sarita, and Villa Park subwatersheds (Figure 4). Water yield was highest at Trout Brook – West Branch (140,213 cf/ac) (Figure 5). Although the total discharge at Trout Brook Outlet was higher than that of Trout Brook - West Branch and Phalen Creek, it’s water yield was the third highest (Figure 5). The lowest yields were generated from the Sarita and Villa Park, which are among the smallest subwatersheds, and have relatively lower amounts of impervious surfaces.
Capitol Region Watershed District 2010 Monitoring Report 18
Table 5. CRWD Monitoring Season Rainfall Amounts.
2005 2006 2007 2008 2009 2010
East Kittsondale 29.05 24.67 24.25 18.89 20.95 35.61
Phalen Creek 29.28 24.13 13.96 17.73 20.34 36.32
St. Anthony Park 28.27 24.13 23.99 9.95 18.72 26.84
Trout Brook-East Branch 23.87 23.92 17.91 20.63 36.27
Trout Brook-West Branch 28.78 24.67 24.25 18.99 20.63 36.32
Trout Brook Outlet 29.28 24.67 24.23 15.54 20.95 36.32
Como 7 28.96 24.16 17.40 18.82 30.92
Sarita 18.19 23.19 17.64 18.72 30.62
Villa Park 24.66 24.16 19.45 19.11 31.32
SiteRainfall (inches)
Table 6. CRWD Total Monitoring Days.
2005 2006 2007 2008 2009 2010
East Kittsondale 200 210 225 218 277 325
Phalen Creek 197 194 134 210 262 362
St. Anthony Park 191 192 215 126 218 188
Trout Brook-East Branch 191 217 212 273 359
Trout Brook-West Branch 191 212 228 220 273 365
Trout Brook Outlet 198 211 226 198 277 364
Como 7 195 222 209 217 206
Sarita 159 227 203 213 205
Villa Park 204 228 223 220 212
SiteMonitoring Days
Capitol Region Watershed District 2010 Monitoring Report 19
0
100,000,000
200,000,000
300,000,000
400,000,000
500,000,000
EastKittsondale
Phalen Creek St. AnthonyPark
Trout Brook-East Branch
Trout Brook-West Branch
Trout BrookOutlet
Como 7 Sarita Villa Park
Site
Dis
cha
rge
(cf)
2005
2006
2007
2008
2009
2010
Figure 3. Total Discharge at CRWD Monitoring Sites, 2005 – 2010.
Capitol Region Watershed District 2010 Monitoring Report 20
0
100,000,000
200,000,000
300,000,000
400,000,000
500,000,000
600,000,000
EastKittsondale
Phalen Creek St. AnthonyPark
Trout Brook-East Branch
Trout Brook-West Branch
Trout BrookOutlet
Como 7 Sarita Villa Park
Site
To
tal D
isch
arg
e (
cf)
Illicit Discharge
Storm
Base
a
Figure 4. Storm and Base Discharge at CRWD Monitoring Sites, 2010.
Capitol Region Watershed District 2010 Monitoring Report 21
0
20,000
40,000
60,000
80,000
100,000
120,000
140,000
EastKittsondale
Phalen Creek St. AnthonyPark
Trout Brook-East Branch
Trout Brook-West Branch
Trout BrookOutlet
Como 7 Sarita Villa Park
Site
Wat
er Y
ield
(c
f/ac
)2005
2006
2007
2008
2009
2010
Figure 5. Total Water Yield at CRWD Monitoring Sites, 2005-2010.
Capitol Region Watershed District 2010 Monitoring Report 22
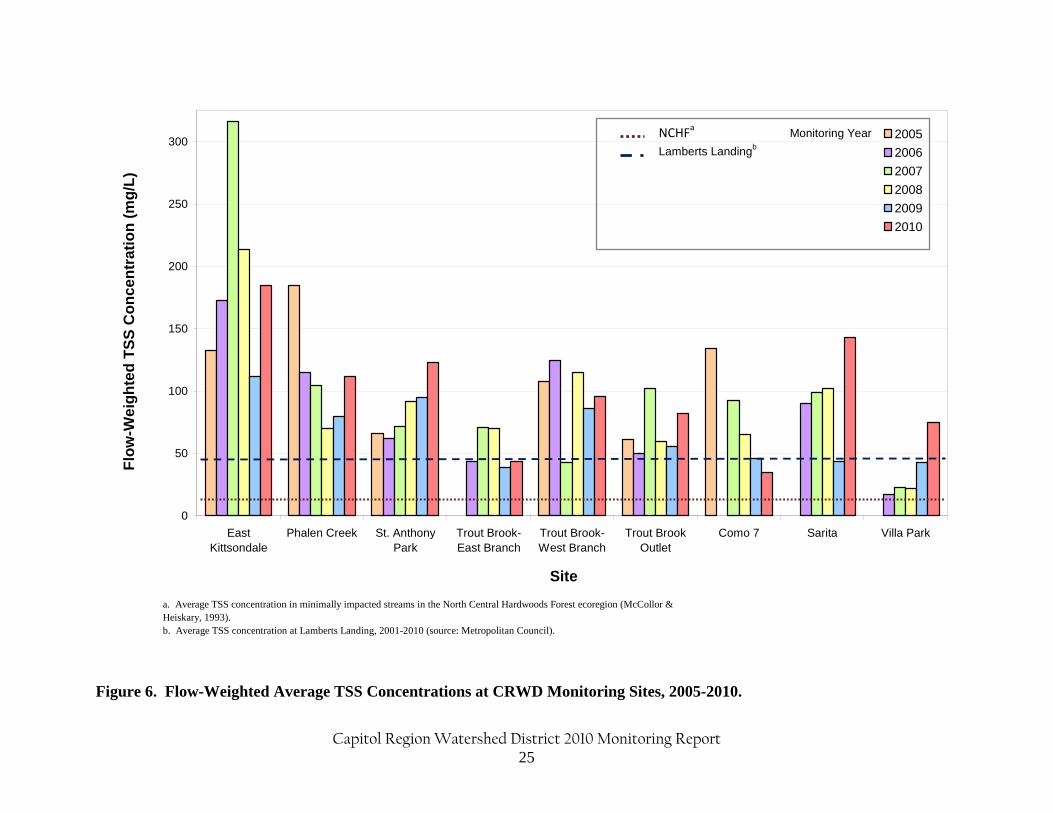
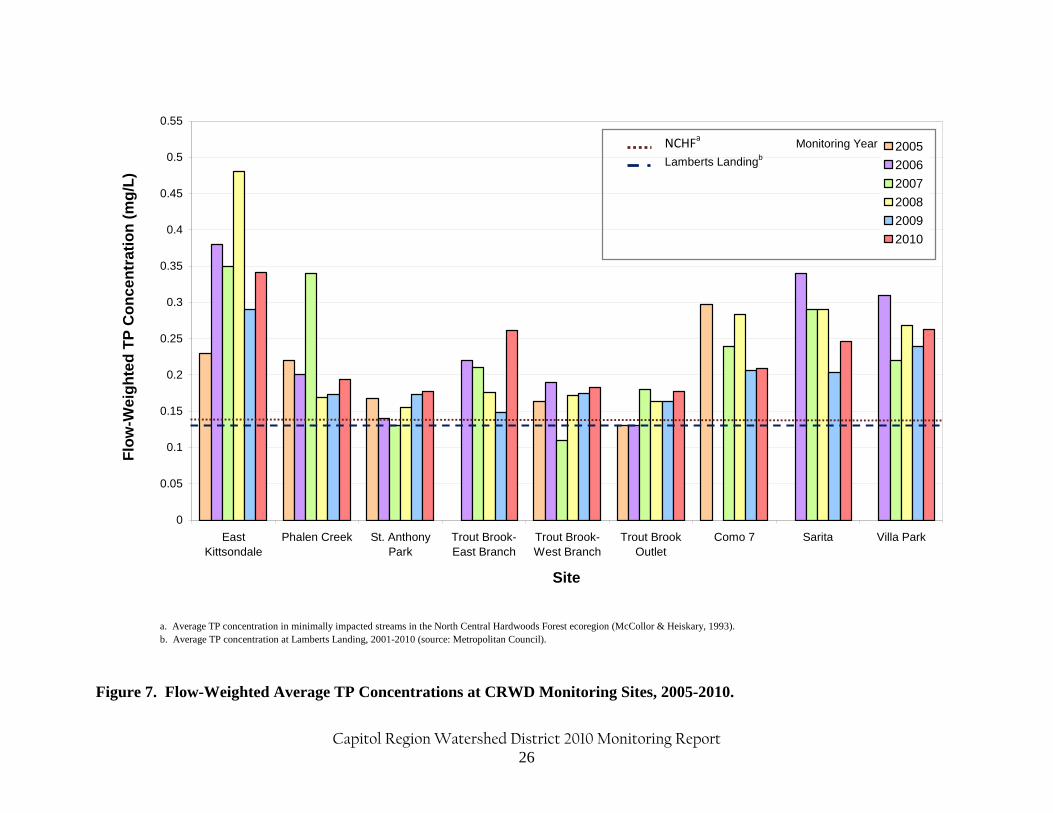
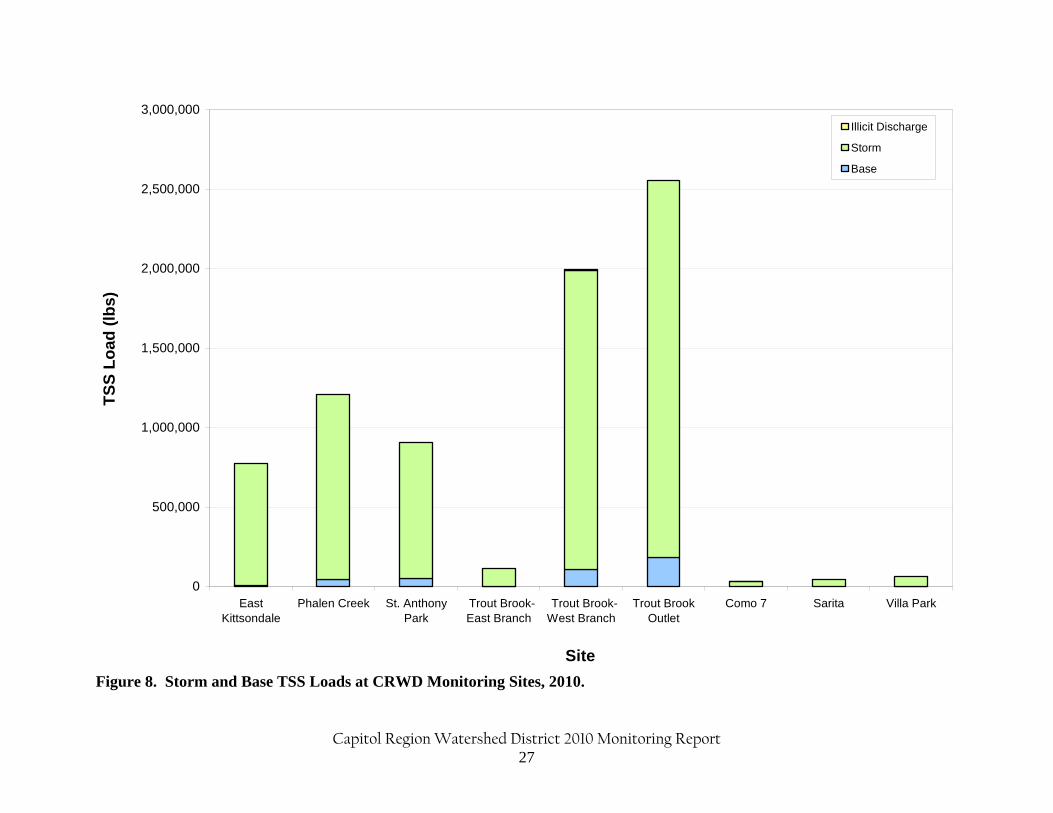
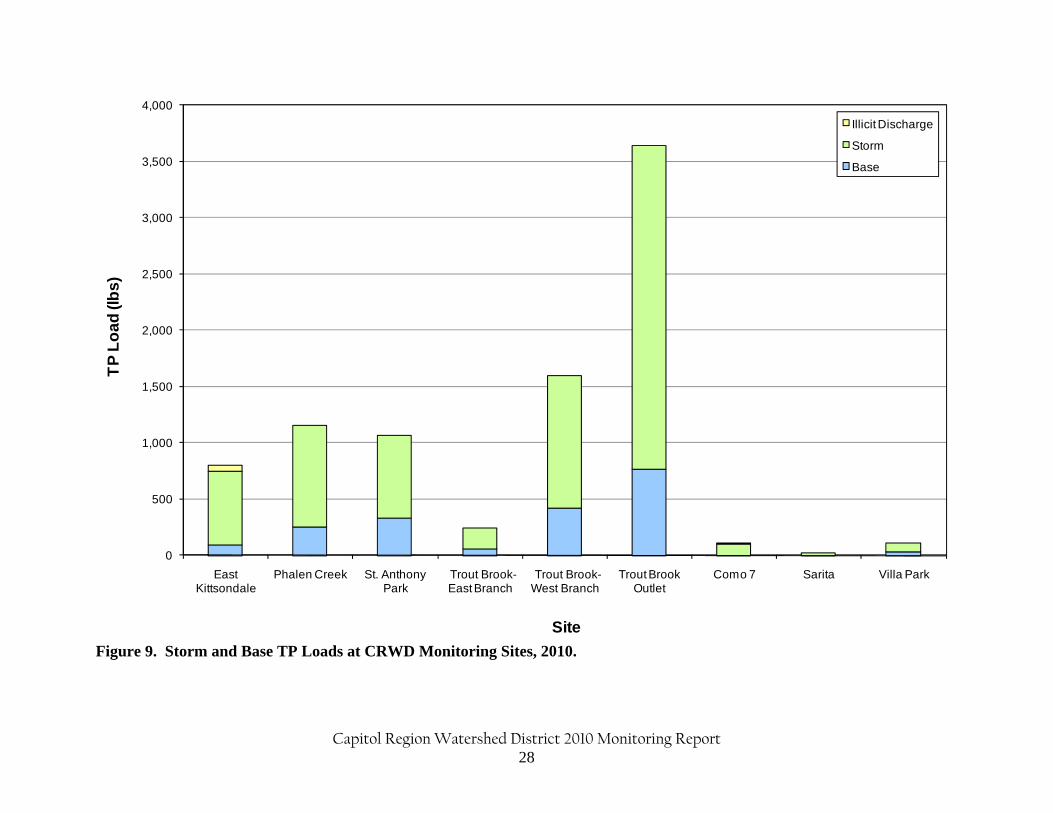
Total Suspended Solids, Total Phosphorus, and Nutrients Table 7 presents the complete water quality data set for all CRWD monitoring sites. The sites with the highest flow-weighted average (FWA) TSS concentrations in 2010 were East Kittsondale and Sarita (Figure 6). The lowest flow-weighted average TSS concentrations in 2010 were measured at Como 7 and Trout Brook – East Branch. Villa Park experienced a significant increase in its flow-weighted average concentration of TSS from previous years (Table 22). This is due largely to the fact that a much greater portion of the total flow was attributable to storms, with almost half the TSS loading occurring during the August 10th storm. Since 2005, all sites flow-weighted average TSS concentrations exceeded the NCHF ecoregion average TSS concentrations. In 2010 all sites, with the exception of Como 7 and Trout Brook – East Branch, had higher the flow-weighted average concentrations than the Mississippi River at Lamberts Landing. The site with the highest flow-weighted average concentration of TP was East Kittsondale (0.341 mg/L, Figure 7). However, the site had relatively low total flow, so the total load was moderate compared to other sites (Figure 9). Villa Park and Trout Brook – East Branch had the next highest flow-weighted average concentrations of TP. The sites with the lowest flow-weighted average TP concentrations were Trout Brook Outlet and St. Anthony Park (0.178). Since 2005, CRWD major subwatershed sites have been more highly concentrated in TP than the Mississippi River at Lamberts Landing. In 2010, all sites also exceeded the NCHF ecoregion average for TP in minimally impacted streams. Regardless of whether or not the majority of flow occurred during stormflow, most of the TSS loading occurred during storms (Figure 8). Baseflow includes groundwater, lake and storm pond water, and permitted industrial discharges, which are generally lower in TSS. In addition, since velocity, turbulence, and total flows are lower during baseflow, water does not have as much ability to carry solids. Stormwater washes off streets, parking lots, and other impervious surfaces, and contains more TSS. During high flows, sediment is less likely to settle before reaching storm drains. Most of the TP loading in the subwatershed also occurred during storms, although the percentage resulting from stormflow is smaller than for TSS (Figure 9). TP loading generally increases with TSS loading because nutrients adhere to suspended solids, plant debris and soil particles. However, TP also exists in soluble form, which is not attached to particles. Across CRWD, the greatest TSS yield (844 lbs/ac) in 2010 occurred in the Phalen Creek subwatershed (Figure 10). Trout Brook - West Branch and East Kittsondale had the next highest TSS yields, 837 lbs/ac and 693 lbs/ac, respectively. The lowest yields, 43 to 85 lbs/acre, occurred at three sites within a major subwatershed and with the smallest areas, Como 7, Sarita, and Villa Park. In 2010, all sites had TSS yields that were higher than the historical average TSS yields for each site. Pollutant yields were also normalized for the amount of stormwater runoff and expressed as lbs/ac/in runoff. In 2010, the normalized TSS yields were highest at East Kittsondale (42 lbs/ac/in runoff) and Sarita (32 lbs/ac/in runoff) (Figure 11). Normalized TSS yields were generally higher than their historical averages with the exception of East Kittsondale, Trout Brook – East Branch, and Como 7. Trout Brook – East Branch had the lowest average TSS concentration of any site in 2010. The lowest normalized TSS yield of 8 lbs/ac/in runoff was exported from the Como 7 subwatershed. Normalized TSS yield (lb/ac/in runoff) for Trout Brook – West Branch was slightly higher than Trout Brook Outlet, indicating that the West
Capitol Region Watershed District 2010 Monitoring Report 23
Branch of Trout Brook subwatershed was generating more pollutants on a per acre and per inch of runoff basis (Figure 11). In 2010, the subwatersheds that generated the lowest TP load per acre were Como 7 (0.257 lbs/ac) and Sarita (0.083 lbs/ac). The highest yields were generated in the Trout Brook – West Branch (1.606 lbs/ac) and Phalen Creek (1.468 lbs/ac) subwatersheds (Figure 12). Similar to the normalized TSS yield, East Kittsondale in 2010 produced the highest normalized TP yield (0.077 lbs/ac/in runoff), 28% higher than the next highest sites, Trout Brook – East Branch and Villa Park (Figure 13). The remaining sites produced similar TP loads per acre for an inch of runoff. Sites with smaller drainage areas had comparable normalized TP yields to the larger subwatershed sites because their flow-weighted average concentrations were higher and are dominated greatly by stormflow. Compared to the yields of seven other metro-area tributaries, three of four CRWD’s major subwatershed outlet sites, East Kittsondale, Phalen Creek and Trout Brook , generally produced more TSS and TP per acre (Figures 14 and 15). This is not surprising; the entire CRWD is urbanized, with water flowing in pipes, whereas many of the other tributaries’ watersheds are partly undeveloped and water flows in natural channels. The Saint Anthony Park subwatershed discharged less TP than the metro-area tributaries except Minnehaha and Rice Creeks. Storm sewers operate differently than natural streams. When water velocity decreases, sediments settle out of the water column. In natural streams, this occurs when the stream meanders, flows through a vegetated area, gets wider, or reaches a relatively flat stretch. Storm sewers are designed to maintain velocity in the pipe; pipes have a set diameter, do not meander, and can change elevation quickly. In natural streams, nutrients are taken up by vegetation and algae, but there is no vegetation in storm sewers. As a result, most of the sediment and nutrients washed into storm sewers remain in the water column until the pipe reaches a body of water. Sediments and nutrients from streets and sidewalks are washed directly into the storm sewer and carried to the river. Average concentrations from CRWD’s four major subwatershed outlet sites exceeded Lambert’s Landing concentrations and ecoregion averages or agency standards for TP, TSS, ammonia, TKN, and lead. (Table 8). Copper concentrations at Phalen Creek and St. Anthony Park exceeded concentrations at Lambert’s Landing and the standards for their given hardness. Nitrite concentrations at all four sites exceeded the concentration at Lambert’s Landing.
Capitol Region Watershed District 2010 Monitoring Report 24
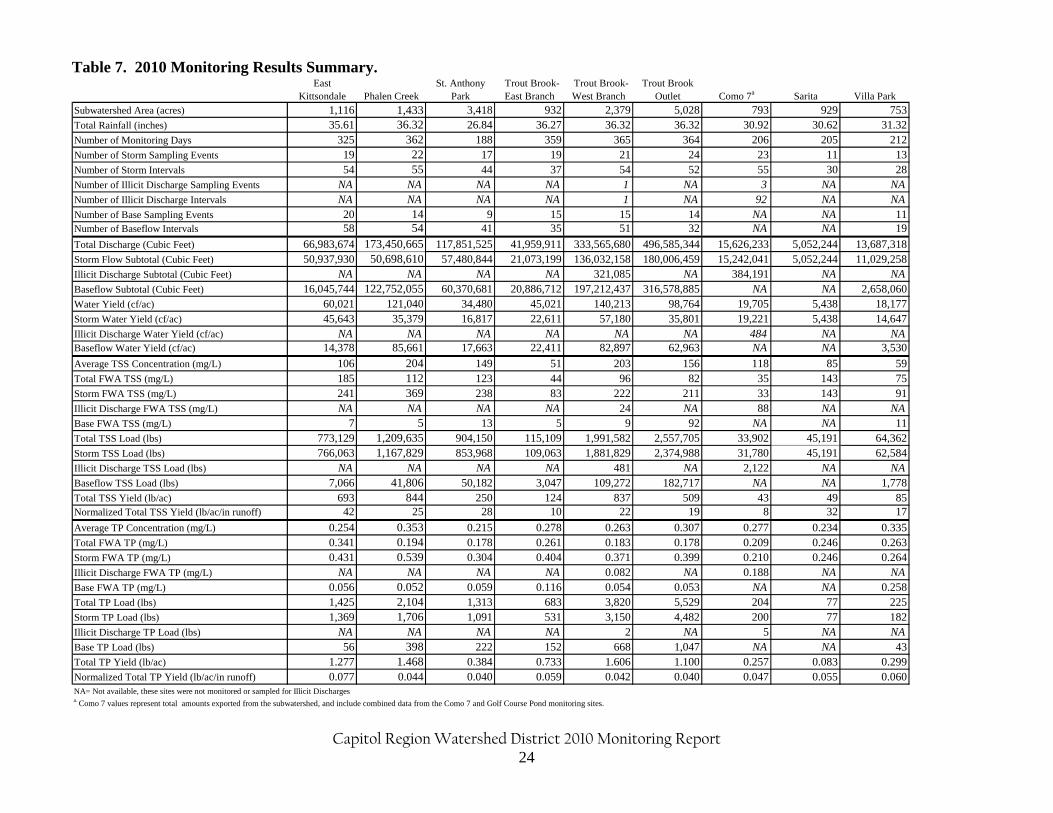
Table 7. 2010 Monitoring Results Summary. East
Kittsondale Phalen CreekSt. Anthony
Park Trout Brook-East Branch
Trout Brook-West Branch
Trout Brook Outlet Como 7a Sarita Villa Park
Subwatershed Area (acres) 1,116 1,433 3,418 932 2,379 5,028 793 929 753Total Rainfall (inches) 35.61 36.32 26.84 36.27 36.32 36.32 30.92 30.62 31.32Number of Monitoring Days 325 362 188 359 365 364 206 205 212Number of Storm Sampling Events 19 22 17 19 21 24 23 11 13Number of Storm Intervals 54 55 44 37 54 52 55 30 28Number of Illicit Discharge Sampling Events NA NA NA NA 1 NA 3 NA NANumber of Illicit Discharge Intervals NA NA NA NA 1 NA 92 NA NANumber of Base Sampling Events 20 14 9 15 15 14 NA NA 11Number of Baseflow Intervals 58 54 41 35 51 32 NA NA 19
Total Discharge (Cubic Feet) 66,983,674 173,450,665 117,851,525 41,959,911 333,565,680 496,585,344 15,626,233 5,052,244 13,687,318Storm Flow Subtotal (Cubic Feet) 50,937,930 50,698,610 57,480,844 21,073,199 136,032,158 180,006,459 15,242,041 5,052,244 11,029,258Illicit Discharge Subtotal (Cubic Feet) NA NA NA NA 321,085 NA 384,191 NA NABaseflow Subtotal (Cubic Feet) 16,045,744 122,752,055 60,370,681 20,886,712 197,212,437 316,578,885 NA NA 2,658,060Water Yield (cf/ac) 60,021 121,040 34,480 45,021 140,213 98,764 19,705 5,438 18,177Storm Water Yield (cf/ac) 45,643 35,379 16,817 22,611 57,180 35,801 19,221 5,438 14,647Illicit Discharge Water Yield (cf/ac) NA NA NA NA NA NA 484 NA NABaseflow Water Yield (cf/ac) 14,378 85,661 17,663 22,411 82,897 62,963 NA NA 3,530
Average TSS Concentration (mg/L) 106 204 149 51 203 156 118 85 59Total FWA TSS (mg/L) 185 112 123 44 96 82 35 143 75Storm FWA TSS (mg/L) 241 369 238 83 222 211 33 143 91Illicit Discharge FWA TSS (mg/L) NA NA NA NA 24 NA 88 NA NABase FWA TSS (mg/L) 7 5 13 5 9 92 NA NA 11Total TSS Load (lbs) 773,129 1,209,635 904,150 115,109 1,991,582 2,557,705 33,902 45,191 64,362Storm TSS Load (lbs) 766,063 1,167,829 853,968 109,063 1,881,829 2,374,988 31,780 45,191 62,584Illicit Discharge TSS Load (lbs) NA NA NA NA 481 NA 2,122 NA NABaseflow TSS Load (lbs) 7,066 41,806 50,182 3,047 109,272 182,717 NA NA 1,778Total TSS Yield (lb/ac) 693 844 250 124 837 509 43 49 85Normalized Total TSS Yield (lb/ac/in runoff) 42 25 28 10 22 19 8 32 17
Average TP Concentration (mg/L) 0.254 0.353 0.215 0.278 0.263 0.307 0.277 0.234 0.335Total FWA TP (mg/L) 0.341 0.194 0.178 0.261 0.183 0.178 0.209 0.246 0.263Storm FWA TP (mg/L) 0.431 0.539 0.304 0.404 0.371 0.399 0.210 0.246 0.264Illicit Discharge FWA TP (mg/L) NA NA NA NA 0.082 NA 0.188 NA NABase FWA TP (mg/L) 0.056 0.052 0.059 0.116 0.054 0.053 NA NA 0.258Total TP Load (lbs) 1,425 2,104 1,313 683 3,820 5,529 204 77 225Storm TP Load (lbs) 1,369 1,706 1,091 531 3,150 4,482 200 77 182Illicit Discharge TP Load (lbs) NA NA NA NA 2 NA 5 NA NABase TP Load (lbs) 56 398 222 152 668 1,047 NA NA 43Total TP Yield (lb/ac) 1.277 1.468 0.384 0.733 1.606 1.100 0.257 0.083 0.299Normalized Total TP Yield (lb/ac/in runoff) 0.077 0.044 0.040 0.059 0.042 0.040 0.047 0.055 0.060NA= Not available, these sites were not monitored or sampled for Illicit Dischargesa. Como 7 values represent total amounts exported from the subwatershed, and include combined data from the Como 7 and Golf Course Pond monitoring sites.
Capitol Region Watershed District 2010 Monitoring Report 25
0
50
100
150
200
250
300
EastKittsondale
Phalen Creek St. AnthonyPark
Trout Brook-East Branch
Trout Brook-West Branch
Trout BrookOutlet
Como 7 Sarita Villa Park
Site
Flo
w-W
eig
hte
d T
SS
Co
nc
en
tra
tio
n (
mg
/L)
2005
2006
2007
2008
2009
2010
a. Average TSS concentration in minimally impacted streams in the North Central Hardwoods Forest ecoregion (McCollor & Heiskary, 1993).b. Average TSS concentration at Lamberts Landing, 2001-2010 (source: Metropolitan Council).
NCHFa Monitoring Year
Lamberts Landingb
Figure 6. Flow-Weighted Average TSS Concentrations at CRWD Monitoring Sites, 2005-2010.
Capitol Region Watershed District 2010 Monitoring Report 26
0
0.05
0.1
0.15
0.2
0.25
0.3
0.35
0.4
0.45
0.5
0.55
EastKittsondale
Phalen Creek St. AnthonyPark
Trout Brook-East Branch
Trout Brook-West Branch
Trout BrookOutlet
Como 7 Sarita Villa Park
Site
Flo
w-W
eig
hte
d T
P C
on
ce
ntr
ati
on
(m
g/L
)2005
2006
2007
2008
2009
2010
NCHFa Monitoring Year
Lamberts Landingb
a. Average TP concentration in minimally impacted streams in the North Central Hardwoods Forest ecoregion (McCollor & Heiskary, 1993).b. Average TP concentration at Lamberts Landing, 2001-2010 (source: Metropolitan Council).
Figure 7. Flow-Weighted Average TP Concentrations at CRWD Monitoring Sites, 2005-2010.
Capitol Region Watershed District 2010 Monitoring Report 27
0
500,000
1,000,000
1,500,000
2,000,000
2,500,000
3,000,000
EastKittsondale
Phalen Creek St. AnthonyPark
Trout Brook-East Branch
Trout Brook-West Branch
Trout BrookOutlet
Como 7 Sarita Villa Park
Site
TS
S L
oa
d (
lbs
)Illicit Discharge
Storm
Base
Figure 8. Storm and Base TSS Loads at CRWD Monitoring Sites, 2010.
Capitol Region Watershed District 2010 Monitoring Report 28
0
500
1,000
1,500
2,000
2,500
3,000
3,500
4,000
East Kittsondale
Phalen Creek St. Anthony Park
Trout Brook-East Branch
Trout Brook-West Branch
Trout Brook Outlet
Como 7 Sarita Villa Park
TP
Lo
ad
(lb
s)
Site
Illicit Discharge
Storm
Base
Figure 9. Storm and Base TP Loads at CRWD Monitoring Sites, 2010.
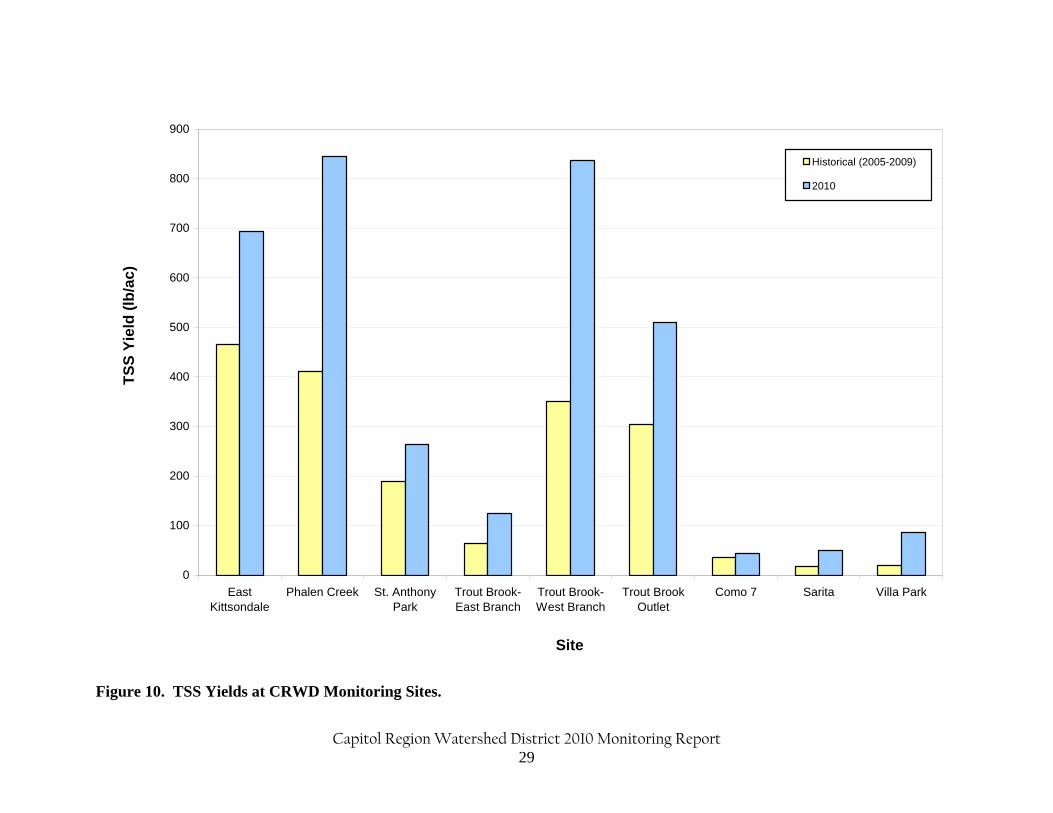
Capitol Region Watershed District 2010 Monitoring Report 29
0
100
200
300
400
500
600
700
800
900
EastKittsondale
Phalen Creek St. AnthonyPark
Trout Brook-East Branch
Trout Brook-West Branch
Trout BrookOutlet
Como 7 Sarita Villa Park
Site
TS
S Y
ield
(lb
/ac
)
Historical (2005-2009)
2010
Figure 10. TSS Yields at CRWD Monitoring Sites.
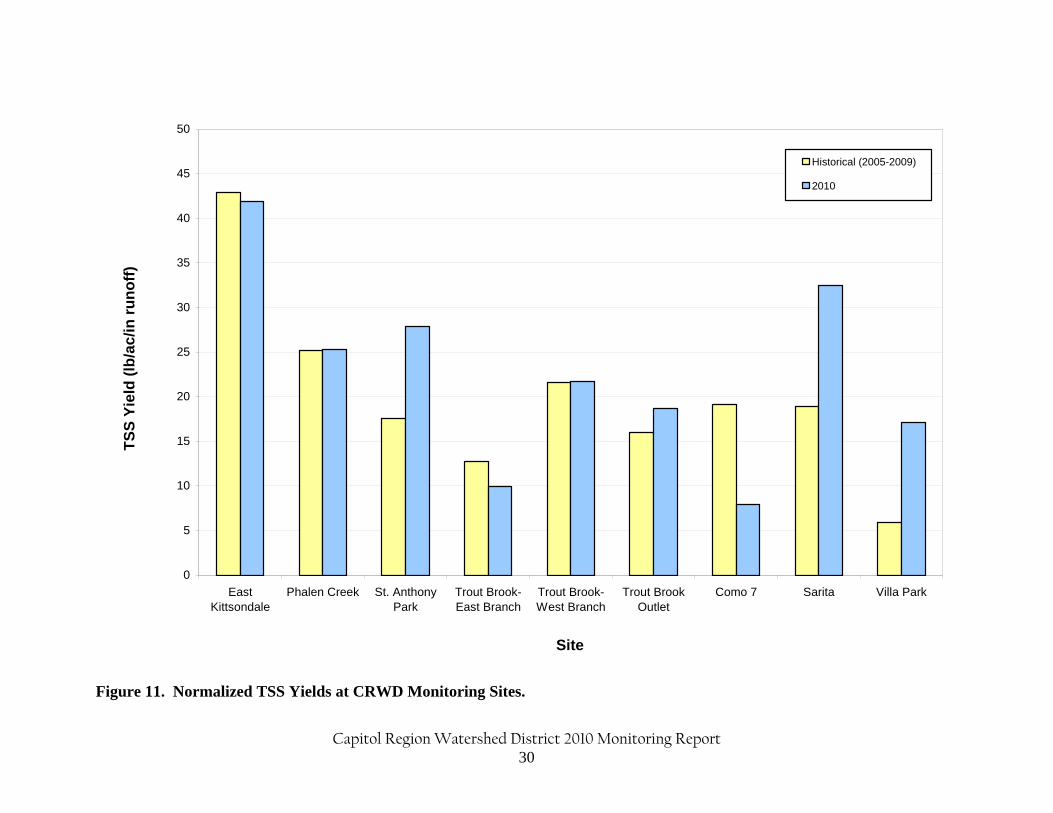
Capitol Region Watershed District 2010 Monitoring Report 30
0
5
10
15
20
25
30
35
40
45
50
EastKittsondale
Phalen Creek St. AnthonyPark
Trout Brook-East Branch
Trout Brook-West Branch
Trout BrookOutlet
Como 7 Sarita Villa Park
Site
TS
S Y
ield
(lb
/ac
/in
ru
no
ff)
Historical (2005-2009)
2010
Figure 11. Normalized TSS Yields at CRWD Monitoring Sites.
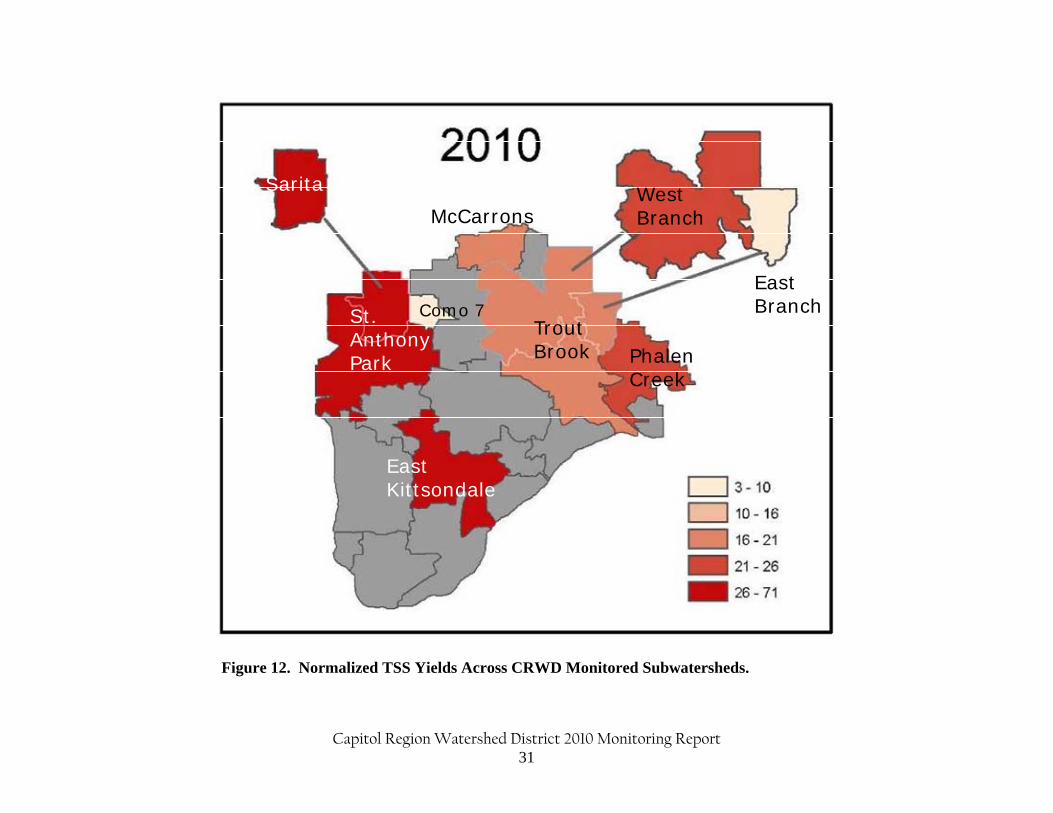
Capitol Region Watershed District 2010 Monitoring Report 31
St. Anthony Park
Sarita
Trout Brook
West Branch
East Branch
McCarrons
Phalen Creek
East Kittsondale
Como 7
Figure 12. Normalized TSS Yields Across CRWD Monitored Subwatersheds.
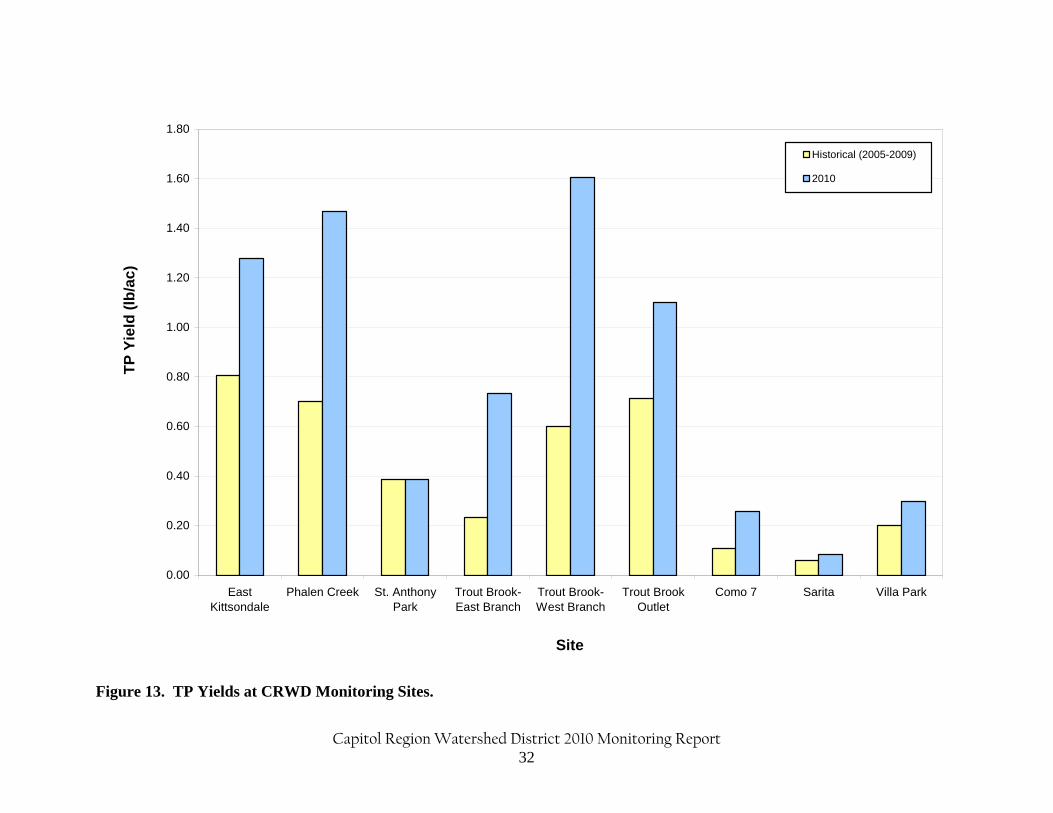
Capitol Region Watershed District 2010 Monitoring Report 32
0.00
0.20
0.40
0.60
0.80
1.00
1.20
1.40
1.60
1.80
EastKittsondale
Phalen Creek St. AnthonyPark
Trout Brook-East Branch
Trout Brook-West Branch
Trout BrookOutlet
Como 7 Sarita Villa Park
Site
TP
Yie
ld (
lb/a
c)
Historical (2005-2009)
2010
Figure 13. TP Yields at CRWD Monitoring Sites.
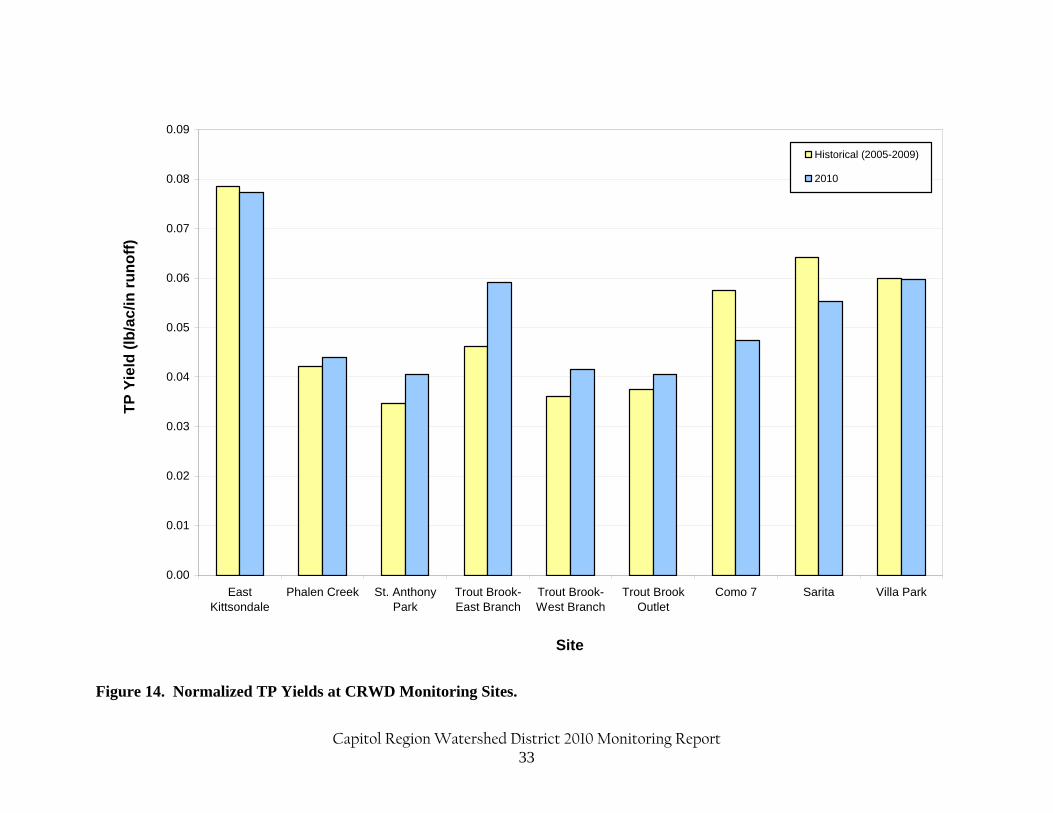
Capitol Region Watershed District 2010 Monitoring Report 33
0.00
0.01
0.02
0.03
0.04
0.05
0.06
0.07
0.08
0.09
EastKittsondale
Phalen Creek St. AnthonyPark
Trout Brook-East Branch
Trout Brook-West Branch
Trout BrookOutlet
Como 7 Sarita Villa Park
Site
TP
Yie
ld (
lb/a
c/i
n r
un
off
)
Historical (2005-2009)
2010
Figure 14. Normalized TP Yields at CRWD Monitoring Sites.

Capitol Region Watershed District 2010 Monitoring Report 34
St. Anthony Park
Sarita
Trout Brook
West Branch
East Branch
McCarrons
Phalen Creek
Como 7
East Kittsondale
Figure 15. Normalized TP Yields Across CRWD Monitored Subwatersheds.
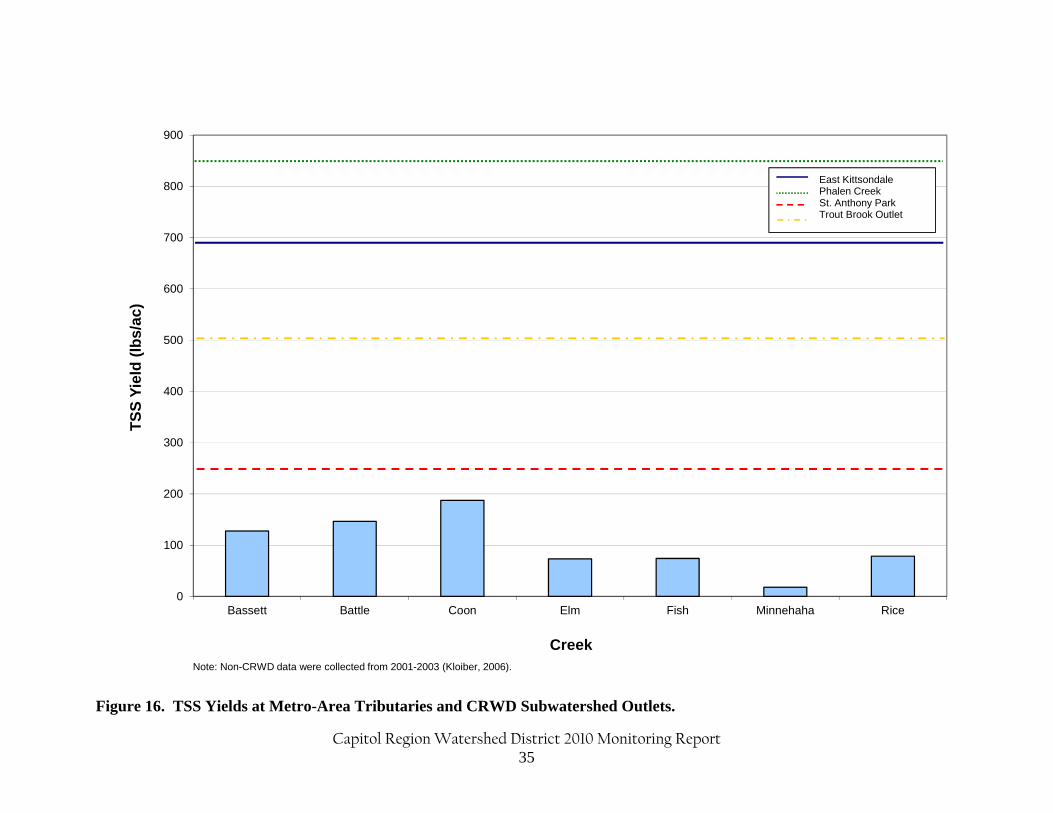
Capitol Region Watershed District 2010 Monitoring Report 35
0
100
200
300
400
500
600
700
800
900
Bassett Battle Coon Elm Fish Minnehaha Rice
TS
S Y
ield
(lb
s/a
c)
Creek
East KittsondalePhalen CreekSt. Anthony ParkTrout Brook Outlet
Note: Non-CRWD data were collected from 2001-2003 (Kloiber, 2006).
Figure 16. TSS Yields at Metro-Area Tributaries and CRWD Subwatershed Outlets.
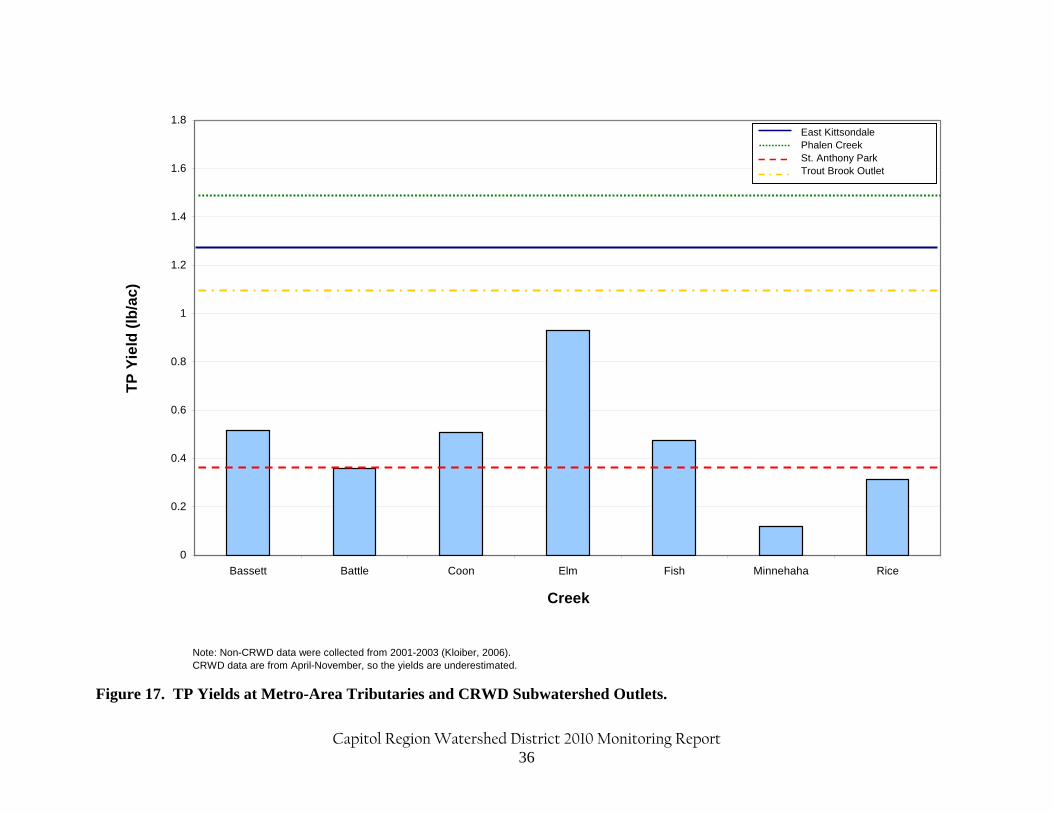
Capitol Region Watershed District 2010 Monitoring Report 36
0
0.2
0.4
0.6
0.8
1
1.2
1.4
1.6
1.8
Bassett Battle Coon Elm Fish Minnehaha Rice
Creek
TP
Yie
ld (
lb/a
c)
East KittsondalePhalen CreekSt. Anthony ParkTrout Brook Outlet
Note: Non-CRWD data were collected from 2001-2003 (Kloiber, 2006).CRWD data are from April-November, so the yields are underestimated.
Figure 17. TP Yields at Metro-Area Tributaries and CRWD Subwatershed Outlets.
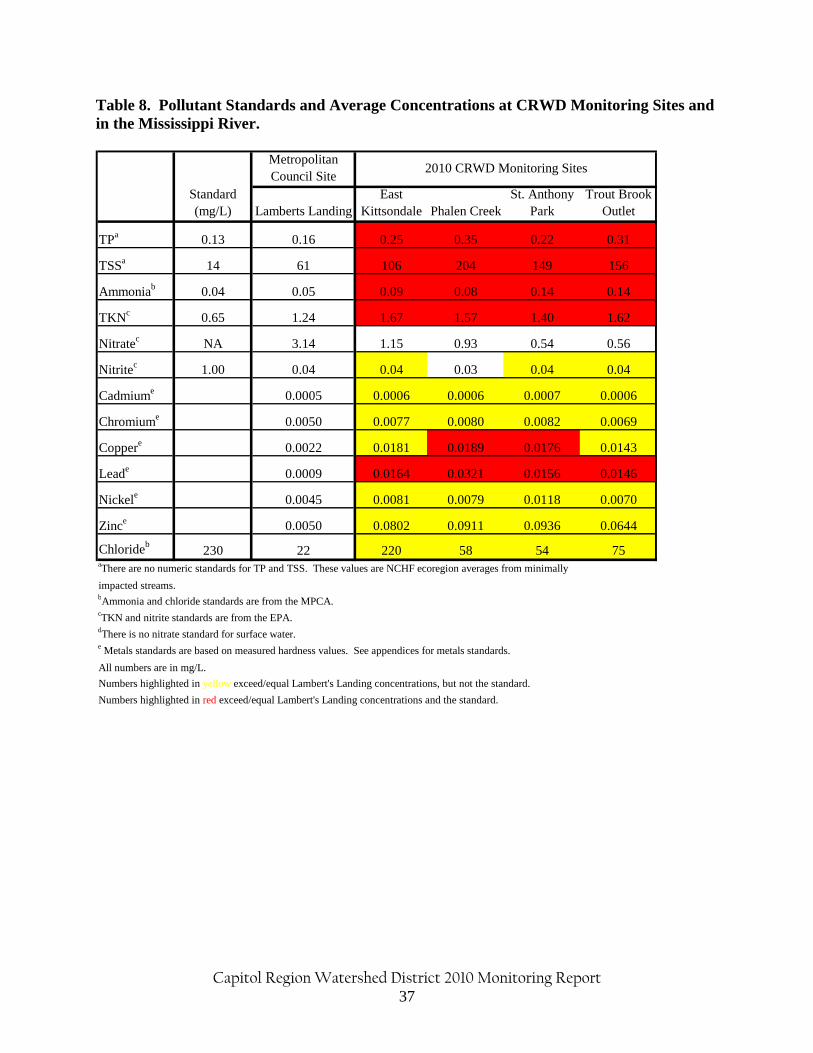
Capitol Region Watershed District 2010 Monitoring Report 37
Table 8. Pollutant Standards and Average Concentrations at CRWD Monitoring Sites and in the Mississippi River.
Metropolitan Council Site
Standard (mg/L) Lamberts Landing
East Kittsondale Phalen Creek
St. Anthony Park
Trout Brook Outlet
TPa 0.13 0.16 0.25 0.35 0.22 0.31
TSSa 14 61 106 204 149 156
Ammoniab 0.04 0.05 0.09 0.08 0.14 0.14
TKNc 0.65 1.24 1.67 1.57 1.40 1.62
Nitratec NA 3.14 1.15 0.93 0.54 0.56
Nitritec 1.00 0.04 0.04 0.03 0.04 0.04
Cadmiume 0.0005 0.0006 0.0006 0.0007 0.0006
Chromiume 0.0050 0.0077 0.0080 0.0082 0.0069
Coppere 0.0022 0.0181 0.0189 0.0176 0.0143
Leade 0.0009 0.0164 0.0321 0.0156 0.0146
Nickele 0.0045 0.0081 0.0079 0.0118 0.0070
Zince 0.0050 0.0802 0.0911 0.0936 0.0644
Chlorideb230 22 220 58 54 75
aThere are no numeric standards for TP and TSS. These values are NCHF ecoregion averages from minimally
impacted streams.bAmmonia and chloride standards are from the MPCA.cTKN and nitrite standards are from the EPA.dThere is no nitrate standard for surface water.e Metals standards are based on measured hardness values. See appendices for metals standards.
All numbers are in mg/L.
Numbers highlighted in yellow exceed/equal Lambert's Landing concentrations, but not the standard.
Numbers highlighted in red exceed/equal Lambert's Landing concentrations and the standard.
2010 CRWD Monitoring Sites
Capitol Region Watershed District 2010 Monitoring Report 38
Metals The MPCA standards for metals toxicity are a function of water hardness. CRWD calculated metal standards based on measured hardness levels for each site (Appendix B). According to these standards, the average storm concentrations at all sites except Villa Park exceeded the toxicity standards for lead and copper (Table 9). The yearly average concentrations for copper in 2010 exceeded copper toxicity standards at Phalen Creek, St. Anthony Park, Trout Brook – West Branch, Como 7, and Sarita.. Those same sites as well as East Kittsondale and Trout Brook Outlet had 2010 average concentrations that exceeded the lead standard. In addition, storm samples at East Kittsondale, Phalen Creek, St. Anthony Park, Trout Brook – West Branch, and Como 7 exceeded the chronic toxicity standard for zinc. The yearly average concentration of zinc at Como 7 exceeded the standard. The 2010 average concentrations for all metal parameters at all monitoring sites exceeded the Mississippi River concentrations at Lambert’s Landing (Tables 8 and 9). Bacteria With the exception of East Kittsondale, most individual E. coli bacteria concentrations at the baseline sites during baseflow were below the E. coli maximum standard of 1,260 cfu/100mL (Table 10). The Trout Brook – East Branch, Trout Brook – West Branch, Trout Brook Outlet, and Villa Park were sites that had one to two baseflow samples higher than the maximum standard. At East Kittsondale, prior to May 25th, all E. coli baseflow samples exceeded the standard. Beginning with the May 25th sample, all of the baseflow samples at East Kittsondale met the standard. This was due to the elimination of an illicit discharge that was presumed to be the source of the high bacteria concentrations. Almost every sample at every site exceeded the maximum standard for bacteria during storm events in 2010 (Table 11). Only six samples out of a total of 52 samples at the nine baseline sites were less than the maximum standard for E. coli bacteria. E. coli concentrations ranged from 46 mpn/100mL to 72,700 mpn/100mL. Half of the bacteria levels during storms at Villa Park were below the maximum standard.
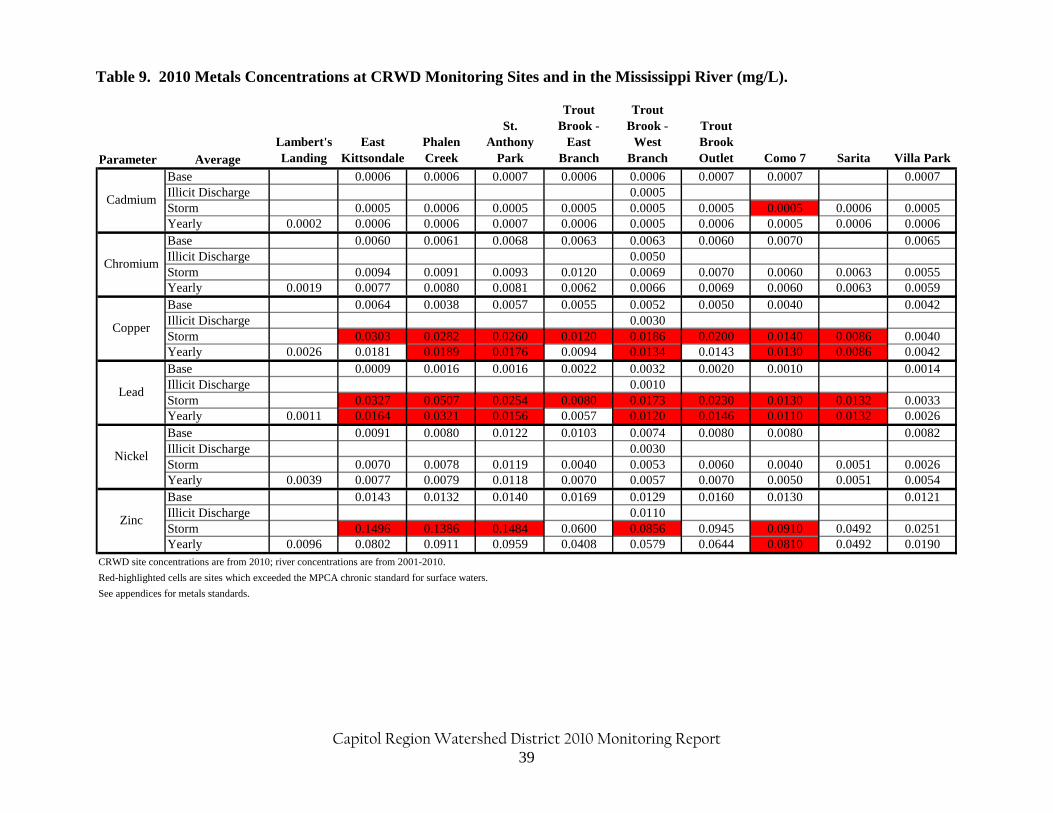
Capitol Region Watershed District 2010 Monitoring Report 39
Table 9. 2010 Metals Concentrations at CRWD Monitoring Sites and in the Mississippi River (mg/L).
Parameter Average
Lambert's Landing
East Kittsondale
Phalen Creek
St. Anthony
Park
Trout Brook -
East Branch
Trout Brook -
West Branch
Trout Brook Outlet Como 7 Sarita Villa Park
Base 0.0006 0.0006 0.0007 0.0006 0.0006 0.0007 0.0007 0.0007Illicit Discharge 0.0005Storm 0.0005 0.0006 0.0005 0.0005 0.0005 0.0005 0.0005 0.0006 0.0005Yearly 0.0002 0.0006 0.0006 0.0007 0.0006 0.0005 0.0006 0.0005 0.0006 0.0006Base 0.0060 0.0061 0.0068 0.0063 0.0063 0.0060 0.0070 0.0065Illicit Discharge 0.0050Storm 0.0094 0.0091 0.0093 0.0120 0.0069 0.0070 0.0060 0.0063 0.0055Yearly 0.0019 0.0077 0.0080 0.0081 0.0062 0.0066 0.0069 0.0060 0.0063 0.0059Base 0.0064 0.0038 0.0057 0.0055 0.0052 0.0050 0.0040 0.0042Illicit Discharge 0.0030Storm 0.0303 0.0282 0.0260 0.0120 0.0186 0.0200 0.0140 0.0086 0.0040Yearly 0.0026 0.0181 0.0189 0.0176 0.0094 0.0134 0.0143 0.0130 0.0086 0.0042Base 0.0009 0.0016 0.0016 0.0022 0.0032 0.0020 0.0010 0.0014Illicit Discharge 0.0010Storm 0.0327 0.0507 0.0254 0.0080 0.0173 0.0230 0.0130 0.0132 0.0033Yearly 0.0011 0.0164 0.0321 0.0156 0.0057 0.0120 0.0146 0.0110 0.0132 0.0026Base 0.0091 0.0080 0.0122 0.0103 0.0074 0.0080 0.0080 0.0082Illicit Discharge 0.0030Storm 0.0070 0.0078 0.0119 0.0040 0.0053 0.0060 0.0040 0.0051 0.0026Yearly 0.0039 0.0077 0.0079 0.0118 0.0070 0.0057 0.0070 0.0050 0.0051 0.0054Base 0.0143 0.0132 0.0140 0.0169 0.0129 0.0160 0.0130 0.0121Illicit Discharge 0.0110Storm 0.1496 0.1386 0.1484 0.0600 0.0856 0.0945 0.0910 0.0492 0.0251Yearly 0.0096 0.0802 0.0911 0.0959 0.0408 0.0579 0.0644 0.0810 0.0492 0.0190
CRWD site concentrations are from 2010; river concentrations are from 2001-2010.
Red-highlighted cells are sites which exceeded the MPCA chronic standard for surface waters.
See appendices for metals standards.
Nickel
Zinc
Cadmium
Chromium
Copper
Lead
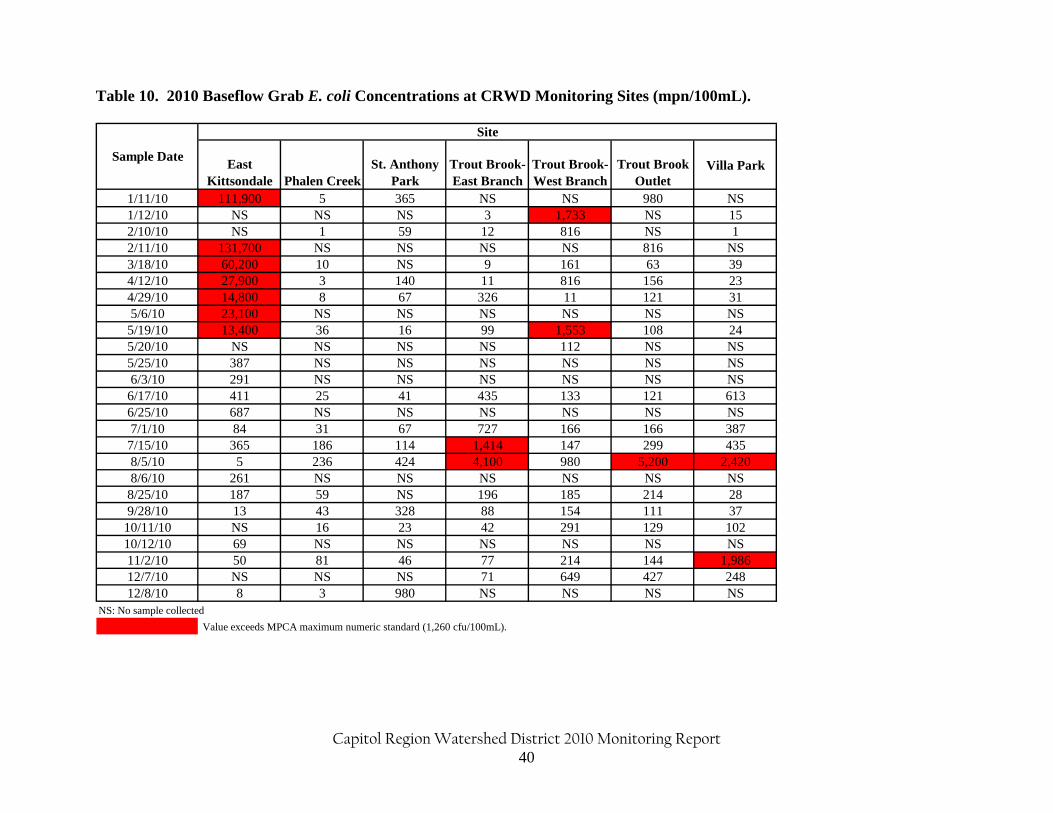
Capitol Region Watershed District 2010 Monitoring Report 40
Table 10. 2010 Baseflow Grab E. coli Concentrations at CRWD Monitoring Sites (mpn/100mL).
East Kittsondale Phalen Creek
St. Anthony Park
Trout Brook-East Branch
Trout Brook-West Branch
Trout Brook Outlet
Villa Park
1/11/10 111,900 5 365 NS NS 980 NS1/12/10 NS NS NS 3 1,733 NS 152/10/10 NS 1 59 12 816 NS 12/11/10 131,700 NS NS NS NS 816 NS3/18/10 60,200 10 NS 9 161 63 394/12/10 27,900 3 140 11 816 156 234/29/10 14,800 8 67 326 11 121 315/6/10 23,100 NS NS NS NS NS NS
5/19/10 13,400 36 16 99 1,553 108 245/20/10 NS NS NS NS 112 NS NS5/25/10 387 NS NS NS NS NS NS6/3/10 291 NS NS NS NS NS NS
6/17/10 411 25 41 435 133 121 6136/25/10 687 NS NS NS NS NS NS7/1/10 84 31 67 727 166 166 387
7/15/10 365 186 114 1,414 147 299 4358/5/10 5 236 424 4,100 980 5,200 2,4208/6/10 261 NS NS NS NS NS NS
8/25/10 187 59 NS 196 185 214 289/28/10 13 43 328 88 154 111 37
10/11/10 NS 16 23 42 291 129 10210/12/10 69 NS NS NS NS NS NS11/2/10 50 81 46 77 214 144 1,98612/7/10 NS NS NS 71 649 427 24812/8/10 8 3 980 NS NS NS NS
NS: No sample collected
Value exceeds MPCA maximum numeric standard (1,260 cfu/100mL).
Site
Sample Date
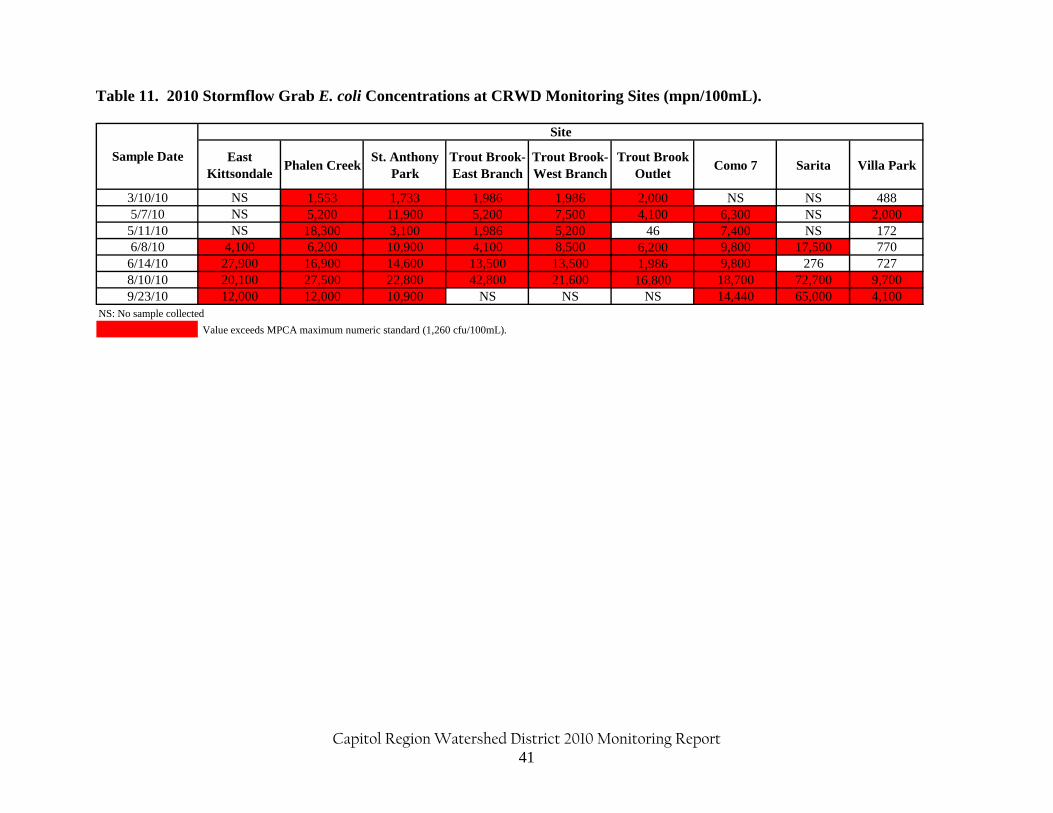
Capitol Region Watershed District 2010 Monitoring Report 41
Table 11. 2010 Stormflow Grab E. coli Concentrations at CRWD Monitoring Sites (mpn/100mL).
East Kittsondale
Phalen CreekSt. Anthony
ParkTrout Brook-East Branch
Trout Brook-West Branch
Trout Brook Outlet
Como 7 Sarita Villa Park
3/10/10 NS 1,553 1,733 1,986 1,986 2,000 NS NS 4885/7/10 NS 5,200 11,900 5,200 7,500 4,100 6,300 NS 2,000
5/11/10 NS 18,300 3,100 1,986 5,200 46 7,400 NS 1726/8/10 4,100 6,200 10,900 4,100 8,500 6,200 9,800 17,500 770
6/14/10 27,900 16,900 14,600 13,500 13,500 1,986 9,800 276 7278/10/10 20,100 27,500 22,800 42,800 21,600 16,800 18,700 72,700 9,7009/23/10 12,000 12,000 10,900 NS NS NS 14,440 65,000 4,100
NS: No sample collected
Value exceeds MPCA maximum numeric standard (1,260 cfu/100mL).
Site
Sample Date
Capitol Region Watershed District 2010 Monitoring Report 42
Summary Comparison of CRWD Stormwater Data and NSQD Data Compared to other urbanized areas in the country, CRWD’s stormwater water quality in 2010 had higher median concentrations for several pollutants including bacteria, TSS, TKN, and TP. Table 12 compares stormwater pollutant median concentrations from CRWD and NSQD. All sites except for Villa Park were several times higher than the NSQD median concentration of 1,050 mpn/100mL for E. coli.. Median TSS concentrations at seven of the nine sites were higher than then NSQD median concentration of 66 mg/L. The two wetland subwatersheds, Sarita and Villa Park, had TSS median concentrations lower than the NSQD median concentration. East Kittsondale, Phalen Creek, Trout Brook – East Branch, Trout Brook – West Branch, Trout Brook Outlet, and Como 7 sites had higher median concentrations of total phosphorus than the NSQD median concentration of 0.28 mg/L. TP median concentrations in CRWD ranged from 0.20 mg/L to 0.45 mg/L. All sites were below the NSQD median concentrations for two nutrients, ammonia and nitrate+nitrite. Conversely, median total Kjeldahl nitrogen concentrations at all sites except Trout Brook – East Branch, Sarita, and Villa Park wetland were equal to or greater than the NSQD median concentration. The comparisons between median concentrations for numerous metals in CRWD and the NSQD were varied. All sites with the exception of St. Anthony Park had median nickel concentrations that were lower than the NSQD median concentration. All median cadmium concentrations in CRWD were below the NSQD median concentration of 0.0009 mg/L. Three out of the four major subwatershed sites, East Kittsondale, Phalen, and St. Anthony Park, exceeded the NSQD median concentrations for chromium, copper, lead, and zinc.
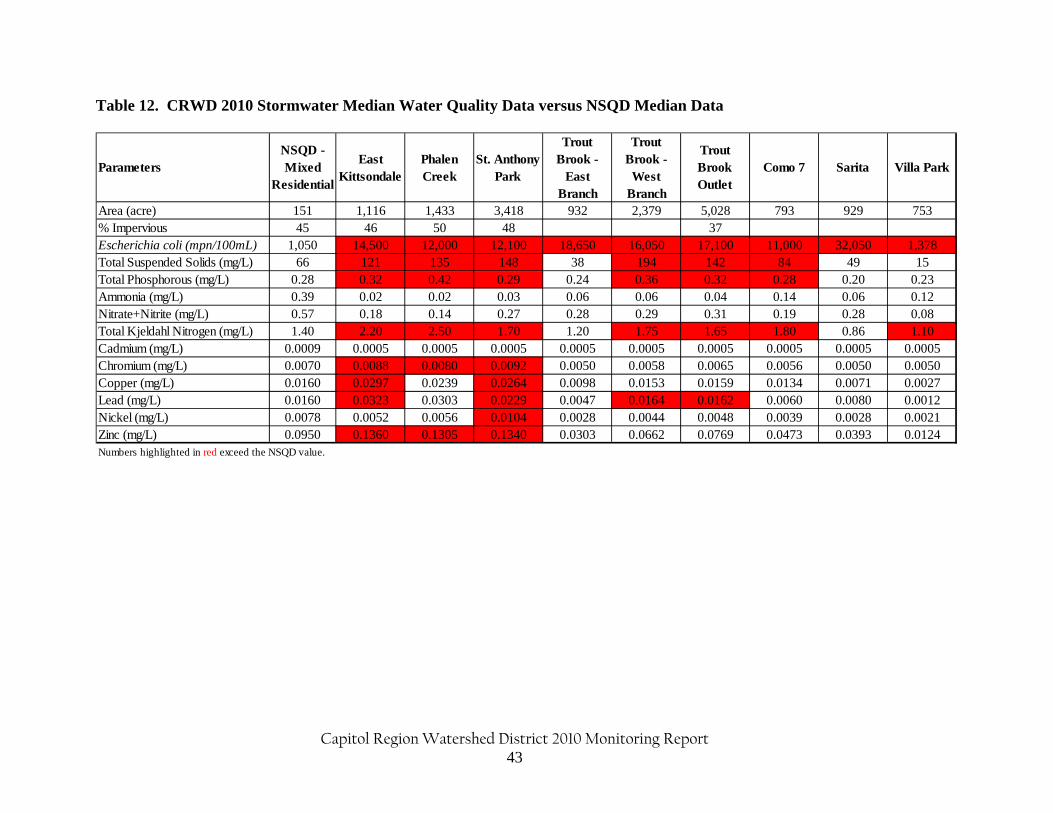
Capitol Region Watershed District 2010 Monitoring Report 43
Table 12. CRWD 2010 Stormwater Median Water Quality Data versus NSQD Median Data
ParametersNSQD - Mixed
Residential
East Kittsondale
Phalen Creek
St. Anthony Park
Trout Brook -
East Branch
Trout Brook - West
Branch
Trout Brook Outlet
Como 7 Sarita Villa Park
Area (acre) 151 1,116 1,433 3,418 932 2,379 5,028 793 929 753% Impervious 45 46 50 48 37Escherichia coli (mpn/100mL) 1,050 14,500 12,000 12,100 18,650 16,050 17,100 11,000 32,050 1,378Total Suspended Solids (mg/L) 66 121 135 148 38 194 142 84 49 15Total Phosphorous (mg/L) 0.28 0.32 0.42 0.29 0.24 0.36 0.32 0.28 0.20 0.23Ammonia (mg/L) 0.39 0.02 0.02 0.03 0.06 0.06 0.04 0.14 0.06 0.12Nitrate+Nitrite (mg/L) 0.57 0.18 0.14 0.27 0.28 0.29 0.31 0.19 0.28 0.08Total Kjeldahl Nitrogen (mg/L) 1.40 2.20 2.50 1.70 1.20 1.75 1.65 1.80 0.86 1.10Cadmium (mg/L) 0.0009 0.0005 0.0005 0.0005 0.0005 0.0005 0.0005 0.0005 0.0005 0.0005Chromium (mg/L) 0.0070 0.0088 0.0080 0.0092 0.0050 0.0058 0.0065 0.0056 0.0050 0.0050Copper (mg/L) 0.0160 0.0297 0.0239 0.0264 0.0098 0.0153 0.0159 0.0134 0.0071 0.0027Lead (mg/L) 0.0160 0.0323 0.0303 0.0229 0.0047 0.0164 0.0162 0.0060 0.0080 0.0012Nickel (mg/L) 0.0078 0.0052 0.0056 0.0104 0.0028 0.0044 0.0048 0.0039 0.0028 0.0021Zinc (mg/L) 0.0950 0.1360 0.1305 0.1340 0.0303 0.0662 0.0769 0.0473 0.0393 0.0124Numbers highlighted in red exceed the NSQD value.

Capitol Region Watershed District 2010 Monitoring Report 44
Capitol Region Watershed District 2010 Monitoring Report 45
Como Lake Subwatershed The Como Lake subwatershed is located directly east of the St. Anthony Park subwatershed, and includes the cities of St. Paul, Roseville, and Falcon Heights (8). Como 7 is one of eight minor subwatersheds within the Como Lake subwatershed, and is located west of Como Lake. North of Como 7 is Como 8 subwatershed, which drains to Gottfried’s Pit, a stormwater detention pond. When the water level in Gottfried’s Pit reaches a specific level, a lift station pumps the water via storm sewer to the Como Park Regional Pond before being discharged to Como Lake. CRWD monitors the Como 7 subwatershed to determine the aggregated or combined improvements to water quality based on the BMPs constructed as part of the Arlington-Pascal Stormwater Improvement Project. Started in 2005, the project included four stormwater BMP types: 1) eight infiltration trenches, 2) eight raingardens, 3) an underground infiltration and storage facility (Arlington-Hamline Underground Storage Facility) and 4) a stormwater pond at the Como Golf Course. These BMPs treat and infiltrate stormwater runoff, minimize localized flooding and reduce stormwater volumes in the storm sewer system. Three of the four BMPs, the Arlington-Hamline Underground Stormwater Storage Facility, eight in-street infiltration trenches and eight neighborhood raingardens, became operational in 2006 and 2007. The last BMP of the project, a storage and retention pond on the Como Park Golf Course (Como Park Regional Pond) became operational in October 2007. To characterize total discharge from the Como 7 subwatershed, CRWD collected and combined monitoring data from two sites: 1) at a storm sewer on the west side of the Como Park Regional Pond and east of Chelsea Avenue (Como 7) and 2) at the outlet of the Como Park Regional Pond (18). The Como 7 site was monitored in 2005 to collect pre-construction data, but not monitored in 2006 due the construction of the BMPs. Monitoring resumed in 2007 to collect post-construction data. Monitoring of the Como Park Regional Pond commenced in 2008. Both the inlet and outlet of the pond are monitored, however, for this monitoring report, only the outlet data was needed for calculating total discharge and pollutant loads from the Como 7 subwatershed. The inlet and outlet data of the stormwater pond are presented in the 2007 and 2008 BMP Monitoring and Maintenance Report (CRWD, 2009). The Como 7 site and Como Park Regional Pond sites will continue to be monitored to determine the effectiveness of the entire project at reducing flow, nutrient, and sediment loading. Flow into the Como 7 site from the north is regulated by a diversion structure at the corner of Chelsea Street and Arlington Avenue which diverts water for treatment to the Golf Course Pond under most flow conditions before discharging to Como Lake. High flows coming into the diversion structure may overtop a high flow weir and be routed to the 60-inch storm sewer that runs through Como 7 before draining to Como Lake. Como 7 Subwatershed Results In 2010, the Como 7 subwatershed produced 15,626,233 cf of runoff, of which 98% was due to stormflow while the remaining 2% resulted from non-storm discharges (Table 13). These non-storm discharges were first documented at the Como 7 monitoring site in 2008, the first year of monitoring after all BMPs were operational. In 2009 and 2010, discharges continued at the Como 7 site, and CRWD collected more samples of these events and assess the quality of these discharges. The results of these non-storm discharges are reflected in the corresponding tables and are labeled “illicit discharge.”

Capitol Region Watershed District 2010 Monitoring Report 46
The total discharge recorded from the Como 7 subwatershed was higher than other monitoring years. The increase in volume can be attributed to a much greater number of storms and Gottfried’s Pit pumping events. 2010 water yield from the Como 7 subwatershed was the highest water yield ever recorded at this monitoring site. In 2010, the total TP flow-weighted average concentration from the Como 7 subwatershed was 0.209 mg/L, similar to the 2009 monitoring year. Total TP load at Como 7 in 2010 was 204 lbs, below average when compared to other monitoring seasons. Stormflow contributed 96% of the TP load for the year, the remainder being from illicit discharges. The flow-weighted average concentration of illicit discharges was 0.188 mg/L, lower than stormflow concentrations. Similar to water yield, the TP yield (lb/ac) was among the lowest in CRWD. When normalized for drainage area and amount of runoff, Como 7 yielded about 80% of normalized TP yields recorded in the previous five years (Figure 14). Total TSS load at the Como 7 subwatershed in 2010 was 33,902 lbs with ninety-four percent of the total loading occurring during storms. Total TSS load in 2010 increased from the previous two years due to the increased amount of precipitation. Like other monitoring years, TSS yield (lb/ac) in 2010 was one of the lowest in CRWD. When normalized for drainage area and amount of runoff, Como 7 yielded lower than average TSS, and has been decreasing since 2005. At the Como 7 subwatershed, the flow-weighted average concentrations of TP and TSS in 2009 were 0.209 mg/L and 35 mg/L, respectively. These values exceed the average concentrations for minimally impacted streams in the NCHF ecoregion and the Mississippi River at Lambert’s Landing. Como 7 Monitoring Site Results Stormwater at the Como 7 monitoring site in 2010 met the EPA’s aquatic life chronic exposure standard for nitrite but not TKN or ammonia (MPCA standard) (see Table 3 for standards). Aquatic life and recreation chronic exposure standards for metals (based on average hardness at each site) were exceeded for cadmium, copper, lead and zinc at the Como 7 site in 2010 (Table 9). Yearly average cadmium, chromium, and nickel concentrations at the Como 7 site did not exceed the chronic exposure toxicity. All storm samples in 2010 exceeded the maximum standard for E. coli (Table 11). None of the three samples collected at Como 7 during illicit discharges exceeded the maximum standard for E. coli in 2010. Como Lake Results Discharge was also measured at the outlet of Como Lake (Figure 2), the location where the entire Como Lake subwatershed flows into the Trout Brook Storm Sewer Interceptor. The outlet structure is regulated by an 8-ft weir that controls lake discharge into the storm sewer system. Data indicated that Como Lake discharged 10,343,700 cf of water in 2010. Lake water quality is monitored by RCPW each summer/fall. The 2010 results are presented in Chapter 4.
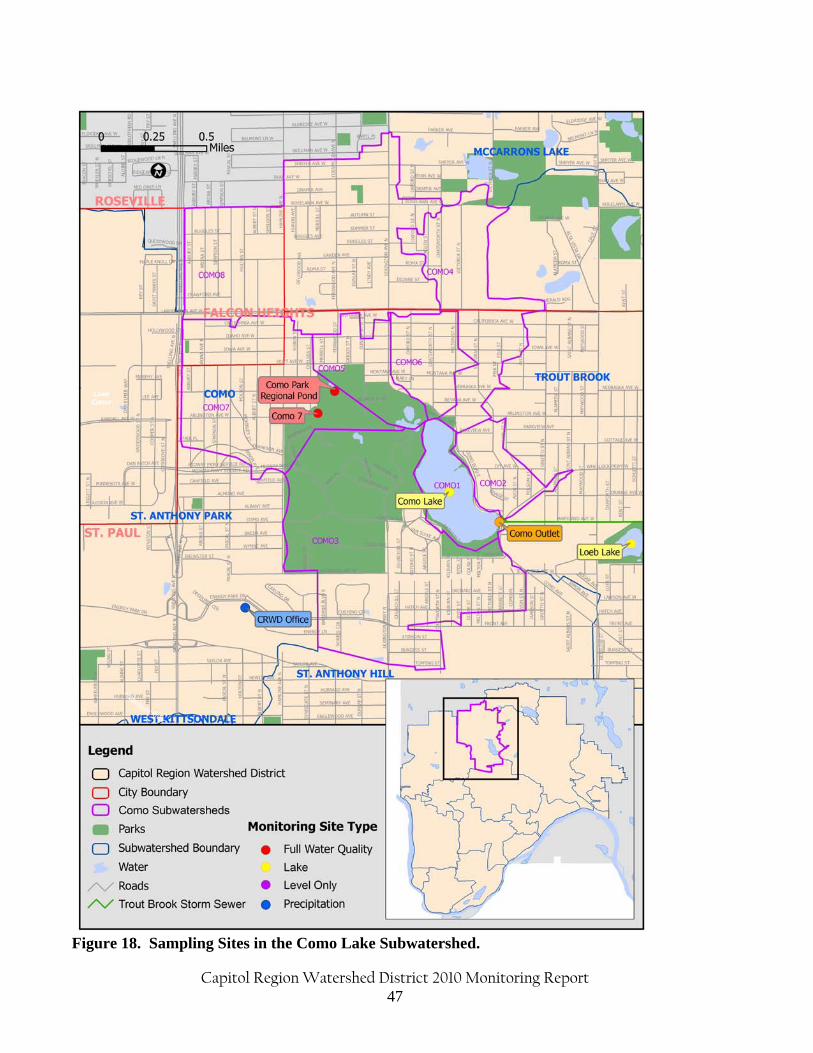
Capitol Region Watershed District 2010 Monitoring Report 47
Figure 18. Sampling Sites in the Como Lake Subwatershed.
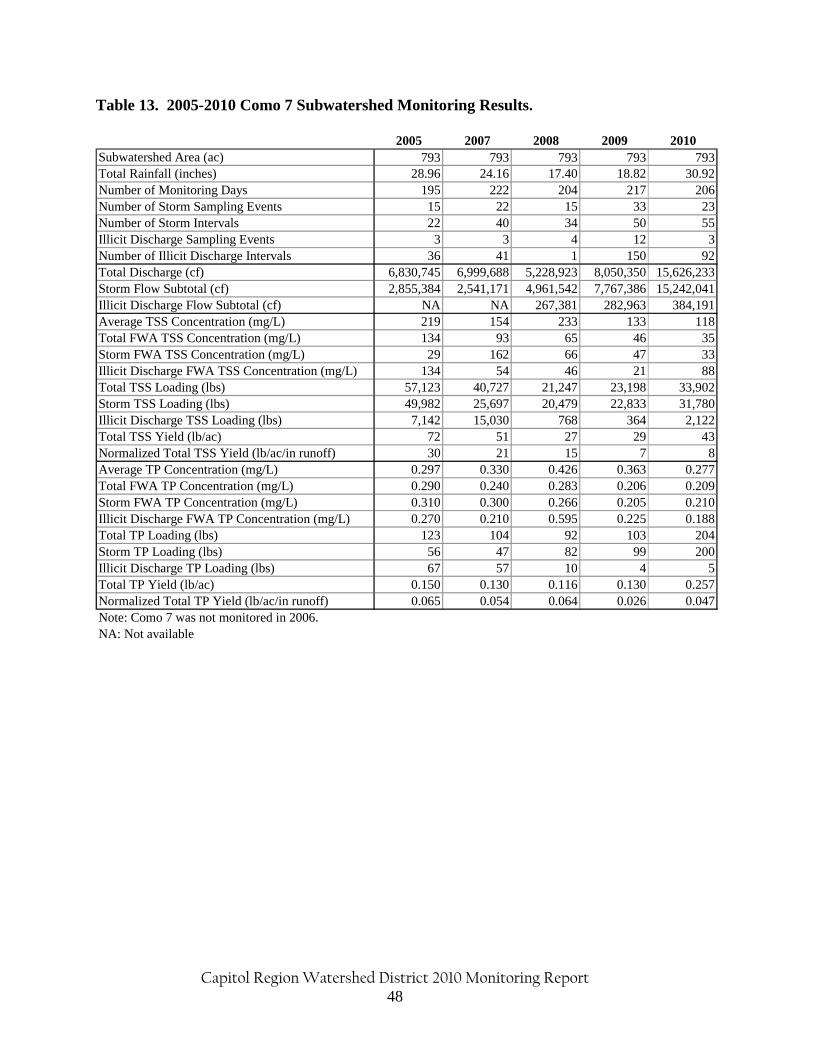
Capitol Region Watershed District 2010 Monitoring Report 48
Table 13. 2005-2010 Como 7 Subwatershed Monitoring Results.
2005 2007 2008 2009 2010Subwatershed Area (ac) 793 793 793 793 793Total Rainfall (inches) 28.96 24.16 17.40 18.82 30.92Number of Monitoring Days 195 222 204 217 206Number of Storm Sampling Events 15 22 15 33 23Number of Storm Intervals 22 40 34 50 55Illicit Discharge Sampling Events 3 3 4 12 3Number of Illicit Discharge Intervals 36 41 1 150 92Total Discharge (cf) 6,830,745 6,999,688 5,228,923 8,050,350 15,626,233Storm Flow Subtotal (cf) 2,855,384 2,541,171 4,961,542 7,767,386 15,242,041Illicit Discharge Flow Subtotal (cf) NA NA 267,381 282,963 384,191Average TSS Concentration (mg/L) 219 154 233 133 118Total FWA TSS Concentration (mg/L) 134 93 65 46 35Storm FWA TSS Concentration (mg/L) 29 162 66 47 33Illicit Discharge FWA TSS Concentration (mg/L) 134 54 46 21 88Total TSS Loading (lbs) 57,123 40,727 21,247 23,198 33,902Storm TSS Loading (lbs) 49,982 25,697 20,479 22,833 31,780Illicit Discharge TSS Loading (lbs) 7,142 15,030 768 364 2,122Total TSS Yield (lb/ac) 72 51 27 29 43Normalized Total TSS Yield (lb/ac/in runoff) 30 21 15 7 8Average TP Concentration (mg/L) 0.297 0.330 0.426 0.363 0.277Total FWA TP Concentration (mg/L) 0.290 0.240 0.283 0.206 0.209Storm FWA TP Concentration (mg/L) 0.310 0.300 0.266 0.205 0.210Illicit Discharge FWA TP Concentration (mg/L) 0.270 0.210 0.595 0.225 0.188Total TP Loading (lbs) 123 104 92 103 204Storm TP Loading (lbs) 56 47 82 99 200Illicit Discharge TP Loading (lbs) 67 57 10 4 5Total TP Yield (lb/ac) 0.150 0.130 0.116 0.130 0.257Normalized Total TP Yield (lb/ac/in runoff) 0.065 0.054 0.064 0.026 0.047Note: Como 7 was not monitored in 2006.NA: Not available
Capitol Region Watershed District 2010 Monitoring Report 49
East Kittsondale Subwatershed
The East Kittsondale subwatershed is located in the southern portion of CRWD and drains 1,116 acres
of St. Paul (Figure 19), the smallest of the four major subwatersheds monitored by CRWD. The
subwatershed empties into the Mississippi River, downstream of the confluence of the Minnesota and
Mississippi Rivers. There are no surface water bodies in the subwatershed. Land use in the
subwatershed is largely residential, with 46% impervious surface cover (CRWD, 2000). CRWD
operates a full water quality monitoring station in the East Kittsondale subwatershed; it is not located at
the true outlet to the river. Because of the deep depth of the storm sewer beneath the ground surface, it
is not possible to monitor any further downstream of the station’s current location. Therefore, the
drainage area of the East Kittsondale monitoring site is 1,116 acres making it the smallest of the four
major subwatersheds monitored by CRWD.
In 2010, 66,983,674 cf of water discharged from the East Kittsondale subwatershed with a majority of
flow occurring as stormflow (Table 14). This is lower than other CRWD major subwatershed sites, and
is expected because the East Kittsondale subwatershed is smaller in area than most sites. East
Kittsondale was monitored for the most of the year in 2010. The 2010 total flow monitored reflects
these additional days of monitoring. In 2009, CRWD quantified the volume of illicit discharges in East
Kittsondale. These illicit discharges occurred throughout the year including during dry periods with no
appreciable rainfall amounts. However, in May 2010, the source of illicit discharges was eliminated,
and no evidence of further discharges was encountered. East Kittsondale exported 60,021 cubic feet of
water per acre during the 2010 monitoring season, the fourth highest of sites monitored throughout the
year, which also includes Phalen Creek, Trout Brook-East Branch, Trout Brook-West Branch, and Trout
Brook Outlet (Table 7).
East Kittsondale exported 773,129 lbs of TSS and 1,425 lbs of TP during in the 2010 monitoring season,
of which 99% and 96% was attributable to stormflow, respectively. These loads are relatively low when
compared to other major subwatershed sites, but remain among the highest when compared to the size of
its drainage area. East Kittsondale exported 693 lbs of TSS per acre and 1.277 lbs of TP per acre. They
were the third highest yields for CRWD monitoring sites monitored throughout in 2010. TSS and TP
yields (lbs/ac) continue to be higher than most other metro area tributaries (Figures 16 and 17). When
normalizing for both drainage area and amount of runoff, the East Kittsondale TSS and TP yields
(lb/ac/in runoff) are the highest for all sites.
Similar to previous years, East Kittsondale’s TP and TSS flow-weighted average concentrations were
the highest in CRWD (Table 8). These concentrations exceeded NCHF ecoregion averages and average
concentrations at Lambert’s Landing.
Yearly average concentrations of ammonia and TKN in East Kittsondale also exceeded agency
standards and Lambert’s Landing concentrations (Tables 8). The site also exceeded the Lambert’s
Landing concentrations for nitrite, cadmium, chromium, zinc, nickel, and chloride. Like most CRWD
monitoring sites, the East Kittsondale yearly average concentrations for lead exceeded agency standards,
but met the other metals standards (Table 9). East Kittsondale chloride concentrations during baseflow
conditions consistently exceeded the chloride standard with 23 out of 24 samples having concentrations
greater than 230 mg/L.
Capitol Region Watershed District 2010 Monitoring Report 50
In 2009 and 2010, CRWD conducted extensive monitoring of East Kittsondale to better understand the
extent and magnitude of the bacteria issues and identify the potential source(s) of the bacteria, which
included collection of more bacteria samples and other IDDE parameters to distinguish between
discharge types. During dry weather from January to mid-May 2010, bacteria levels in TBI greatly
exceeded the State Maximum Surface Water Quality Standard for bacteria of 1,260 cfu/100mL and in
some instances, concentrations were greater than 100,000 colony forming units per 100 milliliters.
CRWD also analyzed samples for other IDDE parameters to help distinguish between four major
discharge types: sanitary wastewater, washwater, natural water, and tap and/or irrigation water. The
four IDDE parameters included ammonia, potassium, fluoride and surfactants. Ammonia and potassium
in high levels may indicate the presence of sanitary wastewater. A ratio of ammonia and potassium
greater than 1.0 likely indicates sanitary wastewater in the discharge. Fluoride levels greater than 0.25
mg/L likely indicate potable water source in areas where water supplies are fluoridated. Surfactants are
the main components of commercial detergents that detach dirt from clothing. Concentrations greater
than 0.25 mg/L likely indicate washwater contamination.
The results of these four IDDE parameters were varied with no strong, evident conclusions to
differentiate the types of discharge. Out of the 26 samples analyzed for both ammonia and potassium,
none of them had an ammonia/potassium ratio greater than 1.0. Nearly 80% of the fluoride samples
exceeded the benchmark level of 0.25 mg/L indicating that these samples may have had significant tap
water. Half of the surfactant samples, which exceeded the benchmark level of 0.25 mg/L, were
indicative of possible washwater contamination.
Daily flows in East Kittsondale provide another source of evidence of illicit discharges into the storm
sewer. During periods of baseflow when no appreciable rain fell within 72 hours of sampling or after
the previous storm’s hydrograph fell, daily flows would surge and on some occasions, double in volume.
The most notable month of daily surges in flow occurred on September 2009 with nine likely illicit
discharges. Several of these surges were fairly significant in volume. On September 2nd, 18th, and
23rd, volumes were greater than 500,000 cubic feet. Several hydrographs from September 2009 are
enclosed for your review.
Since Spring 2008, CRWD staff have observed white, fuzzy masses attached to the bottom of the storm
sewer in East Kittsondale. In November 2008, photos of the white growth were sent to a bacteriologist
at the University of Minnesota who with 75% certainty believes that it is some type of sewer bacteria.
In March 2009, CRWD submitted a sample of the white growth to Metropolitan Council’s (Met
Council) Environmental Services Laboratory for microscopic examination. Met Council identified an
abundance of fungus in the flock with lesser amounts of filamentous bacteria and natural fibers.
In April 2010, CRWD provided a detailed technical memo to the City of Saint Paul outlining the
evidence that points to an illicit discharge in East Kittsondale including water quality and flow data and
photographs of sewer fungus. The City conducted a thorough investigation to pinpoint the source of
pollution and eliminate the illicit connection. By early June 2010, the illicit connection was eliminated
and water quality in East Kittsondale improved during dry weather.
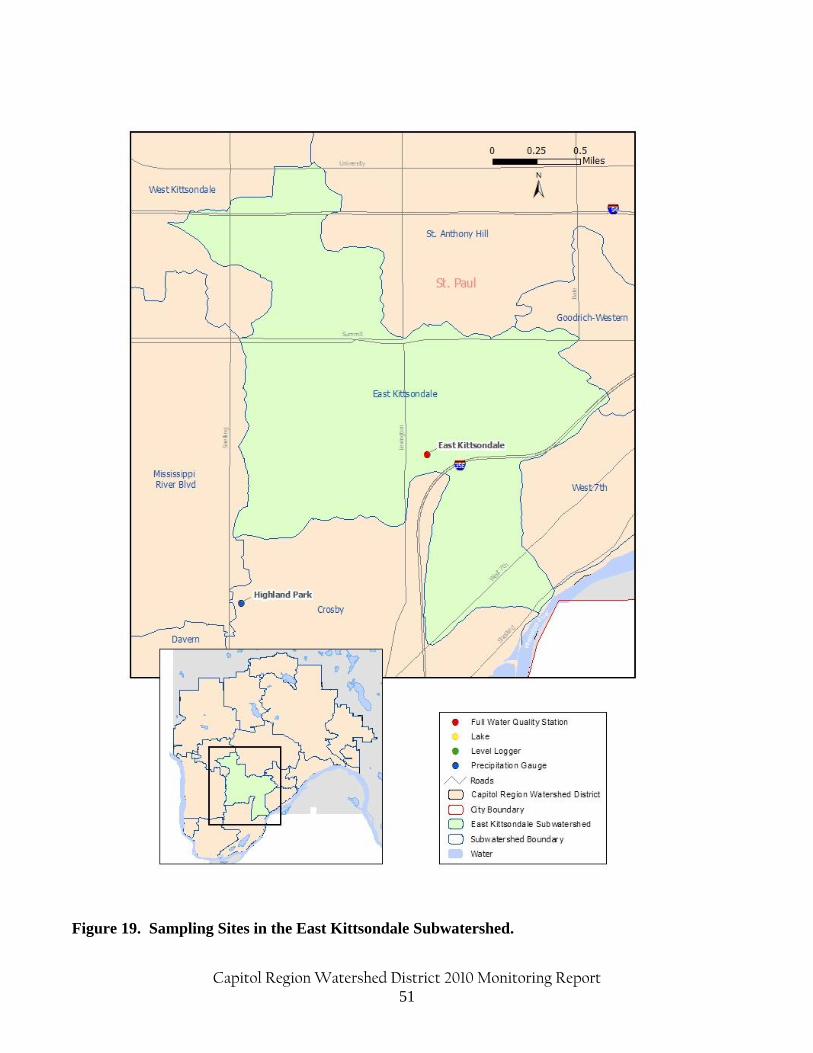
Capitol Region Watershed District 2010 Monitoring Report 51
Figure 19. Sampling Sites in the East Kittsondale Subwatershed.
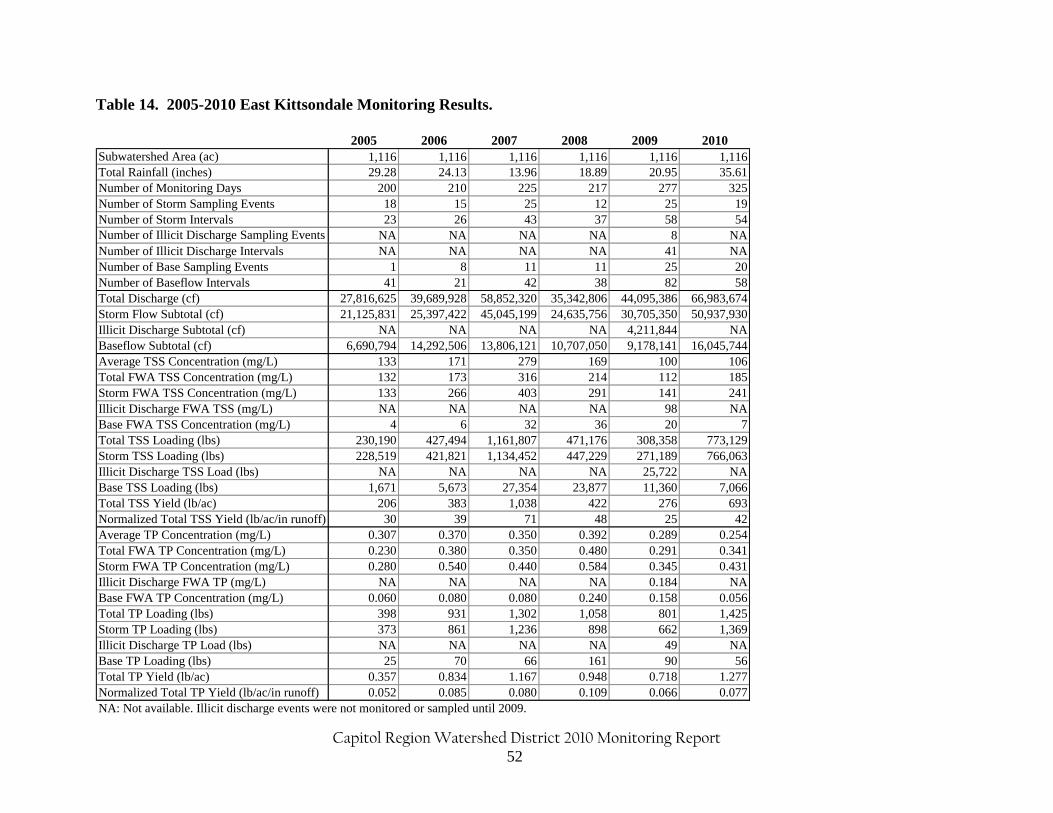
Capitol Region Watershed District 2010 Monitoring Report 52
Table 14. 2005-2010 East Kittsondale Monitoring Results.
2005 2006 2007 2008 2009 2010
Subwatershed Area (ac) 1,116 1,116 1,116 1,116 1,116 1,116
Total Rainfall (inches) 29.28 24.13 13.96 18.89 20.95 35.61
Number of Monitoring Days 200 210 225 217 277 325
Number of Storm Sampling Events 18 15 25 12 25 19
Number of Storm Intervals 23 26 43 37 58 54
Number of Illicit Discharge Sampling Events NA NA NA NA 8 NA
Number of Illicit Discharge Intervals NA NA NA NA 41 NA
Number of Base Sampling Events 1 8 11 11 25 20
Number of Baseflow Intervals 41 21 42 38 82 58
Total Discharge (cf) 27,816,625 39,689,928 58,852,320 35,342,806 44,095,386 66,983,674
Storm Flow Subtotal (cf) 21,125,831 25,397,422 45,045,199 24,635,756 30,705,350 50,937,930
Illicit Discharge Subtotal (cf) NA NA NA NA 4,211,844 NA
Baseflow Subtotal (cf) 6,690,794 14,292,506 13,806,121 10,707,050 9,178,141 16,045,744
Average TSS Concentration (mg/L) 133 171 279 169 100 106
Total FWA TSS Concentration (mg/L) 132 173 316 214 112 185
Storm FWA TSS Concentration (mg/L) 133 266 403 291 141 241
Illicit Discharge FWA TSS (mg/L) NA NA NA NA 98 NA
Base FWA TSS Concentration (mg/L) 4 6 32 36 20 7
Total TSS Loading (lbs) 230,190 427,494 1,161,807 471,176 308,358 773,129
Storm TSS Loading (lbs) 228,519 421,821 1,134,452 447,229 271,189 766,063
Illicit Discharge TSS Load (lbs) NA NA NA NA 25,722 NA
Base TSS Loading (lbs) 1,671 5,673 27,354 23,877 11,360 7,066
Total TSS Yield (lb/ac) 206 383 1,038 422 276 693
Normalized Total TSS Yield (lb/ac/in runoff) 30 39 71 48 25 42
Average TP Concentration (mg/L) 0.307 0.370 0.350 0.392 0.289 0.254
Total FWA TP Concentration (mg/L) 0.230 0.380 0.350 0.480 0.291 0.341
Storm FWA TP Concentration (mg/L) 0.280 0.540 0.440 0.584 0.345 0.431
Illicit Discharge FWA TP (mg/L) NA NA NA NA 0.184 NA
Base FWA TP Concentration (mg/L) 0.060 0.080 0.080 0.240 0.158 0.056
Total TP Loading (lbs) 398 931 1,302 1,058 801 1,425
Storm TP Loading (lbs) 373 861 1,236 898 662 1,369
Illicit Discharge TP Load (lbs) NA NA NA NA 49 NA
Base TP Loading (lbs) 25 70 66 161 90 56
Total TP Yield (lb/ac) 0.357 0.834 1.167 0.948 0.718 1.277
Normalized Total TP Yield (lb/ac/in runoff) 0.052 0.085 0.080 0.109 0.066 0.077
NA: Not available. Illicit discharge events were not monitored or sampled until 2009.
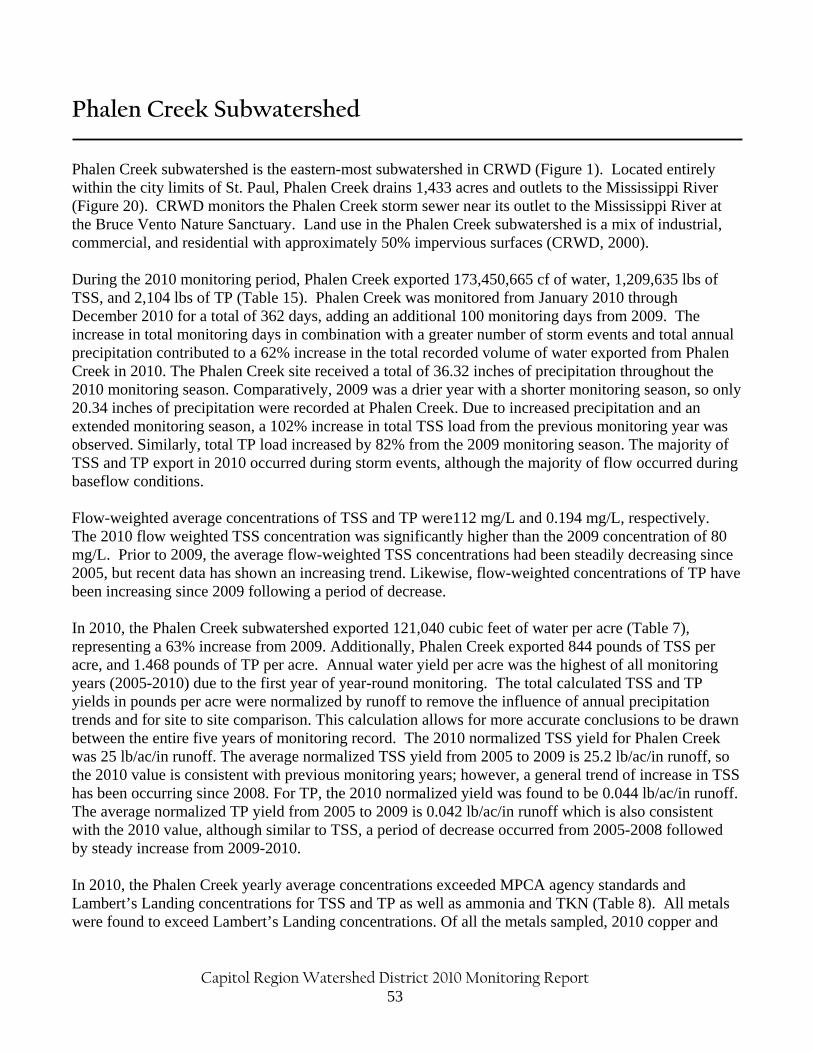
Capitol Region Watershed District 2010 Monitoring Report 53
Phalen Creek Subwatershed Phalen Creek subwatershed is the eastern-most subwatershed in CRWD (Figure 1). Located entirely within the city limits of St. Paul, Phalen Creek drains 1,433 acres and outlets to the Mississippi River (Figure 20). CRWD monitors the Phalen Creek storm sewer near its outlet to the Mississippi River at the Bruce Vento Nature Sanctuary. Land use in the Phalen Creek subwatershed is a mix of industrial, commercial, and residential with approximately 50% impervious surfaces (CRWD, 2000). During the 2010 monitoring period, Phalen Creek exported 173,450,665 cf of water, 1,209,635 lbs of TSS, and 2,104 lbs of TP (Table 15). Phalen Creek was monitored from January 2010 through December 2010 for a total of 362 days, adding an additional 100 monitoring days from 2009. The increase in total monitoring days in combination with a greater number of storm events and total annual precipitation contributed to a 62% increase in the total recorded volume of water exported from Phalen Creek in 2010. The Phalen Creek site received a total of 36.32 inches of precipitation throughout the 2010 monitoring season. Comparatively, 2009 was a drier year with a shorter monitoring season, so only 20.34 inches of precipitation were recorded at Phalen Creek. Due to increased precipitation and an extended monitoring season, a 102% increase in total TSS load from the previous monitoring year was observed. Similarly, total TP load increased by 82% from the 2009 monitoring season. The majority of TSS and TP export in 2010 occurred during storm events, although the majority of flow occurred during baseflow conditions. Flow-weighted average concentrations of TSS and TP were112 mg/L and 0.194 mg/L, respectively. The 2010 flow weighted TSS concentration was significantly higher than the 2009 concentration of 80 mg/L. Prior to 2009, the average flow-weighted TSS concentrations had been steadily decreasing since 2005, but recent data has shown an increasing trend. Likewise, flow-weighted concentrations of TP have been increasing since 2009 following a period of decrease. In 2010, the Phalen Creek subwatershed exported 121,040 cubic feet of water per acre (Table 7), representing a 63% increase from 2009. Additionally, Phalen Creek exported 844 pounds of TSS per acre, and 1.468 pounds of TP per acre. Annual water yield per acre was the highest of all monitoring years (2005-2010) due to the first year of year-round monitoring. The total calculated TSS and TP yields in pounds per acre were normalized by runoff to remove the influence of annual precipitation trends and for site to site comparison. This calculation allows for more accurate conclusions to be drawn between the entire five years of monitoring record. The 2010 normalized TSS yield for Phalen Creek was 25 lb/ac/in runoff. The average normalized TSS yield from 2005 to 2009 is 25.2 lb/ac/in runoff, so the 2010 value is consistent with previous monitoring years; however, a general trend of increase in TSS has been occurring since 2008. For TP, the 2010 normalized yield was found to be 0.044 lb/ac/in runoff. The average normalized TP yield from 2005 to 2009 is 0.042 lb/ac/in runoff which is also consistent with the 2010 value, although similar to TSS, a period of decrease occurred from 2005-2008 followed by steady increase from 2009-2010. In 2010, the Phalen Creek yearly average concentrations exceeded MPCA agency standards and Lambert’s Landing concentrations for TSS and TP as well as ammonia and TKN (Table 8). All metals were found to exceed Lambert’s Landing concentrations. Of all the metals sampled, 2010 copper and
Capitol Region Watershed District 2010 Monitoring Report 54
lead concentrations were found to exceed the MPCA chronic toxicity standards for surface waters. Zinc concentrations exceeded the chronic toxicity standard only during storms. During baseflow conditions, Phalen Creek samples did not exceed the state maximum E.coli standard of 1,260 cfu/100mL (Table 10). Seven E. coli samples were collected at Phalen Creek during storm events in 2010. Similar to previous years, every stormwater sample collected in 2010 exceeded the state standard for bacteria with a maximum measured value of 27,500 cfu/100mL (over 20 times the state standard).
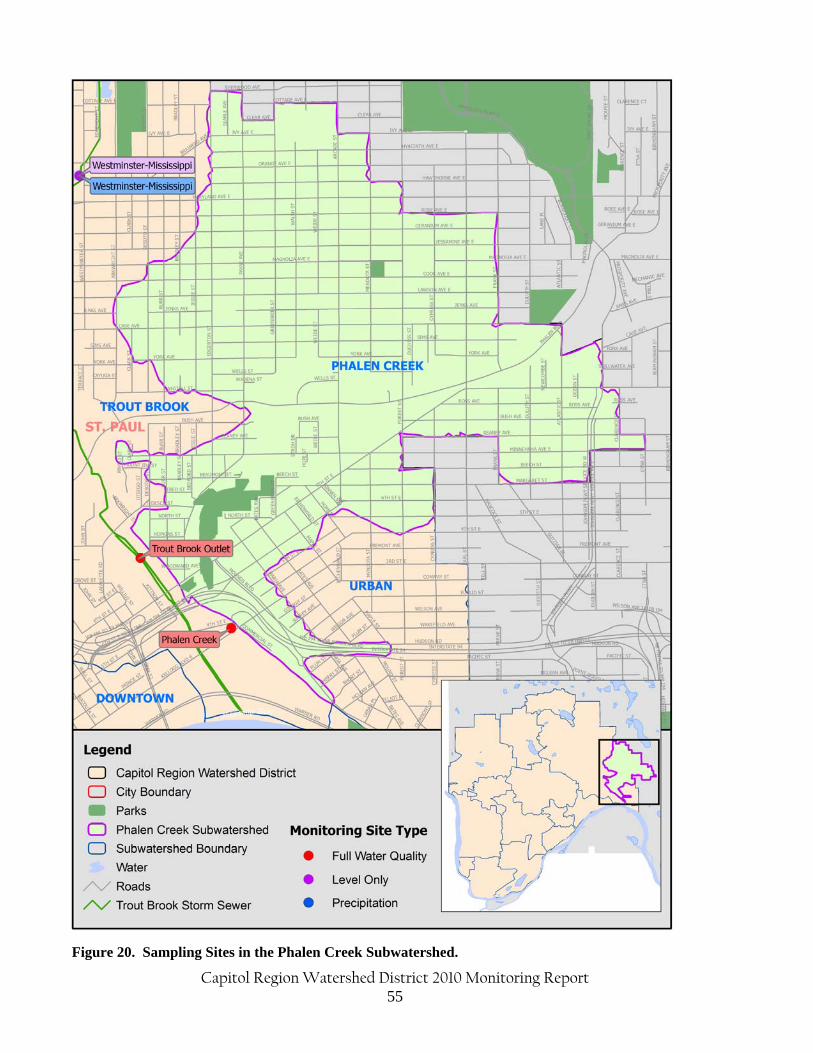
Capitol Region Watershed District 2010 Monitoring Report 55
Figure 20. Sampling Sites in the Phalen Creek Subwatershed.
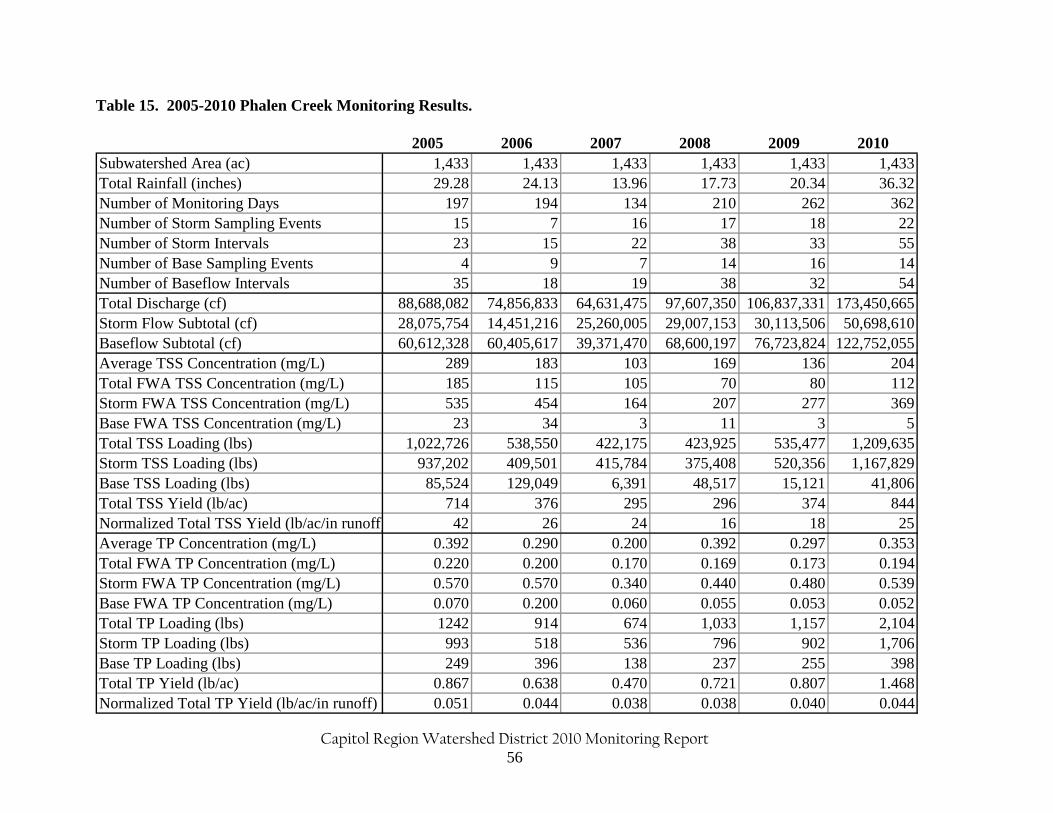
Capitol Region Watershed District 2010 Monitoring Report 56
Table 15. 2005-2010 Phalen Creek Monitoring Results.
2005 2006 2007 2008 2009 2010Subwatershed Area (ac) 1,433 1,433 1,433 1,433 1,433 1,433Total Rainfall (inches) 29.28 24.13 13.96 17.73 20.34 36.32Number of Monitoring Days 197 194 134 210 262 362Number of Storm Sampling Events 15 7 16 17 18 22Number of Storm Intervals 23 15 22 38 33 55Number of Base Sampling Events 4 9 7 14 16 14Number of Baseflow Intervals 35 18 19 38 32 54Total Discharge (cf) 88,688,082 74,856,833 64,631,475 97,607,350 106,837,331 173,450,665Storm Flow Subtotal (cf) 28,075,754 14,451,216 25,260,005 29,007,153 30,113,506 50,698,610Baseflow Subtotal (cf) 60,612,328 60,405,617 39,371,470 68,600,197 76,723,824 122,752,055Average TSS Concentration (mg/L) 289 183 103 169 136 204Total FWA TSS Concentration (mg/L) 185 115 105 70 80 112Storm FWA TSS Concentration (mg/L) 535 454 164 207 277 369Base FWA TSS Concentration (mg/L) 23 34 3 11 3 5Total TSS Loading (lbs) 1,022,726 538,550 422,175 423,925 535,477 1,209,635Storm TSS Loading (lbs) 937,202 409,501 415,784 375,408 520,356 1,167,829Base TSS Loading (lbs) 85,524 129,049 6,391 48,517 15,121 41,806Total TSS Yield (lb/ac) 714 376 295 296 374 844Normalized Total TSS Yield (lb/ac/in runoff) 42 26 24 16 18 25Average TP Concentration (mg/L) 0.392 0.290 0.200 0.392 0.297 0.353Total FWA TP Concentration (mg/L) 0.220 0.200 0.170 0.169 0.173 0.194Storm FWA TP Concentration (mg/L) 0.570 0.570 0.340 0.440 0.480 0.539Base FWA TP Concentration (mg/L) 0.070 0.200 0.060 0.055 0.053 0.052Total TP Loading (lbs) 1242 914 674 1,033 1,157 2,104Storm TP Loading (lbs) 993 518 536 796 902 1,706Base TP Loading (lbs) 249 396 138 237 255 398Total TP Yield (lb/ac) 0.867 0.638 0.470 0.721 0.807 1.468Normalized Total TP Yield (lb/ac/in runoff) 0.051 0.044 0.038 0.038 0.040 0.044

Capitol Region Watershed District 2010 Monitoring Report 57
St. Anthony Park Subwatershed The St. Anthony Park subwatershed has a drainage area of 3,418 acres and is the western-most subwatershed monitored by CRWD (Figure 21). CRWD monitors the storm sewer outlet of the St. Anthony Park subwatershed where it directly flows into the Mississippi River at Desnoyer Park in St. Paul. The subwatershed is primarily comprised of industrial and residential land uses with 48% impervious surface land coverage. CRWD also monitors a 929 acre upland subwatershed of St. Anthony Park called Sarita. The Sarita subwatershed is monitored in a storm sewer at the outlet of the Sarita Wetland near Como Avenue (Figure 21). The Sarita subwatershed has substantially different land use than any other CRWD subwatershed because it encompasses the Minnesota State Fair Grounds and the University of Minnesota St. Paul Campus where open space dominates. The predominant land use within the Sarita subwatershed is institutional with 16% impervious surface coverage. Sarita Subwatershed Total discharge from the Sarita subwatershed in 2010 was 5,052,244 cubic feet (cf), all of which was measured to be storm flow (Table 17). The Sarita outlet was monitored for 205 days in 2010 equaling a total of 8 days less than 2009; however, there was a 150% increase in total measured discharge due to a greater number of storm events and total annual precipitation. The Sarita subwatershed received a total of 30.62 inches of precipitation throughout the 2010 monitoring season. In comparison, only 18.72 inches of precipitation were recorded in 2009. Like previous monitoring years, Sarita had the lowest total water yield of all the full water quality monitoring sites even in comparison to those sites with similar drainage area. This could potentially be attributed to the lesser total area with impervious surfaces covering the Sarita subwatershed as well as the recent implementation of several large scale BMP projects in the upland. In 2010, the Sarita subwatershed exported 77 lbs of total phosphorous (TP) and 45,191 lbs of total suspended solids (TSS). This is the highest recorded amount of TSS exported from Sarita since monitoring commenced in 2006 (Table 16). The total flow-weighted average (FWA) concentrations of TP and TSS were 0.246 mg/L and 143 mg/L respectively. Similarly, this is the highest FWA TSS value found at Sarita since 2006. In comparison to other sites in CRWD, Sarita generated the lowest total TP yields than any other subwatershed in 2010 (Table 7). However, both TP and TSS total FWAs at Sarita exceeded the Northern Central Hardwood Forest (NCHF) ecoregion averages as well as the Lambert’s Landing reference site average concentrations. For further analysis, the total calculated TSS and TP yields in pounds per acre were normalized by runoff to remove the influence of annual precipitation trends and for site to site comparison. This calculation allows for more accurate conclusions to be drawn between the entire five years of monitoring record. The 2010 normalized TSS yield for Sarita was 32 lb/ac/in runoff. In comparison to other monitored sites in CRWD, Sarita exported the second highest normalized TSS value in 2010, falling only behind East Kittsondale. For TP, the 2010 normalized yield was found to be 0.055 lb/ac/in runoff, showing a slight increase from the 2009 value of 0.047 lb/ac/in runoff.
Capitol Region Watershed District 2010 Monitoring Report 58
The average concentrations of both copper (0.0086 mg/L) and lead (0.0132 mg/L) at Sarita exceeded MPCA toxicity standards in 2010 (Table 9). The average annual concentrations of chromium, cadmium, nickel, and zinc were found to exceed Lambert’s Landing average concentrations, but not the MPCA agency standards. Four Escherichia coli (E. coli) grab samples were taken during storm events at Sarita in 2010. Three out of four of those samples exceeded the maximum state agency standard for bacteria of 1,260 cfu/100mL with concentrations ranging from 276 cfu/100mL to 72,700 cfu/100mL and an average of 38,869 cfu/100mL (Table 11). St. Anthony Park During the period of April through November 2010, the St. Anthony Park subwatershed exported 117,851,525 cf of water, 1,313 lbs of TP, and 904,150lbs of TSS (Table 16). The 2010 total recorded discharge was 19% more than the total discharge in 2009 despite 30 fewer monitoring days. This greater volume of discharge is primarily due to an increase in storm events and total annual precipitation in 2010. The St. Anthony Park subwatershed received a total of 26.84 inches of precipitation throughout the 2010 monitoring season. In comparison, 2009 was drier with only 18.72 inches of precipitation. Subsequently, the 2010 water yield (cf/ac) was greater than the 2009 yield, but was significantly lower than yields from 2005 to 2007 even though similar amounts of precipitation occurred during these years. For TSS, a 53% increase in the average TSS load (lbs) from the previous monitoring year was observed, even with a decreased monitoring season length in 2010. The total TP load increased by 23% from the 2009 monitoring season. The data shows that the majority of TSS and TP exported in 2010 occurred during storm events. In evaluating the 2010 total flow-weighted averages (FWA), TP and TSS concentrations were found to be 0.178 mg/L and 123 mg/L, respectively. Both were the highest FWAs ever monitored at this site since 2005. Additionally, both FWA concentrations exceeded the NCHF ecoregion averages as well as average concentrations observed at Lambert’s Landing. The total calculated TSS and TP yields in pounds per acre were normalized by runoff to remove the influence of annual precipitation trends and for site to site comparison. The 2010 normalized TSS yield for St. Anthony Park was 28 lb/ac/in runoff. In comparison to other monitored sites in CRWD, St. Anthony exported the third highest normalized TSS value in 2010, falling only behind East Kittsondale and Sarita. For TP, the 2010 normalized yield was found to be 0.040 lb/ac/in runoff, which is the lowest recorded value for all 2010 CRWD monitoring sites. In 2010, the St. Anthony Park average annual concentrations for ammonia, TKN, copper, lead, and zinc exceeded MPCA agency standards as well as Lambert’s Landing concentrations (Table 8). Additionally, all other metals (cadmium, chromium, nickel) exceeded Lambert’s Landing concentrations, but not the MPCA agency standards. Thirteen E. coli grab samples were taken at St. Anthony Park during baseflow conditions in 2010; all met the state maximum standard of 1,260 mpn/100mL (Table 10). Seven E. coli grab samples were collected at St. Anthony Park during storm events in 2010. All seven samples exceeded the state maximum standard for bacteria ranging from 1,733 cfu/100mL to 22,800 cfu/100mL.
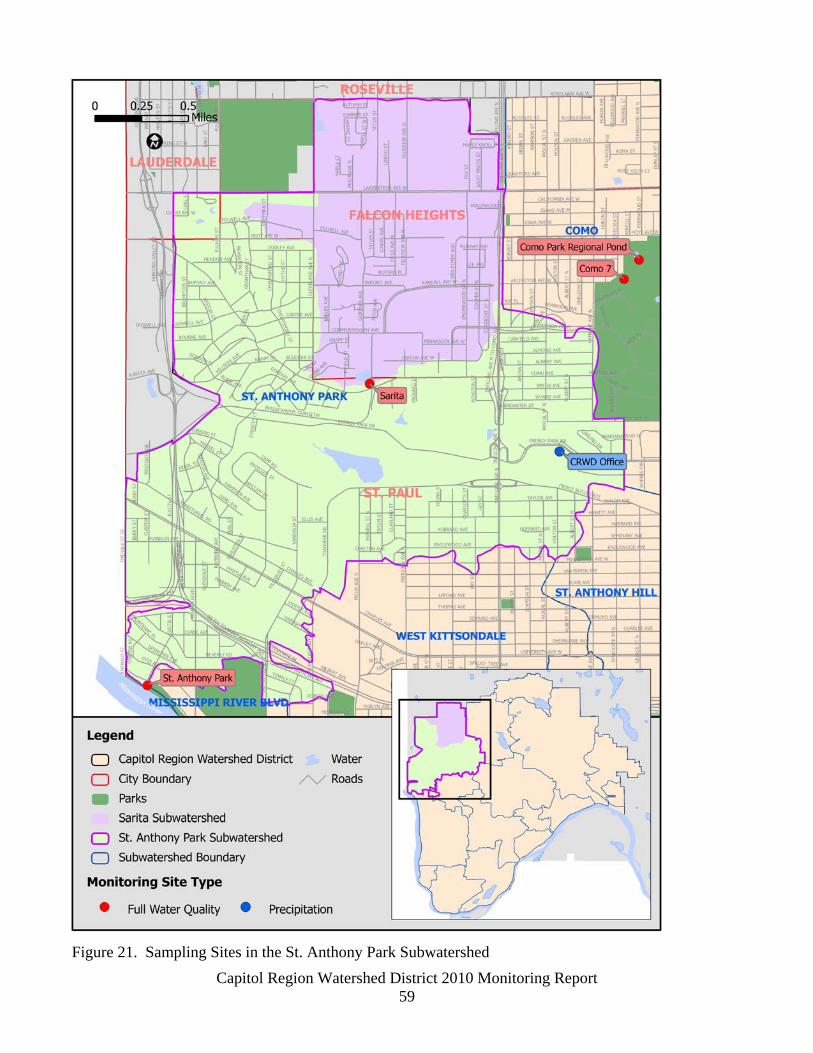
Capitol Region Watershed District 2010 Monitoring Report 59
Figure 21. Sampling Sites in the St. Anthony Park Subwatershed
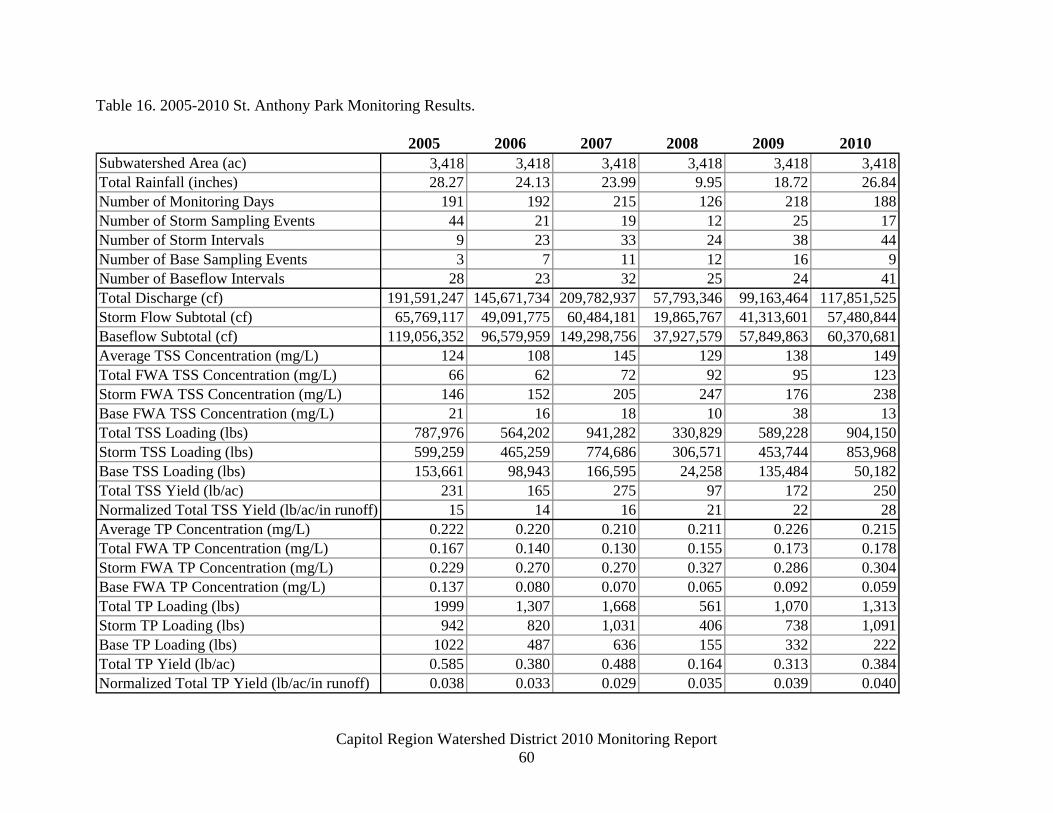
Capitol Region Watershed District 2010 Monitoring Report 60
Table 16. 2005-2010 St. Anthony Park Monitoring Results.
2005 2006 2007 2008 2009 2010Subwatershed Area (ac) 3,418 3,418 3,418 3,418 3,418 3,418Total Rainfall (inches) 28.27 24.13 23.99 9.95 18.72 26.84Number of Monitoring Days 191 192 215 126 218 188Number of Storm Sampling Events 44 21 19 12 25 17Number of Storm Intervals 9 23 33 24 38 44Number of Base Sampling Events 3 7 11 12 16 9Number of Baseflow Intervals 28 23 32 25 24 41Total Discharge (cf) 191,591,247 145,671,734 209,782,937 57,793,346 99,163,464 117,851,525Storm Flow Subtotal (cf) 65,769,117 49,091,775 60,484,181 19,865,767 41,313,601 57,480,844Baseflow Subtotal (cf) 119,056,352 96,579,959 149,298,756 37,927,579 57,849,863 60,370,681Average TSS Concentration (mg/L) 124 108 145 129 138 149Total FWA TSS Concentration (mg/L) 66 62 72 92 95 123Storm FWA TSS Concentration (mg/L) 146 152 205 247 176 238Base FWA TSS Concentration (mg/L) 21 16 18 10 38 13Total TSS Loading (lbs) 787,976 564,202 941,282 330,829 589,228 904,150Storm TSS Loading (lbs) 599,259 465,259 774,686 306,571 453,744 853,968Base TSS Loading (lbs) 153,661 98,943 166,595 24,258 135,484 50,182Total TSS Yield (lb/ac) 231 165 275 97 172 250Normalized Total TSS Yield (lb/ac/in runoff) 15 14 16 21 22 28Average TP Concentration (mg/L) 0.222 0.220 0.210 0.211 0.226 0.215Total FWA TP Concentration (mg/L) 0.167 0.140 0.130 0.155 0.173 0.178Storm FWA TP Concentration (mg/L) 0.229 0.270 0.270 0.327 0.286 0.304Base FWA TP Concentration (mg/L) 0.137 0.080 0.070 0.065 0.092 0.059Total TP Loading (lbs) 1999 1,307 1,668 561 1,070 1,313Storm TP Loading (lbs) 942 820 1,031 406 738 1,091Base TP Loading (lbs) 1022 487 636 155 332 222Total TP Yield (lb/ac) 0.585 0.380 0.488 0.164 0.313 0.384Normalized Total TP Yield (lb/ac/in runoff) 0.038 0.033 0.029 0.035 0.039 0.040
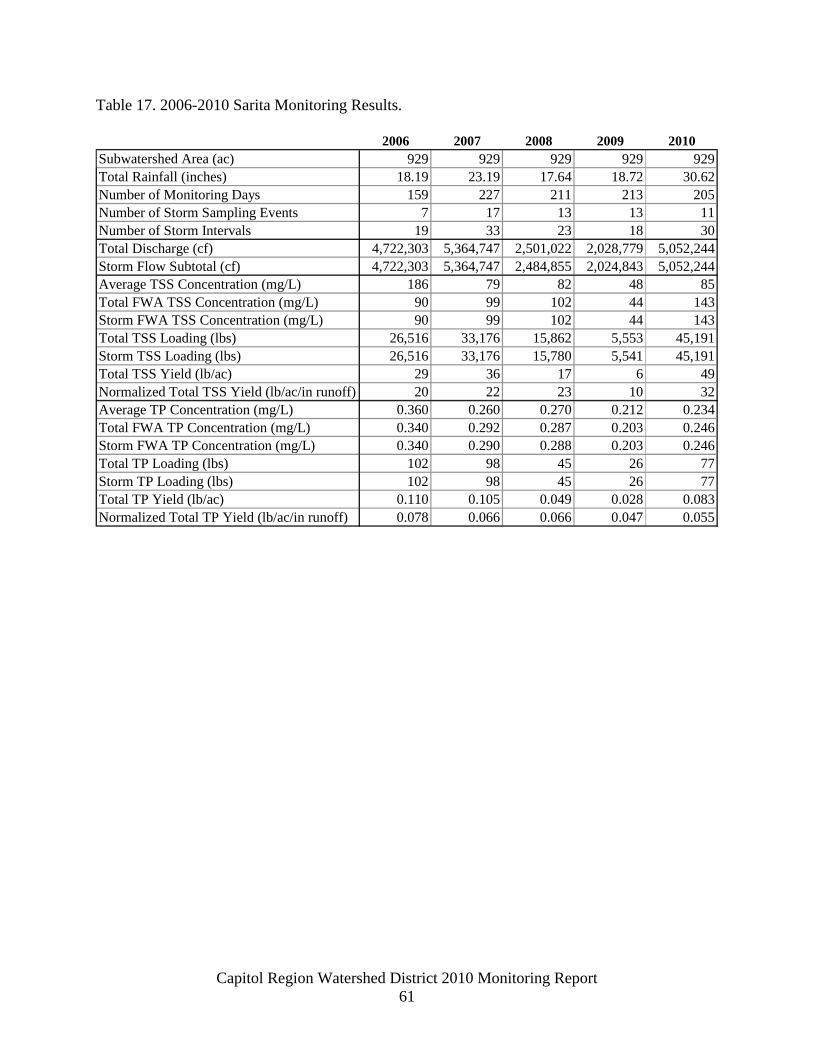
Capitol Region Watershed District 2010 Monitoring Report 61
Table 17. 2006-2010 Sarita Monitoring Results.
2006 2007 2008 2009 2010Subwatershed Area (ac) 929 929 929 929 929Total Rainfall (inches) 18.19 23.19 17.64 18.72 30.62Number of Monitoring Days 159 227 211 213 205Number of Storm Sampling Events 7 17 13 13 11Number of Storm Intervals 19 33 23 18 30Total Discharge (cf) 4,722,303 5,364,747 2,501,022 2,028,779 5,052,244Storm Flow Subtotal (cf) 4,722,303 5,364,747 2,484,855 2,024,843 5,052,244Average TSS Concentration (mg/L) 186 79 82 48 85Total FWA TSS Concentration (mg/L) 90 99 102 44 143Storm FWA TSS Concentration (mg/L) 90 99 102 44 143Total TSS Loading (lbs) 26,516 33,176 15,862 5,553 45,191Storm TSS Loading (lbs) 26,516 33,176 15,780 5,541 45,191Total TSS Yield (lb/ac) 29 36 17 6 49Normalized Total TSS Yield (lb/ac/in runoff) 20 22 23 10 32Average TP Concentration (mg/L) 0.360 0.260 0.270 0.212 0.234Total FWA TP Concentration (mg/L) 0.340 0.292 0.287 0.203 0.246Storm FWA TP Concentration (mg/L) 0.340 0.290 0.288 0.203 0.246Total TP Loading (lbs) 102 98 45 26 77Storm TP Loading (lbs) 102 98 45 26 77Total TP Yield (lb/ac) 0.110 0.105 0.049 0.028 0.083Normalized Total TP Yield (lb/ac/in runoff) 0.078 0.066 0.066 0.047 0.055

Capitol Region Watershed District 2010 Monitoring Report 62

Capitol Region Watershed District 2010 Monitoring Report 63
Trout Brook Subwatershed The entire Trout Brook subwatershed is the largest subwatershed in CRWD that drains 8,000 acres in the cities of St. Paul, Maplewood, Falcon Heights and Roseville and includes the drainage areas of Como Lake in Saint Paul and Lake McCarrons in Roseville (Figure 22). It also contains Loeb Lake and five major stormwater ponds. Land use in the Trout Brook subwatershed is a mix of residential, industrial, and commercial, with 40% impervious surface. Runoff in the subwatershed drains to CRWD’s Trout Brook Storm Sewer Interceptor (TBI), which connects to the City of St. Paul’s storm sewer interceptor before eventually discharging to the Mississippi River, just downstream of Lambert’s Landing in St. Paul. TBI is six and a half miles in length with pipe sizes ranging from 6 to 13 feet in diameter. The upper section of TBI is comprised of two branches, east and west, which converge near the intersection of Maryland Avenue and I-35E in St. Paul. For monitoring and data analysis purposes, CRWD does not consider the drainage areas of Como Lake and Lake McCarrons as part of the Trout Brook subwatershed drainage area. The Trout Brook subwatershed area considered for monitoring purposes is 5,028 acres. Three sites were monitored from January through December for water quality and water quantity in the Trout Brook subwatershed: 1) the west branch of TBI (Trout Brook – West Branch), 2) the east branch of TBI (Trout Brook – East Branch), and 3) the outlet upstream of the connection to the City of Saint Paul’s storm sewer interceptor (Trout Brook Outlet). Water levels were also measured in Loeb Lake and three stormwater ponds (Arlington-Jackson, Sims-Agate, and Westminster-Mississippi). The Arlington-Arkwright and Willow Reserve ponds were not monitored. In addition, CRWD measured precipitation at Trout Brook - East Branch and the Westminster-Mississippi Stormwater Pond monitoring sites (Figure 22). Trout Brook – West Branch Trout Brook – West Branch subwatershed drains 2,379 acres in St. Paul, Roseville, and Falcon Heights. It has the third largest drainage area of the nine baseline monitoring sites. The Arlington-Jackson Stormwater Pond, Willow Reserve Stormwater Pond, Como Lake, Lake McCarrons, and Loeb Lake are located in this subwatershed (Figure 22). The monitoring site is located just upstream of the convergence with the east branch of the TBI, in the northwest quadrant of the intersection of Maryland Avenue and I-35E. Because of the longer and wetter monitoring season in 2010 (January through December), Trout Brook – West Branch produced greater total loads and yields of TP and TSS than average. The site exported 333,565,680 cf of water, 1,991,582 lbs of TSS, and 3,820 lbs of TP. Trout Brook – West Branch produced the second highest TP and TSS load of any site in 2010, behind Trout Brook Outlet. Pollutant loading at this site is driven by stormflow despite the fact that 59% of the flow was comprised of baseflow. Ninety four percent of the TSS load and 82% of the TP load were exported during storm events, which is higher than normal for this site. Trout Brook - West Branch yielded 82,897 cf/acre of water in 2010. The site yielded 1.606 lbs/acre of TP in 2010, the highest among sites monitored throughout the entire year, and yielded 837 lbs/acre of TSS, the second highest yield of sites monitored throughout the entire year. Normalized TP and TSS yields (lb/acre/in runoff) for Trout Brook – West Branch were similar to their historical averages.
Capitol Region Watershed District 2010 Monitoring Report 64
The flow-weighted average TSS concentration at Trout Brook – West Branch was 96 mg/L, higher than the 2009 concentration. This TSS concentration exceeded the average concentrations for minimally impacted streams in the NCHF ecoregion and Lambert’s Landing. The flow-weighted average TP concentration was 0.183 mg/L, a slight increase from 2009. Despite this increase, the concentration was still comparable to most other baseline monitoring sites. This TP concentration exceeded both the NCHF average and the Lambert’s Landing concentrations. Trout Brook – West Branch subwatershed comprises a little over half of the drainage area of the Trout Brook Outlet subwatershed and contributed 67% of the total discharge, 69% of the total phosphorus, and 78% of TSS to Trout Brook Outlet in 2010. Like other CRWD sites, the average stormflow concentrations for copper, lead, and zinc at Trout Brook – West Branch exceeded MPCA toxicity standards (Table 9). Baseflow average concentrations for all of the metal parameters met their toxicity standards. The site also exceeded the MPCA and EPA standards for ammonia and TKN during both baseflow and storm conditions. Two of sixteen E. coli samples at Trout Brook – West Branch during baseflow exceeded the state maximum standard of 1,260 cfu/100mL (Table 10). All bacteria samples exceeded the maximum standard during storm conditions with concentrations ranging from 1,986 mpn/100mL to 21,600 cfu/100mL (Table 11). Trout Brook – East Branch Trout Brook - East Branch drains 932 acres in St. Paul and Maplewood and includes two stormwater ponds, Westminster-Mississippi and Arlington-Arkwright. First established in 2006, this monitoring station was moved slightly downstream in 2007 from its original location to a manhole located between L’Orient Street and I-35E ramp (Figure 22). Like Trout Brook – West Branch, this site was monitored throughout the year and total recorded flow at Trout Brook – East Branch in 2010 was greater than other monitoring years. Trout Brook – East Branch exported 41,959,911 cf of water (Table 20), a 58% increase from 2009; 115,109 lbs of TSS, a 76% increase from 2009; and 683 lbs of TP, a 178% increase from 2009. These pollutant loads are still low when compared to other baseline monitoring sites. The flow-weighted average concentrations of TSS and TP were the lowest of all sites in 2010 (Figures 6 and 7). The 2010 flow-weighted average TSS concentration of 44 mg/L exceeded the Lambert’s Landing average concentration and the NCHF average concentration. The flow-weighted average TP concentration in 2010 of 0.261 mg/L also exceeded average concentrations of the NCHF ecoregion and Lambert’s Landing. Trout Brook – East Branch yielded 45,021 cubic feet of water per acre (Table 7), 124 lbs/ac of TSS, and 0.733 lbs/ac of TP. The TSS and TP yields for Trout Brook – East Branch were higher than their historical averages (Figures 10 and 13). Compared to the other baseline monitoring site yields, Trout Brook – East Branch resulted in below average pollutant yields. Trout Brook – East Branch comprises 19% of the subwatershed area of the Trout Brook - Outlet and contributed 8% of the total flow. Trout Brook – East Branch contributed 5 and 12% of the total TP and TSS loads, respectively.
Capitol Region Watershed District 2010 Monitoring Report 65
Like other CRWD sites, the average stormflow concentrations for copper and lead at Trout Brook – East Branch exceeded MPCA toxicity standards (Table 9). Baseflow average concentrations for all of the metal parameters met their toxicity standards. The site also exceeded the MPCA and EPA standards for ammonia and TKN during both baseflow and storm conditions. The site also exceeded the MPCA chloride standard during baseflow conditions with an average concentration of 334 mg/L. During most baseflow events, bacteria concentrations at Trout Brook – East Branch met the state maximum standard with only two samples exceeding it (Table 10). All samples taken during storm events exceeded the MPCA standard value with concentrations ranging from 1,986 mpn/100mL to 42,800 mpn/100mL (Table 11). Trout Brook Outlet Trout Brook Outlet receives water from nearly 5,028 acres of the Trout Brook subwatershed, which does not include the drainage areas of Como Lake and Lake McCarrons (Figure 22). In 2010, Trout Brook Outlet exported 496,585,344 cf of water, and exported 2,557,705 lbs of TSS and 5,529 lbs of TP (Table 21). The flow and loads were the highest of any CRWD baseline site in 2010. The 2010 monitoring year saw the highest TSS load and TP loads of all monitoring years for all sites. In 2010, total flow-weighted average TSS and TP concentrations were 82 mg/L and 0.178 mg/L, respectively, both similar to concentrations seen in previous years. The TP and TSS concentrations exceeded the NCHF ecoregion and Lambert’s Landing average concentrations (Table 7). Trout Brook Outlet yielded 98,764 cf/ac of water (Table 8),509 lbs/ac of TSS, and 1.100 lbs/ac of TP. The water yield is the third highest of CRWD baseline sites monitored throughout the year behind Phalen Creek and Trout Brook-West Branch. This high yield may be attributed to the significantly higher total discharge at Trout Brook Outlet. Despite its larger subwatershed size, the yield (lb/ac) was still nearly twice as high as any other baseline monitoring site. Baseflow comprised a major portion of the total discharge, 63%. The large amount of baseflow is likely a result of groundwater entering the pipe in the downstream section because of low elevations of the storm sewers, which is an occurrence seen at other higher water yield sites. The average concentrations for ammonia and TKN exceeded agency standards. Average concentrations of copper and lead exceeded MPCA standards during storms, but not during baseflow (Table 9). Average concentrations for TP, TSS, ammonia, and TKN, metals, and chloride, were higher than the NCHF ecoregion and Lambert’s Landing concentrations. Only one baseflow sample exceeded the E. coli maximum standard with a concentration of 5,200 mpn/100mL. Only one sample taken during storm events did not exceed the MPCA standard value with concentrations ranging 46 mpn/100mL to 16,800 mpn/100mL (Table 10).
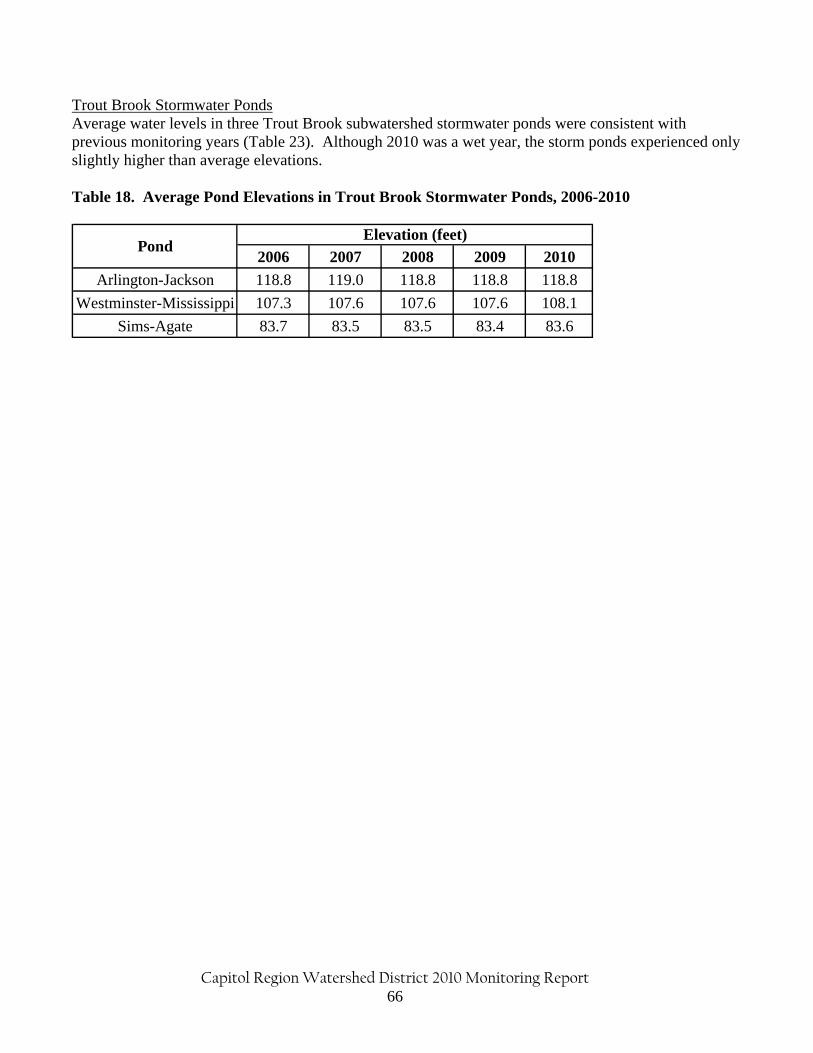
Capitol Region Watershed District 2010 Monitoring Report 66
Trout Brook Stormwater Ponds Average water levels in three Trout Brook subwatershed stormwater ponds were consistent with previous monitoring years (Table 23). Although 2010 was a wet year, the storm ponds experienced only slightly higher than average elevations. Table 18. Average Pond Elevations in Trout Brook Stormwater Ponds, 2006-2010
2006 2007 2008 2009 2010
Arlington-Jackson 118.8 119.0 118.8 118.8 118.8
Westminster-Mississippi 107.3 107.6 107.6 107.6 108.1
Sims-Agate 83.7 83.5 83.5 83.4 83.6
PondElevation (feet)
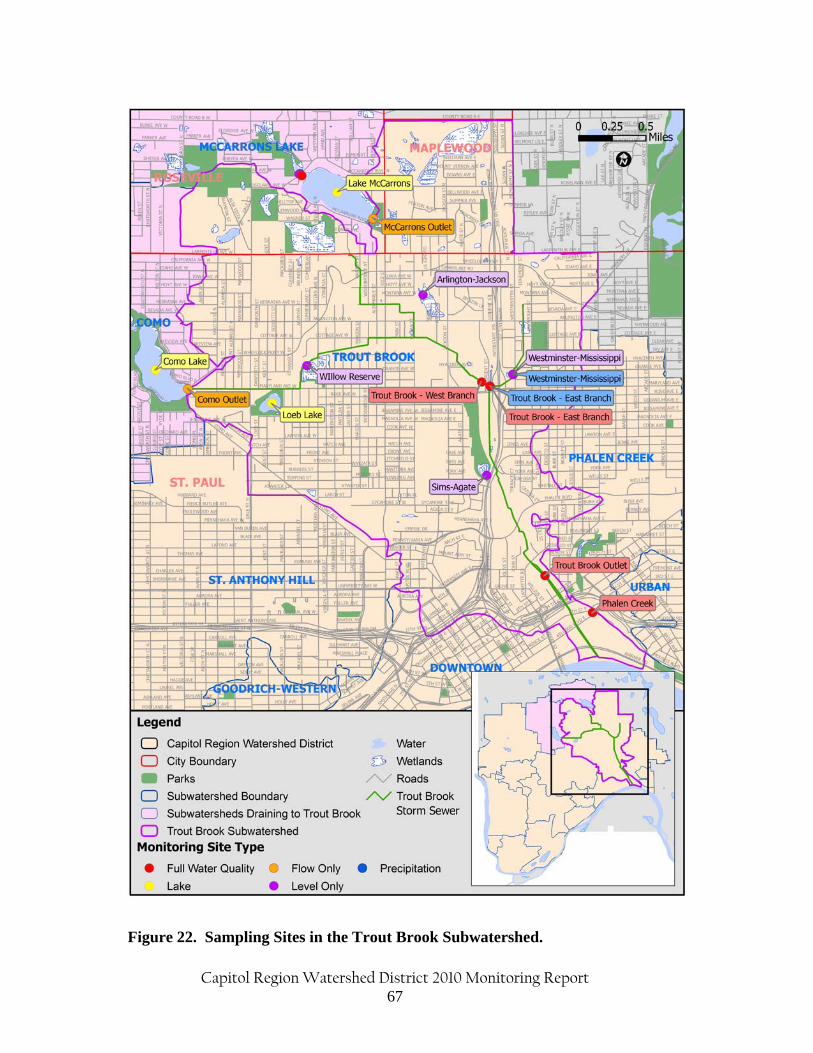
Capitol Region Watershed District 2010 Monitoring Report 67
Figure 22. Sampling Sites in the Trout Brook Subwatershed.
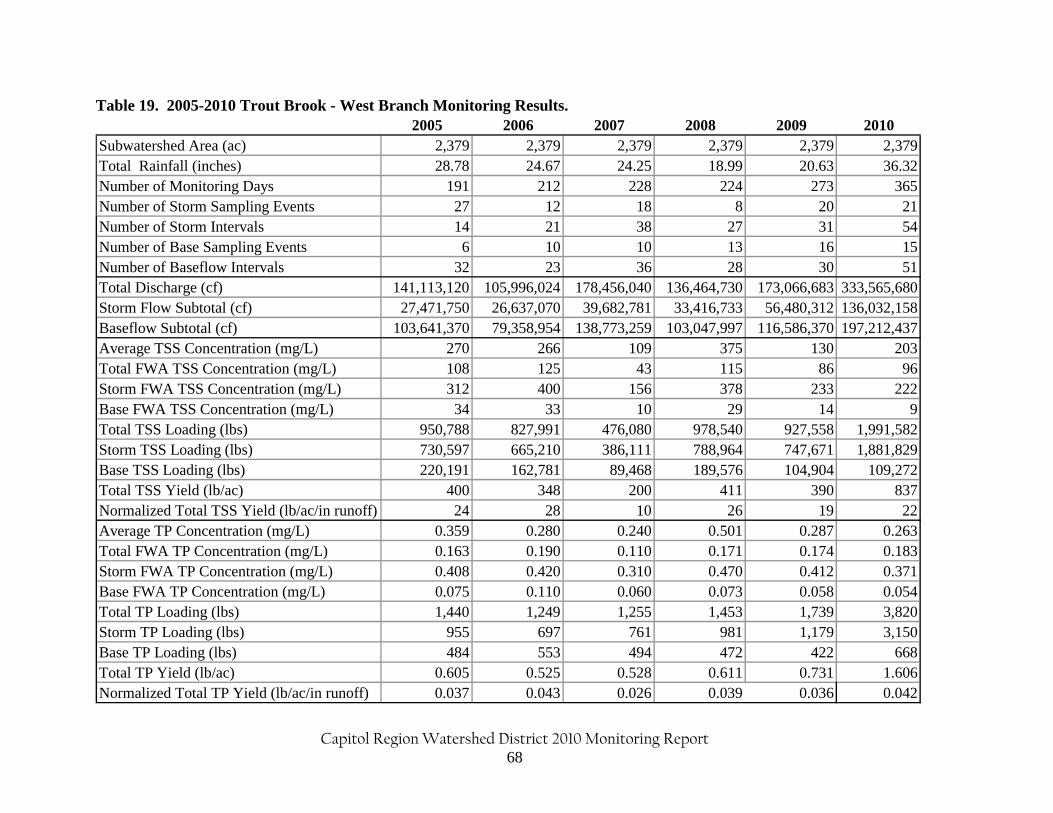
Capitol Region Watershed District 2010 Monitoring Report 68
Table 19. 2005-2010 Trout Brook - West Branch Monitoring Results. 2005 2006 2007 2008 2009 2010
Subwatershed Area (ac) 2,379 2,379 2,379 2,379 2,379 2,379Total Rainfall (inches) 28.78 24.67 24.25 18.99 20.63 36.32Number of Monitoring Days 191 212 228 224 273 365Number of Storm Sampling Events 27 12 18 8 20 21Number of Storm Intervals 14 21 38 27 31 54Number of Base Sampling Events 6 10 10 13 16 15Number of Baseflow Intervals 32 23 36 28 30 51Total Discharge (cf) 141,113,120 105,996,024 178,456,040 136,464,730 173,066,683 333,565,680Storm Flow Subtotal (cf) 27,471,750 26,637,070 39,682,781 33,416,733 56,480,312 136,032,158Baseflow Subtotal (cf) 103,641,370 79,358,954 138,773,259 103,047,997 116,586,370 197,212,437Average TSS Concentration (mg/L) 270 266 109 375 130 203Total FWA TSS Concentration (mg/L) 108 125 43 115 86 96Storm FWA TSS Concentration (mg/L) 312 400 156 378 233 222Base FWA TSS Concentration (mg/L) 34 33 10 29 14 9Total TSS Loading (lbs) 950,788 827,991 476,080 978,540 927,558 1,991,582Storm TSS Loading (lbs) 730,597 665,210 386,111 788,964 747,671 1,881,829Base TSS Loading (lbs) 220,191 162,781 89,468 189,576 104,904 109,272Total TSS Yield (lb/ac) 400 348 200 411 390 837Normalized Total TSS Yield (lb/ac/in runoff) 24 28 10 26 19 22Average TP Concentration (mg/L) 0.359 0.280 0.240 0.501 0.287 0.263Total FWA TP Concentration (mg/L) 0.163 0.190 0.110 0.171 0.174 0.183Storm FWA TP Concentration (mg/L) 0.408 0.420 0.310 0.470 0.412 0.371Base FWA TP Concentration (mg/L) 0.075 0.110 0.060 0.073 0.058 0.054Total TP Loading (lbs) 1,440 1,249 1,255 1,453 1,739 3,820Storm TP Loading (lbs) 955 697 761 981 1,179 3,150Base TP Loading (lbs) 484 553 494 472 422 668Total TP Yield (lb/ac) 0.605 0.525 0.528 0.611 0.731 1.606Normalized Total TP Yield (lb/ac/in runoff) 0.037 0.043 0.026 0.039 0.036 0.042
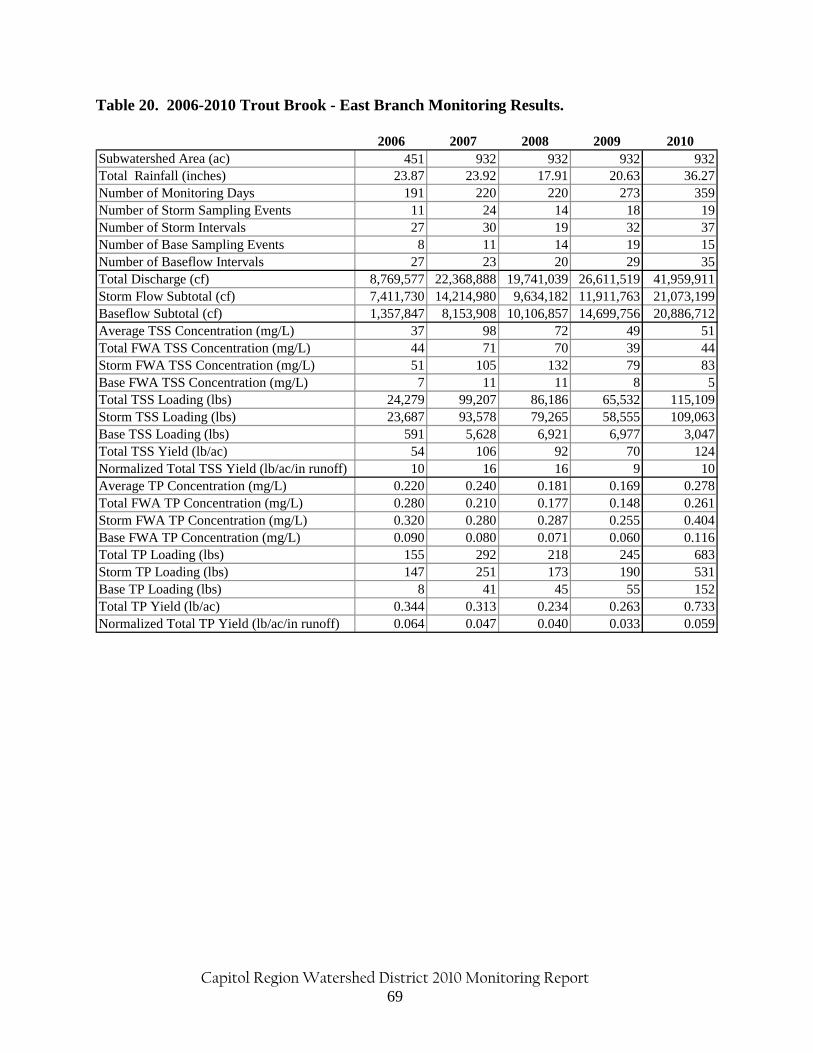
Capitol Region Watershed District 2010 Monitoring Report 69
Table 20. 2006-2010 Trout Brook - East Branch Monitoring Results.
2006 2007 2008 2009 2010Subwatershed Area (ac) 451 932 932 932 932Total Rainfall (inches) 23.87 23.92 17.91 20.63 36.27Number of Monitoring Days 191 220 220 273 359Number of Storm Sampling Events 11 24 14 18 19Number of Storm Intervals 27 30 19 32 37Number of Base Sampling Events 8 11 14 19 15Number of Baseflow Intervals 27 23 20 29 35Total Discharge (cf) 8,769,577 22,368,888 19,741,039 26,611,519 41,959,911Storm Flow Subtotal (cf) 7,411,730 14,214,980 9,634,182 11,911,763 21,073,199Baseflow Subtotal (cf) 1,357,847 8,153,908 10,106,857 14,699,756 20,886,712Average TSS Concentration (mg/L) 37 98 72 49 51Total FWA TSS Concentration (mg/L) 44 71 70 39 44Storm FWA TSS Concentration (mg/L) 51 105 132 79 83Base FWA TSS Concentration (mg/L) 7 11 11 8 5Total TSS Loading (lbs) 24,279 99,207 86,186 65,532 115,109Storm TSS Loading (lbs) 23,687 93,578 79,265 58,555 109,063Base TSS Loading (lbs) 591 5,628 6,921 6,977 3,047Total TSS Yield (lb/ac) 54 106 92 70 124Normalized Total TSS Yield (lb/ac/in runoff) 10 16 16 9 10Average TP Concentration (mg/L) 0.220 0.240 0.181 0.169 0.278Total FWA TP Concentration (mg/L) 0.280 0.210 0.177 0.148 0.261Storm FWA TP Concentration (mg/L) 0.320 0.280 0.287 0.255 0.404Base FWA TP Concentration (mg/L) 0.090 0.080 0.071 0.060 0.116Total TP Loading (lbs) 155 292 218 245 683Storm TP Loading (lbs) 147 251 173 190 531Base TP Loading (lbs) 8 41 45 55 152Total TP Yield (lb/ac) 0.344 0.313 0.234 0.263 0.733Normalized Total TP Yield (lb/ac/in runoff) 0.064 0.047 0.040 0.033 0.059
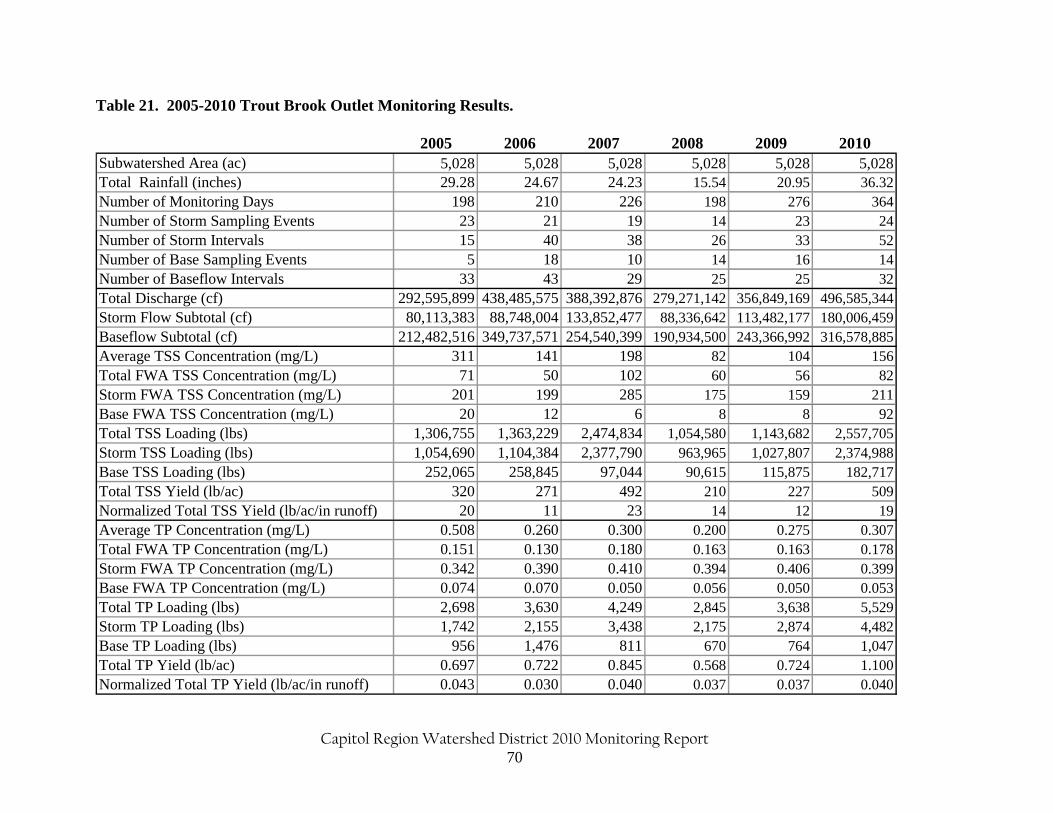
Capitol Region Watershed District 2010 Monitoring Report 70
Table 21. 2005-2010 Trout Brook Outlet Monitoring Results.
2005 2006 2007 2008 2009 2010Subwatershed Area (ac) 5,028 5,028 5,028 5,028 5,028 5,028Total Rainfall (inches) 29.28 24.67 24.23 15.54 20.95 36.32Number of Monitoring Days 198 210 226 198 276 364Number of Storm Sampling Events 23 21 19 14 23 24Number of Storm Intervals 15 40 38 26 33 52Number of Base Sampling Events 5 18 10 14 16 14Number of Baseflow Intervals 33 43 29 25 25 32Total Discharge (cf) 292,595,899 438,485,575 388,392,876 279,271,142 356,849,169 496,585,344Storm Flow Subtotal (cf) 80,113,383 88,748,004 133,852,477 88,336,642 113,482,177 180,006,459Baseflow Subtotal (cf) 212,482,516 349,737,571 254,540,399 190,934,500 243,366,992 316,578,885Average TSS Concentration (mg/L) 311 141 198 82 104 156Total FWA TSS Concentration (mg/L) 71 50 102 60 56 82Storm FWA TSS Concentration (mg/L) 201 199 285 175 159 211Base FWA TSS Concentration (mg/L) 20 12 6 8 8 92Total TSS Loading (lbs) 1,306,755 1,363,229 2,474,834 1,054,580 1,143,682 2,557,705Storm TSS Loading (lbs) 1,054,690 1,104,384 2,377,790 963,965 1,027,807 2,374,988Base TSS Loading (lbs) 252,065 258,845 97,044 90,615 115,875 182,717Total TSS Yield (lb/ac) 320 271 492 210 227 509Normalized Total TSS Yield (lb/ac/in runoff) 20 11 23 14 12 19Average TP Concentration (mg/L) 0.508 0.260 0.300 0.200 0.275 0.307Total FWA TP Concentration (mg/L) 0.151 0.130 0.180 0.163 0.163 0.178Storm FWA TP Concentration (mg/L) 0.342 0.390 0.410 0.394 0.406 0.399Base FWA TP Concentration (mg/L) 0.074 0.070 0.050 0.056 0.050 0.053Total TP Loading (lbs) 2,698 3,630 4,249 2,845 3,638 5,529Storm TP Loading (lbs) 1,742 2,155 3,438 2,175 2,874 4,482Base TP Loading (lbs) 956 1,476 811 670 764 1,047Total TP Yield (lb/ac) 0.697 0.722 0.845 0.568 0.724 1.100Normalized Total TP Yield (lb/ac/in runoff) 0.043 0.030 0.040 0.037 0.037 0.040
Capitol Region Watershed District 2010 Monitoring Report 71
Lake McCarrons Subwatershed Lake McCarrons subwatershed drains 1,070 acres and is the northernmost subwatershed in CRWD, located entirely within the city limits of Roseville (Figure 23). Land use in the subwatershed is predominantly residential and parkland. As a result, the percentage of impervious surfaces in Lake McCarrons subwatershed is less than the other subwatersheds monitored by CRWD. More than half of the subwatershed drains to the Villa Park wetland which is designed to provide stormwater treatment before discharging to Lake McCarrons. CRWD monitors this large drainage area where the runoff flows into the wetland and where water discharges to the lake (Villa Park Outlet). CRWD presents the outlet data in this report and intends to monitor the outlet site long-term as a baseline site. The effectiveness of Villa Park wetland is presented in the 2007 and 2008 BMP Monitoring and Maintenance Report (CRWD, 2009). CRWD operates a flow-only station at the outlet of Lake McCarrons (McCarrons Outlet) as well, and RCPW collects bi-weekly water samples in the lake (see Chapter 5 for lake water quality monitoring results). Water leaving Lake McCarrons eventually flows into the Trout Brook Storm Sewer System. Villa Park The Villa Park subwatershed (753 acres) exported 13,687,318 cf of water in 2010 (Table 22). Stormflow was the dominant contributor to water exported from the subwatershed in 2010; baseflow accounted for only 19% of the total recorded discharge. The Villa Park outlet was monitored for 212 days in 2010 equaling a total of 8 days less than 2009; however, there was an 80% increase in total measured discharge due to a greater number of storm events and total annual precipitation. In the Villa Park subwatershed, a total of 31.32 inches of precipitation was recorded during the 2010 monitoring season while only 19.11 inches of precipitation were recorded in 2009. In 2010, Villa Park subwatershed exported 64,362 lbs of TSS. More TSS was exported from the Villa Park subwatershed in 2010 than any other monitoring year by a significant amount (historical average from 2005-2009 is 17,594 lbs TSS). This is the result of extremely high TSS concentrations during stormflow and higher than average flows, with 44% of the loading occurring during the August 10th storm. Data shows that TSS loading during storms contributed 97% of the total TSS load at Villa Park. TSS yields in pounds per acre were normalized by runoff to remove the influence of annual precipitation trends and for site to site comparison. The 2010 normalized TSS yield for Villa Park was 17 lb/ac/in runoff. The 2010 TSS normalized yield for Villa Park was greater than some other larger subwatersheds and was over twice its historical average (Table 22). Two storms in 2010 produced TSS concentrations greater than 200 mg/L, which is extremely high for this site. The average TSS concentration (59 mg/L) at Villa Park exceeded the MPCA state standard of 14 mg/L. Villa Park subwatershed exported a total of 225 lbs of TP in 2010. The 2010 total TP load was the highest in comparison to previous monitoring years. Data shows that TP loading during storm events contributed to 80% of the total TP load exported at Villa Park. The 2010 normalized TP yield for Villa Park was 0.060 lb/ac/in runoff. This value is comparable to the
Capitol Region Watershed District 2010 Monitoring Report 72
2005-2009 historical average which is also 0.060 lb/ac/in runoff. However, the average TP concentration (0.335 mg/L) at Villa Park exceeded the NCHF ecoregion average concentration of 0.13 mg/L as well as the Lambert’s Landing yearly average of 0.16 mg/L. In 2010, the Villa Park yearly average concentrations for ammonia and TKN exceeded MPCA agency standards and Lambert’s Landing concentrations. Additionally, all tested metals (cadmium, chromium, copper, lead, nickel, zinc) exceeded Lambert’s Landing concentrations, but not the chronic toxicity standards. E. coli grab samples were collected 1-2 times per month during baseflow conditions at the Villa Park site. In 2010, the majority of all bacteria samples during baseflow conditions were below the MPCA maximum standard of 1,260 cfu/100mL; however two base grab samples exceeded the standard with concentrations of 1,986 and 2,420 mpn/100 mL. E. coli grab samples were also collected during seven storm events in 2010. Three of seven samples collected during storm events exceeded the maximum standard with concentrations ranging 2,000 mpn/100mL to 9,700 mpn/100mL. Lake McCarrons Outlet Total discharge at the McCarrons Outlet site in 2010 was 13,998,900 cf, a 45% increase from 2009. Also, the average stage at the outlet (0.228 ft) doubled from 2009. Flow increases were observed at McCarrons Outlet despite 11 fewer monitoring days in 2010 than 2009. However, significant increase in annual precipitation in 2010 can likely account for overall increase in recorded discharge.
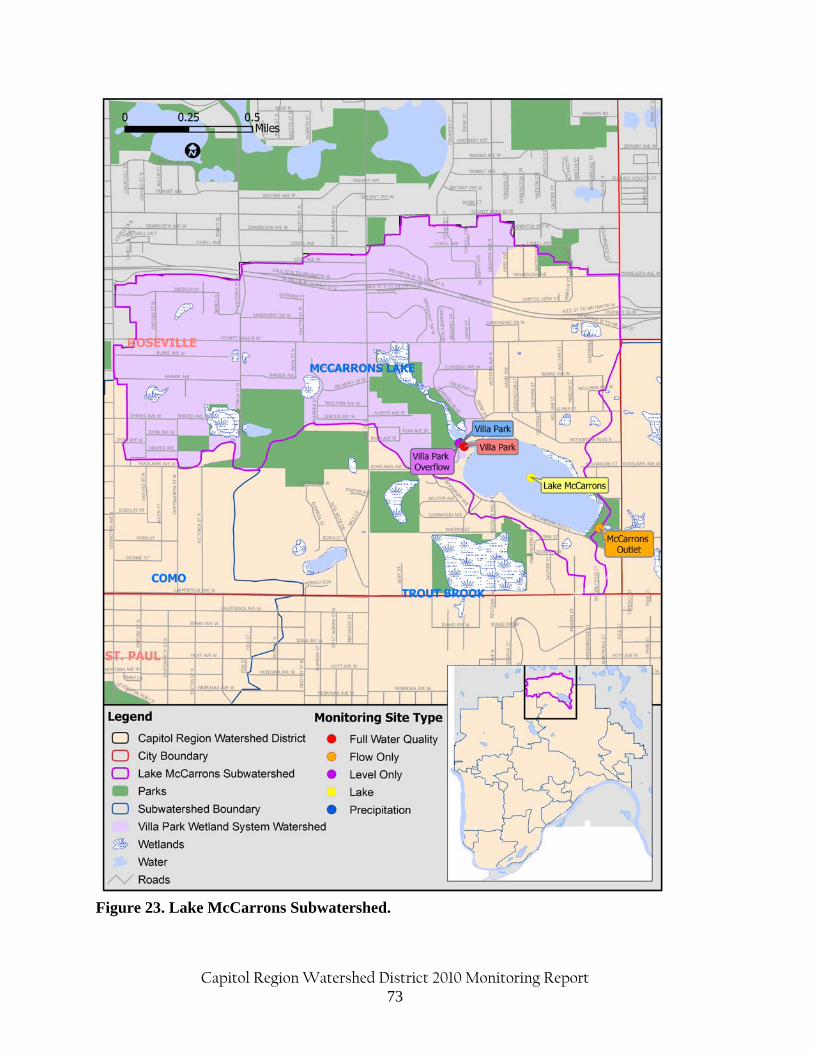
Capitol Region Watershed District 2010 Monitoring Report 73
Figure 23. Lake McCarrons Subwatershed.

Capitol Region Watershed District 2010 Monitoring Report 74
Table 22. 2006-2010 Villa Park Subwatershed Monitoring Results.
2006 2007 2008 2009 2010Subwatershed Area (ac) 753 753 753 753 753Total Rainfall (inches) 24.66 24.16 19.45 19.11 31.32Number of Monitoring Days 204 228 223 220 212Number of Storm Sampling Events 12 18 12 17 13Number of Storm Intervals 15 28 19 24 28Number of Base Sampling Events 7 9 13 16 11Number of Baseflow Intervals 18 23 36 20 19Total Discharge (cf) 11,075,521 14,512,244 12,884,967 7,597,428 13,687,318Storm Flow Subtotal (cf) 5,564,657 9,835,524 7,839,161 5,668,868 11,029,258Baseflow Subtotal (cf) 5,510,864 4,656,826 5,045,805 1,928,561 2,658,060Average TSS Concentration (mg/L) 18 18 25 32 59Total FWA TSS Concentration (mg/L) 17 23 22 43 75Storm FWA TSS Concentration (mg/L) 19 28 14 49 91Base FWA TSS Concentration (mg/L) 15 12 35 26 11Total TSS Loading (lbs) 11,833 20,394 17,740 20,410 64,362Storm TSS Loading (lbs) 6,742 16,981 6,725 17,230 62,584Base TSS Loading (lbs) 5,091 3,397 11,014 3,180 1,778Total TSS Yield (lb/ac) 16 27 24 27 85Normalized Total TSS Yield (lb/ac/in runoff) 4 5 5 10 17Average TP Concentration (mg/L) 0.280 0.260 0.324 0.286 0.335Total FWA TP Concentration (mg/L) 0.310 0.240 0.268 0.239 0.263Storm FWA TP Concentration (mg/L) 0.230 0.220 0.234 0.226 0.264Base FWA TP Concentration (mg/L) 0.400 0.280 0.322 0.277 0.258Total TP Loading (lbs) 216 216 215 113 225Storm TP Loading (lbs) 79 136 114 80 182Base TP Loading (lbs) 137 80 101 33 43Total TP Yield (lb/ac) 0.287 0.287 0.286 0.150 0.299Normalized Total TP Yield (lb/ac/in runoff) 0.071 0.054 0.061 0.054 0.060

Capitol Region Watershed District 2010 Monitoring Report 75
4 Lake Water Quality Monitoring Introduction Capitol Region Watershed District (CRWD) contains four lakes: Como Lake, Crosby Lake, Lake McCarrons, and Loeb Lake (Figure 2). The lakes are monitored to assess overall health and to determine if each lake supports their designated uses for swimming, fishing, and aesthetics. All of the lakes receive stormwater runoff and, with the exception of Loeb Lake, ultimately drain to the Mississippi River. Como Lake, Crosby Lake, and Loeb Lake are classified as shallow lakes and Lake McCarrons is classified as a deep lake. Shallow lakes are defined as those lakes which have a maximum depth less than fifteen feet or those in which more than 80% of the lake is within the littoral zone. The littoral zone is the area of the lake in which plants grow. Deep lakes are defined as those lakes in which the maximum depth is greater than fifteen feet or those in which less than 80% of the lake is in the littoral zone. Water quality of the lakes is monitored by Ramsey County Public Works (RCPW). Como Lake Como Lake is a 67-acre lake with a maximum depth of 15.5 feet and is located in the City of Saint Paul. Surrounding land uses are primarily residential and open space. It is classified as a shallow lake; nearly 100% of the lake is in the littoral zone. Como Lake has been monitored since 1984, and although water quality has improved slightly since then, there has been significant yearly variation in water quality. Como Lake was put on the Minnesota Pollution Control Agency’s (MPCA) 303(d) list of impaired waters in 2010 for excess nutrients (MPCA, 2010). Crosby Lake Crosby Lake is a 48-acre lake with a maximum depth of 19 feet. Classified as a shallow lake, the littoral zone covers 97% of the lake area. Surrounding land uses are primarily open space, single family residential and commercial. Crosby Lake lies within the Mississippi National River and Recreation Area in St. Paul and is surrounded by wetlands. As part of the Mississippi River floodplain, Crosby Lake is often flooded by the river after spring snowmelt. Crosby Lake has been monitored since 2005. Lake McCarrons Located in the City of Roseville, Lake McCarrons is a 68-acre lake with a maximum depth of 57 feet. It is considered a deep lake with less than 36% of the lake area located in the littoral zone. Lake McCarrons has a surrounding land use of mostly mixed residential and open space. Lake McCarrons has been monitored since 1988. Lake McCarrons received an alum treatment in 2004 and water quality of the lake has shown improvement. Loeb Lake Loeb Lake is a 9-acre lake with a maximum depth of 28 feet located in Marydale Park in the City of St. Paul. Surrounding land uses are predominately mixed residential and parkland. Under the Minnesota Loeb Lake was monitored in 2003, was not monitored in 2004, and monitored again from 2005 to present.
Capitol Region Watershed District 2010 Monitoring Report 76
Methods The 2010 lake water quality data was collected by RCPW. During the growing season, May through September, samples and data were collected on monthly or bi-weekly basis. At each lake, RCPW measured temperature, dissolved oxygen, pH, and conductivity profiles using a multi-parameter probe; water transparency using a Secchi disk; and collected water samples. Water samples were collected from discrete depths within the mixed water layer. If thermal stratification was present, additional water samples were collected from the thermocline and the hypolimnion. The water samples were analyzed by the RCWP for chlorophyll-a (Chl-a), phaeophytin-a (Phaeo-a), total phosphorous (TP), soluble reactive phosphorous (SRP), total Kjeldahl nitrogen (TKN), nitrate (NO3), chloride ion concentrations (Cl), and ammonia (NH3). Water transparency, or water clarity, was determined with the use of a Secchi disk. This measurement is also referred to as Secchi depth. Poor water clarity is usually the result of increased turbidity caused by suspended sediments, organic matter, and/or phytoplankton (algae). Phosphorus is an essential biological nutrient associated with the growth of aquatic plants but in excess, can result in nuisance aquatic macrophytes and algae blooms in lakes. Common sources of phosphorus include fertilizers from lawns, golf courses, and other treated open spaces, detergents from residential and commercial car washes, animal waste, and sewage from illicit connections. CRWD lies within the Northern Central Hardwood Forest (NCHF) ecoregion. It is one of seven ecoregions in Minnesota and is characterized as an area with fertile soils and agriculture as the dominant land use in rural areas. In most lakes in the NCHF ecoregion, phosphorous is the least available nutrient; therefore, the concentration of phosphorous controls the extent of algal growth. Algal growth in turn affects the clarity and recreational potential of lakes. Chlorophyll-a is a pigment present in algae. Measuring chlorophyll-a concentration is a surrogate for measuring algal population. Algal blooms can make recreation unpleasant and certain species are toxic to humans and other animals. In addition, as algae die and decompose, oxygen is removed from the water column. Chronic low dissolved oxygen concentrations, less than 5 mg/L, may result in fish kills and low diversity of aquatic life. Although some lakes are naturally eutrophic, many have become eutrophic as a result of human activities. MPCA has established eutrophication numeric water quality standards in lakes for TP, Secchi depth, and chlorophyll-a in order to address eutrophication (MPCA, 2008). A lake is out of compliance if it does not meet the TP standard and either the Secchi or chlorophyll-a standard. Lakes that are out of compliance may be placed on the MPCA list of impaired waters. To account for differences in natural trophic state, the standards vary by ecoregion and lake type. In the NCHF ecoregion, there is a different standard for shallow and deep lakes (Table 23).

Capitol Region Watershed District 2010 Monitoring Report 77
Table 23. Deep and Shallow Lake State Water Quality Standards.
Parameter Agency Use/ExposureDeep Lake Standard
Shallow Lake Standard Units
TP MPCA,2008 aquatic life & recreation/nutrients < 0.04 < 0.06 mg/LChl-a MPCA,2008 aquatic life & recreation/nutrients < 14 < 20 µg/LSecchi depth MPCA,2008 aquatic life & recreation/nutrients ≥ 1.4 ≥ 1.0 m
a. Applies to Class 2B waters: those suitable for warm and cool water fish and other aquatic life and for human recreation.
b. Excess nutrients can negatively impact recreation and aquatic life - the standards are threshold levels. Results and Analysis Summary of Results In 2010 all of the lakes except Como met the MPCA standards for eutrophication during the growing season. Crosby Lake only exceeded the shallow lake TP standard, while Loeb and McCarrons met the three lake standards (Table 24). The 2010 growing season TP average increased only slightly from 2009 for Loeb Lake and Lake McCarrons (Figure 32). The average 2010 TP concentration for Como Lake increased to levels not recorded since 2006, but was still lower than its historical average. The average 2010 TP concentration for Crosby Lake was double its historical average (Figure 32). The 2010 growing season TP averages for Loeb Lake and Lake McCarrons were still lower than their historical growing season averages (Table 24). The increase in TP concentrations at all lakes is likely due to the higher precipitation in 2010. The 2010 growing season Chl-a averages increased slightly in Loeb Lake and Lake McCarrons and increased dramatically in Como Lake and Crosby Lake from 2009 (Figure 33). 2010 growing season Chl-a averages for Como and Crosby lakes were higher than historical growing season averages, while Loeb and McCarrons Chl-a concentrations for 2010 were lower than historical growing season averages (Table 25). 2010 growing season Secchi depth averages declined in Como Lake, Crosby Lake, and Lake McCarrons with Loeb Lake showing only little improvement from 2009 (Figure 32). 2010 growing season Secchi depth averages for Loeb Lake and Lake McCarrons were greater than the historical growing season Secchi depth averages, while Como and Crosby Lakes were less than the historical averages (Table 24). Despite overall increases in the 2010 TP and Chl-a concentrations, the average Secchi depth and Chl-a, and TP concentrations showed an improvement in water quality in comparison to the historical averages for Loeb Lake and Lake McCarrons, and a decline in water quality for Como and Crosby Lakes as compared to the historical averages (Table 25).

Capitol Region Watershed District 2010 Monitoring Report 78
Como Lake In 2010, Como Lake exceeded the state shallow lake standard for TP and Chl-a, but the growing season average Secchi depth was within the state standard (Table 24). The 2010 growing season TP and Chl-a average concentrations were less than the historical averages (Figures 25 and 26). The growing season average Secchi depth was also less than the historical average. Figure 32 presents the historical relationships between secchi depth, total phosphorus, and Chl-a. Since 2006, an overall reduction of nutrients to the lake had been observed. From 2007, this reduction in nutrient loading is partially attributable to the Arlington-Pascal Stormwater Improvement Project constructed upstream of Como Lake. More information about the performance of these BMPs may be found in the CRWD Stormwater BMP Performance and Cost-Benefit Analysis (CRWD, 2010). The lake’s general response to decreased nutrient loading has included an improvement in water clarity and reduced Chl-a; the surrogate for algal population. As the 2010 data indicates, a spike in nutrient loading during the growing season immediately resulted in greater Chl-a concentrations and poorer visibility. Although Como Lake has seen improvements in water quality over the past decade, water quality has fluctuated significantly since monitoring began in 1982. Crosby Lake In 2010, Crosby Lake met the state shallow lake standards for Chl-a and Secchi depth, but exceeded the standard for TP. The 2010 growing season Chl-a and TP averages were greater than the historical averages and the 2010 Secchi depth average was less than the historical average, indicating a decline in water qality (Table 24). Up until the significant increase TP concentration in 2010, the growing season TP average had remained stable since monitoring began in 2005. Meanwhile, the growing season Chl-a average has continued to increase and the growing season Secchi depth average has continued to decrease (Figure 33). Since 2005, the overall water quality of Crosby Lake has been in decline, yet it still meets the state eutrophication standards. Lake McCarrons In 2010, Lake McCarrons met state deep lake standards for Chl-a, TP, and Secchi depth. In comparison to historical growing season averages, the 2010 growing season average for Secchi depth was greater than the historical average and the 2010 growing season TP and Chl-a averages were less than the historical averages (Table 24). Since receiving the alum treatment, the lake has seen an improvement in water quality. From 2004 to 2010, TP and Chl-a concentrations have significantly decreased and Secchi depths have also improved (Figures 22, 23, and 24) . Loeb Lake Loeb Lake met the state shallow lake standards for Chl-a, TP, and Secchi depth in 2010. The 2010 growing season TP and Chl-a averages were slightly less than historical averages and the 2010 growing season Secchi depth average was nearly equal to the historical average (Table 24). Since 2005, growing season TP and Secchi depth averages have decreased and Chl-a has remained the same, indicating that while water quality has improved over the years, aquatic plant growth may be rising (Figure 33). However in 2010, average TP and Chl-a values increased, but secchi depth was not affected.
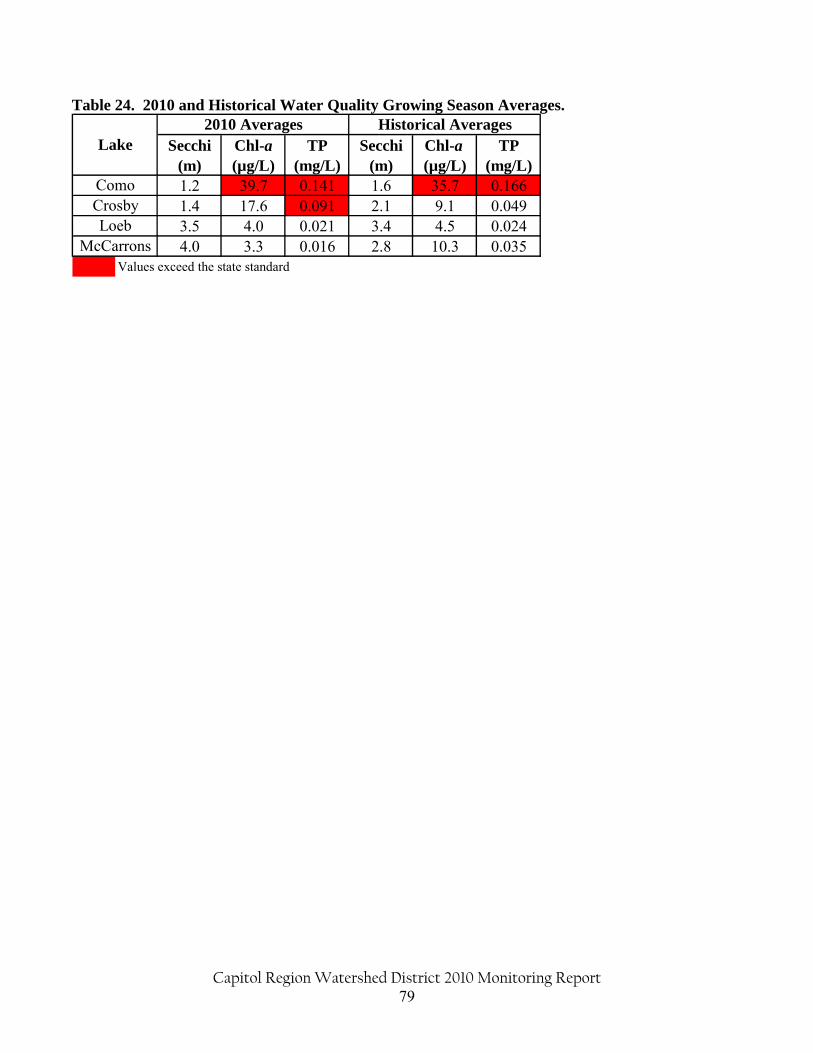
Capitol Region Watershed District 2010 Monitoring Report 79
Table 24. 2010 and Historical Water Quality Growing Season Averages.
Secchi (m)
Chl-a (µg/L)
TP (mg/L)
Secchi (m)
Chl-a (µg/L)
TP (mg/L)
1.2 39.7 0.141 1.6 35.7 0.1661.4 17.6 0.091 2.1 9.1 0.0493.5 4.0 0.021 3.4 4.5 0.0244.0 3.3 0.016 2.8 10.3 0.035
Values exceed the state standard
Historical AveragesLake
ComoCrosbyLoeb
McCarrons
2010 Averages
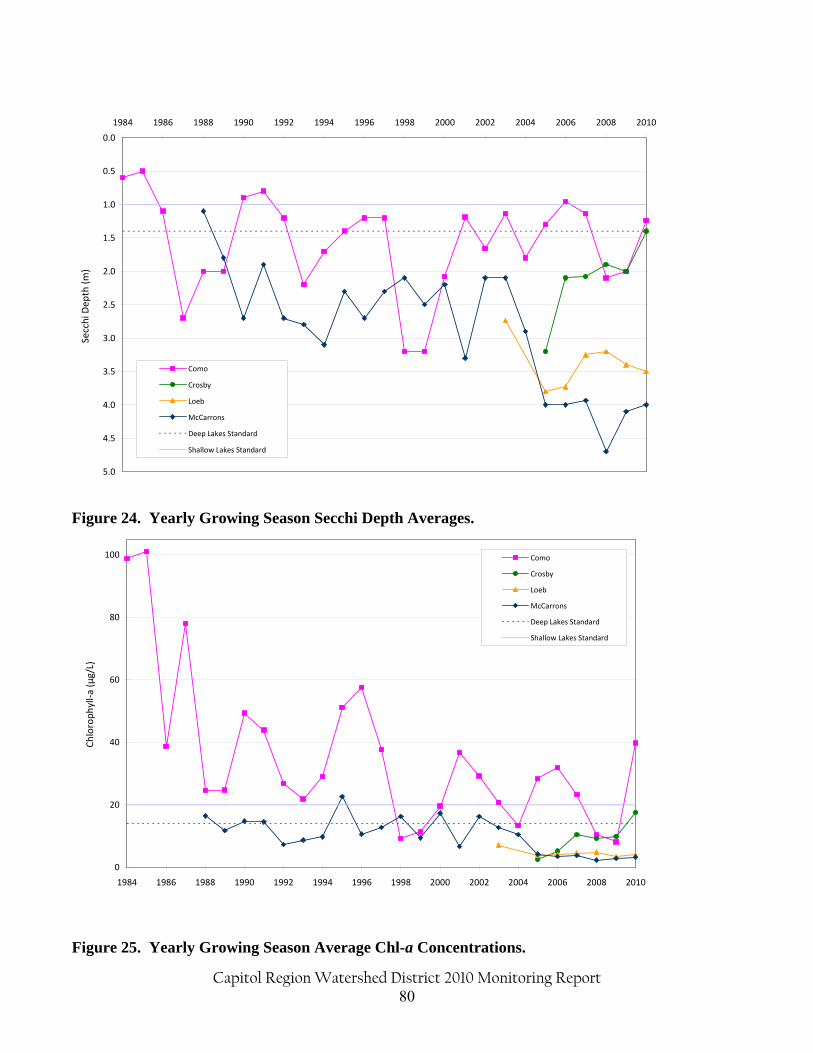
Capitol Region Watershed District 2010 Monitoring Report 80
0.0
0.5
1.0
1.5
2.0
2.5
3.0
3.5
4.0
4.5
5.0
1984 1986 1988 1990 1992 1994 1996 1998 2000 2002 2004 2006 2008 2010
Secchi Dep
th (m
)
Como
Crosby
Loeb
McCarrons
Deep Lakes Standard
Shallow Lakes Standard
Figure 24. Yearly Growing Season Secchi Depth Averages.
0
20
40
60
80
100
1984 1986 1988 1990 1992 1994 1996 1998 2000 2002 2004 2006 2008 2010
Chloroph
yll‐a
(µg/L)
Como
Crosby
Loeb
McCarrons
Deep Lakes Standard
Shallow Lakes Standard
Figure 25. Yearly Growing Season Average Chl-a Concentrations.
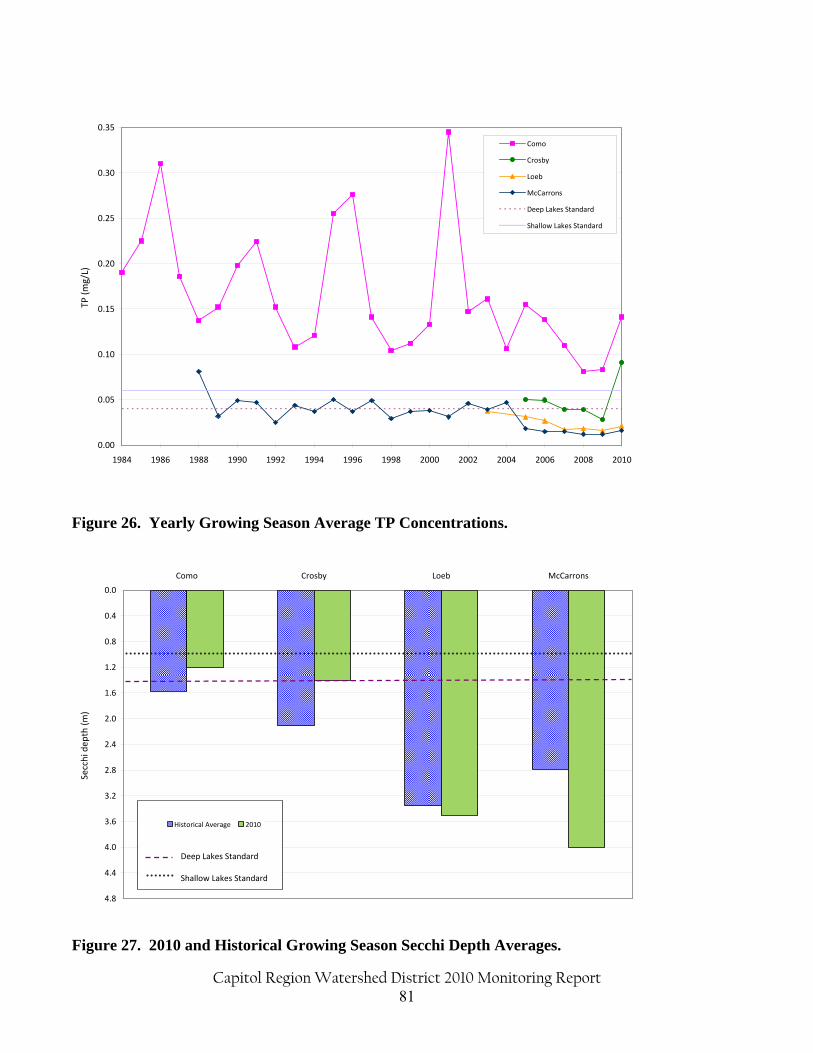
Capitol Region Watershed District 2010 Monitoring Report 81
0.00
0.05
0.10
0.15
0.20
0.25
0.30
0.35
1984 1986 1988 1990 1992 1994 1996 1998 2000 2002 2004 2006 2008 2010
TP (m
g/L)
Como
Crosby
Loeb
McCarrons
Deep Lakes Standard
Shallow Lakes Standard
Figure 26. Yearly Growing Season Average TP Concentrations.
0.0
0.4
0.8
1.2
1.6
2.0
2.4
2.8
3.2
3.6
4.0
4.4
4.8
Como Crosby Loeb McCarrons
Secchi dep
th (m
)
Historical Average 2010
Deep Lakes Standard
Shallow Lakes Standard
Figure 27. 2010 and Historical Growing Season Secchi Depth Averages.
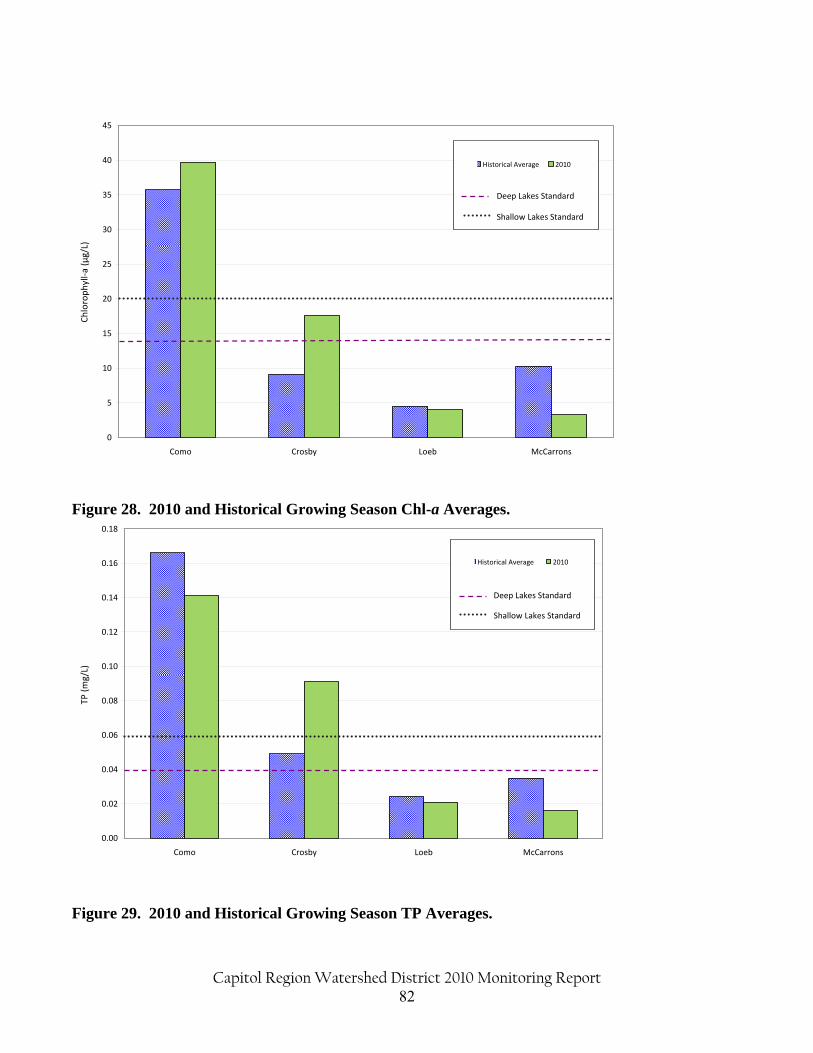
Capitol Region Watershed District 2010 Monitoring Report 82
0
5
10
15
20
25
30
35
40
45
Como Crosby Loeb McCarrons
Chloroph
yll‐a
(µg/L)
Historical Average 2010
Deep Lakes Standard
Shallow Lakes Standard
Figure 28. 2010 and Historical Growing Season Chl-a Averages.
0.00
0.02
0.04
0.06
0.08
0.10
0.12
0.14
0.16
0.18
Como Crosby Loeb McCarrons
TP (m
g/L)
Historical Average 2010
Deep Lakes Standard
Shallow Lakes Standard
Figure 29. 2010 and Historical Growing Season TP Averages.
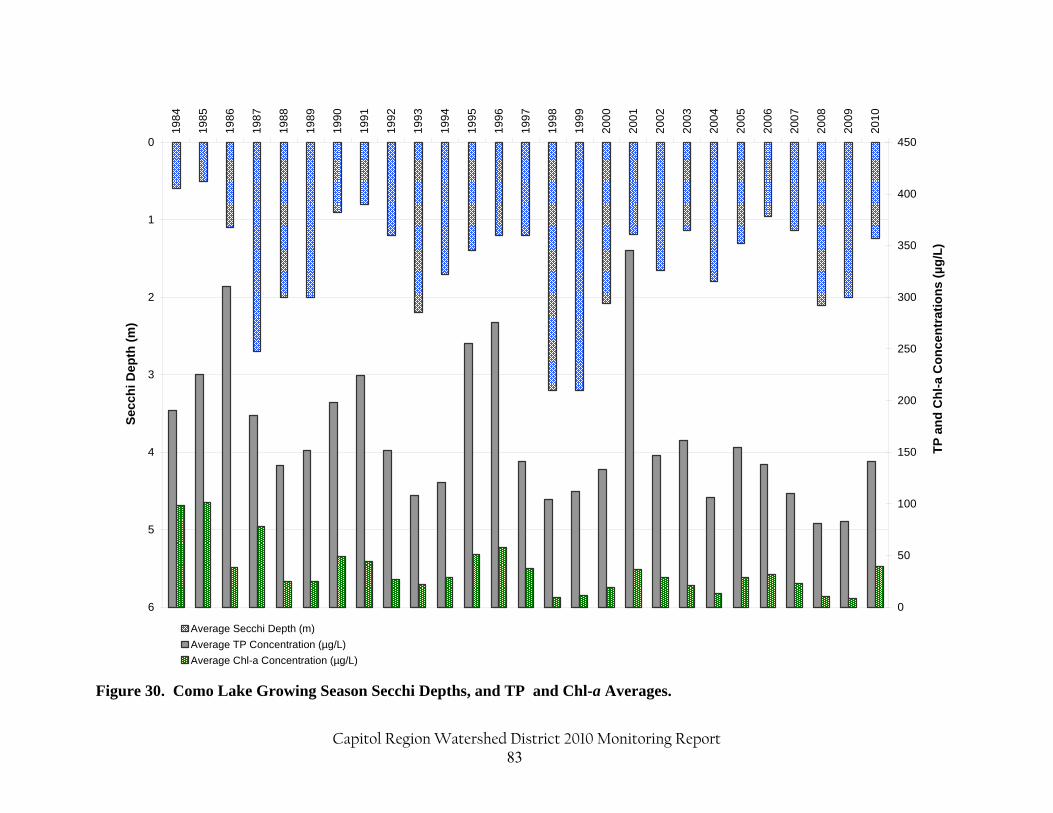
Capitol Region Watershed District 2010 Monitoring Report 83
0
1
2
3
4
5
6
1984
1985
1986
1987
1988
1989
1990
1991
1992
1993
1994
1995
1996
1997
1998
1999
2000
2001
2002
2003
2004
2005
2006
2007
2008
2009
2010
Sec
chi D
epth
(m
)
0
50
100
150
200
250
300
350
400
450
TP
an
d C
hl-
a C
on
cen
trat
ion
s (µ
g/L
)
Average Secchi Depth (m)
Average TP Concentration (µg/L)
Average Chl-a Concentration (µg/L)
Figure 30. Como Lake Growing Season Secchi Depths, and TP and Chl-a Averages.
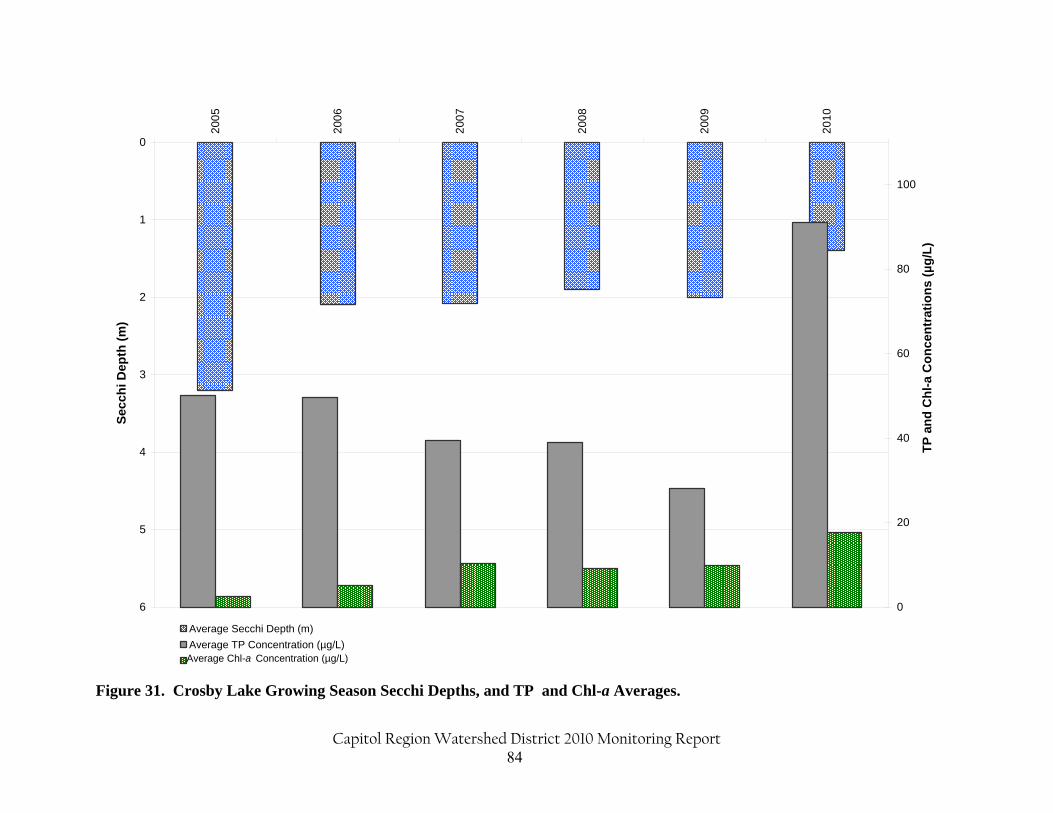
Capitol Region Watershed District 2010 Monitoring Report 84
0
1
2
3
4
5
6
200
5
200
6
200
7
200
8
200
9
201
0
Sec
chi D
epth
(m
)
0
20
40
60
80
100
TP
an
d C
hl-
a C
on
cen
trat
ion
s (µ
g/L
)
Average Secchi Depth (m)
Average TP Concentration (µg/L)Average Chl-a Concentration (µg/L)
Figure 31. Crosby Lake Growing Season Secchi Depths, and TP and Chl-a Averages.
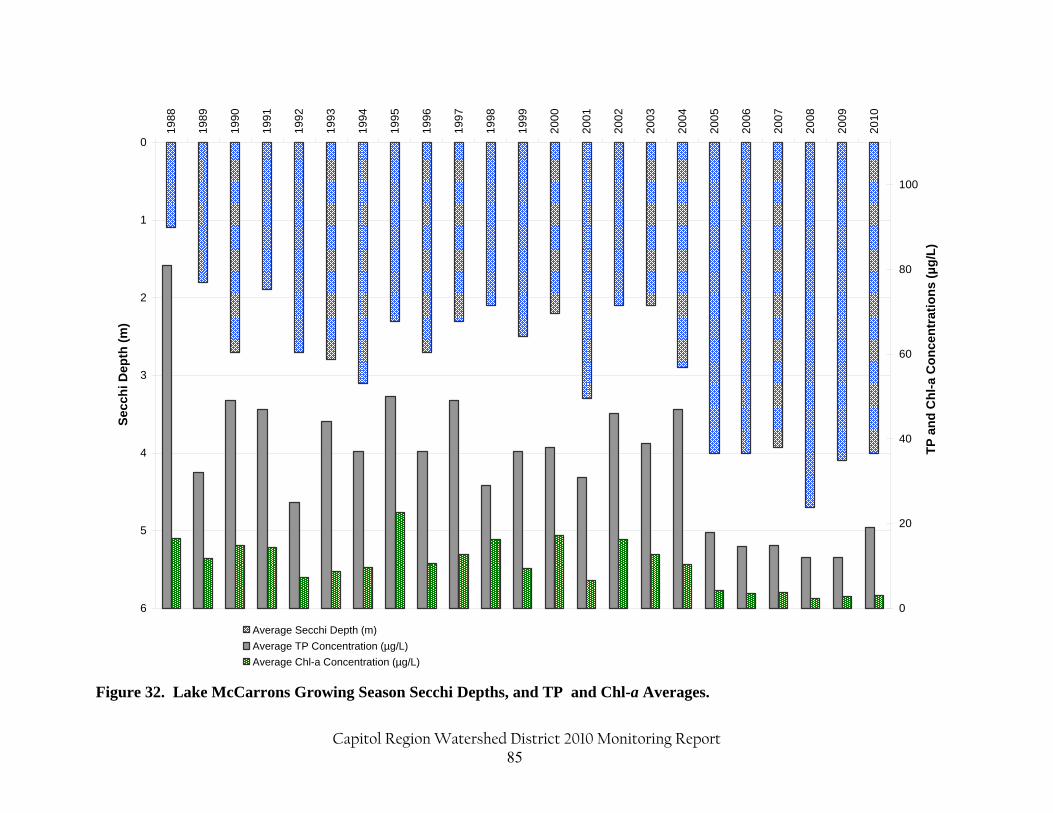
Capitol Region Watershed District 2010 Monitoring Report 85
0
1
2
3
4
5
6
1988
1989
1990
1991
1992
1993
1994
1995
1996
1997
1998
1999
2000
2001
2002
2003
2004
2005
2006
2007
2008
2009
2010
Sec
chi D
epth
(m
)
0
20
40
60
80
100
TP
an
d C
hl-
a C
on
cen
trat
ion
s (µ
g/L
)
Average Secchi Depth (m)
Average TP Concentration (µg/L)
Average Chl-a Concentration (µg/L)
Figure 32. Lake McCarrons Growing Season Secchi Depths, and TP and Chl-a Averages.
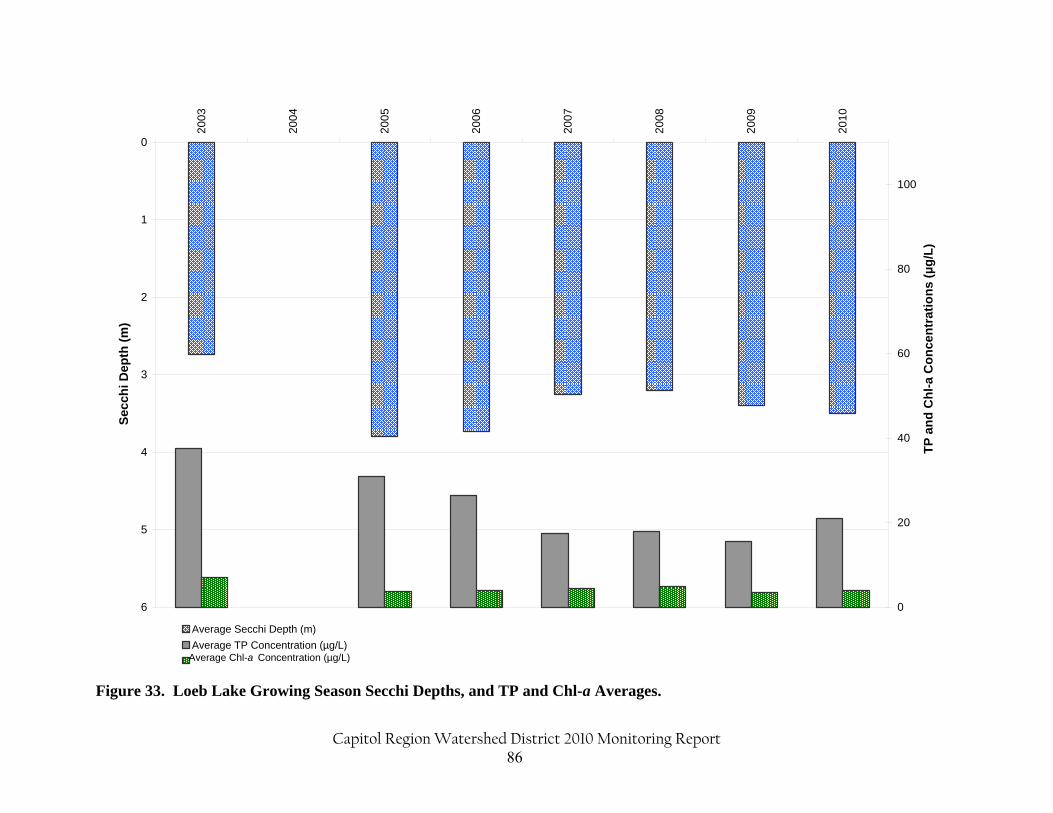
Capitol Region Watershed District 2010 Monitoring Report 86
0
1
2
3
4
5
6
2003
2004
2005
2006
2007
2008
2009
2010
Sec
chi D
epth
(m
)
0
20
40
60
80
100
TP
an
d C
hl-
a C
on
cen
trat
ion
s (µ
g/L
)
Average Secchi Depth (m)
Average TP Concentration (µg/L)Average Chl-a Concentration (µg/L)
Figure 33. Loeb Lake Growing Season Secchi Depths, and TP and Chl-a Averages.
Capitol Region Watershed District 2010 Monitoring Report 87
Chapter 5 Conclusions and Recommendations Conclusions Stormwater from the Capitol Region Watershed District was measured to be more polluted than the Mississippi River. Additionally, the 2010 stormwater data was compared to a national stormwater quality database of urbanized areas which revealed that CRWD stormwater is typically more polluted with sediment, nutrients and bacteria than other urban watersheds across the nation. Concentrations for TP, TSS, metals, and bacteria in CRWD subwatersheds remained high in 2010, especially during stormflows. High stormwater pollutant levels contributed to the various water quality impairments found in CRWD lakes and the Mississippi River. The Midwest Climate Center reported the 2010 calendar year to be the second wettest year in Minnesota’s extended climatic record. Correspondingly, 2010 was the wettest monitoring season CRWD has ever recorded since 2005. The 2010 monitoring season also marked the first year that CRWD baseline monitoring sites were in year-round operation from January through December. The combination of increased precipitation and a lengthened monitoring season resulted in higher TP and TSS loads and higher discharge volumes at all CRWD sites. Among the monitoring sites, the Trout Brook subwatershed produced the highest total discharge and total loads for TSS and TP from CRWD in 2010 which closely corresponds to trends identified in previous monitoring years. East Kittsondale showed improvement in normalized TSS and TP yields in 2010, but flow-weighted average concentrations remained very high. In comparison to the other baseline sites, East Kittsondale continued its trend of generating the highest normalized sediment and phosphorus loads on a per acre and per inch of runoff basis. Additional trend analysis on baseline loading data from 2005 through 2010 is reported in Appendix D: Special Report. Monitoring of the Villa Park subwatershed has identified it as a prominent source of TP to Lake McCarrons. While Villa Park showed increases in TP load in 2010, it was accompanied by a dramatic increase in TSS load and average TSS concentration. CRWD is working to identify the causes of the high pollutant loads as well as solutions for decreasing the amount of pollutants leaving the Villa Park subwatershed into Lake McCarrons. In 2010, the average yearly concentrations of ammonia, TKN, copper, and lead at all the baseline sites were found to exceed MPCA toxicity standards for pollutants. Additionally, average storm concentrations of zinc exceeded MPCA standards at all the baseline sites. Of these metals, lead, copper and zinc continue to be of particular concern to CRWD due to their relative toxicity to humans. In general, bacteria levels during 2010 storm events were found to exceed MPCA water quality standards at most monitoring sites. At all sites except East Kittsondale, baseflow bacteria samples typically did not exceed the standard. In 2009 at East Kittonsdale, CRWD expanded efforts to collect a greater number of dry weather bacteria samples due to extremely high bacteria concentrations. CRWD continued this effort in 2010 and discovered an immediate drop in high
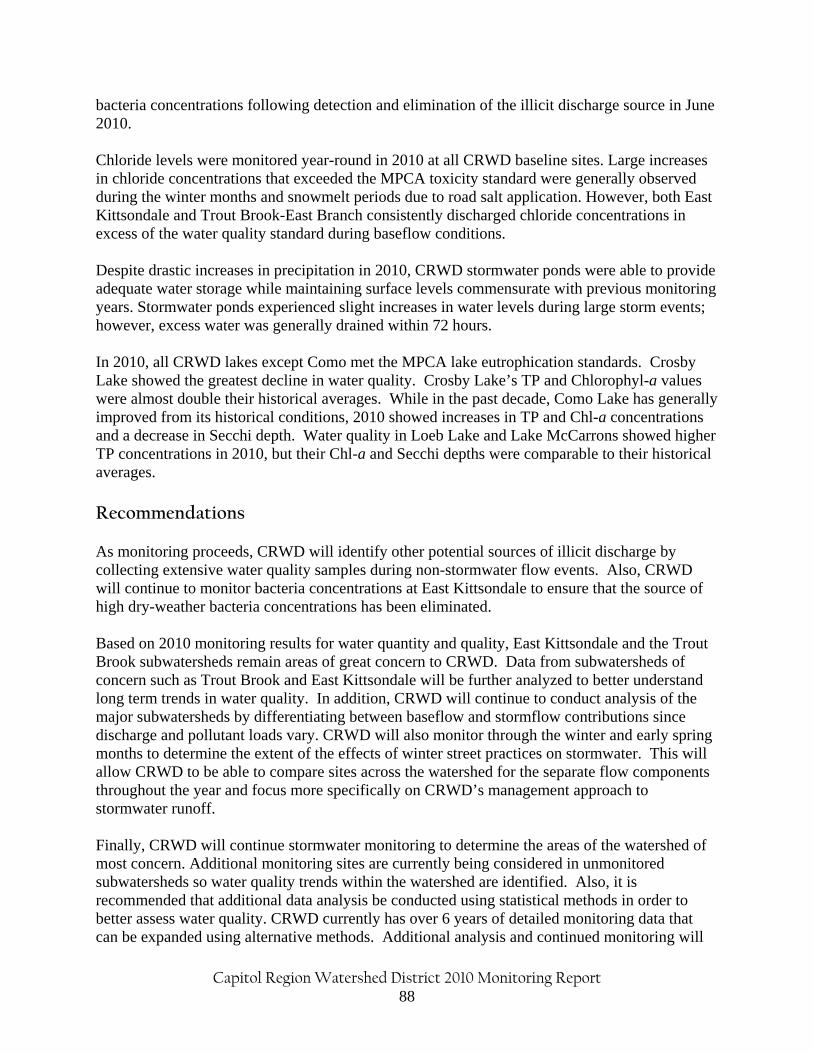
Capitol Region Watershed District 2010 Monitoring Report 88
bacteria concentrations following detection and elimination of the illicit discharge source in June 2010. Chloride levels were monitored year-round in 2010 at all CRWD baseline sites. Large increases in chloride concentrations that exceeded the MPCA toxicity standard were generally observed during the winter months and snowmelt periods due to road salt application. However, both East Kittsondale and Trout Brook-East Branch consistently discharged chloride concentrations in excess of the water quality standard during baseflow conditions. Despite drastic increases in precipitation in 2010, CRWD stormwater ponds were able to provide adequate water storage while maintaining surface levels commensurate with previous monitoring years. Stormwater ponds experienced slight increases in water levels during large storm events; however, excess water was generally drained within 72 hours. In 2010, all CRWD lakes except Como met the MPCA lake eutrophication standards. Crosby Lake showed the greatest decline in water quality. Crosby Lake’s TP and Chlorophyl-a values were almost double their historical averages. While in the past decade, Como Lake has generally improved from its historical conditions, 2010 showed increases in TP and Chl-a concentrations and a decrease in Secchi depth. Water quality in Loeb Lake and Lake McCarrons showed higher TP concentrations in 2010, but their Chl-a and Secchi depths were comparable to their historical averages. Recommendations As monitoring proceeds, CRWD will identify other potential sources of illicit discharge by collecting extensive water quality samples during non-stormwater flow events. Also, CRWD will continue to monitor bacteria concentrations at East Kittsondale to ensure that the source of high dry-weather bacteria concentrations has been eliminated. Based on 2010 monitoring results for water quantity and quality, East Kittsondale and the Trout Brook subwatersheds remain areas of great concern to CRWD. Data from subwatersheds of concern such as Trout Brook and East Kittsondale will be further analyzed to better understand long term trends in water quality. In addition, CRWD will continue to conduct analysis of the major subwatersheds by differentiating between baseflow and stormflow contributions since discharge and pollutant loads vary. CRWD will also monitor through the winter and early spring months to determine the extent of the effects of winter street practices on stormwater. This will allow CRWD to be able to compare sites across the watershed for the separate flow components throughout the year and focus more specifically on CRWD’s management approach to stormwater runoff. Finally, CRWD will continue stormwater monitoring to determine the areas of the watershed of most concern. Additional monitoring sites are currently being considered in unmonitored subwatersheds so water quality trends within the watershed are identified. Also, it is recommended that additional data analysis be conducted using statistical methods in order to better assess water quality. CRWD currently has over 6 years of detailed monitoring data that can be expanded using alternative methods. Additional analysis and continued monitoring will

Capitol Region Watershed District 2010 Monitoring Report 89
assist in guiding our development of water quality improvement projects. This work will help further CRWD’s mission “to protect, manage and improve the water resources of the Capitol Region Watershed District.”

Capitol Region Watershed District 2010 Monitoring Report 90

Capitol Region Watershed District 2010 Monitoring Report 91
References Capitol Region Watershed District, 2010. Stormwater BMP Performance Assessment and Cost-Benefit Analysis. Saint Paul, MN. Capitol Region Watershed District, 2000. Watershed Management Plan 2000. Roseville, MN. Center for Watershed Protection, Maestre, A., and Pitt, R., 2005. The National Stormwater Quality Database, Version 1.1, A compilation and Analysis of NPDES Stormwater Monitoring Information. Prepared for US EPA, Office of Water, Washington, D.C. City of St. Paul Surveyor’s Office. 2010. Survey records. Accessed on-line from http://survey.ci.stpaul.mn.us/survey_records1.html. Saint Paul, MN. ESRI 2009. ArcGIS 9.3 Redlands, CA, USA. Kloiber, S.M. 2006. Estimating nonpoint source pollution for the Twin Cities Metropolitan area using landscape variables. Water, Air, and Soil Pollution. 172: 313-335. Massa, S., Brocchi, G.F., Peri, G. Altieri, C. and Mammina, C. 2001. Evaluation of recovery methods to detect faecal streptococci in polluted waters. Letters in Applied Microbiology. 32: 298-302. McCollor, S. and Heiskary, S. 1993. Selected water quality characteristics of minimally impacted streams from Minnesota’s seven ecoregions. Minnesota Pollution Control Agency, Saint Paul, MN. Metropolitan Council Environmental Services. 2010. Environmental Information Management System. Minnesota Pollution Control Agency. 2010. Final TMDL list of impaired waters. Accessed on-line from http://www.pca.state.mn.us/index.php/view-document.html?gid=8281. Saint Paul, MN. Minnesota Pollution Control Agency. 2010. Draft TMDL list of impaired waters. Accessed on-line from http://www.pca.state.mn.us/index.php/view-document.html?gid=8260. Saint Paul, MN. National Atmospheric and Oceanic Administration. 2010. National Weather Service Climate data. Accessed on-line from http://www.weather.gov/climate/index.php?wfo=mpx United States Environmental Protection Agency. 2010. Current national recommended water quality criteria. Accessed on-line from http://www.epa.gov/waterscience/criteria/wqcriteria.html


Appendix A

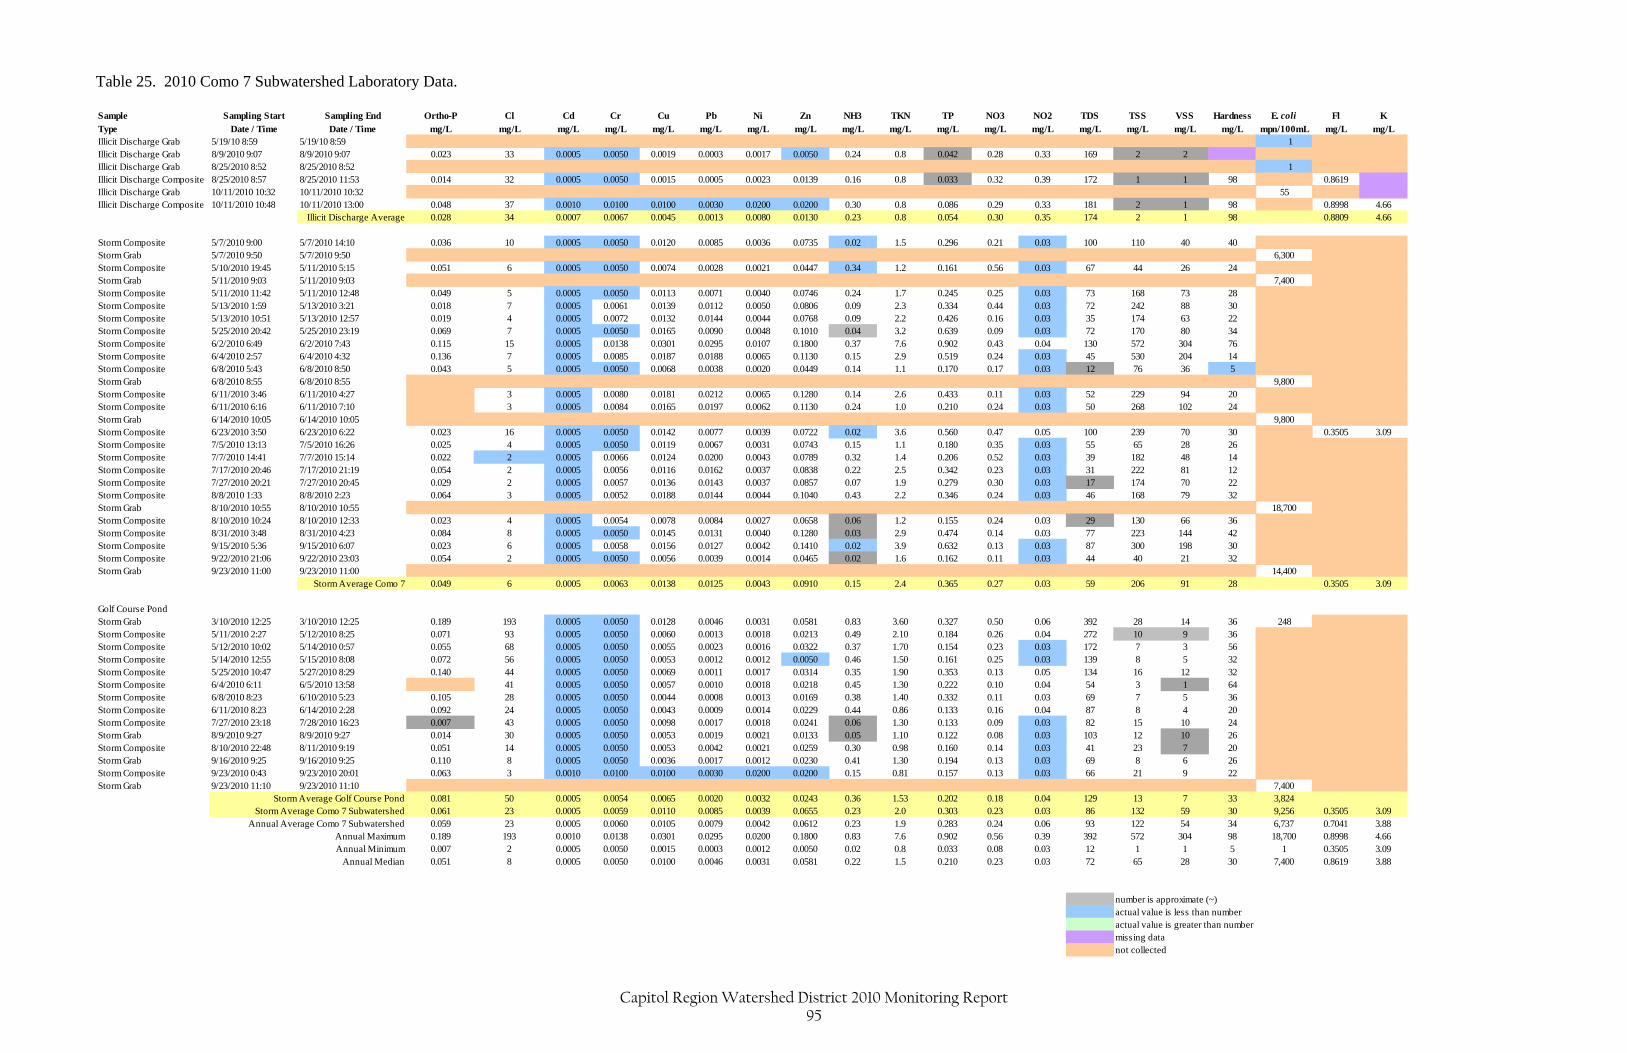
Capitol Region Watershed District 2010 Monitoring Report
95
Table 25. 2010 Como 7 Subwatershed Laboratory Data. Sample Sampling Start Sampling End Ortho-P Cl Cd Cr Cu Pb Ni Zn NH3 TKN TP NO3 NO2 TDS TSS VSS Hardness E. coli Fl KType Date / Time Date / Time mg/L mg/L mg/L mg/L mg/L mg/L mg/L mg/L mg/L mg/L mg/L mg/L mg/L mg/L mg/L mg/L mg/L mpn/100mL mg/L mg/LIllicit Discharge Grab 5/19/10 8:59 5/19/10 8:59 1Illicit Discharge Grab 8/9/2010 9:07 8/9/2010 9:07 0.023 33 0.0005 0.0050 0.0019 0.0003 0.0017 0.0050 0.24 0.8 0.042 0.28 0.33 169 2 2Illicit Discharge Grab 8/25/2010 8:52 8/25/2010 8:52 1Illicit Discharge Composite 8/25/2010 8:57 8/25/2010 11:53 0.014 32 0.0005 0.0050 0.0015 0.0005 0.0023 0.0139 0.16 0.8 0.033 0.32 0.39 172 1 1 98 0.8619Illicit Discharge Grab 10/11/2010 10:32 10/11/2010 10:32 55Illicit Discharge Composite 10/11/2010 10:48 10/11/2010 13:00 0.048 37 0.0010 0.0100 0.0100 0.0030 0.0200 0.0200 0.30 0.8 0.086 0.29 0.33 181 2 1 98 0.8998 4.66
Illicit Discharge Average 0.028 34 0.0007 0.0067 0.0045 0.0013 0.0080 0.0130 0.23 0.8 0.054 0.30 0.35 174 2 1 98 0.8809 4.66
Storm Composite 5/7/2010 9:00 5/7/2010 14:10 0.036 10 0.0005 0.0050 0.0120 0.0085 0.0036 0.0735 0.02 1.5 0.296 0.21 0.03 100 110 40 40Storm Grab 5/7/2010 9:50 5/7/2010 9:50 6,300Storm Composite 5/10/2010 19:45 5/11/2010 5:15 0.051 6 0.0005 0.0050 0.0074 0.0028 0.0021 0.0447 0.34 1.2 0.161 0.56 0.03 67 44 26 24Storm Grab 5/11/2010 9:03 5/11/2010 9:03 7,400Storm Composite 5/11/2010 11:42 5/11/2010 12:48 0.049 5 0.0005 0.0050 0.0113 0.0071 0.0040 0.0746 0.24 1.7 0.245 0.25 0.03 73 168 73 28Storm Composite 5/13/2010 1:59 5/13/2010 3:21 0.018 7 0.0005 0.0061 0.0139 0.0112 0.0050 0.0806 0.09 2.3 0.334 0.44 0.03 72 242 88 30Storm Composite 5/13/2010 10:51 5/13/2010 12:57 0.019 4 0.0005 0.0072 0.0132 0.0144 0.0044 0.0768 0.09 2.2 0.426 0.16 0.03 35 174 63 22Storm Composite 5/25/2010 20:42 5/25/2010 23:19 0.069 7 0.0005 0.0050 0.0165 0.0090 0.0048 0.1010 0.04 3.2 0.639 0.09 0.03 72 170 80 34Storm Composite 6/2/2010 6:49 6/2/2010 7:43 0.115 15 0.0005 0.0138 0.0301 0.0295 0.0107 0.1800 0.37 7.6 0.902 0.43 0.04 130 572 304 76Storm Composite 6/4/2010 2:57 6/4/2010 4:32 0.136 7 0.0005 0.0085 0.0187 0.0188 0.0065 0.1130 0.15 2.9 0.519 0.24 0.03 45 530 204 14Storm Composite 6/8/2010 5:43 6/8/2010 8:50 0.043 5 0.0005 0.0050 0.0068 0.0038 0.0020 0.0449 0.14 1.1 0.170 0.17 0.03 12 76 36 5Storm Grab 6/8/2010 8:55 6/8/2010 8:55 9,800Storm Composite 6/11/2010 3:46 6/11/2010 4:27 3 0.0005 0.0080 0.0181 0.0212 0.0065 0.1280 0.14 2.6 0.433 0.11 0.03 52 229 94 20Storm Composite 6/11/2010 6:16 6/11/2010 7:10 3 0.0005 0.0084 0.0165 0.0197 0.0062 0.1130 0.24 1.0 0.210 0.24 0.03 50 268 102 24Storm Grab 6/14/2010 10:05 6/14/2010 10:05 9,800Storm Composite 6/23/2010 3:50 6/23/2010 6:22 0.023 16 0.0005 0.0050 0.0142 0.0077 0.0039 0.0722 0.02 3.6 0.560 0.47 0.05 100 239 70 30 0.3505 3.09Storm Composite 7/5/2010 13:13 7/5/2010 16:26 0.025 4 0.0005 0.0050 0.0119 0.0067 0.0031 0.0743 0.15 1.1 0.180 0.35 0.03 55 65 28 26Storm Composite 7/7/2010 14:41 7/7/2010 15:14 0.022 2 0.0005 0.0066 0.0124 0.0200 0.0043 0.0789 0.32 1.4 0.206 0.52 0.03 39 182 48 14Storm Composite 7/17/2010 20:46 7/17/2010 21:19 0.054 2 0.0005 0.0056 0.0116 0.0162 0.0037 0.0838 0.22 2.5 0.342 0.23 0.03 31 222 81 12Storm Composite 7/27/2010 20:21 7/27/2010 20:45 0.029 2 0.0005 0.0057 0.0136 0.0143 0.0037 0.0857 0.07 1.9 0.279 0.30 0.03 17 174 70 22Storm Composite 8/8/2010 1:33 8/8/2010 2:23 0.064 3 0.0005 0.0052 0.0188 0.0144 0.0044 0.1040 0.43 2.2 0.346 0.24 0.03 46 168 79 32Storm Grab 8/10/2010 10:55 8/10/2010 10:55 18,700Storm Composite 8/10/2010 10:24 8/10/2010 12:33 0.023 4 0.0005 0.0054 0.0078 0.0084 0.0027 0.0658 0.06 1.2 0.155 0.24 0.03 29 130 66 36Storm Composite 8/31/2010 3:48 8/31/2010 4:23 0.084 8 0.0005 0.0050 0.0145 0.0131 0.0040 0.1280 0.03 2.9 0.474 0.14 0.03 77 223 144 42Storm Composite 9/15/2010 5:36 9/15/2010 6:07 0.023 6 0.0005 0.0058 0.0156 0.0127 0.0042 0.1410 0.02 3.9 0.632 0.13 0.03 87 300 198 30Storm Composite 9/22/2010 21:06 9/22/2010 23:03 0.054 2 0.0005 0.0050 0.0056 0.0039 0.0014 0.0465 0.02 1.6 0.162 0.11 0.03 44 40 21 32Storm Grab 9/23/2010 11:00 9/23/2010 11:00 14,400
Storm Average Como 7 0.049 6 0.0005 0.0063 0.0138 0.0125 0.0043 0.0910 0.15 2.4 0.365 0.27 0.03 59 206 91 28 0.3505 3.09
Golf Course PondStorm Grab 3/10/2010 12:25 3/10/2010 12:25 0.189 193 0.0005 0.0050 0.0128 0.0046 0.0031 0.0581 0.83 3.60 0.327 0.50 0.06 392 28 14 36 248Storm Composite 5/11/2010 2:27 5/12/2010 8:25 0.071 93 0.0005 0.0050 0.0060 0.0013 0.0018 0.0213 0.49 2.10 0.184 0.26 0.04 272 10 9 36Storm Composite 5/12/2010 10:02 5/14/2010 0:57 0.055 68 0.0005 0.0050 0.0055 0.0023 0.0016 0.0322 0.37 1.70 0.154 0.23 0.03 172 7 3 56Storm Composite 5/14/2010 12:55 5/15/2010 8:08 0.072 56 0.0005 0.0050 0.0053 0.0012 0.0012 0.0050 0.46 1.50 0.161 0.25 0.03 139 8 5 32Storm Composite 5/25/2010 10:47 5/27/2010 8:29 0.140 44 0.0005 0.0050 0.0069 0.0011 0.0017 0.0314 0.35 1.90 0.353 0.13 0.05 134 16 12 32Storm Composite 6/4/2010 6:11 6/5/2010 13:58 41 0.0005 0.0050 0.0057 0.0010 0.0018 0.0218 0.45 1.30 0.222 0.10 0.04 54 3 1 64Storm Composite 6/8/2010 8:23 6/10/2010 5:23 0.105 28 0.0005 0.0050 0.0044 0.0008 0.0013 0.0169 0.38 1.40 0.332 0.11 0.03 69 7 5 36Storm Composite 6/11/2010 8:23 6/14/2010 2:28 0.092 24 0.0005 0.0050 0.0043 0.0009 0.0014 0.0229 0.44 0.86 0.133 0.16 0.04 87 8 4 20Storm Composite 7/27/2010 23:18 7/28/2010 16:23 0.007 43 0.0005 0.0050 0.0098 0.0017 0.0018 0.0241 0.06 1.30 0.133 0.09 0.03 82 15 10 24Storm Grab 8/9/2010 9:27 8/9/2010 9:27 0.014 30 0.0005 0.0050 0.0053 0.0019 0.0021 0.0133 0.05 1.10 0.122 0.08 0.03 103 12 10 26Storm Composite 8/10/2010 22:48 8/11/2010 9:19 0.051 14 0.0005 0.0050 0.0053 0.0042 0.0021 0.0259 0.30 0.98 0.160 0.14 0.03 41 23 7 20Storm Grab 9/16/2010 9:25 9/16/2010 9:25 0.110 8 0.0005 0.0050 0.0036 0.0017 0.0012 0.0230 0.41 1.30 0.194 0.13 0.03 69 8 6 26Storm Composite 9/23/2010 0:43 9/23/2010 20:01 0.063 3 0.0010 0.0100 0.0100 0.0030 0.0200 0.0200 0.15 0.81 0.157 0.13 0.03 66 21 9 22Storm Grab 9/23/2010 11:10 9/23/2010 11:10 7,400
Storm Average Golf Course Pond 0.081 50 0.0005 0.0054 0.0065 0.0020 0.0032 0.0243 0.36 1.53 0.202 0.18 0.04 129 13 7 33 3,824Storm Average Como 7 Subwatershed 0.061 23 0.0005 0.0059 0.0110 0.0085 0.0039 0.0655 0.23 2.0 0.303 0.23 0.03 86 132 59 30 9,256 0.3505 3.09
Annual Average Como 7 Subwatershed 0.059 23 0.0005 0.0060 0.0105 0.0079 0.0042 0.0612 0.23 1.9 0.283 0.24 0.06 93 122 54 34 6,737 0.7041 3.88Annual Maximum 0.189 193 0.0010 0.0138 0.0301 0.0295 0.0200 0.1800 0.83 7.6 0.902 0.56 0.39 392 572 304 98 18,700 0.8998 4.66Annual Minimum 0.007 2 0.0005 0.0050 0.0015 0.0003 0.0012 0.0050 0.02 0.8 0.033 0.08 0.03 12 1 1 5 1 0.3505 3.09
Annual Median 0.051 8 0.0005 0.0050 0.0100 0.0046 0.0031 0.0581 0.22 1.5 0.210 0.23 0.03 72 65 28 30 7,400 0.8619 3.88
number is approximate (~)actual value is less than numberactual value is greater than numbermissing datanot collected

Capitol Region Watershed District 2010 Monitoring Report 96
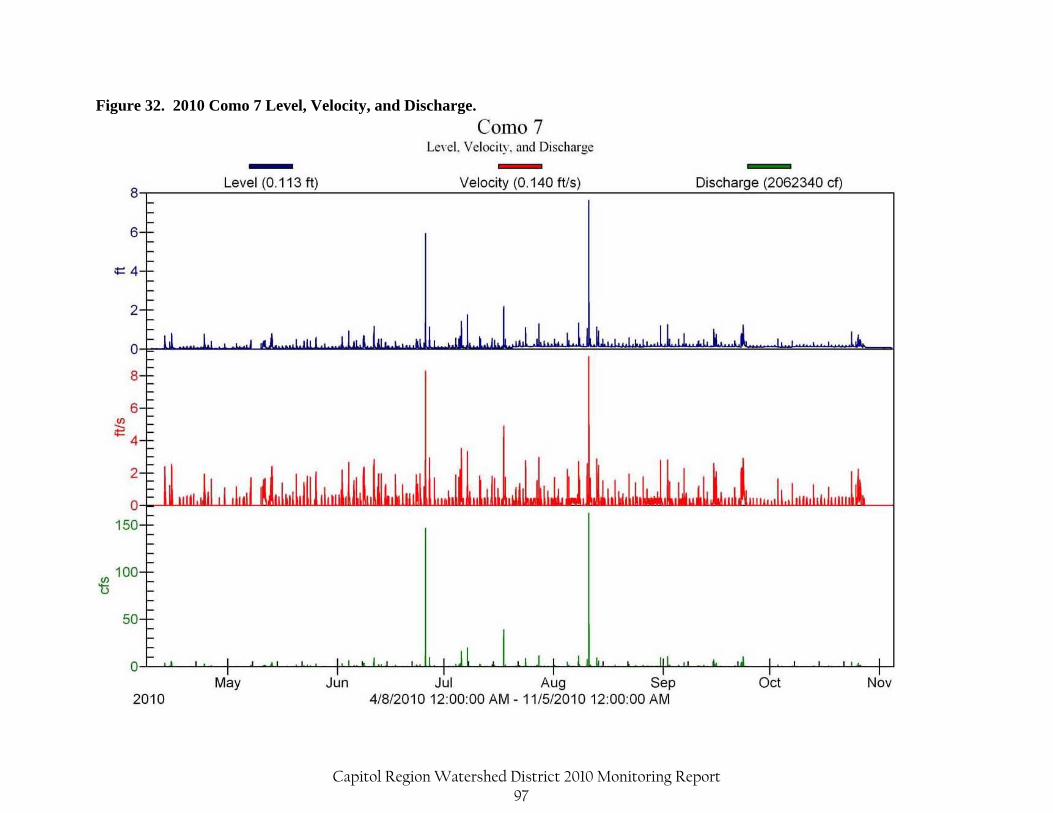
Figure 32. 2010 Como 7 Level, Velocity, and Discharge.
Capitol Region Watershed District 2010 Monitoring Report 97
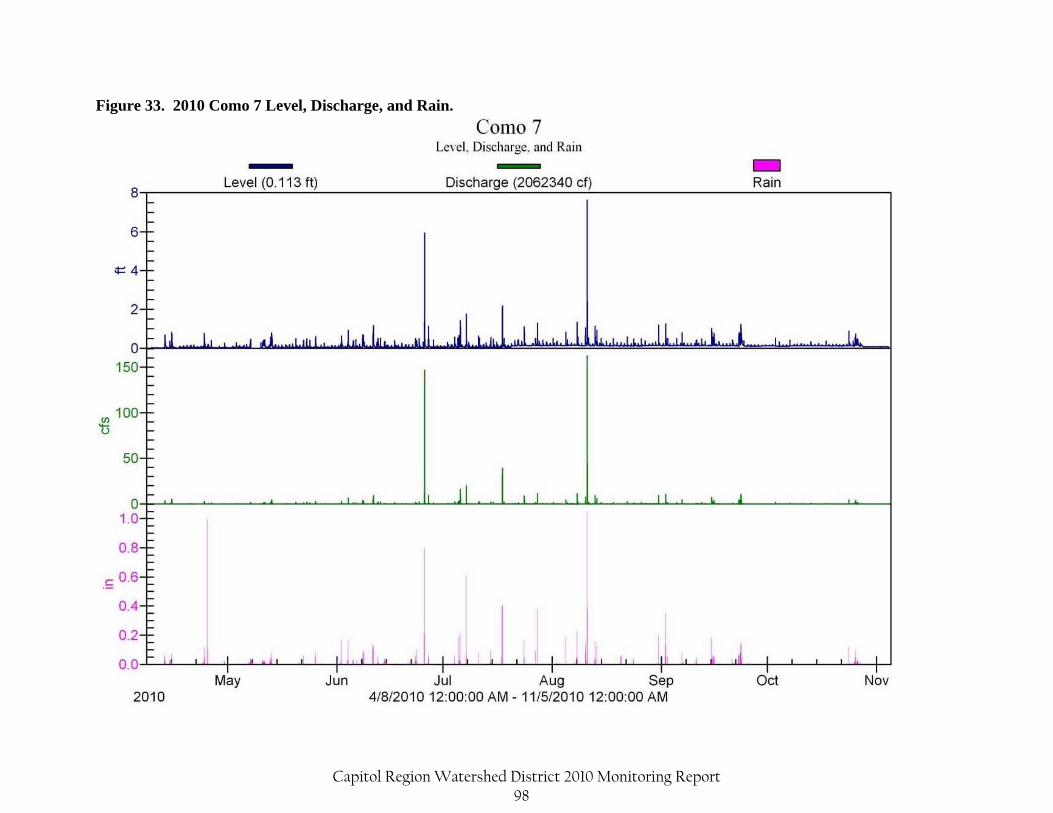
Figure 33. 2010 Como 7 Level, Discharge, and Rain.
Capitol Region Watershed District 2010 Monitoring Report 98
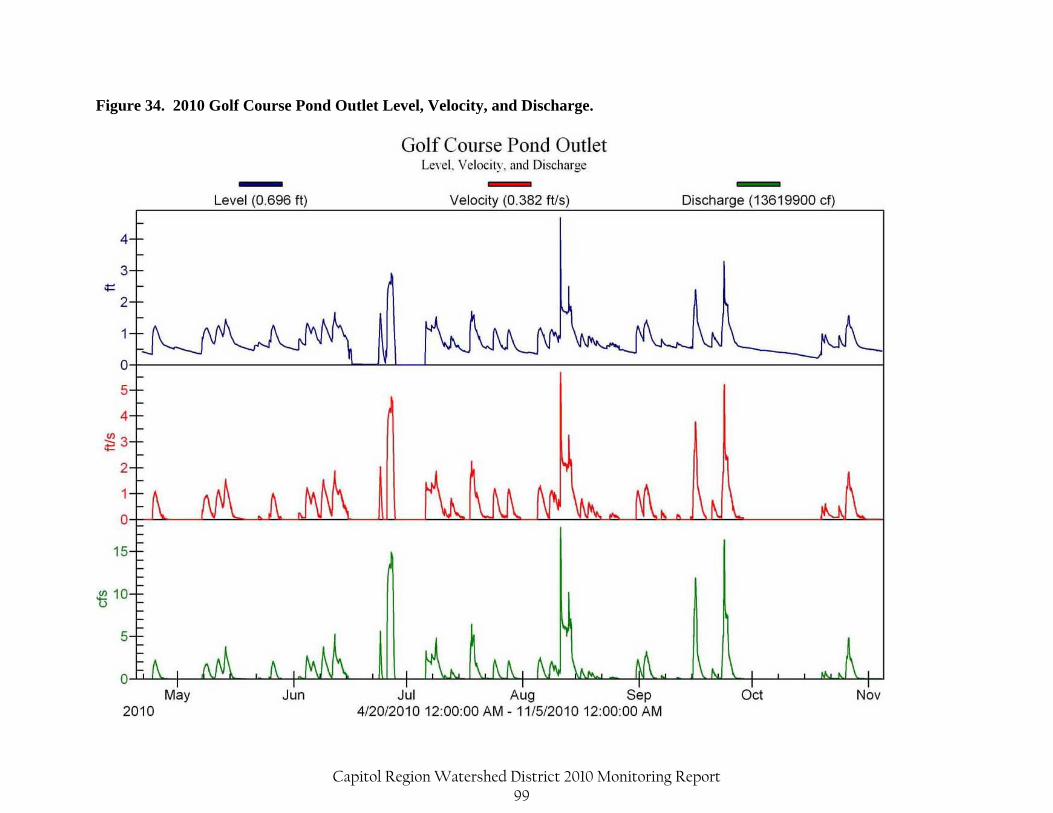
Figure 34. 2010 Golf Course Pond Outlet Level, Velocity, and Discharge.
Capitol Region Watershed District 2010 Monitoring Report 99
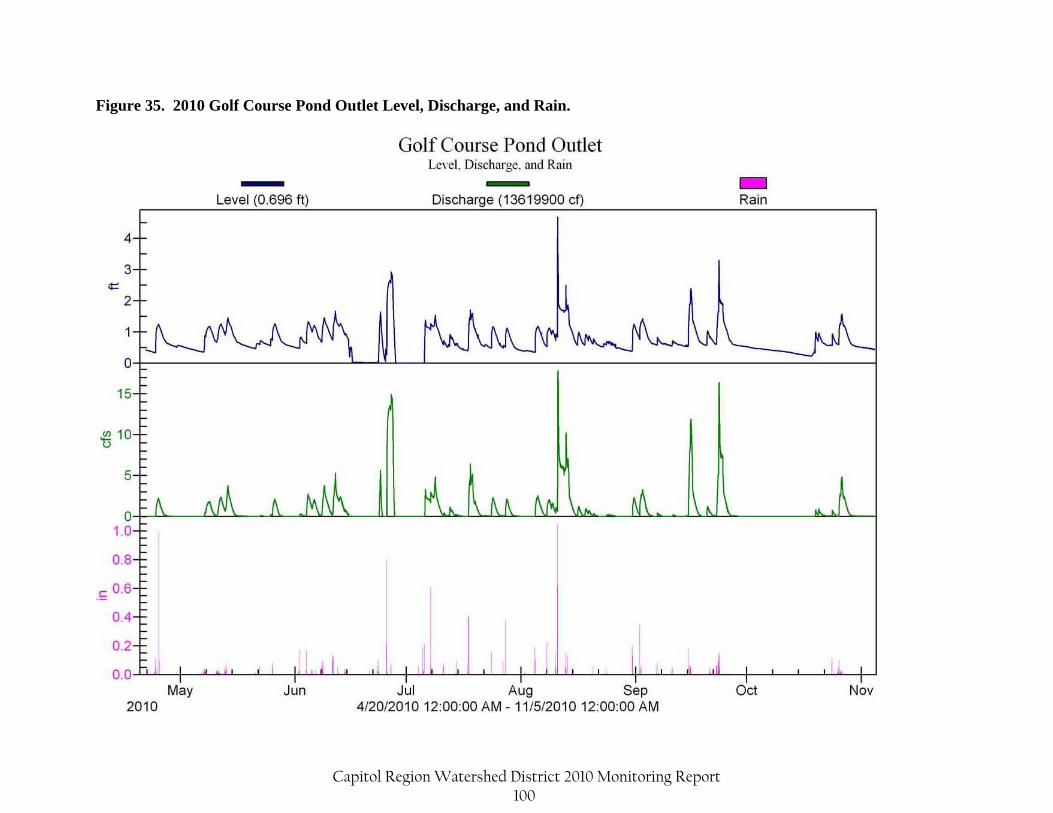
Figure 35. 2010 Golf Course Pond Outlet Level, Discharge, and Rain.
Capitol Region Watershed District 2010 Monitoring Report 100
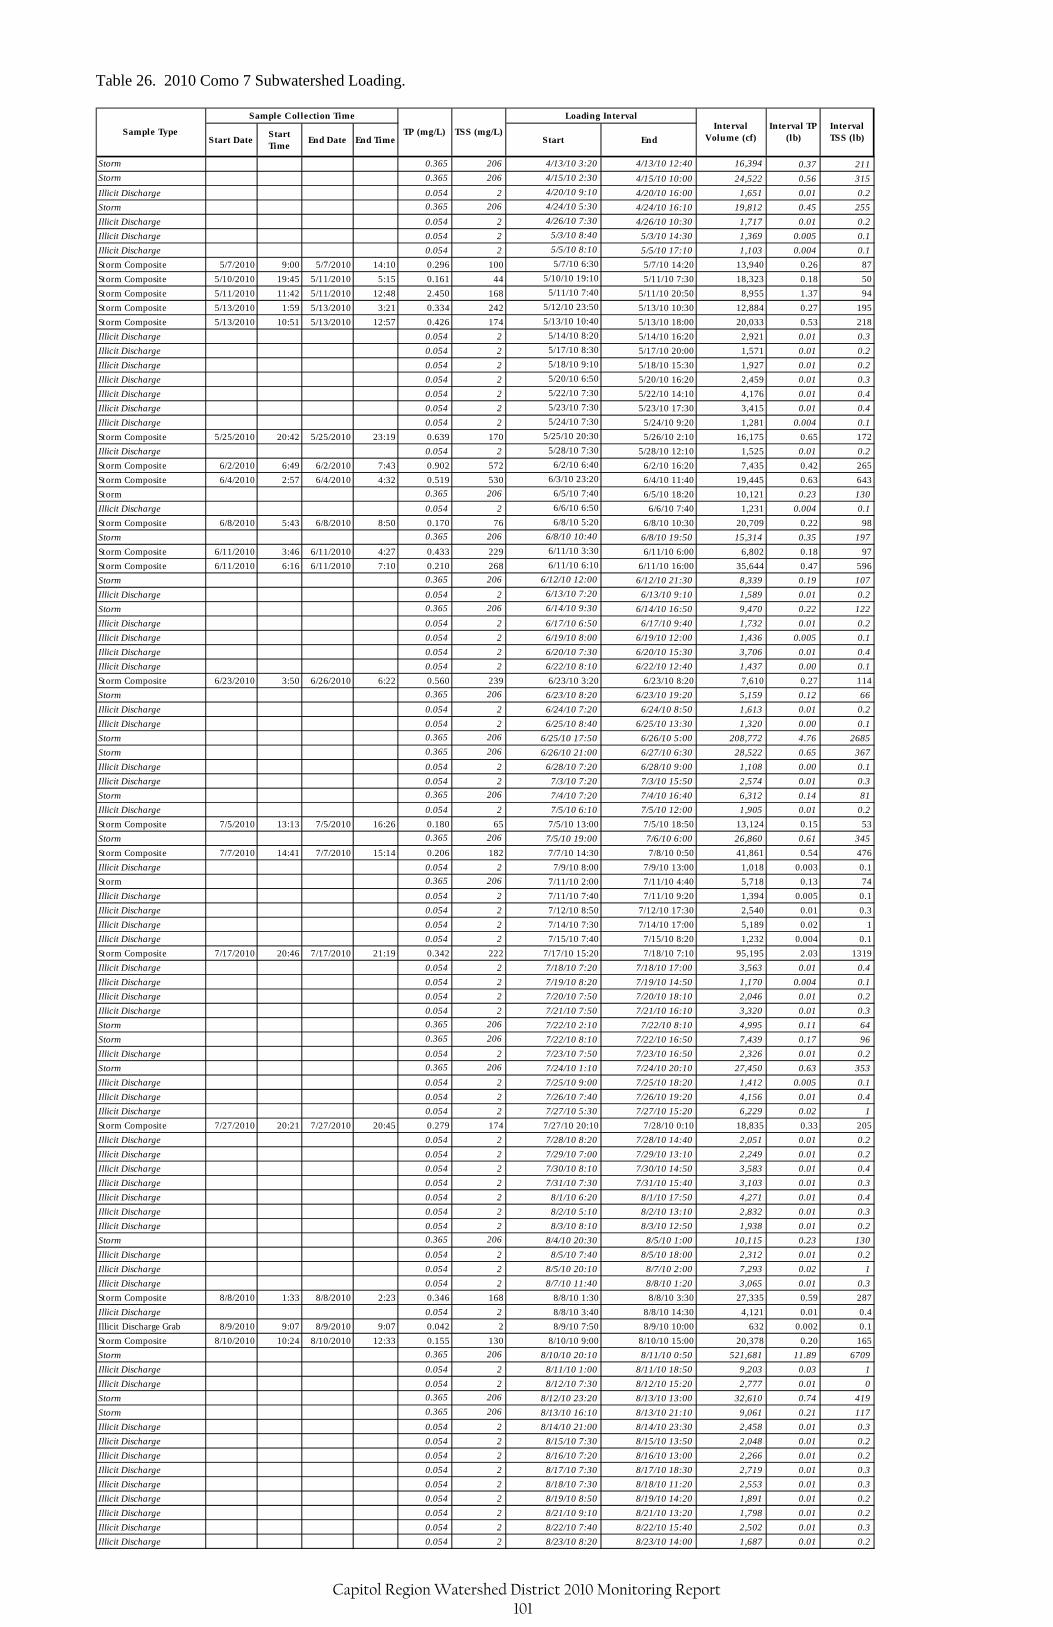
Table 26. 2010 Como 7 Subwatershed Loading.
Start DateStart Time
End Date End Time Start End
Storm 0.365 206 4/13/10 3:20 4/13/10 12:40 16,394 0.37 211
Storm 0.365 206 4/15/10 2:30 4/15/10 10:00 24,522 0.56 315
Illicit Discharge 0.054 2 4/20/10 9:10 4/20/10 16:00 1,651 0.01 0.2
Storm 0.365 206 4/24/10 5:30 4/24/10 16:10 19,812 0.45 255
Illicit Discharge 0.054 2 4/26/10 7:30 4/26/10 10:30 1,717 0.01 0.2
Illicit Discharge 0.054 2 5/3/10 8:40 5/3/10 14:30 1,369 0.005 0.1
Illicit Discharge 0.054 2 5/5/10 8:10 5/5/10 17:10 1,103 0.004 0.1
Storm Composite 5/7/2010 9:00 5/7/2010 14:10 0.296 100 5/7/10 6:30 5/7/10 14:20 13,940 0.26 87
Storm Composite 5/10/2010 19:45 5/11/2010 5:15 0.161 44 5/10/10 19:10 5/11/10 7:30 18,323 0.18 50
Storm Composite 5/11/2010 11:42 5/11/2010 12:48 2.450 168 5/11/10 7:40 5/11/10 20:50 8,955 1.37 94
Storm Composite 5/13/2010 1:59 5/13/2010 3:21 0.334 242 5/12/10 23:50 5/13/10 10:30 12,884 0.27 195
Storm Composite 5/13/2010 10:51 5/13/2010 12:57 0.426 174 5/13/10 10:40 5/13/10 18:00 20,033 0.53 218
Illicit Discharge 0.054 2 5/14/10 8:20 5/14/10 16:20 2,921 0.01 0.3
Illicit Discharge 0.054 2 5/17/10 8:30 5/17/10 20:00 1,571 0.01 0.2
Illicit Discharge 0.054 2 5/18/10 9:10 5/18/10 15:30 1,927 0.01 0.2
Illicit Discharge 0.054 2 5/20/10 6:50 5/20/10 16:20 2,459 0.01 0.3
Illicit Discharge 0.054 2 5/22/10 7:30 5/22/10 14:10 4,176 0.01 0.4
Illicit Discharge 0.054 2 5/23/10 7:30 5/23/10 17:30 3,415 0.01 0.4
Illicit Discharge 0.054 2 5/24/10 7:30 5/24/10 9:20 1,281 0.004 0.1
Storm Composite 5/25/2010 20:42 5/25/2010 23:19 0.639 170 5/25/10 20:30 5/26/10 2:10 16,175 0.65 172
Illicit Discharge 0.054 2 5/28/10 7:30 5/28/10 12:10 1,525 0.01 0.2
Storm Composite 6/2/2010 6:49 6/2/2010 7:43 0.902 572 6/2/10 6:40 6/2/10 16:20 7,435 0.42 265
Storm Composite 6/4/2010 2:57 6/4/2010 4:32 0.519 530 6/3/10 23:20 6/4/10 11:40 19,445 0.63 643
Storm 0.365 206 6/5/10 7:40 6/5/10 18:20 10,121 0.23 130
Illicit Discharge 0.054 2 6/6/10 6:50 6/6/10 7:40 1,231 0.004 0.1
Storm Composite 6/8/2010 5:43 6/8/2010 8:50 0.170 76 6/8/10 5:20 6/8/10 10:30 20,709 0.22 98
Storm 0.365 206 6/8/10 10:40 6/8/10 19:50 15,314 0.35 197
Storm Composite 6/11/2010 3:46 6/11/2010 4:27 0.433 229 6/11/10 3:30 6/11/10 6:00 6,802 0.18 97
Storm Composite 6/11/2010 6:16 6/11/2010 7:10 0.210 268 6/11/10 6:10 6/11/10 16:00 35,644 0.47 596
Storm 0.365 206 6/12/10 12:00 6/12/10 21:30 8,339 0.19 107
Illicit Discharge 0.054 2 6/13/10 7:20 6/13/10 9:10 1,589 0.01 0.2
Storm 0.365 206 6/14/10 9:30 6/14/10 16:50 9,470 0.22 122
Illicit Discharge 0.054 2 6/17/10 6:50 6/17/10 9:40 1,732 0.01 0.2
Illicit Discharge 0.054 2 6/19/10 8:00 6/19/10 12:00 1,436 0.005 0.1
Illicit Discharge 0.054 2 6/20/10 7:30 6/20/10 15:30 3,706 0.01 0.4
Illicit Discharge 0.054 2 6/22/10 8:10 6/22/10 12:40 1,437 0.00 0.1
Storm Composite 6/23/2010 3:50 6/26/2010 6:22 0.560 239 6/23/10 3:20 6/23/10 8:20 7,610 0.27 114
Storm 0.365 206 6/23/10 8:20 6/23/10 19:20 5,159 0.12 66
Illicit Discharge 0.054 2 6/24/10 7:20 6/24/10 8:50 1,613 0.01 0.2
Illicit Discharge 0.054 2 6/25/10 8:40 6/25/10 13:30 1,320 0.00 0.1
Storm 0.365 206 6/25/10 17:50 6/26/10 5:00 208,772 4.76 2685
Storm 0.365 206 6/26/10 21:00 6/27/10 6:30 28,522 0.65 367
Illicit Discharge 0.054 2 6/28/10 7:20 6/28/10 9:00 1,108 0.00 0.1
Illicit Discharge 0.054 2 7/3/10 7:20 7/3/10 15:50 2,574 0.01 0.3
Storm 0.365 206 7/4/10 7:20 7/4/10 16:40 6,312 0.14 81
Illicit Discharge 0.054 2 7/5/10 6:10 7/5/10 12:00 1,905 0.01 0.2
Storm Composite 7/5/2010 13:13 7/5/2010 16:26 0.180 65 7/5/10 13:00 7/5/10 18:50 13,124 0.15 53
Storm 0.365 206 7/5/10 19:00 7/6/10 6:00 26,860 0.61 345
Storm Composite 7/7/2010 14:41 7/7/2010 15:14 0.206 182 7/7/10 14:30 7/8/10 0:50 41,861 0.54 476
Illicit Discharge 0.054 2 7/9/10 8:00 7/9/10 13:00 1,018 0.003 0.1
Storm 0.365 206 7/11/10 2:00 7/11/10 4:40 5,718 0.13 74
Illicit Discharge 0.054 2 7/11/10 7:40 7/11/10 9:20 1,394 0.005 0.1
Illicit Discharge 0.054 2 7/12/10 8:50 7/12/10 17:30 2,540 0.01 0.3
Illicit Discharge 0.054 2 7/14/10 7:30 7/14/10 17:00 5,189 0.02 1
Illicit Discharge 0.054 2 7/15/10 7:40 7/15/10 8:20 1,232 0.004 0.1
Storm Composite 7/17/2010 20:46 7/17/2010 21:19 0.342 222 7/17/10 15:20 7/18/10 7:10 95,195 2.03 1319
Illicit Discharge 0.054 2 7/18/10 7:20 7/18/10 17:00 3,563 0.01 0.4
Illicit Discharge 0.054 2 7/19/10 8:20 7/19/10 14:50 1,170 0.004 0.1
Illicit Discharge 0.054 2 7/20/10 7:50 7/20/10 18:10 2,046 0.01 0.2
Illicit Discharge 0.054 2 7/21/10 7:50 7/21/10 16:10 3,320 0.01 0.3
Storm 0.365 206 7/22/10 2:10 7/22/10 8:10 4,995 0.11 64
Storm 0.365 206 7/22/10 8:10 7/22/10 16:50 7,439 0.17 96
Illicit Discharge 0.054 2 7/23/10 7:50 7/23/10 16:50 2,326 0.01 0.2
Storm 0.365 206 7/24/10 1:10 7/24/10 20:10 27,450 0.63 353
Illicit Discharge 0.054 2 7/25/10 9:00 7/25/10 18:20 1,412 0.005 0.1
Illicit Discharge 0.054 2 7/26/10 7:40 7/26/10 19:20 4,156 0.01 0.4
Illicit Discharge 0.054 2 7/27/10 5:30 7/27/10 15:20 6,229 0.02 1
Storm Composite 7/27/2010 20:21 7/27/2010 20:45 0.279 174 7/27/10 20:10 7/28/10 0:10 18,835 0.33 205
Illicit Discharge 0.054 2 7/28/10 8:20 7/28/10 14:40 2,051 0.01 0.2
Illicit Discharge 0.054 2 7/29/10 7:00 7/29/10 13:10 2,249 0.01 0.2
Illicit Discharge 0.054 2 7/30/10 8:10 7/30/10 14:50 3,583 0.01 0.4
Illicit Discharge 0.054 2 7/31/10 7:30 7/31/10 15:40 3,103 0.01 0.3
Illicit Discharge 0.054 2 8/1/10 6:20 8/1/10 17:50 4,271 0.01 0.4
Illicit Discharge 0.054 2 8/2/10 5:10 8/2/10 13:10 2,832 0.01 0.3
Illicit Discharge 0.054 2 8/3/10 8:10 8/3/10 12:50 1,938 0.01 0.2
Storm 0.365 206 8/4/10 20:30 8/5/10 1:00 10,115 0.23 130
Illicit Discharge 0.054 2 8/5/10 7:40 8/5/10 18:00 2,312 0.01 0.2
Illicit Discharge 0.054 2 8/5/10 20:10 8/7/10 2:00 7,293 0.02 1
Illicit Discharge 0.054 2 8/7/10 11:40 8/8/10 1:20 3,065 0.01 0.3
Storm Composite 8/8/2010 1:33 8/8/2010 2:23 0.346 168 8/8/10 1:30 8/8/10 3:30 27,335 0.59 287
Illicit Discharge 0.054 2 8/8/10 3:40 8/8/10 14:30 4,121 0.01 0.4
Illicit Discharge Grab 8/9/2010 9:07 8/9/2010 9:07 0.042 2 8/9/10 7:50 8/9/10 10:00 632 0.002 0.1
Storm Composite 8/10/2010 10:24 8/10/2010 12:33 0.155 130 8/10/10 9:00 8/10/10 15:00 20,378 0.20 165
Storm 0.365 206 8/10/10 20:10 8/11/10 0:50 521,681 11.89 6709
Illicit Discharge 0.054 2 8/11/10 1:00 8/11/10 18:50 9,203 0.03 1
Illicit Discharge 0.054 2 8/12/10 7:30 8/12/10 15:20 2,777 0.01 0
Storm 0.365 206 8/12/10 23:20 8/13/10 13:00 32,610 0.74 419
Storm 0.365 206 8/13/10 16:10 8/13/10 21:10 9,061 0.21 117
Illicit Discharge 0.054 2 8/14/10 21:00 8/14/10 23:30 2,458 0.01 0.3
Illicit Discharge 0.054 2 8/15/10 7:30 8/15/10 13:50 2,048 0.01 0.2
Illicit Discharge 0.054 2 8/16/10 7:20 8/16/10 13:00 2,266 0.01 0.2
Illicit Discharge 0.054 2 8/17/10 7:30 8/17/10 18:30 2,719 0.01 0.3
Illicit Discharge 0.054 2 8/18/10 7:30 8/18/10 11:20 2,553 0.01 0.3
Illicit Discharge 0.054 2 8/19/10 8:50 8/19/10 14:20 1,891 0.01 0.2
Illicit Discharge 0.054 2 8/21/10 9:10 8/21/10 13:20 1,798 0.01 0.2
Illicit Discharge 0.054 2 8/22/10 7:40 8/22/10 15:40 2,502 0.01 0.3
Illicit Discharge 0.054 2 8/23/10 8:20 8/23/10 14:00 1,687 0.01 0.2
Loading IntervalInterval
Volume (cf)Interval TP
(lb)Interval TSS (lb)
Sample Type
Sample Collection Time
TP (mg/L) TSS (mg/L)
Capitol Region Watershed District 2010 Monitoring Report 101
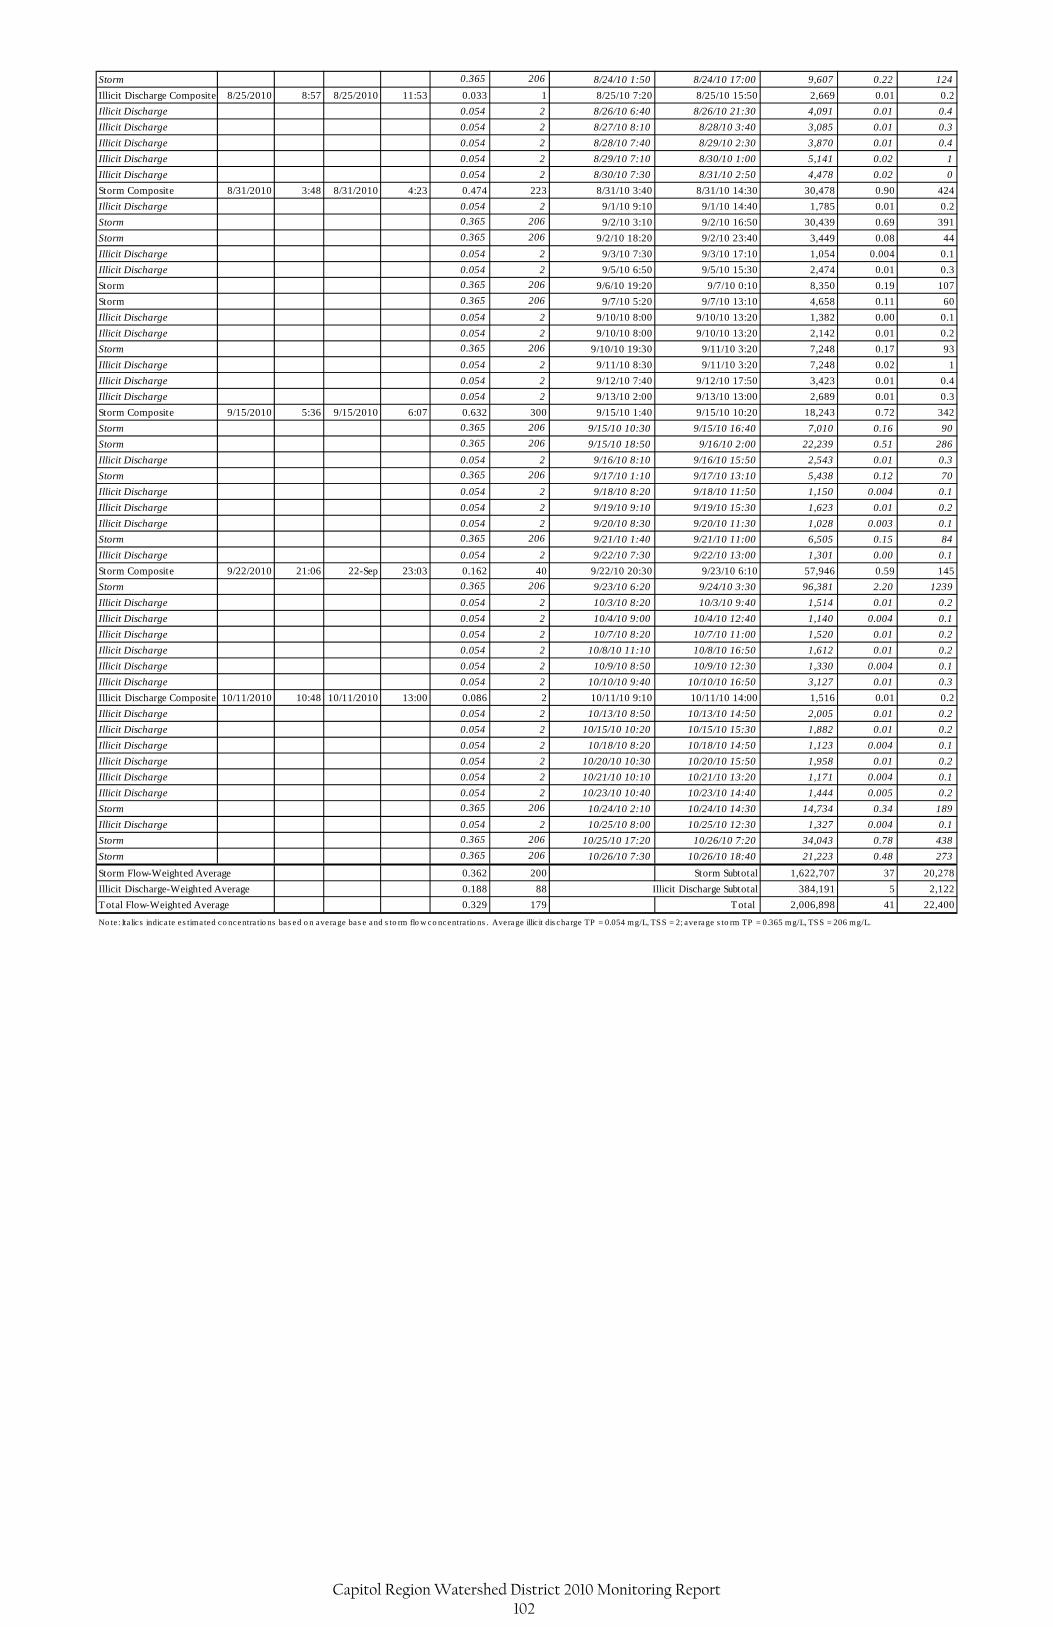
Storm 0.365 206 8/24/10 1:50 8/24/10 17:00 9,607 0.22 124
Illicit Discharge Composite 8/25/2010 8:57 8/25/2010 11:53 0.033 1 8/25/10 7:20 8/25/10 15:50 2,669 0.01 0.2
Illicit Discharge 0.054 2 8/26/10 6:40 8/26/10 21:30 4,091 0.01 0.4
Illicit Discharge 0.054 2 8/27/10 8:10 8/28/10 3:40 3,085 0.01 0.3
Illicit Discharge 0.054 2 8/28/10 7:40 8/29/10 2:30 3,870 0.01 0.4
Illicit Discharge 0.054 2 8/29/10 7:10 8/30/10 1:00 5,141 0.02 1
Illicit Discharge 0.054 2 8/30/10 7:30 8/31/10 2:50 4,478 0.02 0
Storm Composite 8/31/2010 3:48 8/31/2010 4:23 0.474 223 8/31/10 3:40 8/31/10 14:30 30,478 0.90 424
Illicit Discharge 0.054 2 9/1/10 9:10 9/1/10 14:40 1,785 0.01 0.2
Storm 0.365 206 9/2/10 3:10 9/2/10 16:50 30,439 0.69 391
Storm 0.365 206 9/2/10 18:20 9/2/10 23:40 3,449 0.08 44
Illicit Discharge 0.054 2 9/3/10 7:30 9/3/10 17:10 1,054 0.004 0.1
Illicit Discharge 0.054 2 9/5/10 6:50 9/5/10 15:30 2,474 0.01 0.3
Storm 0.365 206 9/6/10 19:20 9/7/10 0:10 8,350 0.19 107
Storm 0.365 206 9/7/10 5:20 9/7/10 13:10 4,658 0.11 60
Illicit Discharge 0.054 2 9/10/10 8:00 9/10/10 13:20 1,382 0.00 0.1
Illicit Discharge 0.054 2 9/10/10 8:00 9/10/10 13:20 2,142 0.01 0.2
Storm 0.365 206 9/10/10 19:30 9/11/10 3:20 7,248 0.17 93
Illicit Discharge 0.054 2 9/11/10 8:30 9/11/10 3:20 7,248 0.02 1
Illicit Discharge 0.054 2 9/12/10 7:40 9/12/10 17:50 3,423 0.01 0.4
Illicit Discharge 0.054 2 9/13/10 2:00 9/13/10 13:00 2,689 0.01 0.3
Storm Composite 9/15/2010 5:36 9/15/2010 6:07 0.632 300 9/15/10 1:40 9/15/10 10:20 18,243 0.72 342
Storm 0.365 206 9/15/10 10:30 9/15/10 16:40 7,010 0.16 90
Storm 0.365 206 9/15/10 18:50 9/16/10 2:00 22,239 0.51 286
Illicit Discharge 0.054 2 9/16/10 8:10 9/16/10 15:50 2,543 0.01 0.3
Storm 0.365 206 9/17/10 1:10 9/17/10 13:10 5,438 0.12 70
Illicit Discharge 0.054 2 9/18/10 8:20 9/18/10 11:50 1,150 0.004 0.1
Illicit Discharge 0.054 2 9/19/10 9:10 9/19/10 15:30 1,623 0.01 0.2
Illicit Discharge 0.054 2 9/20/10 8:30 9/20/10 11:30 1,028 0.003 0.1
Storm 0.365 206 9/21/10 1:40 9/21/10 11:00 6,505 0.15 84
Illicit Discharge 0.054 2 9/22/10 7:30 9/22/10 13:00 1,301 0.00 0.1
Storm Composite 9/22/2010 21:06 22-Sep 23:03 0.162 40 9/22/10 20:30 9/23/10 6:10 57,946 0.59 145
Storm 0.365 206 9/23/10 6:20 9/24/10 3:30 96,381 2.20 1239
Illicit Discharge 0.054 2 10/3/10 8:20 10/3/10 9:40 1,514 0.01 0.2
Illicit Discharge 0.054 2 10/4/10 9:00 10/4/10 12:40 1,140 0.004 0.1
Illicit Discharge 0.054 2 10/7/10 8:20 10/7/10 11:00 1,520 0.01 0.2
Illicit Discharge 0.054 2 10/8/10 11:10 10/8/10 16:50 1,612 0.01 0.2
Illicit Discharge 0.054 2 10/9/10 8:50 10/9/10 12:30 1,330 0.004 0.1
Illicit Discharge 0.054 2 10/10/10 9:40 10/10/10 16:50 3,127 0.01 0.3
Illicit Discharge Composite 10/11/2010 10:48 10/11/2010 13:00 0.086 2 10/11/10 9:10 10/11/10 14:00 1,516 0.01 0.2
Illicit Discharge 0.054 2 10/13/10 8:50 10/13/10 14:50 2,005 0.01 0.2
Illicit Discharge 0.054 2 10/15/10 10:20 10/15/10 15:30 1,882 0.01 0.2
Illicit Discharge 0.054 2 10/18/10 8:20 10/18/10 14:50 1,123 0.004 0.1
Illicit Discharge 0.054 2 10/20/10 10:30 10/20/10 15:50 1,958 0.01 0.2
Illicit Discharge 0.054 2 10/21/10 10:10 10/21/10 13:20 1,171 0.004 0.1
Illicit Discharge 0.054 2 10/23/10 10:40 10/23/10 14:40 1,444 0.005 0.2
Storm 0.365 206 10/24/10 2:10 10/24/10 14:30 14,734 0.34 189
Illicit Discharge 0.054 2 10/25/10 8:00 10/25/10 12:30 1,327 0.004 0.1
Storm 0.365 206 10/25/10 17:20 10/26/10 7:20 34,043 0.78 438
Storm 0.365 206 10/26/10 7:30 10/26/10 18:40 21,223 0.48 273
0.362 200 Storm Subtotal 1,622,707 37 20,278
Illicit Discharge-Weighted Average 0.188 88 Illicit Discharge Subtotal 384,191 5 2,122
0.329 179 Total 2,006,898 41 22,400
No te : Ita lics indica te e s tima ted co ncentra tio ns bas ed o n average bas e and s to rm flo w co ncentra tio ns . Average illic it dis charge TP = 0.054 mg/L, TSS = 2; average s to rm TP = 0.365 mg/L, TSS = 206 mg/L.
Storm Flow-Weighted Average
Total Flow-Weighted Average
Capitol Region Watershed District 2010 Monitoring Report 102
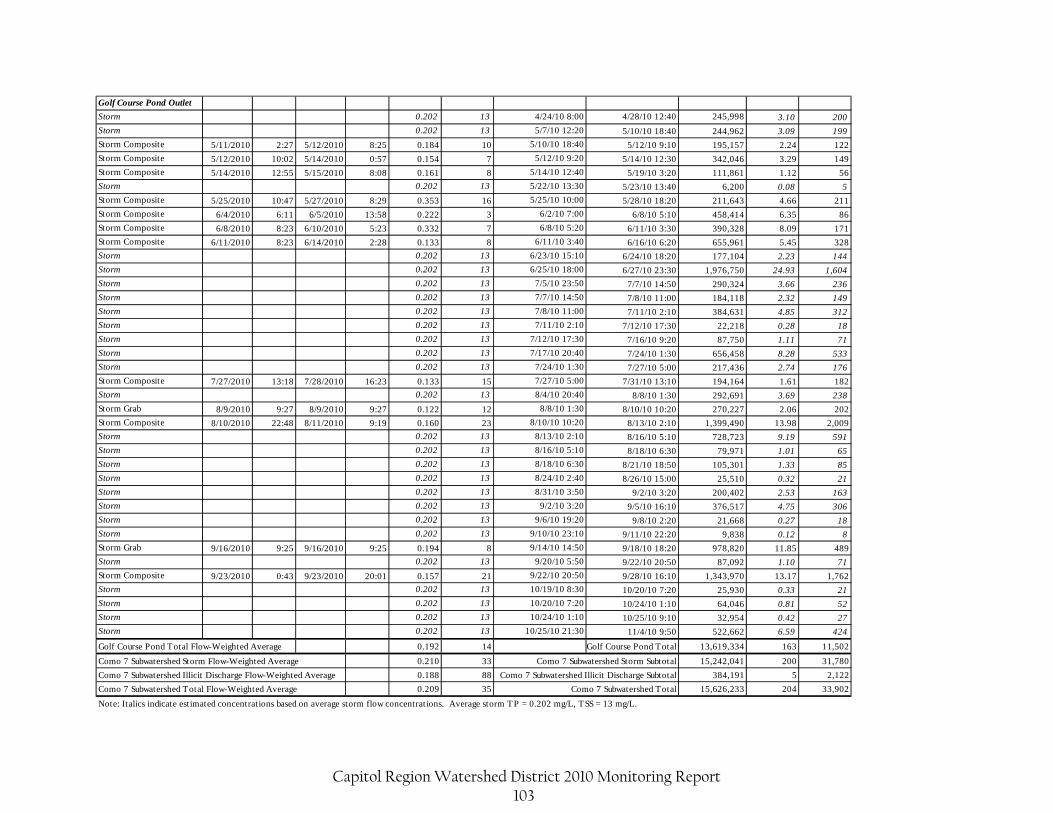
Golf Course Pond OutletStorm 0.202 13 4/24/10 8:00 4/28/10 12:40 245,998 3.10 200
Storm 0.202 13 5/7/10 12:20 5/10/10 18:40 244,962 3.09 199
Storm Composite 5/11/2010 2:27 5/12/2010 8:25 0.184 10 5/10/10 18:40 5/12/10 9:10 195,157 2.24 122
Storm Composite 5/12/2010 10:02 5/14/2010 0:57 0.154 7 5/12/10 9:20 5/14/10 12:30 342,046 3.29 149
Storm Composite 5/14/2010 12:55 5/15/2010 8:08 0.161 8 5/14/10 12:40 5/19/10 3:20 111,861 1.12 56
Storm 0.202 13 5/22/10 13:30 5/23/10 13:40 6,200 0.08 5
Storm Composite 5/25/2010 10:47 5/27/2010 8:29 0.353 16 5/25/10 10:00 5/28/10 18:20 211,643 4.66 211
Storm Composite 6/4/2010 6:11 6/5/2010 13:58 0.222 3 6/2/10 7:00 6/8/10 5:10 458,414 6.35 86
Storm Composite 6/8/2010 8:23 6/10/2010 5:23 0.332 7 6/8/10 5:20 6/11/10 3:30 390,328 8.09 171
Storm Composite 6/11/2010 8:23 6/14/2010 2:28 0.133 8 6/11/10 3:40 6/16/10 6:20 655,961 5.45 328
Storm 0.202 13 6/23/10 15:10 6/24/10 18:20 177,104 2.23 144
Storm 0.202 13 6/25/10 18:00 6/27/10 23:30 1,976,750 24.93 1,604
Storm 0.202 13 7/5/10 23:50 7/7/10 14:50 290,324 3.66 236
Storm 0.202 13 7/7/10 14:50 7/8/10 11:00 184,118 2.32 149
Storm 0.202 13 7/8/10 11:00 7/11/10 2:10 384,631 4.85 312
Storm 0.202 13 7/11/10 2:10 7/12/10 17:30 22,218 0.28 18
Storm 0.202 13 7/12/10 17:30 7/16/10 9:20 87,750 1.11 71
Storm 0.202 13 7/17/10 20:40 7/24/10 1:30 656,458 8.28 533
Storm 0.202 13 7/24/10 1:30 7/27/10 5:00 217,436 2.74 176
Storm Composite 7/27/2010 13:18 7/28/2010 16:23 0.133 15 7/27/10 5:00 7/31/10 13:10 194,164 1.61 182
Storm 0.202 13 8/4/10 20:40 8/8/10 1:30 292,691 3.69 238
Storm Grab 8/9/2010 9:27 8/9/2010 9:27 0.122 12 8/8/10 1:30 8/10/10 10:20 270,227 2.06 202
Storm Composite 8/10/2010 22:48 8/11/2010 9:19 0.160 23 8/10/10 10:20 8/13/10 2:10 1,399,490 13.98 2,009
Storm 0.202 13 8/13/10 2:10 8/16/10 5:10 728,723 9.19 591
Storm 0.202 13 8/16/10 5:10 8/18/10 6:30 79,971 1.01 65
Storm 0.202 13 8/18/10 6:30 8/21/10 18:50 105,301 1.33 85
Storm 0.202 13 8/24/10 2:40 8/26/10 15:00 25,510 0.32 21
Storm 0.202 13 8/31/10 3:50 9/2/10 3:20 200,402 2.53 163
Storm 0.202 13 9/2/10 3:20 9/5/10 16:10 376,517 4.75 306
Storm 0.202 13 9/6/10 19:20 9/8/10 2:20 21,668 0.27 18
Storm 0.202 13 9/10/10 23:10 9/11/10 22:20 9,838 0.12 8
Storm Grab 9/16/2010 9:25 9/16/2010 9:25 0.194 8 9/14/10 14:50 9/18/10 18:20 978,820 11.85 489
Storm 0.202 13 9/20/10 5:50 9/22/10 20:50 87,092 1.10 71
Storm Composite 9/23/2010 0:43 9/23/2010 20:01 0.157 21 9/22/10 20:50 9/28/10 16:10 1,343,970 13.17 1,762
Storm 0.202 13 10/19/10 8:30 10/20/10 7:20 25,930 0.33 21
Storm 0.202 13 10/20/10 7:20 10/24/10 1:10 64,046 0.81 52
Storm 0.202 13 10/24/10 1:10 10/25/10 9:10 32,954 0.42 27
Storm 0.202 13 10/25/10 21:30 11/4/10 9:50 522,662 6.59 424
Golf Course Pond Total Flow-Weighted Average 0.192 14 Golf Course Pond Total 13,619,334 163 11,502
Como 7 Subwatershed Storm Flow-Weighted Average 0.210 33 Como 7 Subwatershed Storm Subtotal 15,242,041 200 31,780
Como 7 Subwatershed Illicit Discharge Flow-Weighted Average 0.188 88 Como 7 Subwatershed Illicit Discharge Subtotal 384,191 5 2,122
Como 7 Subwatershed Total Flow-Weighted Average 0.209 35 Como 7 Subwatershed Total 15,626,233 204 33,902
Note: Italics indicate estimated concentrations based on average storm flow concentrations. Average storm TP = 0.202 mg/L, TSS = 13 mg/L.
Capitol Region Watershed District 2010 Monitoring Report 103

Capitol Region Watershed District 2010 Monitoring Report 104
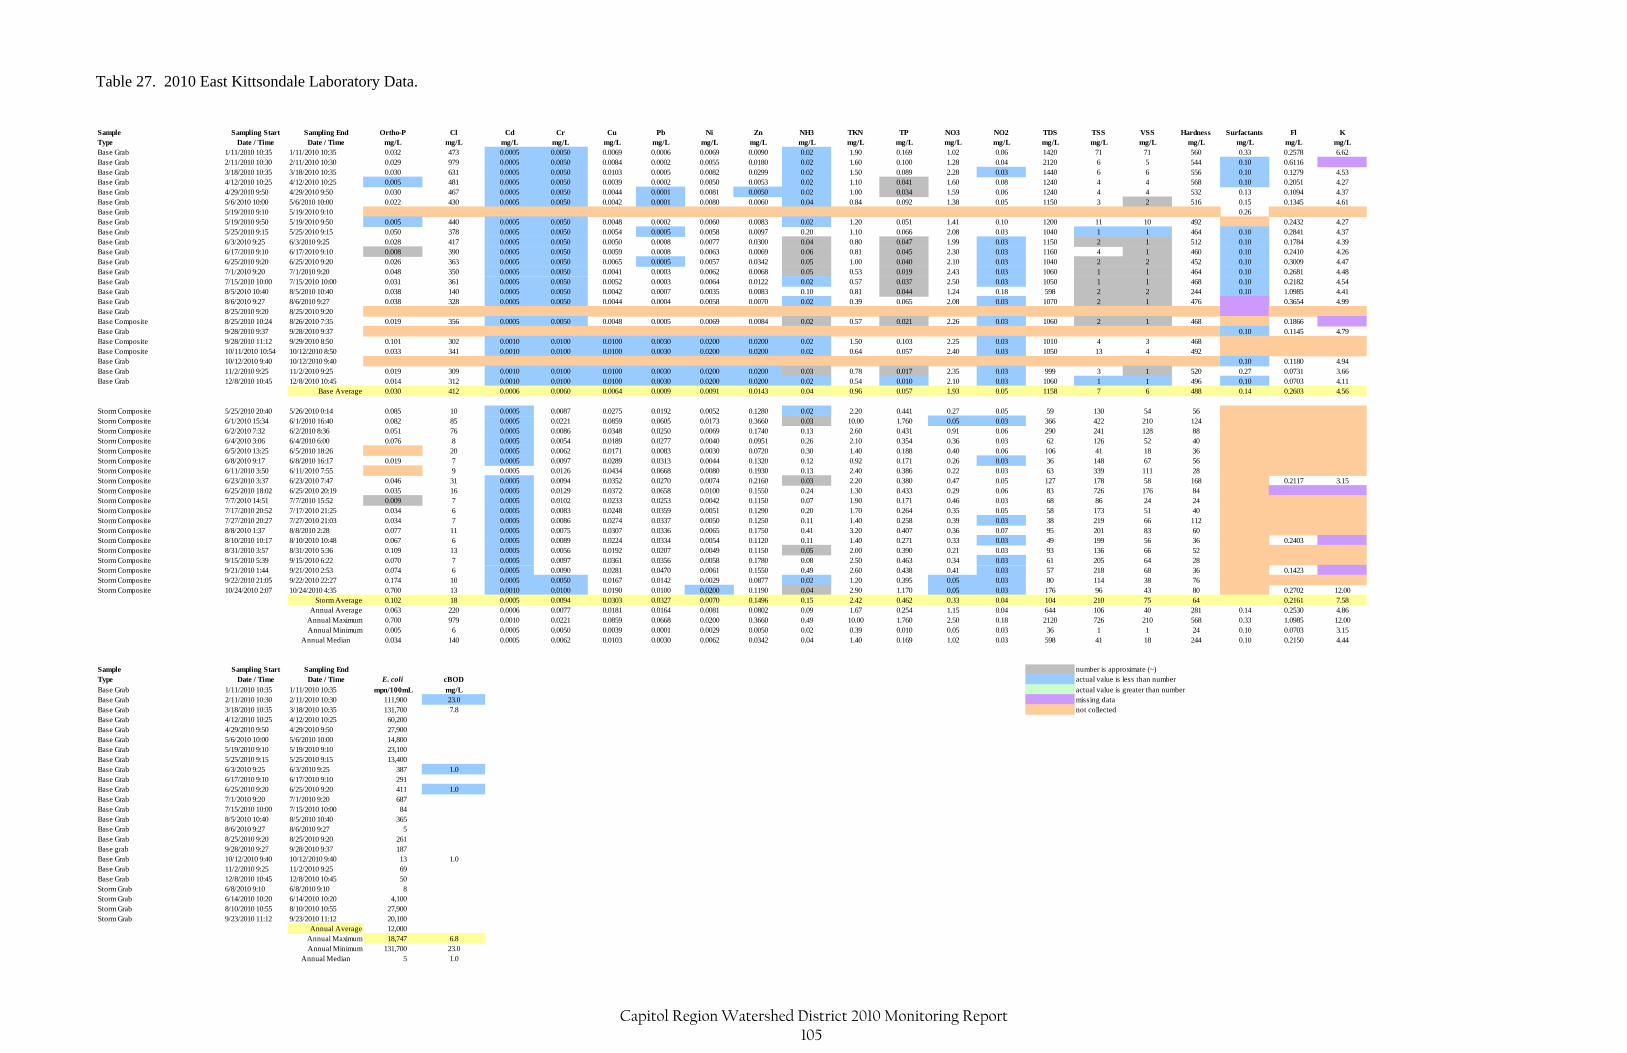
Table 27. 2010 East Kittsondale Laboratory Data. Sample Sampling Start Sampling End Ortho-P Cl Cd Cr Cu Pb Ni Zn NH3 TKN TP NO3 NO2 TDS TSS VSS Hardness Surfactants Fl KType Date / Time Date / Time mg/L mg/L mg/L mg/L mg/L mg/L mg/L mg/L mg/L mg/L mg/L mg/L mg/L mg/L mg/L mg/L mg/L mg/L mg/L mg/LBase Grab 1/11/2010 10:35 1/11/2010 10:35 0.032 473 0.0005 0.0050 0.0069 0.0006 0.0069 0.0090 0.02 1.90 0.169 1.02 0.06 1420 71 71 560 0.33 0.2578 6.62Base Grab 2/11/2010 10:30 2/11/2010 10:30 0.029 979 0.0005 0.0050 0.0084 0.0002 0.0055 0.0180 0.02 1.60 0.100 1.28 0.04 2120 6 5 544 0.10 0.6116Base Grab 3/18/2010 10:35 3/18/2010 10:35 0.030 631 0.0005 0.0050 0.0103 0.0005 0.0082 0.0299 0.02 1.50 0.089 2.28 0.03 1440 6 6 556 0.10 0.1279 4.53Base Grab 4/12/2010 10:25 4/12/2010 10:25 0.005 481 0.0005 0.0050 0.0039 0.0002 0.0050 0.0053 0.02 1.10 0.041 1.60 0.08 1240 4 4 568 0.10 0.2051 4.27Base Grab 4/29/2010 9:50 4/29/2010 9:50 0.030 467 0.0005 0.0050 0.0044 0.0001 0.0081 0.0050 0.02 1.00 0.034 1.59 0.06 1240 4 4 532 0.13 0.1094 4.37Base Grab 5/6/2010 10:00 5/6/2010 10:00 0.022 430 0.0005 0.0050 0.0042 0.0001 0.0080 0.0060 0.04 0.84 0.092 1.38 0.05 1150 3 2 516 0.15 0.1345 4.61Base Grab 5/19/2010 9:10 5/19/2010 9:10 0.26Base Grab 5/19/2010 9:50 5/19/2010 9:50 0.005 440 0.0005 0.0050 0.0048 0.0002 0.0060 0.0083 0.02 1.20 0.051 1.41 0.10 1200 11 10 492 0.2432 4.27Base Grab 5/25/2010 9:15 5/25/2010 9:15 0.050 378 0.0005 0.0050 0.0054 0.0005 0.0058 0.0097 0.20 1.10 0.066 2.08 0.03 1040 1 1 464 0.10 0.2841 4.37Base Grab 6/3/2010 9:25 6/3/2010 9:25 0.028 417 0.0005 0.0050 0.0050 0.0008 0.0077 0.0300 0.04 0.80 0.047 1.99 0.03 1150 2 1 512 0.10 0.1784 4.39Base Grab 6/17/2010 9:10 6/17/2010 9:10 0.008 390 0.0005 0.0050 0.0059 0.0008 0.0063 0.0069 0.06 0.81 0.045 2.30 0.03 1160 4 1 460 0.10 0.2410 4.26Base Grab 6/25/2010 9:20 6/25/2010 9:20 0.026 363 0.0005 0.0050 0.0065 0.0005 0.0057 0.0342 0.05 1.00 0.040 2.10 0.03 1040 2 2 452 0.10 0.3009 4.47Base Grab 7/1/2010 9:20 7/1/2010 9:20 0.048 350 0.0005 0.0050 0.0041 0.0003 0.0062 0.0068 0.05 0.53 0.019 2.43 0.03 1060 1 1 464 0.10 0.2681 4.48Base Grab 7/15/2010 10:00 7/15/2010 10:00 0.031 361 0.0005 0.0050 0.0052 0.0003 0.0064 0.0122 0.02 0.57 0.037 2.50 0.03 1050 1 1 468 0.10 0.2182 4.54Base Grab 8/5/2010 10:40 8/5/2010 10:40 0.038 140 0.0005 0.0050 0.0042 0.0007 0.0035 0.0083 0.10 0.81 0.044 1.24 0.18 598 2 2 244 0.10 1.0985 4.41Base Grab 8/6/2010 9:27 8/6/2010 9:27 0.038 328 0.0005 0.0050 0.0044 0.0004 0.0058 0.0070 0.02 0.39 0.065 2.08 0.03 1070 2 1 476 0.3654 4.99Base Grab 8/25/2010 9:20 8/25/2010 9:20Base Composite 8/25/2010 10:24 8/26/2010 7:35 0.019 356 0.0005 0.0050 0.0048 0.0005 0.0069 0.0084 0.02 0.57 0.021 2.26 0.03 1060 2 1 468 0.1866Base Grab 9/28/2010 9:37 9/28/2010 9:37 0.10 0.1145 4.79Base Composite 9/28/2010 11:12 9/29/2010 8:50 0.101 302 0.0010 0.0100 0.0100 0.0030 0.0200 0.0200 0.02 1.50 0.103 2.25 0.03 1010 4 3 468Base Composite 10/11/2010 10:54 10/12/2010 8:50 0.033 341 0.0010 0.0100 0.0100 0.0030 0.0200 0.0200 0.02 0.64 0.057 2.40 0.03 1050 13 4 492Base Grab 10/12/2010 9:40 10/12/2010 9:40 0.10 0.1180 4.94Base Grab 11/2/2010 9:25 11/2/2010 9:25 0.019 309 0.0010 0.0100 0.0100 0.0030 0.0200 0.0200 0.03 0.78 0.017 2.35 0.03 999 3 1 520 0.27 0.0731 3.66Base Grab 12/8/2010 10:45 12/8/2010 10:45 0.014 312 0.0010 0.0100 0.0100 0.0030 0.0200 0.0200 0.02 0.54 0.010 2.10 0.03 1060 1 1 496 0.10 0.0703 4.11
Base Average 0.030 412 0.0006 0.0060 0.0064 0.0009 0.0091 0.0143 0.04 0.96 0.057 1.93 0.05 1158 7 6 488 0.14 0.2603 4.56
Storm Composite 5/25/2010 20:40 5/26/2010 0:14 0.085 10 0.0005 0.0087 0.0275 0.0192 0.0052 0.1280 0.02 2.20 0.441 0.27 0.05 59 130 54 56Storm Composite 6/1/2010 15:34 6/1/2010 16:40 0.082 85 0.0005 0.0221 0.0859 0.0605 0.0173 0.3660 0.03 10.00 1.760 0.05 0.03 366 422 210 124Storm Composite 6/2/2010 7:32 6/2/2010 8:36 0.051 76 0.0005 0.0086 0.0348 0.0250 0.0069 0.1740 0.13 2.60 0.431 0.91 0.06 290 241 128 88Storm Composite 6/4/2010 3:06 6/4/2010 6:00 0.076 8 0.0005 0.0054 0.0189 0.0277 0.0040 0.0951 0.26 2.10 0.354 0.36 0.03 62 126 52 40Storm Composite 6/5/2010 13:25 6/5/2010 18:26 20 0.0005 0.0062 0.0171 0.0083 0.0030 0.0720 0.30 1.40 0.188 0.40 0.06 106 41 18 36Storm Composite 6/8/2010 9:17 6/8/2010 16:17 0.019 7 0.0005 0.0097 0.0289 0.0313 0.0044 0.1320 0.12 0.92 0.171 0.26 0.03 36 148 67 56Storm Composite 6/11/2010 3:50 6/11/2010 7:55 9 0.0005 0.0126 0.0434 0.0668 0.0080 0.1930 0.13 2.40 0.386 0.22 0.03 63 339 111 28Storm Composite 6/23/2010 3:37 6/23/2010 7:47 0.046 31 0.0005 0.0094 0.0352 0.0270 0.0074 0.2160 0.03 2.20 0.380 0.47 0.05 127 178 58 168 0.2117 3.15Storm Composite 6/25/2010 18:02 6/25/2010 20:19 0.035 16 0.0005 0.0129 0.0372 0.0658 0.0100 0.1550 0.24 1.30 0.433 0.29 0.06 83 726 176 84Storm Composite 7/7/2010 14:51 7/7/2010 15:52 0.009 7 0.0005 0.0102 0.0233 0.0253 0.0042 0.1150 0.07 1.90 0.171 0.46 0.03 68 86 24 24Storm Composite 7/17/2010 20:52 7/17/2010 21:25 0.034 6 0.0005 0.0083 0.0248 0.0359 0.0051 0.1290 0.20 1.70 0.264 0.35 0.05 58 173 51 40Storm Composite 7/27/2010 20:27 7/27/2010 21:03 0.034 7 0.0005 0.0086 0.0274 0.0337 0.0050 0.1250 0.11 1.40 0.258 0.39 0.03 38 219 66 112Storm Composite 8/8/2010 1:37 8/8/2010 2:28 0.077 11 0.0005 0.0075 0.0307 0.0336 0.0065 0.1750 0.41 3.20 0.407 0.36 0.07 95 201 83 60Storm Composite 8/10/2010 10:17 8/10/2010 10:48 0.067 6 0.0005 0.0089 0.0224 0.0334 0.0054 0.1120 0.11 1.40 0.271 0.33 0.03 49 199 56 36 0.2403Storm Composite 8/31/2010 3:57 8/31/2010 5:36 0.109 13 0.0005 0.0056 0.0192 0.0207 0.0049 0.1150 0.05 2.00 0.390 0.21 0.03 93 136 66 52Storm Composite 9/15/2010 5:39 9/15/2010 6:22 0.070 7 0.0005 0.0097 0.0361 0.0356 0.0058 0.1780 0.08 2.50 0.463 0.34 0.03 61 205 64 28Storm Composite 9/21/2010 1:44 9/21/2010 2:53 0.074 6 0.0005 0.0090 0.0281 0.0470 0.0061 0.1550 0.49 2.60 0.438 0.41 0.03 57 218 68 36 0.1423Storm Composite 9/22/2010 21:05 9/22/2010 22:27 0.174 10 0.0005 0.0050 0.0167 0.0142 0.0029 0.0877 0.02 1.20 0.395 0.05 0.03 80 114 38 76Storm Composite 10/24/2010 2:07 10/24/2010 4:35 0.700 13 0.0010 0.0100 0.0190 0.0100 0.0200 0.1190 0.04 2.90 1.170 0.05 0.03 176 96 43 80 0.2702 12.00
Storm Average 0.102 18 0.0005 0.0094 0.0303 0.0327 0.0070 0.1496 0.15 2.42 0.462 0.33 0.04 104 210 75 64 0.2161 7.58Annual Average 0.063 220 0.0006 0.0077 0.0181 0.0164 0.0081 0.0802 0.09 1.67 0.254 1.15 0.04 644 106 40 281 0.14 0.2530 4.86
Annual Maximum 0.700 979 0.0010 0.0221 0.0859 0.0668 0.0200 0.3660 0.49 10.00 1.760 2.50 0.18 2120 726 210 568 0.33 1.0985 12.00Annual Minimum 0.005 6 0.0005 0.0050 0.0039 0.0001 0.0029 0.0050 0.02 0.39 0.010 0.05 0.03 36 1 1 24 0.10 0.0703 3.15
Annual Median 0.034 140 0.0005 0.0062 0.0103 0.0030 0.0062 0.0342 0.04 1.40 0.169 1.02 0.03 598 41 18 244 0.10 0.2150 4.44
Sample Sampling Start Sampling End number is approximate (~)Type Date / Time Date / Time E. coli cBOD actual value is less than number
Base Grab 1/11/2010 10:35 1/11/2010 10:35 mpn/100mL mg/L actual value is greater than numberBase Grab 2/11/2010 10:30 2/11/2010 10:30 111,900 23.0 missing dataBase Grab 3/18/2010 10:35 3/18/2010 10:35 131,700 7.8 not collectedBase Grab 4/12/2010 10:25 4/12/2010 10:25 60,200Base Grab 4/29/2010 9:50 4/29/2010 9:50 27,900Base Grab 5/6/2010 10:00 5/6/2010 10:00 14,800Base Grab 5/19/2010 9:10 5/19/2010 9:10 23,100Base Grab 5/25/2010 9:15 5/25/2010 9:15 13,400Base Grab 6/3/2010 9:25 6/3/2010 9:25 387 1.0Base Grab 6/17/2010 9:10 6/17/2010 9:10 291Base Grab 6/25/2010 9:20 6/25/2010 9:20 411 1.0Base Grab 7/1/2010 9:20 7/1/2010 9:20 687Base Grab 7/15/2010 10:00 7/15/2010 10:00 84Base Grab 8/5/2010 10:40 8/5/2010 10:40 365Base Grab 8/6/2010 9:27 8/6/2010 9:27 5Base Grab 8/25/2010 9:20 8/25/2010 9:20 261Base grab 9/28/2010 9:27 9/28/2010 9:37 187Base Grab 10/12/2010 9:40 10/12/2010 9:40 13 1.0Base Grab 11/2/2010 9:25 11/2/2010 9:25 69Base Grab 12/8/2010 10:45 12/8/2010 10:45 50Storm Grab 6/8/2010 9:10 6/8/2010 9:10 8Storm Grab 6/14/2010 10:20 6/14/2010 10:20 4,100Storm Grab 8/10/2010 10:55 8/10/2010 10:55 27,900Storm Grab 9/23/2010 11:12 9/23/2010 11:12 20,100
Annual Average 12,000Annual Maximum 18,747 6.8Annual Minimum 131,700 23.0
Annual Median 5 1.0
Capitol Region Watershed District 2010 Monitoring Report 105

Capitol Region Watershed District 2010 Monitoring Report 106
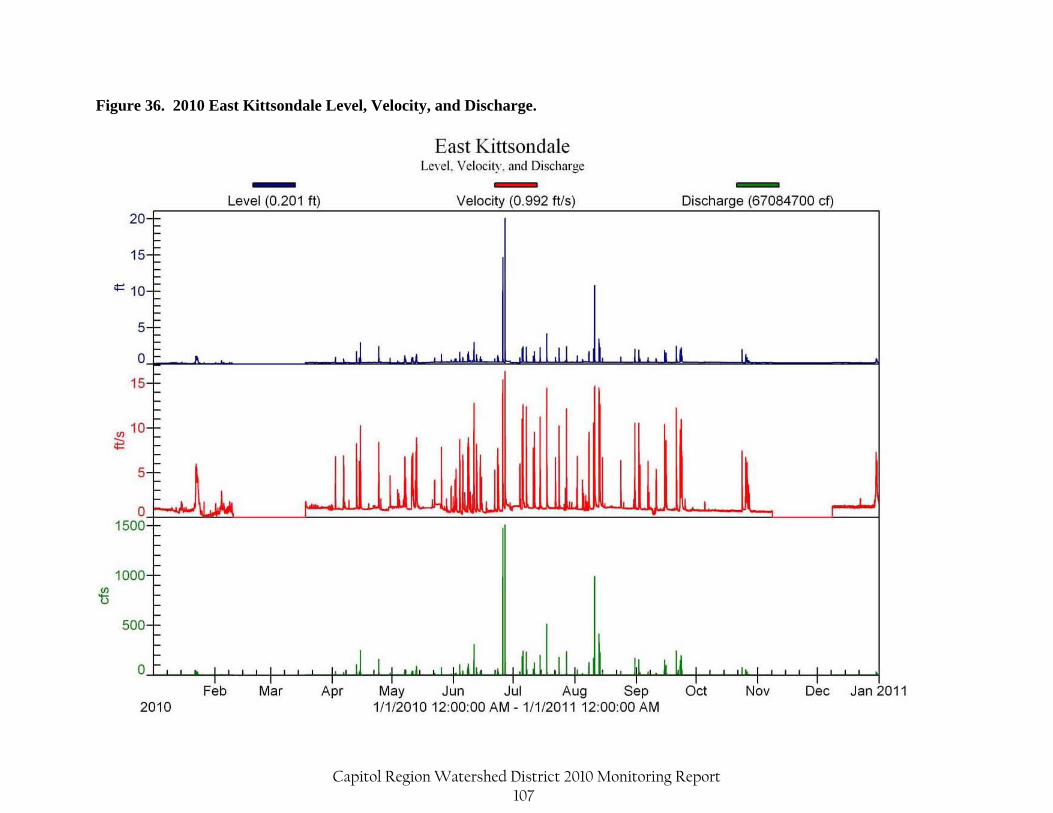
Figure 36. 2010 East Kittsondale Level, Velocity, and Discharge.
Capitol Region Watershed District 2010 Monitoring Report 107
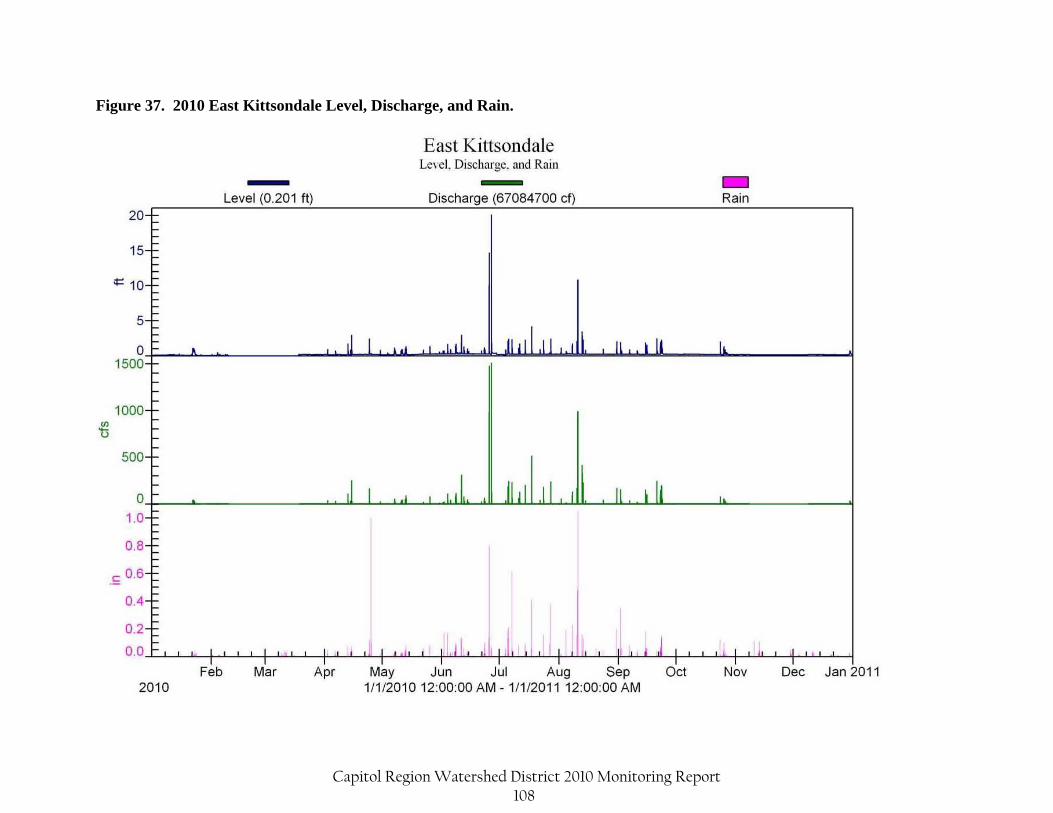
Figure 37. 2010 East Kittsondale Level, Discharge, and Rain.
Capitol Region Watershed District 2010 Monitoring Report 108
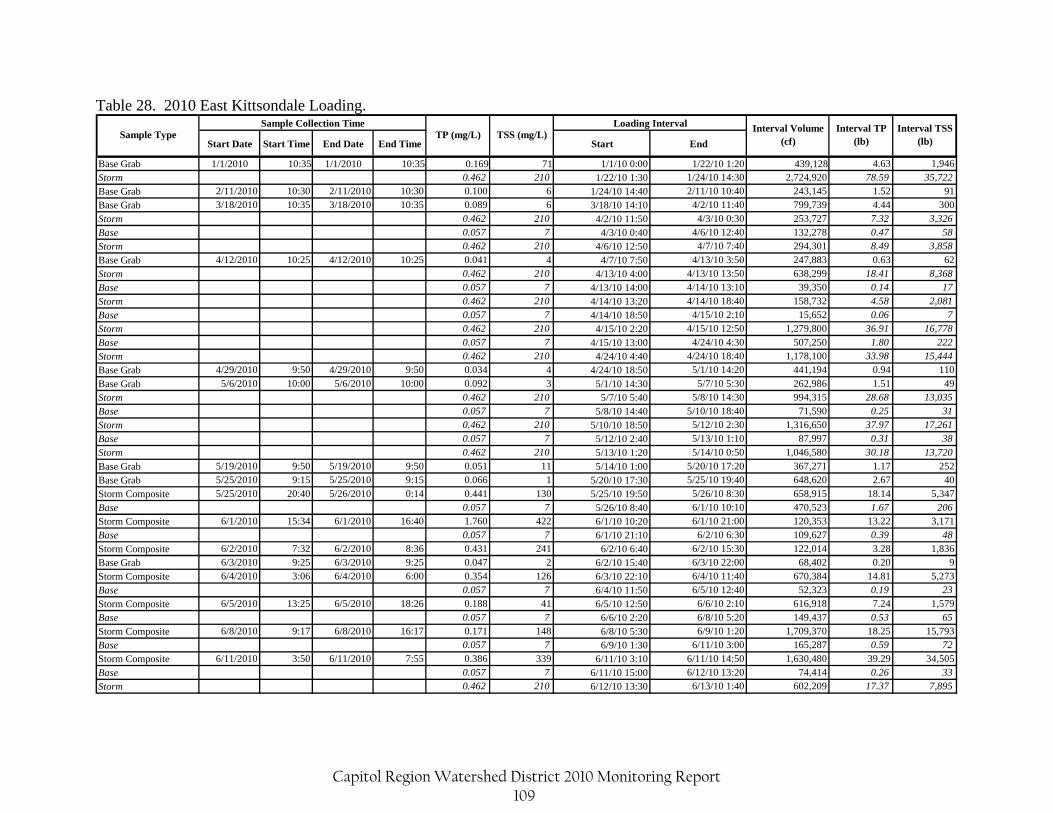
Table 28. 2010 East Kittsondale Loading.
Start Date Start Time End Date End Time Start End
Base Grab 1/1/2010 10:35 1/1/2010 10:35 0.169 71 1/1/10 0:00 1/22/10 1:20 439,128 4.63 1,946
Storm 0.462 210 1/22/10 1:30 1/24/10 14:30 2,724,920 78.59 35,722
Base Grab 2/11/2010 10:30 2/11/2010 10:30 0.100 6 1/24/10 14:40 2/11/10 10:40 243,145 1.52 91
Base Grab 3/18/2010 10:35 3/18/2010 10:35 0.089 6 3/18/10 14:10 4/2/10 11:40 799,739 4.44 300
Storm 0.462 210 4/2/10 11:50 4/3/10 0:30 253,727 7.32 3,326
Base 0.057 7 4/3/10 0:40 4/6/10 12:40 132,278 0.47 58
Storm 0.462 210 4/6/10 12:50 4/7/10 7:40 294,301 8.49 3,858
Base Grab 4/12/2010 10:25 4/12/2010 10:25 0.041 4 4/7/10 7:50 4/13/10 3:50 247,883 0.63 62
Storm 0.462 210 4/13/10 4:00 4/13/10 13:50 638,299 18.41 8,368
Base 0.057 7 4/13/10 14:00 4/14/10 13:10 39,350 0.14 17
Storm 0.462 210 4/14/10 13:20 4/14/10 18:40 158,732 4.58 2,081
Base 0.057 7 4/14/10 18:50 4/15/10 2:10 15,652 0.06 7
Storm 0.462 210 4/15/10 2:20 4/15/10 12:50 1,279,800 36.91 16,778
Base 0.057 7 4/15/10 13:00 4/24/10 4:30 507,250 1.80 222
Storm 0.462 210 4/24/10 4:40 4/24/10 18:40 1,178,100 33.98 15,444
Base Grab 4/29/2010 9:50 4/29/2010 9:50 0.034 4 4/24/10 18:50 5/1/10 14:20 441,194 0.94 110
Base Grab 5/6/2010 10:00 5/6/2010 10:00 0.092 3 5/1/10 14:30 5/7/10 5:30 262,986 1.51 49
Storm 0.462 210 5/7/10 5:40 5/8/10 14:30 994,315 28.68 13,035
Base 0.057 7 5/8/10 14:40 5/10/10 18:40 71,590 0.25 31
Storm 0.462 210 5/10/10 18:50 5/12/10 2:30 1,316,650 37.97 17,261
Base 0.057 7 5/12/10 2:40 5/13/10 1:10 87,997 0.31 38
Storm 0.462 210 5/13/10 1:20 5/14/10 0:50 1,046,580 30.18 13,720
Base Grab 5/19/2010 9:50 5/19/2010 9:50 0.051 11 5/14/10 1:00 5/20/10 17:20 367,271 1.17 252
Base Grab 5/25/2010 9:15 5/25/2010 9:15 0.066 1 5/20/10 17:30 5/25/10 19:40 648,620 2.67 40
Storm Composite 5/25/2010 20:40 5/26/2010 0:14 0.441 130 5/25/10 19:50 5/26/10 8:30 658,915 18.14 5,347
Base 0.057 7 5/26/10 8:40 6/1/10 10:10 470,523 1.67 206
Storm Composite 6/1/2010 15:34 6/1/2010 16:40 1.760 422 6/1/10 10:20 6/1/10 21:00 120,353 13.22 3,171
Base 0.057 7 6/1/10 21:10 6/2/10 6:30 109,627 0.39 48
Storm Composite 6/2/2010 7:32 6/2/2010 8:36 0.431 241 6/2/10 6:40 6/2/10 15:30 122,014 3.28 1,836
Base Grab 6/3/2010 9:25 6/3/2010 9:25 0.047 2 6/2/10 15:40 6/3/10 22:00 68,402 0.20 9
Storm Composite 6/4/2010 3:06 6/4/2010 6:00 0.354 126 6/3/10 22:10 6/4/10 11:40 670,384 14.81 5,273
Base 0.057 7 6/4/10 11:50 6/5/10 12:40 52,323 0.19 23
Storm Composite 6/5/2010 13:25 6/5/2010 18:26 0.188 41 6/5/10 12:50 6/6/10 2:10 616,918 7.24 1,579
Base 0.057 7 6/6/10 2:20 6/8/10 5:20 149,437 0.53 65
Storm Composite 6/8/2010 9:17 6/8/2010 16:17 0.171 148 6/8/10 5:30 6/9/10 1:20 1,709,370 18.25 15,793
Base 0.057 7 6/9/10 1:30 6/11/10 3:00 165,287 0.59 72
Storm Composite 6/11/2010 3:50 6/11/2010 7:55 0.386 339 6/11/10 3:10 6/11/10 14:50 1,630,480 39.29 34,505
Base 0.057 7 6/11/10 15:00 6/12/10 13:20 74,414 0.26 33
Storm 0.462 210 6/12/10 13:30 6/13/10 1:40 602,209 17.37 7,895
Sample Collection Time Loading IntervalSample Type
Interval Volume (cf)
Interval TP (lb)
Interval TSS (lb)
TP (mg/L) TSS (mg/L)
Capitol Region Watershed District 2010 Monitoring Report 109

Base 0.057 7 6/13/10 1:50 6/14/10 9:00 91,826 0.33 40
Storm 0.462 210 6/14/10 9:10 6/14/10 21:00 557,173 16.07 7,304
Base Grab 6/17/2010 9:10 6/17/2010 9:10 0.045 4 6/14/10 21:10 6/23/10 2:10 673,686 1.89 168
Storm Composite 6/23/2010 3:37 6/23/2010 7:47 0.380 178 6/23/10 2:20 6/23/10 10:30 498,889 11.83 5,544
Base 0.057 7 6/23/10 10:40 6/23/10 13:50 15,374 0.05 7
Storm 0.462 210 6/23/10 14:00 6/23/10 21:10 153,117 4.42 2,007
Base Grab 6/25/2010 9:20 6/25/2010 9:20 0.040 2 6/23/10 21:20 6/25/10 17:30 127,345 0.32 16
Storm Composite 6/25/2010 18:02 6/25/2010 20:19 0.433 726 6/25/10 17:40 6/25/10 22:30 4,070,290 110.02 184,471
Base 0.057 7 6/25/10 22:40 6/26/10 20:40 115,021 0.41 50
Storm 0.462 210 6/26/10 20:50 6/27/10 2:20 3,468,620 100.04 45,472
Base Grab 7/1/2010 9:20 7/1/2010 9:20 0.019 1 6/27/10 2:30 7/4/10 7:20 803,073 0.95 50
Storm 0.462 210 7/4/10 7:30 7/4/10 15:10 166,705 4.81 2,185
Base 0.057 7 7/4/10 15:20 7/5/10 12:10 60,389 0.21 26
Storm 0.462 210 7/5/10 12:20 7/6/10 5:20 1,906,980 55.00 25,000
Base 0.057 7 7/6/10 5:30 7/7/10 14:00 121,601 0.43 53
Storm Composite 7/7/2010 14:51 7/7/2010 15:52 0.171 86 7/7/10 14:10 7/7/10 21:40 819,685 8.75 4,401
Base 0.057 7 7/7/10 21:50 7/11/10 1:30 239,866 0.85 105
Storm 0.462 210 7/11/10 1:40 7/11/10 7:50 245,814 7.09 3,222
Base 0.057 7 7/11/10 8:00 7/11/10 16:10 29,504 0.10 13
Storm 0.462 210 7/11/10 16:20 7/11/10 22:00 585,714 16.89 7,678
Base 0.057 7 7/11/10 22:10 7/14/10 13:10 215,651 0.77 94
Storm 0.462 210 7/14/10 13:20 7/14/10 18:30 494,677 14.27 6,485
Base Grab 7/15/2010 10:00 7/15/2010 10:00 0.037 1 7/14/10 18:40 7/17/10 20:10 218,891 0.51 14
Storm Composite 7/17/2010 20:52 7/17/2010 21:25 0.264 173 7/17/10 20:20 7/18/10 1:30 1,562,570 25.75 16,875
Base 0.057 7 7/18/10 1:40 7/22/10 3:00 352,603 1.25 154
Storm 0.462 210 7/22/10 3:10 7/22/10 16:40 407,922 11.76 5,348
Base 0.057 7 7/22/10 16:50 7/24/10 0:40 94,132 0.33 41
Storm 0.462 210 7/24/10 0:50 7/24/10 7:50 760,941 21.95 9,976
Base 0.057 7 7/24/10 8:00 7/27/10 20:00 274,052 0.98 120
Storm Composite 7/27/2010 20:27 7/27/2010 21:03 0.258 219 7/27/10 20:10 7/28/10 2:10 648,103 10.44 8,860
Base 0.057 7 7/28/10 2:20 8/2/10 4:00 372,548 1.33 163
Storm 0.462 210 8/2/10 4:10 8/2/10 12:30 208,596 6.02 2,735
Base Grab 8/5/2010 10:40 8/5/2010 10:40 0.044 2 8/2/10 12:40 8/5/10 17:40 303,253 0.83 38
Base Grab 8/6/2010 9:27 8/6/2010 9:27 0.065 2 8/5/10 17:50 8/8/10 0:50 196,927 0.80 25
Storm Composite 8/8/2010 1:37 8/8/2010 2:28 0.407 201 8/8/10 1:00 8/8/10 8:50 563,797 14.32 7,074
Base 0.057 7 8/8/10 9:00 9/10/10 9:40 146,183 0.52 64
Storm Composite 8/10/2010 10:17 8/10/2010 10:48 0.271 199 8/10/10 9:50 8/10/10 13:50 624,946 10.57 7,764
Base 0.057 7 8/10/10 14:00 8/10/10 20:50 49,507 0.18 22
Storm 0.462 210 8/10/10 21:00 8/11/10 2:50 2,860,000 82.48 37,493
Base 0.057 7 8/11/10 3:00 8/13/10 2:20 243,884 0.87 107
Storm 0.462 210 8/13/10 2:30 8/13/10 8:30 1,845,290 53.22 24,191
Base 0.057 7 8/13/10 8:40 8/13/10 15:50 83,171 0.30 36
Capitol Region Watershed District 2010 Monitoring Report 110
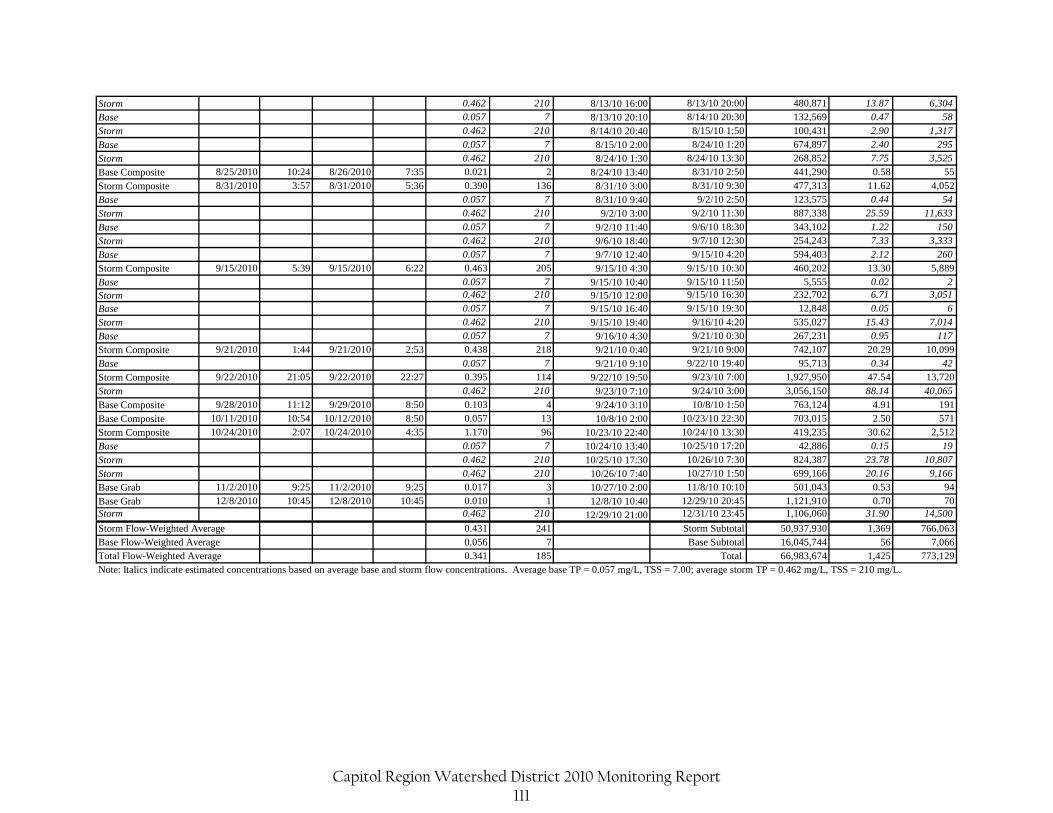
Storm 0.462 210 8/13/10 16:00 8/13/10 20:00 480,871 13.87 6,304
Base 0.057 7 8/13/10 20:10 8/14/10 20:30 132,569 0.47 58
Storm 0.462 210 8/14/10 20:40 8/15/10 1:50 100,431 2.90 1,317
Base 0.057 7 8/15/10 2:00 8/24/10 1:20 674,897 2.40 295
Storm 0.462 210 8/24/10 1:30 8/24/10 13:30 268,852 7.75 3,525
Base Composite 8/25/2010 10:24 8/26/2010 7:35 0.021 2 8/24/10 13:40 8/31/10 2:50 441,290 0.58 55
Storm Composite 8/31/2010 3:57 8/31/2010 5:36 0.390 136 8/31/10 3:00 8/31/10 9:30 477,313 11.62 4,052
Base 0.057 7 8/31/10 9:40 9/2/10 2:50 123,575 0.44 54
Storm 0.462 210 9/2/10 3:00 9/2/10 11:30 887,338 25.59 11,633
Base 0.057 7 9/2/10 11:40 9/6/10 18:30 343,102 1.22 150
Storm 0.462 210 9/6/10 18:40 9/7/10 12:30 254,243 7.33 3,333
Base 0.057 7 9/7/10 12:40 9/15/10 4:20 594,403 2.12 260
Storm Composite 9/15/2010 5:39 9/15/2010 6:22 0.463 205 9/15/10 4:30 9/15/10 10:30 460,202 13.30 5,889
Base 0.057 7 9/15/10 10:40 9/15/10 11:50 5,555 0.02 2Storm 0.462 210 9/15/10 12:00 9/15/10 16:30 232,702 6.71 3,051
Base 0.057 7 9/15/10 16:40 9/15/10 19:30 12,848 0.05 6
Storm 0.462 210 9/15/10 19:40 9/16/10 4:20 535,027 15.43 7,014
Base 0.057 7 9/16/10 4:30 9/21/10 0:30 267,231 0.95 117
Storm Composite 9/21/2010 1:44 9/21/2010 2:53 0.438 218 9/21/10 0:40 9/21/10 9:00 742,107 20.29 10,099
Base 0.057 7 9/21/10 9:10 9/22/10 19:40 95,713 0.34 42
Storm Composite 9/22/2010 21:05 9/22/2010 22:27 0.395 114 9/22/10 19:50 9/23/10 7:00 1,927,950 47.54 13,720
Storm 0.462 210 9/23/10 7:10 9/24/10 3:00 3,056,150 88.14 40,065
Base Composite 9/28/2010 11:12 9/29/2010 8:50 0.103 4 9/24/10 3:10 10/8/10 1:50 763,124 4.91 191
Base Composite 10/11/2010 10:54 10/12/2010 8:50 0.057 13 10/8/10 2:00 10/23/10 22:30 703,015 2.50 571
Storm Composite 10/24/2010 2:07 10/24/2010 4:35 1.170 96 10/23/10 22:40 10/24/10 13:30 419,235 30.62 2,512
Base 0.057 7 10/24/10 13:40 10/25/10 17:20 42,886 0.15 19
Storm 0.462 210 10/25/10 17:30 10/26/10 7:30 824,387 23.78 10,807
Storm 0.462 210 10/26/10 7:40 10/27/10 1:50 699,166 20.16 9,166
Base Grab 11/2/2010 9:25 11/2/2010 9:25 0.017 3 10/27/10 2:00 11/8/10 10:10 501,043 0.53 94
Base Grab 12/8/2010 10:45 12/8/2010 10:45 0.010 1 12/8/10 10:40 12/29/10 20:45 1,121,910 0.70 70Storm 0.462 210 12/29/10 21:00 12/31/10 23:45 1,106,060 31.90 14,500
0.431 241 Storm Subtotal 50,937,930 1,369 766,0630.056 7 Base Subtotal 16,045,744 56 7,0660.341 185 Total 66,983,674 1,425 773,129
Note: Italics indicate estimated concentrations based on average base and storm flow concentrations. Average base TP = 0.057 mg/L, TSS = 7.00; average storm TP = 0.462 mg/L, TSS = 210 mg/L.Total Flow-Weighted Average
Storm Flow-Weighted AverageBase Flow-Weighted Average
Capitol Region Watershed District 2010 Monitoring Report 111
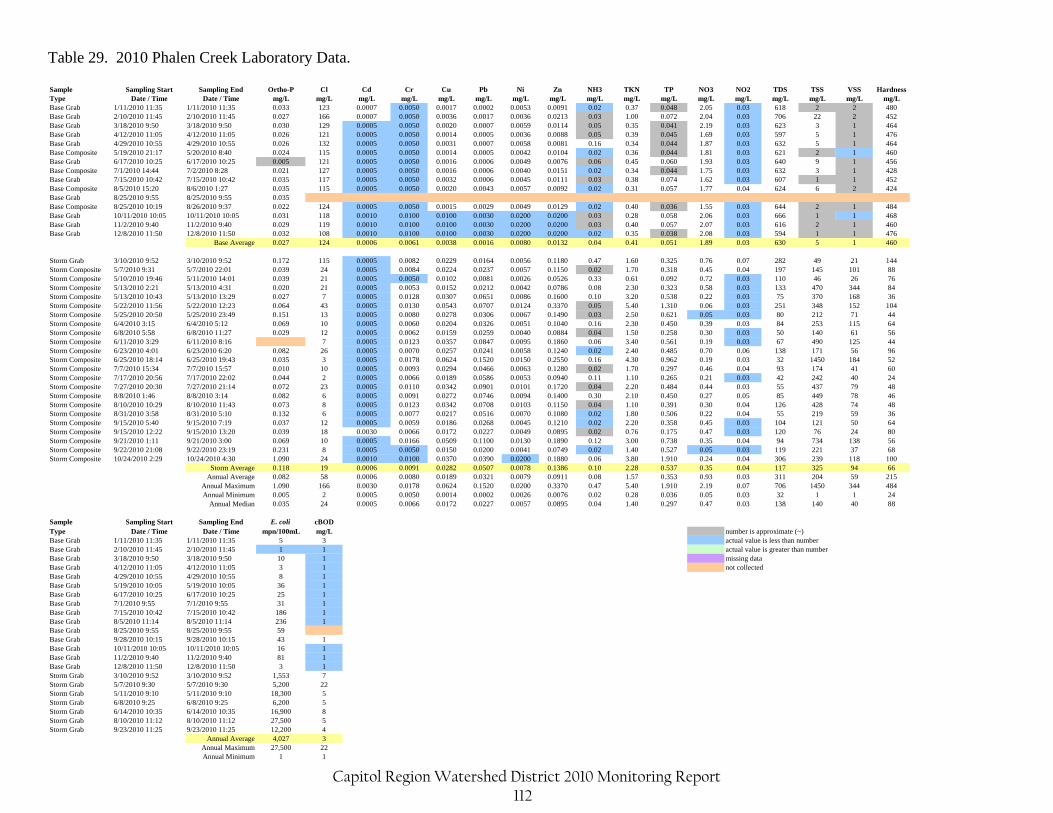
Table 29. 2010 Phalen Creek Laboratory Data. Sample Sampling Start Sampling End Ortho-P Cl Cd Cr Cu Pb Ni Zn NH3 TKN TP NO3 NO2 TDS TSS VSS HardnessType Date / Time Date / Time mg/L mg/L mg/L mg/L mg/L mg/L mg/L mg/L mg/L mg/L mg/L mg/L mg/L mg/L mg/L mg/L mg/LBase Grab 1/11/2010 11:35 1/11/2010 11:35 0.033 123 0.0007 0.0050 0.0017 0.0002 0.0053 0.0091 0.02 0.37 0.048 2.05 0.03 618 2 2 480Base Grab 2/10/2010 11:45 2/10/2010 11:45 0.027 166 0.0007 0.0050 0.0036 0.0017 0.0036 0.0213 0.03 1.00 0.072 2.04 0.03 706 22 2 452Base Grab 3/18/2010 9:50 3/18/2010 9:50 0.030 129 0.0005 0.0050 0.0020 0.0007 0.0059 0.0114 0.05 0.35 0.041 2.19 0.03 623 3 1 464Base Grab 4/12/2010 11:05 4/12/2010 11:05 0.026 121 0.0005 0.0050 0.0014 0.0005 0.0036 0.0088 0.05 0.39 0.045 1.69 0.03 597 5 1 476Base Grab 4/29/2010 10:55 4/29/2010 10:55 0.026 132 0.0005 0.0050 0.0031 0.0007 0.0058 0.0081 0.16 0.34 0.044 1.87 0.03 632 5 1 464Base Composite 5/19/2010 21:17 5/20/2010 8:40 0.024 115 0.0005 0.0050 0.0014 0.0005 0.0042 0.0104 0.02 0.36 0.044 1.81 0.03 621 2 1 460Base Grab 6/17/2010 10:25 6/17/2010 10:25 0.005 121 0.0005 0.0050 0.0016 0.0006 0.0049 0.0076 0.06 0.45 0.060 1.93 0.03 640 9 1 456Base Composite 7/1/2010 14:44 7/2/2010 8:28 0.021 127 0.0005 0.0050 0.0016 0.0006 0.0040 0.0151 0.02 0.34 0.044 1.75 0.03 632 3 1 428Base Grab 7/15/2010 10:42 7/15/2010 10:42 0.035 117 0.0005 0.0050 0.0032 0.0006 0.0045 0.0111 0.03 0.38 0.074 1.62 0.03 607 1 1 452Base Composite 8/5/2010 15:20 8/6/2010 1:27 0.035 115 0.0005 0.0050 0.0020 0.0043 0.0057 0.0092 0.02 0.31 0.057 1.77 0.04 624 6 2 424Base Grab 8/25/2010 9:55 8/25/2010 9:55 0.035Base Composite 8/25/2010 10:19 8/26/2010 9:37 0.022 124 0.0005 0.0050 0.0015 0.0029 0.0049 0.0129 0.02 0.40 0.036 1.55 0.03 644 2 1 484Base Grab 10/11/2010 10:05 10/11/2010 10:05 0.031 118 0.0010 0.0100 0.0100 0.0030 0.0200 0.0200 0.03 0.28 0.058 2.06 0.03 666 1 1 468Base Grab 11/2/2010 9:40 11/2/2010 9:40 0.029 119 0.0010 0.0100 0.0100 0.0030 0.0200 0.0200 0.03 0.40 0.057 2.07 0.03 616 2 1 460Base Grab 12/8/2010 11:50 12/8/2010 11:50 0.032 108 0.0010 0.0100 0.0100 0.0030 0.0200 0.0200 0.02 0.35 0.038 2.08 0.03 594 1 1 476
Base Average 0.027 124 0.0006 0.0061 0.0038 0.0016 0.0080 0.0132 0.04 0.41 0.051 1.89 0.03 630 5 1 460
Storm Grab 3/10/2010 9:52 3/10/2010 9:52 0.172 115 0.0005 0.0082 0.0229 0.0164 0.0056 0.1180 0.47 1.60 0.325 0.76 0.07 282 49 21 144Storm Composite 5/7/2010 9:31 5/7/2010 22:01 0.039 24 0.0005 0.0084 0.0224 0.0237 0.0057 0.1150 0.02 1.70 0.318 0.45 0.04 197 145 101 88Storm Composite 5/10/2010 19:46 5/11/2010 14:01 0.039 21 0.0005 0.0050 0.0102 0.0081 0.0026 0.0526 0.33 0.61 0.092 0.72 0.03 110 46 26 76Storm Composite 5/13/2010 2:21 5/13/2010 4:31 0.020 21 0.0005 0.0053 0.0152 0.0212 0.0042 0.0786 0.08 2.30 0.323 0.58 0.03 133 470 344 84Storm Composite 5/13/2010 10:43 5/13/2010 13:29 0.027 7 0.0005 0.0128 0.0307 0.0651 0.0086 0.1600 0.10 3.20 0.538 0.22 0.03 75 370 168 36Storm Composite 5/22/2010 11:56 5/22/2010 12:23 0.064 43 0.0005 0.0130 0.0543 0.0707 0.0124 0.3370 0.05 5.40 1.310 0.06 0.03 251 348 152 104Storm Composite 5/25/2010 20:50 5/25/2010 23:49 0.151 13 0.0005 0.0080 0.0278 0.0306 0.0067 0.1490 0.03 2.50 0.621 0.05 0.03 80 212 71 44Storm Composite 6/4/2010 3:15 6/4/2010 5:12 0.069 10 0.0005 0.0060 0.0204 0.0326 0.0051 0.1040 0.16 2.30 0.450 0.39 0.03 84 253 115 64Storm Composite 6/8/2010 5:58 6/8/2010 11:27 0.029 12 0.0005 0.0062 0.0159 0.0259 0.0040 0.0884 0.04 1.50 0.258 0.30 0.03 50 140 61 56Storm Composite 6/11/2010 3:29 6/11/2010 8:16 7 0.0005 0.0123 0.0357 0.0847 0.0095 0.1860 0.06 3.40 0.561 0.19 0.03 67 490 125 44Storm Composite 6/23/2010 4:01 6/23/2010 6:20 0.082 26 0.0005 0.0070 0.0257 0.0241 0.0058 0.1240 0.02 2.40 0.485 0.70 0.06 138 171 56 96Storm Composite 6/25/2010 18:14 6/25/2010 19:43 0.035 3 0.0005 0.0178 0.0624 0.1520 0.0150 0.2550 0.16 4.30 0.962 0.19 0.03 32 1450 184 52Storm Composite 7/7/2010 15:34 7/7/2010 15:57 0.010 10 0.0005 0.0093 0.0294 0.0466 0.0063 0.1280 0.02 1.70 0.297 0.46 0.04 93 174 41 60Storm Composite 7/17/2010 20:56 7/17/2010 22:02 0.044 2 0.0005 0.0066 0.0189 0.0586 0.0053 0.0940 0.11 1.10 0.265 0.21 0.03 42 242 40 24Storm Composite 7/27/2010 20:30 7/27/2010 21:14 0.072 23 0.0005 0.0110 0.0342 0.0901 0.0101 0.1720 0.04 2.20 0.484 0.44 0.03 55 437 79 48Storm Composite 8/8/2010 1:46 8/8/2010 3:14 0.082 6 0.0005 0.0091 0.0272 0.0746 0.0094 0.1400 0.30 2.10 0.450 0.27 0.05 85 449 78 46Storm Composite 8/10/2010 10:29 8/10/2010 11:43 0.073 8 0.0005 0.0123 0.0342 0.0708 0.0103 0.1150 0.04 1.10 0.391 0.30 0.04 126 428 74 48Storm Composite 8/31/2010 3:58 8/31/2010 5:10 0.132 6 0.0005 0.0077 0.0217 0.0516 0.0070 0.1080 0.02 1.80 0.506 0.22 0.04 55 219 59 36Storm Composite 9/15/2010 5:40 9/15/2010 7:19 0.037 12 0.0005 0.0059 0.0186 0.0268 0.0045 0.1210 0.02 2.20 0.358 0.45 0.03 104 121 50 64Storm Composite 9/15/2010 12:22 9/15/2010 13:20 0.039 18 0.0030 0.0066 0.0172 0.0227 0.0049 0.0895 0.02 0.76 0.175 0.47 0.03 120 76 24 80Storm Composite 9/21/2010 1:11 9/21/2010 3:00 0.069 10 0.0005 0.0166 0.0509 0.1100 0.0130 0.1890 0.12 3.00 0.738 0.35 0.04 94 734 138 56Storm Composite 9/22/2010 21:08 9/22/2010 23:19 0.231 8 0.0005 0.0050 0.0150 0.0200 0.0041 0.0749 0.02 1.40 0.527 0.05 0.03 119 221 37 68Storm Composite 10/24/2010 2:29 10/24/2010 4:30 1.090 24 0.0010 0.0100 0.0370 0.0390 0.0200 0.1880 0.06 3.80 1.910 0.24 0.04 306 239 118 100
Storm Average 0.118 19 0.0006 0.0091 0.0282 0.0507 0.0078 0.1386 0.10 2.28 0.537 0.35 0.04 117 325 94 66Annual Average 0.082 58 0.0006 0.0080 0.0189 0.0321 0.0079 0.0911 0.08 1.57 0.353 0.93 0.03 311 204 59 215
Annual Maximum 1.090 166 0.0030 0.0178 0.0624 0.1520 0.0200 0.3370 0.47 5.40 1.910 2.19 0.07 706 1450 344 484Annual Minimum 0.005 2 0.0005 0.0050 0.0014 0.0002 0.0026 0.0076 0.02 0.28 0.036 0.05 0.03 32 1 1 24
Annual Median 0.035 24 0.0005 0.0066 0.0172 0.0227 0.0057 0.0895 0.04 1.40 0.297 0.47 0.03 138 140 40 88
Sample Sampling Start Sampling End E. coli cBODType Date / Time Date / Time mpn/100mL mg/L number is approximate (~)Base Grab 1/11/2010 11:35 1/11/2010 11:35 5 3 actual value is less than numberBase Grab 2/10/2010 11:45 2/10/2010 11:45 1 1 actual value is greater than numberBase Grab 3/18/2010 9:50 3/18/2010 9:50 10 1 missing dataBase Grab 4/12/2010 11:05 4/12/2010 11:05 3 1 not collectedBase Grab 4/29/2010 10:55 4/29/2010 10:55 8 1Base Grab 5/19/2010 10:05 5/19/2010 10:05 36 1Base Grab 6/17/2010 10:25 6/17/2010 10:25 25 1Base Grab 7/1/2010 9:55 7/1/2010 9:55 31 1Base Grab 7/15/2010 10:42 7/15/2010 10:42 186 1Base Grab 8/5/2010 11:14 8/5/2010 11:14 236 1Base Grab 8/25/2010 9:55 8/25/2010 9:55 59Base Grab 9/28/2010 10:15 9/28/2010 10:15 43 1Base Grab 10/11/2010 10:05 10/11/2010 10:05 16 1Base Grab 11/2/2010 9:40 11/2/2010 9:40 81 1Base Grab 12/8/2010 11:50 12/8/2010 11:50 3 1Storm Grab 3/10/2010 9:52 3/10/2010 9:52 1,553 7Storm Grab 5/7/2010 9:30 5/7/2010 9:30 5,200 22Storm Grab 5/11/2010 9:10 5/11/2010 9:10 18,300 5Storm Grab 6/8/2010 9:25 6/8/2010 9:25 6,200 5Storm Grab 6/14/2010 10:35 6/14/2010 10:35 16,900 8Storm Grab 8/10/2010 11:12 8/10/2010 11:12 27,500 5Storm Grab 9/23/2010 11:25 9/23/2010 11:25 12,200 4
Annual Average 4,027 3Annual Maximum 27,500 22Annual Minimum 1 1
Capitol Region Watershed District 2010 Monitoring Report 112
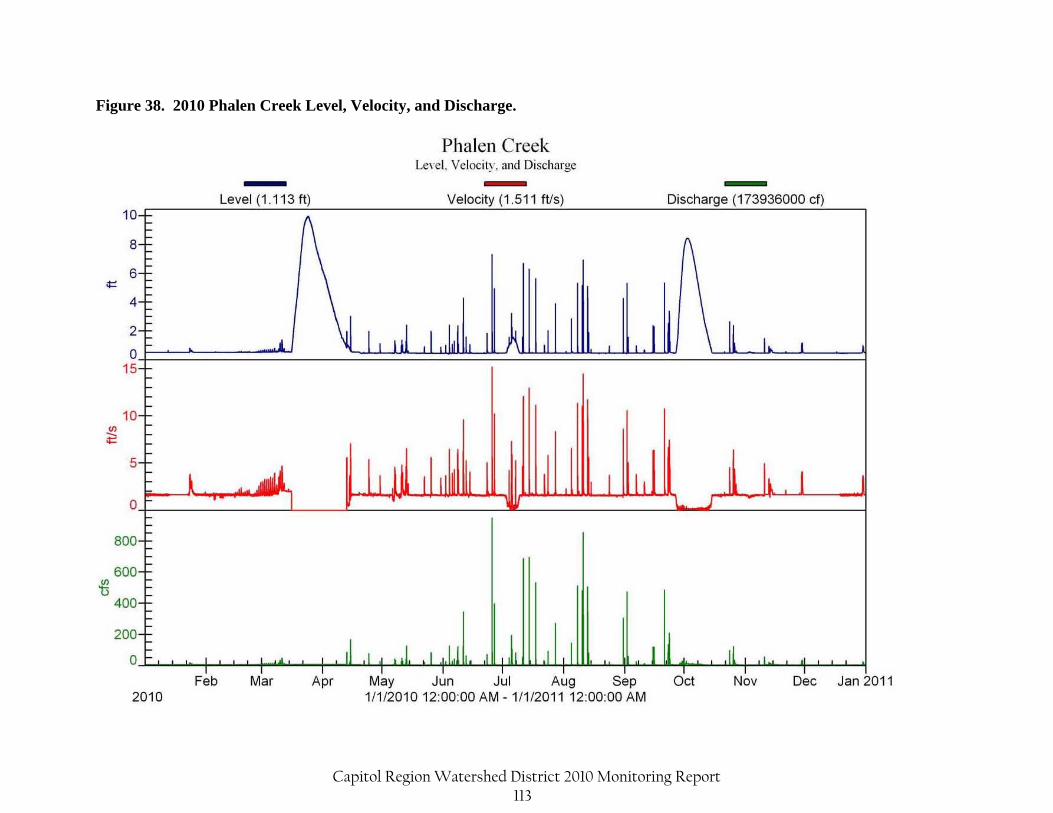
Figure 38. 2010 Phalen Creek Level, Velocity, and Discharge.
Capitol Region Watershed District 2010 Monitoring Report 113
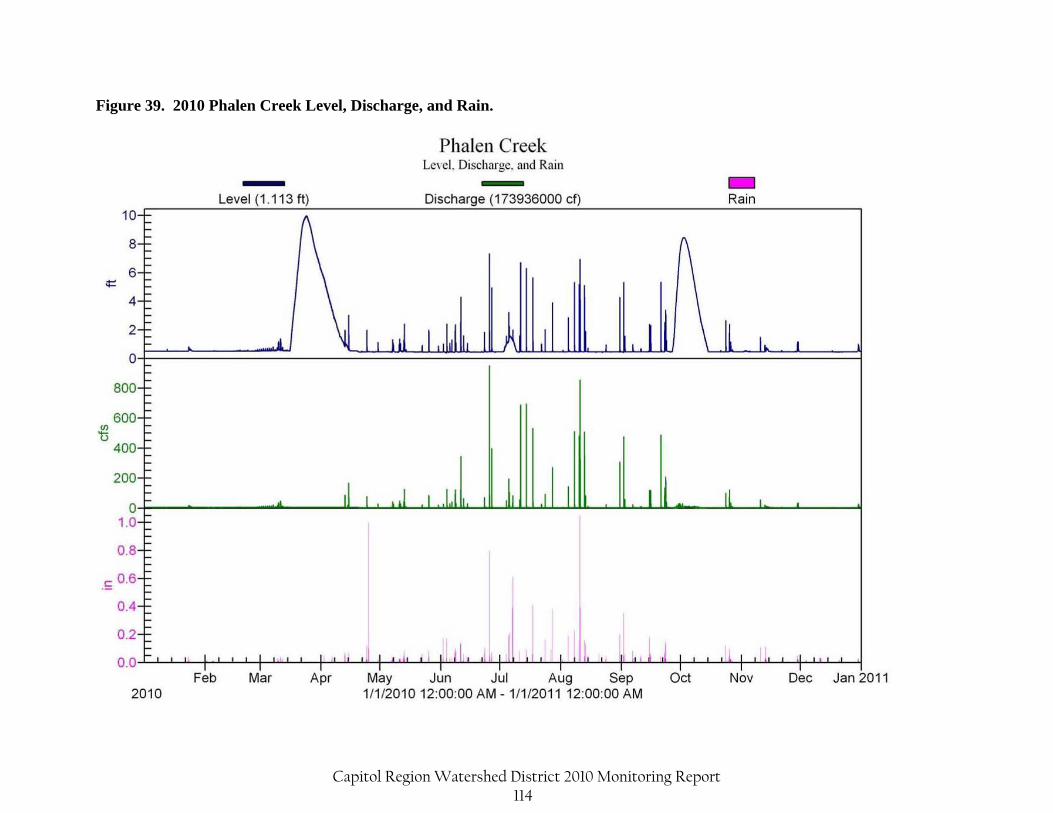
Figure 39. 2010 Phalen Creek Level, Discharge, and Rain.
Capitol Region Watershed District 2010 Monitoring Report 114

Table 30. 2010 Phalen Creek Loading.
Start Date Start Time End Date End Time Start End
Base Grab 1/11/2010 11:35 1/11/2010 11:35 0.048 2 1/1/10 0:00 2/5/10 15:20 13,951,700 41.81 1,742
Base Grab 2/10/2010 11:45 2/10/2010 11:45 0.072 22 2/5/10 15:30 3/10/10 3:20 14,446,900 64.93 19,841
Storm Grab 3/10/2010 9:52 3/10/2010 9:52 0.325 49 3/10/10 3:30 3/11/10 23:20 1,813,020 36.78 5,546
Base Grab 3/18/2010 9:50 3/18/2010 9:50 0.041 3 3/11/10 23:30 3/27/10 12:00 7,806,980 19.98 1,462
Base Grab 4/12/2010 11:05 4/12/2010 11:05 0.045 5 3/27/10 12:10 4/13/10 4:20 7,954,620 22.35 2,483
Storm 0.537 325 4/13/10 4:30 4/13/10 8:40 452,098 15.16 9,172
Base 0.051 5 4/13/10 8:50 4/14/10 13:30 393,133 1.25 112
Storm 0.537 325 4/14/10 13:40 4/14/10 16:40 119,613 4.01 2,427
Base 0.051 5 4/14/10 16:50 4/15/10 2:00 165,175 0.53 47
Storm 0.537 325 4/15/10 2:10 4/15/10 7:10 809,688 27.14 16,427
Base 0.051 5 4/15/10 7:20 4/24/10 7:30 3,238,820 10.31 924
Storm 0.537 325 4/24/10 7:40 4/24/10 16:30 697,054 23.37 14,142
Base Grab 4/29/2010 10:55 4/29/2010 10:55 0.044 5 4/24/10 16:40 4/30/10 1:20 1,732,550 4.76 541
Storm 0.537 325 4/30/10 1:30 4/30/10 10:50 208,673 7.00 4,234
Base 0.051 5 4/30/10 11:00 5/7/10 5:30 2,067,590 6.58 590
Storm Composite 5/7/2010 9:31 5/7/2010 22:01 0.381 145 5/7/10 5:40 5/8/10 2:30 919,516 21.87 8,323
Base 0.051 5 5/8/10 2:40 5/10/10 18:10 832,096 2.65 237
Storm Composite 5/10/2010 19:46 5/11/2010 14:01 0.092 46 5/10/10 18:20 5/11/10 20:30 1,265,990 7.27 3,635
Base 0.051 5 5/11/10 20:40 5/13/10 0:10 407,924 1.30 116
Storm Composite 5/13/2010 2:21 5/13/2010 4:31 0.323 470 5/13/10 0:20 5/13/10 9:50 429,765 8.67 12,609
Storm Composite 5/13/2010 10:43 5/13/2010 13:29 0.538 370 5/13/10 10:00 5/13/10 16:20 783,255 26.31 18,091
Base Composite 5/19/2010 21:17 5/20/2010 8:40 0.044 2 5/13/10 16:30 5/22/10 11:00 2,763,970 7.59 345
Storm Composite 5/22/2010 11:56 5/22/2010 12:23 1.310 348 5/22/10 11:10 5/22/10 20:10 221,872 18.14 4,820
Base 0.051 5 5/22/10 20:20 5/25/10 19:50 883,999 2.81 252
Storm Composite 5/25/2010 20:50 5/25/2010 23:49 0.621 212 5/25/10 20:00 5/26/10 6:30 711,079 27.57 9,411
Base 0.051 5 5/26/10 6:30 6/2/10 0:20 2,102,430 6.69 600
Storm 0.537 325 6/2/10 0:30 6/2/10 12:20 237,869 7.97 4,826
Base 0.051 5 6/2/10 12:30 6/3/10 23:00 430,518 1.37 123
Storm Composite 6/4/2010 3:15 6/4/2010 5:12 0.450 253 6/3/10 23:00 6/4/10 10:00 554,610 15.58 8,759
Base 0.051 5 6/4/10 10:20 6/5/10 10:30 312,117 0.99 89
Storm 0.537 325 6/5/10 10:40 6/5/10 23:00 457,366 15.33 9,279
Base 0.051 5 6/5/10 23:10 6/6/10 13:50 190,277 0.61 54
Storm 0.537 325 6/6/10 14:00 6/6/10 18:40 146,545 4.91 2,973
Base 0.051 5 6/6/10 18:50 6/8/10 3:50 401,903 1.28 115
Storm Composite 6/8/2010 5:58 6/8/2010 11:27 0.258 140 6/8/10 4:00 6/8/10 22:20 1,333,950 21.48 11,658
Base 0.051 5 6/8/10 22:30 6/11/10 1:10 658,492 2.10 188
Storm Composite 6/11/2010 3:29 6/11/2010 8:16 0.561 490 6/11/10 1:20 6/11/10 11:00 1,391,820 48.74 42,574
Base 0.051 5 6/11/10 11:10 6/12/10 12:30 351,622 1.12 100
Storm 0.537 325 6/12/10 12:40 6/13/10 0:00 436,610 14.64 8,858
Sample Collection TimeSample Type
Interval Volume (cf)
Interval TP (lb)
Interval TSS (lb)
TP (mg/L) TSS (mg/L)Loading Interval
Capitol Region Watershed District 2010 Monitoring Report 115
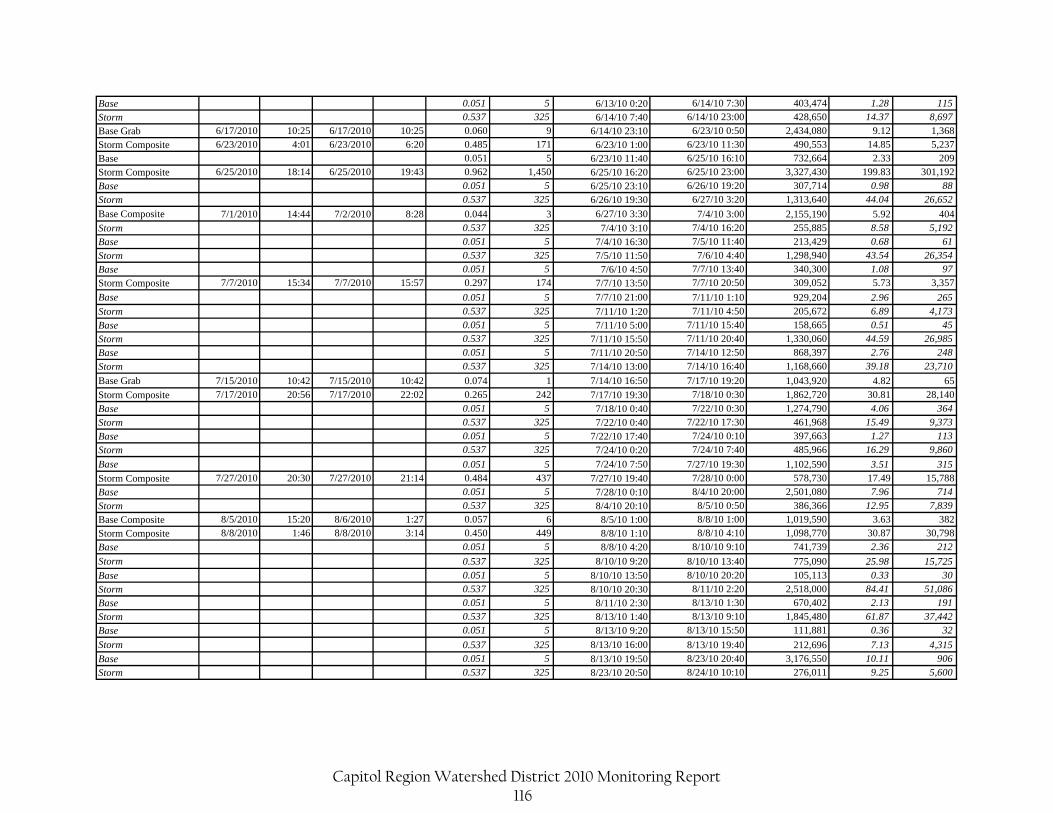
Base 0.051 5 6/13/10 0:20 6/14/10 7:30 403,474 1.28 115
Storm 0.537 325 6/14/10 7:40 6/14/10 23:00 428,650 14.37 8,697
Base Grab 6/17/2010 10:25 6/17/2010 10:25 0.060 9 6/14/10 23:10 6/23/10 0:50 2,434,080 9.12 1,368
Storm Composite 6/23/2010 4:01 6/23/2010 6:20 0.485 171 6/23/10 1:00 6/23/10 11:30 490,553 14.85 5,237
Base 0.051 5 6/23/10 11:40 6/25/10 16:10 732,664 2.33 209
Storm Composite 6/25/2010 18:14 6/25/2010 19:43 0.962 1,450 6/25/10 16:20 6/25/10 23:00 3,327,430 199.83 301,192
Base 0.051 5 6/25/10 23:10 6/26/10 19:20 307,714 0.98 88
Storm 0.537 325 6/26/10 19:30 6/27/10 3:20 1,313,640 44.04 26,652
Base Composite 7/1/2010 14:44 7/2/2010 8:28 0.044 3 6/27/10 3:30 7/4/10 3:00 2,155,190 5.92 404
Storm 0.537 325 7/4/10 3:10 7/4/10 16:20 255,885 8.58 5,192
Base 0.051 5 7/4/10 16:30 7/5/10 11:40 213,429 0.68 61
Storm 0.537 325 7/5/10 11:50 7/6/10 4:40 1,298,940 43.54 26,354
Base 0.051 5 7/6/10 4:50 7/7/10 13:40 340,300 1.08 97
Storm Composite 7/7/2010 15:34 7/7/2010 15:57 0.297 174 7/7/10 13:50 7/7/10 20:50 309,052 5.73 3,357
Base 0.051 5 7/7/10 21:00 7/11/10 1:10 929,204 2.96 265
Storm 0.537 325 7/11/10 1:20 7/11/10 4:50 205,672 6.89 4,173
Base 0.051 5 7/11/10 5:00 7/11/10 15:40 158,665 0.51 45
Storm 0.537 325 7/11/10 15:50 7/11/10 20:40 1,330,060 44.59 26,985
Base 0.051 5 7/11/10 20:50 7/14/10 12:50 868,397 2.76 248
Storm 0.537 325 7/14/10 13:00 7/14/10 16:40 1,168,660 39.18 23,710
Base Grab 7/15/2010 10:42 7/15/2010 10:42 0.074 1 7/14/10 16:50 7/17/10 19:20 1,043,920 4.82 65
Storm Composite 7/17/2010 20:56 7/17/2010 22:02 0.265 242 7/17/10 19:30 7/18/10 0:30 1,862,720 30.81 28,140
Base 0.051 5 7/18/10 0:40 7/22/10 0:30 1,274,790 4.06 364
Storm 0.537 325 7/22/10 0:40 7/22/10 17:30 461,968 15.49 9,373
Base 0.051 5 7/22/10 17:40 7/24/10 0:10 397,663 1.27 113
Storm 0.537 325 7/24/10 0:20 7/24/10 7:40 485,966 16.29 9,860
Base 0.051 5 7/24/10 7:50 7/27/10 19:30 1,102,590 3.51 315
Storm Composite 7/27/2010 20:30 7/27/2010 21:14 0.484 437 7/27/10 19:40 7/28/10 0:00 578,730 17.49 15,788
Base 0.051 5 7/28/10 0:10 8/4/10 20:00 2,501,080 7.96 714
Storm 0.537 325 8/4/10 20:10 8/5/10 0:50 386,366 12.95 7,839
Base Composite 8/5/2010 15:20 8/6/2010 1:27 0.057 6 8/5/10 1:00 8/8/10 1:00 1,019,590 3.63 382
Storm Composite 8/8/2010 1:46 8/8/2010 3:14 0.450 449 8/8/10 1:10 8/8/10 4:10 1,098,770 30.87 30,798
Base 0.051 5 8/8/10 4:20 8/10/10 9:10 741,739 2.36 212
Storm 0.537 325 8/10/10 9:20 8/10/10 13:40 775,090 25.98 15,725
Base 0.051 5 8/10/10 13:50 8/10/10 20:20 105,113 0.33 30
Storm 0.537 325 8/10/10 20:30 8/11/10 2:20 2,518,000 84.41 51,086
Base 0.051 5 8/11/10 2:30 8/13/10 1:30 670,402 2.13 191
Storm 0.537 325 8/13/10 1:40 8/13/10 9:10 1,845,480 61.87 37,442
Base 0.051 5 8/13/10 9:20 8/13/10 15:50 111,881 0.36 32
Storm 0.537 325 8/13/10 16:00 8/13/10 19:40 212,696 7.13 4,315
Base 0.051 5 8/13/10 19:50 8/23/10 20:40 3,176,550 10.11 906
Storm 0.537 325 8/23/10 20:50 8/24/10 10:10 276,011 9.25 5,600
Capitol Region Watershed District 2010 Monitoring Report 116
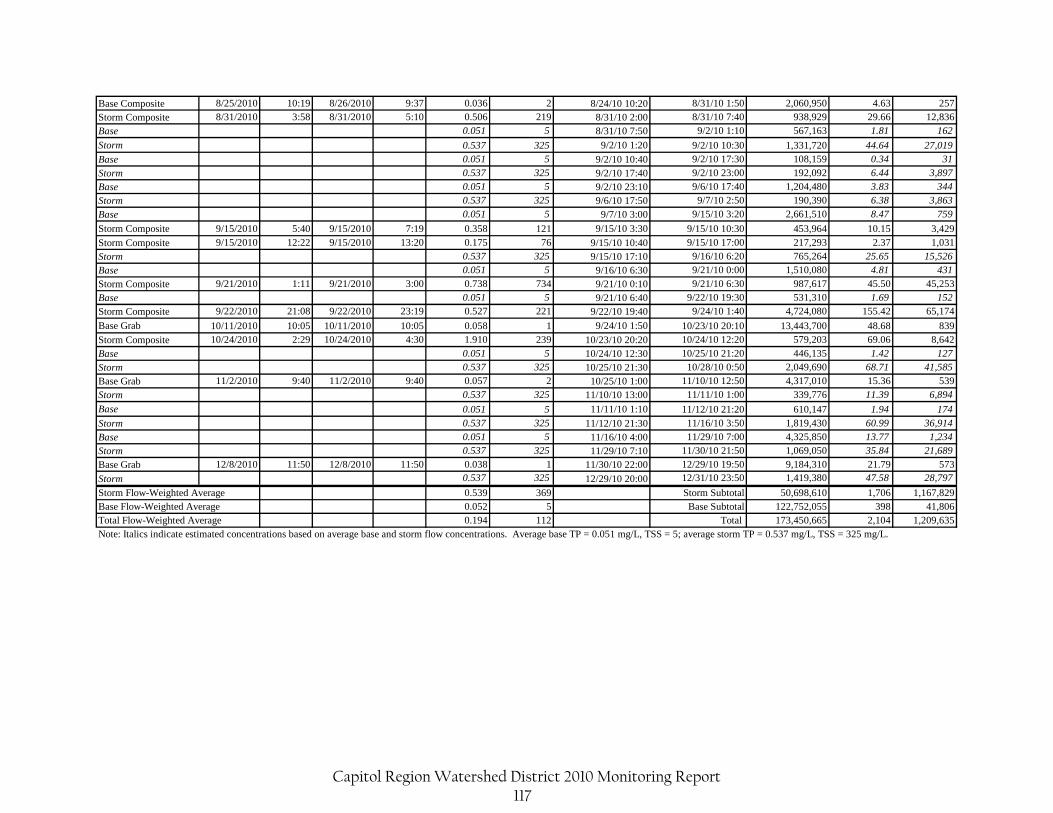
Base Composite 8/25/2010 10:19 8/26/2010 9:37 0.036 2 8/24/10 10:20 8/31/10 1:50 2,060,950 4.63 257
Storm Composite 8/31/2010 3:58 8/31/2010 5:10 0.506 219 8/31/10 2:00 8/31/10 7:40 938,929 29.66 12,836
Base 0.051 5 8/31/10 7:50 9/2/10 1:10 567,163 1.81 162
Storm 0.537 325 9/2/10 1:20 9/2/10 10:30 1,331,720 44.64 27,019
Base 0.051 5 9/2/10 10:40 9/2/10 17:30 108,159 0.34 31
Storm 0.537 325 9/2/10 17:40 9/2/10 23:00 192,092 6.44 3,897
Base 0.051 5 9/2/10 23:10 9/6/10 17:40 1,204,480 3.83 344
Storm 0.537 325 9/6/10 17:50 9/7/10 2:50 190,390 6.38 3,863
Base 0.051 5 9/7/10 3:00 9/15/10 3:20 2,661,510 8.47 759
Storm Composite 9/15/2010 5:40 9/15/2010 7:19 0.358 121 9/15/10 3:30 9/15/10 10:30 453,964 10.15 3,429
Storm Composite 9/15/2010 12:22 9/15/2010 13:20 0.175 76 9/15/10 10:40 9/15/10 17:00 217,293 2.37 1,031
Storm 0.537 325 9/15/10 17:10 9/16/10 6:20 765,264 25.65 15,526
Base 0.051 5 9/16/10 6:30 9/21/10 0:00 1,510,080 4.81 431
Storm Composite 9/21/2010 1:11 9/21/2010 3:00 0.738 734 9/21/10 0:10 9/21/10 6:30 987,617 45.50 45,253
Base 0.051 5 9/21/10 6:40 9/22/10 19:30 531,310 1.69 152
Storm Composite 9/22/2010 21:08 9/22/2010 23:19 0.527 221 9/22/10 19:40 9/24/10 1:40 4,724,080 155.42 65,174
Base Grab 10/11/2010 10:05 10/11/2010 10:05 0.058 1 9/24/10 1:50 10/23/10 20:10 13,443,700 48.68 839
Storm Composite 10/24/2010 2:29 10/24/2010 4:30 1.910 239 10/23/10 20:20 10/24/10 12:20 579,203 69.06 8,642
Base 0.051 5 10/24/10 12:30 10/25/10 21:20 446,135 1.42 127
Storm 0.537 325 10/25/10 21:30 10/28/10 0:50 2,049,690 68.71 41,585
Base Grab 11/2/2010 9:40 11/2/2010 9:40 0.057 2 10/25/10 1:00 11/10/10 12:50 4,317,010 15.36 539
Storm 0.537 325 11/10/10 13:00 11/11/10 1:00 339,776 11.39 6,894
Base 0.051 5 11/11/10 1:10 11/12/10 21:20 610,147 1.94 174
Storm 0.537 325 11/12/10 21:30 11/16/10 3:50 1,819,430 60.99 36,914
Base 0.051 5 11/16/10 4:00 11/29/10 7:00 4,325,850 13.77 1,234
Storm 0.537 325 11/29/10 7:10 11/30/10 21:50 1,069,050 35.84 21,689
Base Grab 12/8/2010 11:50 12/8/2010 11:50 0.038 1 11/30/10 22:00 12/29/10 19:50 9,184,310 21.79 573
Storm 0.537 325 12/29/10 20:00 12/31/10 23:50 1,419,380 47.58 28,797
0.539 369 Storm Subtotal 50,698,610 1,706 1,167,8290.052 5 Base Subtotal 122,752,055 398 41,8060.194 112 Total 173,450,665 2,104 1,209,635
Note: Italics indicate estimated concentrations based on average base and storm flow concentrations. Average base TP = 0.051 mg/L, TSS = 5; average storm TP = 0.537 mg/L, TSS = 325 mg/L.Total Flow-Weighted Average
Storm Flow-Weighted AverageBase Flow-Weighted Average
Capitol Region Watershed District 2010 Monitoring Report 117

Table 31. 2010 Sarita Laboratory Data. Sample Sampling Start Sampling End Ortho-P Cl Cd Cr Cu Pb Ni Zn NH3 TKN TP NO3 NO2 TDS TSS VSS HardnessType Date / Time Date / Time mg/L mg/L mg/L mg/L mg/L mg/L mg/L mg/L mg/L mg/L mg/L mg/L mg/L mg/L mg/L mg/L mg/LStorm Composite 5/13/2010 11:04 5/13/2010 13:50 0.034 3 0.0005 0.0050 0.0079 0.0145 0.0032 0.0591 0.08 1.20 0.160 0.30 0.03 55 38 12 28Storm Composite 6/8/2010 10:53 6/8/2010 13:51 3 0.0005 0.0050 0.0051 0.0033 0.0016 0.0254 0.16 0.57 0.118 0.23 0.03 21 17 6 136Storm Composite 6/11/2010 7:00 6/11/2010 9:15 2 0.0005 0.0050 0.0074 0.0106 0.0027 0.0442 0.28 1.10 0.198 0.35 0.03 44 87 23 24Storm Composite 6/25/2010 18:24 6/25/2010 20:28 0.087 2 0.0005 0.0095 0.0162 0.0350 0.0068 0.0919 0.24 1.60 0.416 0.23 0.03 36 207 39 44Storm Composite 7/5/2010 23:08 7/6/2010 2:53 0.071 3 0.0005 0.0050 0.0050 0.0057 0.0019 0.0261 0.18 0.77 0.158 0.21 0.03 57 36 11 26Storm Composite 7/7/2010 14:52 7/7/2010 16:25 0.059 2 0.0005 0.0065 0.0092 0.0098 0.0035 0.0435 0.19 1.00 0.200 0.41 0.03 45 80 16 30Storm Composite 7/17/2010 21:02 7/17/2010 22:27 0.069 2 0.0005 0.0050 0.0080 0.0145 0.0035 0.0462 0.15 1.40 0.369 0.22 0.03 45 103 23 24Storm Composite 8/10/2010 21:36 8/10/2010 22:55 0.055 2 0.0005 0.0074 0.0114 0.0256 0.0051 0.0688 0.09 0.73 0.196 0.17 0.03 26 206 44 26Storm Composite 9/15/2010 20:02 9/16/2010 3:48 0.131 5 0.0005 0.0050 0.0062 0.0064 0.0023 0.0393 0.16 1.00 0.255 0.35 0.04 86 32 12 38Storm Composite 9/22/2010 22:39 9/23/2010 3:15 0.129 2 0.0010 0.0100 0.0100 0.0070 0.0200 0.0470 0.03 0.88 0.272 0.15 0.03 62 46 14 40
Storm Average 0.079 3 0.0006 0.0063 0.0086 0.0132 0.0051 0.0492 0.16 1.03 0.234 0.26 0.03 48 85 20 42Annual Average 0.079 3 0.0006 0.0063 0.0086 0.0132 0.0051 0.0492 0.16 1.03 0.234 0.26 0.03 48 85 20 42
Annual Maximum 0.131 5 0.0010 0.0100 0.0162 0.0350 0.0200 0.0919 0.28 1.60 0.416 0.41 0.04 86 207 44 136Annual Median 0.070 2 0.0005 0.0050 0.0080 0.0102 0.0034 0.0452 0.16 1.00 0.199 0.23 0.03 45 63 15 29
number is approximate (~)Sample Sampling Start Sampling End E. coli actual value is less than numberType Date / Time Date / Time mpn/100mL actual value is greater than numberStorm Grab 6/8/2010 9:16 6/8/2010 9:16 17,500 missing dataStorm Grab 6/14/2010 10:19 6/14/2010 10:19 276 not collectedStorm Grab 8/10/2010 11:12 8/10/2010 11:12 72,700Storm Grab 9/23/2010 11:30 9/23/2010 11:30 65,000
Storm Average 38,869Annual Maximum 72,700Annual Minimum 276
Capitol Region Watershed District 2010 Monitoring Report 118
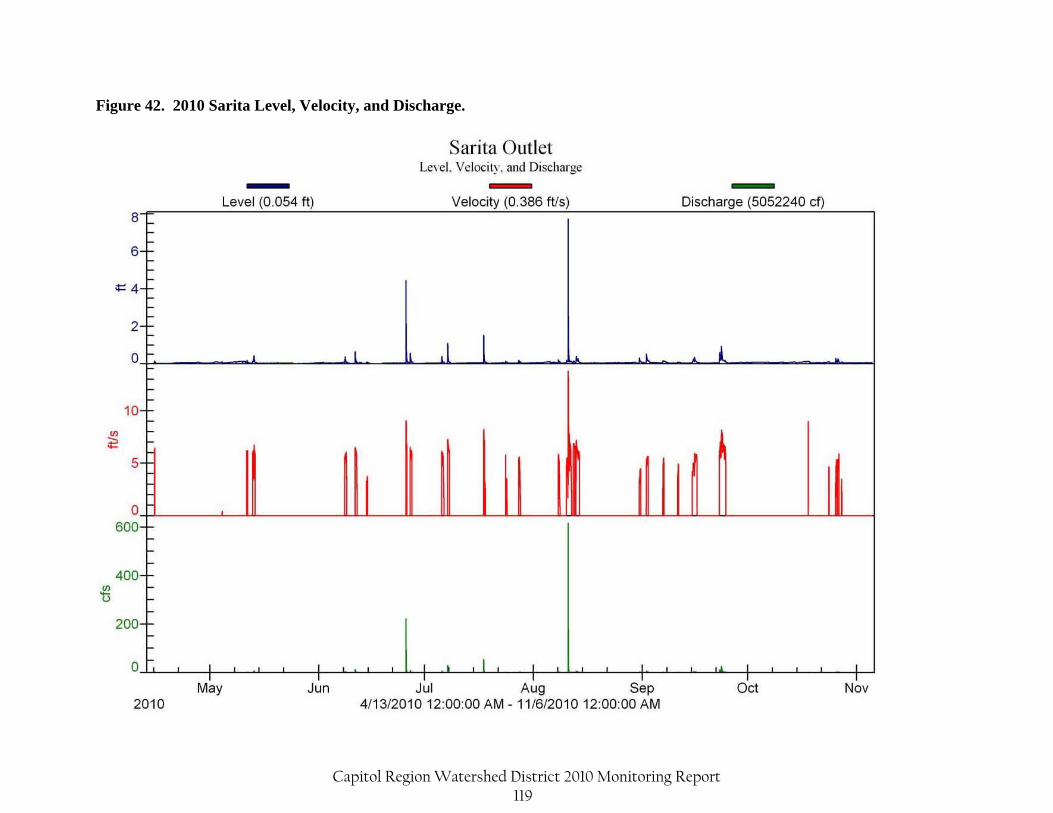
Figure 42. 2010 Sarita Level, Velocity, and Discharge.
Capitol Region Watershed District 2010 Monitoring Report 119
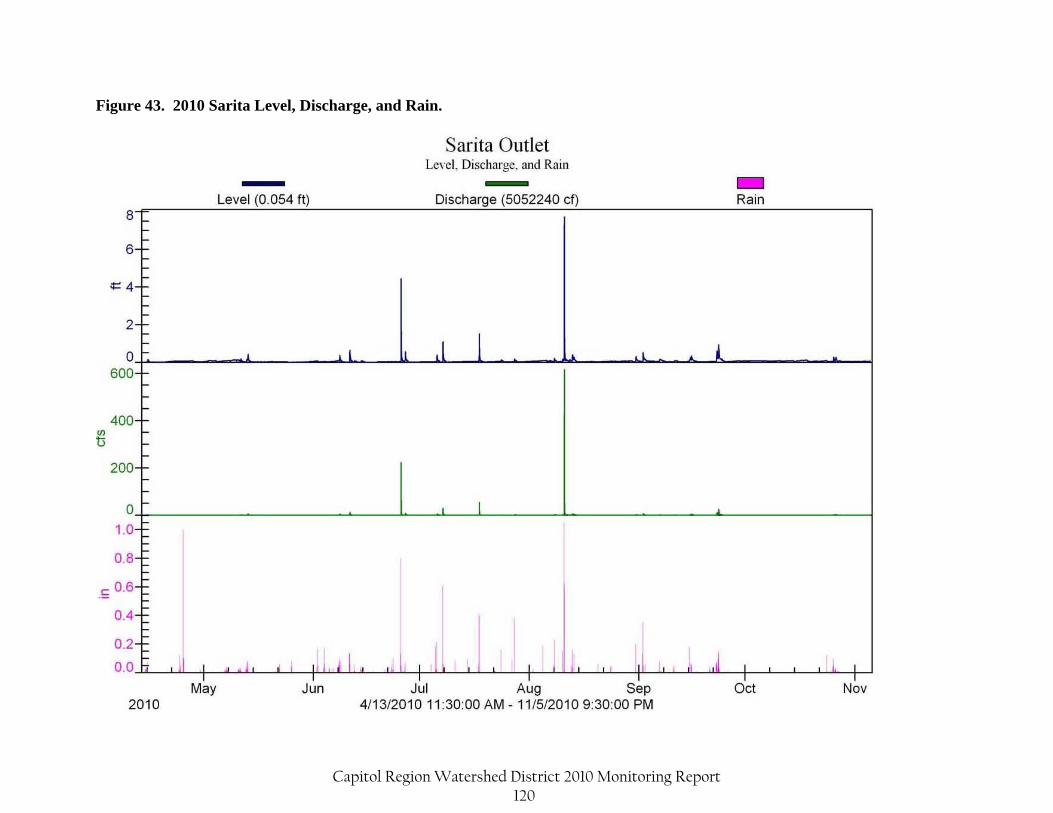
Figure 43. 2010 Sarita Level, Discharge, and Rain.
Capitol Region Watershed District 2010 Monitoring Report 120
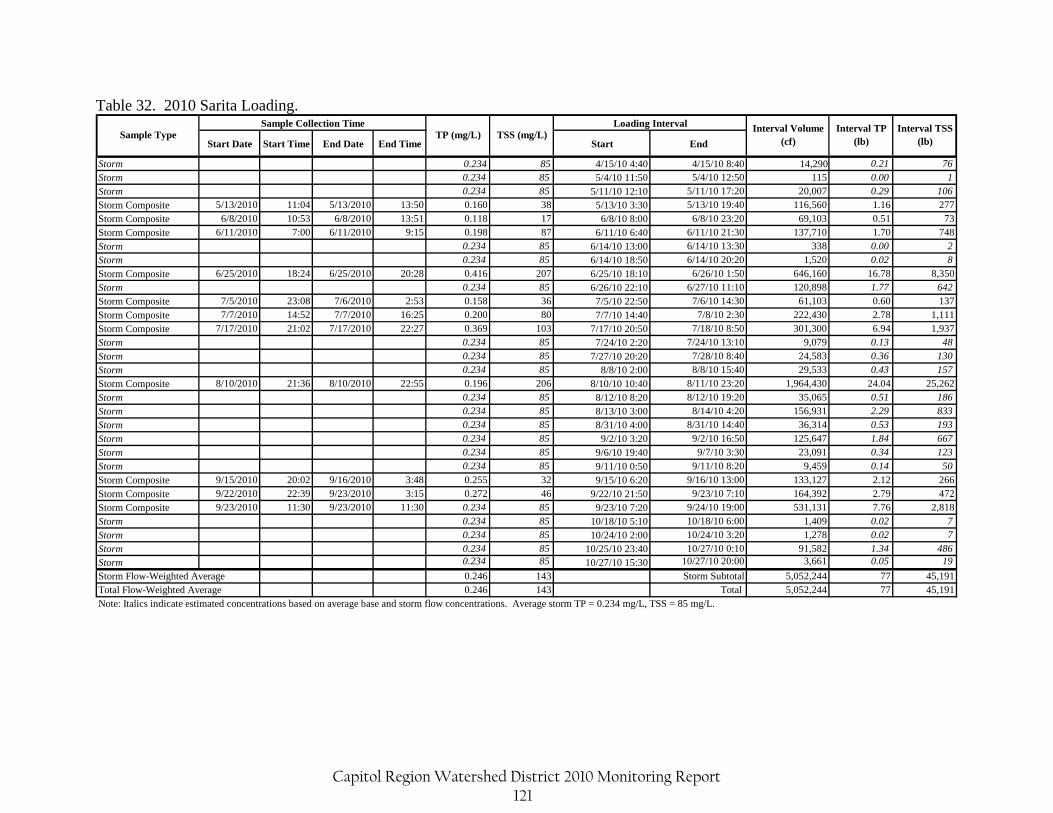
Table 32. 2010 Sarita Loading.
Start Date Start Time End Date End Time Start End
Storm 0.234 85 4/15/10 4:40 4/15/10 8:40 14,290 0.21 76
Storm 0.234 85 5/4/10 11:50 5/4/10 12:50 115 0.00 1
Storm 0.234 85 5/11/10 12:10 5/11/10 17:20 20,007 0.29 106
Storm Composite 5/13/2010 11:04 5/13/2010 13:50 0.160 38 5/13/10 3:30 5/13/10 19:40 116,560 1.16 277
Storm Composite 6/8/2010 10:53 6/8/2010 13:51 0.118 17 6/8/10 8:00 6/8/10 23:20 69,103 0.51 73
Storm Composite 6/11/2010 7:00 6/11/2010 9:15 0.198 87 6/11/10 6:40 6/11/10 21:30 137,710 1.70 748
Storm 0.234 85 6/14/10 13:00 6/14/10 13:30 338 0.00 2
Storm 0.234 85 6/14/10 18:50 6/14/10 20:20 1,520 0.02 8
Storm Composite 6/25/2010 18:24 6/25/2010 20:28 0.416 207 6/25/10 18:10 6/26/10 1:50 646,160 16.78 8,350
Storm 0.234 85 6/26/10 22:10 6/27/10 11:10 120,898 1.77 642
Storm Composite 7/5/2010 23:08 7/6/2010 2:53 0.158 36 7/5/10 22:50 7/6/10 14:30 61,103 0.60 137
Storm Composite 7/7/2010 14:52 7/7/2010 16:25 0.200 80 7/7/10 14:40 7/8/10 2:30 222,430 2.78 1,111
Storm Composite 7/17/2010 21:02 7/17/2010 22:27 0.369 103 7/17/10 20:50 7/18/10 8:50 301,300 6.94 1,937
Storm 0.234 85 7/24/10 2:20 7/24/10 13:10 9,079 0.13 48
Storm 0.234 85 7/27/10 20:20 7/28/10 8:40 24,583 0.36 130
Storm 0.234 85 8/8/10 2:00 8/8/10 15:40 29,533 0.43 157
Storm Composite 8/10/2010 21:36 8/10/2010 22:55 0.196 206 8/10/10 10:40 8/11/10 23:20 1,964,430 24.04 25,262
Storm 0.234 85 8/12/10 8:20 8/12/10 19:20 35,065 0.51 186
Storm 0.234 85 8/13/10 3:00 8/14/10 4:20 156,931 2.29 833
Storm 0.234 85 8/31/10 4:00 8/31/10 14:40 36,314 0.53 193
Storm 0.234 85 9/2/10 3:20 9/2/10 16:50 125,647 1.84 667
Storm 0.234 85 9/6/10 19:40 9/7/10 3:30 23,091 0.34 123
Storm 0.234 85 9/11/10 0:50 9/11/10 8:20 9,459 0.14 50
Storm Composite 9/15/2010 20:02 9/16/2010 3:48 0.255 32 9/15/10 6:20 9/16/10 13:00 133,127 2.12 266
Storm Composite 9/22/2010 22:39 9/23/2010 3:15 0.272 46 9/22/10 21:50 9/23/10 7:10 164,392 2.79 472
Storm Composite 9/23/2010 11:30 9/23/2010 11:30 0.234 85 9/23/10 7:20 9/24/10 19:00 531,131 7.76 2,818
Storm 0.234 85 10/18/10 5:10 10/18/10 6:00 1,409 0.02 7
Storm 0.234 85 10/24/10 2:00 10/24/10 3:20 1,278 0.02 7
Storm 0.234 85 10/25/10 23:40 10/27/10 0:10 91,582 1.34 486
Storm 0.234 85 10/27/10 15:30 10/27/10 20:00 3,661 0.05 19
0.246 143 Storm Subtotal 5,052,244 77 45,1910.246 143 Total 5,052,244 77 45,191
Note: Italics indicate estimated concentrations based on average base and storm flow concentrations. Average storm TP = 0.234 mg/L, TSS = 85 mg/L.
Interval Volume (cf)
Interval TP (lb)
Interval TSS (lb)
TP (mg/L) TSS (mg/L)
Total Flow-Weighted Average
Sample Collection Time Loading Interval
Storm Flow-Weighted Average
Sample Type
Capitol Region Watershed District 2010 Monitoring Report 121
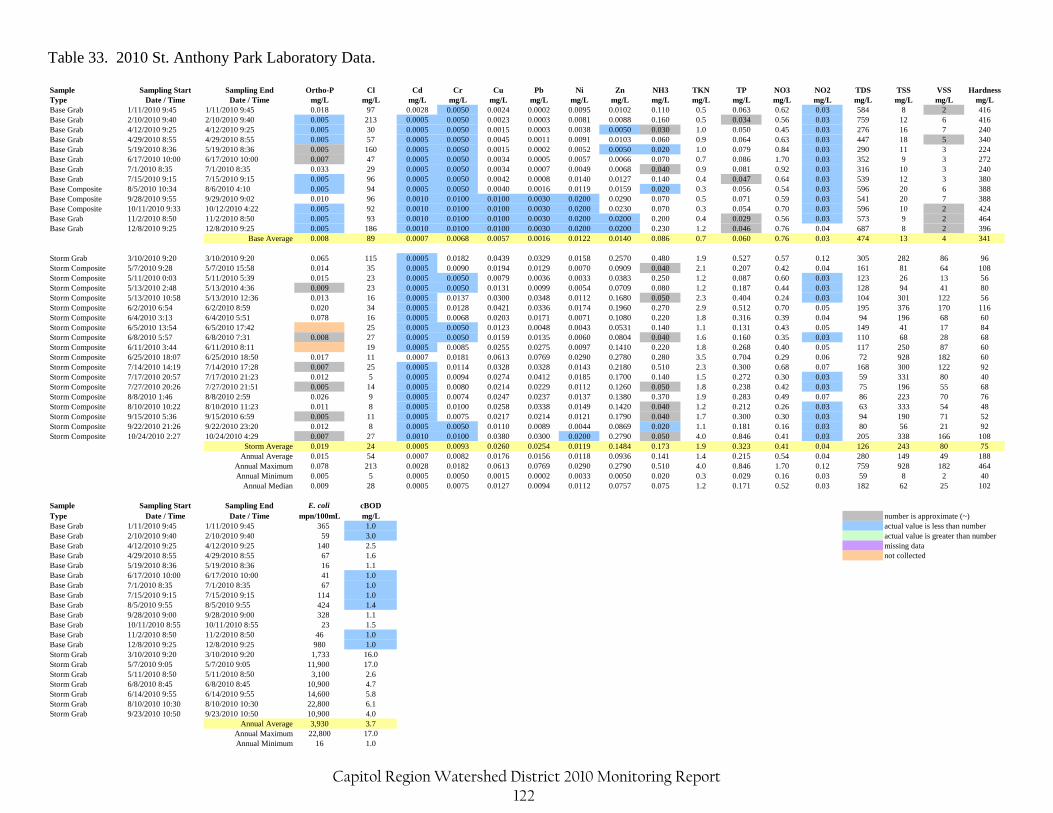
Table 33. 2010 St. Anthony Park Laboratory Data. Sample Sampling Start Sampling End Ortho-P Cl Cd Cr Cu Pb Ni Zn NH3 TKN TP NO3 NO2 TDS TSS VSS HardnessType Date / Time Date / Time mg/L mg/L mg/L mg/L mg/L mg/L mg/L mg/L mg/L mg/L mg/L mg/L mg/L mg/L mg/L mg/L mg/LBase Grab 1/11/2010 9:45 1/11/2010 9:45 0.018 97 0.0028 0.0050 0.0024 0.0002 0.0095 0.0102 0.110 0.5 0.063 0.62 0.03 584 8 2 416Base Grab 2/10/2010 9:40 2/10/2010 9:40 0.005 213 0.0005 0.0050 0.0023 0.0003 0.0081 0.0088 0.160 0.5 0.034 0.56 0.03 759 12 6 416Base Grab 4/12/2010 9:25 4/12/2010 9:25 0.005 30 0.0005 0.0050 0.0015 0.0003 0.0038 0.0050 0.030 1.0 0.050 0.45 0.03 276 16 7 240Base Grab 4/29/2010 8:55 4/29/2010 8:55 0.005 57 0.0005 0.0050 0.0045 0.0011 0.0091 0.0103 0.060 0.9 0.064 0.63 0.03 447 18 5 340Base Grab 5/19/2010 8:36 5/19/2010 8:36 0.005 160 0.0005 0.0050 0.0015 0.0002 0.0052 0.0050 0.020 1.0 0.079 0.84 0.03 290 11 3 224Base Grab 6/17/2010 10:00 6/17/2010 10:00 0.007 47 0.0005 0.0050 0.0034 0.0005 0.0057 0.0066 0.070 0.7 0.086 1.70 0.03 352 9 3 272Base Grab 7/1/2010 8:35 7/1/2010 8:35 0.033 29 0.0005 0.0050 0.0034 0.0007 0.0049 0.0068 0.040 0.9 0.081 0.92 0.03 316 10 3 240Base Grab 7/15/2010 9:15 7/15/2010 9:15 0.005 96 0.0005 0.0050 0.0042 0.0008 0.0140 0.0127 0.140 0.4 0.047 0.64 0.03 539 12 3 380Base Composite 8/5/2010 10:34 8/6/2010 4:10 0.005 94 0.0005 0.0050 0.0040 0.0016 0.0119 0.0159 0.020 0.3 0.056 0.54 0.03 596 20 6 388Base Composite 9/28/2010 9:55 9/29/2010 9:02 0.010 96 0.0010 0.0100 0.0100 0.0030 0.0200 0.0290 0.070 0.5 0.071 0.59 0.03 541 20 7 388Base Composite 10/11/2010 9:33 10/12/2010 4:22 0.005 92 0.0010 0.0100 0.0100 0.0030 0.0200 0.0230 0.070 0.3 0.054 0.70 0.03 596 10 2 424Base Grab 11/2/2010 8:50 11/2/2010 8:50 0.005 93 0.0010 0.0100 0.0100 0.0030 0.0200 0.0200 0.200 0.4 0.029 0.56 0.03 573 9 2 464Base Grab 12/8/2010 9:25 12/8/2010 9:25 0.005 186 0.0010 0.0100 0.0100 0.0030 0.0200 0.0200 0.230 1.2 0.046 0.76 0.04 687 8 2 396
Base Average 0.008 89 0.0007 0.0068 0.0057 0.0016 0.0122 0.0140 0.086 0.7 0.060 0.76 0.03 474 13 4 341
Storm Grab 3/10/2010 9:20 3/10/2010 9:20 0.065 115 0.0005 0.0182 0.0439 0.0329 0.0158 0.2570 0.480 1.9 0.527 0.57 0.12 305 282 86 96Storm Composite 5/7/2010 9:28 5/7/2010 15:58 0.014 35 0.0005 0.0090 0.0194 0.0129 0.0070 0.0909 0.040 2.1 0.207 0.42 0.04 161 81 64 108Storm Composite 5/11/2010 0:03 5/11/2010 5:39 0.015 23 0.0005 0.0050 0.0079 0.0036 0.0033 0.0383 0.250 1.2 0.087 0.60 0.03 123 26 13 56Storm Composite 5/13/2010 2:48 5/13/2010 4:36 0.009 23 0.0005 0.0050 0.0131 0.0099 0.0054 0.0709 0.080 1.2 0.187 0.44 0.03 128 94 41 80Storm Composite 5/13/2010 10:58 5/13/2010 12:36 0.013 16 0.0005 0.0137 0.0300 0.0348 0.0112 0.1680 0.050 2.3 0.404 0.24 0.03 104 301 122 56Storm Composite 6/2/2010 6:54 6/2/2010 8:59 0.020 34 0.0005 0.0128 0.0421 0.0336 0.0174 0.1960 0.270 2.9 0.512 0.70 0.05 195 376 170 116Storm Composite 6/4/2010 3:13 6/4/2010 5:51 0.078 16 0.0005 0.0068 0.0203 0.0171 0.0071 0.1080 0.220 1.8 0.316 0.39 0.04 94 196 68 60Storm Composite 6/5/2010 13:54 6/5/2010 17:42 25 0.0005 0.0050 0.0123 0.0048 0.0043 0.0531 0.140 1.1 0.131 0.43 0.05 149 41 17 84Storm Composite 6/8/2010 5:57 6/8/2010 7:31 0.008 27 0.0005 0.0050 0.0159 0.0135 0.0060 0.0804 0.040 1.6 0.160 0.35 0.03 110 68 28 68Storm Composite 6/11/2010 3:44 6/11/2010 8:11 19 0.0005 0.0085 0.0255 0.0275 0.0097 0.1410 0.220 1.8 0.268 0.40 0.05 117 250 87 60Storm Composite 6/25/2010 18:07 6/25/2010 18:50 0.017 11 0.0007 0.0181 0.0613 0.0769 0.0290 0.2780 0.280 3.5 0.704 0.29 0.06 72 928 182 60Storm Composite 7/14/2010 14:19 7/14/2010 17:28 0.007 25 0.0005 0.0114 0.0328 0.0328 0.0143 0.2180 0.510 2.3 0.300 0.68 0.07 168 300 122 92Storm Composite 7/17/2010 20:57 7/17/2010 21:23 0.012 5 0.0005 0.0094 0.0274 0.0412 0.0185 0.1700 0.140 1.5 0.272 0.30 0.03 59 331 80 40Storm Composite 7/27/2010 20:26 7/27/2010 21:51 0.005 14 0.0005 0.0080 0.0214 0.0229 0.0112 0.1260 0.050 1.8 0.238 0.42 0.03 75 196 55 68Storm Composite 8/8/2010 1:46 8/8/2010 2:59 0.026 9 0.0005 0.0074 0.0247 0.0237 0.0137 0.1380 0.370 1.9 0.283 0.49 0.07 86 223 70 76Storm Composite 8/10/2010 10:22 8/10/2010 11:23 0.011 8 0.0005 0.0100 0.0258 0.0338 0.0149 0.1420 0.040 1.2 0.212 0.26 0.03 63 333 54 48Storm Composite 9/15/2010 5:36 9/15/2010 6:59 0.005 11 0.0005 0.0075 0.0217 0.0214 0.0121 0.1790 0.040 1.7 0.300 0.30 0.03 94 190 71 52Storm Composite 9/22/2010 21:26 9/22/2010 23:20 0.012 8 0.0005 0.0050 0.0110 0.0089 0.0044 0.0869 0.020 1.1 0.181 0.16 0.03 80 56 21 92Storm Composite 10/24/2010 2:27 10/24/2010 4:29 0.007 27 0.0010 0.0100 0.0380 0.0300 0.0200 0.2790 0.050 4.0 0.846 0.41 0.03 205 338 166 108
Storm Average 0.019 24 0.0005 0.0093 0.0260 0.0254 0.0119 0.1484 0.173 1.9 0.323 0.41 0.04 126 243 80 75Annual Average 0.015 54 0.0007 0.0082 0.0176 0.0156 0.0118 0.0936 0.141 1.4 0.215 0.54 0.04 280 149 49 188
Annual Maximum 0.078 213 0.0028 0.0182 0.0613 0.0769 0.0290 0.2790 0.510 4.0 0.846 1.70 0.12 759 928 182 464Annual Minimum 0.005 5 0.0005 0.0050 0.0015 0.0002 0.0033 0.0050 0.020 0.3 0.029 0.16 0.03 59 8 2 40
Annual Median 0.009 28 0.0005 0.0075 0.0127 0.0094 0.0112 0.0757 0.075 1.2 0.171 0.52 0.03 182 62 25 102
Sample Sampling Start Sampling End E. coli cBODType Date / Time Date / Time mpn/100mL mg/L number is approximate (~)Base Grab 1/11/2010 9:45 1/11/2010 9:45 365 1.0 actual value is less than numberBase Grab 2/10/2010 9:40 2/10/2010 9:40 59 3.0 actual value is greater than numberBase Grab 4/12/2010 9:25 4/12/2010 9:25 140 2.5 missing dataBase Grab 4/29/2010 8:55 4/29/2010 8:55 67 1.6 not collectedBase Grab 5/19/2010 8:36 5/19/2010 8:36 16 1.1Base Grab 6/17/2010 10:00 6/17/2010 10:00 41 1.0Base Grab 7/1/2010 8:35 7/1/2010 8:35 67 1.0Base Grab 7/15/2010 9:15 7/15/2010 9:15 114 1.0Base Grab 8/5/2010 9:55 8/5/2010 9:55 424 1.4Base Grab 9/28/2010 9:00 9/28/2010 9:00 328 1.1Base Grab 10/11/2010 8:55 10/11/2010 8:55 23 1.5Base Grab 11/2/2010 8:50 11/2/2010 8:50 46 1.0Base Grab 12/8/2010 9:25 12/8/2010 9:25 980 1.0Storm Grab 3/10/2010 9:20 3/10/2010 9:20 1,733 16.0Storm Grab 5/7/2010 9:05 5/7/2010 9:05 11,900 17.0Storm Grab 5/11/2010 8:50 5/11/2010 8:50 3,100 2.6Storm Grab 6/8/2010 8:45 6/8/2010 8:45 10,900 4.7Storm Grab 6/14/2010 9:55 6/14/2010 9:55 14,600 5.8Storm Grab 8/10/2010 10:30 8/10/2010 10:30 22,800 6.1Storm Grab 9/23/2010 10:50 9/23/2010 10:50 10,900 4.0
Annual Average 3,930 3.7Annual Maximum 22,800 17.0Annual Minimum 16 1.0
Capitol Region Watershed District 2010 Monitoring Report 122
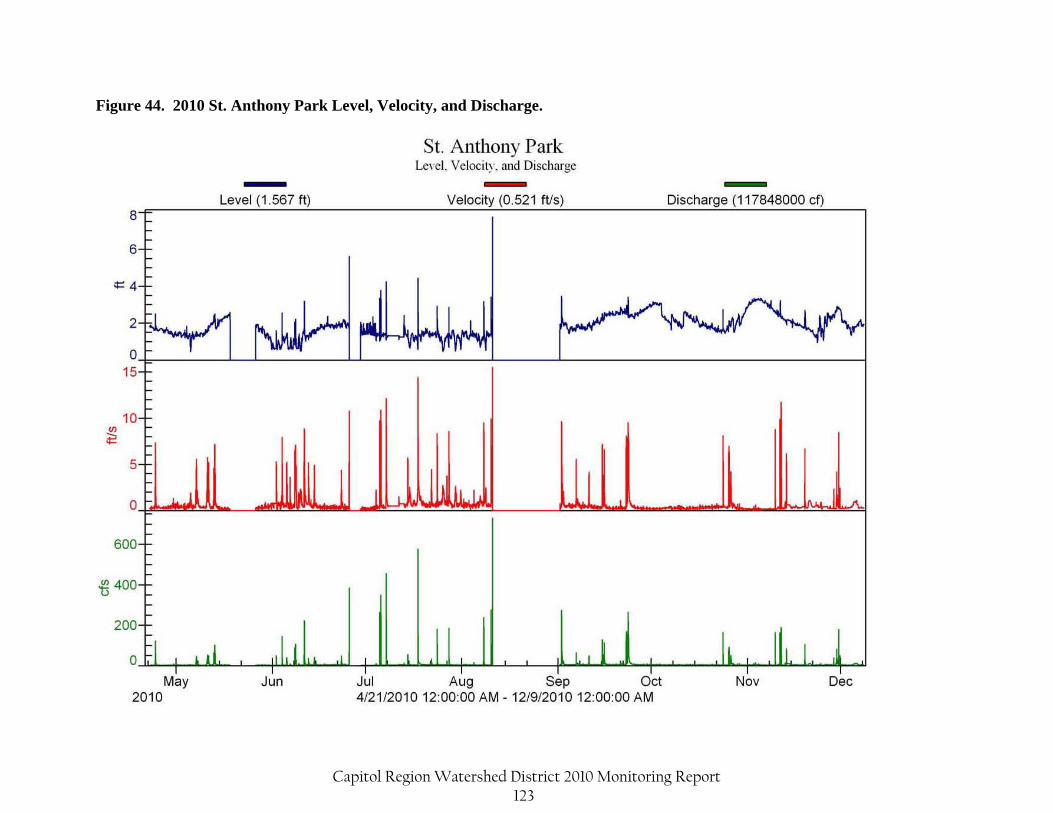
Figure 44. 2010 St. Anthony Park Level, Velocity, and Discharge.
Capitol Region Watershed District 2010 Monitoring Report 123
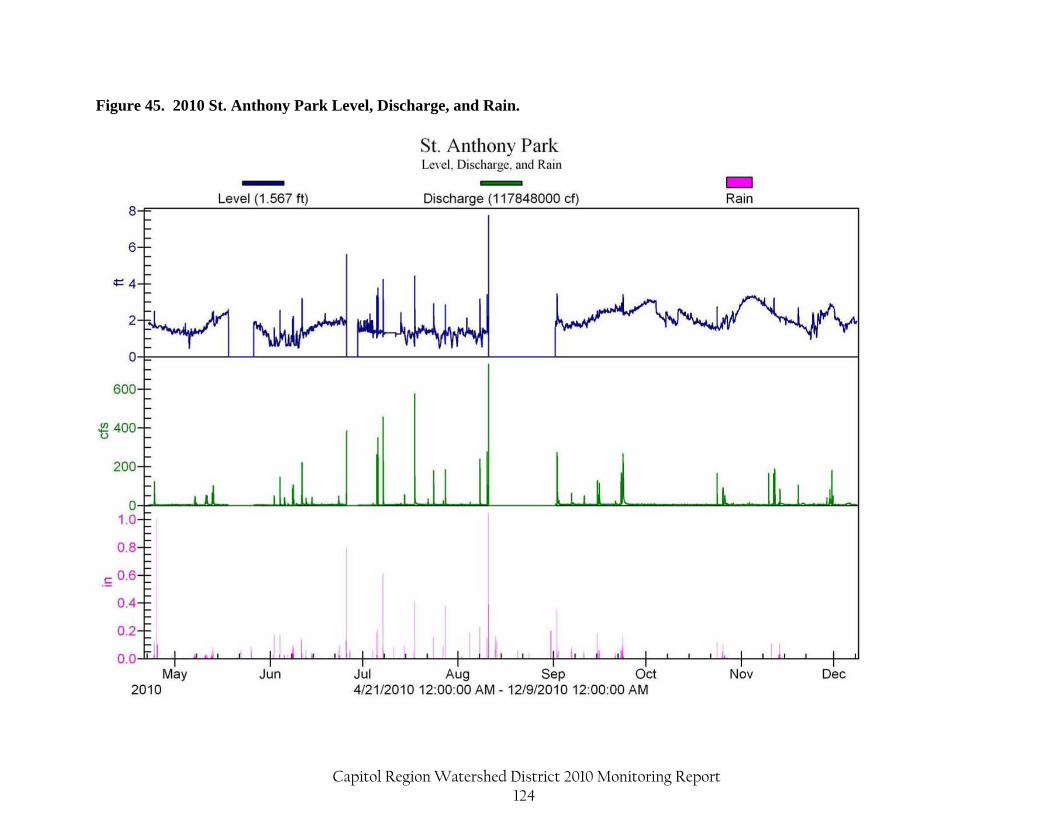
Figure 45. 2010 St. Anthony Park Level, Discharge, and Rain.
Capitol Region Watershed District 2010 Monitoring Report 124
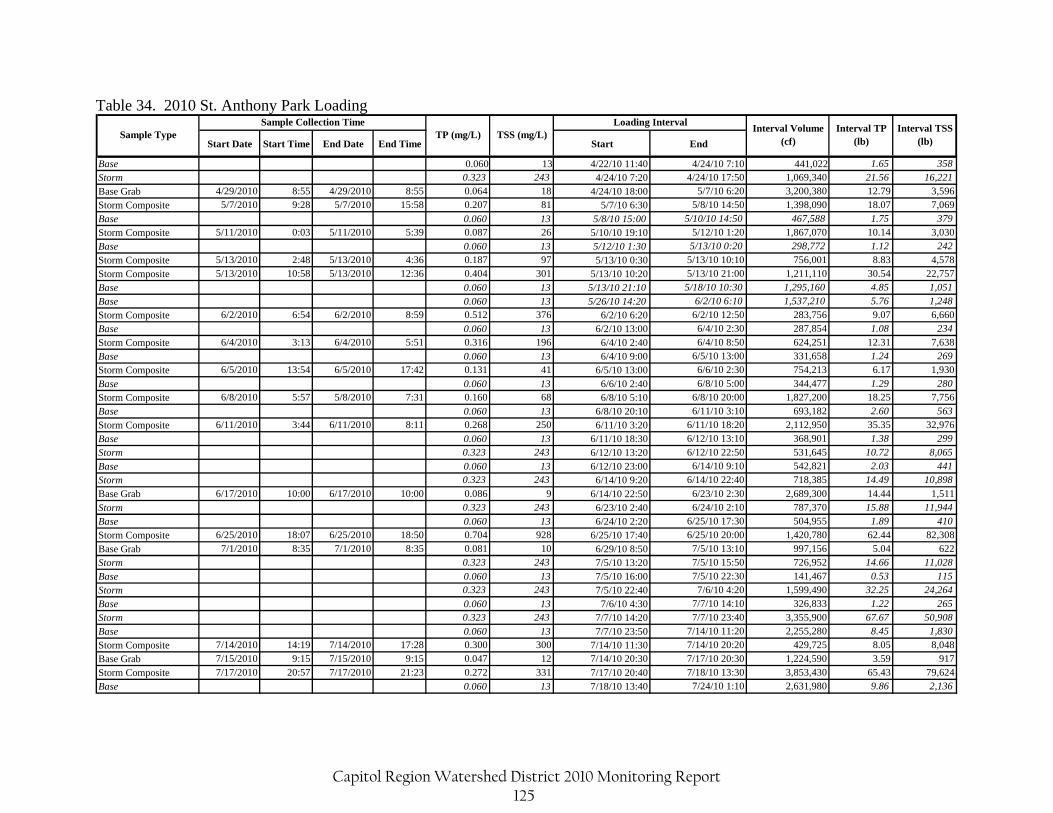
Table 34. 2010 St. Anthony Park Loading
Start Date Start Time End Date End Time Start End
Base 0.060 13 4/22/10 11:40 4/24/10 7:10 441,022 1.65 358
Storm 0.323 243 4/24/10 7:20 4/24/10 17:50 1,069,340 21.56 16,221
Base Grab 4/29/2010 8:55 4/29/2010 8:55 0.064 18 4/24/10 18:00 5/7/10 6:20 3,200,380 12.79 3,596
Storm Composite 5/7/2010 9:28 5/7/2010 15:58 0.207 81 5/7/10 6:30 5/8/10 14:50 1,398,090 18.07 7,069
Base 0.060 13 5/8/10 15:00 5/10/10 14:50 467,588 1.75 379
Storm Composite 5/11/2010 0:03 5/11/2010 5:39 0.087 26 5/10/10 19:10 5/12/10 1:20 1,867,070 10.14 3,030
Base 0.060 13 5/12/10 1:30 5/13/10 0:20 298,772 1.12 242
Storm Composite 5/13/2010 2:48 5/13/2010 4:36 0.187 97 5/13/10 0:30 5/13/10 10:10 756,001 8.83 4,578
Storm Composite 5/13/2010 10:58 5/13/2010 12:36 0.404 301 5/13/10 10:20 5/13/10 21:00 1,211,110 30.54 22,757
Base 0.060 13 5/13/10 21:10 5/18/10 10:30 1,295,160 4.85 1,051
Base 0.060 13 5/26/10 14:20 6/2/10 6:10 1,537,210 5.76 1,248
Storm Composite 6/2/2010 6:54 6/2/2010 8:59 0.512 376 6/2/10 6:20 6/2/10 12:50 283,756 9.07 6,660
Base 0.060 13 6/2/10 13:00 6/4/10 2:30 287,854 1.08 234
Storm Composite 6/4/2010 3:13 6/4/2010 5:51 0.316 196 6/4/10 2:40 6/4/10 8:50 624,251 12.31 7,638
Base 0.060 13 6/4/10 9:00 6/5/10 13:00 331,658 1.24 269
Storm Composite 6/5/2010 13:54 6/5/2010 17:42 0.131 41 6/5/10 13:00 6/6/10 2:30 754,213 6.17 1,930
Base 0.060 13 6/6/10 2:40 6/8/10 5:00 344,477 1.29 280
Storm Composite 6/8/2010 5:57 5/8/2010 7:31 0.160 68 6/8/10 5:10 6/8/10 20:00 1,827,200 18.25 7,756
Base 0.060 13 6/8/10 20:10 6/11/10 3:10 693,182 2.60 563
Storm Composite 6/11/2010 3:44 6/11/2010 8:11 0.268 250 6/11/10 3:20 6/11/10 18:20 2,112,950 35.35 32,976
Base 0.060 13 6/11/10 18:30 6/12/10 13:10 368,901 1.38 299
Storm 0.323 243 6/12/10 13:20 6/12/10 22:50 531,645 10.72 8,065
Base 0.060 13 6/12/10 23:00 6/14/10 9:10 542,821 2.03 441
Storm 0.323 243 6/14/10 9:20 6/14/10 22:40 718,385 14.49 10,898
Base Grab 6/17/2010 10:00 6/17/2010 10:00 0.086 9 6/14/10 22:50 6/23/10 2:30 2,689,300 14.44 1,511
Storm 0.323 243 6/23/10 2:40 6/24/10 2:10 787,370 15.88 11,944
Base 0.060 13 6/24/10 2:20 6/25/10 17:30 504,955 1.89 410
Storm Composite 6/25/2010 18:07 6/25/2010 18:50 0.704 928 6/25/10 17:40 6/25/10 20:00 1,420,780 62.44 82,308
Base Grab 7/1/2010 8:35 7/1/2010 8:35 0.081 10 6/29/10 8:50 7/5/10 13:10 997,156 5.04 622
Storm 0.323 243 7/5/10 13:20 7/5/10 15:50 726,952 14.66 11,028
Base 0.060 13 7/5/10 16:00 7/5/10 22:30 141,467 0.53 115
Storm 0.323 243 7/5/10 22:40 7/6/10 4:20 1,599,490 32.25 24,264
Base 0.060 13 7/6/10 4:30 7/7/10 14:10 326,833 1.22 265
Storm 0.323 243 7/7/10 14:20 7/7/10 23:40 3,355,900 67.67 50,908
Base 0.060 13 7/7/10 23:50 7/14/10 11:20 2,255,280 8.45 1,830
Storm Composite 7/14/2010 14:19 7/14/2010 17:28 0.300 300 7/14/10 11:30 7/14/10 20:20 429,725 8.05 8,048
Base Grab 7/15/2010 9:15 7/15/2010 9:15 0.047 12 7/14/10 20:30 7/17/10 20:30 1,224,590 3.59 917
Storm Composite 7/17/2010 20:57 7/17/2010 21:23 0.272 331 7/17/10 20:40 7/18/10 13:30 3,853,430 65.43 79,624
Base 0.060 13 7/18/10 13:40 7/24/10 1:10 2,631,980 9.86 2,136
Interval Volume (cf)
Interval TP (lb)
Interval TSS (lb)
TP (mg/L) TSS (mg/L)Sample Collection Time Loading Interval
Sample Type
Capitol Region Watershed District 2010 Monitoring Report 125
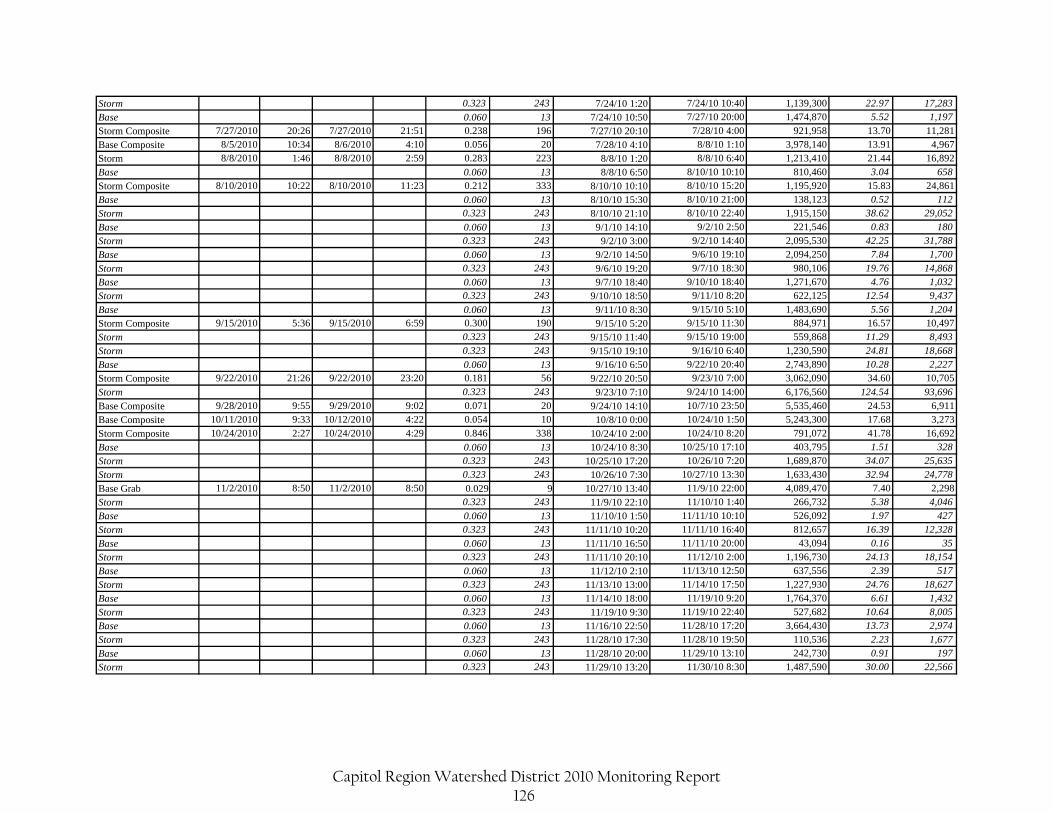
Storm 0.323 243 7/24/10 1:20 7/24/10 10:40 1,139,300 22.97 17,283
Base 0.060 13 7/24/10 10:50 7/27/10 20:00 1,474,870 5.52 1,197
Storm Composite 7/27/2010 20:26 7/27/2010 21:51 0.238 196 7/27/10 20:10 7/28/10 4:00 921,958 13.70 11,281
Base Composite 8/5/2010 10:34 8/6/2010 4:10 0.056 20 7/28/10 4:10 8/8/10 1:10 3,978,140 13.91 4,967
Storm 8/8/2010 1:46 8/8/2010 2:59 0.283 223 8/8/10 1:20 8/8/10 6:40 1,213,410 21.44 16,892
Base 0.060 13 8/8/10 6:50 8/10/10 10:10 810,460 3.04 658
Storm Composite 8/10/2010 10:22 8/10/2010 11:23 0.212 333 8/10/10 10:10 8/10/10 15:20 1,195,920 15.83 24,861
Base 0.060 13 8/10/10 15:30 8/10/10 21:00 138,123 0.52 112
Storm 0.323 243 8/10/10 21:10 8/10/10 22:40 1,915,150 38.62 29,052
Base 0.060 13 9/1/10 14:10 9/2/10 2:50 221,546 0.83 180
Storm 0.323 243 9/2/10 3:00 9/2/10 14:40 2,095,530 42.25 31,788
Base 0.060 13 9/2/10 14:50 9/6/10 19:10 2,094,250 7.84 1,700
Storm 0.323 243 9/6/10 19:20 9/7/10 18:30 980,106 19.76 14,868
Base 0.060 13 9/7/10 18:40 9/10/10 18:40 1,271,670 4.76 1,032
Storm 0.323 243 9/10/10 18:50 9/11/10 8:20 622,125 12.54 9,437
Base 0.060 13 9/11/10 8:30 9/15/10 5:10 1,483,690 5.56 1,204
Storm Composite 9/15/2010 5:36 9/15/2010 6:59 0.300 190 9/15/10 5:20 9/15/10 11:30 884,971 16.57 10,497
Storm 0.323 243 9/15/10 11:40 9/15/10 19:00 559,868 11.29 8,493
Storm 0.323 243 9/15/10 19:10 9/16/10 6:40 1,230,590 24.81 18,668
Base 0.060 13 9/16/10 6:50 9/22/10 20:40 2,743,890 10.28 2,227
Storm Composite 9/22/2010 21:26 9/22/2010 23:20 0.181 56 9/22/10 20:50 9/23/10 7:00 3,062,090 34.60 10,705
Storm 0.323 243 9/23/10 7:10 9/24/10 14:00 6,176,560 124.54 93,696
Base Composite 9/28/2010 9:55 9/29/2010 9:02 0.071 20 9/24/10 14:10 10/7/10 23:50 5,535,460 24.53 6,911
Base Composite 10/11/2010 9:33 10/12/2010 4:22 0.054 10 10/8/10 0:00 10/24/10 1:50 5,243,300 17.68 3,273
Storm Composite 10/24/2010 2:27 10/24/2010 4:29 0.846 338 10/24/10 2:00 10/24/10 8:20 791,072 41.78 16,692
Base 0.060 13 10/24/10 8:30 10/25/10 17:10 403,795 1.51 328
Storm 0.323 243 10/25/10 17:20 10/26/10 7:20 1,689,870 34.07 25,635
Storm 0.323 243 10/26/10 7:30 10/27/10 13:30 1,633,430 32.94 24,778
Base Grab 11/2/2010 8:50 11/2/2010 8:50 0.029 9 10/27/10 13:40 11/9/10 22:00 4,089,470 7.40 2,298
Storm 0.323 243 11/9/10 22:10 11/10/10 1:40 266,732 5.38 4,046
Base 0.060 13 11/10/10 1:50 11/11/10 10:10 526,092 1.97 427
Storm 0.323 243 11/11/10 10:20 11/11/10 16:40 812,657 16.39 12,328
Base 0.060 13 11/11/10 16:50 11/11/10 20:00 43,094 0.16 35
Storm 0.323 243 11/11/10 20:10 11/12/10 2:00 1,196,730 24.13 18,154
Base 0.060 13 11/12/10 2:10 11/13/10 12:50 637,556 2.39 517
Storm 0.323 243 11/13/10 13:00 11/14/10 17:50 1,227,930 24.76 18,627
Base 0.060 13 11/14/10 18:00 11/19/10 9:20 1,764,370 6.61 1,432
Storm 0.323 243 11/19/10 9:30 11/19/10 22:40 527,682 10.64 8,005
Base 0.060 13 11/16/10 22:50 11/28/10 17:20 3,664,430 13.73 2,974
Storm 0.323 243 11/28/10 17:30 11/28/10 19:50 110,536 2.23 1,677
Base 0.060 13 11/28/10 20:00 11/29/10 13:10 242,730 0.91 197
Storm 0.323 243 11/29/10 13:20 11/30/10 8:30 1,487,590 30.00 22,566
Capitol Region Watershed District 2010 Monitoring Report 126
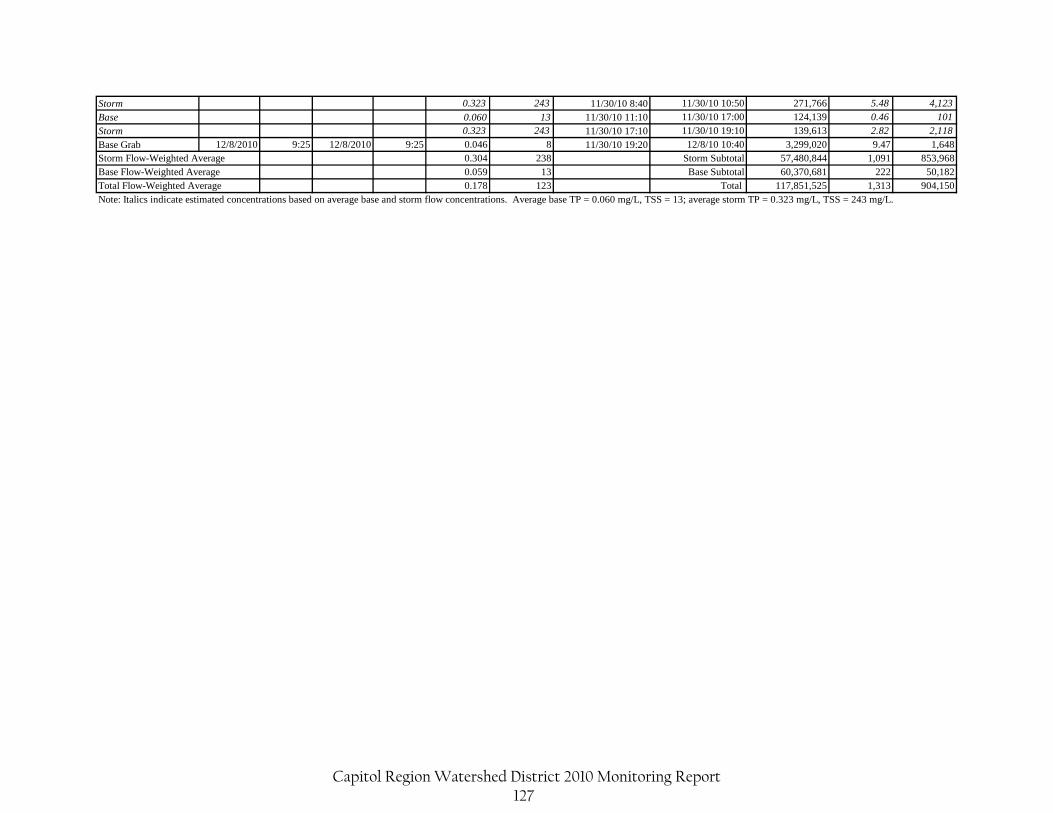
Storm 0.323 243 11/30/10 8:40 11/30/10 10:50 271,766 5.48 4,123
Base 0.060 13 11/30/10 11:10 11/30/10 17:00 124,139 0.46 101
Storm 0.323 243 11/30/10 17:10 11/30/10 19:10 139,613 2.82 2,118
Base Grab 12/8/2010 9:25 12/8/2010 9:25 0.046 8 11/30/10 19:20 12/8/10 10:40 3,299,020 9.47 1,6480.304 238 Storm Subtotal 57,480,844 1,091 853,9680.059 13 Base Subtotal 60,370,681 222 50,1820.178 123 Total 117,851,525 1,313 904,150
Note: Italics indicate estimated concentrations based on average base and storm flow concentrations. Average base TP = 0.060 mg/L, TSS = 13; average storm TP = 0.323 mg/L, TSS = 243 mg/L.Total Flow-Weighted Average
Storm Flow-Weighted AverageBase Flow-Weighted Average
Capitol Region Watershed District 2010 Monitoring Report 127
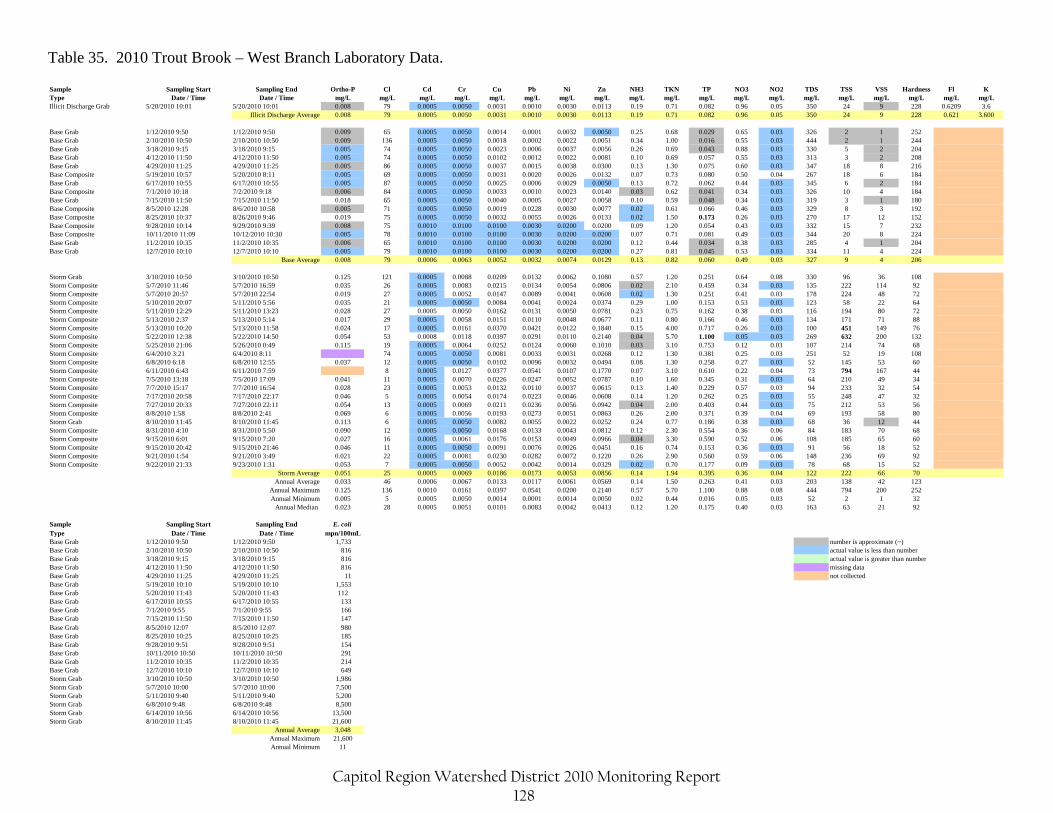
Table 35. 2010 Trout Brook – West Branch Laboratory Data. Sample Sampling Start Sampling End Ortho-P Cl Cd Cr Cu Pb Ni Zn NH3 TKN TP NO3 NO2 TDS TSS VSS Hardness Fl KType Date / Time Date / Time mg/L mg/L mg/L mg/L mg/L mg/L mg/L mg/L mg/L mg/L mg/L mg/L mg/L mg/L mg/L mg/L mg/L mg/L mg/LIllicit Discharge Grab 5/20/2010 10:01 5/20/2010 10:01 0.008 79 0.0005 0.0050 0.0031 0.0010 0.0030 0.0113 0.19 0.71 0.082 0.96 0.05 350 24 9 228 0.6209 3.6
Illicit Discharge Average 0.008 79 0.0005 0.0050 0.0031 0.0010 0.0030 0.0113 0.19 0.71 0.082 0.96 0.05 350 24 9 228 0.621 3.600
Base Grab 1/12/2010 9:50 1/12/2010 9:50 0.009 65 0.0005 0.0050 0.0014 0.0001 0.0032 0.0050 0.25 0.68 0.029 0.65 0.03 326 2 1 252Base Grab 2/10/2010 10:50 2/10/2010 10:50 0.009 136 0.0005 0.0050 0.0018 0.0002 0.0022 0.0051 0.34 1.00 0.016 0.55 0.03 444 2 1 244Base Grab 3/18/2010 9:15 3/18/2010 9:15 0.005 74 0.0005 0.0050 0.0023 0.0006 0.0037 0.0056 0.26 0.69 0.043 0.88 0.03 330 5 2 204Base Grab 4/12/2010 11:50 4/12/2010 11:50 0.005 74 0.0005 0.0050 0.0102 0.0012 0.0022 0.0081 0.10 0.69 0.057 0.55 0.03 313 3 2 208Base Grab 4/29/2010 11:25 4/29/2010 11:25 0.005 86 0.0005 0.0050 0.0037 0.0015 0.0038 0.0300 0.13 1.30 0.075 0.60 0.03 347 18 8 216Base Composite 5/19/2010 10:57 5/20/2010 8:11 0.005 69 0.0005 0.0050 0.0031 0.0020 0.0026 0.0132 0.07 0.73 0.080 0.50 0.04 267 18 6 184Base Grab 6/17/2010 10:55 6/17/2010 10:55 0.005 87 0.0005 0.0050 0.0025 0.0006 0.0029 0.0050 0.13 0.72 0.062 0.44 0.03 345 6 2 184Base Composite 7/1/2010 10:18 7/2/2010 9:18 0.006 84 0.0005 0.0050 0.0033 0.0010 0.0023 0.0140 0.03 0.62 0.041 0.34 0.03 326 10 4 184Base Grab 7/15/2010 11:50 7/15/2010 11:50 0.018 65 0.0005 0.0050 0.0040 0.0005 0.0027 0.0058 0.10 0.59 0.048 0.34 0.03 319 3 1 180Base Composite 8/5/2010 12:28 8/6/2010 10:58 0.005 71 0.0005 0.0050 0.0019 0.0228 0.0030 0.0077 0.02 0.61 0.066 0.46 0.03 329 8 3 192Base Composite 8/25/2010 10:37 8/26/2010 9:46 0.019 75 0.0005 0.0050 0.0032 0.0055 0.0026 0.0133 0.02 1.50 0.173 0.26 0.03 270 17 12 152Base Composite 9/28/2010 10:14 9/29/2010 9:39 0.008 75 0.0010 0.0100 0.0100 0.0030 0.0200 0.0200 0.09 1.20 0.054 0.43 0.03 332 15 7 232Base Composite 10/11/2010 11:09 10/12/2010 10:30 0.005 78 0.0010 0.0100 0.0100 0.0030 0.0200 0.0200 0.07 0.71 0.081 0.49 0.03 344 20 8 224Base Grab 11/2/2010 10:35 11/2/2010 10:35 0.006 65 0.0010 0.0100 0.0100 0.0030 0.0200 0.0200 0.12 0.44 0.034 0.38 0.03 285 4 1 204Base Grab 12/7/2010 10:10 12/7/2010 10:10 0.005 79 0.0010 0.0100 0.0100 0.0030 0.0200 0.0200 0.27 0.81 0.045 0.53 0.03 334 11 4 224
Base Average 0.008 79 0.0006 0.0063 0.0052 0.0032 0.0074 0.0129 0.13 0.82 0.060 0.49 0.03 327 9 4 206
Storm Grab 3/10/2010 10:50 3/10/2010 10:50 0.125 121 0.0005 0.0088 0.0209 0.0132 0.0062 0.1080 0.57 1.20 0.251 0.64 0.08 330 96 36 108Storm Composite 5/7/2010 11:46 5/7/2010 16:59 0.035 26 0.0005 0.0083 0.0215 0.0134 0.0054 0.0806 0.02 2.10 0.459 0.34 0.03 135 222 114 92Storm Composite 5/7/2010 20:57 5/7/2010 22:54 0.019 27 0.0005 0.0052 0.0147 0.0089 0.0041 0.0608 0.02 1.30 0.251 0.41 0.03 178 224 48 72Storm Composite 5/10/2010 20:07 5/11/2010 5:56 0.035 21 0.0005 0.0050 0.0084 0.0041 0.0024 0.0374 0.29 1.00 0.153 0.53 0.03 123 58 22 64Storm Composite 5/11/2010 12:29 5/11/2010 13:23 0.028 27 0.0005 0.0050 0.0162 0.0131 0.0050 0.0781 0.23 0.75 0.162 0.38 0.03 116 194 80 72Storm Composite 5/13/2010 2:37 5/13/2010 5:14 0.017 29 0.0005 0.0058 0.0151 0.0110 0.0048 0.0677 0.11 0.80 0.166 0.46 0.03 134 171 71 88Storm Composite 5/13/2010 10:20 5/13/2010 11:58 0.024 17 0.0005 0.0161 0.0370 0.0421 0.0122 0.1840 0.15 4.00 0.717 0.26 0.03 100 451 149 76Storm Composite 5/22/2010 12:38 5/22/2010 14:50 0.054 53 0.0008 0.0118 0.0397 0.0291 0.0110 0.2140 0.04 5.70 1.100 0.05 0.03 269 632 200 132Storm Composite 5/25/2010 21:06 5/26/2010 0:49 0.115 19 0.0005 0.0064 0.0252 0.0124 0.0060 0.1010 0.03 3.10 0.753 0.12 0.03 107 214 74 68Storm Composite 6/4/2010 3:21 6/4/2010 8:11 74 0.0005 0.0050 0.0081 0.0033 0.0031 0.0268 0.12 1.30 0.381 0.25 0.03 251 52 19 108Storm Composite 6/8/2010 6:18 6/8/2010 12:55 0.037 12 0.0005 0.0050 0.0102 0.0096 0.0032 0.0494 0.08 1.30 0.258 0.27 0.03 52 145 53 60Storm Composite 6/11/2010 6:43 6/11/2010 7:59 8 0.0005 0.0127 0.0377 0.0541 0.0107 0.1770 0.07 3.10 0.610 0.22 0.04 73 794 167 44Storm Composite 7/5/2010 13:18 7/5/2010 17:09 0.041 11 0.0005 0.0070 0.0226 0.0247 0.0052 0.0787 0.10 1.60 0.345 0.31 0.03 64 210 49 34Storm Composite 7/7/2010 15:17 7/7/2010 16:54 0.028 23 0.0005 0.0053 0.0132 0.0110 0.0037 0.0615 0.13 1.40 0.229 0.57 0.03 94 233 32 54Storm Composite 7/17/2010 20:58 7/17/2010 22:17 0.046 5 0.0005 0.0054 0.0174 0.0223 0.0046 0.0608 0.14 1.20 0.262 0.25 0.03 55 248 47 32Storm Composite 7/27/2010 20:33 7/27/2010 22:11 0.054 13 0.0005 0.0069 0.0211 0.0236 0.0056 0.0942 0.04 2.00 0.403 0.44 0.03 75 212 53 56Storm Composite 8/8/2010 1:58 8/8/2010 2:41 0.069 6 0.0005 0.0056 0.0193 0.0273 0.0051 0.0863 0.26 2.00 0.371 0.39 0.04 69 193 58 80Storm Grab 8/10/2010 11:45 8/10/2010 11:45 0.113 6 0.0005 0.0050 0.0082 0.0055 0.0022 0.0252 0.24 0.77 0.186 0.38 0.03 68 36 12 44Storm Composite 8/31/2010 4:10 8/31/2010 5:50 0.090 12 0.0005 0.0050 0.0168 0.0133 0.0043 0.0812 0.12 2.30 0.554 0.36 0.06 84 183 70 68Storm Composite 9/15/2010 6:01 9/15/2010 7:20 0.027 16 0.0005 0.0061 0.0176 0.0153 0.0049 0.0966 0.04 3.30 0.590 0.52 0.06 108 185 65 60Storm Composite 9/15/2010 20:42 9/15/2010 21:46 0.046 11 0.0005 0.0050 0.0091 0.0076 0.0026 0.0451 0.16 0.74 0.153 0.36 0.03 91 56 18 52Storm Composite 9/21/2010 1:54 9/21/2010 3:49 0.021 22 0.0005 0.0081 0.0230 0.0282 0.0072 0.1220 0.26 2.90 0.560 0.59 0.06 148 236 69 92Storm Composite 9/22/2010 21:33 9/23/2010 1:31 0.053 7 0.0005 0.0050 0.0052 0.0042 0.0014 0.0329 0.02 0.70 0.177 0.09 0.03 78 68 15 52
Storm Average 0.051 25 0.0005 0.0069 0.0186 0.0173 0.0053 0.0856 0.14 1.94 0.395 0.36 0.04 122 222 66 70Annual Average 0.033 46 0.0006 0.0067 0.0133 0.0117 0.0061 0.0569 0.14 1.50 0.263 0.41 0.03 203 138 42 123
Annual Maximum 0.125 136 0.0010 0.0161 0.0397 0.0541 0.0200 0.2140 0.57 5.70 1.100 0.88 0.08 444 794 200 252Annual Minimum 0.005 5 0.0005 0.0050 0.0014 0.0001 0.0014 0.0050 0.02 0.44 0.016 0.05 0.03 52 2 1 32
Annual Median 0.023 28 0.0005 0.0051 0.0101 0.0083 0.0042 0.0413 0.12 1.20 0.175 0.40 0.03 163 63 21 92
Sample Sampling Start Sampling End E. coliType Date / Time Date / Time mpn/100mLBase Grab 1/12/2010 9:50 1/12/2010 9:50 1,733 number is approximate (~)Base Grab 2/10/2010 10:50 2/10/2010 10:50 816 actual value is less than numberBase Grab 3/18/2010 9:15 3/18/2010 9:15 816 actual value is greater than numberBase Grab 4/12/2010 11:50 4/12/2010 11:50 816 missing dataBase Grab 4/29/2010 11:25 4/29/2010 11:25 11 not collectedBase Grab 5/19/2010 10:10 5/19/2010 10:10 1,553Base Grab 5/20/2010 11:43 5/20/2010 11:43 112Base Grab 6/17/2010 10:55 6/17/2010 10:55 133Base Grab 7/1/2010 9:55 7/1/2010 9:55 166Base Grab 7/15/2010 11:50 7/15/2010 11:50 147Base Grab 8/5/2010 12:07 8/5/2010 12:07 980Base Grab 8/25/2010 10:25 8/25/2010 10:25 185Base Grab 9/28/2010 9:51 9/28/2010 9:51 154Base Grab 10/11/2010 10:50 10/11/2010 10:50 291Base Grab 11/2/2010 10:35 11/2/2010 10:35 214Base Grab 12/7/2010 10:10 12/7/2010 10:10 649Storm Grab 3/10/2010 10:50 3/10/2010 10:50 1,986Storm Grab 5/7/2010 10:00 5/7/2010 10:00 7,500Storm Grab 5/11/2010 9:40 5/11/2010 9:40 5,200Storm Grab 6/8/2010 9:48 6/8/2010 9:48 8,500Storm Grab 6/14/2010 10:56 6/14/2010 10:56 13,500Storm Grab 8/10/2010 11:45 8/10/2010 11:45 21,600
Annual Average 3,048Annual Maximum 21,600Annual Minimum 11
Capitol Region Watershed District 2010 Monitoring Report 128
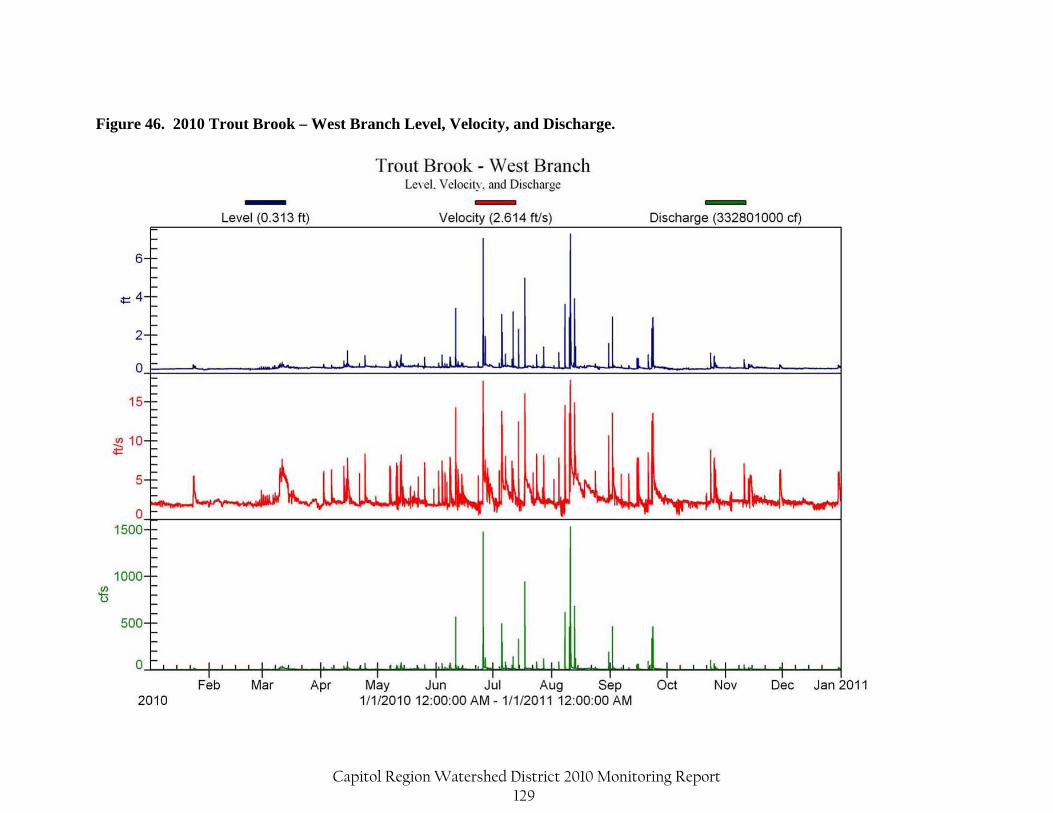
Figure 46. 2010 Trout Brook – West Branch Level, Velocity, and Discharge.
Capitol Region Watershed District 2010 Monitoring Report 129
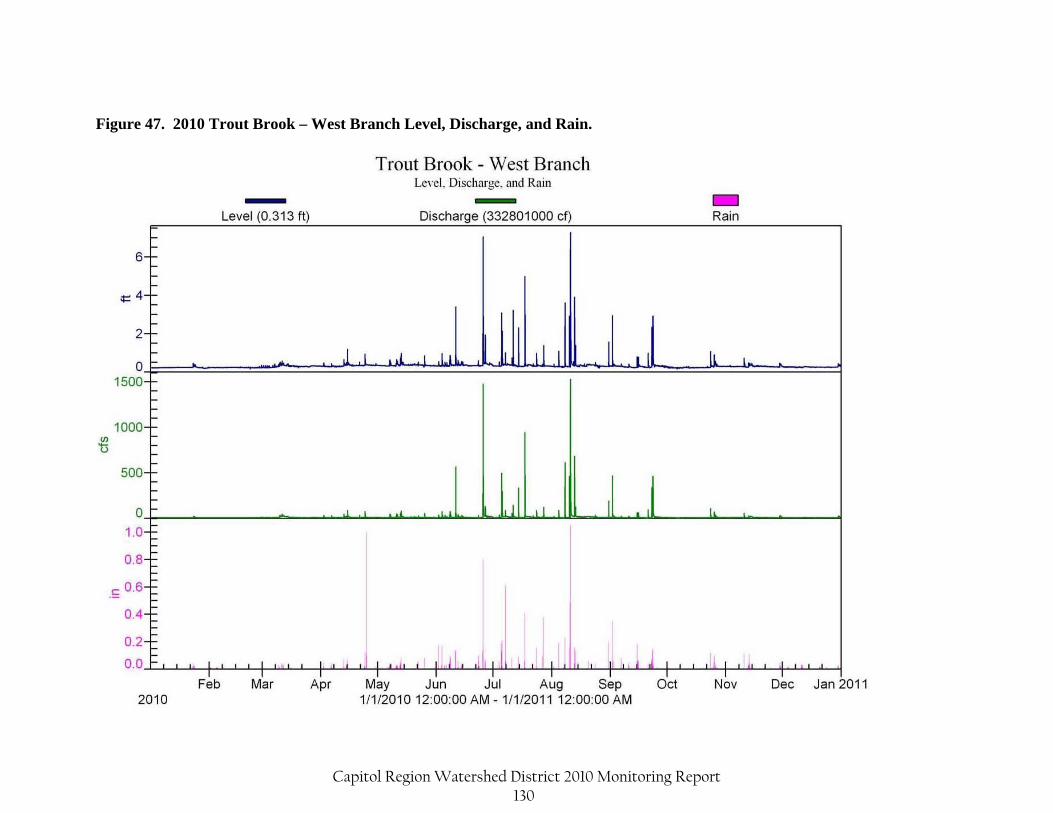
Figure 47. 2010 Trout Brook – West Branch Level, Discharge, and Rain.
Capitol Region Watershed District 2010 Monitoring Report 130
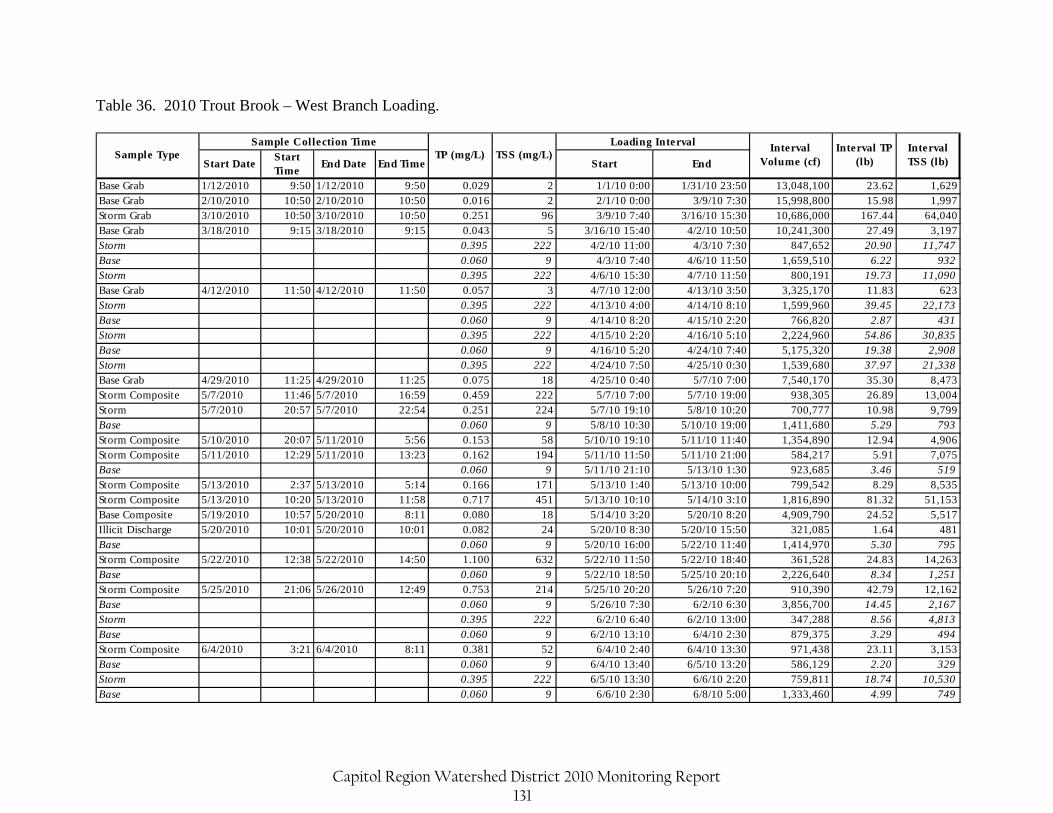
Table 36. 2010 Trout Brook – West Branch Loading.
Start DateStart Time
End Date End Time Start End
Base Grab 1/12/2010 9:50 1/12/2010 9:50 0.029 2 1/1/10 0:00 1/31/10 23:50 13,048,100 23.62 1,629Base Grab 2/10/2010 10:50 2/10/2010 10:50 0.016 2 2/1/10 0:00 3/9/10 7:30 15,998,800 15.98 1,997Storm Grab 3/10/2010 10:50 3/10/2010 10:50 0.251 96 3/9/10 7:40 3/16/10 15:30 10,686,000 167.44 64,040Base Grab 3/18/2010 9:15 3/18/2010 9:15 0.043 5 3/16/10 15:40 4/2/10 10:50 10,241,300 27.49 3,197Storm 0.395 222 4/2/10 11:00 4/3/10 7:30 847,652 20.90 11,747Base 0.060 9 4/3/10 7:40 4/6/10 11:50 1,659,510 6.22 932Storm 0.395 222 4/6/10 15:30 4/7/10 11:50 800,191 19.73 11,090Base Grab 4/12/2010 11:50 4/12/2010 11:50 0.057 3 4/7/10 12:00 4/13/10 3:50 3,325,170 11.83 623Storm 0.395 222 4/13/10 4:00 4/14/10 8:10 1,599,960 39.45 22,173Base 0.060 9 4/14/10 8:20 4/15/10 2:20 766,820 2.87 431Storm 0.395 222 4/15/10 2:20 4/16/10 5:10 2,224,960 54.86 30,835Base 0.060 9 4/16/10 5:20 4/24/10 7:40 5,175,320 19.38 2,908Storm 0.395 222 4/24/10 7:50 4/25/10 0:30 1,539,680 37.97 21,338Base Grab 4/29/2010 11:25 4/29/2010 11:25 0.075 18 4/25/10 0:40 5/7/10 7:00 7,540,170 35.30 8,473Storm Composite 5/7/2010 11:46 5/7/2010 16:59 0.459 222 5/7/10 7:00 5/7/10 19:00 938,305 26.89 13,004Storm 5/7/2010 20:57 5/7/2010 22:54 0.251 224 5/7/10 19:10 5/8/10 10:20 700,777 10.98 9,799Base 0.060 9 5/8/10 10:30 5/10/10 19:00 1,411,680 5.29 793Storm Composite 5/10/2010 20:07 5/11/2010 5:56 0.153 58 5/10/10 19:10 5/11/10 11:40 1,354,890 12.94 4,906Storm Composite 5/11/2010 12:29 5/11/2010 13:23 0.162 194 5/11/10 11:50 5/11/10 21:00 584,217 5.91 7,075Base 0.060 9 5/11/10 21:10 5/13/10 1:30 923,685 3.46 519Storm Composite 5/13/2010 2:37 5/13/2010 5:14 0.166 171 5/13/10 1:40 5/13/10 10:00 799,542 8.29 8,535Storm Composite 5/13/2010 10:20 5/13/2010 11:58 0.717 451 5/13/10 10:10 5/14/10 3:10 1,816,890 81.32 51,153Base Composite 5/19/2010 10:57 5/20/2010 8:11 0.080 18 5/14/10 3:20 5/20/10 8:20 4,909,790 24.52 5,517Illicit Discharge 5/20/2010 10:01 5/20/2010 10:01 0.082 24 5/20/10 8:30 5/20/10 15:50 321,085 1.64 481Base 0.060 9 5/20/10 16:00 5/22/10 11:40 1,414,970 5.30 795Storm Composite 5/22/2010 12:38 5/22/2010 14:50 1.100 632 5/22/10 11:50 5/22/10 18:40 361,528 24.83 14,263Base 0.060 9 5/22/10 18:50 5/25/10 20:10 2,226,640 8.34 1,251Storm Composite 5/25/2010 21:06 5/26/2010 12:49 0.753 214 5/25/10 20:20 5/26/10 7:20 910,390 42.79 12,162Base 0.060 9 5/26/10 7:30 6/2/10 6:30 3,856,700 14.45 2,167Storm 0.395 222 6/2/10 6:40 6/2/10 13:00 347,288 8.56 4,813Base 0.060 9 6/2/10 13:10 6/4/10 2:30 879,375 3.29 494Storm Composite 6/4/2010 3:21 6/4/2010 8:11 0.381 52 6/4/10 2:40 6/4/10 13:30 971,438 23.11 3,153Base 0.060 9 6/4/10 13:40 6/5/10 13:20 586,129 2.20 329Storm 0.395 222 6/5/10 13:30 6/6/10 2:20 759,811 18.74 10,530Base 0.060 9 6/6/10 2:30 6/8/10 5:00 1,333,460 4.99 749
Sample TypeInterval
Volume (cf)Interval TP
(lb)Interval TSS (lb)
TP (mg/L) TSS (mg/L)Sample Collection Time Loading Interval
Capitol Region Watershed District 2010 Monitoring Report 131
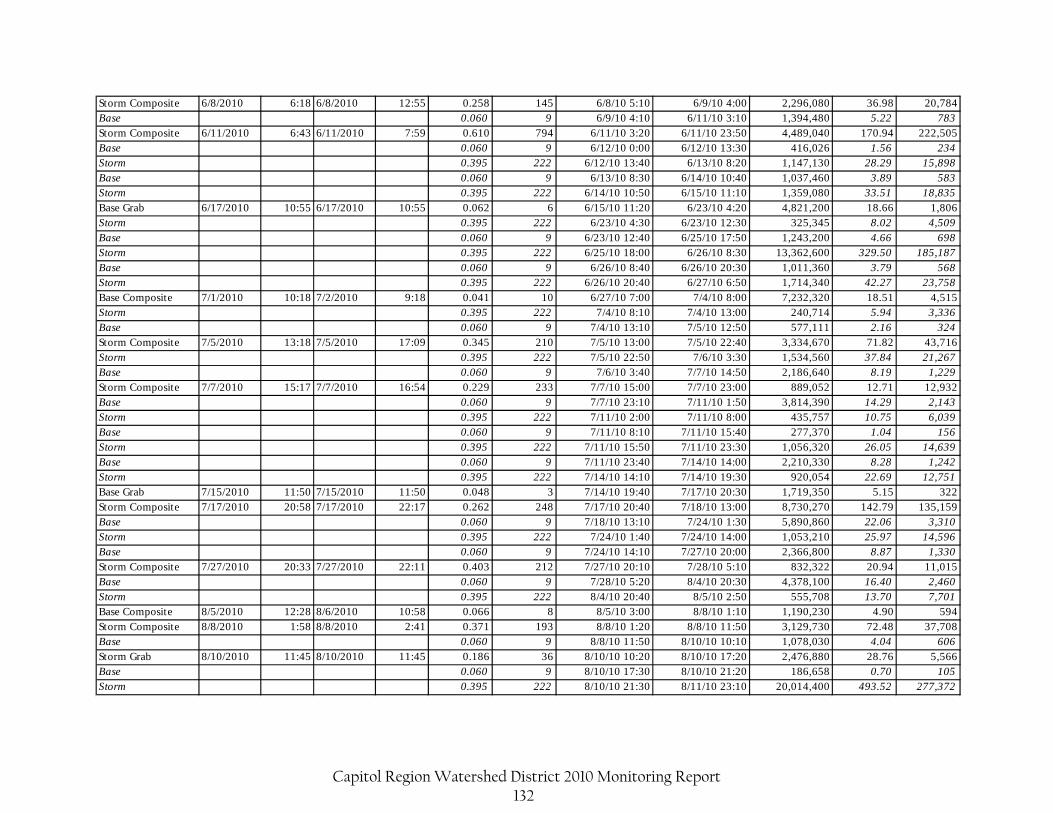
Storm Composite 6/8/2010 6:18 6/8/2010 12:55 0.258 145 6/8/10 5:10 6/9/10 4:00 2,296,080 36.98 20,784Base 0.060 9 6/9/10 4:10 6/11/10 3:10 1,394,480 5.22 783Storm Composite 6/11/2010 6:43 6/11/2010 7:59 0.610 794 6/11/10 3:20 6/11/10 23:50 4,489,040 170.94 222,505Base 0.060 9 6/12/10 0:00 6/12/10 13:30 416,026 1.56 234Storm 0.395 222 6/12/10 13:40 6/13/10 8:20 1,147,130 28.29 15,898Base 0.060 9 6/13/10 8:30 6/14/10 10:40 1,037,460 3.89 583Storm 0.395 222 6/14/10 10:50 6/15/10 11:10 1,359,080 33.51 18,835Base Grab 6/17/2010 10:55 6/17/2010 10:55 0.062 6 6/15/10 11:20 6/23/10 4:20 4,821,200 18.66 1,806Storm 0.395 222 6/23/10 4:30 6/23/10 12:30 325,345 8.02 4,509Base 0.060 9 6/23/10 12:40 6/25/10 17:50 1,243,200 4.66 698Storm 0.395 222 6/25/10 18:00 6/26/10 8:30 13,362,600 329.50 185,187Base 0.060 9 6/26/10 8:40 6/26/10 20:30 1,011,360 3.79 568Storm 0.395 222 6/26/10 20:40 6/27/10 6:50 1,714,340 42.27 23,758Base Composite 7/1/2010 10:18 7/2/2010 9:18 0.041 10 6/27/10 7:00 7/4/10 8:00 7,232,320 18.51 4,515Storm 0.395 222 7/4/10 8:10 7/4/10 13:00 240,714 5.94 3,336Base 0.060 9 7/4/10 13:10 7/5/10 12:50 577,111 2.16 324Storm Composite 7/5/2010 13:18 7/5/2010 17:09 0.345 210 7/5/10 13:00 7/5/10 22:40 3,334,670 71.82 43,716Storm 0.395 222 7/5/10 22:50 7/6/10 3:30 1,534,560 37.84 21,267Base 0.060 9 7/6/10 3:40 7/7/10 14:50 2,186,640 8.19 1,229Storm Composite 7/7/2010 15:17 7/7/2010 16:54 0.229 233 7/7/10 15:00 7/7/10 23:00 889,052 12.71 12,932Base 0.060 9 7/7/10 23:10 7/11/10 1:50 3,814,390 14.29 2,143Storm 0.395 222 7/11/10 2:00 7/11/10 8:00 435,757 10.75 6,039Base 0.060 9 7/11/10 8:10 7/11/10 15:40 277,370 1.04 156Storm 0.395 222 7/11/10 15:50 7/11/10 23:30 1,056,320 26.05 14,639Base 0.060 9 7/11/10 23:40 7/14/10 14:00 2,210,330 8.28 1,242Storm 0.395 222 7/14/10 14:10 7/14/10 19:30 920,054 22.69 12,751Base Grab 7/15/2010 11:50 7/15/2010 11:50 0.048 3 7/14/10 19:40 7/17/10 20:30 1,719,350 5.15 322Storm Composite 7/17/2010 20:58 7/17/2010 22:17 0.262 248 7/17/10 20:40 7/18/10 13:00 8,730,270 142.79 135,159Base 0.060 9 7/18/10 13:10 7/24/10 1:30 5,890,860 22.06 3,310Storm 0.395 222 7/24/10 1:40 7/24/10 14:00 1,053,210 25.97 14,596Base 0.060 9 7/24/10 14:10 7/27/10 20:00 2,366,800 8.87 1,330Storm Composite 7/27/2010 20:33 7/27/2010 22:11 0.403 212 7/27/10 20:10 7/28/10 5:10 832,322 20.94 11,015Base 0.060 9 7/28/10 5:20 8/4/10 20:30 4,378,100 16.40 2,460Storm 0.395 222 8/4/10 20:40 8/5/10 2:50 555,708 13.70 7,701Base Composite 8/5/2010 12:28 8/6/2010 10:58 0.066 8 8/5/10 3:00 8/8/10 1:10 1,190,230 4.90 594Storm Composite 8/8/2010 1:58 8/8/2010 2:41 0.371 193 8/8/10 1:20 8/8/10 11:50 3,129,730 72.48 37,708Base 0.060 9 8/8/10 11:50 8/10/10 10:10 1,078,030 4.04 606Storm Grab 8/10/2010 11:45 8/10/2010 11:45 0.186 36 8/10/10 10:20 8/10/10 17:20 2,476,880 28.76 5,566Base 0.060 9 8/10/10 17:30 8/10/10 21:20 186,658 0.70 105Storm 0.395 222 8/10/10 21:30 8/11/10 23:10 20,014,400 493.52 277,372
Capitol Region Watershed District 2010 Monitoring Report 132
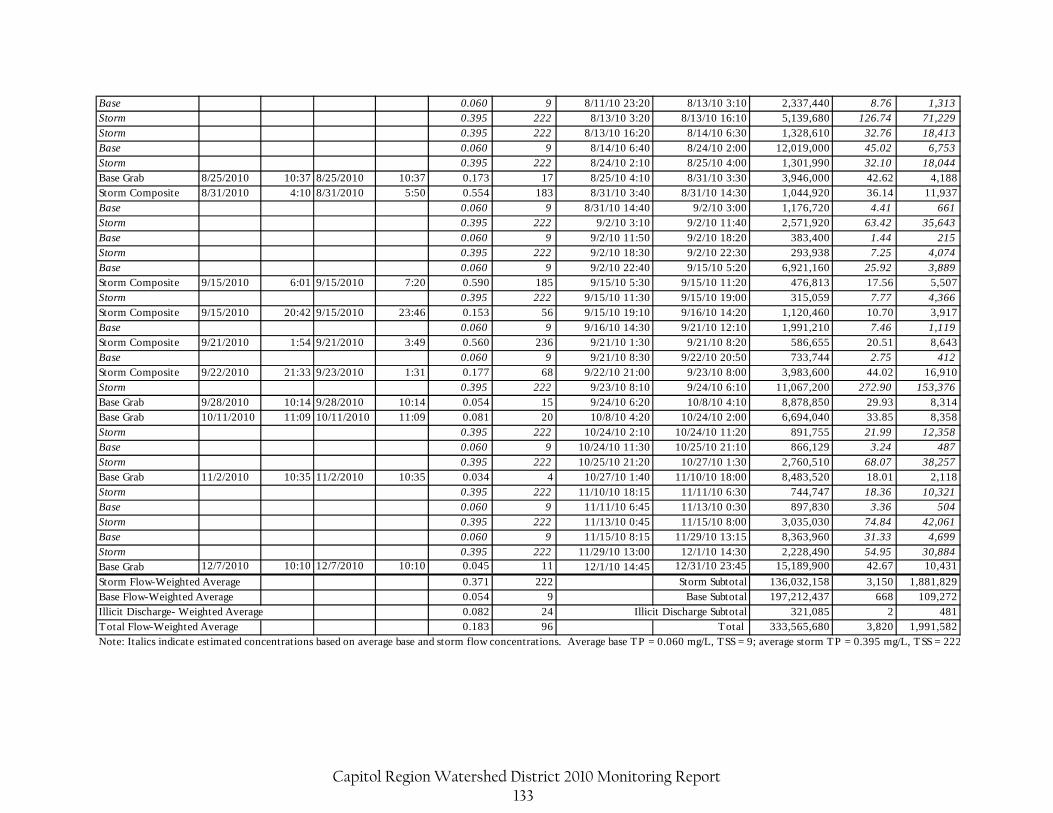
Base 0.060 9 8/11/10 23:20 8/13/10 3:10 2,337,440 8.76 1,313Storm 0.395 222 8/13/10 3:20 8/13/10 16:10 5,139,680 126.74 71,229Storm 0.395 222 8/13/10 16:20 8/14/10 6:30 1,328,610 32.76 18,413Base 0.060 9 8/14/10 6:40 8/24/10 2:00 12,019,000 45.02 6,753Storm 0.395 222 8/24/10 2:10 8/25/10 4:00 1,301,990 32.10 18,044Base Grab 8/25/2010 10:37 8/25/2010 10:37 0.173 17 8/25/10 4:10 8/31/10 3:30 3,946,000 42.62 4,188Storm Composite 8/31/2010 4:10 8/31/2010 5:50 0.554 183 8/31/10 3:40 8/31/10 14:30 1,044,920 36.14 11,937Base 0.060 9 8/31/10 14:40 9/2/10 3:00 1,176,720 4.41 661Storm 0.395 222 9/2/10 3:10 9/2/10 11:40 2,571,920 63.42 35,643Base 0.060 9 9/2/10 11:50 9/2/10 18:20 383,400 1.44 215Storm 0.395 222 9/2/10 18:30 9/2/10 22:30 293,938 7.25 4,074Base 0.060 9 9/2/10 22:40 9/15/10 5:20 6,921,160 25.92 3,889Storm Composite 9/15/2010 6:01 9/15/2010 7:20 0.590 185 9/15/10 5:30 9/15/10 11:20 476,813 17.56 5,507Storm 0.395 222 9/15/10 11:30 9/15/10 19:00 315,059 7.77 4,366Storm Composite 9/15/2010 20:42 9/15/2010 23:46 0.153 56 9/15/10 19:10 9/16/10 14:20 1,120,460 10.70 3,917Base 0.060 9 9/16/10 14:30 9/21/10 12:10 1,991,210 7.46 1,119Storm Composite 9/21/2010 1:54 9/21/2010 3:49 0.560 236 9/21/10 1:30 9/21/10 8:20 586,655 20.51 8,643Base 0.060 9 9/21/10 8:30 9/22/10 20:50 733,744 2.75 412Storm Composite 9/22/2010 21:33 9/23/2010 1:31 0.177 68 9/22/10 21:00 9/23/10 8:00 3,983,600 44.02 16,910Storm 0.395 222 9/23/10 8:10 9/24/10 6:10 11,067,200 272.90 153,376Base Grab 9/28/2010 10:14 9/28/2010 10:14 0.054 15 9/24/10 6:20 10/8/10 4:10 8,878,850 29.93 8,314Base Grab 10/11/2010 11:09 10/11/2010 11:09 0.081 20 10/8/10 4:20 10/24/10 2:00 6,694,040 33.85 8,358Storm 0.395 222 10/24/10 2:10 10/24/10 11:20 891,755 21.99 12,358Base 0.060 9 10/24/10 11:30 10/25/10 21:10 866,129 3.24 487Storm 0.395 222 10/25/10 21:20 10/27/10 1:30 2,760,510 68.07 38,257Base Grab 11/2/2010 10:35 11/2/2010 10:35 0.034 4 10/27/10 1:40 11/10/10 18:00 8,483,520 18.01 2,118Storm 0.395 222 11/10/10 18:15 11/11/10 6:30 744,747 18.36 10,321Base 0.060 9 11/11/10 6:45 11/13/10 0:30 897,830 3.36 504Storm 0.395 222 11/13/10 0:45 11/15/10 8:00 3,035,030 74.84 42,061Base 0.060 9 11/15/10 8:15 11/29/10 13:15 8,363,960 31.33 4,699Storm 0.395 222 11/29/10 13:00 12/1/10 14:30 2,228,490 54.95 30,884Base Grab 12/7/2010 10:10 12/7/2010 10:10 0.045 11 12/1/10 14:45 12/31/10 23:45 15,189,900 42.67 10,431
0.371 222 Storm Subtotal 136,032,158 3,150 1,881,8290.054 9 Base Subtotal 197,212,437 668 109,272
Illicit Discharge- Weighted Average 0.082 24 Illicit Discharge Subtotal 321,085 2 4810.183 96 Total 333,565,680 3,820 1,991,582
Note: Italics indicate estimated concentrations based on average base and storm flow concentrations. Average base TP = 0.060 mg/L, TSS = 9; average storm TP = 0.395 mg/L, TSS = 222Total Flow-Weighted Average
Storm Flow-Weighted AverageBase Flow-Weighted Average
Capitol Region Watershed District 2010 Monitoring Report 133
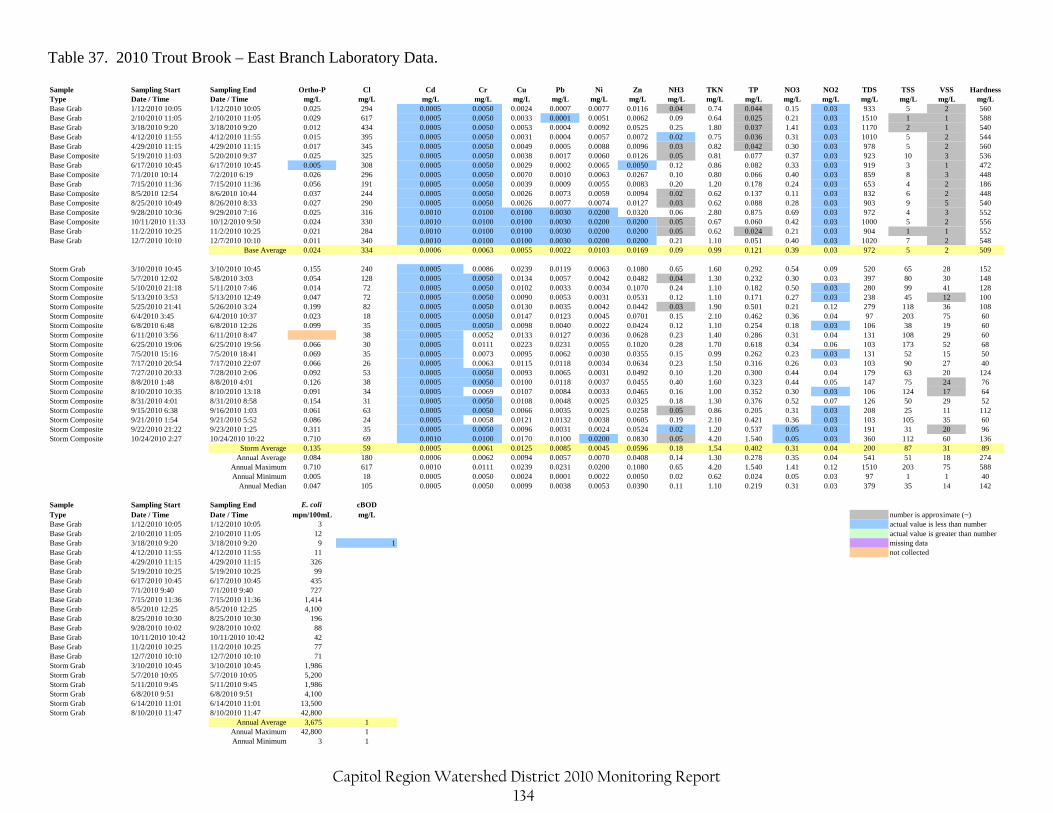
Table 37. 2010 Trout Brook – East Branch Laboratory Data. Sample Sampling Start Sampling End Ortho-P Cl Cd Cr Cu Pb Ni Zn NH3 TKN TP NO3 NO2 TDS TSS VSS HardnessType Date / Time Date / Time mg/L mg/L mg/L mg/L mg/L mg/L mg/L mg/L mg/L mg/L mg/L mg/L mg/L mg/L mg/L mg/L mg/LBase Grab 1/12/2010 10:05 1/12/2010 10:05 0.025 294 0.0005 0.0050 0.0024 0.0007 0.0077 0.0116 0.04 0.74 0.044 0.15 0.03 933 5 2 560Base Grab 2/10/2010 11:05 2/10/2010 11:05 0.029 617 0.0005 0.0050 0.0033 0.0001 0.0051 0.0062 0.09 0.64 0.025 0.21 0.03 1510 1 1 588Base Grab 3/18/2010 9:20 3/18/2010 9:20 0.012 434 0.0005 0.0050 0.0053 0.0004 0.0092 0.0525 0.25 1.80 0.037 1.41 0.03 1170 2 1 540Base Grab 4/12/2010 11:55 4/12/2010 11:55 0.015 395 0.0005 0.0050 0.0031 0.0004 0.0057 0.0072 0.02 0.75 0.036 0.31 0.03 1010 5 2 544Base Grab 4/29/2010 11:15 4/29/2010 11:15 0.017 345 0.0005 0.0050 0.0049 0.0005 0.0088 0.0096 0.03 0.82 0.042 0.30 0.03 978 5 2 560Base Composite 5/19/2010 11:03 5/20/2010 9:37 0.025 325 0.0005 0.0050 0.0038 0.0017 0.0060 0.0126 0.05 0.81 0.077 0.37 0.03 923 10 3 536Base Grab 6/17/2010 10:45 6/17/2010 10:45 0.005 308 0.0005 0.0050 0.0029 0.0002 0.0065 0.0050 0.12 0.86 0.082 0.33 0.03 919 3 1 472Base Composite 7/1/2010 10:14 7/2/2010 6:19 0.026 296 0.0005 0.0050 0.0070 0.0010 0.0063 0.0267 0.10 0.80 0.066 0.40 0.03 859 8 3 448Base Grab 7/15/2010 11:36 7/15/2010 11:36 0.056 191 0.0005 0.0050 0.0039 0.0009 0.0055 0.0083 0.20 1.20 0.178 0.24 0.03 653 4 2 186Base Composite 8/5/2010 12:54 8/6/2010 10:44 0.037 244 0.0005 0.0050 0.0026 0.0073 0.0059 0.0094 0.02 0.62 0.137 0.11 0.03 832 6 2 448Base Composite 8/25/2010 10:49 8/26/2010 8:33 0.027 290 0.0005 0.0050 0.0026 0.0077 0.0074 0.0127 0.03 0.62 0.088 0.28 0.03 903 9 5 540Base Composite 9/28/2010 10:36 9/29/2010 7:16 0.025 316 0.0010 0.0100 0.0100 0.0030 0.0200 0.0320 0.06 2.80 0.875 0.69 0.03 972 4 3 552Base Composite 10/11/2010 11:33 10/12/2010 9:50 0.024 330 0.0010 0.0100 0.0100 0.0030 0.0200 0.0200 0.05 0.67 0.060 0.42 0.03 1000 5 2 556Base Grab 11/2/2010 10:25 11/2/2010 10:25 0.021 284 0.0010 0.0100 0.0100 0.0030 0.0200 0.0200 0.05 0.62 0.024 0.21 0.03 904 1 1 552Base Grab 12/7/2010 10:10 12/7/2010 10:10 0.011 340 0.0010 0.0100 0.0100 0.0030 0.0200 0.0200 0.21 1.10 0.051 0.40 0.03 1020 7 2 548
Base Average 0.024 334 0.0006 0.0063 0.0055 0.0022 0.0103 0.0169 0.09 0.99 0.121 0.39 0.03 972 5 2 509
Storm Grab 3/10/2010 10:45 3/10/2010 10:45 0.155 240 0.0005 0.0086 0.0239 0.0119 0.0063 0.1080 0.65 1.60 0.292 0.54 0.09 520 65 28 152Storm Composite 5/7/2010 12:02 5/8/2010 3:03 0.054 128 0.0005 0.0050 0.0134 0.0057 0.0042 0.0482 0.04 1.30 0.232 0.30 0.03 397 80 30 148Storm Composite 5/10/2010 21:18 5/11/2010 7:46 0.014 72 0.0005 0.0050 0.0102 0.0033 0.0034 0.1070 0.24 1.10 0.182 0.50 0.03 280 99 41 128Storm Composite 5/13/2010 3:53 5/13/2010 12:49 0.047 72 0.0005 0.0050 0.0090 0.0053 0.0031 0.0531 0.12 1.10 0.171 0.27 0.03 238 45 12 100Storm Composite 5/25/2010 21:41 5/26/2010 3:24 0.199 82 0.0005 0.0050 0.0130 0.0035 0.0042 0.0442 0.03 1.90 0.501 0.21 0.12 279 118 36 108Storm Composite 6/4/2010 3:45 6/4/2010 10:37 0.023 18 0.0005 0.0050 0.0147 0.0123 0.0045 0.0701 0.15 2.10 0.462 0.36 0.04 97 203 75 60Storm Composite 6/8/2010 6:48 6/8/2010 12:26 0.099 35 0.0005 0.0050 0.0098 0.0040 0.0022 0.0424 0.12 1.10 0.254 0.18 0.03 106 38 19 60Storm Composite 6/11/2010 3:56 6/11/2010 8:47 38 0.0005 0.0052 0.0133 0.0127 0.0036 0.0628 0.23 1.40 0.286 0.31 0.04 131 108 29 60Storm Composite 6/25/2010 19:06 6/25/2010 19:56 0.066 30 0.0005 0.0111 0.0223 0.0231 0.0055 0.1020 0.28 1.70 0.618 0.34 0.06 103 173 52 68Storm Composite 7/5/2010 15:16 7/5/2010 18:41 0.069 35 0.0005 0.0073 0.0095 0.0062 0.0030 0.0355 0.15 0.99 0.262 0.23 0.03 131 52 15 50Storm Composite 7/17/2010 20:54 7/17/2010 22:07 0.066 26 0.0005 0.0063 0.0115 0.0118 0.0034 0.0634 0.23 1.50 0.316 0.26 0.03 103 90 27 40Storm Composite 7/27/2010 20:33 7/28/2010 2:06 0.092 53 0.0005 0.0050 0.0093 0.0065 0.0031 0.0492 0.10 1.20 0.300 0.44 0.04 179 63 20 124Storm Composite 8/8/2010 1:48 8/8/2010 4:01 0.126 38 0.0005 0.0050 0.0100 0.0118 0.0037 0.0455 0.40 1.60 0.323 0.44 0.05 147 75 24 76Storm Composite 8/10/2010 10:35 8/10/2010 13:18 0.091 34 0.0005 0.0069 0.0107 0.0084 0.0033 0.0465 0.16 1.00 0.352 0.30 0.03 106 124 17 64Storm Composite 8/31/2010 4:01 8/31/2010 8:58 0.154 31 0.0005 0.0050 0.0108 0.0048 0.0025 0.0325 0.18 1.30 0.376 0.52 0.07 126 50 29 52Storm Composite 9/15/2010 6:38 9/16/2010 1:03 0.061 63 0.0005 0.0050 0.0066 0.0035 0.0025 0.0258 0.05 0.86 0.205 0.31 0.03 208 25 11 112Storm Composite 9/21/2010 1:54 9/21/2010 5:52 0.086 24 0.0005 0.0058 0.0121 0.0132 0.0038 0.0605 0.19 2.10 0.421 0.36 0.03 103 105 35 60Storm Composite 9/22/2010 21:22 9/23/2010 1:25 0.311 35 0.0005 0.0050 0.0096 0.0031 0.0024 0.0524 0.02 1.20 0.537 0.05 0.03 191 31 20 96Storm Composite 10/24/2010 2:27 10/24/2010 10:22 0.710 69 0.0010 0.0100 0.0170 0.0100 0.0200 0.0830 0.05 4.20 1.540 0.05 0.03 360 112 60 136
Storm Average 0.135 59 0.0005 0.0061 0.0125 0.0085 0.0045 0.0596 0.18 1.54 0.402 0.31 0.04 200 87 31 89Annual Average 0.084 180 0.0006 0.0062 0.0094 0.0057 0.0070 0.0408 0.14 1.30 0.278 0.35 0.04 541 51 18 274
Annual Maximum 0.710 617 0.0010 0.0111 0.0239 0.0231 0.0200 0.1080 0.65 4.20 1.540 1.41 0.12 1510 203 75 588Annual Minimum 0.005 18 0.0005 0.0050 0.0024 0.0001 0.0022 0.0050 0.02 0.62 0.024 0.05 0.03 97 1 1 40
Annual Median 0.047 105 0.0005 0.0050 0.0099 0.0038 0.0053 0.0390 0.11 1.10 0.219 0.31 0.03 379 35 14 142
Sample Sampling Start Sampling End E. coli cBODType Date / Time Date / Time mpn/100mL mg/L number is approximate (~)Base Grab 1/12/2010 10:05 1/12/2010 10:05 3 actual value is less than numberBase Grab 2/10/2010 11:05 2/10/2010 11:05 12 actual value is greater than numberBase Grab 3/18/2010 9:20 3/18/2010 9:20 9 1 missing dataBase Grab 4/12/2010 11:55 4/12/2010 11:55 11 not collectedBase Grab 4/29/2010 11:15 4/29/2010 11:15 326Base Grab 5/19/2010 10:25 5/19/2010 10:25 99Base Grab 6/17/2010 10:45 6/17/2010 10:45 435Base Grab 7/1/2010 9:40 7/1/2010 9:40 727Base Grab 7/15/2010 11:36 7/15/2010 11:36 1,414Base Grab 8/5/2010 12:25 8/5/2010 12:25 4,100Base Grab 8/25/2010 10:30 8/25/2010 10:30 196Base Grab 9/28/2010 10:02 9/28/2010 10:02 88Base Grab 10/11/2010 10:42 10/11/2010 10:42 42Base Grab 11/2/2010 10:25 11/2/2010 10:25 77Base Grab 12/7/2010 10:10 12/7/2010 10:10 71Storm Grab 3/10/2010 10:45 3/10/2010 10:45 1,986Storm Grab 5/7/2010 10:05 5/7/2010 10:05 5,200Storm Grab 5/11/2010 9:45 5/11/2010 9:45 1,986Storm Grab 6/8/2010 9:51 6/8/2010 9:51 4,100Storm Grab 6/14/2010 11:01 6/14/2010 11:01 13,500Storm Grab 8/10/2010 11:47 8/10/2010 11:47 42,800
Annual Average 3,675 1Annual Maximum 42,800 1Annual Minimum 3 1
Capitol Region Watershed District 2010 Monitoring Report 134
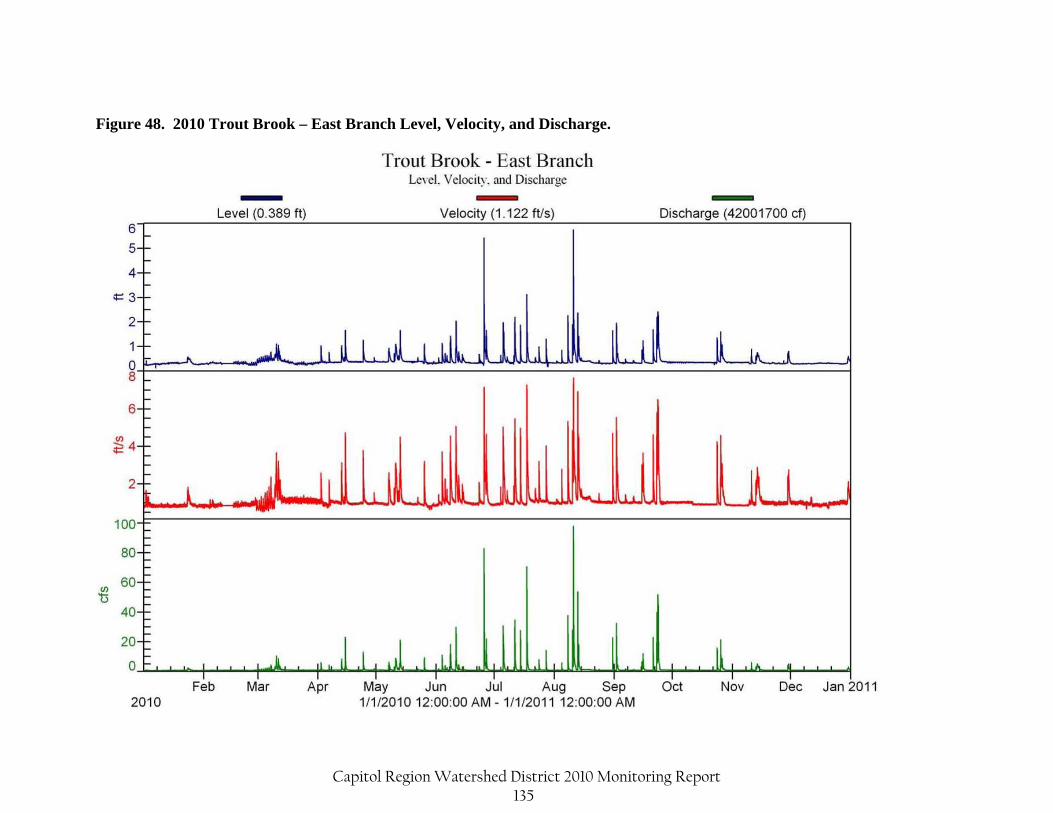
Figure 48. 2010 Trout Brook – East Branch Level, Velocity, and Discharge.
Capitol Region Watershed District 2010 Monitoring Report 135
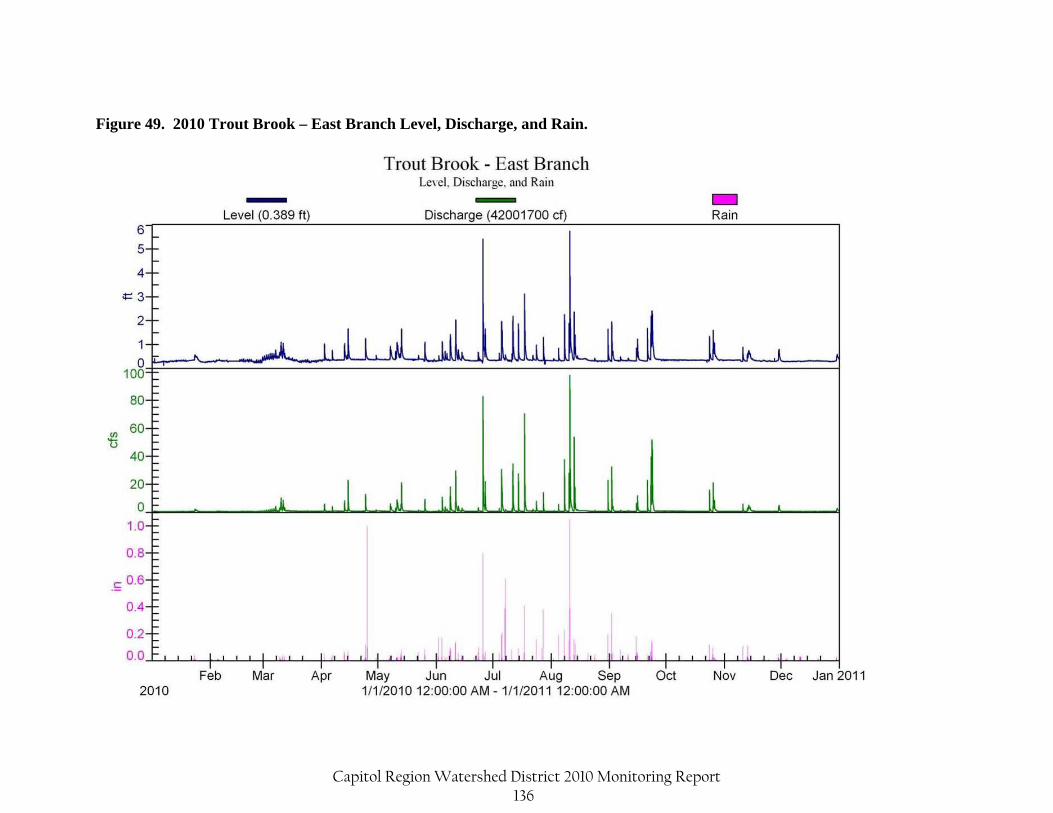
Figure 49. 2010 Trout Brook – East Branch Level, Discharge, and Rain.
Capitol Region Watershed District 2010 Monitoring Report 136
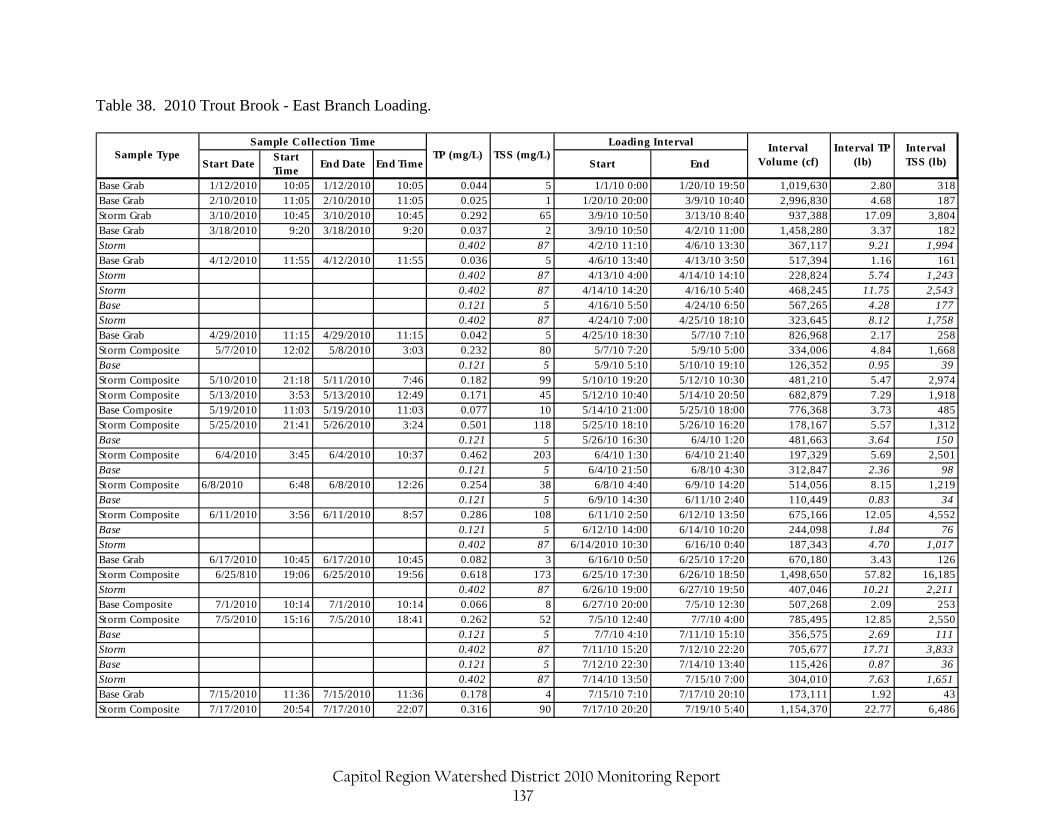
Table 38. 2010 Trout Brook - East Branch Loading.
Start DateStart Time
End Date End Time Start End
Base Grab 1/12/2010 10:05 1/12/2010 10:05 0.044 5 1/1/10 0:00 1/20/10 19:50 1,019,630 2.80 318Base Grab 2/10/2010 11:05 2/10/2010 11:05 0.025 1 1/20/10 20:00 3/9/10 10:40 2,996,830 4.68 187Storm Grab 3/10/2010 10:45 3/10/2010 10:45 0.292 65 3/9/10 10:50 3/13/10 8:40 937,388 17.09 3,804Base Grab 3/18/2010 9:20 3/18/2010 9:20 0.037 2 3/9/10 10:50 4/2/10 11:00 1,458,280 3.37 182Storm 0.402 87 4/2/10 11:10 4/6/10 13:30 367,117 9.21 1,994Base Grab 4/12/2010 11:55 4/12/2010 11:55 0.036 5 4/6/10 13:40 4/13/10 3:50 517,394 1.16 161Storm 0.402 87 4/13/10 4:00 4/14/10 14:10 228,824 5.74 1,243Storm 0.402 87 4/14/10 14:20 4/16/10 5:40 468,245 11.75 2,543Base 0.121 5 4/16/10 5:50 4/24/10 6:50 567,265 4.28 177Storm 0.402 87 4/24/10 7:00 4/25/10 18:10 323,645 8.12 1,758Base Grab 4/29/2010 11:15 4/29/2010 11:15 0.042 5 4/25/10 18:30 5/7/10 7:10 826,968 2.17 258Storm Composite 5/7/2010 12:02 5/8/2010 3:03 0.232 80 5/7/10 7:20 5/9/10 5:00 334,006 4.84 1,668Base 0.121 5 5/9/10 5:10 5/10/10 19:10 126,352 0.95 39Storm Composite 5/10/2010 21:18 5/11/2010 7:46 0.182 99 5/10/10 19:20 5/12/10 10:30 481,210 5.47 2,974Storm Composite 5/13/2010 3:53 5/13/2010 12:49 0.171 45 5/12/10 10:40 5/14/10 20:50 682,879 7.29 1,918Base Composite 5/19/2010 11:03 5/19/2010 11:03 0.077 10 5/14/10 21:00 5/25/10 18:00 776,368 3.73 485Storm Composite 5/25/2010 21:41 5/26/2010 3:24 0.501 118 5/25/10 18:10 5/26/10 16:20 178,167 5.57 1,312Base 0.121 5 5/26/10 16:30 6/4/10 1:20 481,663 3.64 150Storm Composite 6/4/2010 3:45 6/4/2010 10:37 0.462 203 6/4/10 1:30 6/4/10 21:40 197,329 5.69 2,501Base 0.121 5 6/4/10 21:50 6/8/10 4:30 312,847 2.36 98Storm Composite 6/8/2010 6:48 6/8/2010 12:26 0.254 38 6/8/10 4:40 6/9/10 14:20 514,056 8.15 1,219Base 0.121 5 6/9/10 14:30 6/11/10 2:40 110,449 0.83 34Storm Composite 6/11/2010 3:56 6/11/2010 8:57 0.286 108 6/11/10 2:50 6/12/10 13:50 675,166 12.05 4,552Base 0.121 5 6/12/10 14:00 6/14/10 10:20 244,098 1.84 76Storm 0.402 87 6/14/2010 10:30 6/16/10 0:40 187,343 4.70 1,017Base Grab 6/17/2010 10:45 6/17/2010 10:45 0.082 3 6/16/10 0:50 6/25/10 17:20 670,180 3.43 126Storm Composite 6/25/810 19:06 6/25/2010 19:56 0.618 173 6/25/10 17:30 6/26/10 18:50 1,498,650 57.82 16,185Storm 0.402 87 6/26/10 19:00 6/27/10 19:50 407,046 10.21 2,211Base Composite 7/1/2010 10:14 7/1/2010 10:14 0.066 8 6/27/10 20:00 7/5/10 12:30 507,268 2.09 253Storm Composite 7/5/2010 15:16 7/5/2010 18:41 0.262 52 7/5/10 12:40 7/7/10 4:00 785,495 12.85 2,550Base 0.121 5 7/7/10 4:10 7/11/10 15:10 356,575 2.69 111Storm 0.402 87 7/11/10 15:20 7/12/10 22:20 705,677 17.71 3,833Base 0.121 5 7/12/10 22:30 7/14/10 13:40 115,426 0.87 36Storm 0.402 87 7/14/10 13:50 7/15/10 7:00 304,010 7.63 1,651Base Grab 7/15/2010 11:36 7/15/2010 11:36 0.178 4 7/15/10 7:10 7/17/10 20:10 173,111 1.92 43Storm Composite 7/17/2010 20:54 7/17/2010 22:07 0.316 90 7/17/10 20:20 7/19/10 5:40 1,154,370 22.77 6,486
Interval Volume (cf)
Interval TP (lb)
Interval TSS (lb)
TP (mg/L) TSS (mg/L)Sample Collection Time Loading Interval
Sample Type
Capitol Region Watershed District 2010 Monitoring Report 137
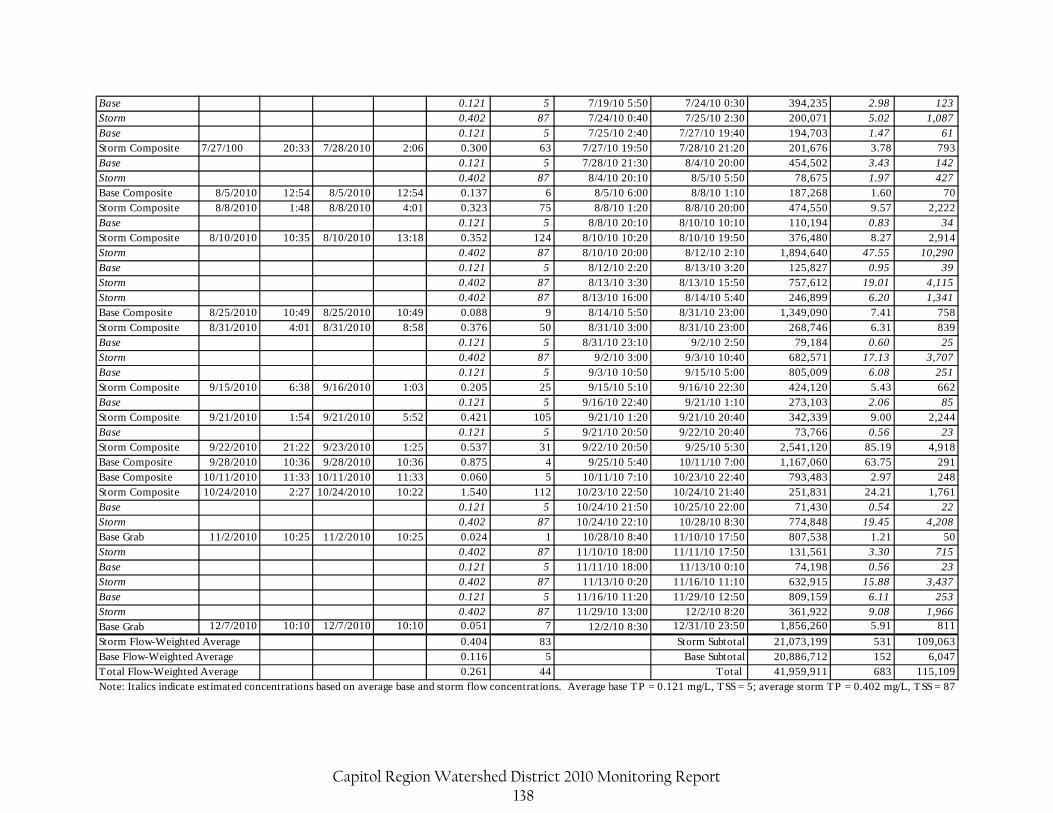
Base 0.121 5 7/19/10 5:50 7/24/10 0:30 394,235 2.98 123Storm 0.402 87 7/24/10 0:40 7/25/10 2:30 200,071 5.02 1,087Base 0.121 5 7/25/10 2:40 7/27/10 19:40 194,703 1.47 61Storm Composite 7/27/100 20:33 7/28/2010 2:06 0.300 63 7/27/10 19:50 7/28/10 21:20 201,676 3.78 793Base 0.121 5 7/28/10 21:30 8/4/10 20:00 454,502 3.43 142Storm 0.402 87 8/4/10 20:10 8/5/10 5:50 78,675 1.97 427Base Composite 8/5/2010 12:54 8/5/2010 12:54 0.137 6 8/5/10 6:00 8/8/10 1:10 187,268 1.60 70Storm Composite 8/8/2010 1:48 8/8/2010 4:01 0.323 75 8/8/10 1:20 8/8/10 20:00 474,550 9.57 2,222Base 0.121 5 8/8/10 20:10 8/10/10 10:10 110,194 0.83 34Storm Composite 8/10/2010 10:35 8/10/2010 13:18 0.352 124 8/10/10 10:20 8/10/10 19:50 376,480 8.27 2,914Storm 0.402 87 8/10/10 20:00 8/12/10 2:10 1,894,640 47.55 10,290Base 0.121 5 8/12/10 2:20 8/13/10 3:20 125,827 0.95 39Storm 0.402 87 8/13/10 3:30 8/13/10 15:50 757,612 19.01 4,115Storm 0.402 87 8/13/10 16:00 8/14/10 5:40 246,899 6.20 1,341Base Composite 8/25/2010 10:49 8/25/2010 10:49 0.088 9 8/14/10 5:50 8/31/10 23:00 1,349,090 7.41 758Storm Composite 8/31/2010 4:01 8/31/2010 8:58 0.376 50 8/31/10 3:00 8/31/10 23:00 268,746 6.31 839Base 0.121 5 8/31/10 23:10 9/2/10 2:50 79,184 0.60 25Storm 0.402 87 9/2/10 3:00 9/3/10 10:40 682,571 17.13 3,707Base 0.121 5 9/3/10 10:50 9/15/10 5:00 805,009 6.08 251Storm Composite 9/15/2010 6:38 9/16/2010 1:03 0.205 25 9/15/10 5:10 9/16/10 22:30 424,120 5.43 662Base 0.121 5 9/16/10 22:40 9/21/10 1:10 273,103 2.06 85Storm Composite 9/21/2010 1:54 9/21/2010 5:52 0.421 105 9/21/10 1:20 9/21/10 20:40 342,339 9.00 2,244Base 0.121 5 9/21/10 20:50 9/22/10 20:40 73,766 0.56 23Storm Composite 9/22/2010 21:22 9/23/2010 1:25 0.537 31 9/22/10 20:50 9/25/10 5:30 2,541,120 85.19 4,918Base Composite 9/28/2010 10:36 9/28/2010 10:36 0.875 4 9/25/10 5:40 10/11/10 7:00 1,167,060 63.75 291Base Composite 10/11/2010 11:33 10/11/2010 11:33 0.060 5 10/11/10 7:10 10/23/10 22:40 793,483 2.97 248Storm Composite 10/24/2010 2:27 10/24/2010 10:22 1.540 112 10/23/10 22:50 10/24/10 21:40 251,831 24.21 1,761Base 0.121 5 10/24/10 21:50 10/25/10 22:00 71,430 0.54 22Storm 0.402 87 10/24/10 22:10 10/28/10 8:30 774,848 19.45 4,208Base Grab 11/2/2010 10:25 11/2/2010 10:25 0.024 1 10/28/10 8:40 11/10/10 17:50 807,538 1.21 50Storm 0.402 87 11/10/10 18:00 11/11/10 17:50 131,561 3.30 715Base 0.121 5 11/11/10 18:00 11/13/10 0:10 74,198 0.56 23Storm 0.402 87 11/13/10 0:20 11/16/10 11:10 632,915 15.88 3,437Base 0.121 5 11/16/10 11:20 11/29/10 12:50 809,159 6.11 253Storm 0.402 87 11/29/10 13:00 12/2/10 8:20 361,922 9.08 1,966Base Grab 12/7/2010 10:10 12/7/2010 10:10 0.051 7 12/2/10 8:30 12/31/10 23:50 1,856,260 5.91 811
0.404 83 Storm Subtotal 21,073,199 531 109,0630.116 5 Base Subtotal 20,886,712 152 6,0470.261 44 Total 41,959,911 683 115,109
Note: Italics indicate estimated concentrations based on average base and storm flow concentrations. Average base TP = 0.121 mg/L, TSS = 5; average storm TP = 0.402 mg/L, TSS = 87 Total Flow-Weighted Average
Storm Flow-Weighted AverageBase Flow-Weighted Average
Capitol Region Watershed District 2010 Monitoring Report 138
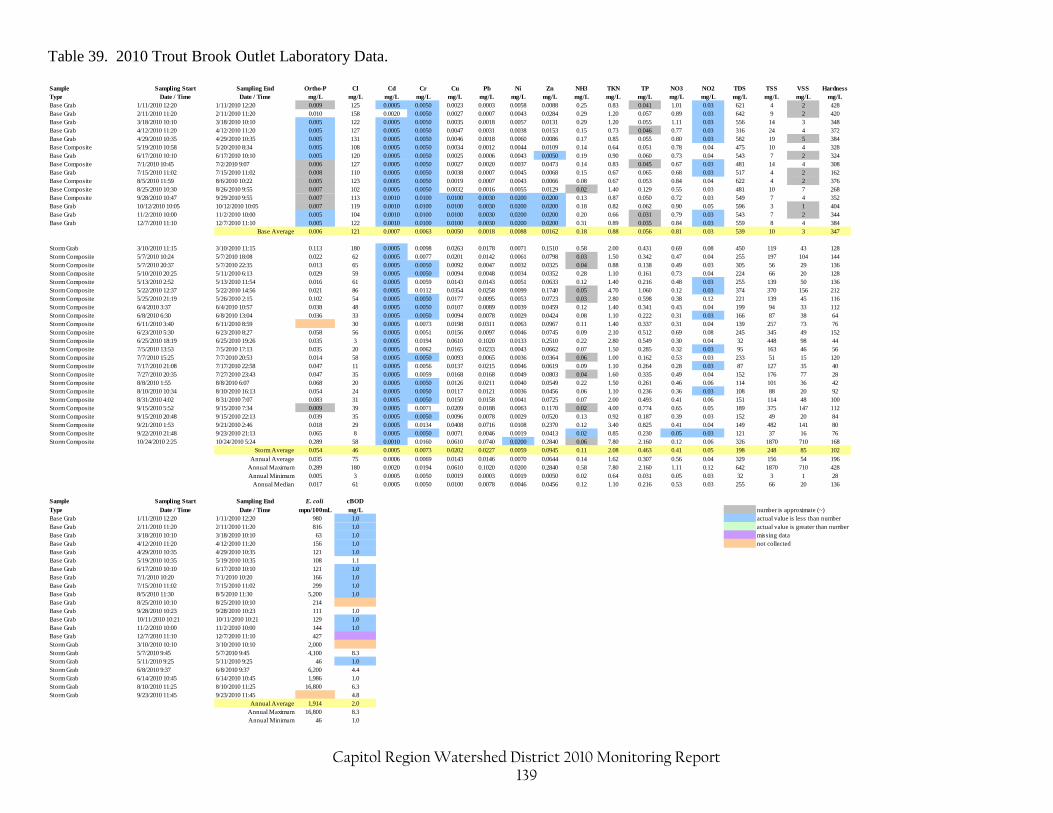
Capitol Region Watershed District 2010 Monitoring Report 139
Table 39. 2010 Trout Brook Outlet Laboratory Data.
Sample Sampling Start Sampling End Ortho-P Cl Cd Cr Cu Pb Ni Zn NH3 TKN TP NO3 NO2 TDS TSS VSS Hardness
Type Date / Time Date / Time mg/L mg/L mg/L mg/L mg/L mg/L mg/L mg/L mg/L mg/L mg/L mg/L mg/L mg/L mg/L mg/L mg/L
Base Grab 1/11/2010 12:20 1/11/2010 12:20 0.009 125 0.0005 0.0050 0.0023 0.0003 0.0058 0.0088 0.25 0.83 0.041 1.01 0.03 621 4 2 428
Base Grab 2/11/2010 11:20 2/11/2010 11:20 0.010 158 0.0020 0.0050 0.0027 0.0007 0.0043 0.0284 0.29 1.20 0.057 0.89 0.03 642 9 2 420
Base Grab 3/18/2010 10:10 3/18/2010 10:10 0.005 122 0.0005 0.0050 0.0035 0.0018 0.0057 0.0131 0.29 1.20 0.055 1.11 0.03 556 14 3 348
Base Grab 4/12/2010 11:20 4/12/2010 11:20 0.005 127 0.0005 0.0050 0.0047 0.0031 0.0038 0.0153 0.15 0.73 0.046 0.77 0.03 316 24 4 372
Base Grab 4/29/2010 10:35 4/29/2010 10:35 0.005 131 0.0005 0.0050 0.0046 0.0018 0.0060 0.0086 0.17 0.85 0.055 0.80 0.03 582 19 5 384
Base Composite 5/19/2010 10:58 5/20/2010 8:34 0.005 108 0.0005 0.0050 0.0034 0.0012 0.0044 0.0109 0.14 0.64 0.051 0.78 0.04 475 10 4 328
Base Grab 6/17/2010 10:10 6/17/2010 10:10 0.005 120 0.0005 0.0050 0.0025 0.0006 0.0043 0.0050 0.19 0.90 0.060 0.73 0.04 543 7 2 324
Base Composite 7/1/2010 10:45 7/2/2010 9:07 0.006 127 0.0005 0.0050 0.0027 0.0020 0.0037 0.0473 0.14 0.83 0.045 0.67 0.03 481 14 4 308
Base Grab 7/15/2010 11:02 7/15/2010 11:02 0.008 110 0.0005 0.0050 0.0038 0.0007 0.0045 0.0068 0.15 0.67 0.065 0.68 0.03 517 4 2 162
Base Composite 8/5/2010 11:59 8/6/2010 10:22 0.005 123 0.0005 0.0050 0.0019 0.0007 0.0043 0.0066 0.08 0.67 0.053 0.84 0.04 622 4 2 376
Base Composite 8/25/2010 10:30 8/26/2010 9:55 0.007 102 0.0005 0.0050 0.0032 0.0016 0.0055 0.0129 0.02 1.40 0.129 0.55 0.03 481 10 7 268
Base Composite 9/28/2010 10:47 9/29/2010 9:55 0.007 113 0.0010 0.0100 0.0100 0.0030 0.0200 0.0200 0.13 0.87 0.050 0.72 0.03 549 7 4 352
Base Grab 10/12/2010 10:05 10/12/2010 10:05 0.007 119 0.0010 0.0100 0.0100 0.0030 0.0200 0.0200 0.18 0.82 0.062 0.90 0.05 596 3 1 404
Base Grab 11/2/2010 10:00 11/2/2010 10:00 0.005 104 0.0010 0.0100 0.0100 0.0030 0.0200 0.0200 0.20 0.66 0.031 0.79 0.03 543 7 2 344
Base Grab 12/7/2010 11:10 12/7/2010 11:10 0.005 122 0.0010 0.0100 0.0100 0.0030 0.0200 0.0200 0.31 0.89 0.035 0.84 0.03 559 8 4 384
Base Average 0.006 121 0.0007 0.0063 0.0050 0.0018 0.0088 0.0162 0.18 0.88 0.056 0.81 0.03 539 10 3 347
Storm Grab 3/10/2010 11:15 3/10/2010 11:15 0.113 180 0.0005 0.0098 0.0263 0.0178 0.0071 0.1510 0.58 2.00 0.431 0.69 0.08 450 119 43 128
Storm Composite 5/7/2010 10:24 5/7/2010 18:08 0.022 62 0.0005 0.0077 0.0201 0.0142 0.0061 0.0798 0.03 1.50 0.342 0.47 0.04 255 197 104 144
Storm Composite 5/7/2010 20:37 5/7/2010 22:35 0.013 65 0.0005 0.0050 0.0092 0.0047 0.0032 0.0325 0.04 0.88 0.138 0.49 0.03 305 56 29 136
Storm Composite 5/10/2010 20:25 5/11/2010 6:13 0.029 59 0.0005 0.0050 0.0094 0.0048 0.0034 0.0352 0.28 1.10 0.161 0.73 0.04 224 66 20 128
Storm Composite 5/13/2010 2:52 5/13/2010 11:54 0.016 61 0.0005 0.0059 0.0143 0.0143 0.0051 0.0633 0.12 1.40 0.216 0.48 0.03 255 139 50 136
Storm Composite 5/22/2010 12:37 5/22/2010 14:56 0.021 86 0.0005 0.0112 0.0354 0.0258 0.0099 0.1740 0.05 4.70 1.060 0.12 0.03 374 370 156 212
Storm Composite 5/25/2010 21:19 5/26/2010 2:15 0.102 54 0.0005 0.0050 0.0177 0.0095 0.0053 0.0723 0.03 2.80 0.598 0.38 0.12 221 139 45 116
Storm Composite 6/4/2010 3:37 6/4/2010 10:57 0.038 48 0.0005 0.0050 0.0107 0.0089 0.0039 0.0459 0.12 1.40 0.341 0.43 0.04 199 94 33 112
Storm Composite 6/8/2010 6:30 6/8/2010 13:04 0.036 33 0.0005 0.0050 0.0094 0.0078 0.0029 0.0424 0.08 1.10 0.222 0.31 0.03 166 87 38 64
Storm Composite 6/11/2010 3:40 6/11/2010 8:59 30 0.0005 0.0073 0.0198 0.0311 0.0063 0.0967 0.11 1.40 0.337 0.31 0.04 139 257 73 76
Storm Composite 6/23/2010 5:30 6/23/2010 8:27 0.058 56 0.0005 0.0051 0.0156 0.0097 0.0046 0.0745 0.09 2.10 0.512 0.69 0.08 245 345 49 152
Storm Composite 6/25/2010 18:19 6/25/2010 19:26 0.035 3 0.0005 0.0194 0.0610 0.1020 0.0133 0.2510 0.22 2.80 0.549 0.30 0.04 32 448 98 44
Storm Composite 7/5/2010 13:53 7/5/2010 17:13 0.035 20 0.0005 0.0062 0.0165 0.0233 0.0043 0.0662 0.07 1.50 0.285 0.32 0.03 95 163 46 56
Storm Composite 7/7/2010 15:25 7/7/2010 20:53 0.014 58 0.0005 0.0050 0.0093 0.0065 0.0036 0.0364 0.06 1.00 0.162 0.53 0.03 233 51 15 120
Storm Composite 7/17/2010 21:08 7/17/2010 22:58 0.047 11 0.0005 0.0056 0.0137 0.0215 0.0046 0.0619 0.09 1.10 0.264 0.28 0.03 87 127 35 40
Storm Composite 7/27/2010 20:35 7/27/2010 23:43 0.047 35 0.0005 0.0059 0.0168 0.0168 0.0049 0.0803 0.04 1.60 0.335 0.49 0.04 152 176 77 28
Storm Composite 8/8/2010 1:55 8/8/2010 6:07 0.068 20 0.0005 0.0050 0.0126 0.0211 0.0040 0.0549 0.22 1.50 0.261 0.46 0.06 114 101 36 42
Storm Composite 8/10/2010 10:34 8/10/2010 16:13 0.054 24 0.0005 0.0050 0.0117 0.0121 0.0036 0.0456 0.06 1.10 0.236 0.36 0.03 108 88 20 92
Storm Composite 8/31/2010 4:02 8/31/2010 7:07 0.083 31 0.0005 0.0050 0.0150 0.0158 0.0041 0.0725 0.07 2.00 0.493 0.41 0.06 151 114 48 100
Storm Composite 9/15/2010 5:52 9/15/2010 7:34 0.009 39 0.0005 0.0071 0.0209 0.0188 0.0063 0.1170 0.02 4.00 0.774 0.65 0.05 189 375 147 112
Storm Composite 9/15/2010 20:48 9/15/2010 22:13 0.039 35 0.0005 0.0050 0.0096 0.0078 0.0029 0.0520 0.13 0.92 0.187 0.39 0.03 152 49 20 84
Storm Composite 9/21/2010 1:53 9/21/2010 2:46 0.018 29 0.0005 0.0134 0.0408 0.0716 0.0108 0.2370 0.12 3.40 0.825 0.41 0.04 149 482 141 80
Storm Composite 9/22/2010 21:48 9/23/2010 21:13 0.065 8 0.0005 0.0050 0.0071 0.0046 0.0019 0.0413 0.02 0.85 0.230 0.05 0.03 121 37 16 76
Storm Composite 10/24/2010 2:25 10/24/2010 5:24 0.289 58 0.0010 0.0160 0.0610 0.0740 0.0200 0.2840 0.06 7.80 2.160 0.12 0.06 326 1870 710 168
Storm Average 0.054 46 0.0005 0.0073 0.0202 0.0227 0.0059 0.0945 0.11 2.08 0.463 0.41 0.05 198 248 85 102
Annual Average 0.035 75 0.0006 0.0069 0.0143 0.0146 0.0070 0.0644 0.14 1.62 0.307 0.56 0.04 329 156 54 196
Annual Maximum 0.289 180 0.0020 0.0194 0.0610 0.1020 0.0200 0.2840 0.58 7.80 2.160 1.11 0.12 642 1870 710 428
Annual Minimum 0.005 3 0.0005 0.0050 0.0019 0.0003 0.0019 0.0050 0.02 0.64 0.031 0.05 0.03 32 3 1 28
Annual Median 0.017 61 0.0005 0.0050 0.0100 0.0078 0.0046 0.0456 0.12 1.10 0.216 0.53 0.03 255 66 20 136
Sample Sampling Start Sampling End E. coli cBOD
Type Date / Time Date / Time mpn/100mL mg/L number is approximate (~)
Base Grab 1/11/2010 12:20 1/11/2010 12:20 980 1.0 actual value is less than number
Base Grab 2/11/2010 11:20 2/11/2010 11:20 816 1.0 actual value is greater than number
Base Grab 3/18/2010 10:10 3/18/2010 10:10 63 1.0 missing data
Base Grab 4/12/2010 11:20 4/12/2010 11:20 156 1.0 not collected
Base Grab 4/29/2010 10:35 4/29/2010 10:35 121 1.0
Base Grab 5/19/2010 10:35 5/19/2010 10:35 108 1.1
Base Grab 6/17/2010 10:10 6/17/2010 10:10 121 1.0
Base Grab 7/1/2010 10:20 7/1/2010 10:20 166 1.0
Base Grab 7/15/2010 11:02 7/15/2010 11:02 299 1.0
Base Grab 8/5/2010 11:30 8/5/2010 11:30 5,200 1.0
Base Grab 8/25/2010 10:10 8/25/2010 10:10 214
Base Grab 9/28/2010 10:23 9/28/2010 10:23 111 1.0
Base Grab 10/11/2010 10:21 10/11/2010 10:21 129 1.0
Base Grab 11/2/2010 10:00 11/2/2010 10:00 144 1.0
Base Grab 12/7/2010 11:10 12/7/2010 11:10 427
Storm Grab 3/10/2010 10:10 3/10/2010 10:10 2,000
Storm Grab 5/7/2010 9:45 5/7/2010 9:45 4,100 8.3
Storm Grab 5/11/2010 9:25 5/11/2010 9:25 46 1.0
Storm Grab 6/8/2010 9:37 6/8/2010 9:37 6,200 4.4
Storm Grab 6/14/2010 10:45 6/14/2010 10:45 1,986 1.0
Storm Grab 8/10/2010 11:25 8/10/2010 11:25 16,800 6.3
Storm Grab 9/23/2010 11:45 9/23/2010 11:45 4.8
Annual Average 1,914 2.0
Annual Maximum 16,800 8.3
Annual Minimum 46 1.0
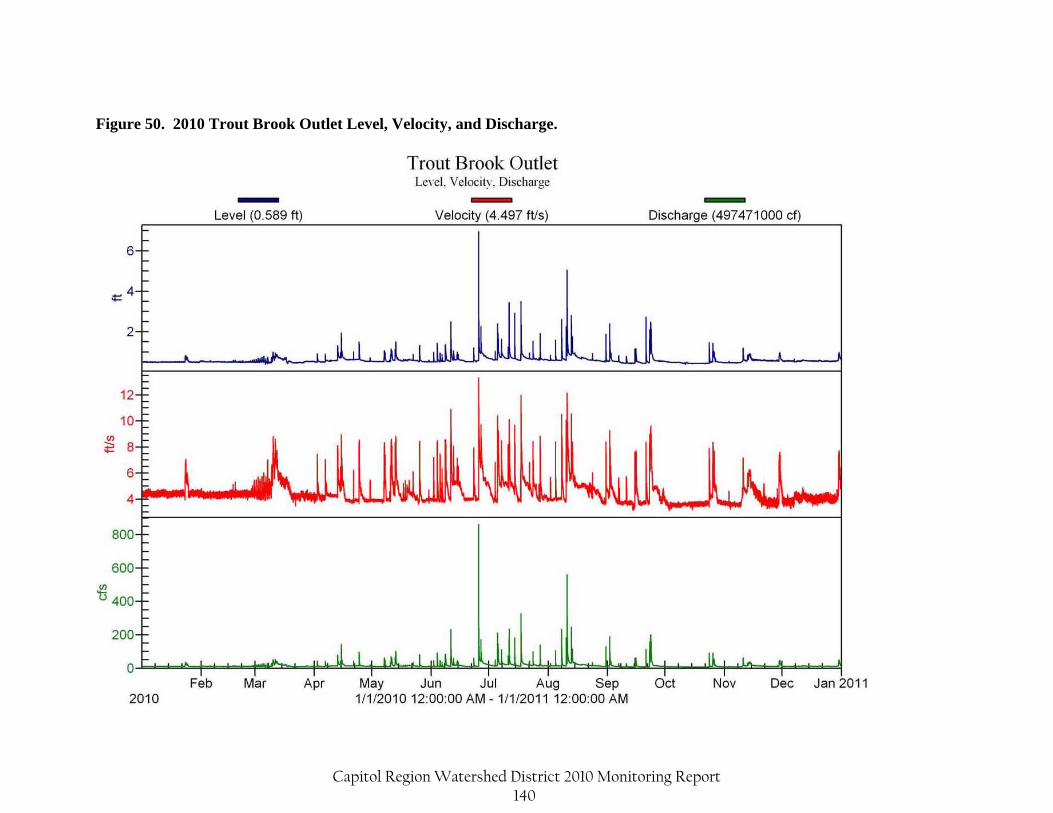
Figure 50. 2010 Trout Brook Outlet Level, Velocity, and Discharge.
Capitol Region Watershed District 2010 Monitoring Report 140
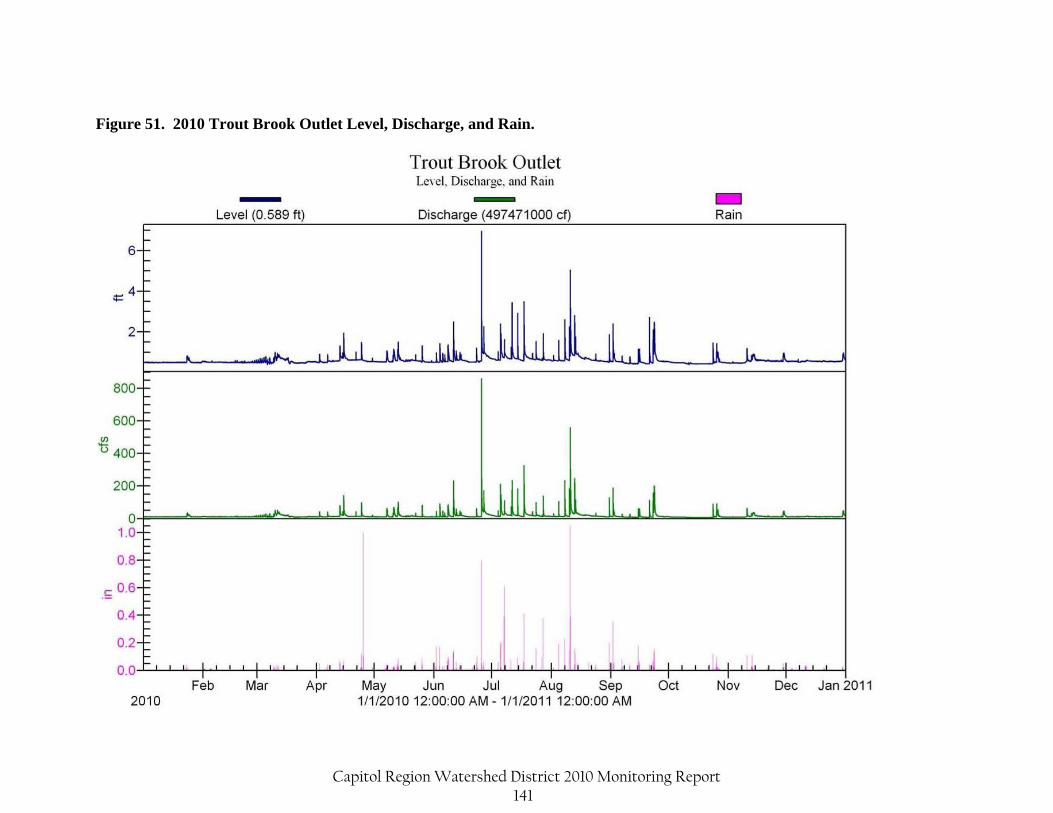
Figure 51. 2010 Trout Brook Outlet Level, Discharge, and Rain.
Capitol Region Watershed District 2010 Monitoring Report 141
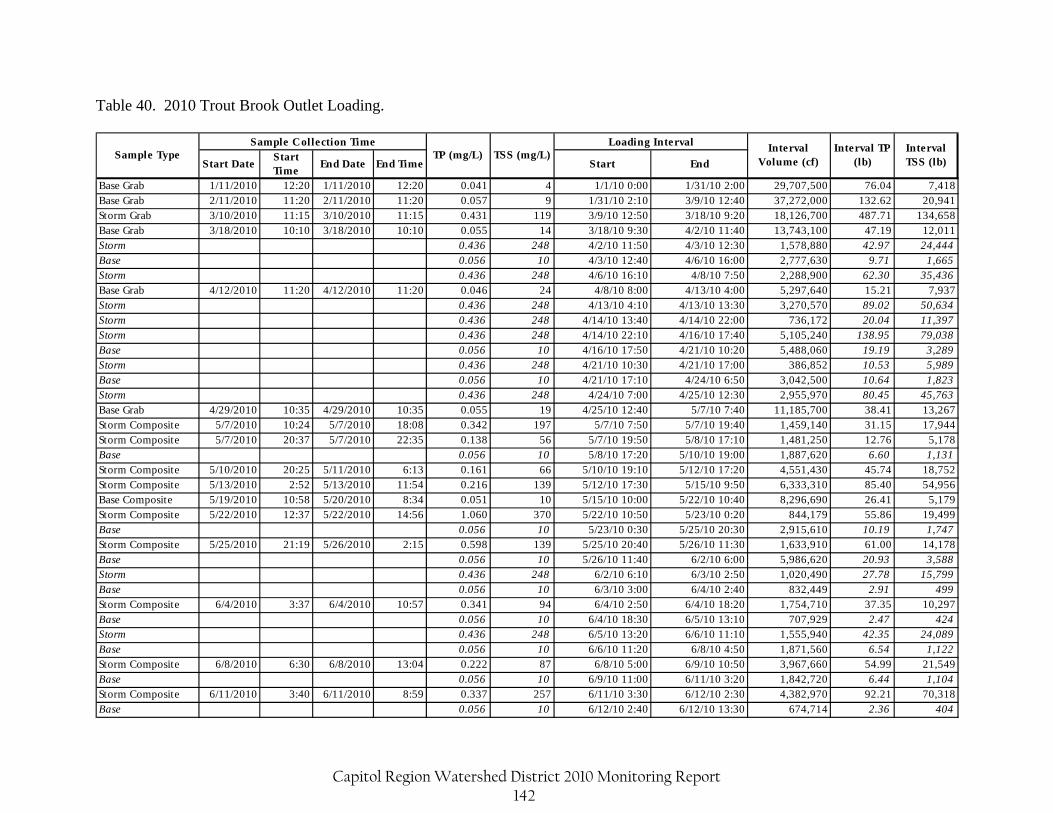
Table 40. 2010 Trout Brook Outlet Loading.
Start DateStart Time
End Date End Time Start End
Base Grab 1/11/2010 12:20 1/11/2010 12:20 0.041 4 1/1/10 0:00 1/31/10 2:00 29,707,500 76.04 7,418Base Grab 2/11/2010 11:20 2/11/2010 11:20 0.057 9 1/31/10 2:10 3/9/10 12:40 37,272,000 132.62 20,941Storm Grab 3/10/2010 11:15 3/10/2010 11:15 0.431 119 3/9/10 12:50 3/18/10 9:20 18,126,700 487.71 134,658Base Grab 3/18/2010 10:10 3/18/2010 10:10 0.055 14 3/18/10 9:30 4/2/10 11:40 13,743,100 47.19 12,011Storm 0.436 248 4/2/10 11:50 4/3/10 12:30 1,578,880 42.97 24,444Base 0.056 10 4/3/10 12:40 4/6/10 16:00 2,777,630 9.71 1,665Storm 0.436 248 4/6/10 16:10 4/8/10 7:50 2,288,900 62.30 35,436Base Grab 4/12/2010 11:20 4/12/2010 11:20 0.046 24 4/8/10 8:00 4/13/10 4:00 5,297,640 15.21 7,937Storm 0.436 248 4/13/10 4:10 4/13/10 13:30 3,270,570 89.02 50,634Storm 0.436 248 4/14/10 13:40 4/14/10 22:00 736,172 20.04 11,397Storm 0.436 248 4/14/10 22:10 4/16/10 17:40 5,105,240 138.95 79,038Base 0.056 10 4/16/10 17:50 4/21/10 10:20 5,488,060 19.19 3,289Storm 0.436 248 4/21/10 10:30 4/21/10 17:00 386,852 10.53 5,989Base 0.056 10 4/21/10 17:10 4/24/10 6:50 3,042,500 10.64 1,823Storm 0.436 248 4/24/10 7:00 4/25/10 12:30 2,955,970 80.45 45,763Base Grab 4/29/2010 10:35 4/29/2010 10:35 0.055 19 4/25/10 12:40 5/7/10 7:40 11,185,700 38.41 13,267Storm Composite 5/7/2010 10:24 5/7/2010 18:08 0.342 197 5/7/10 7:50 5/7/10 19:40 1,459,140 31.15 17,944Storm Composite 5/7/2010 20:37 5/7/2010 22:35 0.138 56 5/7/10 19:50 5/8/10 17:10 1,481,250 12.76 5,178Base 0.056 10 5/8/10 17:20 5/10/10 19:00 1,887,620 6.60 1,131Storm Composite 5/10/2010 20:25 5/11/2010 6:13 0.161 66 5/10/10 19:10 5/12/10 17:20 4,551,430 45.74 18,752Storm Composite 5/13/2010 2:52 5/13/2010 11:54 0.216 139 5/12/10 17:30 5/15/10 9:50 6,333,310 85.40 54,956Base Composite 5/19/2010 10:58 5/20/2010 8:34 0.051 10 5/15/10 10:00 5/22/10 10:40 8,296,690 26.41 5,179Storm Composite 5/22/2010 12:37 5/22/2010 14:56 1.060 370 5/22/10 10:50 5/23/10 0:20 844,179 55.86 19,499Base 0.056 10 5/23/10 0:30 5/25/10 20:30 2,915,610 10.19 1,747Storm Composite 5/25/2010 21:19 5/26/2010 2:15 0.598 139 5/25/10 20:40 5/26/10 11:30 1,633,910 61.00 14,178Base 0.056 10 5/26/10 11:40 6/2/10 6:00 5,986,620 20.93 3,588Storm 0.436 248 6/2/10 6:10 6/3/10 2:50 1,020,490 27.78 15,799Base 0.056 10 6/3/10 3:00 6/4/10 2:40 832,449 2.91 499Storm Composite 6/4/2010 3:37 6/4/2010 10:57 0.341 94 6/4/10 2:50 6/4/10 18:20 1,754,710 37.35 10,297Base 0.056 10 6/4/10 18:30 6/5/10 13:10 707,929 2.47 424Storm 0.436 248 6/5/10 13:20 6/6/10 11:10 1,555,940 42.35 24,089Base 0.056 10 6/6/10 11:20 6/8/10 4:50 1,871,560 6.54 1,122Storm Composite 6/8/2010 6:30 6/8/2010 13:04 0.222 87 6/8/10 5:00 6/9/10 10:50 3,967,660 54.99 21,549Base 0.056 10 6/9/10 11:00 6/11/10 3:20 1,842,720 6.44 1,104Storm Composite 6/11/2010 3:40 6/11/2010 8:59 0.337 257 6/11/10 3:30 6/12/10 2:30 4,382,970 92.21 70,318Base 0.056 10 6/12/10 2:40 6/12/10 13:30 674,714 2.36 404
Interval Volume (cf)
Interval TP (lb)
Interval TSS (lb)
TP (mg/L) TSS (mg/L)Sample Collection Time Loading Interval
Sample Type
Capitol Region Watershed District 2010 Monitoring Report 142

Storm 0.436 248 6/12/10 13:40 6/13/10 8:30 1,975,200 53.76 30,579Base 0.056 10 6/13/10 8:40 6/14/10 9:40 1,602,990 5.60 961Storm 0.436 248 6/14/10 9:50 6/15/10 16:50 2,708,630 73.72 41,934Base Grab 6/17/2010 10:10 6/17/2010 10:10 0.060 7 6/15/10 17:00 6/23/10 1:50 7,579,190 28.39 3,312Storm Composite 6/23/2010 5:30 6/23/2010 8:27 0.512 345 6/23/10 2:00 6/23/10 22:00 1,372,530 43.87 29,560Base 0.056 10 6/23/10 22:10 6/25/10 17:20 1,777,740 6.21 1,065Storm Composite 6/25/2010 18:19 6/25/2010 19:26 0.549 448 6/25/10 17:30 6/26/10 16:50 8,560,430 293.38 239,409Storm 0.436 248 6/26/10 17:00 6/28/10 4:30 6,486,050 176.54 100,415Base Composite 7/1/2010 10:45 7/2/2010 9:07 0.045 14 6/28/10 4:40 7/4/10 7:30 10,618,600 29.83 9,280Storm 0.436 248 7/4/10 7:40 7/4/10 17:30 708,308 19.28 10,966Base 0.056 10 7/4/10 17:40 7/5/10 12:40 891,466 3.12 534Storm Composite 7/5/2010 13:53 7/5/2010 17:13 0.285 163 7/5/10 12:50 7/6/10 19:30 6,392,710 113.74 65,049Base 0.056 10 7/6/10 19:40 7/7/10 15:00 1,603,940 5.61 961Storm Composite 7/7/2010 15:25 7/7/2010 20:53 0.162 51 7/7/10 15:10 7/8/10 14:20 3,129,270 31.65 9,963Base 0.056 10 7/8/10 14:30 7/11/10 0:50 4,556,180 15.93 2,730Storm 0.436 248 7/11/10 1:00 7/11/10 10:30 1,020,520 27.78 15,799Base 0.056 10 7/11/10 10:40 7/11/10 15:40 359,176 1.26 215Storm 0.436 248 7/11/10 15:50 7/12/10 13:10 3,992,650 108.67 61,813Base 0.056 10 7/12/10 13:20 7/14/10 13:10 3,495,780 12.22 2,095Storm 0.436 248 7/14/10 13:20 7/15/10 7:30 2,232,290 60.76 34,560Base 0.056 10 7/15/10 7:40 7/17/10 15:00 2,739,080 9.58 1,642Storm Composite 7/17/2010 21:08 7/17/2010 22:58 0.264 127 7/17/10 15:10 7/19/10 12:10 8,133,770 134.05 64,486Base 0.056 10 7/19/10 12:10 7/22/10 4:20 4,904,750 17.15 2,939Storm 0.436 248 7/22/10 4:30 7/22/10 20:20 1,314,420 35.78 20,349Base 0.056 10 7/22/10 20:30 7/24/10 0:50 1,639,610 5.73 983Storm 0.436 248 7/24/10 1:00 7/25/10 2:10 2,584,900 70.36 40,019Base 0.056 10 7/25/10 2:20 7/27/10 19:00 3,573,830 12.49 2,142Storm Composite 7/27/2010 20:35 7/27/2010 23:43 0.335 176 7/27/10 19:10 7/28/10 22:20 2,517,010 52.64 27,654Base 0.056 10 7/28/10 22:30 8/4/10 19:30 7,978,080 27.89 4,781Storm 0.436 248 8/4/10 19:40 8/5/10 10:50 1,484,020 40.39 22,975Base Composite 8/5/2010 11:59 8/6/2010 10:22 0.053 4 8/5/10 11:00 8/8/10 1:30 2,836,250 9.38 708Storm Composite 8/8/2010 1:55 8/8/2010 6:07 0.261 101 8/8/10 1:40 8/8/10 21:10 3,190,580 51.98 20,117Base 0.056 10 8/8/10 21:20 8/10/10 10:10 1,870,490 6.54 1,121Storm Composite 8/10/2010 10:34 8/10/2010 16:13 0.236 88 8/10/10 10:20 8/10/10 21:00 2,379,870 35.06 13,074Storm 0.436 248 8/10/10 21:10 8/11/10 18:20 8,877,860 241.64 137,444Base 0.056 10 8/11/10 18:30 8/13/10 3:10 3,964,440 13.86 2,376Storm 0.436 248 8/13/10 3:20 8/13/10 16:00 3,679,930 100.16 56,972Storm 0.436 248 8/13/10 16:10 8/14/10 12:00 3,017,400 82.13 46,714Base 0.056 10 8/14/10 12:10 8/25/10 10:10 18,722,300 65.45 11,220
Capitol Region Watershed District 2010 Monitoring Report 143
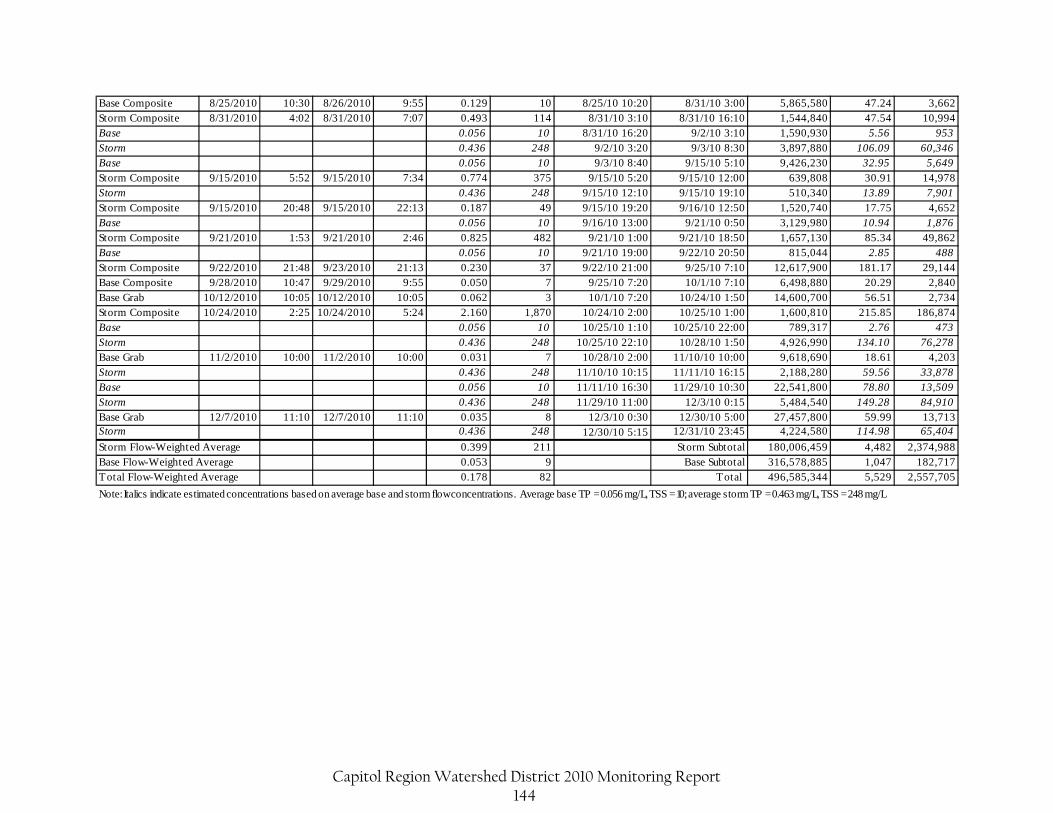
Base Composite 8/25/2010 10:30 8/26/2010 9:55 0.129 10 8/25/10 10:20 8/31/10 3:00 5,865,580 47.24 3,662Storm Composite 8/31/2010 4:02 8/31/2010 7:07 0.493 114 8/31/10 3:10 8/31/10 16:10 1,544,840 47.54 10,994Base 0.056 10 8/31/10 16:20 9/2/10 3:10 1,590,930 5.56 953Storm 0.436 248 9/2/10 3:20 9/3/10 8:30 3,897,880 106.09 60,346Base 0.056 10 9/3/10 8:40 9/15/10 5:10 9,426,230 32.95 5,649Storm Composite 9/15/2010 5:52 9/15/2010 7:34 0.774 375 9/15/10 5:20 9/15/10 12:00 639,808 30.91 14,978Storm 0.436 248 9/15/10 12:10 9/15/10 19:10 510,340 13.89 7,901Storm Composite 9/15/2010 20:48 9/15/2010 22:13 0.187 49 9/15/10 19:20 9/16/10 12:50 1,520,740 17.75 4,652Base 0.056 10 9/16/10 13:00 9/21/10 0:50 3,129,980 10.94 1,876Storm Composite 9/21/2010 1:53 9/21/2010 2:46 0.825 482 9/21/10 1:00 9/21/10 18:50 1,657,130 85.34 49,862Base 0.056 10 9/21/10 19:00 9/22/10 20:50 815,044 2.85 488Storm Composite 9/22/2010 21:48 9/23/2010 21:13 0.230 37 9/22/10 21:00 9/25/10 7:10 12,617,900 181.17 29,144Base Composite 9/28/2010 10:47 9/29/2010 9:55 0.050 7 9/25/10 7:20 10/1/10 7:10 6,498,880 20.29 2,840Base Grab 10/12/2010 10:05 10/12/2010 10:05 0.062 3 10/1/10 7:20 10/24/10 1:50 14,600,700 56.51 2,734Storm Composite 10/24/2010 2:25 10/24/2010 5:24 2.160 1,870 10/24/10 2:00 10/25/10 1:00 1,600,810 215.85 186,874Base 0.056 10 10/25/10 1:10 10/25/10 22:00 789,317 2.76 473Storm 0.436 248 10/25/10 22:10 10/28/10 1:50 4,926,990 134.10 76,278Base Grab 11/2/2010 10:00 11/2/2010 10:00 0.031 7 10/28/10 2:00 11/10/10 10:00 9,618,690 18.61 4,203Storm 0.436 248 11/10/10 10:15 11/11/10 16:15 2,188,280 59.56 33,878Base 0.056 10 11/11/10 16:30 11/29/10 10:30 22,541,800 78.80 13,509Storm 0.436 248 11/29/10 11:00 12/3/10 0:15 5,484,540 149.28 84,910Base Grab 12/7/2010 11:10 12/7/2010 11:10 0.035 8 12/3/10 0:30 12/30/10 5:00 27,457,800 59.99 13,713Storm 0.436 248 12/30/10 5:15 12/31/10 23:45 4,224,580 114.98 65,404
0.399 211 Storm Subtotal 180,006,459 4,482 2,374,9880.053 9 Base Subtotal 316,578,885 1,047 182,7170.178 82 Total 496,585,344 5,529 2,557,705
Note: Italics indicate estimated concentrations based on average base and storm flow concentrations. Average base TP = 0.056 mg/L, TSS = 10; average storm TP = 0.463 mg/L, TSS = 248 mg/L
Total Flow-Weighted Average
Storm Flow-Weighted AverageBase Flow-Weighted Average
Capitol Region Watershed District 2010 Monitoring Report 144
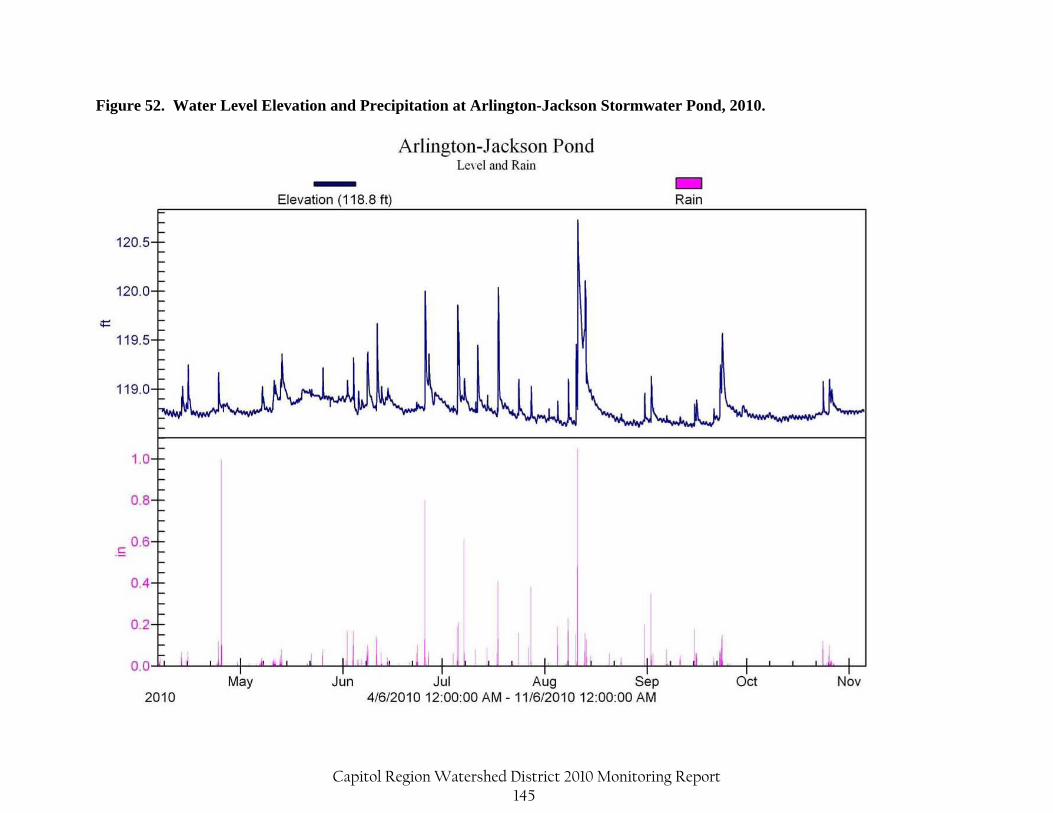
Figure 52. Water Level Elevation and Precipitation at Arlington-Jackson Stormwater Pond, 2010.
Capitol Region Watershed District 2010 Monitoring Report 145
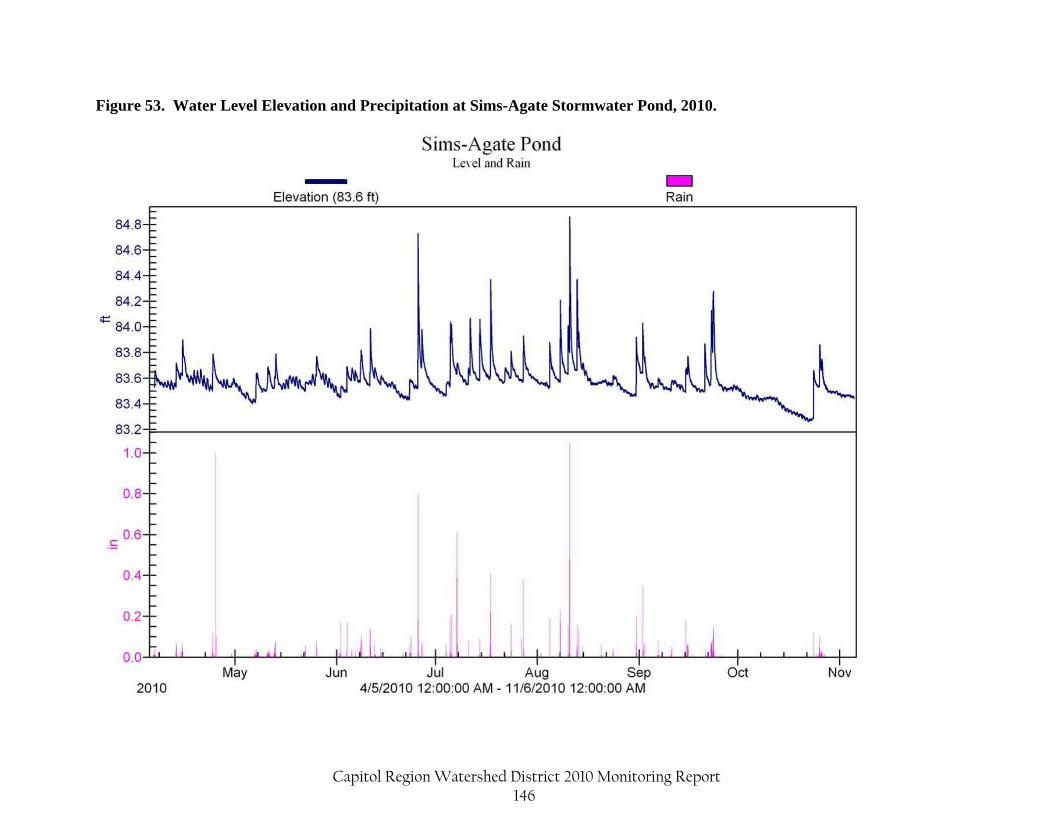
Figure 53. Water Level Elevation and Precipitation at Sims-Agate Stormwater Pond, 2010.
Capitol Region Watershed District 2010 Monitoring Report 146
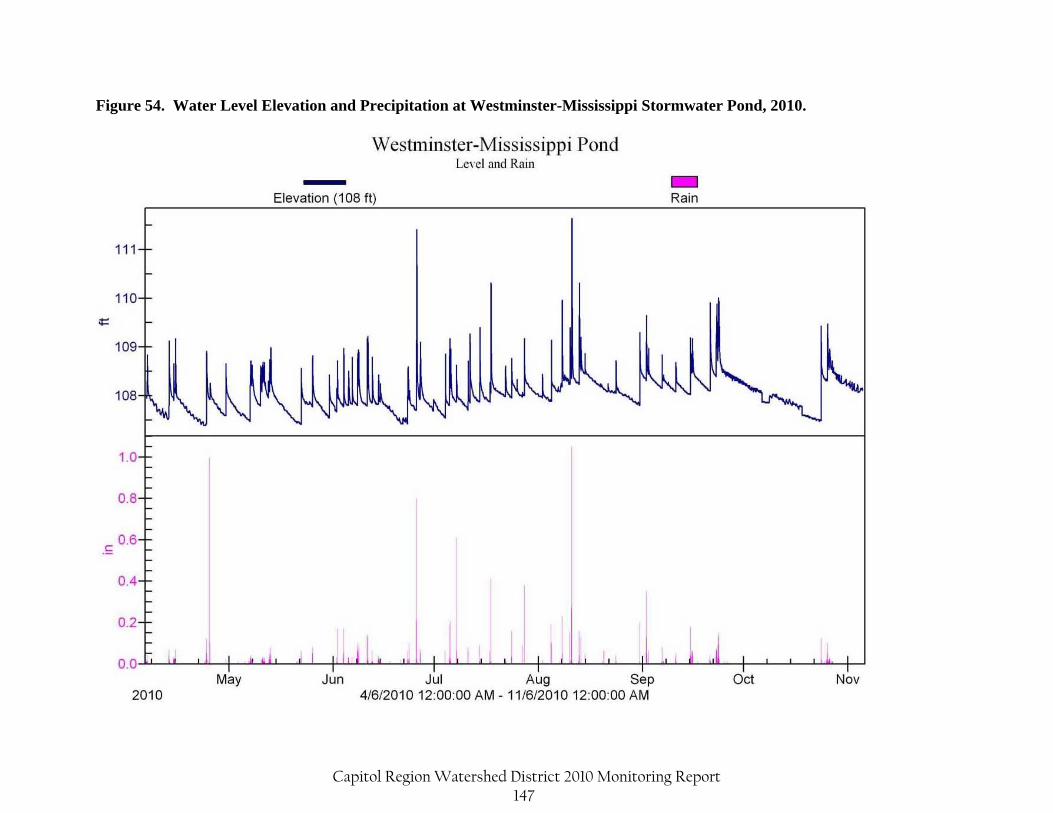
Figure 54. Water Level Elevation and Precipitation at Westminster-Mississippi Stormwater Pond, 2010.
Capitol Region Watershed District 2010 Monitoring Report 147
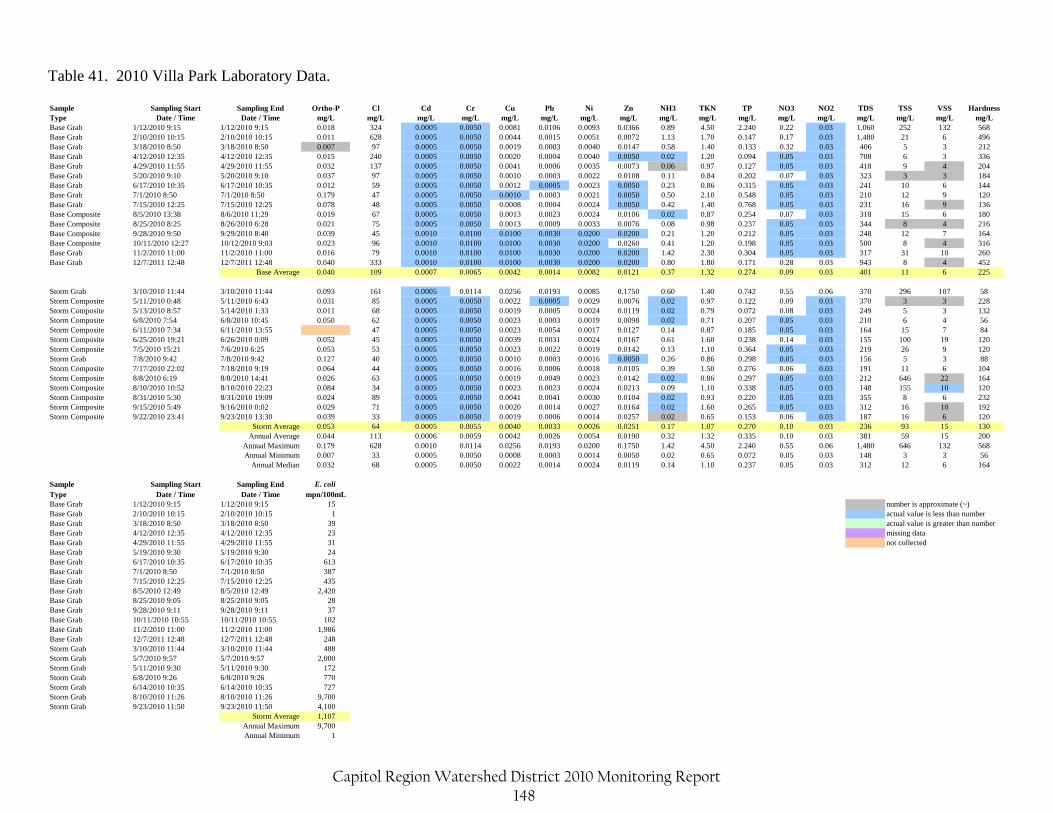
Table 41. 2010 Villa Park Laboratory Data. Sample Sampling Start Sampling End Ortho-P Cl Cd Cr Cu Pb Ni Zn NH3 TKN TP NO3 NO2 TDS TSS VSS HardnessType Date / Time Date / Time mg/L mg/L mg/L mg/L mg/L mg/L mg/L mg/L mg/L mg/L mg/L mg/L mg/L mg/L mg/L mg/L mg/LBase Grab 1/12/2010 9:15 1/12/2010 9:15 0.018 324 0.0005 0.0050 0.0081 0.0106 0.0093 0.0366 0.89 4.50 2.240 0.22 0.03 1,060 252 132 568Base Grab 2/10/2010 10:15 2/10/2010 10:15 0.011 628 0.0005 0.0050 0.0044 0.0015 0.0051 0.0072 1.13 1.70 0.147 0.17 0.03 1,480 21 6 496Base Grab 3/18/2010 8:50 3/18/2010 8:50 0.007 97 0.0005 0.0050 0.0019 0.0003 0.0040 0.0147 0.58 1.40 0.133 0.32 0.03 406 5 3 212Base Grab 4/12/2010 12:35 4/12/2010 12:35 0.015 240 0.0005 0.0050 0.0020 0.0004 0.0040 0.0050 0.02 1.20 0.094 0.05 0.03 708 6 3 336Base Grab 4/29/2010 11:55 4/29/2010 11:55 0.032 137 0.0005 0.0050 0.0041 0.0006 0.0035 0.0073 0.06 0.97 0.127 0.05 0.03 418 9 4 204Base Grab 5/20/2010 9:10 5/20/2010 9:10 0.037 97 0.0005 0.0050 0.0010 0.0003 0.0022 0.0108 0.11 0.84 0.202 0.07 0.03 323 3 3 184Base Grab 6/17/2010 10:35 6/17/2010 10:35 0.012 59 0.0005 0.0050 0.0012 0.0005 0.0023 0.0050 0.23 0.86 0.315 0.05 0.03 241 10 6 144Base Grab 7/1/2010 8:50 7/1/2010 8:50 0.179 47 0.0005 0.0050 0.0010 0.0003 0.0021 0.0050 0.50 2.10 0.548 0.05 0.03 210 12 9 120Base Grab 7/15/2010 12:25 7/15/2010 12:25 0.078 48 0.0005 0.0050 0.0008 0.0004 0.0024 0.0050 0.42 1.40 0.768 0.05 0.03 231 16 9 136Base Composite 8/5/2010 13:38 8/6/2010 11:29 0.019 67 0.0005 0.0050 0.0013 0.0023 0.0024 0.0106 0.02 0.87 0.254 0.07 0.03 318 15 6 180Base Composite 8/25/2010 8:25 8/26/2010 6:28 0.021 75 0.0005 0.0050 0.0013 0.0009 0.0033 0.0076 0.08 0.98 0.237 0.05 0.03 344 8 4 216Base Composite 9/28/2010 9:50 9/29/2010 8:40 0.039 45 0.0010 0.0100 0.0100 0.0030 0.0200 0.0200 0.21 1.20 0.212 0.05 0.03 248 12 7 164Base Composite 10/11/2010 12:27 10/12/2010 9:03 0.023 96 0.0010 0.0100 0.0100 0.0030 0.0200 0.0260 0.41 1.20 0.198 0.05 0.03 500 8 4 316Base Grab 11/2/2010 11:00 11/2/2010 11:00 0.016 79 0.0010 0.0100 0.0100 0.0030 0.0200 0.0200 1.42 2.30 0.304 0.05 0.03 317 31 10 260Base Grab 12/7/2011 12:48 12/7/2011 12:48 0.040 333 0.0010 0.0100 0.0100 0.0030 0.0200 0.0200 0.80 1.80 0.171 0.28 0.03 943 8 4 452
Base Average 0.040 109 0.0007 0.0065 0.0042 0.0014 0.0082 0.0121 0.37 1.32 0.274 0.09 0.03 401 11 6 225
Storm Grab 3/10/2010 11:44 3/10/2010 11:44 0.093 161 0.0005 0.0114 0.0256 0.0193 0.0085 0.1750 0.60 1.40 0.742 0.55 0.06 370 296 107 58Storm Composite 5/11/2010 0:48 5/11/2010 6:43 0.031 85 0.0005 0.0050 0.0022 0.0005 0.0029 0.0076 0.02 0.97 0.122 0.09 0.03 370 3 3 228Storm Composite 5/13/2010 8:57 5/14/2010 1:33 0.011 68 0.0005 0.0050 0.0019 0.0005 0.0024 0.0119 0.02 0.79 0.072 0.08 0.03 249 5 3 132Storm Composite 6/8/2010 7:54 6/8/2010 10:45 0.050 62 0.0005 0.0050 0.0023 0.0003 0.0019 0.0098 0.02 0.71 0.207 0.05 0.03 210 6 4 56Storm Composite 6/11/2010 7:34 6/11/2010 13:55 47 0.0005 0.0050 0.0023 0.0054 0.0017 0.0127 0.14 0.87 0.185 0.05 0.03 164 15 7 84Storm Composite 6/25/2010 19:21 6/26/2010 0:09 0.052 45 0.0005 0.0050 0.0039 0.0031 0.0024 0.0167 0.61 1.60 0.238 0.14 0.03 155 100 19 120Storm Composite 7/5/2010 15:21 7/6/2010 6:25 0.053 53 0.0005 0.0050 0.0023 0.0022 0.0019 0.0142 0.13 1.10 0.364 0.05 0.03 219 26 9 120Storm Grab 7/8/2010 9:42 7/8/2010 9:42 0.127 40 0.0005 0.0050 0.0010 0.0003 0.0016 0.0050 0.26 0.86 0.298 0.05 0.03 156 5 3 88Storm Composite 7/17/2010 22:02 7/18/2010 9:19 0.064 44 0.0005 0.0050 0.0016 0.0006 0.0018 0.0105 0.39 1.50 0.276 0.06 0.03 191 11 6 104Storm Composite 8/8/2010 6:19 8/8/2010 14:41 0.026 63 0.0005 0.0050 0.0019 0.0049 0.0023 0.0142 0.02 0.86 0.297 0.05 0.03 212 646 22 164Storm Composite 8/10/2010 10:52 8/10/2010 22:23 0.084 34 0.0005 0.0050 0.0023 0.0023 0.0024 0.0213 0.09 1.10 0.338 0.05 0.03 148 155 10 120Storm Composite 8/31/2010 5:30 8/31/2010 19:09 0.024 89 0.0005 0.0050 0.0041 0.0041 0.0030 0.0104 0.02 0.93 0.220 0.05 0.03 355 8 6 232Storm Composite 9/15/2010 5:49 9/16/2010 0:02 0.029 71 0.0005 0.0050 0.0020 0.0014 0.0027 0.0164 0.02 1.60 0.265 0.05 0.03 312 16 10 192Storm Composite 9/22/2010 23:41 9/23/2010 13:30 0.039 33 0.0005 0.0050 0.0019 0.0006 0.0014 0.0257 0.02 0.65 0.153 0.06 0.03 187 16 6 120
Storm Average 0.053 64 0.0005 0.0055 0.0040 0.0033 0.0026 0.0251 0.17 1.07 0.270 0.10 0.03 236 93 15 130Annual Average 0.044 113 0.0006 0.0059 0.0042 0.0026 0.0054 0.0190 0.32 1.32 0.335 0.10 0.03 381 59 15 200
Annual Maximum 0.179 628 0.0010 0.0114 0.0256 0.0193 0.0200 0.1750 1.42 4.50 2.240 0.55 0.06 1,480 646 132 568Annual Minimum 0.007 33 0.0005 0.0050 0.0008 0.0003 0.0014 0.0050 0.02 0.65 0.072 0.05 0.03 148 3 3 56
Annual Median 0.032 68 0.0005 0.0050 0.0022 0.0014 0.0024 0.0119 0.14 1.10 0.237 0.05 0.03 312 12 6 164
Sample Sampling Start Sampling End E. coliType Date / Time Date / Time mpn/100mLBase Grab 1/12/2010 9:15 1/12/2010 9:15 15 number is approximate (~)Base Grab 2/10/2010 10:15 2/10/2010 10:15 1 actual value is less than numberBase Grab 3/18/2010 8:50 3/18/2010 8:50 39 actual value is greater than numberBase Grab 4/12/2010 12:35 4/12/2010 12:35 23 missing dataBase Grab 4/29/2010 11:55 4/29/2010 11:55 31 not collectedBase Grab 5/19/2010 9:30 5/19/2010 9:30 24Base Grab 6/17/2010 10:35 6/17/2010 10:35 613Base Grab 7/1/2010 8:50 7/1/2010 8:50 387Base Grab 7/15/2010 12:25 7/15/2010 12:25 435Base Grab 8/5/2010 12:49 8/5/2010 12:49 2,420Base Grab 8/25/2010 9:05 8/25/2010 9:05 28Base Grab 9/28/2010 9:11 9/28/2010 9:11 37Base Grab 10/11/2010 10:55 10/11/2010 10:55 102Base Grab 11/2/2010 11:00 11/2/2010 11:00 1,986Base Grab 12/7/2011 12:48 12/7/2011 12:48 248Storm Grab 3/10/2010 11:44 3/10/2010 11:44 488Storm Grab 5/7/2010 9:57 5/7/2010 9:57 2,000Storm Grab 5/11/2010 9:30 5/11/2010 9:30 172Storm Grab 6/8/2010 9:26 6/8/2010 9:26 770Storm Grab 6/14/2010 10:35 6/14/2010 10:35 727Storm Grab 8/10/2010 11:26 8/10/2010 11:26 9,700Storm Grab 9/23/2010 11:50 9/23/2010 11:50 4,100
Storm Average 1,107Annual Maximum 9,700Annual Minimum 1
Capitol Region Watershed District 2010 Monitoring Report 148
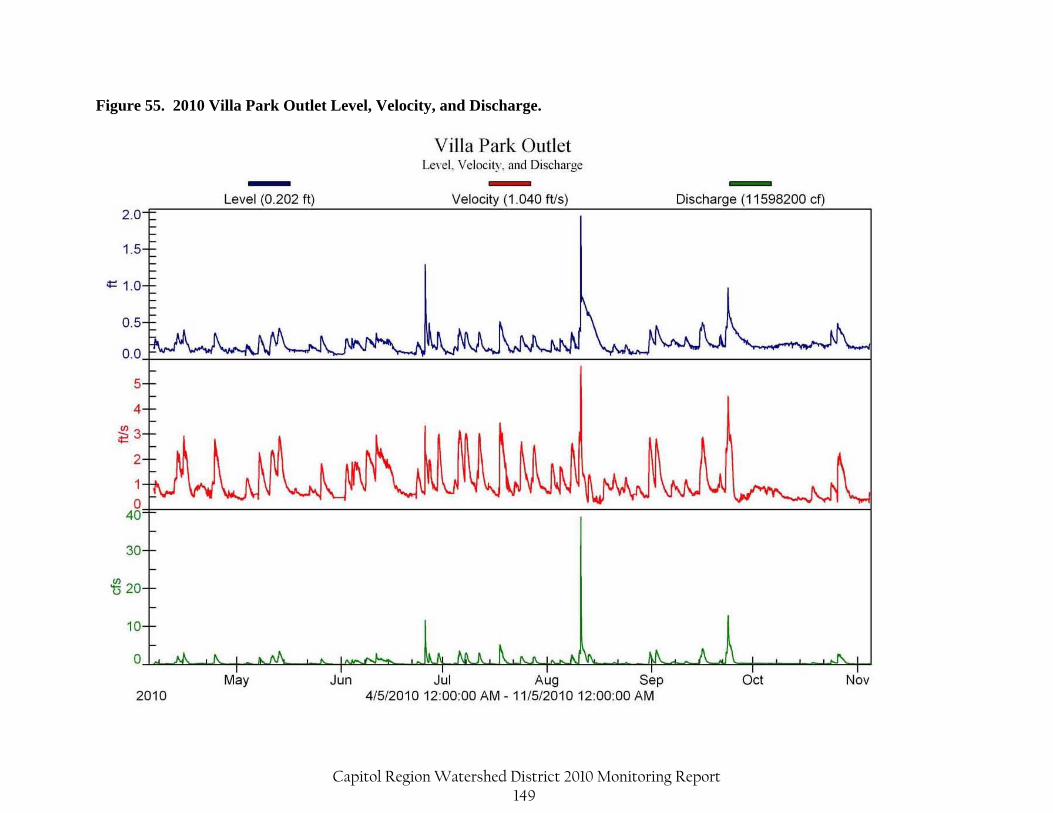
Figure 55. 2010 Villa Park Outlet Level, Velocity, and Discharge.
Capitol Region Watershed District 2010 Monitoring Report 149
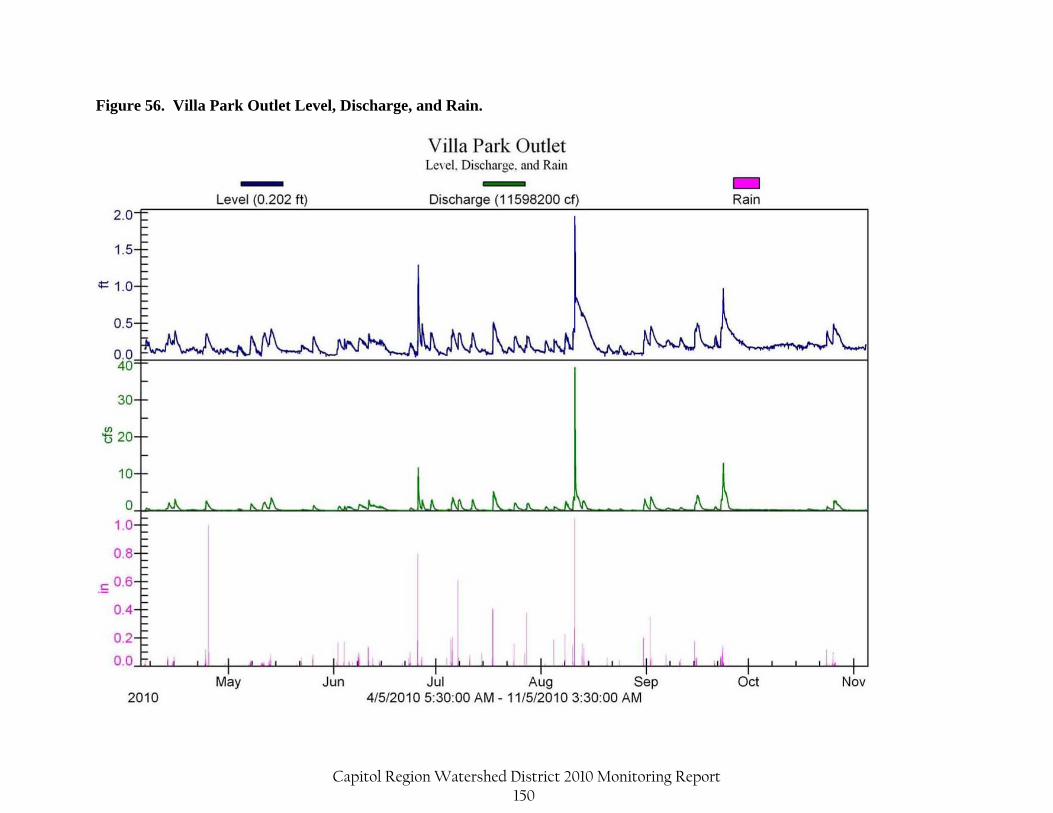
Figure 56. Villa Park Outlet Level, Discharge, and Rain.
Capitol Region Watershed District 2010 Monitoring Report 150
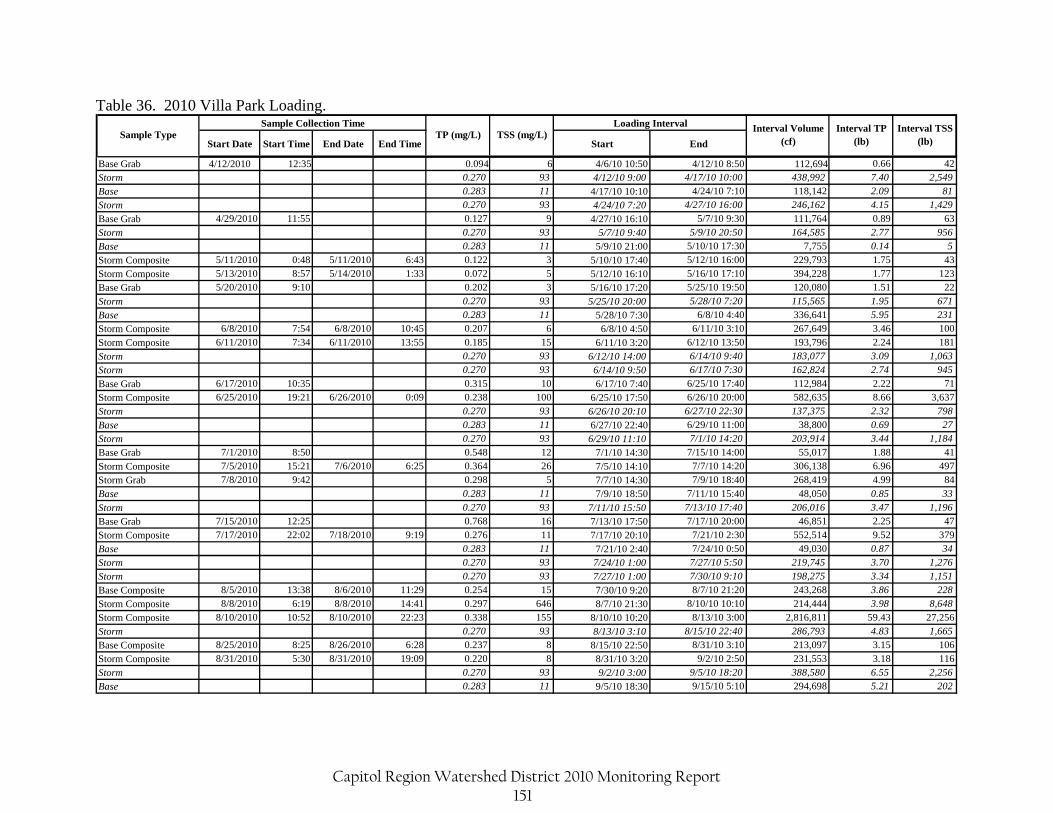
Table 36. 2010 Villa Park Loading.
Start Date Start Time End Date End Time Start End
Base Grab 4/12/2010 12:35 0.094 6 4/6/10 10:50 4/12/10 8:50 112,694 0.66 42
Storm 0.270 93 4/12/10 9:00 4/17/10 10:00 438,992 7.40 2,549
Base 0.283 11 4/17/10 10:10 4/24/10 7:10 118,142 2.09 81
Storm 0.270 93 4/24/10 7:20 4/27/10 16:00 246,162 4.15 1,429
Base Grab 4/29/2010 11:55 0.127 9 4/27/10 16:10 5/7/10 9:30 111,764 0.89 63
Storm 0.270 93 5/7/10 9:40 5/9/10 20:50 164,585 2.77 956
Base 0.283 11 5/9/10 21:00 5/10/10 17:30 7,755 0.14 5
Storm Composite 5/11/2010 0:48 5/11/2010 6:43 0.122 3 5/10/10 17:40 5/12/10 16:00 229,793 1.75 43
Storm Composite 5/13/2010 8:57 5/14/2010 1:33 0.072 5 5/12/10 16:10 5/16/10 17:10 394,228 1.77 123
Base Grab 5/20/2010 9:10 0.202 3 5/16/10 17:20 5/25/10 19:50 120,080 1.51 22
Storm 0.270 93 5/25/10 20:00 5/28/10 7:20 115,565 1.95 671
Base 0.283 11 5/28/10 7:30 6/8/10 4:40 336,641 5.95 231
Storm Composite 6/8/2010 7:54 6/8/2010 10:45 0.207 6 6/8/10 4:50 6/11/10 3:10 267,649 3.46 100
Storm Composite 6/11/2010 7:34 6/11/2010 13:55 0.185 15 6/11/10 3:20 6/12/10 13:50 193,796 2.24 181
Storm 0.270 93 6/12/10 14:00 6/14/10 9:40 183,077 3.09 1,063
Storm 0.270 93 6/14/10 9:50 6/17/10 7:30 162,824 2.74 945
Base Grab 6/17/2010 10:35 0.315 10 6/17/10 7:40 6/25/10 17:40 112,984 2.22 71
Storm Composite 6/25/2010 19:21 6/26/2010 0:09 0.238 100 6/25/10 17:50 6/26/10 20:00 582,635 8.66 3,637
Storm 0.270 93 6/26/10 20:10 6/27/10 22:30 137,375 2.32 798
Base 0.283 11 6/27/10 22:40 6/29/10 11:00 38,800 0.69 27
Storm 0.270 93 6/29/10 11:10 7/1/10 14:20 203,914 3.44 1,184
Base Grab 7/1/2010 8:50 0.548 12 7/1/10 14:30 7/15/10 14:00 55,017 1.88 41
Storm Composite 7/5/2010 15:21 7/6/2010 6:25 0.364 26 7/5/10 14:10 7/7/10 14:20 306,138 6.96 497
Storm Grab 7/8/2010 9:42 0.298 5 7/7/10 14:30 7/9/10 18:40 268,419 4.99 84
Base 0.283 11 7/9/10 18:50 7/11/10 15:40 48,050 0.85 33
Storm 0.270 93 7/11/10 15:50 7/13/10 17:40 206,016 3.47 1,196
Base Grab 7/15/2010 12:25 0.768 16 7/13/10 17:50 7/17/10 20:00 46,851 2.25 47
Storm Composite 7/17/2010 22:02 7/18/2010 9:19 0.276 11 7/17/10 20:10 7/21/10 2:30 552,514 9.52 379
Base 0.283 11 7/21/10 2:40 7/24/10 0:50 49,030 0.87 34
Storm 0.270 93 7/24/10 1:00 7/27/10 5:50 219,745 3.70 1,276
Storm 0.270 93 7/27/10 1:00 7/30/10 9:10 198,275 3.34 1,151
Base Composite 8/5/2010 13:38 8/6/2010 11:29 0.254 15 7/30/10 9:20 8/7/10 21:20 243,268 3.86 228
Storm Composite 8/8/2010 6:19 8/8/2010 14:41 0.297 646 8/7/10 21:30 8/10/10 10:10 214,444 3.98 8,648
Storm Composite 8/10/2010 10:52 8/10/2010 22:23 0.338 155 8/10/10 10:20 8/13/10 3:00 2,816,811 59.43 27,256
Storm 0.270 93 8/13/10 3:10 8/15/10 22:40 286,793 4.83 1,665
Base Composite 8/25/2010 8:25 8/26/2010 6:28 0.237 8 8/15/10 22:50 8/31/10 3:10 213,097 3.15 106
Storm Composite 8/31/2010 5:30 8/31/2010 19:09 0.220 8 8/31/10 3:20 9/2/10 2:50 231,553 3.18 116
Storm 0.270 93 9/2/10 3:00 9/5/10 18:20 388,580 6.55 2,256
Base 0.283 11 9/5/10 18:30 9/15/10 5:10 294,698 5.21 202
Loading Interval Interval Volume (cf)
Interval TP (lb)
Interval TSS (lb)
Sample TypeSample Collection Time
TP (mg/L) TSS (mg/L)
Capitol Region Watershed District 2010 Monitoring Report 151
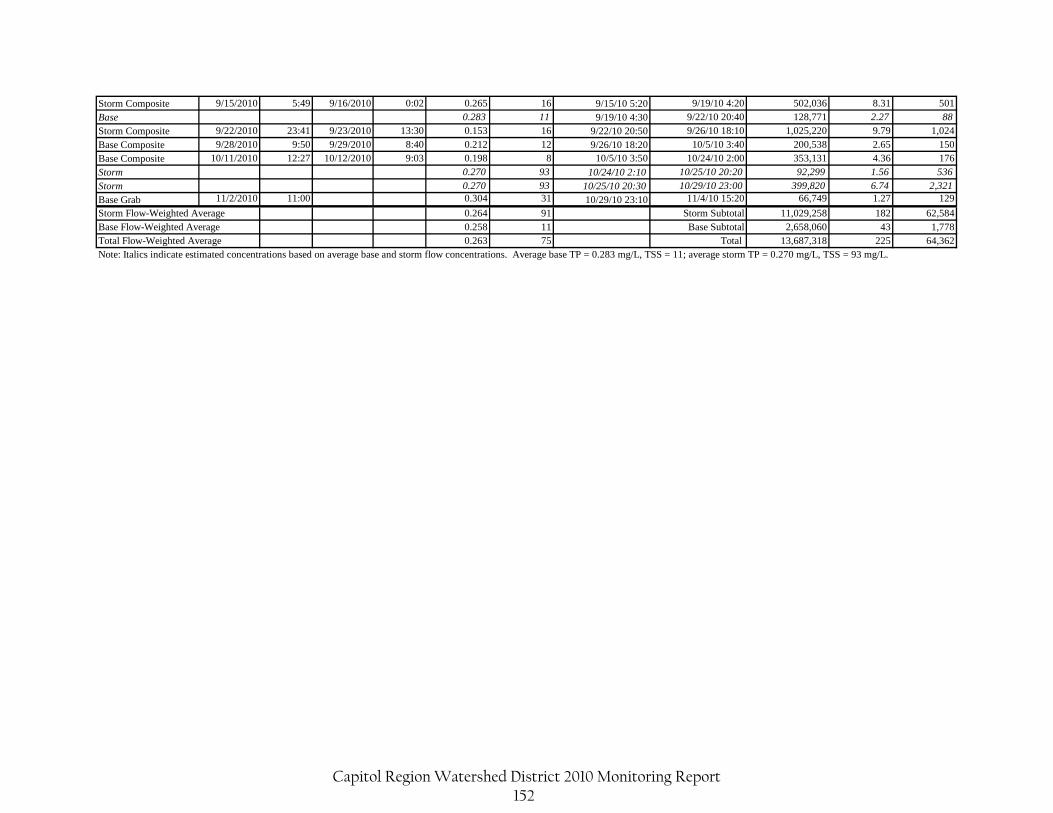
Storm Composite 9/15/2010 5:49 9/16/2010 0:02 0.265 16 9/15/10 5:20 9/19/10 4:20 502,036 8.31 501
Base 0.283 11 9/19/10 4:30 9/22/10 20:40 128,771 2.27 88
Storm Composite 9/22/2010 23:41 9/23/2010 13:30 0.153 16 9/22/10 20:50 9/26/10 18:10 1,025,220 9.79 1,024
Base Composite 9/28/2010 9:50 9/29/2010 8:40 0.212 12 9/26/10 18:20 10/5/10 3:40 200,538 2.65 150
Base Composite 10/11/2010 12:27 10/12/2010 9:03 0.198 8 10/5/10 3:50 10/24/10 2:00 353,131 4.36 176
Storm 0.270 93 10/24/10 2:10 10/25/10 20:20 92,299 1.56 536
Storm 0.270 93 10/25/10 20:30 10/29/10 23:00 399,820 6.74 2,321
Base Grab 11/2/2010 11:00 0.304 31 10/29/10 23:10 11/4/10 15:20 66,749 1.27 129
0.264 91 Storm Subtotal 11,029,258 182 62,5840.258 11 Base Subtotal 2,658,060 43 1,7780.263 75 Total 13,687,318 225 64,362
Note: Italics indicate estimated concentrations based on average base and storm flow concentrations. Average base TP = 0.283 mg/L, TSS = 11; average storm TP = 0.270 mg/L, TSS = 93 mg/L.
Storm Flow-Weighted AverageBase Flow-Weighted AverageTotal Flow-Weighted Average
Capitol Region Watershed District 2010 Monitoring Report 152
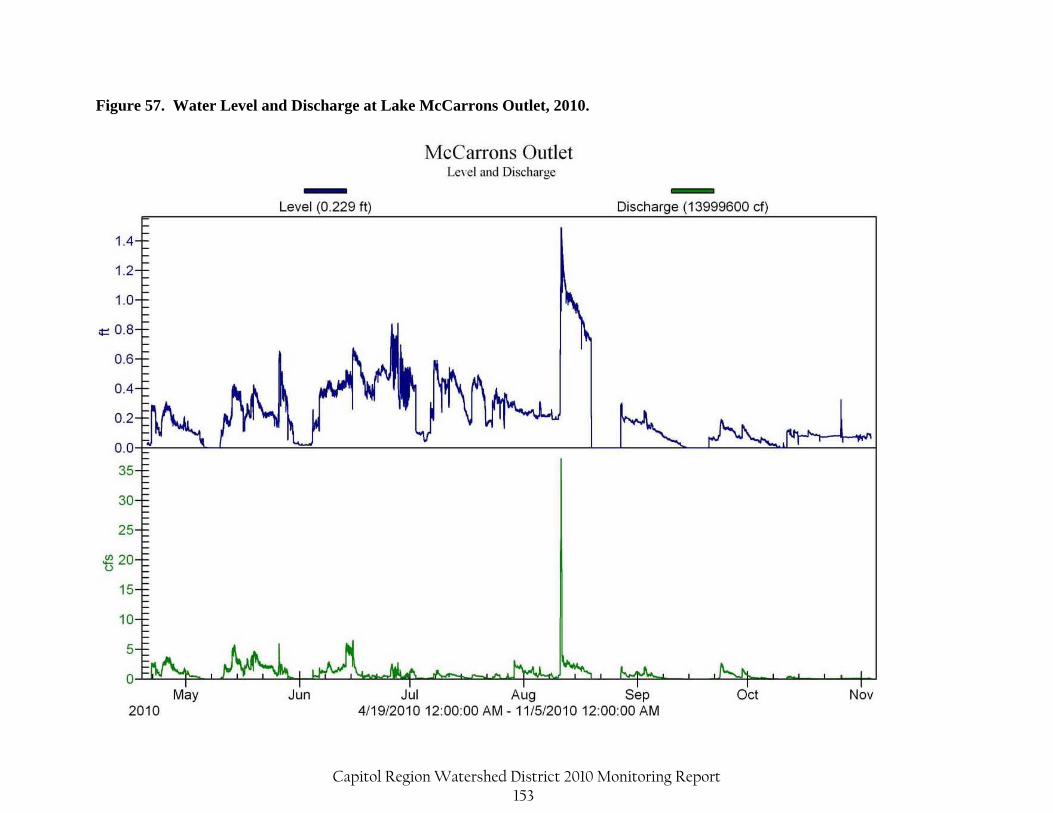
Figure 57. Water Level and Discharge at Lake McCarrons Outlet, 2010.
Capitol Region Watershed District 2010 Monitoring Report 153

Capitol Region Watershed District 2010 Monitoring Report 154

Appendix B

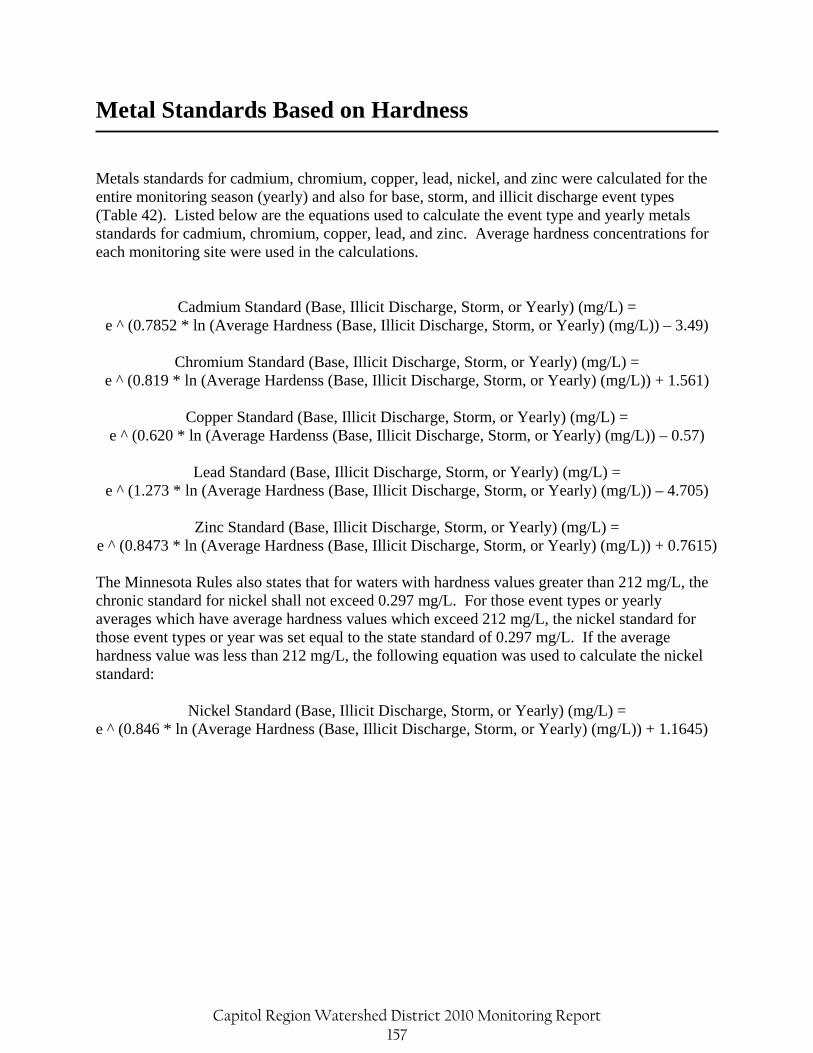
Metal Standards Based on Hardness Metals standards for cadmium, chromium, copper, lead, nickel, and zinc were calculated for the entire monitoring season (yearly) and also for base, storm, and illicit discharge event types (Table 42). Listed below are the equations used to calculate the event type and yearly metals standards for cadmium, chromium, copper, lead, and zinc. Average hardness concentrations for each monitoring site were used in the calculations.
Cadmium Standard (Base, Illicit Discharge, Storm, or Yearly) (mg/L) =
e ^ (0.7852 * ln (Average Hardness (Base, Illicit Discharge, Storm, or Yearly) (mg/L)) – 3.49)
Chromium Standard (Base, Illicit Discharge, Storm, or Yearly) (mg/L) = e ^ (0.819 * ln (Average Hardenss (Base, Illicit Discharge, Storm, or Yearly) (mg/L)) + 1.561)
Copper Standard (Base, Illicit Discharge, Storm, or Yearly) (mg/L) =
e ^ (0.620 * ln (Average Hardenss (Base, Illicit Discharge, Storm, or Yearly) (mg/L)) – 0.57)
Lead Standard (Base, Illicit Discharge, Storm, or Yearly) (mg/L) = e ^ (1.273 * ln (Average Hardness (Base, Illicit Discharge, Storm, or Yearly) (mg/L)) – 4.705)
Zinc Standard (Base, Illicit Discharge, Storm, or Yearly) (mg/L) =
e ^ (0.8473 * ln (Average Hardness (Base, Illicit Discharge, Storm, or Yearly) (mg/L)) + 0.7615) The Minnesota Rules also states that for waters with hardness values greater than 212 mg/L, the chronic standard for nickel shall not exceed 0.297 mg/L. For those event types or yearly averages which have average hardness values which exceed 212 mg/L, the nickel standard for those event types or year was set equal to the state standard of 0.297 mg/L. If the average hardness value was less than 212 mg/L, the following equation was used to calculate the nickel standard:
Nickel Standard (Base, Illicit Discharge, Storm, or Yearly) (mg/L) =
e ^ (0.846 * ln (Average Hardness (Base, Illicit Discharge, Storm, or Yearly) (mg/L)) + 1.1645)
Capitol Region Watershed District 2010 Monitoring Report 157
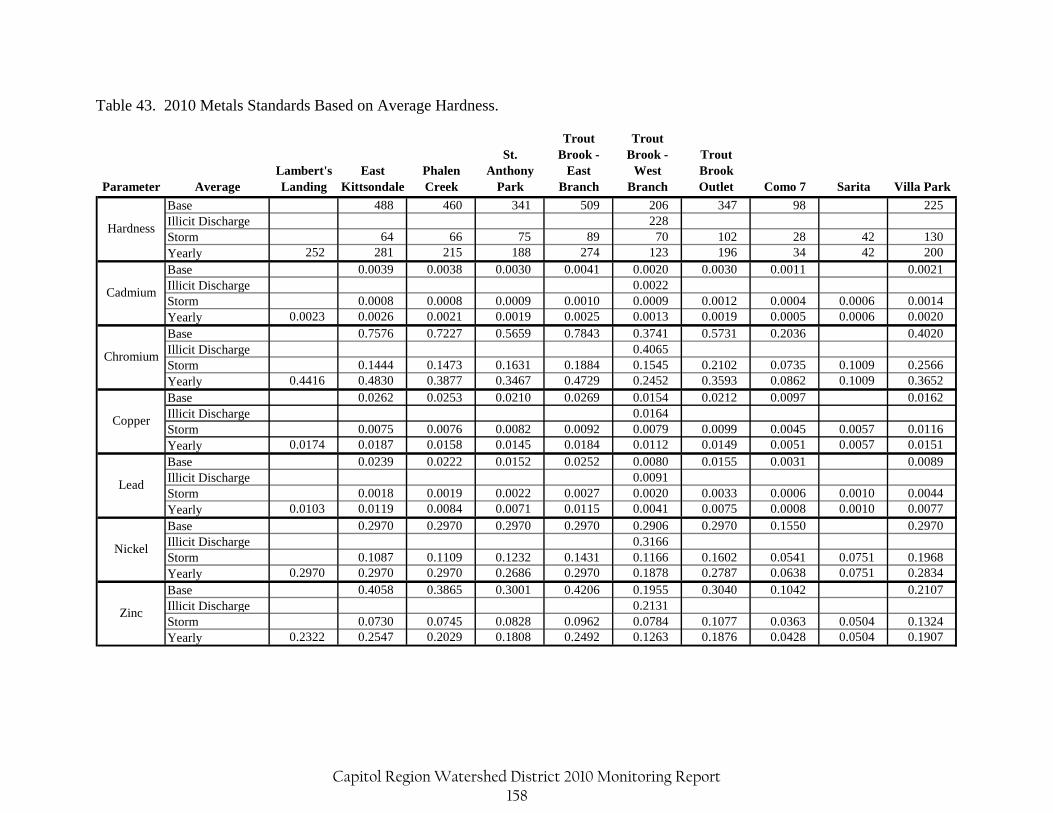
Table 43. 2010 Metals Standards Based on Average Hardness.
Parameter AverageLambert's Landing
East Kittsondale
Phalen Creek
St. Anthony
Park
Trout Brook -
East Branch
Trout Brook -
West Branch
Trout Brook Outlet Como 7 Sarita Villa Park
Base 488 460 341 509 206 347 98 225Illicit Discharge 228Storm 64 66 75 89 70 102 28 42 130Yearly 252 281 215 188 274 123 196 34 42 200Base 0.0039 0.0038 0.0030 0.0041 0.0020 0.0030 0.0011 0.0021Illicit Discharge 0.0022Storm 0.0008 0.0008 0.0009 0.0010 0.0009 0.0012 0.0004 0.0006 0.0014Yearly 0.0023 0.0026 0.0021 0.0019 0.0025 0.0013 0.0019 0.0005 0.0006 0.0020Base 0.7576 0.7227 0.5659 0.7843 0.3741 0.5731 0.2036 0.4020Illicit Discharge 0.4065Storm 0.1444 0.1473 0.1631 0.1884 0.1545 0.2102 0.0735 0.1009 0.2566Yearly 0.4416 0.4830 0.3877 0.3467 0.4729 0.2452 0.3593 0.0862 0.1009 0.3652Base 0.0262 0.0253 0.0210 0.0269 0.0154 0.0212 0.0097 0.0162Illicit Discharge 0.0164Storm 0.0075 0.0076 0.0082 0.0092 0.0079 0.0099 0.0045 0.0057 0.0116Yearly 0.0174 0.0187 0.0158 0.0145 0.0184 0.0112 0.0149 0.0051 0.0057 0.0151Base 0.0239 0.0222 0.0152 0.0252 0.0080 0.0155 0.0031 0.0089Illicit Discharge 0.0091Storm 0.0018 0.0019 0.0022 0.0027 0.0020 0.0033 0.0006 0.0010 0.0044Yearly 0.0103 0.0119 0.0084 0.0071 0.0115 0.0041 0.0075 0.0008 0.0010 0.0077Base 0.2970 0.2970 0.2970 0.2970 0.2906 0.2970 0.1550 0.2970Illicit Discharge 0.3166Storm 0.1087 0.1109 0.1232 0.1431 0.1166 0.1602 0.0541 0.0751 0.1968Yearly 0.2970 0.2970 0.2970 0.2686 0.2970 0.1878 0.2787 0.0638 0.0751 0.2834Base 0.4058 0.3865 0.3001 0.4206 0.1955 0.3040 0.1042 0.2107Illicit Discharge 0.2131Storm 0.0730 0.0745 0.0828 0.0962 0.0784 0.1077 0.0363 0.0504 0.1324Yearly 0.2322 0.2547 0.2029 0.1808 0.2492 0.1263 0.1876 0.0428 0.0504 0.1907
Zinc
Hardness
Cadmium
Chromium
Copper
Lead
Nickel
Capitol Region Watershed District 2010 Monitoring Report 158

Appendix C

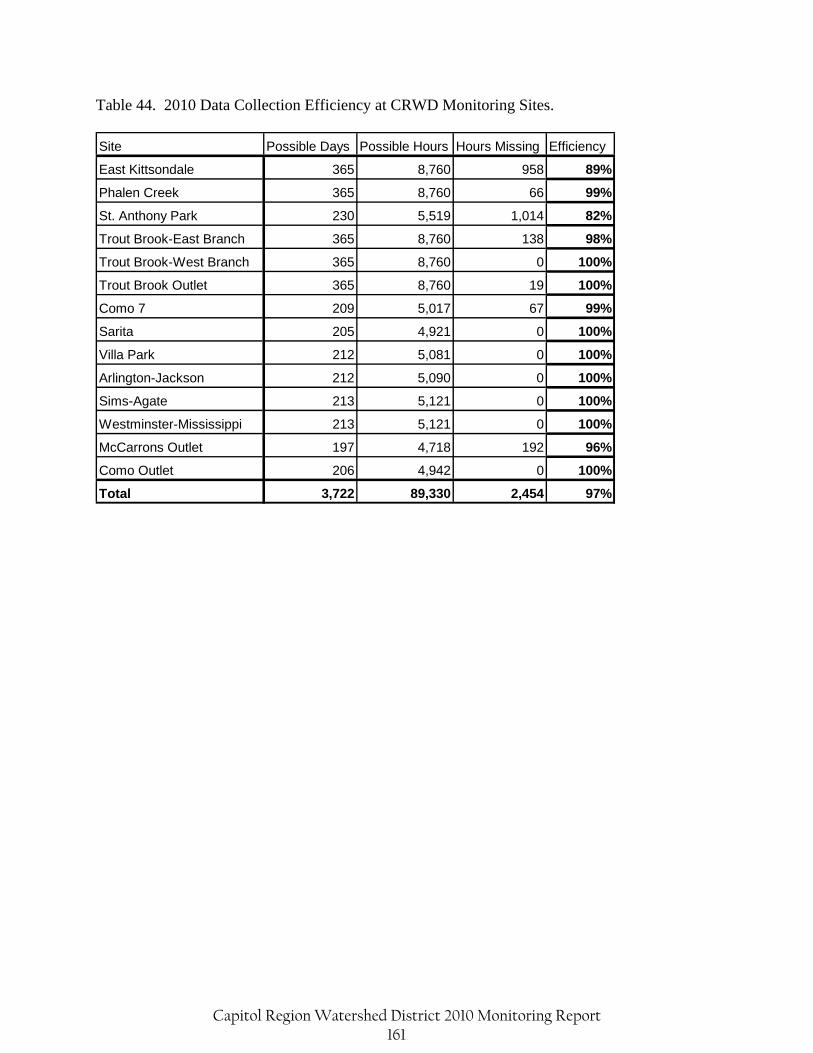
Table 44. 2010 Data Collection Efficiency at CRWD Monitoring Sites.
Site Possible Days Possible Hours Hours Missing Efficiency
East Kittsondale 365 8,760 958 89%
Phalen Creek 365 8,760 66 99%
St. Anthony Park 230 5,519 1,014 82%
Trout Brook-East Branch 365 8,760 138 98%
Trout Brook-West Branch 365 8,760 0 100%
Trout Brook Outlet 365 8,760 19 100%
Como 7 209 5,017 67 99%
Sarita 205 4,921 0 100%
Villa Park 212 5,081 0 100%
Arlington-Jackson 212 5,090 0 100%
Sims-Agate 213 5,121 0 100%
Westminster-Mississippi 213 5,121 0 100%
McCarrons Outlet 197 4,718 192 96%
Como Outlet 206 4,942 0 100%
Total 3,722 89,330 2,454 97%
Capitol Region Watershed District 2010 Monitoring Report 161
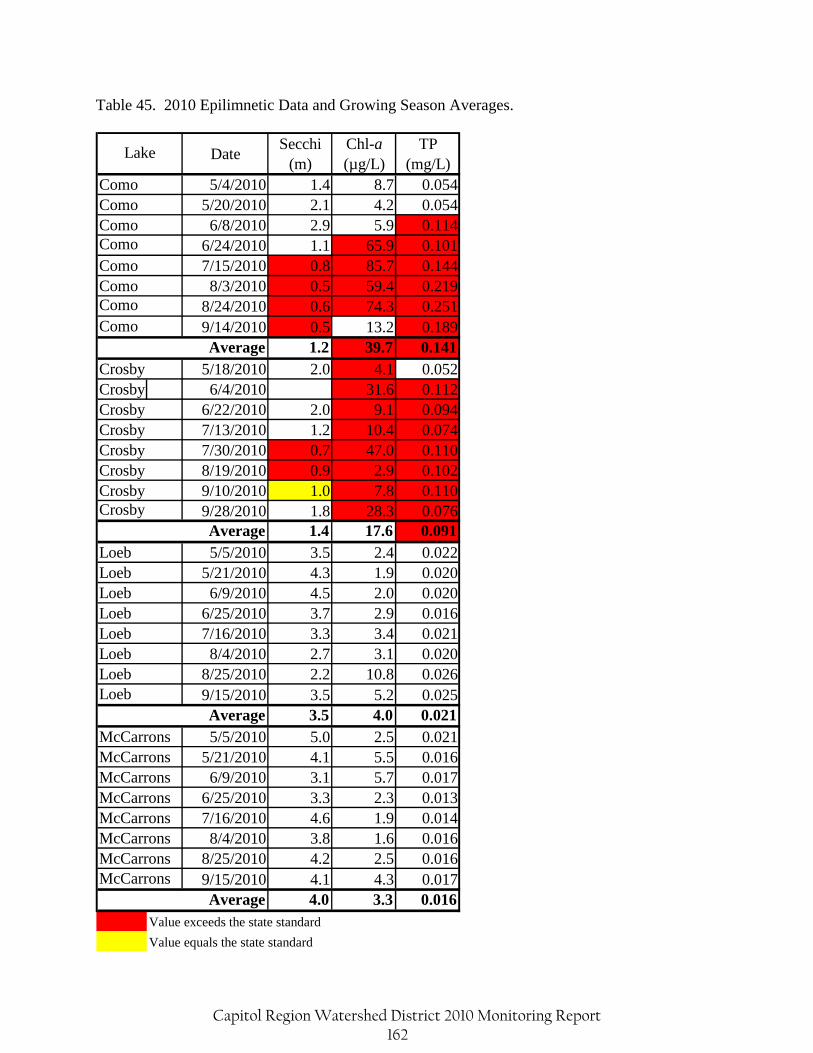
Table 45. 2010 Epilimnetic Data and Growing Season Averages.
DateSecchi
(m)Chl-a (µg/L)
TP (mg/L)
5/4/2010 1.4 8.7 0.0545/20/2010 2.1 4.2 0.0546/8/2010 2.9 5.9 0.114
6/24/2010 1.1 65.9 0.1017/15/2010 0.8 85.7 0.1448/3/2010 0.5 59.4 0.219
8/24/2010 0.6 74.3 0.2519/14/2010 0.5 13.2 0.189
1.2 39.7 0.1415/18/2010 2.0 4.1 0.052
Crosby 6/4/2010 31.6 0.1126/22/2010 2.0 9.1 0.0947/13/2010 1.2 10.4 0.0747/30/2010 0.7 47.0 0.1108/19/2010 0.9 2.9 0.1029/10/2010 1.0 7.8 0.1109/28/2010 1.8 28.3 0.076
1.4 17.6 0.0915/5/2010 3.5 2.4 0.022
5/21/2010 4.3 1.9 0.0206/9/2010 4.5 2.0 0.020
6/25/2010 3.7 2.9 0.0167/16/2010 3.3 3.4 0.0218/4/2010 2.7 3.1 0.020
8/25/2010 2.2 10.8 0.0269/15/2010 3.5 5.2 0.025
3.5 4.0 0.0215/5/2010 5.0 2.5 0.021
5/21/2010 4.1 5.5 0.0166/9/2010 3.1 5.7 0.017
6/25/2010 3.3 2.3 0.0137/16/2010 4.6 1.9 0.0148/4/2010 3.8 1.6 0.016
8/25/2010 4.2 2.5 0.0169/15/2010 4.1 4.3 0.017
4.0 3.3 0.016Value exceeds the state standard
Value equals the state standard
ComoComo
Lake
ComoComoComo
Crosby
ComoComoComo
AverageCrosby
CrosbyCrosbyCrosbyCrosbyCrosby
McCarronsMcCarrons
AverageLoebLoebLoebLoebLoebLoebLoebLoeb
Average
Average
McCarronsMcCarronsMcCarronsMcCarronsMcCarronsMcCarrons
Capitol Region Watershed District 2010 Monitoring Report 162

Appendix D

SPECIAL REPORT:
2005‐2010 Monitoring Data Summary for Total Pollutant Loads
Britta Suppes, Water Resource Technician
April 1, 2011
1410 Energy Park Drive, Suite 4, St. Paul, MN 55108 Phone: (651) 644-8888 Fax: (651) 644-8894 www.capitolregionwd.org
Capitol Region Watershed District
Capitol Region Watershed District 2010 Monitoring Report 165
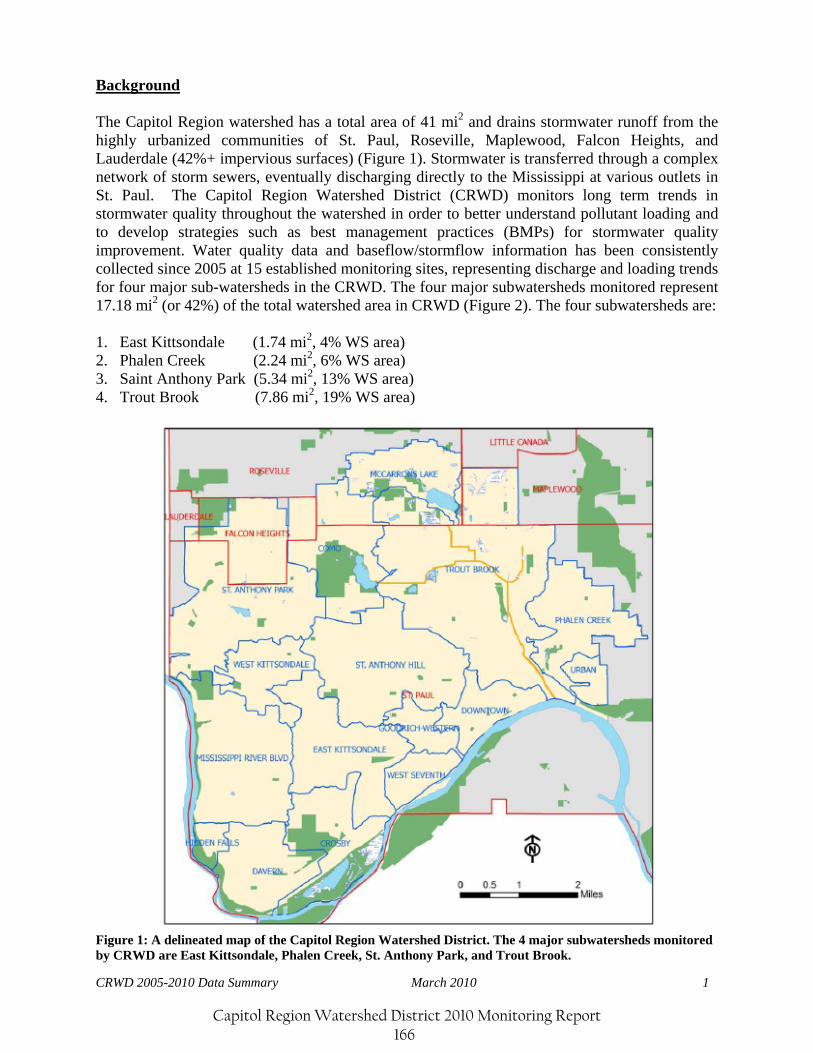
CRWD 2005-2010 Data Summary March 2010 1
Background The Capitol Region watershed has a total area of 41 mi2 and drains stormwater runoff from the highly urbanized communities of St. Paul, Roseville, Maplewood, Falcon Heights, and Lauderdale (42%+ impervious surfaces) (Figure 1). Stormwater is transferred through a complex network of storm sewers, eventually discharging directly to the Mississippi at various outlets in St. Paul. The Capitol Region Watershed District (CRWD) monitors long term trends in stormwater quality throughout the watershed in order to better understand pollutant loading and to develop strategies such as best management practices (BMPs) for stormwater quality improvement. Water quality data and baseflow/stormflow information has been consistently collected since 2005 at 15 established monitoring sites, representing discharge and loading trends for four major sub-watersheds in the CRWD. The four major subwatersheds monitored represent 17.18 mi2 (or 42%) of the total watershed area in CRWD (Figure 2). The four subwatersheds are: 1. East Kittsondale (1.74 mi2, 4% WS area) 2. Phalen Creek (2.24 mi2, 6% WS area) 3. Saint Anthony Park (5.34 mi2, 13% WS area) 4. Trout Brook (7.86 mi2, 19% WS area)
Figure 1: A delineated map of the Capitol Region Watershed District. The 4 major subwatersheds monitored by CRWD are East Kittsondale, Phalen Creek, St. Anthony Park, and Trout Brook.
Capitol Region Watershed District 2010 Monitoring Report 166
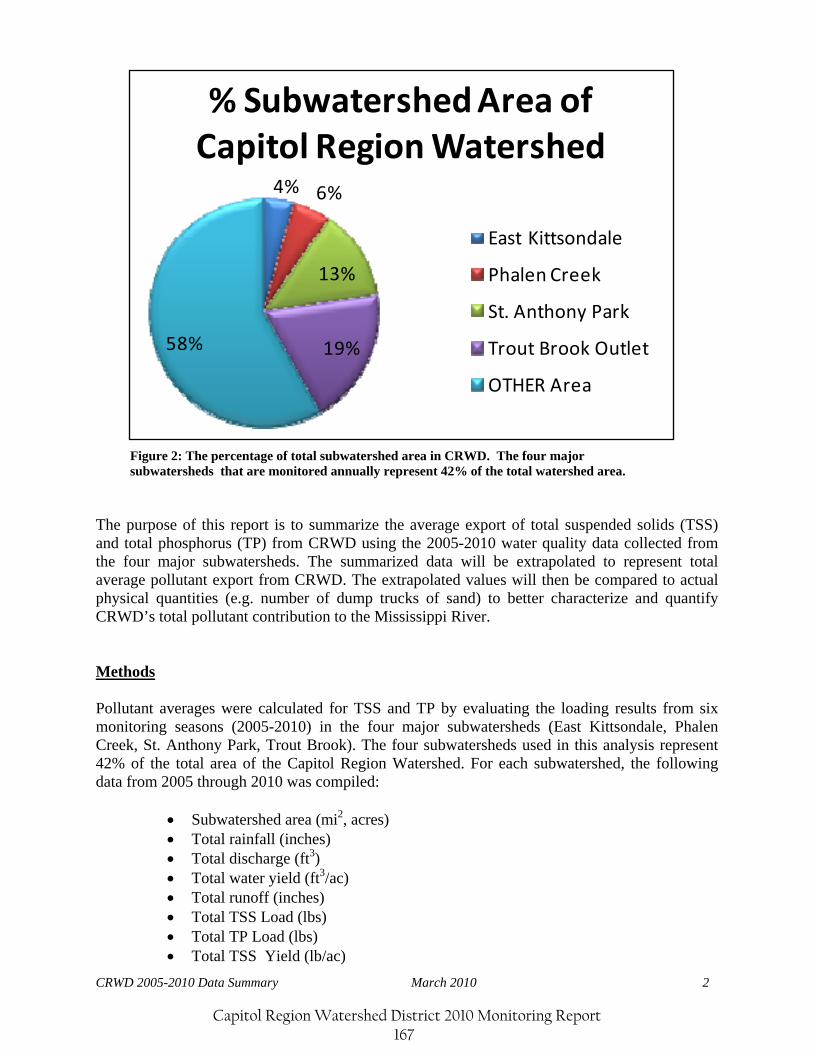
CRWD 2005-2010 Data Summary March 2010 2
4% 6%
13%
19%58%
% Subwatershed Area of Capitol Region Watershed
East Kittsondale
Phalen Creek
St. Anthony Park
Trout Brook Outlet
OTHER Area
The purpose of this report is to summarize the average export of total suspended solids (TSS) and total phosphorus (TP) from CRWD using the 2005-2010 water quality data collected from the four major subwatersheds. The summarized data will be extrapolated to represent total average pollutant export from CRWD. The extrapolated values will then be compared to actual physical quantities (e.g. number of dump trucks of sand) to better characterize and quantify CRWD’s total pollutant contribution to the Mississippi River. Methods Pollutant averages were calculated for TSS and TP by evaluating the loading results from six monitoring seasons (2005-2010) in the four major subwatersheds (East Kittsondale, Phalen Creek, St. Anthony Park, Trout Brook). The four subwatersheds used in this analysis represent 42% of the total area of the Capitol Region Watershed. For each subwatershed, the following data from 2005 through 2010 was compiled:
• Subwatershed area (mi2, acres) • Total rainfall (inches) • Total discharge (ft3) • Total water yield (ft3/ac) • Total runoff (inches) • Total TSS Load (lbs) • Total TP Load (lbs) • Total TSS Yield (lb/ac)
Figure 2: The percentage of total subwatershed area in CRWD. The four major subwatersheds that are monitored annually represent 42% of the total watershed area.
Capitol Region Watershed District 2010 Monitoring Report 167

CRWD 2005-2010 Data Summary March 2010 3
• Total TP Yield (lb/ac) • Normalized Total TSS Yield (lb/ac/in runoff) • Normalized Total TP Yield (lb/ac/in runoff)
Each of the four major subwatersheds investigated in this study varied greatly in size (total drainage area) and annual precipitation (spatial and temporal). Therefore, the data was normalized by subwatershed size (acres) and runoff (inches) in order to make meaningful comparisons between each site. Normalizing the TSS and TP loading data by total watershed acreage makes each subwatershed equivalent in size. Also, normalizing the data by total runoff effectively eliminates the influence of annual variations in precipitation trends as well as the year to year differences in monitoring season length. Normalized TSS and TP loads were calculated for each subwatershed site using the following equations:
Water Yield = ⎟⎠⎞
⎜⎝⎛
A
Q (Equation 1)
Where water yield = ft3/acre, Q = total discharge (ft3), and A = subwatershed area (acres).
Pollutant Yield = ⎟⎠⎞
⎜⎝⎛
A
L (Equation 2)
Where pollutant yield = lbs/acre of TP or TSS, L = total TP or TSS load (lbs), and A = subwatershed area (acres).
Runoff = ⎟⎟⎠
⎞⎜⎜⎝
⎛×
⎟⎟⎟⎟⎟
⎠
⎞
⎜⎜⎜⎜⎜
⎝
⎛
⎟⎟⎠
⎞⎜⎜⎝
⎛ ft
in
ft
acreA
Q
1
12
560,43
12
(Equation 3)
Where runoff = total subwatershed runoff (inches), Q = total discharge (ft3), and A = subwatershed area (acres).
Normalized Pollutant Yield =
⎟⎟⎟⎟
⎠
⎞
⎜⎜⎜⎜
⎝
⎛
ROA
L
(Equation 4)
Where normalized pollutant yield = lbs/acre/inches of runoff of TP or TSS, L = total TP or TSS load (lbs), and A = subwatershed area (acres), and RO = total subwatershed runoff (inches). The normalized TSS and TP loads were calculated using Equation 4 for each subwatershed from 2005 to 2010. The normalized values from 2005-2010 were summed and then averaged to find a mean load (lb/acres/in) for each subwatershed. This data was calculated in order to identify which subwatersheds are the greatest exporters of TSS and TP, regardless of subwatershed size and annual precipitation.
Capitol Region Watershed District 2010 Monitoring Report 168
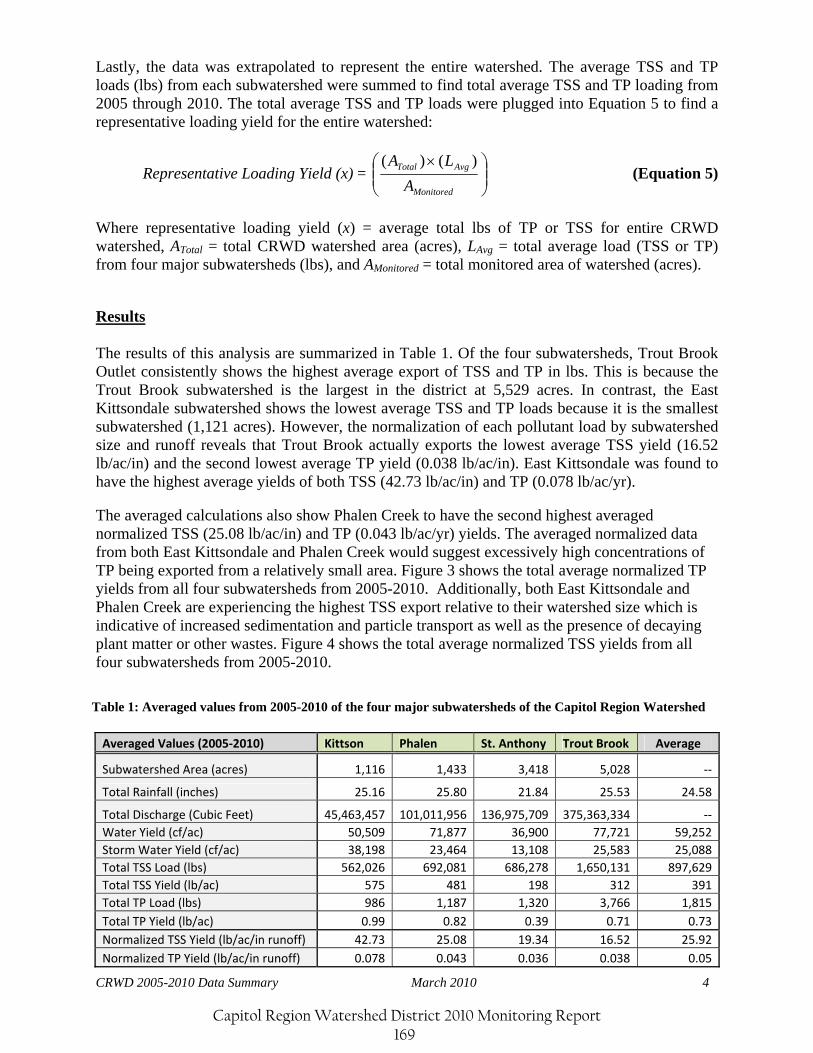
CRWD 2005-2010 Data Summary March 2010 4
Lastly, the data was extrapolated to represent the entire watershed. The average TSS and TP loads (lbs) from each subwatershed were summed to find total average TSS and TP loading from 2005 through 2010. The total average TSS and TP loads were plugged into Equation 5 to find a representative loading yield for the entire watershed:
Representative Loading Yield (x) = ⎟⎟⎠
⎞⎜⎜⎝
⎛ ×
Monitored
AvgTotal
A
LA )()( (Equation 5)
Where representative loading yield (x) = average total lbs of TP or TSS for entire CRWD watershed, ATotal = total CRWD watershed area (acres), LAvg = total average load (TSS or TP) from four major subwatersheds (lbs), and AMonitored = total monitored area of watershed (acres). Results The results of this analysis are summarized in Table 1. Of the four subwatersheds, Trout Brook Outlet consistently shows the highest average export of TSS and TP in lbs. This is because the Trout Brook subwatershed is the largest in the district at 5,529 acres. In contrast, the East Kittsondale subwatershed shows the lowest average TSS and TP loads because it is the smallest subwatershed (1,121 acres). However, the normalization of each pollutant load by subwatershed size and runoff reveals that Trout Brook actually exports the lowest average TSS yield (16.52 lb/ac/in) and the second lowest average TP yield (0.038 lb/ac/in). East Kittsondale was found to have the highest average yields of both TSS (42.73 lb/ac/in) and TP (0.078 lb/ac/yr). The averaged calculations also show Phalen Creek to have the second highest averaged normalized TSS (25.08 lb/ac/in) and TP (0.043 lb/ac/yr) yields. The averaged normalized data from both East Kittsondale and Phalen Creek would suggest excessively high concentrations of TP being exported from a relatively small area. Figure 3 shows the total average normalized TP yields from all four subwatersheds from 2005-2010. Additionally, both East Kittsondale and Phalen Creek are experiencing the highest TSS export relative to their watershed size which is indicative of increased sedimentation and particle transport as well as the presence of decaying plant matter or other wastes. Figure 4 shows the total average normalized TSS yields from all four subwatersheds from 2005-2010.
Averaged Values (2005‐2010) Kittson Phalen St. Anthony Trout Brook Average
Subwatershed Area (acres) 1,116 1,433 3,418 5,028 ‐‐
Total Rainfall (inches) 25.16 25.80 21.84 25.53 24.58
Total Discharge (Cubic Feet) 45,463,457 101,011,956 136,975,709 375,363,334 ‐‐Water Yield (cf/ac) 50,509 71,877 36,900 77,721 59,252Storm Water Yield (cf/ac) 38,198 23,464 13,108 25,583 25,088Total TSS Load (lbs) 562,026 692,081 686,278 1,650,131 897,629Total TSS Yield (lb/ac) 575 481 198 312 391Total TP Load (lbs) 986 1,187 1,320 3,766 1,815Total TP Yield (lb/ac) 0.99 0.82 0.39 0.71 0.73Normalized TSS Yield (lb/ac/in runoff) 42.73 25.08 19.34 16.52 25.92Normalized TP Yield (lb/ac/in runoff) 0.078 0.043 0.036 0.038 0.05
Table 1: Averaged values from 2005-2010 of the four major subwatersheds of the Capitol Region Watershed
Capitol Region Watershed District 2010 Monitoring Report 169
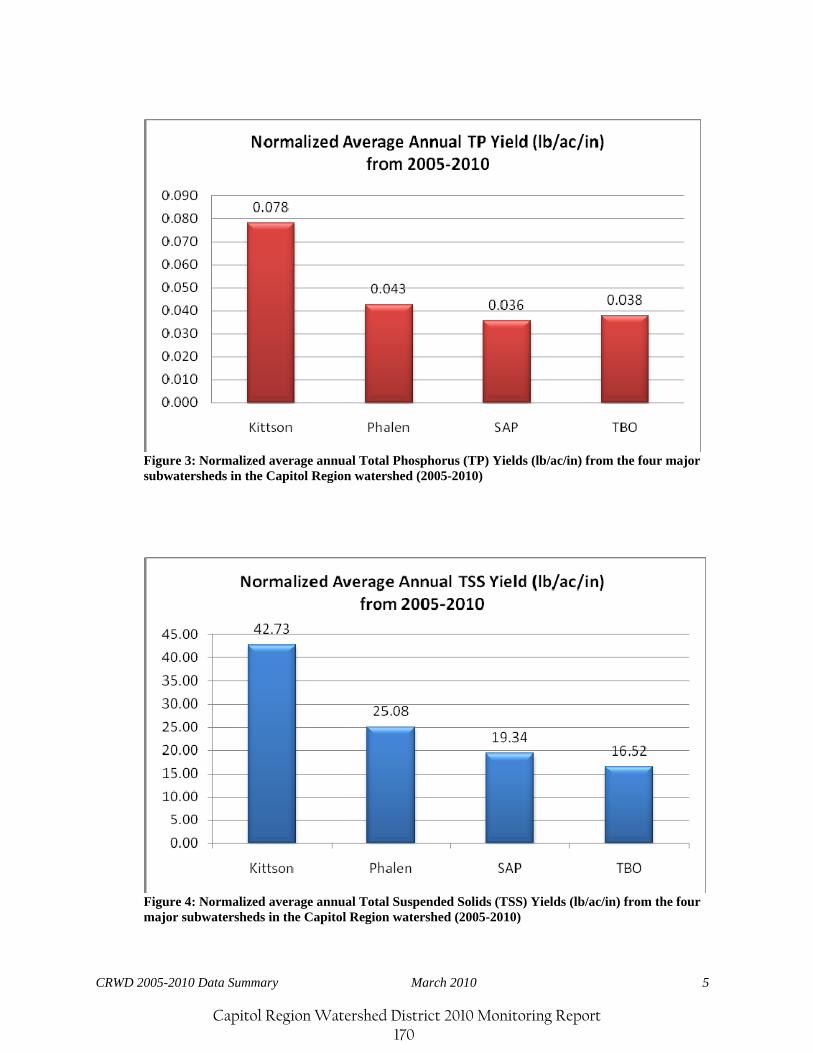
CRWD 2005-2010 Data Summary March 2010 5
Figure 3: Normalized average annual Total Phosphorus (TP) Yields (lb/ac/in) from the four major subwatersheds in the Capitol Region watershed (2005-2010)
Figure 4: Normalized average annual Total Suspended Solids (TSS) Yields (lb/ac/in) from the four major subwatersheds in the Capitol Region watershed (2005-2010)
Capitol Region Watershed District 2010 Monitoring Report 170
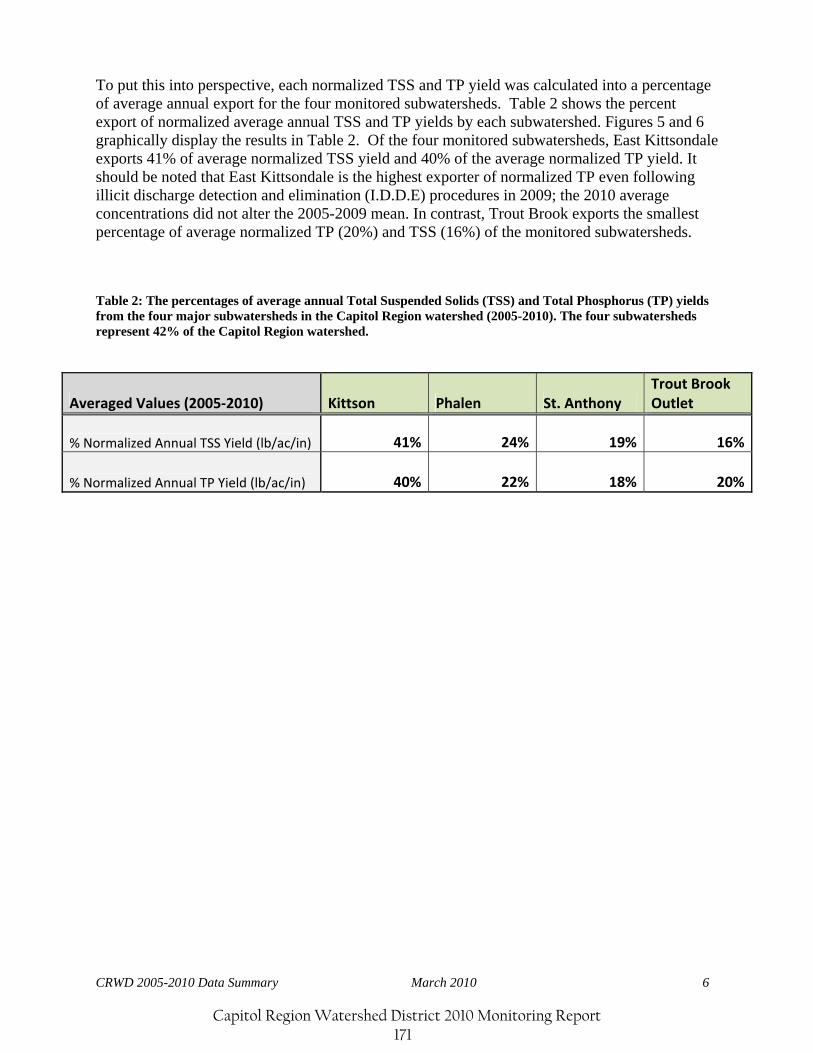
CRWD 2005-2010 Data Summary March 2010 6
To put this into perspective, each normalized TSS and TP yield was calculated into a percentage of average annual export for the four monitored subwatersheds. Table 2 shows the percent export of normalized average annual TSS and TP yields by each subwatershed. Figures 5 and 6 graphically display the results in Table 2. Of the four monitored subwatersheds, East Kittsondale exports 41% of average normalized TSS yield and 40% of the average normalized TP yield. It should be noted that East Kittsondale is the highest exporter of normalized TP even following illicit discharge detection and elimination (I.D.D.E) procedures in 2009; the 2010 average concentrations did not alter the 2005-2009 mean. In contrast, Trout Brook exports the smallest percentage of average normalized TP (20%) and TSS (16%) of the monitored subwatersheds. Table 2: The percentages of average annual Total Suspended Solids (TSS) and Total Phosphorus (TP) yields from the four major subwatersheds in the Capitol Region watershed (2005-2010). The four subwatersheds represent 42% of the Capitol Region watershed.
Averaged Values (2005‐2010) Kittson Phalen St. Anthony Trout Brook Outlet
% Normalized Annual TSS Yield (lb/ac/in) 41% 24% 19% 16%
% Normalized Annual TP Yield (lb/ac/in) 40% 22% 18% 20%
Capitol Region Watershed District 2010 Monitoring Report 171
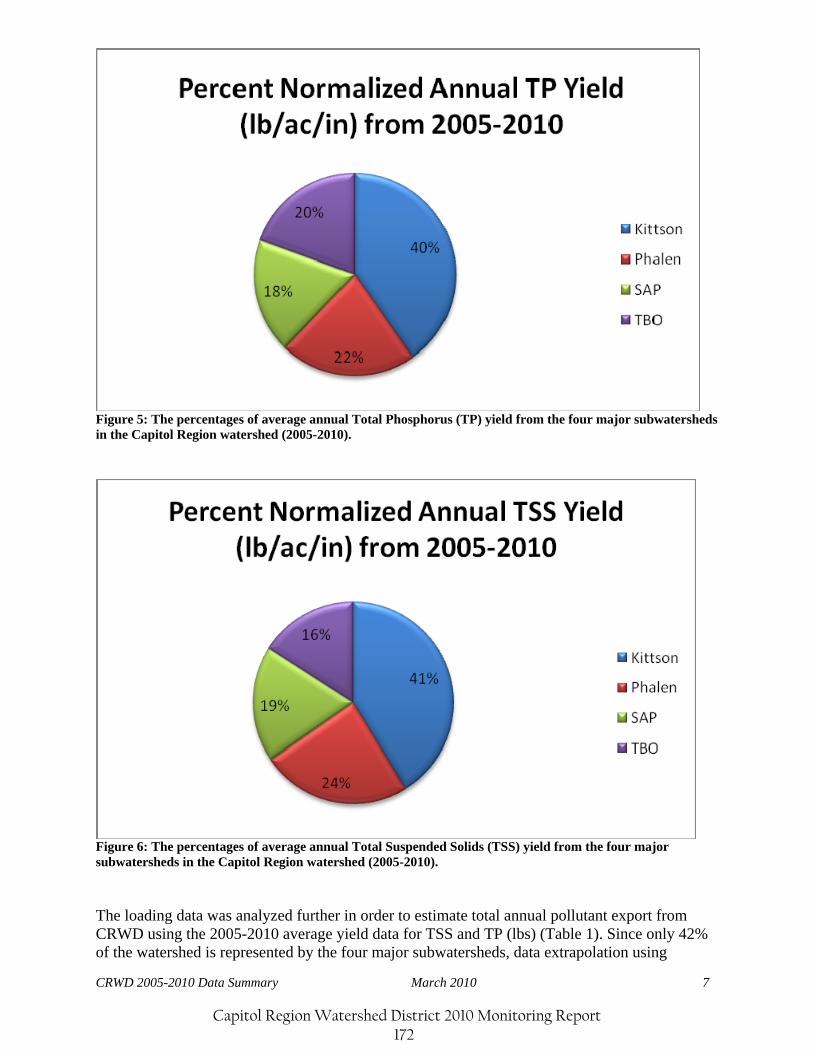
CRWD 2005-2010 Data Summary March 2010 7
Figure 5: The percentages of average annual Total Phosphorus (TP) yield from the four major subwatersheds in the Capitol Region watershed (2005-2010).
Figure 6: The percentages of average annual Total Suspended Solids (TSS) yield from the four major subwatersheds in the Capitol Region watershed (2005-2010). The loading data was analyzed further in order to estimate total annual pollutant export from CRWD using the 2005-2010 average yield data for TSS and TP (lbs) (Table 1). Since only 42% of the watershed is represented by the four major subwatersheds, data extrapolation using
Capitol Region Watershed District 2010 Monitoring Report 172
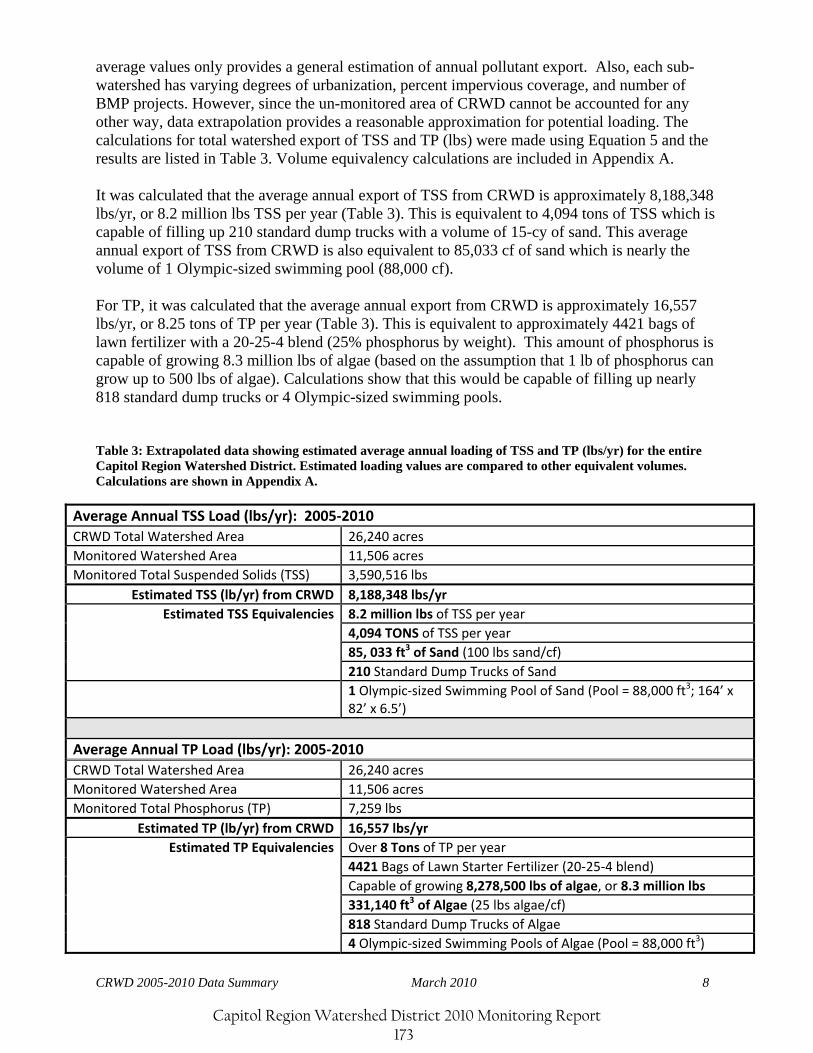
CRWD 2005-2010 Data Summary March 2010 8
average values only provides a general estimation of annual pollutant export. Also, each sub-watershed has varying degrees of urbanization, percent impervious coverage, and number of BMP projects. However, since the un-monitored area of CRWD cannot be accounted for any other way, data extrapolation provides a reasonable approximation for potential loading. The calculations for total watershed export of TSS and TP (lbs) were made using Equation 5 and the results are listed in Table 3. Volume equivalency calculations are included in Appendix A. It was calculated that the average annual export of TSS from CRWD is approximately 8,188,348 lbs/yr, or 8.2 million lbs TSS per year (Table 3). This is equivalent to 4,094 tons of TSS which is capable of filling up 210 standard dump trucks with a volume of 15-cy of sand. This average annual export of TSS from CRWD is also equivalent to 85,033 cf of sand which is nearly the volume of 1 Olympic-sized swimming pool (88,000 cf). For TP, it was calculated that the average annual export from CRWD is approximately 16,557 lbs/yr, or 8.25 tons of TP per year (Table 3). This is equivalent to approximately 4421 bags of lawn fertilizer with a 20-25-4 blend (25% phosphorus by weight). This amount of phosphorus is capable of growing 8.3 million lbs of algae (based on the assumption that 1 lb of phosphorus can grow up to 500 lbs of algae). Calculations show that this would be capable of filling up nearly 818 standard dump trucks or 4 Olympic-sized swimming pools. Table 3: Extrapolated data showing estimated average annual loading of TSS and TP (lbs/yr) for the entire Capitol Region Watershed District. Estimated loading values are compared to other equivalent volumes. Calculations are shown in Appendix A.
Average Annual TSS Load (lbs/yr): 2005‐2010 CRWD Total Watershed Area 26,240 acres Monitored Watershed Area 11,506 acres Monitored Total Suspended Solids (TSS) 3,590,516 lbs
Estimated TSS (lb/yr) from CRWD 8,188,348 lbs/yr Estimated TSS Equivalencies 8.2 million lbs of TSS per year
4,094 TONS of TSS per year 85, 033 ft3 of Sand (100 lbs sand/cf) 210 Standard Dump Trucks of Sand
1 Olympic‐sized Swimming Pool of Sand (Pool = 88,000 ft3; 164’ x 82’ x 6.5’)
Average Annual TP Load (lbs/yr): 2005‐2010 CRWD Total Watershed Area 26,240 acres Monitored Watershed Area 11,506 acres Monitored Total Phosphorus (TP) 7,259 lbs
Estimated TP (lb/yr) from CRWD 16,557 lbs/yr Estimated TP Equivalencies Over 8 Tons of TP per year
4421 Bags of Lawn Starter Fertilizer (20‐25‐4 blend) Capable of growing 8,278,500 lbs of algae, or 8.3 million lbs 331,140 ft3 of Algae (25 lbs algae/cf) 818 Standard Dump Trucks of Algae 4 Olympic‐sized Swimming Pools of Algae (Pool = 88,000 ft3)
Capitol Region Watershed District 2010 Monitoring Report 173
CRWD 2005-2010 Data Summary March 2010 9
Discussion & Conclusions The data compiled for this study summarizes average TP and TSS loading data from the four major subwatersheds of the Capitol Region watershed from 2005-2010. The purpose was to summarize the average export of total suspended solids (TSS) and total phosphorus (TP) from the monitored subwatersheds of CRWD in order to: a) identify the subwatershed with the highest average pollutant load and b) extrapolate the subwatershed loading data to find an estimated total annual pollutant export from CRWD. The results of this study have shown the East Kittsondale watershed to consistently be the highest exporter of TP and TSS in the Capitol Region watershed. East Kittonsdale is the smallest subwatershed of the four major subwatersheds encompassing only 1.74 mi2, but exports 40% of the average annual TP load and 41% of the average annual TSS load when compared to the others. Additional analysis could attempt to compare loading trends with land use activity; for example, Kittsondale and Phalen are nested in highly urbanized areas of St. Paul in comparison to the St. Anthony Park and Trout Brook subwatersheds. Statistical analysis could determine if there is a relationship between percent impervious surface and TP and TSS loading. The data evaluated in this study only represents loading trends from 17.18 mi2 (or 42%) of the total watershed area (41 mi2) in the Capitol Region watershed. Other subwatershed monitoring stations in the CRWD exist (i.e. Como 7 and Villa Park subwatersheds); however, the addition of these subwatershed monitoring stations only add on 6% more in total area monitored. Ultimately, CRWD only monitors 48% of the total watershed, leaving 52% of the Capitol Region watershed un-monitored. To account for this, data extrapolation of average pollutant loads (pounds) to represent total watershed export show that CRWD annually discharges an average of 8,188,348 lbs TSS and 16,557 lbs TP. For TSS, this is equivalent to 8.2 million lbs per year, or 210 dump trucks of sand. For TP, the estimated annual load is equivalent to over 8 tons of TP per year, or 4421 bags of lawn fertilizer. This amount of lawn fertilizer is capable of growing 8.3 million pounds of algae per year which would fill 818 dump trucks at 4 Olympic-sized swimming pools.
Capitol Region Watershed District 2010 Monitoring Report 174
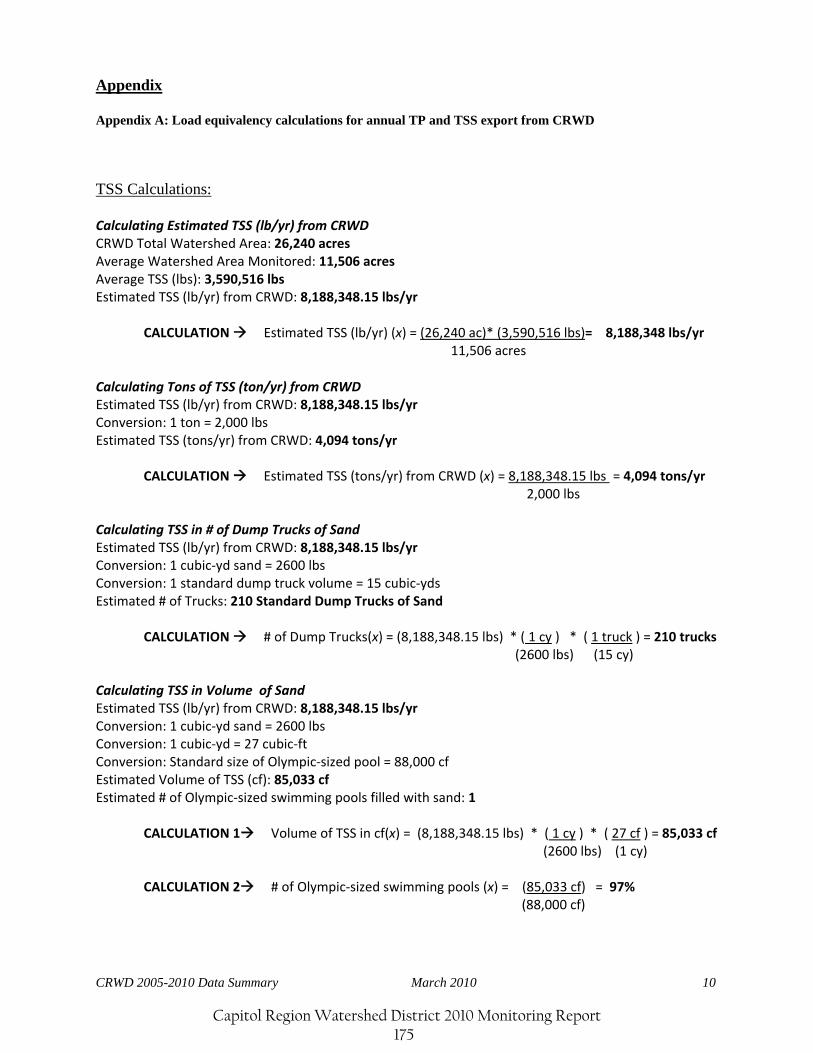
CRWD 2005-2010 Data Summary March 2010 10
Appendix Appendix A: Load equivalency calculations for annual TP and TSS export from CRWD TSS Calculations: Calculating Estimated TSS (lb/yr) from CRWD CRWD Total Watershed Area: 26,240 acres Average Watershed Area Monitored: 11,506 acres Average TSS (lbs): 3,590,516 lbs Estimated TSS (lb/yr) from CRWD: 8,188,348.15 lbs/yr CALCULATION Estimated TSS (lb/yr) (x) = (26,240 ac)* (3,590,516 lbs)= 8,188,348 lbs/yr 11,506 acres Calculating Tons of TSS (ton/yr) from CRWD Estimated TSS (lb/yr) from CRWD: 8,188,348.15 lbs/yr Conversion: 1 ton = 2,000 lbs Estimated TSS (tons/yr) from CRWD: 4,094 tons/yr
CALCULATION Estimated TSS (tons/yr) from CRWD (x) = 8,188,348.15 lbs = 4,094 tons/yr 2,000 lbs
Calculating TSS in # of Dump Trucks of Sand Estimated TSS (lb/yr) from CRWD: 8,188,348.15 lbs/yr Conversion: 1 cubic‐yd sand = 2600 lbs Conversion: 1 standard dump truck volume = 15 cubic‐yds Estimated # of Trucks: 210 Standard Dump Trucks of Sand
CALCULATION # of Dump Trucks(x) = (8,188,348.15 lbs) * ( 1 cy ) * ( 1 truck ) = 210 trucks (2600 lbs) (15 cy)
Calculating TSS in Volume of Sand Estimated TSS (lb/yr) from CRWD: 8,188,348.15 lbs/yr Conversion: 1 cubic‐yd sand = 2600 lbs Conversion: 1 cubic‐yd = 27 cubic‐ft Conversion: Standard size of Olympic‐sized pool = 88,000 cf Estimated Volume of TSS (cf): 85,033 cf Estimated # of Olympic‐sized swimming pools filled with sand: 1
CALCULATION 1 Volume of TSS in cf(x) = (8,188,348.15 lbs) * ( 1 cy ) * ( 27 cf ) = 85,033 cf (2600 lbs) (1 cy) CALCULATION 2 # of Olympic‐sized swimming pools (x) = (85,033 cf) = 97%
(88,000 cf)
Capitol Region Watershed District 2010 Monitoring Report 175

CRWD 2005-2010 Data Summary March 2010 11
TP Calculations: Calculating Estimated TP (lb/yr) from CRWD CRWD Total Watershed Area: 26,240 acres Average Watershed Area Monitored: 11,506 acres Average TP (lbs): 7,259.17 lbs Estimated TP (lb/yr) from CRWD: 16,556.89 lbs/yr CALCULATION Estimated TP (lb/yr) from CRWD(x) = (26,240 ac)* (7,259.17 lbs) = 16,556.89 lbs/yr 11,506 acres Calculating Tons of TP (ton/yr) from CRWD Estimated TP (lb/yr) from CRWD: 16,556.89 lbs/yr Conversion: 1 ton = 2,000 lbs Estimated TP (tons/yr) from CRWD: 8.28 tons/yr
CALCULATION Estimated TP (tons/yr) from CRWD (x) = 16,557 lbs = 8.28 tons/yr 2,000 lbs
Calculating TP in # of Fertilizer Bags Estimated TP (lb/yr) from CRWD: 16,556.89 lbs/yr Assumption 1: One 15‐lb bag of ‘Turf Starter’ fertilizer with a 20‐25‐4 blend (25% phosphorus by weight) Assumption 2: Phosphorus = 25% of 15 lbs, so 3.75 lbs of P per bag Estimated # of Trucks: 4,421 bags of fertilizer
CALCULATION Estimated # of Fertilizer Bags(x) = (16,557 lbs) = 4,421 bags of fertilizer (3.75 lbs)
Calculating TP in Volume of Algae Estimated TSS (lb/yr) from CRWD: 16,556.89 lbs/yr Assumption 1: 1 lb of P can grow 500 lbs of wet algae Assumption 2: 25 lbs wet algae per 1 cubic‐ft (assumed to be ¼ of weight of sand) Conversion 1: 1‐cy = 27‐cf Conversion2: 1 standard dump truck volume = 15 cubic‐yds Conversion 3: Standard size of Olympic‐sized pool = 88,000 cf Estimated weight of Algae produced by CRWD Average TP Export: 8,278,500 lbs Estimated Volume of Algae (cf): 331,140 cf Estimated # of Trucks: 818 Standard Dump Trucks of Algae Estimated # of Olympic‐sized swimming pools filled with algae: 4
CALCULATION 1 Weight of algae lbs(x) = (16,557 lbs) * (500 lbs) = 8,278,500 lbs CALCULATION 2 Volume of algae in cf(x) = (8,278,500 lbs) * ( 1 cf ) = 331,140 cf (25lbs) CALCULATION 3 # of Dump Trucks(x) = (8,278,500 lbs) * ( 1 cf ) * ( 1 cy ) * ( 1 truck ) = 818 (25 lbs) (27 cf) (15 cy) CALCULATION 4 # of Olympic‐sized swimming pools (x) = (331,140 cf) = 3.76 pools
(88,000 cf)
Capitol Region Watershed District 2010 Monitoring Report 176


![Risk MAP and Discovery FEMA Region [#], [WATERSHED NAME] Watershed Discovery Meetings [DATE]](https://img.pdfslide.net/doc/110x75/56649d005503460f949d2390/risk-map-and-discovery-fema-region-watershed-name-watershed-discovery.jpg)


![Risk MAP and Discovery FEMA Region [#], [WATERSHED NAME] Watershed Information Exchange Sessions [DATES]](https://img.pdfslide.net/doc/110x75/56649ed05503460f94bde97e/risk-map-and-discovery-fema-region-watershed-name-watershed-information.jpg)