Embed Size (px)
Citation preview
Roland-Holst 1
David Roland-Holst, UC Berkeley Seminar – Asian Development Bank Manila – 18 July 2013 [email protected]
CAPSIM: A Decision Tool for CAREC Regional Planning and Policy Dialog
Roland-Holst 2
Overview
Ø Regional economic integration is accelerating in Central Asia, significantly because of determined national and international commitments to infrastructure and other investments.
Ø This has been complimented by substantial progress on the institutional side, promoting a more open multilateral trade and investment environment.
Ø In a rapidly evolving regional economy, however, decision makers need support for more evidence-based strategic planning and engagement.
Ø This project develops a new generation of decision tools for economic analysis and policy dialog, nationally, regionally and with international development partners.
18 July 2013
Roland-Holst 3
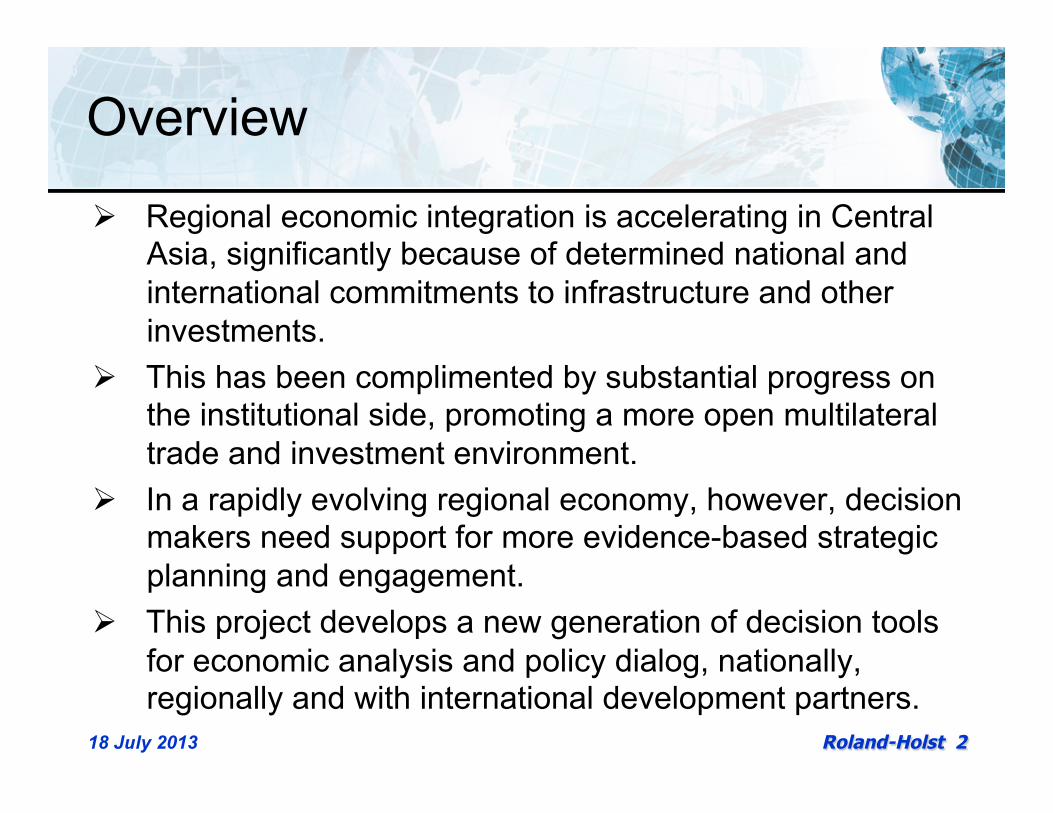
How evidence-based forecasting can help policy Ø Ex ante perspective: look before you leap Ø Identify/quantify impacts:
– Reduced costs (TTT, VOC, time, etc.) – Expanded investment horizons – Larger markets
Ø Transport vs. Development – capture integrated economic activities and indirect longer term impacts
Ø Trade creation vs. trade diversion Ø Second-generation infrastructure Ø Adjustment assistance Ø Support dialog generally
– Public: local, national, regional coherence/coordination – Private: arouse private stakeholders to complete the
Commitment Game 18 July 2013
Roland-Holst 4
CAPSIM: Central Asian Policy Simulation Model
Ø The basic architecture of this regional modeling facility is based on a global prototype designed at the University of California, Berkeley.
Ø This combines a multi-country Computable General Equilibrium (CGE) forecasting model with an interactive, user-friendly, browser-based interface.
Ø To protect confidentiality of official data, these tools are designed to be implemented on local computers rather than the Internet.
Ø Local policy researchers can vary input data and scenario assumptions and assess long term regional impacts and implications.
18 July 2013
Roland-Holst 5
Basic CAPSIM Ingredients
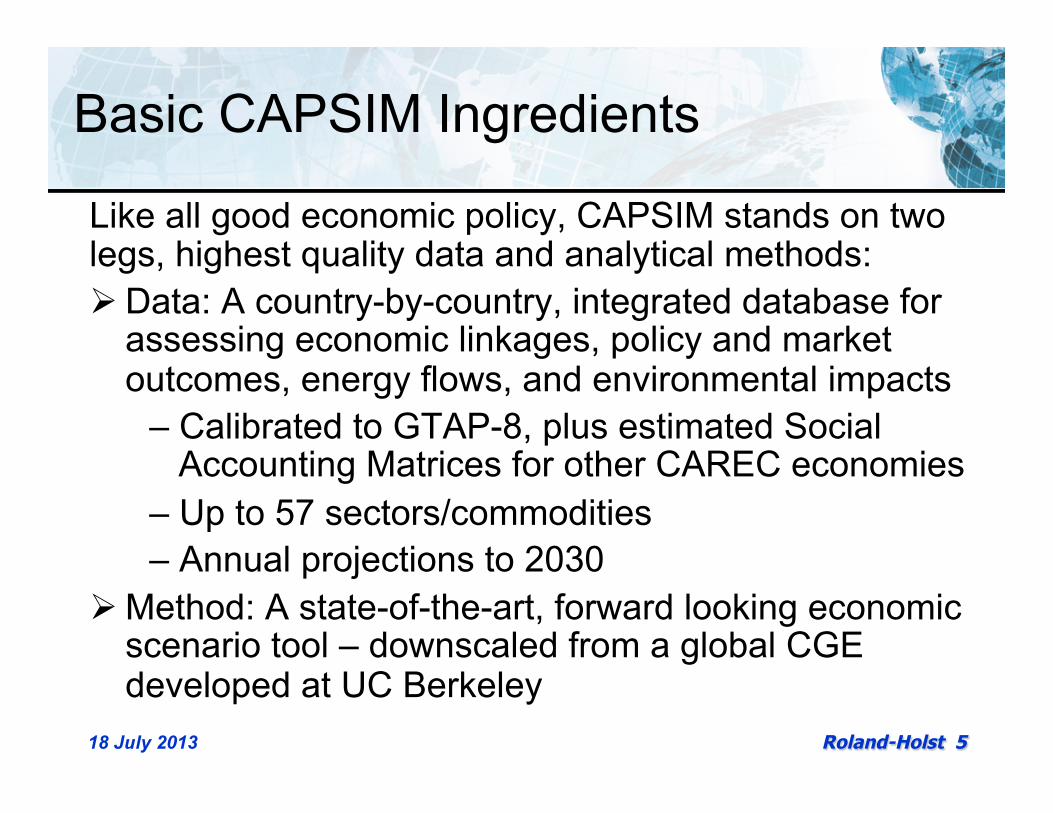
Like all good economic policy, CAPSIM stands on two legs, highest quality data and analytical methods: Ø Data: A country-by-country, integrated database for
assessing economic linkages, policy and market outcomes, energy flows, and environmental impacts
– Calibrated to GTAP-8, plus estimated Social Accounting Matrices for other CAREC economies
– Up to 57 sectors/commodities – Annual projections to 2030
Ø Method: A state-of-the-art, forward looking economic scenario tool – downscaled from a global CGE developed at UC Berkeley
18 July 2013
Roland-Holst 6
Available Data
18 July 2013
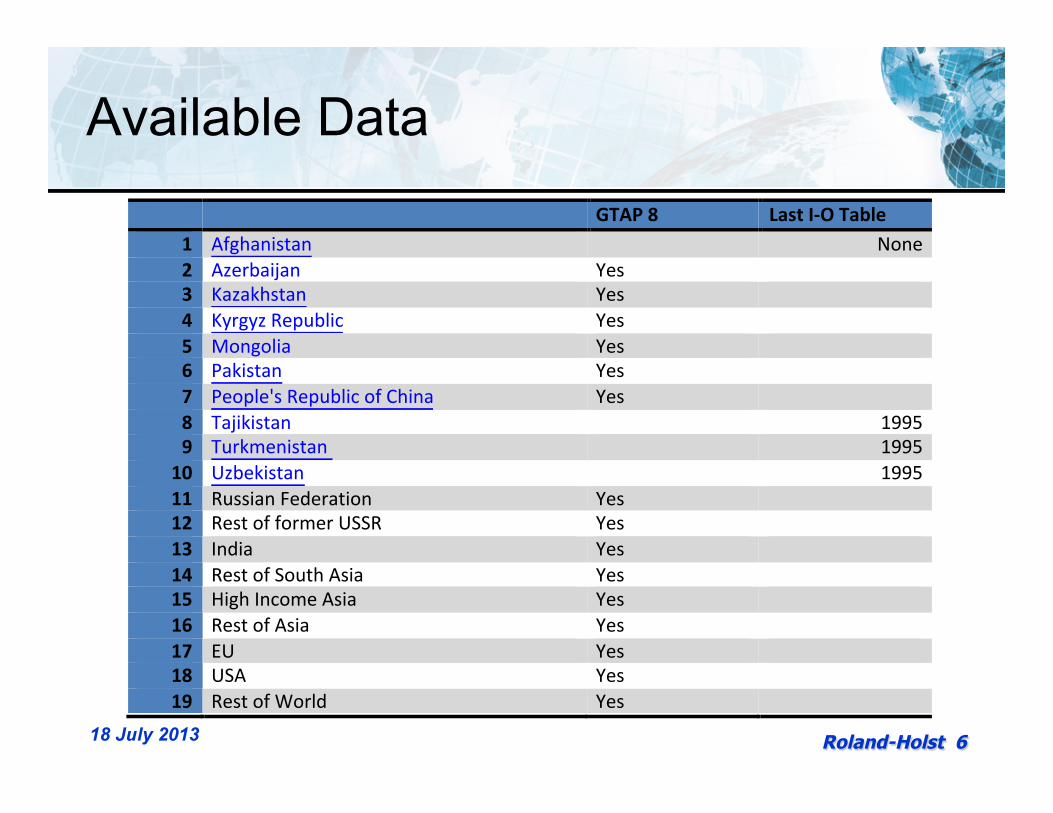
! ! GTAP!8! Last!I,O!Table!1! Afghanistan* * None*2! Azerbaijan* Yes* *3! Kazakhstan* Yes* *4! Kyrgyz*Republic* Yes* *5! Mongolia* Yes* *6! Pakistan* Yes* *7! People's*Republic*of*China* Yes* *8! Tajikistan* * 1995*9! Turkmenistan** * 1995*10! Uzbekistan* * 1995*11! Russian*Federation* Yes* *12! Rest*of*former*USSR* Yes* *13! India* Yes* *14! Rest*of*South*Asia* Yes* *15! High*Income*Asia* Yes* *16! Rest*of*Asia* Yes* *17! EU* Yes* *18! USA* Yes* *19! Rest*of*World* Yes* *
!
Roland-Holst 7
Other Candidates
Ø Xinjiang UAR Ø Inner Mongolia AR
18 July 2013
Roland-Holst 8
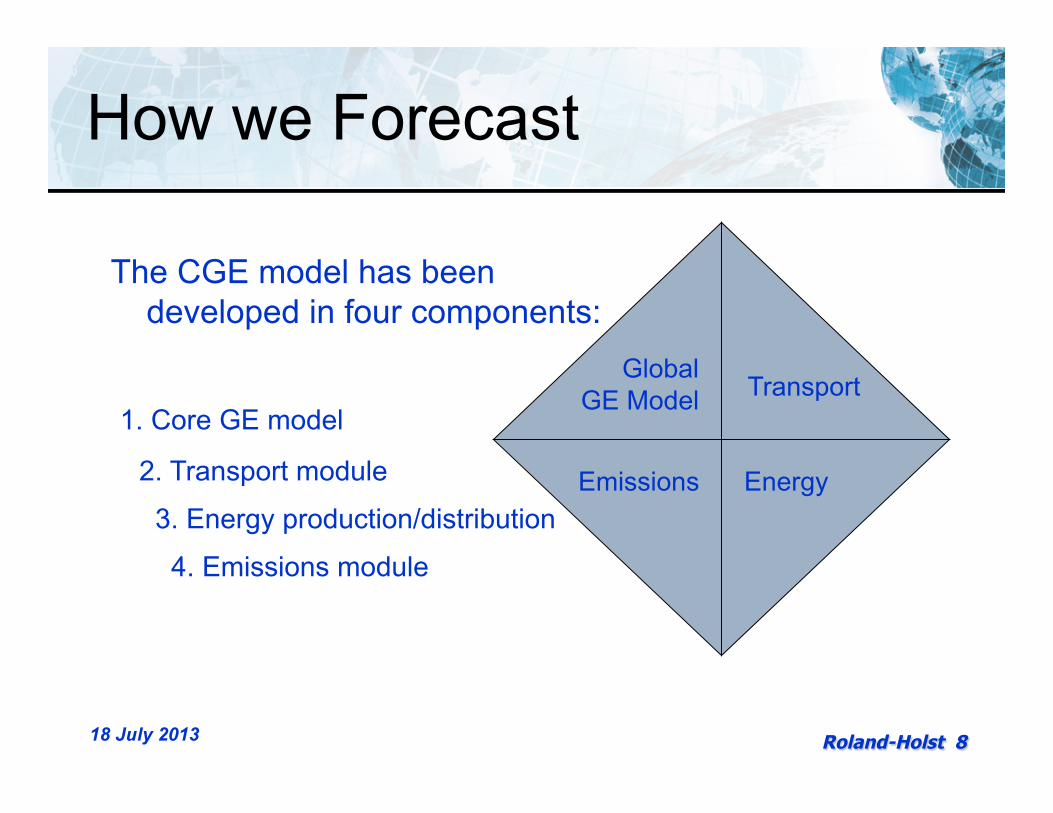
How we Forecast
18 July 2013
Global
GE Model
Emissions Energy
Transport
The CGE model has been developed in four components:
1. Core GE model
2. Transport module
3. Energy production/distribution
4. Emissions module
Roland-Holst 9
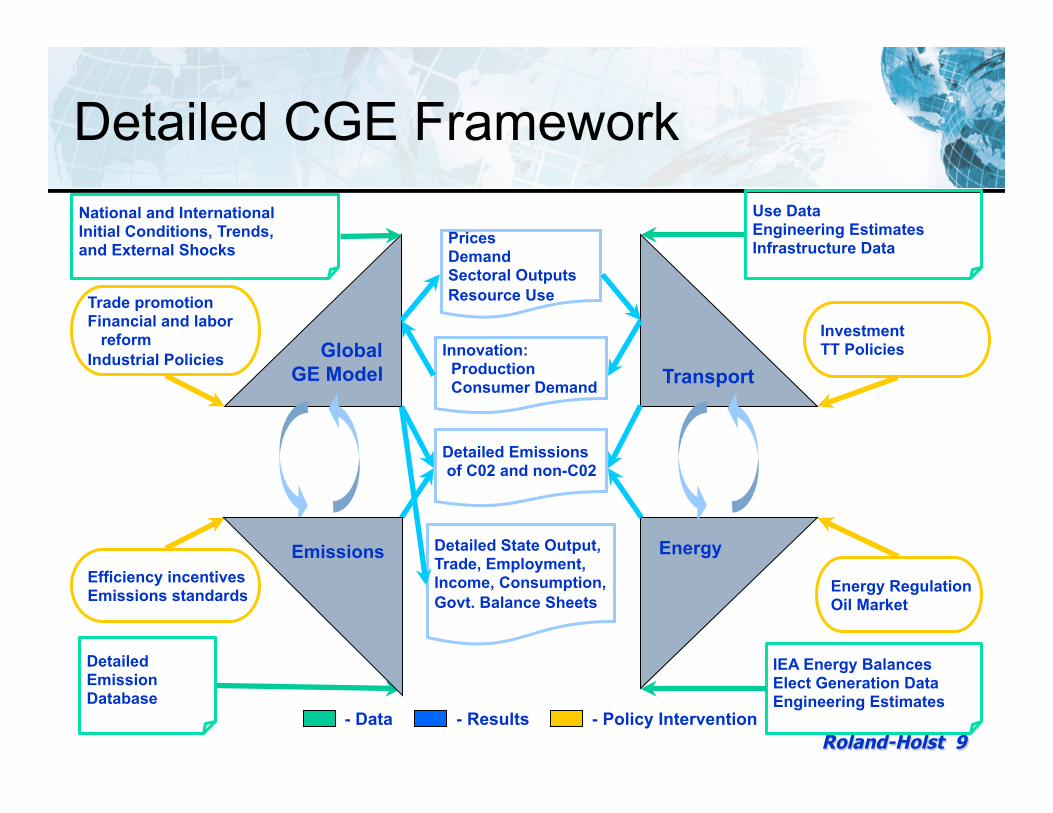
Detailed CGE Framework National and International Initial Conditions, Trends, and External Shocks
Use Data Engineering Estimates Infrastructure Data Prices
Demand Sectoral Outputs Resource Use
Detailed State Output, Trade, Employment, Income, Consumption, Govt. Balance Sheets
Trade promotion Financial and labor reform Industrial Policies
Investment TT Policies
Global
GE Model
Energy
Transport
IEA Energy Balances Elect Generation Data Engineering Estimates
Innovation: Production Consumer Demand
Energy Regulation Oil Market
- Data - Results - Policy Intervention
Detailed Emission Database
Efficiency incentives Emissions standards
Detailed Emissions of C02 and non-C02
Emissions
Roland-Holst 10
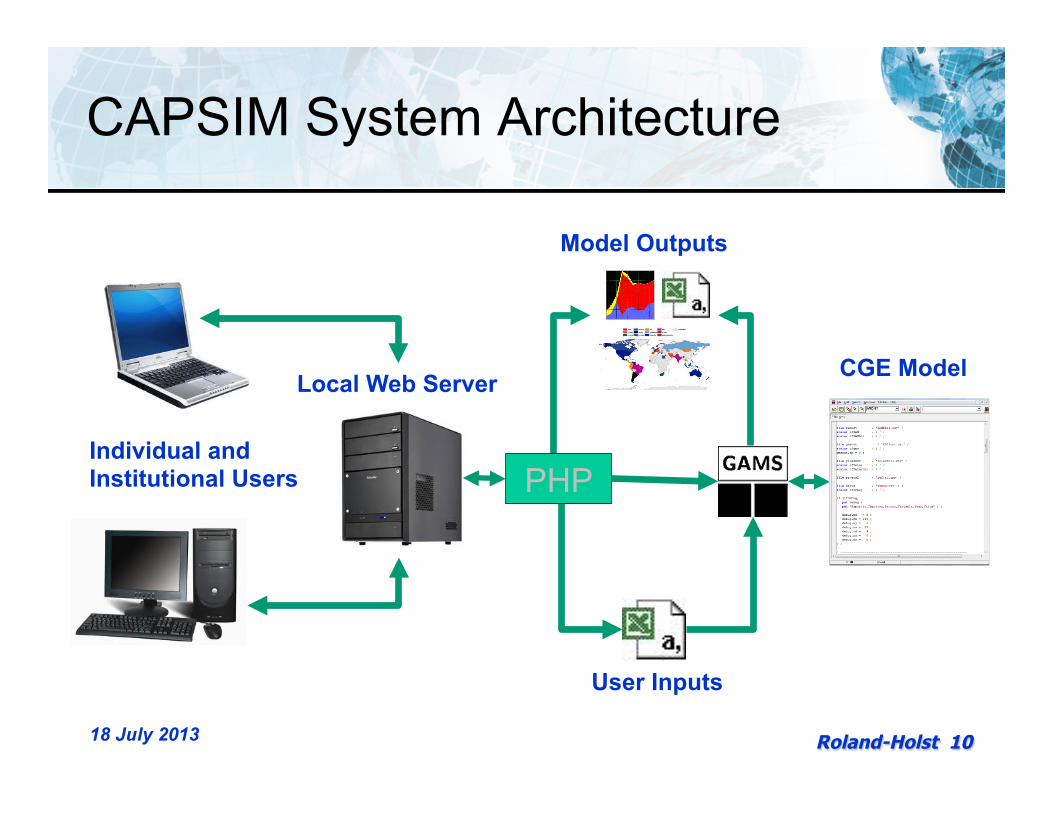
CAPSIM System Architecture
18 July 2013
Local Web Server
Individual and Institutional Users
CGE Model
User Inputs
Model Outputs
PHP
Roland-Holst 11
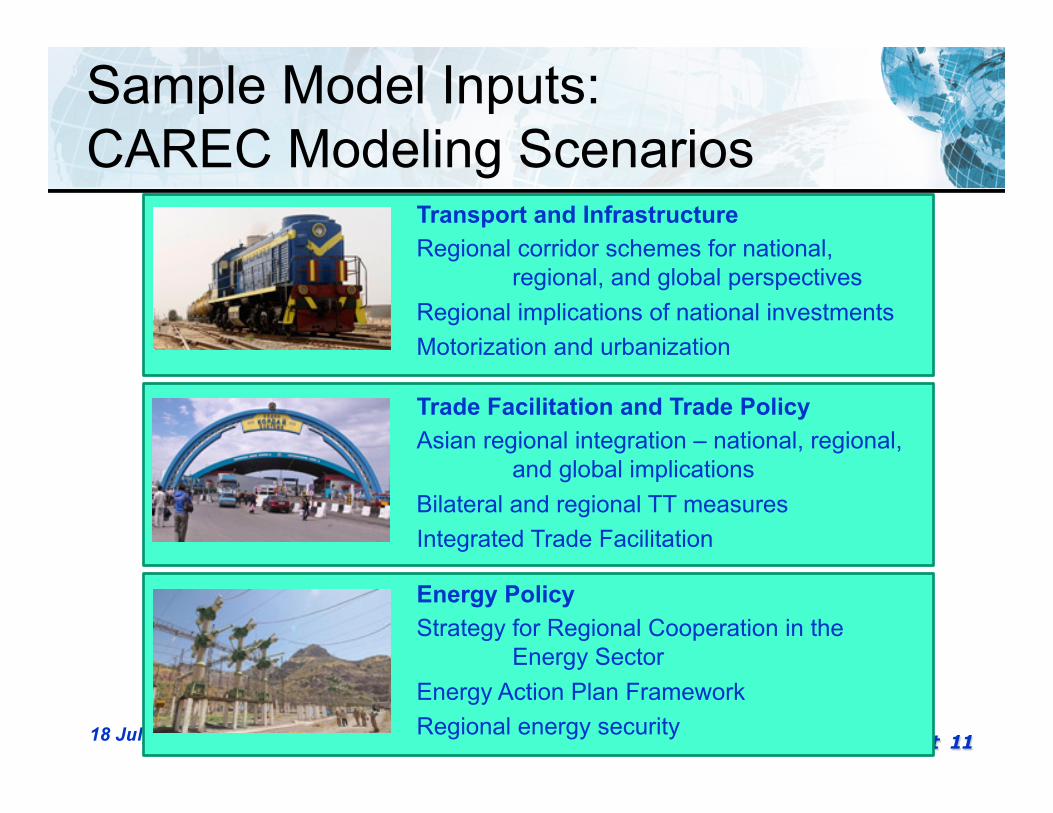
Sample Model Inputs: CAREC Modeling Scenarios
18 July 2013
Trade Facilitation and Trade Policy Asian regional integration – national, regional,
and global implications Bilateral and regional TT measures Integrated Trade Facilitation Energy Policy Strategy for Regional Cooperation in the
Energy Sector Energy Action Plan Framework Regional energy security
Transport and Infrastructure Regional corridor schemes for national,
regional, and global perspectives Regional implications of national investments Motorization and urbanization
Roland-Holst 12
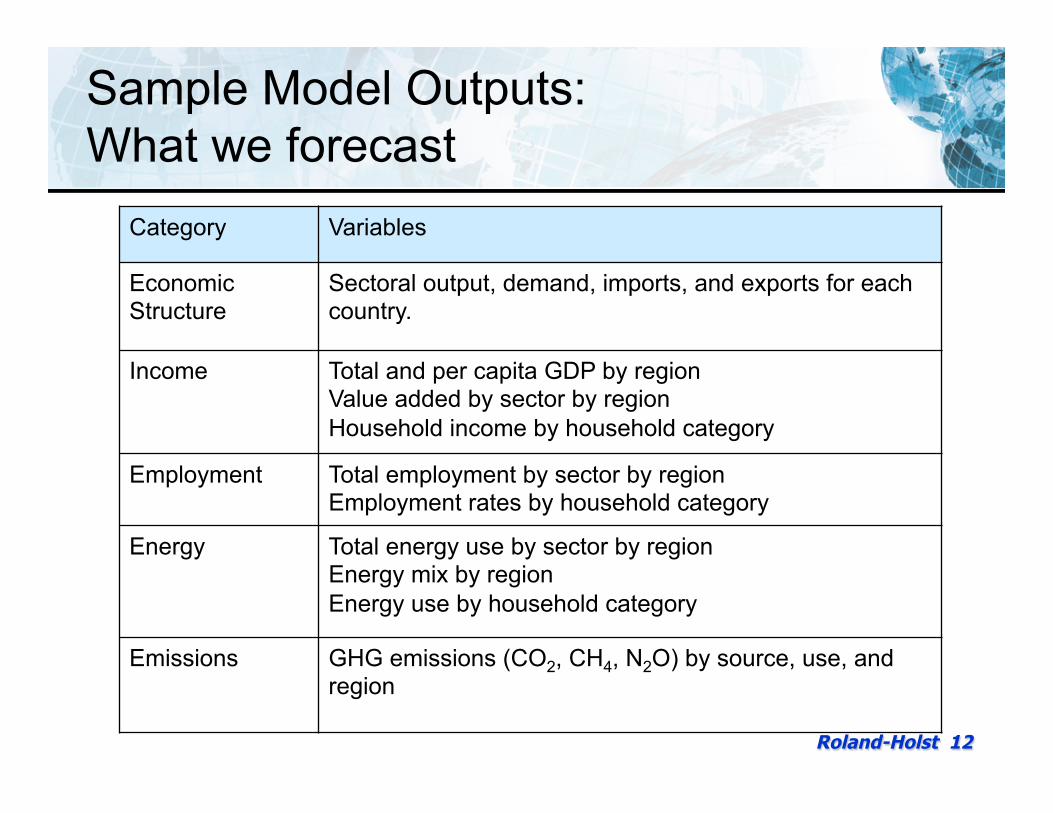
Sample Model Outputs: What we forecast
Category Variables
Economic Structure
Sectoral output, demand, imports, and exports for each country.
Income Total and per capita GDP by region Value added by sector by region Household income by household category
Employment Total employment by sector by region Employment rates by household category
Energy Total energy use by sector by region Energy mix by region Energy use by household category
Emissions GHG emissions (CO2, CH4, N2O) by source, use, and region
Roland-Holst 13
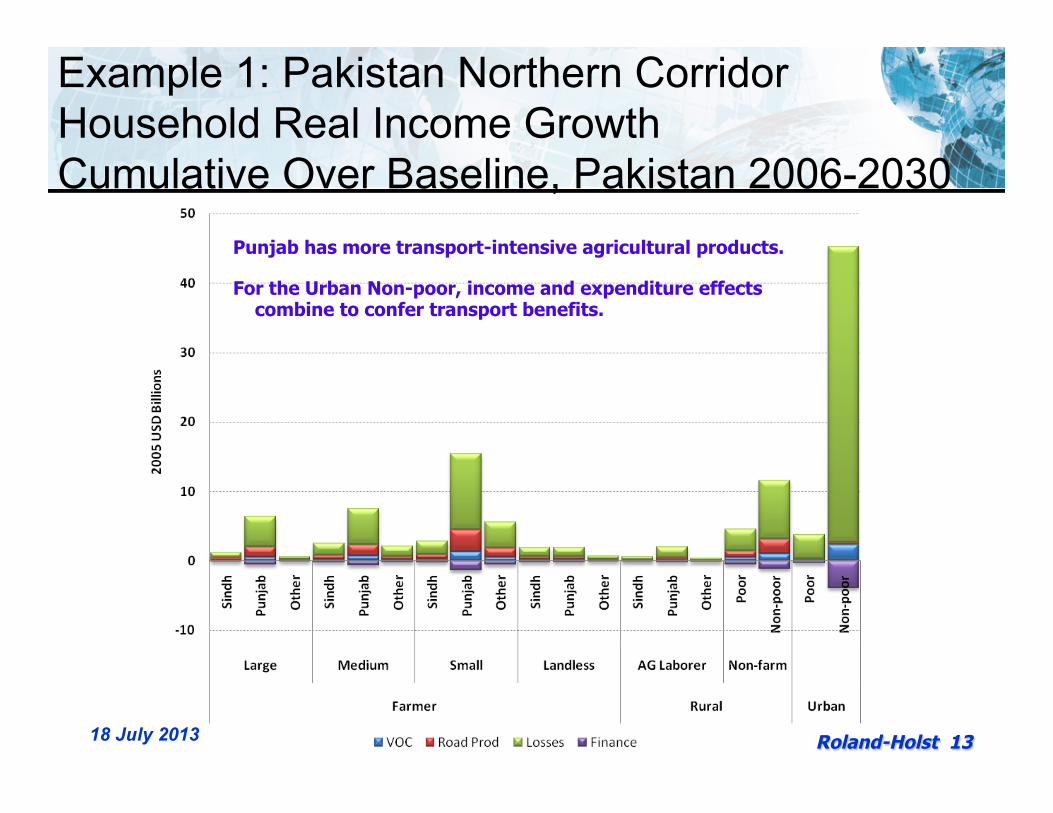
Example 1: Pakistan Northern Corridor Household Real Income Growth Cumulative Over Baseline, Pakistan 2006-2030
Punjab has more transport-intensive agricultural products.
For the Urban Non-poor, income and expenditure effects combine to confer transport benefits.
18 July 2013
Roland-Holst 14
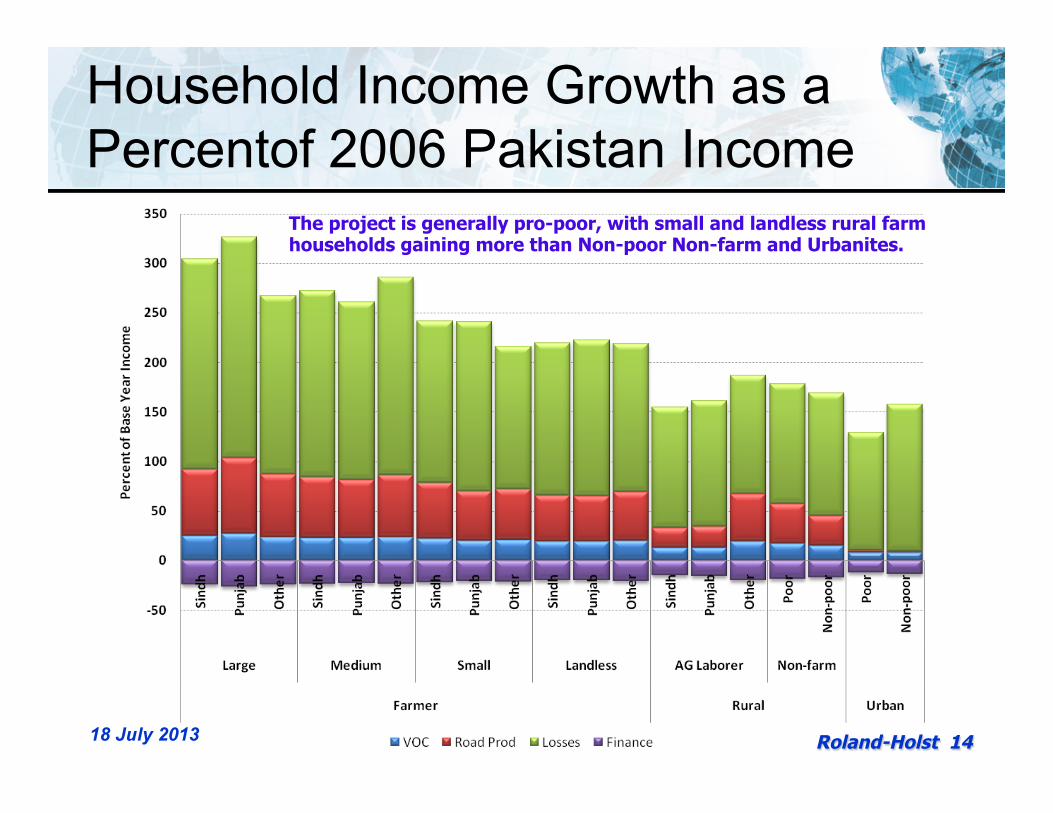
Household Income Growth as a Percentof 2006 Pakistan Income
The project is generally pro-poor, with small and landless rural farm households gaining more than Non-poor Non-farm and Urbanites.
18 July 2013
Roland-Holst 15
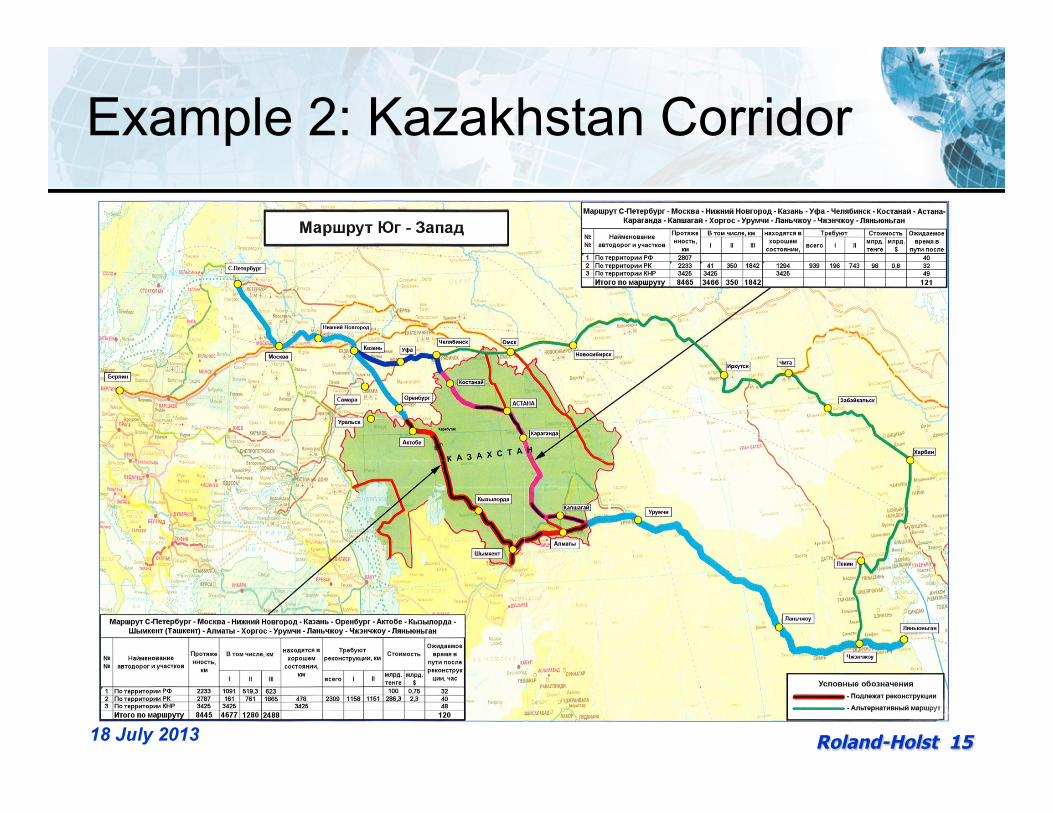
Example 2: Kazakhstan Corridor
18 July 2013
Roland-Holst 16
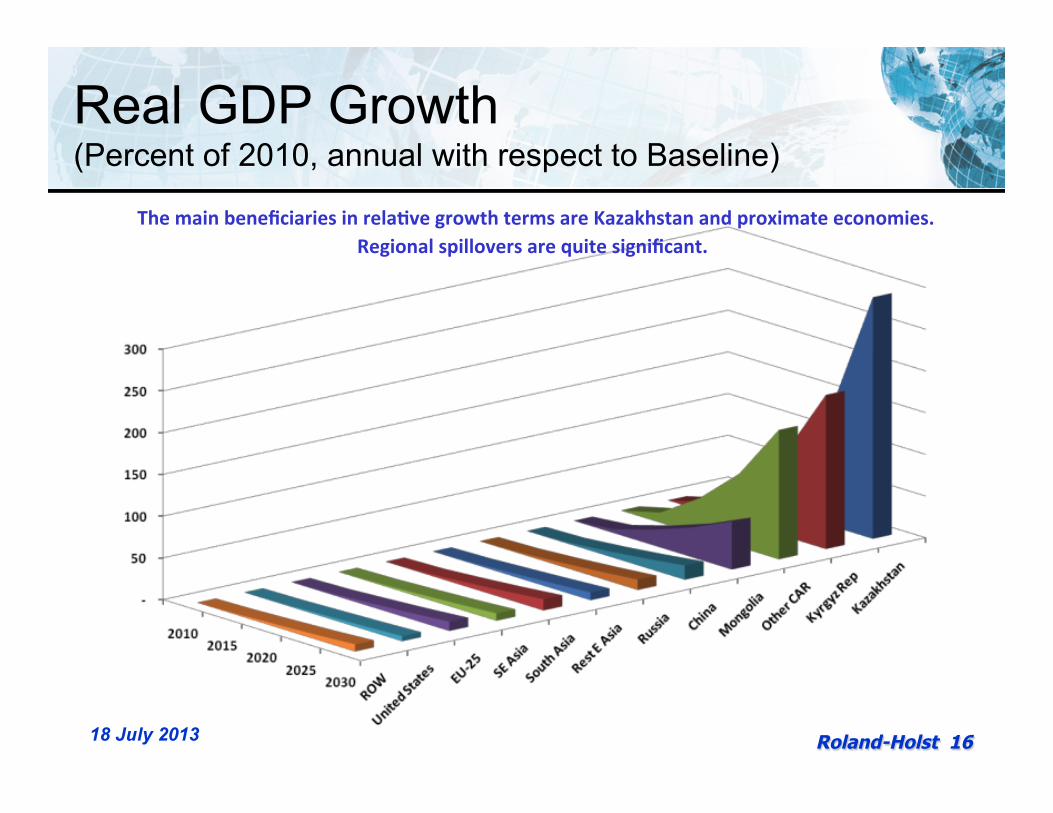
Real GDP Growth (Percent of 2010, annual with respect to Baseline)
The main beneficiaries in rela/ve growth terms are Kazakhstan and proximate economies. Regional spillovers are quite significant.
18 July 2013
Roland-Holst 17
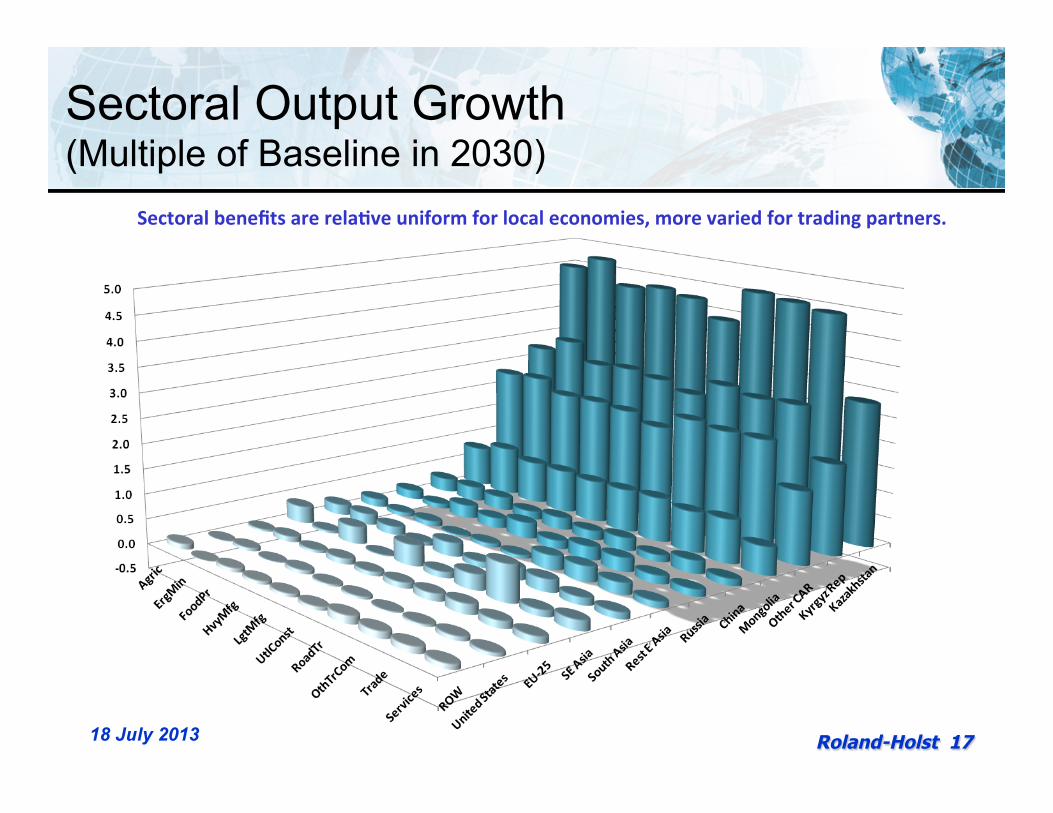
Sectoral Output Growth (Multiple of Baseline in 2030)
Sectoral benefits are rela/ve uniform for local economies, more varied for trading partners.
18 July 2013
Roland-Holst 18
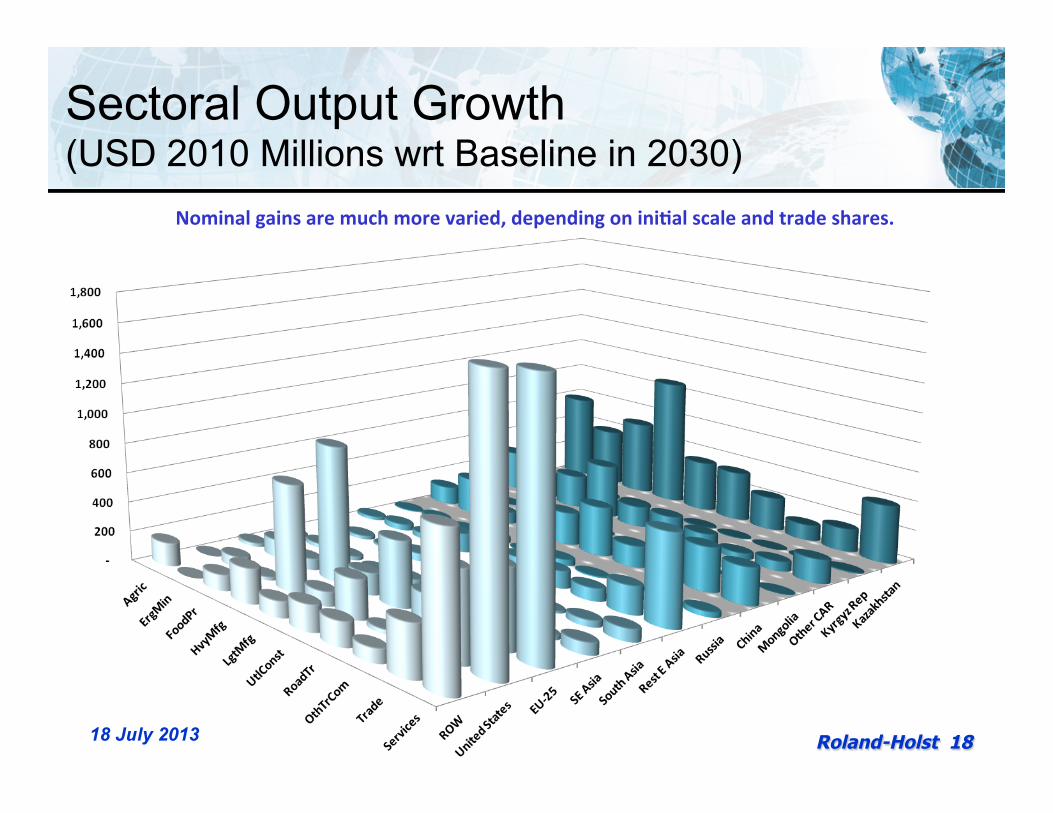
Sectoral Output Growth (USD 2010 Millions wrt Baseline in 2030)
Nominal gains are much more varied, depending on ini/al scale and trade shares.
18 July 2013
Roland-Holst 19
Extensions
1. Regional assessment of trade and investment potential and trends. 2. Transport corridors: Detailed regional and national impact analysis. 3. Energy pathways: Detailed regional and national impact analysis. 4. Dynamics of regional growth and poverty reduction. 5. Trends in urbanization and rural development. 6. Resource development, public investment, and fiscal sustainability. 7. Demographic assessment, including impacts of migration, labor force
development and employment patterns, and other socioeconomic trends.
8. Public policy impacts on development indicators, MDG’s, etc., nationally and regionally.
9. Coordination with agent-based GIS modeling to improve policy targeting and impact evaluation.
18 July 2013
Roland-Holst 20
The Policy Dashboard
CAPSIM represents a new generation of policy simulation models, combining
– Detailed structural data – State-of-the-art forecasting model – User-friendly, interactive, interface with real
time numerical and graphic results The Policy Dashboard interface allows ex ante visualization of policy impacts.
18 July 2013
Roland-Holst 21
Demonstration
Ø Now we switch to a browser.
18 July 2013
Roland-Holst 22
Issues
Ø Economic data – must be seen as indicative for some countries
Ø Inputs – which are relevant to CAREC policy research?
Ø Outputs – likewise Ø Capacity standards – uniform across
implementations or adaptive Ø ADB capacity – where do you want to take this?
18 July 2013
Roland-Holst 23
Thank you