Embed Size (px)
Citation preview
University of WollongongResearch Online
Deputy Vice-Chancellor (Academic) - Papers Deputy Vice-Chancellor (Academic)
2012
Capturing business intelligence required fortargeted marketing, demonstrating value, anddriving process improvementBrian CoxUniversity of Wollongong, [email protected]
Margie JanttiUniversity of Wollongong, [email protected]
Research Online is the open access institutional repository for the University of Wollongong. For further information contact the UOW Library:[email protected]
Publication DetailsCox, B. L. & Jantti, M. H. 2012, 'Capturing business intelligence required for targeted marketing, demonstrating value, and drivingprocess improvement', Library & information science research, vol. 34, no. 4, pp. 308-316.

Capturing business intelligence required for targeted marketing,demonstrating value, and driving process improvement
AbstractThe University of Wollongong (UOW) has undertaken an innovative and collaborative research project todemonstrate the value that can be provided by academic libraries. The tool developed, the “Library Cube”, is adata warehouse linking student borrowing and use of electronic resources to students’ academic grades anddemographic information. The project is different to other institutions’ efforts to link usage to studentoutcomes, in that the Library Cube is not a one-off research project, but is now an ongoing part of UOW’ssystems and performance reporting and represents a fundamental shift in evaluating the student experiencethrough the integration of discrete systems and datasets.
The Library Cube demonstrates a new direction for evidence-based research. Analysis enabled through theCube has revealed a very strong relationship between library usage and students’ academic performance. Thisinformation will improve UOW Library’s ability to demonstrate value to clients and stakeholders. The LibraryCube has also delivered some anticipated and unexpected findings on the relationship between socialvariables (such as gender, age, and citizenship) and library usage behaviors; and in doing so has also identifiedpotential target audiences for Library promotions and engagement strategies.
KeywordsLibrary Cube, Library usage, Student grades
DisciplinesArts and Humanities | Social and Behavioral Sciences
Publication DetailsCox, B. L. & Jantti, M. H. 2012, 'Capturing business intelligence required for targeted marketing,demonstrating value, and driving process improvement', Library & information science research, vol. 34, no.4, pp. 308-316.
This journal article is available at Research Online: http://ro.uow.edu.au/asdpapers/242

1
Capturing business intelligence required for targeted marketing,
demonstrating value, and driving process improvement
Brian L Cox*, Margie Jantti
University of Wollongong Library
Northfields Ave, Wollongong, NSW 2522, Australia
----------------------------
*Corresponding author.
E-mail:[email protected]
ABSTRACT
The University of Wollongong (UOW) in New South Wales, Australia, has undertaken an
innovative and collaborative research project to demonstrate the value that can be provided
by academic libraries through a tool called the ‘library cube’. The library cube consists of
two major components: a backend system containing a multidimensional data warehouse
linking student borrowing and use of electronic resources to students’ academic marks
(grades); and a frontend system that allows users to quickly and easily create cross tabulated
data views, such as average student marks by frequency of library resource usage and gender.
The project is different from the efforts of other institutions to link usage to student
outcomes, in that the library cube is not a isolated research project, but is now an ongoing
part of UOW’s systems and performance reporting. The library cube represents a
fundamental shift in evaluating the student experience through the integration of discrete

2
systems and datasets. It has revealed a very strong relationship between student library usage
and academic performance. This information will improve UOW Library’s ability to
demonstrate value to clients and stakeholders. The library cube has also delivered some
anticipated and unexpected findings on the relationship between social variables, such as
gender, age, and citizenship, and library usage behaviors; and in doing so has also identified
potential target audiences for library promotions and engagement strategies.
1. Introduction
The University of Wollongong Library (UWL), like many libraries around the world,
has long used patron satisfaction surveys to drive continuous improvement through
measuring the quality of services, identifying changing student perceptions and needs, and
obtaining unstructured feedback on what patrons consider important. The surveys were and
will continue to be useful. They do, however, have a number of significant limitations,
including: they are no longer regarded by administrators as sufficient evidence of impact;
they are naturally biased towards library users; they are not run frequently enough to support
marketing; and they do not measure the impact of the library on clients’ success, only
respondents’ subjective assessment of value and performance.
UWL required a cost effective and sustainable way of collecting information on its
impact on client outcomes, that is, what the client receives for his or her investment of time
and energy spent in using library resources and services (Neal, 2011). Alternative methods
for demonstrating value, such as contingency valuations and survey-based research were, in
UWL’s opinion, equally limited. It is in this context that UWL decided to explore alternative
methods for demonstrating its value.
3
In 2009, UWL began working with staff from the University of Wollongong’s
(UOW’s) Performance Indicator Unit1 (PIU) to develop a library cube. PIU has developed a
number of cubes to help UOW to make better informed business decisions. From the users’
point of view, the cubes provide an elegant way to interrogate existing datasets, allowing
users to drag and drop dimensions and measures into cross tables via a web-based platform
called Cognos. The library cube is based on a multidimensional data warehouse that joins
library usage data with students’ demographic data and their Weighted Average Marks
(WAM or ‘marks’2).
The purpose of the project is to demonstrate the value of the library in supporting
teaching and learning, and to collect information to help UWL improve the impact of its
resources and teaching activities with respect to student academic performance and student
engagement (Jantti & Cox, 2010).
2. Problem statement
There are two significant interrelated problems facing academic libraries that require
urgent attention. First, libraries are under increasing pressure to demonstrate value in the
context of economic constraints and growing competition. Libraries need compelling
evidence that directly links their activities to positive outcomes for their clients. Libraries that
do not provide such evidence will be at an increasing risk of having their funding reduced or
eliminated (Jantti & Cox, 2010).
Academic libraries also face a lack of ongoing access to up-to-date marketing
intelligence that can be used to identify which segments of their client base are not using
1 The Performance Indicators Unit exists to manage and provide accessible and integrated reporting and analysis
solutions through the secure, Web-based Performance Indicators Portal. It collects and leverages critical data
through scorecard, reporting, and analysis capabilities providing staff with a one-stop data source that is needed
to achieve a clear picture of day-to-day operations: http://www.uow.edu.au/services/pi/index.html. 2 Please note: ‘marks’ are the same as ‘grades’.

4
library resources and services. Without this information, libraries cannot identify, in an
accurate and timely manner, whom to target for promotions, or whether promotions have
increased the market share of information consumers. Sound marketing can improve a
library’s value proposition, and being able to articulate strong evidence of value enhances a
library’s ability to market itself effectively. Consequently, a lack of evidence linking clients’
library usage to positive client outcomes can lead to a cycle of devaluation, as poor evidence
of value leads to weak marketing impact, leading in turn to poorer usage, which then reduces
the value offered by the library as the cost per client increases. Breaking this cycle is
paramount to the long term survival of academic libraries.
For both problems the issue is a lack of ongoing valid and reliable data being
collected, from which generalizations can be made about the value provided by libraries.
3. Literature Review
In 1998, Lindauer assessed the state of literature on library performance measures and
concluded that:
There are several good publications that offer field-tested measures and data-
gathering techniques to provide guidance in all aspects of measuring and evaluating
inputs, processes, and outputs. However, almost none of these publications provides
measures or methods for assessing the impact of academic libraries on campus wide
educational outcomes. Overwhelmingly, the literature is internally focused, looking at
the academic library as an overall organization or at one or more of its components or
services (Lindauer, 1998, pp. 547-548).
Lindauer went on to state that “The common observation made in numerous publications is
that what is most needed are performance indicators that demonstrate the academic library’s

5
impact on desired educational outcomes and methods to measure them (Lindauer, 1998, p.
548).
In the 13 years that have passed since Lindauer’s paper was published, there have
been a number of developments and innovations in the area of measuring value and impact. If
the recent proliferation of conferences on the subject are a valid indicator, however, then the
problem of how to demonstrate value is far from resolved.
Contingent valuation is arguably the most significant break from existing methods of
measuring value, given that it explicitly attempts to measure the economic value of libraries,
as opposed to focusing on softer measures of value. A recent significant example was
research commissioned by the British Library in 2003, in which over 2000 random members
of the public and direct British Library users were asked the following questions:
• How much they would be willing to pay for the library’s continued existence?
• What was the minimum payment they would be willing to accept to forgo the
library’s existence?
• How much did they invest in terms of time and money to make use of the library?
• How much they would have to pay to use alternatives to the library, if such
alternatives could be found (British Library, 2003)
Using this method, the British Library found that it generated 4.4 times the value of
its funding. Many other libraries have also used contingent valuation. Indeed, Poll has
advocated for an International Standards Organisation (ISO) standard for measuring impact
based upon the contingent valuation method (Poll, 2010).
Unfortunately, the validity of contingent valuation hinges upon clients having formed
an opinion of the value of the free service they were using prior to being surveyed, and that

6
such opinions would accurately predict their future behavior, should they ever have to choose
to fund a public library. Research has found, however, that respondents are likely to
overestimate both their willingness to accept and their willingness to pay, which are the two
key questions upon which contingent valuations are based (Oakleaf, 2010).
The other problem with contingent valuation is the same as all survey-based research.
Crafting and implementing a survey instrument that produces valid and reliable results from
which generalizations can be made about the wider population is a costly exercise, which at
best only produces a snapshot of the situation at the time of the survey.
Contingency valuation is only one among many methods that have been developed to
demonstrate value. Indeed, there are so many methods that the Association of College and
Research Libraries (ACRL) recently commissioned a report to provide “1) a clear view of the
current state of the literature on value of libraries within an institutional context, 2)
suggestions for immediate ‘Next Steps’ in the demonstration of academic library value, and
3) a ‘Research Agenda’ for articulating academic library value” (Oakleaf, 2010, p. 11).
The ACRL report provides a comprehensive overview of the existing literature on the
subject of measuring impact and value, and it would be largely redundant to add anything
further, other than point to the key findings on measures relevant to students:
• There has been some survey research into the link between student retention and
library use, “but the challenge lies in determining how libraries can contribute and
then document the contribution” (Oakleaf, 2010, p. 34). Some of student engagement
surveys contain library-related questions from which it may be possible to infer the
contribution made by libraries. These surveys are limited by their reliance on indirect
measures and self-reporting (Oakleaf, 2010). There are many other examples of
survey-based research, such as the ARL Mines survey (Oakleaf, 2010), that arguably
suffer the same limitations.

7
• There is a large body of literature on information-literacy assessment, with the most
recent literature focused on assessing outcomes using standardized assessment tests.,
Most research consists of small studies, however, and there is a need for rigorous
larger-scale studies (Oakleaf, 2010). Some work has been done on assessing student
learning outcomes from student work (e.g., papers, reports), and this approach is
promising (Oakleaf, 2010)., Information-literacy assessment is likely to be even more
expensive than surveys, however, though it does have the potential to offer richer and
more valid data than surveys.
• “Academic librarians have not collected individual student data or accessed
institutional student information systems, despite the fact that these data sources could
be used to demonstrate library value” (Oakleaf, 2010, p. 43). Since implementing the
library cube, UWL has become aware of other similar projects, such as the JISC-
funded Library Impact Data Project (JISC, 2011; see also Stone, Ramsden, & Pattern,
2011). However, UOW appears to be the only institution to have created an ongoing
system that joins usage to student systems data.
• ACRL listed indirect ways of measuring value, such as institutional ranking measures
and accreditation (Oakleaf, 2010). Indirect measures can be useful, though such
measures are not sufficient in themselves to demonstrate value to all clients and
stakeholders. They also assume that activity translates into client outcomes.
• Attempts have been made to identify the social return on investment—that is, the
social benefit provided by libraries. However, it is difficult to “isolate the impact of
academic libraries on these contributions” (Oakleaf, 2010, p. 56).
Despite all the research around demonstrating value, ACRL concluded that until
libraries connect usage of library resources with student attainment (i.e., marks), “they will be

8
blocked in many of their efforts to demonstrate value” (Oakleaf, 2010, p. 97). UWL has
achieved precisely that with the library cube.
4. The library cube
4.1. Overview
The library cube is a dataset that joins usage of UWL resources with enterprise
systems containing student demographic data and academic performance using a unique
identifier, the student number. This data is contained within an Oracle Data Warehouse with
access managed via IBM Cognos 8.4 software system. The entire system is developed and
maintained by PIU.
One of the initial challenges of the project was dealing with the privacy issues. UWL
was fortunate in that UOW students are required as part of the enrollment process to provide
consent to the university to use their personal information for certain purposes, and the
library cube fell within the scope of one of those purposes (Jantti & Cox, 2010). If another
library wishes to create their own cube, they will need to ensure that they are able to do so
under the relevant privacy and data protection laws.
Due to the nature of the data, it is not practical or possible to join all data within a
single cube. To expedite the project, and to ensure data integrity, UWL decided in
conjunction with PIU to create three separate cubes:
1. The library value cube, which is now in production, is structured around academic
teaching sessions, and is used to assess the impact of the usage of UWL’s resources
upon UOW students’ weighted average marks (WAM). This cube also allows UWL
to review demographics by level of usage. The library value cube is updated after
student marks are loaded into UOW’s student system at the end of each academic
session.

9
2. For marketing, UWL needed a cube that could be updated weekly. This information
could not be added to the value cube, as WAM is tied to a session, not weeks.
Consequently, the library marketing cube does not contain WAM information. The
marketing cube will contain student demographic data, and will also identify the type
of electronic resources being accessed (ebooks, lecturers’ ereadings, and database
names) . The marketing cube is still under development, and will require further
testing and refinement before it is ready for user acceptance testing.
3. The process improvement cube is yet to be built. It will be structured around
academic subjects, and is expected to assist UWL academic outreach activities.
While there is a large historical dataset for UOW student demographics and marks,
UWL only began collecting resource usage data that could be integrated into the library cube
from mid-2009 for loans, and at the beginning of 2010 for online resources. Consequently,
the library cubes will only have time-series data starting from 2010.
4.2. Library data sources
The two library data sources fed into the cube are loans data and data relating to usage
of electronic resources.
Loans data is extracted from UWL’s library information management system.
Unfortunately, the only usable data that can be exported from this system that includes the
student unique identifier is the total number of items borrowed to date. To build time-series
data, an export of data occurs weekly, and the differences between two weeks is the
borrowing that occurred over that week.
UWL used Ezproxy logs to extract information on usage of library electronic
resources. Ezproxy is the system used by UWL to manage access to licensed materials. Each
time a user accesses certain library resources, an entry is generated in the log file. These

10
resources include subscription databases, e-books, and so-called e-Reading materials
(electronic readings uploaded by the library at the request of teaching academics), which can
be accessed via the library catalogue, or through links provided on UOW’s learning
management system. While accessing an e-reading item versus obtaining material
independently from a subscription database requires different research skills, at this stage in
the project, UWL cannot differentiate between the various types of resources being accessed.
The logs contain useful information, such as the students’ unique identifier. But they
also contain a great deal of extraneous data. Counting the number of entries in the log proved
futile, as they vary wildly depending upon the online resource being accessed. Consequently,
UWL decided to use the time stamp in the log as a de-facto time session measure, using the
following business rules:
• The day is divided into 144 10-minute sessions.
• If a student has an entry in the log during a 10-minute period, then one sixth is added
to the sum of that student’s access for that session .
• Any further log entries during that 10-minute period for that student are not counted.
Using this logic, UWL can measure how long individual students spent using its
electronic resources with a reasonable degree of accuracy, because of the small time periods
(10 minutes) being measured. The marketing cube also uses this method, and includes
another measure and dimension for the name of the electronic resource being accessed by the
student. UWL was able to identify the online resource being accessed through the forensic
task of identifying values (“strings”) in the Ezproxy log that are unique to the electronic
resource. The 10-minute logic that applies to overall usage of electronic resources is also
being applied at the more granular level of electronic resource names.
11
Joining the loans and electronic resource usage data to student demographic and
marks data was not a simple exercise, and required extensive collaboration between PIU and
UWL to develop robust business rules. For example, one student can be enrolled in many
courses, but there is no data available to allow library usage to be attributed to a specific
course. UWL decided in this instance that usage can be attributed across the courses on a pro
rata basis, as very few students are enrolled in more than one course. There were other
complicated aspects to joining data, for example, not all usage of library resources occurs in
session, so business rules had to be created to determine when and where to attribute usage
out of session to student marks.
The datasets used to create the cubes are very large, particularly the Ezproxy logs.
The hardware and software infrastructure used to build the cubes had been pushed to its
limits to extract the names of the resources being used from the Ezproxy logs for the
marketing cube. There is more useful information that may be gleaned from the Ezproxy
logs, as Nicholas, Huntington, Jamali, & Tenopir, (2006) and Nicholas, Rowlands,
Huntington, Jamali & Salazar (2010) demonstrated through their forensic mining of client
resource usage behavior data from their institutions’ access and authentication logs. As
computer power improves, UWL will be able to consider the business case for extracting
more information from the logs, but currently that is not feasible.
4.3. The cube itself
Users of Excel pivot tables or Online Analytical Processing (OLAP) cubes will be
familiar with much of the functionality of the IBM Cognos system in which the library cube
is housed. Users can simply drag and drop the dimensions of the cube—such as gender,
faculty, country of origin—either as a field in a cross-tab table, or as a filter value. Users also
need to select what they wish to measure, for example, student head count, or total number of

12
borrowings. The Web-based system allows users to manipulate data easily, and they can even
save views.
<Figure 1: Library Cube snapshot>
5. Limitations
Before looking at the relationship between usage of our resources and student
performance, it is important to acknowledge that:
• Borrowing a book or using an electronic resource does not automatically translate into
learning. Even if the student read a book or article, it does not mean they understood
it, or used it to complete an assignment.
• There are many factors besides library usage that contribute to a student’s academic
success, not least of which are academic teaching skills, and a student’s attitudes and
aptitude.
• Correlation does not prove cause. For example, good teachers might encourage
students to use the library more frequently, and therefore the correlation may be a
product of teaching skills, rather than engagement with the collection, per se.
• Other variables that may contribute to a student’s academic success, such as
attendance, either cannot or have not been captured in the library cube, because of
technical and resource limitations.
There are, however, a number of factors that increase UWL’s confidence in the
validity of the findings:
• Sampling error is not a problem, as the data is a census that is frequently updated—
weekly for loans and daily for electronic resources.
13
• There is a very strong relationship between the average marks for each level of
resource usage and student marks.
• Finally, with a few notable exceptions, the relationship still holds for many views of
the data.
6. Findings
There are so many factors contributing to students’ academic performance, that, as
expected, there is no direct correlation between use of this collection and academic
performance, at least superficially.
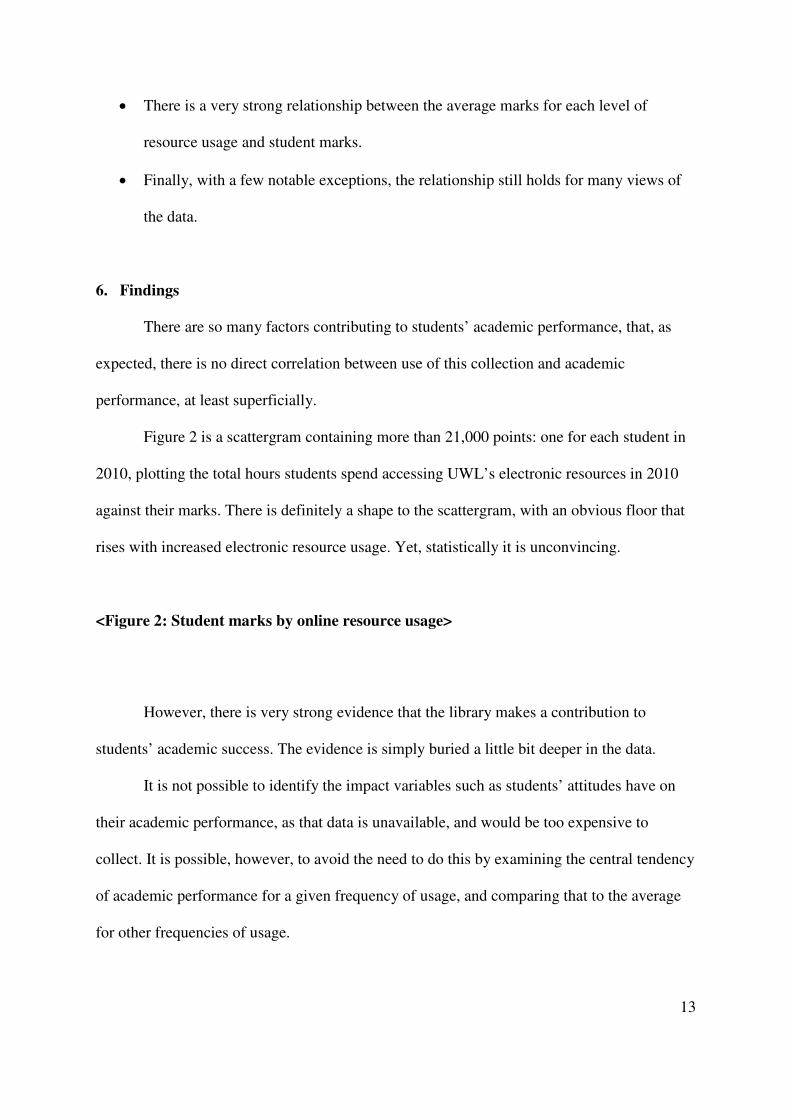
Figure 2 is a scattergram containing more than 21,000 points: one for each student in
2010, plotting the total hours students spend accessing UWL’s electronic resources in 2010
against their marks. There is definitely a shape to the scattergram, with an obvious floor that
rises with increased electronic resource usage. Yet, statistically it is unconvincing.
<Figure 2: Student marks by online resource usage>
However, there is very strong evidence that the library makes a contribution to
students’ academic success. The evidence is simply buried a little bit deeper in the data.
It is not possible to identify the impact variables such as students’ attitudes have on
their academic performance, as that data is unavailable, and would be too expensive to
collect. It is possible, however, to avoid the need to do this by examining the central tendency
of academic performance for a given frequency of usage, and comparing that to the average
for other frequencies of usage.

14
<Figure 2a: Student marks by online resource usage>
Figure 2a plots the average mark for every integer frequency of students’ usage of
UWL’s electronic resources. For example, the average mark for students who never used
UWL electronic resources is 58. The average mark for students that spent up to one hour a
year accessing UWL electronic resources per year was 62. Figure 2a indicates that there is a
very strong nonlinear correlation between average usage of resources and average student
marks (R squared = 0.87).
It appears that the principle of diminishing marginal returns applies, with the curve
flattening with higher usage. It also appears that strength of the relationship between
electronic resource usage and students’ academic performance weakens further along the
curve, which is most likely caused by the smaller number of students at these frequencies.
The amount of usage per year appears to be very low. UWL staff have anecdotally
observed that most students do not read material online, however, but either print it or save it
to their thumb drive to read later. The amount of time spent accessing UWL resources is best
interpreted as time spent searching for resources, not time spent reading resources.
One possible explanation for the correlation is that it is simply a function of
attendance. Students who drop out early are less likely to use the library, and less likely to
perform well academically. The library cube is not linked to attrition or attendance data yet
(though this may be possible in the future), so it is not possible to test directly for the
influence of attendance. However, it is possible to exclude very poor performers from the
data. As Figure 2b illustrates, there is an even stronger correlation between library usage and
academic performance (R squared = 0.90) after very poor performing students are excluded.
<Figure 2b: Student marks by online resource usage (excluding very low achievers)>

15
The most notable difference in this subset of students is that the nonusers have a much
higher average mark, and that the line of best fit follows a different curve.
The results for the correlation between borrowing and student marks are similar, but
not quite as striking (R squared = 0.73). The correlation is not as tight, and the increase in
marks with usage is not as steep.
<Figure 3: Student marks by borrowing>
Another way of looking at the relationship between student marks and usage of the
UWL collection, is to map the frequency distribution of student marks by various usage
levels.
<Figure 4: Frequency distribution student marks by levels of online resource usage>
Figure 4 shows the diversity of students’ marks and the impact of UWL’s collection.
For example, some students that use UWL electronic resources fail, and some nonusers
perform strongly. All else being equal, however, the more students use UWL’s electronic
resources, the more likely they are to perform better. To put this in perspective, only half of
one percent of the high users fail (0.47%), whereas 19% of nonusers fail. In other words,
nonusers are 40 times more likely to fail than high users of library electronic resources. The
story is similar for loans, but not as dramatic.

16
There is a significant difference between usage and impact of UWL’s printed
collection versus its electronic resources. As Table 1 illustrates, nearly one third of UOW
students never borrowed a book in 2010. However, only 8% of students never accessed
electronic resources. There is also a large difference between the WAM for the higher users
of books compared to electronic resources, with a cumulative difference of 11 and 19 marks
respectively between nonusers versus heaviest users. Books appear to be used less, and have
less impact. Nevertheless, even though the benefit of using electronic resources is very clear,
students who borrow books are more likely to do much better than students who do not
borrow.
<Table 1: Library usage by grades and number of students>
7. Discussion
7.1. Implications
Clearly, there is a very strong message UWL can promote to its clients and
stakeholders. There is also a bigger picture. How can UWL differentiate the value it provides,
when collections across Australia and the world are becoming increasingly similar? If it is the
collection that is unlocking students learning capabilities, then what value can the library
provide over and above database vendors or ubiquitous search engines, for example?
Presently, libraries still have a very large role to play in managing access and
collection development. Over time, this is likely to become an increasingly tenuous space to
occupy. It is not inconceivable to imagine a future where collection development has been
largely homogenized, and access and discovery can be administered much more efficiently
by external organizations. In this context, selling the message that increased use of the

17
collection translates into improved student performance carries a high risk. If other libraries
were to undertake a similar project, and find similar results, would that be a good thing? Or
would the credit increasingly go to database vendors at the expense of traditional libraries?
These are important questions, as libraries need to market themselves on their unique value
proposition.
7.2. UWL’s value proposition
So what is UWL’s value proposition? Ultimately, libraries are about connecting
authors to readers. Libraries are the intermediaries, the facilitators in this process, and there
are four main points at which UWL can add value: engagement, access, discovery, and
collection development.
While collection development and accessibility will continue to be the critical
bedrock of success, the individual library is likely to be cast more and more in the role of
consumer, rather than producer, of these services. Indeed, it could be argued that the
outsourcing of academic librarians in Japan is possible because of the changing position of
librarians, relative to external vendors and discovery platform suppliers, and that such
changes present real risks to the librarian profession:
The wide use of outsourcing [in Japan] has been beneficial to many library
operations. . . . However, the long-term effect on the profession of librarianship raises
concerns. Limited budgets, a cumbersome management system, legacy organizational
structures, narrow employment opportunity, lack of strong leadership and inadequate
LIS education programs all combine to make the future of the profession vulnerable.
Since library outsourcing has become widespread, the majority of certified librarians
who desire to become academic librarians are compelled to look for job vacancies

18
among commercial vendors. The current library outsourcing environment is building
the foundation of a system in which librarians find it almost impossible to further their
careers in Japan (Matsuoka-Motleya, 2011, p. 277).
In the past, academic libraries have placed a metaphorical corral around their
resources, and have been able to differentiate their collections from other information sources
on the basis of quality. The validity of this distinction will be tested by the growing reliability
of publicly-created sources of information residing outside library collections, such as
Wikipedia. The growth of non-library-based sources of reliable academic information has led
to the well-documented information overload; in this context, some libraries have found an
expanding niche in assisting and teaching clients to assess the quality of information sources.
Even this space is under threat, however, as it is not infeasible to imagine that the level of
skill required to assess the quality of sources will diminish and become more mechanical as
new technologies emerge, such as the author-rating systems used for Wikipedia. The question
then is, what needs can libraries address in the future, given the large-scale changes to the
structure of information, and the way people create and use information?
Neal urged academic libraries to “embrace the ‘human’ objectives, like success,
happiness, productivity, progress, relationships, experiences, and impact” (2011, p. 427).
Following this trajectory of thinking, engagement is an area that, with imaginative thinking,
could become a “blue ocean market”:
“Imagine a market universe composed of two sorts of oceans: red oceans and
blue oceans. Red oceans represent all the industries in existence today. This is the
known market space. Blue oceans denote all the industries not in existence today.
This is the unknown market space.

19
In the red oceans, industry boundaries are defined and accepted, and the
competitive rules of the game are known. Here companies try to outperform their
rivals to grab a greater share of existing demand. The dominant focus of strategy work
over the past twenty-five years has been on competition-based red ocean strategies.
As the market space of red oceans gets crowded, prospects for profits and growth are
reduced. Products become commodities, and cutthroat competition turns the red ocean
bloody. Hence we use the term “red” oceans.
Blue oceans, in contrast, are defined by untapped market space, demand
creation, and the opportunity for highly profitable growth.” (Kim & Mauborgne,
2005, p. 106)
Enhancing discoverability via web-based systems is a ‘red ocean’ dominated by
Google; whereas ‘engagement’ is a potential ‘blue ocean’, one that university libraries have
been exploring the periphery for some time:
The academic librarian's role has become both dynamic and challenging, with
librarians frequently involved in outreach and management and “embedded” in the
classroom, providing instruction in person or via an online management system. At
the same time, librarians are required to understand and use increasingly
sophisticated, rapidly changing technology, as academic libraries move toward fully
digital or nearly digital libraries that must be managed, and their patrons increasingly
request the help of librarians to navigate the explosion of information available on the
Internet (Shupe & Pung, 2011, p. 413).

20
What the authors are proposing is not to occupy another space between the database
vendors, search engine providers, and clients, however, but to occupy an entirely new space.
If the library is simply an intermediary that helps to connect authors to readers, then inspiring
a love of reading and learning is a far more rewarding role than showing clients where to
click, regardless of how sophisticated such instruction becomes. Inspiring students to read
library acquired resources will require a qualitative leap in the role for marketing at UWL, a
role that should focus on two main objectives: increasing traction and improving usage.
7.3. Improving engagement through increasing traction and usage
Gaining traction is about ensuring that students get academic benefit from using
UWL’s collection. A few groups of users are not getting the same impact from using UWL’s
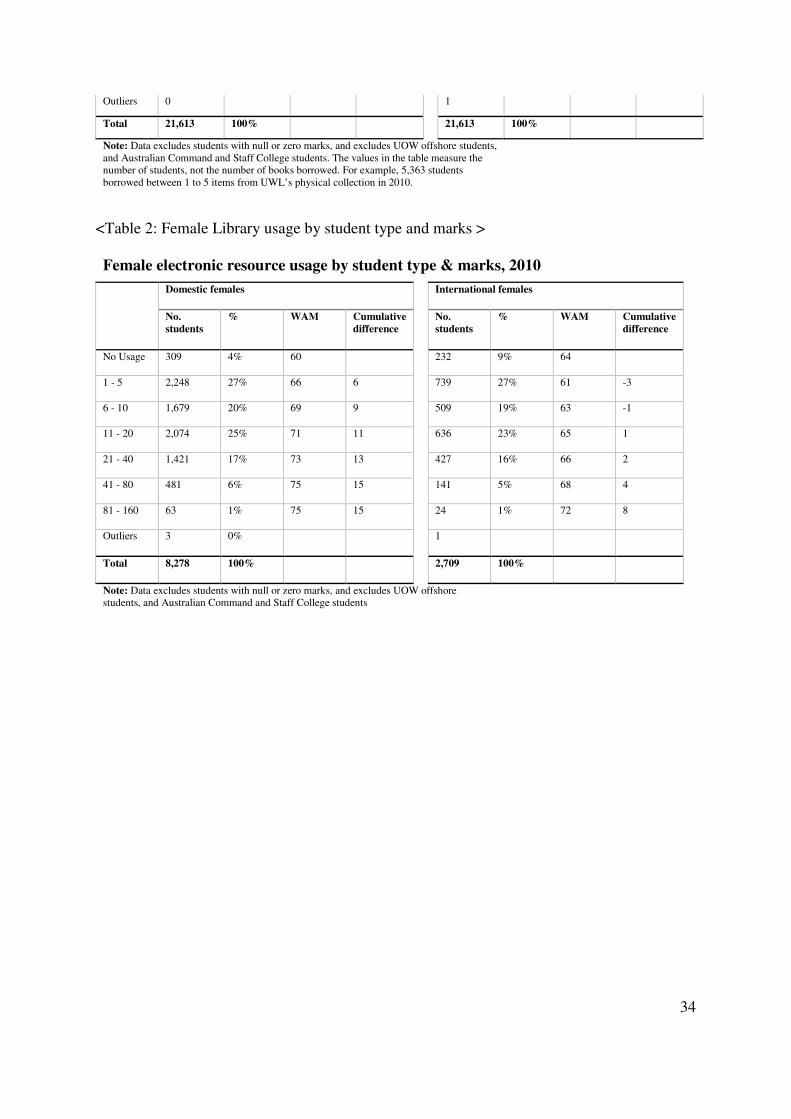
resources as other groups. For example, UOW domestic female students get a lot more
traction from using resources than their international counterparts. The highest domestic
female users of electronic resources scored a distinction (75% on average), which is 15 marks
higher than nonusers. For international females, however, only the very highest users
received any benefit at all, in terms of academic marks, from using electronic resources.
<Table 2: Female Library usage by student type and marks >
The library cube has revealed a few other areas where UWL could investigate the
possibility of improving engagement by addressing poor usage and low traction.
7.3.1. Books
In 2010, nearly one-third of UOW students never borrowed a book. This finding is
similar to the findings from a similar research project conducted by Huddersfield University

21
Library (Goodall & Pattern, 2011). In the first session for 2011, 49% of UOW students were
non-borrowers. The data points to trends that may suggest loans could decline even faster. In
2009, the older students get, the less likely they were to borrow books. This leaves younger
students as a baseline support for demand; however, students age 22 and below are a growing
group of non-borrowers, and now outstrip the 23 to 29 age group.
The decline in demand for print material matches national and international trends. It
is not a uniform phenomena, however, at either UWL, or internationally. As Joint noted,
“Some U.S. print library collections are being used less, but not all. And there are significant
library collections outside the U.S.A. with circulation figures showing increases, in direct
contrast to North America” (2008, p. 88).
Similarly, the library cube has demonstrated that there are still some groups that get a
sizable academic benefit from borrowing, such as University of Wollongong College
students, students in particular disciplines (e.g., arts), and cohorts (e.g., international males).
Consequently, loanable resources will continue to be relevant to these students.
7.3.2. Gender and origin
Fifty-two percent of UOW male students accessed UWL’s electronic resources for
five hours or less in 2010, compared to 34% for females. However, data indicate that males,
and domestic males in particular, obtain significantly more traction than females from
increasing their usage of resources, both print and electronic. So, prima facie, there appears to
be a good return on promotion effort to be made in targeting males, both in terms of impact
and usage.
Gender differences in usage are not unexpected, and have been found in other
research on information usage behavior. For example, Jones, Johnson-Yale, Millermaier &
Pérez (2009) reported that:
22
Our data suggest that women are more likely, for example, to report using
mainstream information sources than men. . . . Male college students spend greater
amounts of time pursuing a wide variety of leisure activities online with greater
frequency than females, including listening to and downloading music, watching and
downloading videos. The data are in line with the trend that Fortson et al. (2007)
observed in past literature, suggesting that males see the Internet primarily as an outlet
for leisure, while women make greater use of its social and educational functions
(Jones et al., 2009, pp. 259-260).
Lim and Kwon also recently cited Jones et al. (2009), noting that, “Male students tend
to use Wikipedia more frequently than female students and follow links on Wikipedia more
than their female counterparts.” However, the authors found “no gender difference in the use
of authorized information sources, contrasting with Jones et al.’s (2009) finding.” (Lim &
Kwon, 2010, p. 218.). Consequently, putting aside the unavoidable risk of sampling error, or
methodological problems, it appears that gender differences in the use of the collection may
not be uniform, which is entirely expected given the complexity of gender.
7.3.3. Faculties
When looking at the difference in academic performance of students who do not use
UWL resources, compared to the heaviest users, the Science faculty obtains the most benefit
from both print and electronic resources. The improvement for using electronic resources is
striking, with nonusers obtaining an average mark of 47, and steadily rising up to distinction
for the heaviest users (81).

23
Using the above metric, the faculty that gets the least academic benefit from books is
Health and Behavioral Sciences (HBS), and for electronic resources, it is Creative Arts.
However, few students occupy the highest frequency of usage (0.5% of HBS students
spent more than 161 hours in 2010 accessing electronic resources), and consequently it is
more meaningful to measure traction relative to frequencies of usage that do not sit on the
extreme tail of the usage curve. As Table 1 shows, 99% of students in 2010 spent less than 81
hours accessing electronic resources. When traction is measured as the difference between
the average mark for non-users and the average mark for those who spend between 41 and 80
hours accessing electronic resources, the story remains the same, except commerce replaces
HBS as the faculty receiving the lowest traction for books (commerce = 2 marks, education =
3 marks, HBS = 4 marks, and science = 13 marks). For electronic resources, the Science
faculty still receive the highest traction (nonusers average mark = 47, and the average mark
for students spending 41 to 80 hours accessing electronic resources = 76. Therefore, Science
traction = 29 marks). The lowest level of traction relative to students who spend between 41
and 80 hours accessing electronic resources is Creative Arts and the Sydney Business School
(traction = 8 marks for both).
One of the faculties with the highest proportion of nonusers of electronic resources
was engineering (second, with 20% students were nonusers). This matches Bridges’ research,
who found that, “Although engineering students did not statistically differ from their peers in
their use of the physical library, they were significantly less likely to use the online library
resources when compared with students from liberal arts” (2008, p. 194).
For books, the largest non-users were the Sydney Business School, followed by the
Commerce faculty.

24
7.3.4. First year
The relative benefit of using the UWL collection is the same for first-year students as
it is for other students. This finding poses questions on the relevance of current approaches to
information-literacy support, and how these skills could be promoted throughout a student’s
academic career to improve traction.
Similarly, the increase in usage beyond first year is very marginal, which suggests
that ongoing exposure to UWL promotions is not having the desired impact.
7.3.5. Undergraduates and postgraduates
Undergraduates get much more benefit from using the collection, compared to
postgraduates. For example, undergraduates who spent between 81 and 160 hours using
electronic resources in 2010 scored 20 marks higher on average than undergraduates who
didn’t use electronic resources in 2010. Postgraduates in the same category, however, scored
11 more marks.
7.3.6. Age
With the exception of the 22-year-olds and under, the data shows that the older a
person is, the less value they get from using the collection, and the less likely they are to use
the collection. Students over age 39 do not seem to benefit from increased borrowing, and the
evidence is also weak when it comes to electronic resources. The students that benefit the
most are ages 20 to 29 years, who fortunately are also the biggest group of students at UOW.
A picture is emerging from looking at the data through the lenses of year of
enrollment, courses and ages. It appears that UWL is doing a good job engaging with new
and relatively inexperienced students. However, increased usage of the collection is not

25
having anywhere near the same impact for our experienced students. This is something UWL
will need to investigate further.
7.4. Future for the cube
The library cube is now part of UOW systems, and will receive ongoing funding. This
is one of the key points that differentiate the library cube from existing longitudinal studies,
even the ground-breaking large scale quantitative work being undertaken through
Huddersfield University Library via the Library Impact Data Project. There, when Phases I
and II are finished, data collection will cease. However, the library cube will continue to be
perpetually updated with census data. The business case for maintaining the library cube is
simple:
• Library resources are expensive. Improving usage reduces the per student cost of the
electronic and physical collection. The library cube is essential to achieving and
identifying improved usage.
• Like all universities, UOW is seeking to reduce student attrition through early
intervention and activities aimed at improving student engagement. Student attrition
data will eventually be linked to the library cube. Once this dataset is linked, the
library cube can be used along with other datasets to identify groups of students who
are high attrition risks. The economic benefit of reducing student attrition is
significant, and can be comparatively easily quantified.
The library cube has allowed UWL to identify and describe usage patterns, but it does
not explain them. Explaining student behaviors, such as why there are a higher proportion of
male nonusers, is beyond the scope of this paper. Similarly, explaining the outcomes such as
why female international students do not get the same benefit from using UWL resources as

26
their domestic counterparts, is also beyond the scope. The limitation of the library cube is that
it describes, but it cannot explain. With this in mind, UWL researchers have been meeting
with faculty education committees and senior staff throughout the university to discuss the
findings, and what actions can be taken to address the findings. The response has exceeded
expectations, with academic staff highly engaged with the process.
Once the marketing cube is completed, UWL will be in a position to assess the
success of its promotions on a week by week basis. Changing any behavior is challenging,
and finding the effective formula will require constant experimentation, assessment, and
recalibration. The marketing cube will provide the marketing intelligence that is needed to
feed promotion experimentation.
8. Conclusion
The library cube project represents a new milestone in the UWL’s quality and
assessment journey. Well-established measures of effectiveness, efficiency, and satisfaction
are now being augmented by measures of impact and value. Through the development of the
library cube, UWL has established solid evidence that it plays a vital role in students’
academic success, and that students who do not use the UWL information resources are at an
academic disadvantage. The findings also reveal opportunities for improvement. Most
importantly, UWL now has at its disposal a tool that can be used to improve learning
outcomes for students, by identifying non- and low-user groups, and being able to assess
whether targeted initiatives changed students’ behavior and outcomes. Libraries do need to be
careful, however, that they differentiate the value provided by their collections from the value
provided by the library itself. The library can add value by improving usage and traction, and
this is something no vendor or search engine provider can achieve.

27
Acknowledgements
The library cubes could not have been built without the expertise and professionalism of
University of Wollongong’s Performance Indicator Unit. In particular, the authors would like
to acknowledge and thank Brad Dixon (Senior Technical Analyst), Amanda Nedeski
(Business Analyst), and Richelle Hilton (Director).
References
Bridges, L.M. (2008). Who is not using the library? A comparison of undergraduate
academic disciplines and library use. portal: Libraries and the Academy, 8(2), 187-
196. doi: 10.1353/pla.2008.0023
British Library (2003). Measuring our value. Retrieved from
http://www.bl.uk/pdf/measuring.pdf
Goodall, D., & Pattern, D. (2011). Academic library non/low use and undergraduate student
achievement: A preliminary report of research in progress. Library Management,
32(3), 159-170. doi: 10.1108/01435121111112871
Jantti, M., & Cox, B. (2010, October). Measuring the value of library resources and student
academic performance through relational datasets. In S. Hiller, K. Justh, M.
Kyrillidou, & J. Self (Eds.), Proceedings of the Library Assessment Conference:
Building effective, sustainable, practical assessment. Washington, DC: Association of
Research Libraries (pp. 525-532). Retrieved from
http://libraryassessment.org/bm~doc/proceedings-lac-2010.pdf
JISC. (2011). Library Impact Data Project. Bristol, UK: JISC. Retrieved from
http://www.jisc.ac.uk/whatwedo/programmes/inf11/activitydata/libraryimpact.aspx
Joint, N. (2008). Is digitisation the new circulation?: Borrowing trends, digitisation and the
nature of reading in US and UK libraries. Library Review, 57(2), 87-95. doi:
10.1108/00242530810853973
Jones, S., Johnson-Yale, C., & Millermaier, S., Pérez, F. S. (2009). U.S. college students’
internet use: Race, gender and digital divides. Journal of Computer-Mediated
Communication, 14(2), 244-264. doi: 10.1111/j.1083-6101.2009.01439.x.
Kim, W. C., & Mauborgne, R. (2005). Blue ocean strategy: From theory to practice,
California Management Review. 47(3), 105-121.
Lim, S., & Kwon, N. (2010). Gender differences in information behavior concerning
Wikipedia, an unorthodox information source? Library & Information Science
Research, 32, 212-220. doi: 10.1016/j.lisr.2010.01.003

28
Lindauer, B. G. (1998). Defining and measuring the library’s impact on campuswide
outcomes. College & Research Libraries, 59(6), 546-570. Retrieved from
http://crl.acrl.org/content/59/6.toc
Matsuoka-Motleya, N. (2011). Librarian as commodity: Outsourcing in Japanese academic
libraries. The Journal of Academic Librarianship, 37(3), 273-277. doi:
10.1016/j.acalib.2011.03.001
Neal, J. G. (2011). Stop the madness: The insanity of ROI and the need for new qualitative
measures of academic library success. In D. M. Mueller (Ed.), A declaration of
interdependence: Proceedings of the ACRL 2011 Conference, March 30-April 2,
2011, Philadelphia, PA. Chicago, IL: ACRL. Retrieved from
http://www.ala.org/acrl/sites/ala.org.acrl/files/content/conferences/confsandpreconfs/n
ational/2011/papers/stop_the_madness.pdf
Nicholas, D., Huntington, P., Jamali, H. R., & Tenopir, C. (2006). Finding information in
(very large) digital libraries: A deep log approach to determining differences in use
according to method of access. Journal of Academic Librarianship, 32, 119–126. doi:
10.1016/j.acalib.2005.12.005
Nicholas, D., Rowlands, I., Huntington, P., Jamali, H. R., & Salazar, P. H. (2010). Diversity
in the e-journal use and information-seeking behavior of UK researchers. Journal of
Documentation, 66, 409-433. doi: 10.1108/00220411011038476
Oakleaf, M. (2010). Value of academic libraries: A comprehensive research review and
report. Chicago, IL: Association of College and Research Libraries.
Poll, R. (2010, August 23). Can we quantify the library’s influence? Creating an ISO
standard for impact assessment. Paper presented at 9th Northumbria International
Conference on Performance Measurement in Libraries and Information Services,
York, England. Retrieved from http://www.york.ac.uk/about/departments/support-
and-admin/information-directorate/events/performance-conference-
2011/presentations/
Shupe, E. I., & Pung, S. K. (2011). Understanding the changing role of academic librarians
from a psychological perspective: A literature review. The Journal of Academic
Librarianship, 37, 409-415. doi: 10.1016/j.acalib.2011.06.005
Stone, G., Ramsden, B., & Pattern, D. (2011). Looking for the link between library usage and
student attainment. Ariadne, 67. Retrieved from
http://www.ariadne.ac.uk/issue67/stone-et-al/

29
Figures and tables
<Figure 1: Library Cube snapshot>
NOTE: Numbers have been grayed out where the total is less than 10
<Figure 2: Student marks by online resource usage>

Note: Data excludes students with null or zero marks, and excludes UOW offshore students. Some students have marks very close to ze
(as they may have attended one lecture but did not drop the class by the required deadline
greater than 14, and 96.96% have a mark greater than 34). Many of the data points overlap because of the large number of stu
represented here. The data excludes 0.1% outliers
included. The data table used to create this figure is not included, as it would require a table containing more than 21,000
Data excludes students with null or zero marks, and excludes UOW offshore students. Some students have marks very close to ze
lecture but did not drop the class by the required deadline—note that 99.16% of students have a mark
greater than 14, and 96.96% have a mark greater than 34). Many of the data points overlap because of the large number of stu
data excludes 0.1% outliers—therefore 99.9% of students with a weighted average mark greater than zero were
included. The data table used to create this figure is not included, as it would require a table containing more than 21,000
30
Data excludes students with null or zero marks, and excludes UOW offshore students. Some students have marks very close to zero
note that 99.16% of students have a mark
greater than 14, and 96.96% have a mark greater than 34). Many of the data points overlap because of the large number of students
therefore 99.9% of students with a weighted average mark greater than zero were
included. The data table used to create this figure is not included, as it would require a table containing more than 21,000 rows of data.

<Figure 2a: Student marks by online resource usage>
Notes:
• Any frequency that had less than 10 students was defined as an outlier, and was excluded. The outliers only constitute half a
the total (112 out of 21613).
• In order to be able to apply a logarithmic line of best fit, each of the frequencies was incremented by one. However, this has no impact
on the correlation, the shape of the line of best fit, or the relationship of the points to each other.
• Data excludes students with null or zero marks
students
<Figure 2b: Student marks by online resource usage (excluding very low achievers)>
Notes:
• Frequencies beyond 65 hours were not excluded as outliers with the result
• Data excludes students with null or zero marks, and excludes UOW offshore students
students
e 2a: Student marks by online resource usage>
Any frequency that had less than 10 students was defined as an outlier, and was excluded. The outliers only constitute half a
logarithmic line of best fit, each of the frequencies was incremented by one. However, this has no impact
on the correlation, the shape of the line of best fit, or the relationship of the points to each other.
Data excludes students with null or zero marks, and excludes UOW offshore students, and Australian Command and Staff College
<Figure 2b: Student marks by online resource usage (excluding very low achievers)>
Frequencies beyond 65 hours were not excluded as outliers with the result that 1.4% of students were excluded as outliers.
Data excludes students with null or zero marks, and excludes UOW offshore students, and Australian Command and Staff College
31
Any frequency that had less than 10 students was defined as an outlier, and was excluded. The outliers only constitute half a percent of
logarithmic line of best fit, each of the frequencies was incremented by one. However, this has no impact
, and excludes UOW offshore students, and Australian Command and Staff College
<Figure 2b: Student marks by online resource usage (excluding very low achievers)>
that 1.4% of students were excluded as outliers.
, and Australian Command and Staff College

<Figure 3: Student marks by borrowing>
Note: Data excludes students with null or zero marks, and excludes UOW offshore students
students
<Figure 3: Student marks by borrowing>
s with null or zero marks, and excludes UOW offshore students, and Australian Command and Staff College
32
, and Australian Command and Staff College

<Figure 4: Frequency distribution student marks
Notes:
• Nonusers = zero time spent accessing electronic
• Low users = 0+ to 10 hours
• Medium users = 11 to 40 hours
• High users = 41 + hours
• Data excludes students with null or zero marks, and excludes UOW offshore students, and Australian Command and Staff College
students
<Table 1: Library usage by gr
Number of students by resource usage and WAM, 2010Frequenc
y of usage
Borrowing
No.
students
%
No Usage 6,902 32%
1 - 5 5,363 25%
6 - 10 2,713 13%
11 - 20 2,751 13%
21 - 40 2,325 11%
41 - 80 1,217 6%
81 - 160 317 1%
161 - 320 25 0%
ncy distribution student marks by levels of online resource usage>
Nonusers = zero time spent accessing electronic resources
Data excludes students with null or zero marks, and excludes UOW offshore students, and Australian Command and Staff College
<Table 1: Library usage by grades and number of students>
Number of students by resource usage and WAM, 2010 Electronic resources
WAM Cumulativ
e
difference
No.
students
%
63 0 1,707 8%
65 2 7,316 34%
67 4 4,058 19%
68 5 4,556 21%
70 7 2,923 14%
72 9 923 4%
73 10 122 1%
74 11 7 0%
33
by levels of online resource usage>
Data excludes students with null or zero marks, and excludes UOW offshore students, and Australian Command and Staff College
WAM Cumulativ
e
difference
58 0
63 5
66 8
69 11
71 13
73 15
74 16
77 19
34
Outliers 0 1
Total 21,613 100% 21,613 100%
Note: Data excludes students with null or zero marks, and excludes UOW offshore students,
and Australian Command and Staff College students. The values in the table measure the
number of students, not the number of books borrowed. For example, 5,363 students
borrowed between 1 to 5 items from UWL’s physical collection in 2010.
<Table 2: Female Library usage by student type and marks >
Female electronic resource usage by student type & marks, 2010
Domestic females International females
No.
students
% WAM Cumulative
difference
No.
students
% WAM Cumulative
difference
No Usage 309 4% 60 232 9% 64
1 - 5 2,248 27% 66 6 739 27% 61 -3
6 - 10 1,679 20% 69 9 509 19% 63 -1
11 - 20 2,074 25% 71 11 636 23% 65 1
21 - 40 1,421 17% 73 13 427 16% 66 2
41 - 80 481 6% 75 15 141 5% 68 4
81 - 160 63 1% 75 15 24 1% 72 8
Outliers 3 0% 1
Total 8,278 100% 2,709 100%
Note: Data excludes students with null or zero marks, and excludes UOW offshore
students, and Australian Command and Staff College students