Embed Size (px)
Citation preview

CARRA Working Paper Series Working Paper 2017-09
Capturing more than poverty: School free and reduced-price lunch data and household income
Thurston DominaUniversity of North Carolina, Chapel Hill
Quentin Brummet Nikolas Pharris-Ciurej
Sonya R. Porter U.S. Census Bureau
Andrew Penner Emily Penner
Tanya Sanabria University of California, Irvine
Center for Administrative Records Research and Applications U.S. Census Bureau
Washington, D.C. 20233
Paper Issued: December, 2017 Disclaimer: This paper is released to inform interested parties of research and to encourage discussion. The views expressed are those of the authors and not necessarily those of the U.S. Census Bureau.

Capturing more than poverty: School free and reduced-price lunch data and household income
Abstract
Educational researchers often use National School Lunch Program (NSLP) data as a proxy for student poverty. Under NSLP policy, students whose household income is less than 130 percent of the poverty line qualify for free lunch and students whose household income is between 130percent and 185 percent of the poverty line qualify for reduced-price lunch. Linking school administrative records for all 8th graders in a California public school district to household-level IRS income tax data, we examine how well NSLP data capture student disadvantage. We find both that there is substantial disadvantage in household income not captured by NSLP categorydata, and that NSLP categories capture disadvantage on test scores above and beyond household income.
1

Introduction
The National School Lunch Program (NSLP) is among the oldest and largest child development programs in the United States. Founded in 1946, the program now serves free or reduced-price meals to over 30 million students at a cost of nearly $12.6 billion annually (USDA 2017). The program provides free lunches to students whose household income is less than 130 percent of the poverty line and reduced-price lunches to students whose household income is between 130 percent and 185 percent of the poverty line, based on student, parent, or guardian reports of total household income. Nearly 99 percent of all public schools offer meals via the NSLP, and close to 60 percent of US children, aged 5 to 18, receive meals through the program at least once per week (IOM 2008; Snyder et al. 2016).
As free and reduced-price lunch participation are often the sole available indicators ofstudent socioeconomic status available in K-12 school administrative data, the program also plays a central role in research on the relationship between poverty and academic outcomes, and in the allocation of school finances. Educational researchers routinely categorize students as poor or non-poor based on their NSLP enrollment (c.f. Hill, Bloom, Black, & Lipsey 2008; Reardon 2011) and represent peer poverty based on classroom or school-level free and reduced-price enrollment rates (Hanushek et al. 2003; Kim & Sunderman 2005). Likewise, school finance policies – including federal Title I funds as well as state and local weighted student funding formulae – use NSLP enrollment data to target supplemental funds to poor students.
In this paper, we investigate whether free and reduced-price lunch designations capture students’ household income and educational disadvantage. We draw on a unique link between student administrative records from 8th graders in one mid-sized California public school district and Internal Revenue Service (IRS) records of students’ annual household income. The resulting dataset combines educational administrative data with students’ annual household income data,providing an unprecedented look at the relation between NSLP enrollment categories, the economic resources in students’ homes, and students’ educational achievement.
Our analyses suggest that school reports of students’ NSLP enrollment do not capture students’ socio-economic resources as measured by IRS-reported annual household income. Interestingly, however, our analyses indicate that NSLP data may better capture student educational disadvantage than annual household income data. School-reported measures of student free or reduced-priced lunch enrollment correlate more strongly with test scores than doNSLP eligibility categories that we generate using IRS-reported annual household income.Further, we find that school NSLP enrollment data predict test scores independent of othermeasures of household income, suggesting that NSLP categories may capture income volatility, educator perceptions of family resources, and other dimensions of disadvantage beyond annual household income. Finally, we show that the degree to which free and reduced-price lunchclassification captures student poverty varies across schools, so that school-level free or reduced-price lunch enrollment rates provide an imprecise measure of school-level economic disadvantage.
2

Background
In 1946, when President Harry Truman authorized the NLSP, he cited evidence suggesting that approximately 10 percent of the young men drafted during the World War II period were ineligible for service due to the consequences of severe malnutrition. Seventy years later, food insecurity remains a challenge in the US, and the USDA classifies approximately 19 percent of households with children as “food insecure” (Coleman-Jensen, McFall, & Nord, 2013). The NLSP’s primary aim is to address the substantial and well-documented developmental challenges associated with childhood malnutrition (c.f. Adolphus et al. 2013, Brown & Pollitt 1996, Frisvold 2015, Glewwe et al. 2001, Hinrichs 2010, Victora et al. 2008) by assuring that poor and near-poor students in American schools have access to at least one nutritious meal during school days.
In addition, the NSLP occupies a central place in educational research. Administrative data from schools are a cornerstone for contemporary educational research, since they provide repeated measures of academic progress and educational contexts for the universe of students in many states and large districts. However, NSLP enrollment is often the only indicator of student home economic resources available in K-12 administrative data. While scholars acknowledge that the coarseness and limited purview of this measure of family background is a limitation,they utilize free or reduced-price lunch enrollment categories extensively as an individual-level control or stratifying variable, and use school-level variation to characterize the concentration of poverty in schools; prominent examples include Chetty, Friedman, & Rockoff 2014; Dobie & Fryer 2010; Figlio & Hart 2014; and Morris & Perry 2016.
The NSLP also plays an instrumental role in the provision of funds targeted at schools that educate economically disadvantaged youth. The Elementary and Secondary Education Act allocates Title I funds to districts and schools based on the proportion of students enrolled in the free or reduced-price lunch program. Likewise, 34 states allocate supplemental educational funds to districts based on free or reduced-price lunch enrollment rates (Verstegen 2011).
However, several scholars have raised concerns about the validity of free and reduced-price lunch data as a measure of student socioeconomic status (Cruse & Powers 2006; Harwell & LeBeau 2010; Michelmore & Dynarski 2016). As Michelmore and Dynarski (2016) point out, NSLP thresholds obscure important variation in household resources at both the top and bottom of the income distribution, likely leading scholars to under-estimate the relationship between household resources and student educational experiences and outcomes. Recent changes to the legislation governing the NSLP may render the measure increasingly problematic for research purposes and governmental programs with funding formulae that rely upon NSLP enrollment data. A series of provisions authorized by the U.S. Department of Agriculture (USDA) in 2002 make it possible for schools in which many students are enrolled in the free lunch program to renew students’ program registration for up to four years without collecting updated information on students’ household incomes (USDA 2002). Further, the Healthy, Hunger-Free Kids Act of 2010’s Community Eligibility Provision (CEP), implemented nationwide in the 2014-15 school year, aims to allow schools or districts in which 40 percent or more of students are directly certified for enrollment in the NSLP, based on their participation in other federal nutrition programs targeted at poor and near-poor families, to offer free lunch and breakfast to all students
3
without collecting data on other students’ household income. Currently more than 15 percent of U.S. students attend a school or district that participates in the CEP (Segal et al. 2016). As this program becomes more widely adopted, it will likely create new challenges for educational researchers using school-reported NSLP participation rates as a proxy for economic disadvantage.
District offices enroll students in free and reduced-price lunch based on student, parent,or guardian reports of household income, collected in varying ways in different contexts. The USDA provides detailed guidance to schools about how to solicit and validate applications for NSLP data. Districts are required to publicize the program’s existence via local media,encourage participation by sending letters home with children, solicit standardized information about students’ household size and current income from all household earners, and retain records for potential audit. However, schools may vary in encouragement and assistance they provide to potential NSLP applicants.1 Accordingly, the degree to which free and reduced-price lunchenrollment categories capture socio-economic disadvantage might vary across schools.
Research Questions
In this paper we provide the first available data on the relationship between free and reduced-price lunch enrollment and families’ annual household income. We address three questions:
1. What is the relationship between IRS-reported annual household income and school-reported free or reduced-price lunch program enrollment?
2. What is the relationship between school-reported NSLP enrollment and student test scores? How does this relationship compare to the relationship between IRS-reported annual household income and test scores?
3. To what extent do school-level measures of free and reduced-price lunch enrollment rates correspond to other income-based measures of school-level socioeconomic disadvantage?
Data and Methods
Our data include student-level administrative records from all 8th graders enrolled in one mid-sized California public school district for the 2008-09 through 2013-14 school years. As is typically the case in school administrative data, these district records provide little information about students’ family background beyond a categorical variable describing whether studentswere listed by the district, for a given academic year, as enrolled to receive free lunch, reduced-price lunch, or no support under the NSLP.2 We aggregate this information at the school level tocalculate school-level NSLP enrollment rates consistent with those typically utilized in
1 Federal guidelines regarding verification of NSLP eligibility are available at https://fns-prod.azureedge.net/sites/default/files/cn/EligibilityManualFinal.pdf.2 It would also be useful to examine the district’s designation for students’ program enrollment status over multiple years and at other ages (as in Dynarski and Michelmore 2016), however we unfortunately only have NSLP data from 8th grade.
4
educational research and for federal- and state-resource allocations. To examine the relationship between student poverty, NSLP enrollment, and student schooling outcomes, we use student test score data from the end of students’ 8th grade years. In California, during this time period,students were tested annually with the California Standards Test (CST) in grades 2 through11.3
District measures of free and reduced-price lunch enrollment reflect NSLP enrollment thresholds. Students whose household income is less than 130 percent of the poverty line4 are eligible for free lunch, and students with household incomes between 130 and 185 percent of poverty are eligible for reduced-price lunch.5 Thus, it is important to understand the process through which NSLP applications capture household income and size. In the district under study,the NSLP application asks for the current income, which is defined as pre-tax income from a wide variety of sources in the last month. The application specifies that the definition of income includes earnings from all sources (including work, pensions, public assistance, child support, and interest) from all members of the household (defined as “related or non-related individuals who are living as one economic unit and sharing living expenses.”)6
We linked these student-level records with IRS tax records stored at the U.S. Census Bureau. Most notably, these IRS records include income information for the students’ households, as reported on 1040 forms filed during each year of students’ elementary school and early high school careers. Despite the limitations of IRS-derived measures of household income that we discuss below, our IRS-reported income measures provide unprecedented insights into the economic resources available in students’ homes. The IRS-reported income data are continuous, include a wide range of income sources, and are collected in a context in which respondents have scaffolds (in the form of W2s and similar statements) as well as strong legal incentives to report accurate data.
The student records were processed at the Census Bureau using the Person Identification Validation System (PVS), which employs record linkage techniques using personal information such as Social Security Number, name, date of birth, and address to assign each student, when
3 We examine student performance in English Language Arts because 8th grade students all take the same exam in this subject. By contrast, student mathematics course-taking in California, and in this district, begins to differentiate in 8th grade, such that some students are tested in pre-algebra and others in algebra. 4 The poverty line is defined annually by the U.S. Department of Health and Human Services and is the threshold used to determine who is officially considered in poverty (defined as having less than the amount of income necessary for a family to pay for a minimum level of food, clothing, transportation, shelter, etc.). In 2017, the poverty line for a family of four was $24,600 (US DHHS 2017).5 Note, however, that students in households receiving benefits from certain assistance programs (e.g. Supplemental Nutrition Assistance Program) are directly enrolled in the NSLP program. 6 The NSLP application states that if the household income in the past month was unusually high or low, the applicant should report the household’s usual current monthly income.
5

possible, an anonymized unique Protected Identification Key (PIK).7 Approximately 94 percent of students in the school administrative records were assigned a PIK. These students were matched to the IRS 1040 tax records. Approximately 99 percent of all IRS 1040 records filed across the United States were assigned a PIK. As not every household files taxes in every year and not all students received a PIK, 8th grade household income is available for 87 percent of the students for whom we also have school NSLP enrollment data.8
We use the IRS 1040 tax records to create measures of the household income to poverty ratio, and predicted free and reduced-price lunch eligibility following the NSLP enrollment thresholds. However, in comparison to the measures found in the school administrative records, differences exist in the operationalization of household, household size, and household income.9We use a unique address identifier to indicate a student’s household and household size is based upon the total number of primary, secondary, and dependent exemptions claimed on all 1040s filed in a household.
As multiple persons in a household may file a 1040, we follow USDA—Food and Nutrition Service guidelines and define household income as the sum of all total money income reported on all filed 1040s in a student’s household. An important limitation to this approach is that tax years and school years are not aligned. We use students’ household income from the IRS tax records for the calendar year that coincides with the beginning of the school year (e.g. for the 2008-09 school year we use 2008 tax records) since schools typically ask students to complete NSLP applications at the beginning of the school year. We are unable to account for short-term income volatility and its implications for student NSLP enrollment. Recent data suggests that this
7 Once the PIK is assigned personal information is removed from the file to protect the student’s confidentiality. For more information on the linking process used in this study, see Wagner and Layne (2014). 8 Students that live in a household that does not files taxes are excluded from the analysis. As 13 percent of our sample live in such households, we examined whether it is associated with any socio-demographic or academic indicators. We find that foreign born Hispanic students, student that perform poorly on the English Language Arts test, students that receive free lunch, and students that are English Language Learners are all more likely than their peers to live in a household that did not file taxes for the calendar year the student started 8th grade.
As another assessment of the potential impact of missing 8th grade income information on our findings, we re-ran our models using a measure of 8th grade income that uses IRS reported income from the immediately succeeding and preceding tax years, in that order, as a proxy for 8th
grade household income for students that lived in a household without 1040 income data for 8th
grade (e.g. no one in the household filed). Overall, the results from the supplementary analyses (where we are able to link 92.4 percent of students with NSLP information to IRS information) were very similar to those presented in the paper. Results are available upon request. 9 Due to these differences we re-estimated the models presented below with varying samples ofstudents to examine whether the results were robust to changes in the sample based upon various household size and number of 1040s filed per household inclusion thresholds (e.g. limit the sample to households in which only one 1040 was filed; household with 7 or fewer people).Although the specific point estimates and p-values varied, the general patterns were consistent.
6

volatility is substantial, such that the average family spends several months each year with a monthly household income that is at least 25 percent lower than their annual household income (Morduch & Schneider 2017). Such volatility may produce differences between NSLP enrollment data and IRS income data if students enroll in NSLP based on household income during a period of unemployment or underemployment, but remain on the program throughout the school year.10
We use household income and size to create a measure of household income relative to the poverty line, dividing the students’ household income by the poverty threshold for a household of their size. We also create a series of annual indicators from kindergarten through 8th grade indicating whether students came from households with incomes less than 130 percent of the poverty line (corresponding to the free lunch threshold), between 130 and 185 percent of the poverty line (corresponding to the reduced-price lunch threshold), and whether the student lived in a household with an income below the poverty threshold.11 We use these measures to examine the distributions of household income relative to NSLP enrollment for 8th grade students in our sample.12
We then examine the relationship between NSLP enrollment, IRS-reported annual household income, and student achievement on the English Language Arts (ELA) portion of the California Standards Test. Under state and federal school accountability law, California public schools administered this assessment of student mastery of state instructional standards for 8th
grade ELA courses to all students in the spring of their 8th grade year. In a series of OLS regression models, we compare the extent to which NSLP enrollment and IRS-reported annual household income each explain variation on this achievement net of controls for student
10 Since our data cannot address short-term income volatility, and NSLP eligibility guidelines do not prohibit students from enrolling in the NSLP based on short-term dips in household income, our findings cannot speak to which students are or are not eligible for the NSLP. Likewise, ourdata do not permit us to examine the extent to which students actually receive or consume free or reduced-price lunches via the NSLP participation. Gleason (2008) and others (for example, Ponza, Gleason, Hulsey, & Moore 2009; USDA 2004, 2015) seek to address questions around NSLP under- and over-enrollment, and several studies indicate that children discard between 10 and 45 percent of the food served via the NSLP (c.f. Buzby & Guthrie 2002; Byker et al. 2014; Cohen et al. 2013). 11 See https://www.fns.usda.gov/school-meals/income-eligibility-guidelines for details on NSLP eligibility and https://aspe.hhs.gov/poverty-guidelines for details on poverty status. Poverty status (and NSLP threshold indicators) were not computed for small handful cases (between .5and 1 percent of all cases) due to extreme values for household size or number of 1040s filed at an address. 12 See https://www.fns.usda.gov/school-meals/income-eligibility-guidelines for details on NSLP eligibility and https://aspe.hhs.gov/poverty-guidelines for details on poverty status. Poverty status (and NSLP threshold indicators) were not computed for small handful cases (between .5and 1 percent of all cases) due to extreme values for household size or number of 1040s filed at an address.
7

race/ethnicity, U.S. nativity, language status, and various measures of students’ prior exposure to poverty and family composition.
In a final analysis, we examine how measures of economic disadvantage vary between schools by plotting school disadvantage measures derived from school NSLP data as well as IRS income data separately by school.
Findings
NSLP enrollment data reduce continuous variation in students’ household income to poverty ratio into three discrete categories: Free lunch recipients, reduced-price lunch recipients, and non-free and reduced-price lunch (FRL) students. As such, these data inevitably result in the loss of information and obscure important differences among students within each category. NSLP participation data prevent differentiation between extremely poor students, such as the estimated 1.5 million U.S. children who live on less than $2 a day (Schafer, Edin & Talbert 2015) and students closer to the 130 percent of poverty threshold (which is equivalent to approximately $32,000 for students in a family of four.) Likewise, NSLP data inevitably confound students from relatively modest backgrounds whose family income is just above the 185 percent of poverty threshold for reduced-price lunch eligibility with their wealthy peers. In analyses reported in Appendix Table 1, we consider the extent to which these categories capture the continuous variation in student household income. Using categories constructed around the NSLP thresholds with IRS-reported household income data to predict a continuous measure of the household income to poverty ratio, we demonstrate that income categories account for 51percent of the variation in the continuous household income to poverty ratio in our school district. By contrast, the district’s NSLP categories account for 28 percent of the variation incontinuous household income.13
Figure 1 plots household income-to-poverty ratios for students separately by NSLP enrollment categories and illustrates the information lost by using free or reduced-price lunch status as a proxy for annual household income. This figure makes it clear that there is substantial variation in household income among students in the same NSLP participation category. In our district, this variation is particularly pronounced among program non-enrollees, a category that combines a substantial proportion of students from middle-income families (the majority of whom have household incomes between two or four times the poverty line), a considerable number of far more affluent students, and many students (approximately 13 percent of non-NSLP students) who have household incomes below the 185 percent of poverty threshold.
FIGURE 1 AROUND HERE
13 We estimate models predicting IRS-reported household income (divided by the poverty line) with categorical variables corresponding to the NSLP thresholds using IRS income to obtain insight into how much information is lost simply by virtue of relatively coarse categories. The adjusted R-square from these models is .51. We then estimate the same models using the district’s NSLP measure, which has an adjusted R-square of .28.
8

Considerable variation in household income also exists among free and reduced-price lunch recipients. Figure 1 illustrates that most free lunch recipients come from households with incomes near or slightly below the poverty line. However, the left tail of the income-to-poverty distribution for free lunch recipients includes a group of extremely poor students. In this district, 26 percent of free lunch recipients come from households with household incomes below the poverty line (or approximately $24,000 a year for a family of four.) Likewise, a substantial number (35 percent) have incomes that are greater than two times the poverty line.
Table 1 presents results from OLS regression models examining the relative predictive power of NSLP status and household income to explain student ELA achievement. Perhaps surprisingly, the analyses reported in Table 1 indicate that school-reported NSLP status variables are more closely associated with student achievement on standardized tests in ELA than parallel categories constructed using IRS-reported household income. Results from the first model reported in Table 1 indicate that compared to non-FRL students, students who are flagged as free lunch recipients in district administrative data score approximately 22 points (approximately 0.3 standard deviation) lower on the state mandated 8th grade ELA test, and students who are flagged as reduced-price lunch recipients score nearly 12 points lower. The R-square on this otherwise unconditional model is 0.10, indicating that these two NSLP status indicators alone explain 10 percent of the variation in 8th grade ELA achievement. By contrast, the results reported in the second model in Table 1 indicate that parallel variables constructed using IRS-reported household income explain 8 percent of the variation in 8th grade ELA achievement. Interestingly, both students whose IRS-reported household income is less than 130 percent of poverty and students whose IRS-reported household income is between 130 percent of poverty and 185 percent of poverty score roughly 9 points lower than students who appear to be ineligible for free or reduced-price lunch based on their IRS-reported income.
TABLE 1 AROUND HERE
The third and fourth models in Table 1 indicate that rather than being a simple butimprecise proxy for household income, NSLP enrollment appears to provide information about students that is unavailable in IRS-reported household income. We see in Model 3 that free lunch and reduced-price lunch enrollment categories significantly predict ELA achievement after controlling for the IRS measures. Indeed, free lunch enrollment continues to predict ELA achievement even after additionally controlling for linear and quadratic measures of IRS-reported household income to poverty ratios in Model 4.
Given that school-reported NSLP categories appear to contain information that is predictive of test scores above and beyond IRS-reported household income, we examine whether this might be explained by other student characteristics. Model 5 in Table 1 indicates that controlling for student race/ethnicity and language status substantially mitigates the relationship between school-reported NSLP categories and ELA achievement. However, even after including these demographic controls, as well as controls for prior years of poverty and below NSLP program thresholds from IRS records in model 6, school-reported NSLP categories continue to predict ELA achievement. Supplementary models, reported in Appendix Table 2, indicate that
9

these results are robust to the inclusion of multiple years of IRS-reported household income in linear and quadratic terms in order to control for longer-term income volatility.14
Taken together, the analyses reported in Figure 1 and Table 1 indicate that school free and reduced-price lunch information provide, at best, a noisy indicator of household income for the 8th graders for whom we have IRS data. At the same time, they indicate that these school-reported data provide important information about student disadvantage that is not captured in more direct IRS-reported household income measures.
FIGURE 2 AROUND HERE
Figure 2 examines whether school-level aggregated NSLP enrollment rates– often used in research and policy to understand the concentration of economic disadvantage across schools – capture school-level differences in household income. We plot the percent of students who 1) are enrolled in the free or reduced-price lunch program in our sample, 2) were below the poverty line according to IRS household income information from the relevant tax year, 3), were ever below the poverty line as a kindergarten through 8th grade, based on IRS records, 4) and were below the threshold for free or reduced-price lunch according to IRS information from the relevant taxyear. Figure 2 reveals substantial school variation in the degree to which the NSLP information aligns with other indicators of poverty. Schools 7 and 8, for example, have similar NSLP enrollment rates (74 and 75 respectively) but vary considerably on other measures of poverty, while schools 8 and 10 vary on NSLP enrollment rates (75 and 84) but are similar in their other measures of poverty. Thus, an understanding of the levels of poverty in a school and differences in levels across schools may vary substantially across different data sources used to indicate poverty.
Discussion
By linking student-level school administrative data and IRS records, our analyses provide hitherto unavailable evidence regarding the relationship between NSLP program enrollment information and socio-economic and educational disadvantage. We find that while in this district, schools’ administrative NSLP category data are at best imperfect proxies for the household income of students in a given year, NSLP information appears to capture additional aspects of disadvantage not captured by IRS income measures.
Before discussing the implications of these findings, it is important to note the limitations of our data. The most of obvious of these limitations is generalizability. While we know of no reason to think the district for which we have data is idiosyncratic, it is not yet clear whether the patterns we observe among 8th graders in one mid-sized public school district generalize morebroadly to other school districts in the US. However, to assess the generalizability, we replicated
14 Additionally, we re-estimated the models in Table 1 using average IRS-reported income from Kindergarten to 8th grade in place of 8th grade income. As expected, the measure of average income showed a stronger association with test scores than the 8th grade income measure. However, the general patterns were consistent with those presented in Table 1 and Appendix Table 2.
10

our analysis with linked administrative record and 1040 tax data from the state of Oregon for 8th
grade cohorts from 2004-05 through 2013-14. The Oregon administrative records include a larger sample of students (roughly 350,000 8th graders) and cover a broader period of time, butthe Oregon data only distinguish between students who receive free or reduced-price lunch and those who do not, providing no data on the distinction between free lunch recipients and reduced-price lunch recipients. Nonetheless, the results using the Oregon data are very similar to those reported here. Although we have found consistent results in two distinct locations, it will be important to for future analyses to continue to investigate the extent to which the correspondence between NSLP participation and household income varies across schools, districts, and students’ grade level.
A second set of limitations involves measurement. Our measure of household income, derived from IRS 1040 filings, is among the most valid measures of household income available. It captures income in a continuous fashion for all earners in a household from a broad array of sources including employer W2 earnings reports, investment returns, business income, and other sources. However, while the NSLP eligibility requirements appear to be designed to provide nutrition support to students who are experiencing relatively short-term income fluctuations, our IRS income measure is not sensitive to month-to-month income volatility. Further, the calendar year covered by IRS data captures only a portion of the August to May school year. An additional potential issue in our data involves the difference between households, as defined by the NSLP (all people that live in an economic unit and share living expenses), and IRS 1040 taxunits, which includes individuals or married couples that file together along with any dependents they declare that earn below the filing threshold. We compute IRS household income based upon all tax units in a household, a decision that may lead us to overstate household income in cases in which individuals live in housing units without sharing living expenses. At the same time, IRS data may undercount cash income and other informal income sources.
In light of these measurement issues, it is important to recognize that our analyses cannotspeak to questions around NSLP eligibility. However, they do indicate that free and reduced-price lunch data do not capture differences in household income-to-poverty ratios particularly well. As such, our analyses raise questions about the extent to which researchers and educators understand students’ household income and its relation to educational experiences.
At the same time, our analyses indicate that free and reduced-price lunch data tap into aspects of educational disadvantage that more precise IRS income data appear to elide. While welack direct evidence to explain why NSLP categories are more closely tied to educational disadvantage than IRS-reported measures of income, income volatility could be one explanation.If students enroll in free or reduced-price lunch during periods in which their household incomes dip and if these income dips have long-term consequences for student achievement, NSLP enrollment may provide information that IRS-reported annual household income data – even IRS-reported annual household income data over multiple years – do not. Related, schools may provide students with extra encouragement to apply for and participate in the school lunch program based on educators’ perceptions of student need. In such a case, NSLP enrollment
11

categories may reflect variation in resources and needs across families that simple household income data and poverty line calculations overlook.
From a policy perspective, federal and many state educational finance systems identify “high need” schools for targeted resources and other interventions based, in part, on theproportion of students in these schools who qualify for free or reduced-price lunch. If these criteria imprecisely distinguish poor and non-poor schools, they may impede efforts to provide educational opportunities for students from highly economically-disadvantaged homes.
Our findings thus raise many questions for future analyses. Further research – bothqualitative and quantitative – is needed to better understand the formal and informal processes that determine which children do and do not enroll in the NSLP and the ways in which these enrollment processes vary across schools and districts. In addition, we lack strong evidence regarding the consequences of NSLP enrollment for student school experiences and achievement outcomes.
12

References
Adolphus, Katie, Clare L. Lawton and Louise Dye. 2013. The effects of breakfast and academic performance in children and adolescents. Frontiers in Human Neuroscience, 7, 1-28.
Buzby, J. C., & Guthrie, J. F. (2002). Plate waste in school nutrition programs. The Journal of Consumer Affairs, 36(2), 220-238.
Byker, C. J., Farris, A. R., Marcenelle, M., Davis, G. C., & Serrano, E. L. (2014). Food waste in a school nutrition program after implementation of new lunch program guidelines. Journal of Nutrition Education and Behavior, 46(5), 406-411.
Cohen, J. F., Richardson, S., Austin, S. B., Economos, C. D., & Rimm, E. B. (2013). School lunch waste among middle school students: nutrients consumed and costs. American Journal of Preventive Medicine, 44(2), 114-121.
Coleman-Jensen, A., McFall, W., & Nord, M. 2013. Food insecurity in households with children: prevalence, severity, and household characteristics, 2010-11 (No. EIB-113). United States Department of Agriculture, Economic Research Service.
Chetty, R., Friedman, J. N., & Rockoff, J. E. (2014). Measuring the impacts of teachers I: Evaluating bias in teacher value-added estimates. The American Economic Review,104(9), 2593-2632.
Cruse, C., & Powers, D. (2006). Estimating school district poverty with free and reduced-price lunch data. US Census Bureau. http://www. census. gov/hhes/www/saipe/asapaper/CrusePowers2006asa. pdf.
Dobbie, W., & Fryer Jr, R. G. (2013). Getting beneath the veil of effective schools: Evidence from New York City. American Economic Journal: Applied Economics, 5(4), 28-60.
Dynarski, S., & Berends, M. (2015). Introduction to special issue. Educational Evaluation and Policy Analysis.
Fellegi, Ivan P. and Alan. B. Sunter. 1969. “A Theory for Record Linkage.” Journal of the American Statistical Association, 64, 1183-1210.
Figlio, D., & Hart, C. (2014). Competitive effects of means-tested school vouchers. American Economic Journal: Applied Economics, 6(1), 133-156.
Frisvold, David E. 2015. Nutrition and cognitive achievement: An evaluation of the School Breakfast Program. Journal of Public Economics, 124, 91-104
Glevwe, Paul, Hanan G. Jacoby and Elizabeth M. King. 2001. Early childhood nutrition and academic achievement: a longitudinal analysis. Journal of Public Economics, 81, 345-368.
13

Hanushek, E. A., Kain, J. F., Markman, J. M., & Rivkin, S. G. (2003). Does peer ability affect student achievement?. Journal of Applied Econometrics, 18(5), 527-544.
Hill, C. J., Bloom, H. S., Black, A. R., & Lipsey, M. W. (2008). Empirical benchmarks for interpreting effect sizes in research. Child Development Perspectives, 2(3), 172-177.
Hinrichs, Peter. 2010. The effect of the national school lunch program on education and health. Journal of Policy Analysis and Management, 29, 479–505.
IOM (Institute of Medicine). (2008.) Nutrition Standards and Meal Requirements for National School Lunch and Breakfast Programs: Phase I. Proposed Approach for Recommending Revisions. Washington, DC: The National Academies Press.
Morduch, J., & Schneider, R. (2017). The Financial Diaries: How American Families Cope in a World of Uncertainty. Princeton University Press.
Michelmore, K., & Dynarski, S. (2016). The Gap within the Gap: Using Longitudinal Data to Understand Income Differences in Student Achievement (No. w22474). National Bureau of Economic Research.
Morris, E. W., & Perry, B. L. (2016). The punishment gap: School suspension and racial disparities in achievement. Social Problems, 63(1), 68-86.
Reardon, S. F. (2011). The widening academic achievement gap between the rich and the poor: New evidence and possible explanations. Whither opportunity, 91-116.
Shaefer, H. L., Edin, K., & Talbert, E. (2015). Understanding the dynamics of $2-a-day poverty in the United States. RSF.
Snyder, T.D., de Brey, C., and Dillow, S.A. (2016). Digest of Education Statistics 2014 (NCES 2016-006). National Center for Education Statistics, Institute of Education Sciences, U.S. Department of Education. Washington, DC.
U.S. Department of Agriculture, Economic Research Service. (2017). National School Lunch Program Retrieved from https://www.ers.usda.gov/topics/food-nutrition-assistance/child-nutrition-programs/national-school-lunch-program/ on September 20th, 2017
U.S. Department of Health and Human Services. (2017). U.S. Federal Poverty Guidelines Used to Determine Financial Eligibility for Certain Federal Programs Retrieved from https://aspe.hhs.gov/poverty-guidelines on September 20th, 2017
Verstegen, D. A. (2011). Public education finance systems in the United States and funding policies for populations with special educational needs. Education Policy Analysis Archives, 19, 21.
14

Victora, Cesar G., Linda Adair, Caroline Fall, Pedro C Hallal, Reynaldo Martorell, Linda Richter, Harshpal Singh Sachdev, for the Maternal and Child Undernutrition Study Group. 2008. Maternal and child undernutrition: consequences for adult health and human capital. Lancet, 371, 340-357.
Wagner, D. and M. Layne. 2014. The Person Identification Validation System (PVS): Applying the Center for Administrative Records Research and Applications’ (CARRA) Record Linkage Software. Center for Administrative Records Research and Applications Working Paper 2014-01. Washington, DC: U.S. Census Bureau. Available at: https://www.census.gov/srd/carra/CARRA_PVS_Record_Linkage.pdf
15

Figure 1 Distribution of IRS-reported household income-to-poverty ratio by 8th grade NSLP enrollment in one California School District for academic years 2008-09 through 2013-14 (N =12,659).
Note: Distributions have been adjusted to comply with Census Bureau disclosure requirements
Source: Linked school district administrative records, for academic years 2008-09 through 2013-14, and Internal Revenue Service 1040 Tax data, from 2008 through 2013.
16
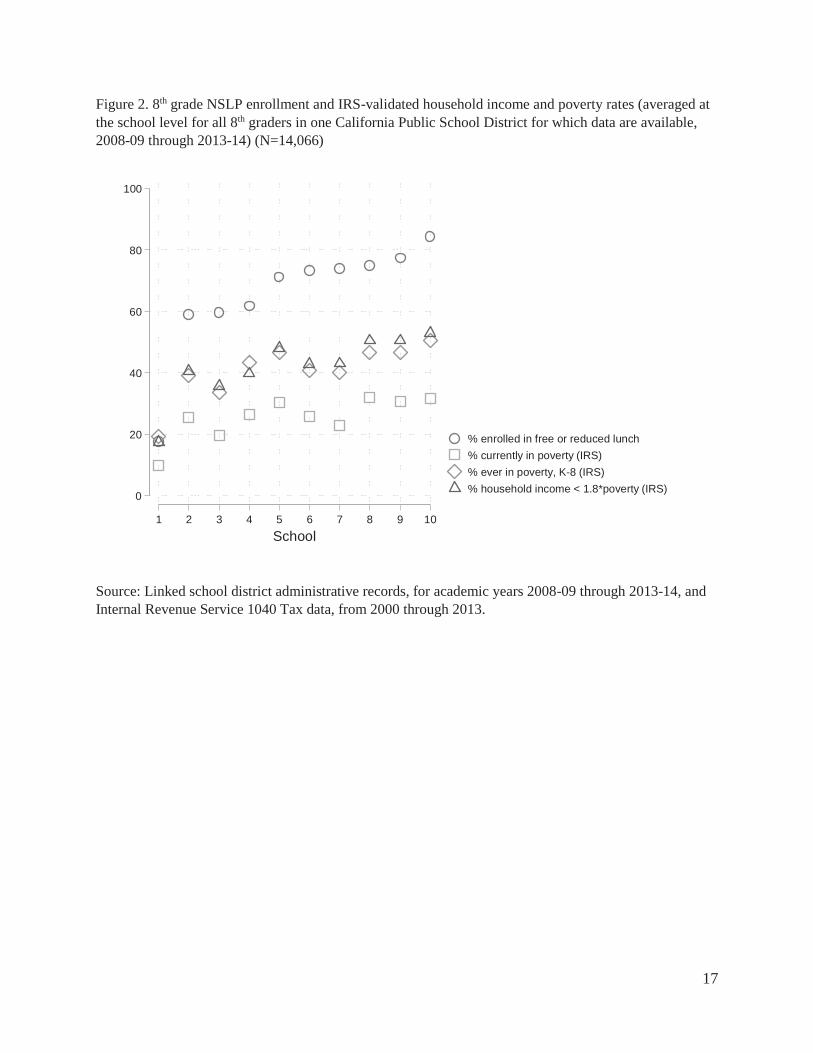
Figure 2. 8th grade NSLP enrollment and IRS-validated household income and poverty rates (averaged at the school level for all 8th graders in one California Public School District for which data are available, 2008-09 through 2013-14) (N=14,066)
0
20
40
60
80
100
1 2 3 4 5 6 7 8 9 10School
% enrolled in free or reduced lunch% currently in poverty (IRS)% ever in poverty, K-8 (IRS)% household income < 1.8*poverty (IRS)
Source: Linked school district administrative records, for academic years 2008-09 through 2013-14, and Internal Revenue Service 1040 Tax data, from 2000 through 2013.
17

Tabl
e 1.
OLS
pre
dict
ors o
f 8th
grad
e En
glis
h La
ngua
ge A
rts sc
ores
for s
tude
nts i
n on
e C
alifo
rnia
dis
trict
usi
ng li
nked
adm
inis
trativ
e an
d IR
S re
cord
s and
scho
ol
fixed
eff
ects
. M
odel
1
Coe
f. p-
valu
e M
odel
2
Coe
f.p-
valu
e M
odel
3
Coe
f. p-
valu
e M
odel
4
Coe
f. p-
valu
e M
odel
5
Coe
f.p-
valu
e M
odel
6
Coe
f. p-
valu
e N
SLP
Free
Lun
ch
-22.
06<.
001
-21.
63<.
001
-19.
54<.
001
-7.8
9<.
001
-7.9
0<.
001
NSL
P R
educ
ed-P
rice
Lunc
h -1
1.64
<.00
1-1
1.21
<.00
1-9
.06
<.00
1-3
.77
<.01
-3.9
2<.
01IR
S Fr
ee L
unch
-8
.67
<.00
1-0
.13
4.91
<.05
2.38
2.59
IRS
Red
uced
-Pric
e Lu
nch
-9.0
6<.
001
-3.1
4<.
050.
552.
031.
42H
H In
com
e to
Pov
erty
Rat
io
1.84
1.44
1.44
HH
Inc:
Pov
erty
Rat
io S
quar
ed
0.08
0.06
0.06
Bla
ck
-12.
80<.
01-1
2.92
<.01
US
Bor
n H
ispa
nic
-14.
60<.
001
-14.
73<.
001
Fore
ign
Bor
n H
ispa
nic
-13.
20<.
001
-13.
22<.
001
US
Bor
n A
sian
17
.25
<.00
117
.35
<.00
1Fo
reig
n B
orn
Asi
an
14.3
1<.
001
14.5
2<.
001
Unk
now
n PO
B H
ispa
nic
-22.
69<.
001
-22.
81<.
001
Unk
now
n PO
B A
sian
6.
27<.
016.
40<.
01(R
efer
ence
: Whi
te)
Engl
ish
Onl
y 45
.68
<.00
145
.78
<.00
1In
itial
ly F
luen
t in
Engl
ish
62.5
5<.
001
62.6
1<.
001
Rec
lass
ified
Flu
ent i
n En
glis
h 70
.37
<.00
170
.36
<.00
1M
ultip
le L
angu
age
Stat
uses
53
.58
<.00
153
.59
<.00
1(R
efer
ence
: Eng
lish
Lear
ner)
%
Yea
rs in
Pov
erty
-4
.38
% Y
ears
NSL
P El
igib
le
2.46
Con
stan
t 38
5.1
<.00
137
5.3
<.00
138
5.4
<.00
137
6.7
<.00
132
8.7
<.00
132
8.4
<.00
1N
=14
,066
14,0
6614
,066
14,0
6614
,066
14,0
66R
2 0.
096
0.07
70.
096
0.10
00.
406
0.40
6So
urce
: Lin
ked
scho
ol d
istri
ct a
dmin
istra
tive
reco
rds,
for a
cade
mic
yea
rs 2
008-
09 th
roug
h 20
13-1
4, a
nd In
tern
al R
even
ue S
ervi
ce 1
040
Tax
data
, fr
om 2
000
thro
ugh
2013
.
18

App
endi
x Ta
ble
1. P
redi
ctor
s of 8
thgr
ade
Hou
seho
ld In
com
e to
Pov
erty
Thr
esho
ld
Rat
io fo
r stu
dent
s in
one
Cal
iforn
ia d
istri
ct u
sing
link
ed a
dmin
istra
tive
and
IRS
reco
rds a
nd sc
hool
fixe
d ef
fect
s. M
odel
1
Coe
f. p-
valu
e M
odel
2
Coe
f. p-
valu
e N
SLP
Free
Lun
ch
-1.7
6<.
001
NSL
P R
educ
ed-P
rice
Lunc
h -1
.15
<.00
1IR
S Fr
ee L
unch
-2
.54
<.00
1IR
S R
educ
ed-P
rice
Lunc
h -1
.81
<.00
1C
onst
ant
3.64
<.00
13.
47<.
001
N=
18,7
9818
,798
R2
0.28
00.
506
Sour
ce: L
inke
d sc
hool
dis
trict
adm
inis
trativ
e re
cord
s, fo
r aca
dem
ic y
ears
200
8-09
thro
ugh
2013
-14,
and
Inte
rnal
Rev
enue
Ser
vice
104
0 Ta
x da
ta, f
rom
200
0 th
roug
h 20
13.
19

App
endi
x Ta
ble
2. O
LS p
redi
ctor
s of 8
thgr
ade
Engl
ish
Lang
uage
Arts
scor
es fo
r stu
dent
s in
one
Cal
iforn
ia d
istri
ct u
sing
link
ed a
dmin
istra
tive
and
IRS
reco
rds
and
scho
ol fi
xed
effe
cts.
Mod
el 1
C
oef.
p-va
lue
Mod
el 2
C
oef.
p-va
lue
Mod
el 3
C
oef.
p-va
lue
Mod
el 4
C
oef.
p-va
lue
Mod
el 5
C
oef.
p-va
lue
Mod
el 6
C
oef.
p-va
lue
NSL
P Fr
ee L
unch
-2
1.89
<.
001
-22.
09
<.00
1 -2
0.01
<.
001
-7.8
1 <.
001
-7.6
9 <.
001
NSL
P R
educ
ed-P
rice
Lunc
h -1
2.00
<.
001
-11.
60
<.00
1 -9
.37
<.00
1 -3
.98
<.01
-4
.01
<.01
IR
S Fr
ee L
unch
-8
.56
<.00
1 -1
.67
3.65
3.
56
3.94
<.
05
IRS
Red
uced
-Pric
e Lu
nch
-9.3
3 <.
001
-3.5
2 <.
05
0.15
1.
67
1.41
1
Yea
r Lag
IRS
Free
Lun
ch
-1.0
1 -0
.36
-2.8
9 -2
.35
1 Y
ear L
ag IR
S R
educ
ed-P
rice
Lunc
h -2
.42
-1.5
1 0.
49
0.30
2
Yea
rLag
IRS
Free
Lun
ch
0.81
1.
38
1.66
2.
28
2Y
ear L
ag IR
S R
educ
ed-P
rice
Lunc
h 0.
98
1.76
2.
21
2.16
3
Yea
r Lag
IRS
Free
Lun
ch
5.06
<.
01
5.11
<.
01
1.36
2.
48
3Y
ear L
ag IR
S R
educ
ed-P
rice
Lunc
h -0
.20
-0.2
5 -0
.84
-0.8
2 A
vg.K
-8 H
H In
com
e to
Pov
erty
Rat
io
2.47
<.
05
1.82
1.
66
Avg
.K-8
HH
Inc:
Pove
rty R
atio
20.
04
0.04
0.
05
Bla
ck
-10.
30
<.05
-1
0.45
<.
05
US
Bor
n H
ispa
nic
-15.
01
<.00
1 -1
5.14
<.
001
Fore
ign
Bor
n H
ispa
nic
-12.
91
<.01
-1
3.25
<.
001
US
Bor
n A
sian
16
.99
<.00
1 17
.10
<.00
1 Fo
reig
n B
orn
Asi
an
13.8
1 <.
001
13.6
9 <.
001
Unk
now
n PO
B H
ispa
nic
-22.
86
<.00
1 -2
2.95
<.
001
Unk
now
n PO
B A
sian
5.
81
<.01
5.
92
<.01
(R
efer
ence
: Whi
te)
Engl
ish
Onl
y 45
.55
<.00
1 45
.60
<.00
1 In
itial
ly F
luen
t in
Engl
ish
59.4
9 <.
001
59.5
0 <.
001
Rec
lass
ified
Flu
ent i
n En
glis
h 70
.67
<.00
1 70
.71
<.00
1 M
ultip
le L
angu
age
Stat
uses
53
.31
<.00
1 53
.36
<.00
1 (R
efer
ence
: Eng
lish
Lear
ner)
%
Yea
rs in
Pov
erty
-6
.52
<.05
%
Yea
rs N
SLP
Elig
ible
0.
46
Con
stan
t 38
5.3
<.00
1 37
5.7
<.00
1 38
5.5
<.00
1 37
4.8
<.00
1 32
7.6
<.00
1 32
8.0
<.00
1 N
=13
,353
13
,353
13
,353
13
,353
13
,353
13
,353
R
2 0.
094
0.07
5 0.
096
0.09
9 0.
404
0.40
4 So
urce
: Lin
ked
scho
ol d
istri
ct a
dmin
istra
tive
reco
rds,
for a
cade
mic
yea
rs 2
008-
09 th
roug
h 20
13-1
4, a
nd In
tern
al R
even
ue S
ervi
ce 1
040
Tax
data
, fro
m 2
000
thro
ugh
2013
.
20