Embed Size (px)
Citation preview
Scottish Carbon Capture & Storage
Murchison House, West Mains Road Edinburgh EH9 3LA
Telephone +44 (0)131 650 0270 www.sccs.org.uk
Carbon Accounting for Carbon Dioxide Enhanced Oil Recovery
November 2014
R Jamie Stewart, University of Edinburgh
Stuart Haszeldine, University of Edinburgh
www.sccs.org.uk 1 of 62
Contents
Summary of findings .............................................................................................................. 3
1. Introduction ........................................................................................................................ 5
2. Background Information ..................................................................................................... 6
2.1 Carbon accounting in the oil and gas sector .................................................................... 6
2.1.2 The European Union Emission Trading Scheme ...................................................... 6
2.1.3 Environmental Emissions Monitoring System ........................................................... 7
2.1.4 Measuring emissions in the oil and gas sector ......................................................... 8
2.1.5 Current GHG emissions from the oil and gas sector ................................................ 8
2.2 Key findings of previous studies .............................................................................. 11
2.3 Life cycle assessments- an introduction ........................................................................ 12
2.4 CO2EOR emission sources ............................................................................................ 13
2.4.1 CO2EOR operations ................................................................................................ 13
2.4.1.1 Compression ........................................................................................................ 13
2.4.1.2 Artificial lift ............................................................................................................ 14
2.4.1.3 Hydrocarbon gas separation ................................................................................ 14
2.4.2 Flaring / venting and fugitive emissions .................................................................. 15
2.5 CO2 Storage in EOR Projects .................................................................................. 17
2.5.1 Retention vs. storage .............................................................................................. 17
2.5.2 Storage factors ........................................................................................................ 17
2.6 Displacement, additionality and carbon intensity ....................................................... 19
3. Factors affecting the carbon balance- Onshore (US) vs offshore (UK) ........................... 21
3.1 Reservoir lithology ...................................................................................................... 21
3.2 Pressure and temperature .......................................................................................... 22
3.3 Well Density................................................................................................................ 23
3.4 Power supply .............................................................................................................. 24
3.5 CO2 import rate ........................................................................................................... 24
3.6 Injectivity issues ......................................................................................................... 25
4. Case study- A CO2EOR development in the North Sea .................................................. 26
4.1 Introduction .................................................................................................................... 26
4.1.1 Scope of this study .................................................................................................. 26
4.1.2 Life cycle analysis overview .................................................................................... 27
4.1.3 CO2EOR process overview- defining the system boundary ................................... 28
Overview of the EOR Process .......................................................................................... 28
4.2 Methodology ................................................................................................................... 30
4.2.1 Model design ........................................................................................................... 30
4.2.1.1 Infrastructure ........................................................................................................ 30
4.2.1.2 Wells ..................................................................................................................... 30
www.sccs.org.uk 2 of 62
4.2.1.3 Reservoir dynamics .............................................................................................. 30
4.2.2 Power generation/ fuel supply ................................................................................. 31
4.2.3 Production operations & power demand ................................................................. 31
4.2.4 Calculating emissions from production processes .................................................. 32
4.2.5 Flaring / venting & fugitive emissions ...................................................................... 33
4.2.6 Scenarios modelled ................................................................................................. 34
4.2.6.1 Injection strategy .................................................................................................. 34
4.3 Results ........................................................................................................................... 36
4.3.1 Emissions and storage through time ....................................................................... 36
4.3.2 Cumulative emissions ............................................................................................. 39
4.3.3 Cumulative CO2 stored ............................................................................................ 42
4.3.4 Net carbon balance ................................................................................................. 43
4.4 Discussion ...................................................................................................................... 44
4.4.1 Increasing the system boundary ............................................................................. 44
4.4.2 Double accounting of CO2 credits ........................................................................... 47
4.4.3 Uncertainties in this study ....................................................................................... 48
4.4.4 Utilisation Factor ...................................................................................................... 48
4.4.5 Exploring the control of flared/vented produced gas ............................................... 50
4.4.6 Comparison of findings with other studies .............................................................. 52
4.4.6.1 CO2 storage per barrel .......................................................................................... 52
4.4.6.2 Emissions per barrel ............................................................................................. 52
4.4.6.3 Emissions per kilogram of CO2stored .................................................................. 53
4.5 Future Work ................................................................................................................... 53
4.6 Conclusions .................................................................................................................... 54
References ........................................................................................................................... 56
Appendix .............................................................................................................................. 58
Previous work on the carbon balance of CO2EOR .............................................................. 58
www.sccs.org.uk 3 of 62
Summary of findings
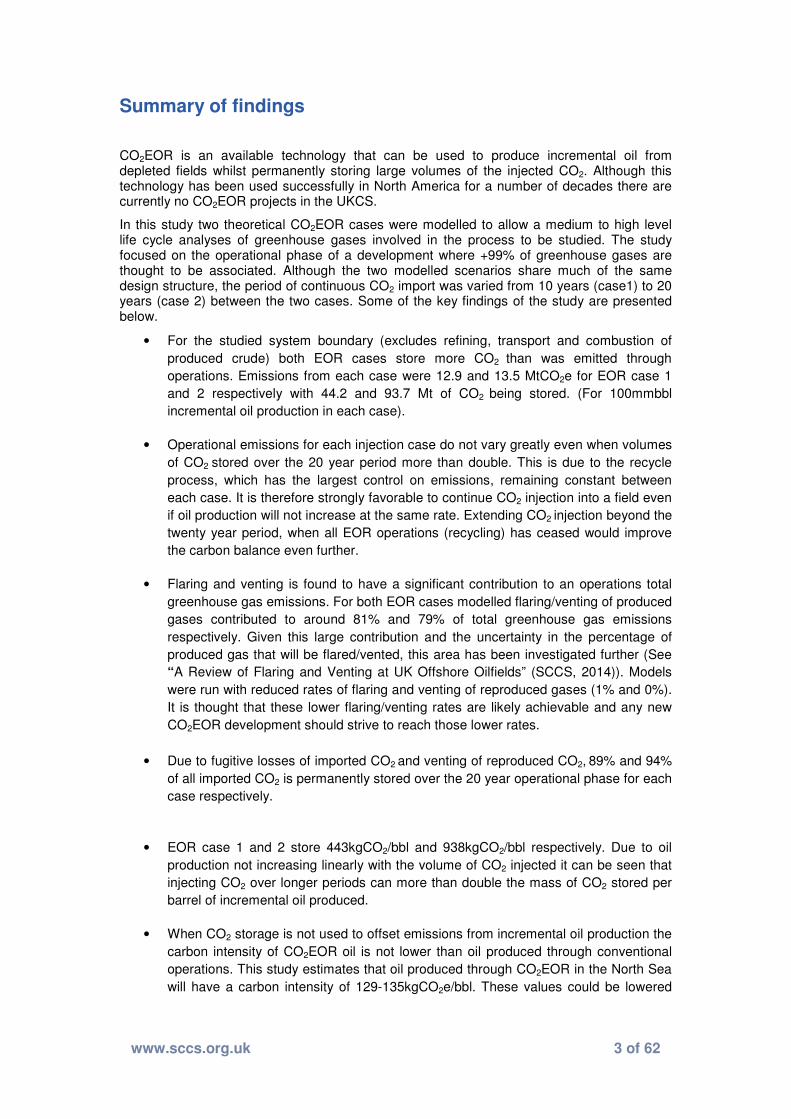
CO2EOR is an available technology that can be used to produce incremental oil from depleted fields whilst permanently storing large volumes of the injected CO2. Although this technology has been used successfully in North America for a number of decades there are currently no CO2EOR projects in the UKCS.
In this study two theoretical CO2EOR cases were modelled to allow a medium to high level life cycle analyses of greenhouse gases involved in the process to be studied. The study focused on the operational phase of a development where +99% of greenhouse gases are thought to be associated. Although the two modelled scenarios share much of the same design structure, the period of continuous CO2 import was varied from 10 years (case1) to 20 years (case 2) between the two cases. Some of the key findings of the study are presented below.
• For the studied system boundary (excludes refining, transport and combustion of
produced crude) both EOR cases store more CO2 than was emitted through
operations. Emissions from each case were 12.9 and 13.5 MtCO2e for EOR case 1
and 2 respectively with 44.2 and 93.7 Mt of CO2 being stored. (For 100mmbbl
incremental oil production in each case).
• Operational emissions for each injection case do not vary greatly even when volumes
of CO2 stored over the 20 year period more than double. This is due to the recycle
process, which has the largest control on emissions, remaining constant between
each case. It is therefore strongly favorable to continue CO2 injection into a field even
if oil production will not increase at the same rate. Extending CO2 injection beyond the
twenty year period, when all EOR operations (recycling) has ceased would improve
the carbon balance even further.
• Flaring and venting is found to have a significant contribution to an operations total
greenhouse gas emissions. For both EOR cases modelled flaring/venting of produced
gases contributed to around 81% and 79% of total greenhouse gas emissions
respectively. Given this large contribution and the uncertainty in the percentage of
produced gas that will be flared/vented, this area has been investigated further (See
“A Review of Flaring and Venting at UK Offshore Oilfields” (SCCS, 2014)). Models
were run with reduced rates of flaring and venting of reproduced gases (1% and 0%).
It is thought that these lower flaring/venting rates are likely achievable and any new
CO2EOR development should strive to reach those lower rates.
• Due to fugitive losses of imported CO2 and venting of reproduced CO2, 89% and 94%
of all imported CO2 is permanently stored over the 20 year operational phase for each
case respectively.
• EOR case 1 and 2 store 443kgCO2/bbl and 938kgCO2/bbl respectively. Due to oil
production not increasing linearly with the volume of CO2 injected it can be seen that
injecting CO2 over longer periods can more than double the mass of CO2 stored per
barrel of incremental oil produced.
• When CO2 storage is not used to offset emissions from incremental oil production the
carbon intensity of CO2EOR oil is not lower than oil produced through conventional
operations. This study estimates that oil produced through CO2EOR in the North Sea
will have a carbon intensity of 129-135kgCO2e/bbl. These values could be lowered
www.sccs.org.uk 4 of 62
with the reduction of flaring/venting or reproduced gases. Oil produced from CO2EOR
may however have a lower carbon intensity than other unconventional sources.
• The reporting metric of a study has the ability to alter the perceived environmental
performance of an operation. When environmental performance is judged by
embedded carbon of oil produced (CO2e/bbl) the utilization factor chosen is of great
importance. (Increased oil production with no modelled change in emissions results in
lower carbon intensity oil production)
• Selecting a system boundary has a large control on the carbon balance of CO2EOR
projects. When the theory of additionality is followed and emissions from the transport,
refining and combustion of produced crude oil are included within the system
boundary, CO2EOR projects in the UKCS may have a positive carbon balance. This
study concluded that a period of CO2 injection beyond the period required to enhance
oil recovery was needed to produce a negative carbon balance for the studied system
boundary.
• Double accounting of CO2 emission credits under the ETS must be considered. If
allowances are retained for CO2 reduction at the capture plant then CO2 stored at the
EOR operation cannot be used to offset the emissions from oil production.
• Completing a sensitivity analysis on the results of this study would be beneficial in
clarifying what parameters have the largest control on the carbon footprint of an
offshore CO2EOR project.

www.sccs.org.uk 5 of 62
1. Introduction
It is recognised from currently operating CO2EOR projects that the operations and processes involved in CO2EOR are energy intensive and may compromise the overall carbon footprint of a project (ARI, 2009; Dilmore, 2010). This study intends to provide a medium to high level life cycle assessment of CO2EOR operations for a theoretical offshore North Sea project.
The study will focus on upstream operations involved in the CO2 EOR process and aims to quantify all significant processes and activities that contribute to a projects carbon footprint. An attempt will also be made to incorporate the impact of new infrastructure on the carbon inventory of the project.
Alongside quantifying the emissions related to operating a CO2 EOR project the study aims to assess the performance of a realistic offshore CO2EOR operation with regard to both incremental oil produced and CO2 stored. Although this performance is relatively well characterised for onshore US projects, it may vary significantly for the currently unproven offshore environment. Considering the uncertainties involved in operating a CO2EOR project in an offshore environment a number of scenarios will be modelled to assess how parameters such as the utilization factor (‘barrels of oil produced per tonne of CO2 injected’) will affect the overall carbon budget of a project.
By modeling a theoretical offshore North Sea CO2EOR project the study intends to both assess the climate benefits / penalties of the project as both a CO2 storage mechanism and as an oil producer. An attempt will be made to assess the merits of such a proposed integrated project against standalone CO2 storage in saline aquifers and oil produced through alternative processes.
www.sccs.org.uk 6 of 62
2. Background Information
2.1 Carbon accounting in the oil and gas sector
2.1.2 The European Union Emission Trading Scheme
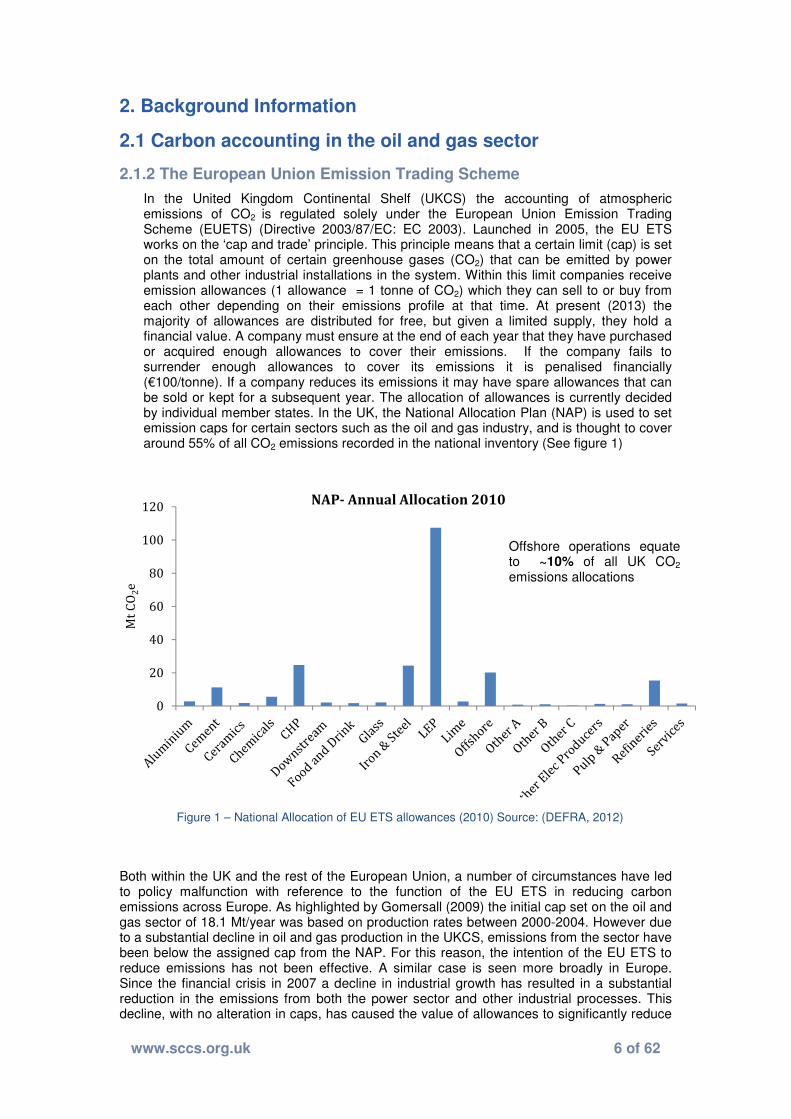
In the United Kingdom Continental Shelf (UKCS) the accounting of atmospheric emissions of CO2 is regulated solely under the European Union Emission Trading Scheme (EUETS) (Directive 2003/87/EC: EC 2003). Launched in 2005, the EU ETS works on the ‘cap and trade’ principle. This principle means that a certain limit (cap) is set on the total amount of certain greenhouse gases (CO2) that can be emitted by power plants and other industrial installations in the system. Within this limit companies receive emission allowances (1 allowance = 1 tonne of CO2) which they can sell to or buy from each other depending on their emissions profile at that time. At present (2013) the majority of allowances are distributed for free, but given a limited supply, they hold a financial value. A company must ensure at the end of each year that they have purchased or acquired enough allowances to cover their emissions. If the company fails to surrender enough allowances to cover its emissions it is penalised financially (€100/tonne). If a company reduces its emissions it may have spare allowances that can be sold or kept for a subsequent year. The allocation of allowances is currently decided by individual member states. In the UK, the National Allocation Plan (NAP) is used to set emission caps for certain sectors such as the oil and gas industry, and is thought to cover around 55% of all CO2 emissions recorded in the national inventory (See figure 1)
Both within the UK and the rest of the European Union, a number of circumstances have led to policy malfunction with reference to the function of the EU ETS in reducing carbon emissions across Europe. As highlighted by Gomersall (2009) the initial cap set on the oil and gas sector of 18.1 Mt/year was based on production rates between 2000-2004. However due to a substantial decline in oil and gas production in the UKCS, emissions from the sector have been below the assigned cap from the NAP. For this reason, the intention of the EU ETS to reduce emissions has not been effective. A similar case is seen more broadly in Europe. Since the financial crisis in 2007 a decline in industrial growth has resulted in a substantial reduction in the emissions from both the power sector and other industrial processes. This decline, with no alteration in caps, has caused the value of allowances to significantly reduce
0
20
40
60
80
100
120
Mt
CO
2e
NAP- Annual Allocation 2010
Offshore operations equate to ~10% of all UK CO2
emissions allocations
Figure 1 – National Allocation of EU ETS allowances (2010) Source: (DEFRA, 2012)

www.sccs.org.uk 7 of 62
(currently around €8 per allowance/tonne) and hence slow down the drive for CO2 reductions. Phase III of the EU ETS is set to come into place in January 2013 and will set to tackle both the mentioned policy malfunctions described above. In this third phase installations will receive 80% of their benchmarked allocation, which will decline to 30% in 2020 and 0% by 2027 (DECC, 2011).
2.1.3 Environmental Emissions Monitoring System
In order to regulate emissions and fulfill the function of the EU ETS operators in the UKCS are legally required, under the terms and conditions of their relevant permits or approvals, to report 100% of their atmospheric emissions. This is completed through the Environmental Emissions Monitoring System (EEMS), which is used to record environmental data relating to the UK offshore oil and gas industry, and is ultimately overseen by the Department for Energy and Climate Change (DECC). Through the EEMS, emissions resulting from the production of oil and gas from offshore reservoirs including offshore tanker loading, emissions from exploration, appraisal and development drilling rigs, and emissions from onshore oil and gas terminals engaged in processing/storing and loading hydrocarbons are monitored.
Emissions from support vessels, tankers on route, helicopters and seismic vessels are not included as they are recorded elsewhere in the National Inventory (DECC, 2012a). Within the processes mentioned above three broad types of emissions can be established; consumption; direct emissions and drilling. Emissions from each of these processes, which may apply both to the offshore installation and the loading terminal, must be recorded in the EEMS. Consumption and drilling emission sources involve the combustion of gas, diesel and fuel oil, which broadly power plant operations, along with emissions from gas flaring. Direct emissions account for the direct release of emission gases to the atmosphere through; gas venting; direct process emissions; oil loading; storage tanks; and fugitive emissions (leaks from valves etc.) (Table 1). Total plant emissions from an installation or terminal can be calculated by aggregating the emissions data from across all emission sources.
Consumption Direct Emissions Drilling
Gas Consumption- Plant Operations (turbines, engines and heaters)
Gas Venting Well testing
Diesel Consumption- Plant Operations (turbines, engines and heaters)
Direct Process Emissions Diesel Consumption
Fuel Oil Consumption- Plant Operations(turbines, engines and heaters)
Oil Loading
Gas flaring (routine operations, maintenance, upsets/other or gross)
Storage Tanks
Fugitive Emissions
Table 1 – Summary of reporting requirements for the EEMS

www.sccs.org.uk 8 of 62
2.1.4 Measuring emissions in the oil and gas sector
The direct measurement or monitoring of emission gases is rare offshore and so for most sources only activity data, such as fuel consumption or the rate of a process activity are available. Where direct monitoring systems are available, they may be operated as part of an environmental management system that often has external verification. As explained in the EEMS Atmospheric Emissions Calculations document (EEMS, Oil and Gas UK, DECC, 2008), when direct measurement systems are not in place, emissions calculations involve the use of an activity factor, such as fuel consumption or flow to flare/vent, and an emission factor for each source(s) and emission gas(i). By multiplying the activity factor (A) by the emission factor (E), the masses of each emission gas can be calculated:
M (is) = E (is) . A (s)
Where:
M (is) is the emitted mass of a particular emission gas (i) for a given source (s)
A (s) is the source (s) activity factor
E (is) is the emission factor for the emission gas (i) relevant to the emission source (s).
2.1.5 Current GHG emissions from the oil and gas sector
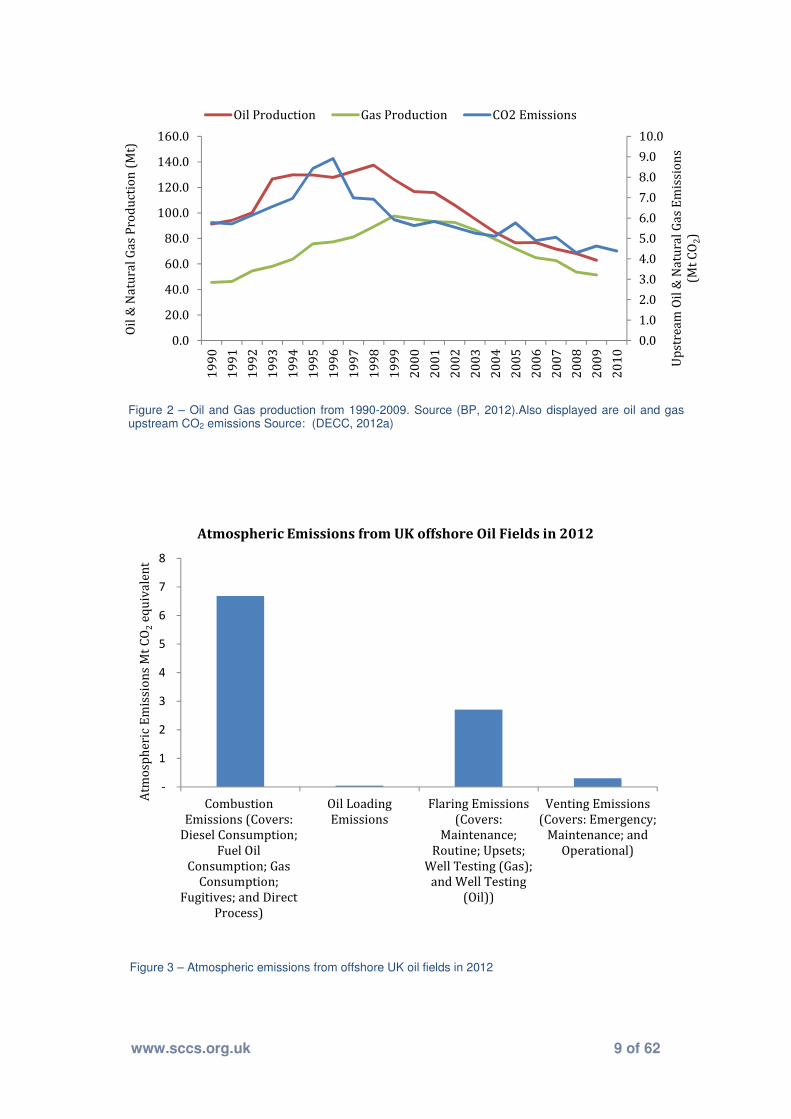
From the year 1990 to 2010 emissions from the upstream oil and gas sector accounted for around 1% of all CO2 emissions in the UK’s inventory
1. However, when considering only
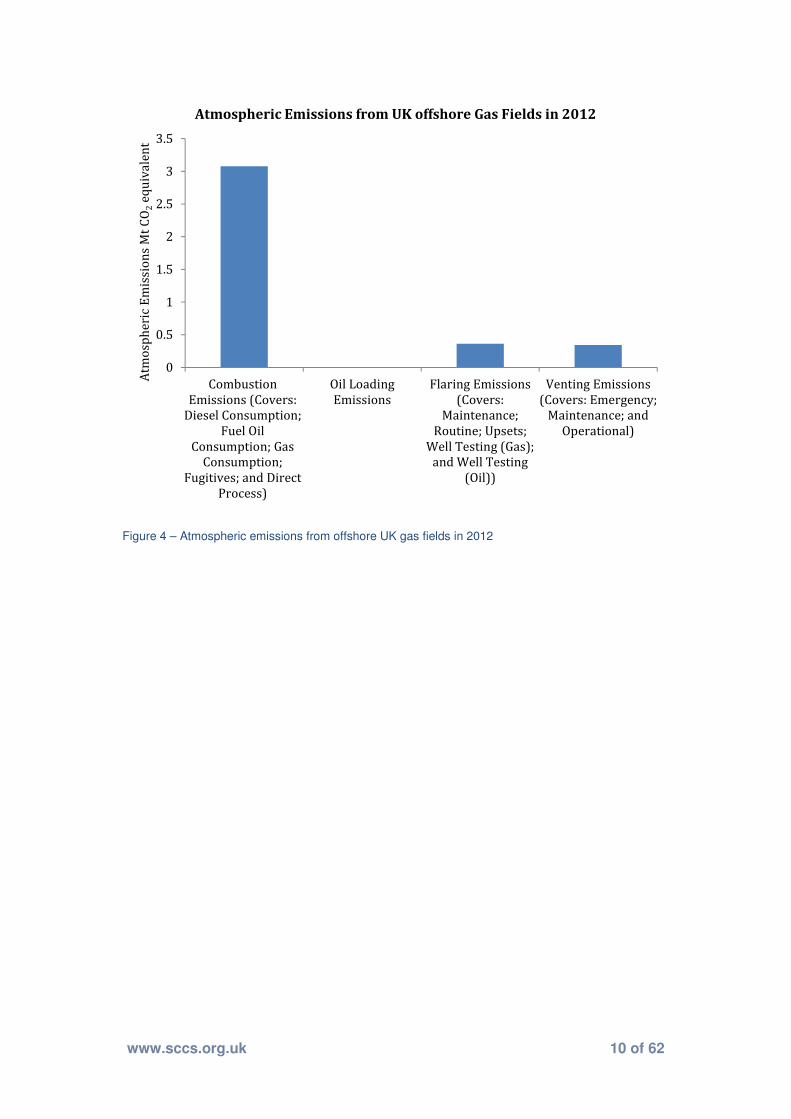
emissions included in the EU ETS, offshore oil and gas emissions receive around 9% of the national allocation (See Figure 1). As can be seen in Figure 2 CO2 emissions from the upstream oil and gas sector peaked in 1996, shortly before oil production peaked in 1998, and gas in 1999. Even with the introduction of the Petroleum Act in 1998, that states that flaring of gas must be reduced, flaring still accounts for around 30% of atmospheric emissions from offshore oil fields. The remaining emissions are derived from combustion emissions (~70%)(diesel consumption; fuel oil consumption; gas consumption; fugitive emissions and direct process emissions) and venting (<5%) (Figure 3). Similar ratios are seen at offshore UK gas fields (Figure 4).
1 Upstream Oil & Natural Gas Emissions include: Exploration, production and transport of oils; Offshore
oil and gas flaring; Offshore oil and gas venting; Exploration, production and transport of gas.
www.sccs.org.uk 9 of 62
0.0
1.0
2.0
3.0
4.0
5.0
6.0
7.0
8.0
9.0
10.0
0.0
20.0
40.0
60.0
80.0
100.0
120.0
140.0
160.0
19
90
19
91
19
92
19
93
19
94
19
95
19
96
19
97
19
98
19
99
20
00
20
01
20
02
20
03
20
04
20
05
20
06
20
07
20
08
20
09
20
10
Up
stre
am
Oil
& N
atu
ral
Ga
s E
mis
sio
ns
(Mt
CO
2)
Oil
& N
atu
ral
Ga
s P
rod
uct
ion
(M
t)Oil Production Gas Production CO2 Emissions
-
1
2
3
4
5
6
7
8
Combustion
Emissions (Covers:
Diesel Consumption;
Fuel Oil
Consumption; Gas
Consumption;
Fugitives; and Direct
Process)
Oil Loading
Emissions
Flaring Emissions
(Covers:
Maintenance;
Routine; Upsets;
Well Testing (Gas);
and Well Testing
(Oil))
Venting Emissions
(Covers: Emergency;
Maintenance; and
Operational)
Atm
osp
he
ric
Em
issi
on
s M
t C
O2
eq
uiv
ale
nt
Atmospheric Emissions from UK offshore Oil Fields in 2012
Figure 2 – Oil and Gas production from 1990-2009. Source (BP, 2012).Also displayed are oil and gas upstream CO2 emissions Source: (DECC, 2012a)
Figure 3 – Atmospheric emissions from offshore UK oil fields in 2012
www.sccs.org.uk 10 of 62
0
0.5
1
1.5
2
2.5
3
3.5
Combustion
Emissions (Covers:
Diesel Consumption;
Fuel Oil
Consumption; Gas
Consumption;
Fugitives; and Direct
Process)
Oil Loading
Emissions
Flaring Emissions
(Covers:
Maintenance;
Routine; Upsets;
Well Testing (Gas);
and Well Testing
(Oil))
Venting Emissions
(Covers: Emergency;
Maintenance; and
Operational)
Atm
osp
he
ric
Em
issi
on
s M
t C
O2
eq
uiv
ale
nt
Atmospheric Emissions from UK offshore Gas Fields in 2012
Figure 4 – Atmospheric emissions from offshore UK gas fields in 2012
www.sccs.org.uk 11 of 62
2.2 Key findings of previous studies
A review of current literature was undertaken. Details of how this literature was acquired along with a summary of each key paper can be found in the Appendix. Below the key points from the literature search are detailed.
• There have been a number of previous studies to assess the carbon balance of CO2EOR projects. However many of the studies discuss slightly different aspects and are therefore difficult to directly compare. The majority of these studies focus on North American CO2EOR projects using old onshore fields that utilise traditional ‘oil optimised’ injection strategies.
• A valuable way to assess the carbon balance of CO2EOR operations is to review the carbon emissions profile for the whole operation, and compare this to a projects CO2 storage profile. This can be completed using life cycle assessment to assess the emissions profile from all direct and indirect activities associated with the CO2EOR operation.
• Jaramillo et al., (2009) found that when emissions from the full system boundary, from coal mining to final product combustion are included, then CO2 EOR projects have historically been net emitters of CO2. By contrast, a study by Faltison & Gunter (2011) found that when only emissions directly related to CO2EOR operations are included in life cycle assessments, CO2EOR projects have the ability to be net CO2 stores.
• Traditional onshore CO2EOR projects in the US, where CO2 purchase is a cost of operation and is therefore minimised, have permanently stored around 200-300Kg of CO2 per barrel of oil produced. Future projects, which may be optimised to store maximum CO2 have the capability of storing 300-600Kg of CO2 per barrel of oil. Reviewed in another way, Advanced Resources International (2010) proposed that CO2EOR projects not optimised for CO2 storage have the capability to store 50-60% of the emissions occurring within the system boundary (including final product combustion). If an injection strategy to optimise CO2 storage is utilised, projects may have the capability to store up to 129% of the emissions over the lifetime of the project.
• It is agreed (Jaramillo et al., 2009; Condor & Suebsiri, 2010) that end product combustion has the largest contribution of CO2 emissions to CO2EOR projects when the whole system boundary from coal mining to end product use is assessed.
• Many processes in the CO2EOR system boundary are not unique to CO2EOR. Crude transport, refining and end use are all stages common to normal crude oil production. Upstream power plant, power plant and CO2 compression and transport are all stages found in normal carbon capture and storage system boundaries. Oil production operations are the only stage that is solely unique to CO2EOR operations. For this reason a number of studies (Hertwich et al., 2008; ARI, 2009; Dilmore, 2010) have focused their assessments on this stage.
• Advanced Resources International (2009, 2010) found that in traditional onshore projects, upstream CO2EOR operations are dominated by three energy demanding processes. CO2 compression has the largest contribution energy demand and therefore associated emissions. Although variable from project to project, gas separation and artificial lifting also significantly contribute to the energy demands of CO2EOR operations. Hertwich et al., (2008) found that the emissions associated with these energy intensive processes were largely controlled by whether equipment was powered by gas/diesel turbines or connected to a larger electricity grid.
www.sccs.org.uk 12 of 62
• From work completed in previous studies it is clear that the debate about the ‘principle of additionality’ and the ‘principle of displacement’ is one that is yet to be solved. Faltison & Gunter (2010) state that the principle of additionally should not be adhered to because world oil production is controlled by demand. However other studies (Gomersall, 2009; Condor & Suebsiri, 2010) state that the ‘principle of additionality’ must be followed when assessing the net carbon balance of CO2EOR projects. The use of different principles has the ability to polarise the results of the net carbon balance and hence is of great importance. Gomersall (2009) suggest that the most effective way in assessing the climate benefits of CO2EOR may be to assess the carbon intensity of oil produced through CO2EOR against alternative energy sources.
2.3 Life cycle assessments- an introduction
Life cycle assessment (LCA) is a method to assess the environmental impacts of a product system from the cradle-to-grave (Baumann, 2004). Developed initially for use in chemical engineering and energy analysis, as the name suggests all stages in a product or services life are taken into account. In a traditional cradle to grave life cycle assessment emissions and resource use from resource extraction, production, distribution, use and disposal are all included. In the 1970’s an important role of life cycle analysis was to compare renewable technologies with fossil fuels with relation to their electricity demands and outputs. Since then, however, LCA’s, (now standardised by ISO (ISO, 1997)), have been applied to a diverse range of environmental concerns. (Hertwich at al., 2008)
LCA’s aim to provide a holistic overview of the environmental impacts of a product, service or system. In order to achieve this, four interdependent steps must be completed. These are; quantification of activities and flows associated with a product system, quantification of the emissions, evaluation of the environmental impacts caused by the different interventions and interpretation.
The environmental impacts analysed within an assessment may include; global warming potential, human toxicity and biotic resource extraction. Although a full LCA should include all environmental impacts, many focus on only a limited number. For example many energy systems LCAs are often focused around CO2 emissions. Along with full ‘cradle-to-grave’ LCA’s ‘gate-to-gate’ LCAs can be completed to examine certain aspects of a product system. This can then be integrated with the appropriate production chain to form a full cradle-to-grave assessment. In the 1990’s life cycle assessments were based on assessing processes in physical terms and using cut off criteria to identify processes which could be excluded from the modelling process due to their small contribution (Heijungs et al., 1992; Consoli, 1993). However it has been proven that the sum of all small contributions is significant (Hertwich, 2008 and references therein) and so hybrid LCAs were developed to tackle this. This form of LCA models a foreground system in physical terms but takes smaller contributions from a background economy. Hybrid LCA is thus able to cover virtually all activities and focusses the effort to model detail on where it matters. (Hertwich et al., 2008).
www.sccs.org.uk 13 of 62
2.4 CO2EOR emission sources
It is known from currently operating onshore CO2EOR developments that atmospheric emissions arise from powering offshore production equipment, from flaring/venting and fugitive emissions. Below an overview is given to the primary energy demanding processes alongside other activities that may contribute significantly to an operations atmospheric emissions. Further work within the study attempts to quantify how these processes and activities will be deployed in an offshore CO2EOR development in the UKCS. (See Section 4)
2.4.1 CO2EOR operations
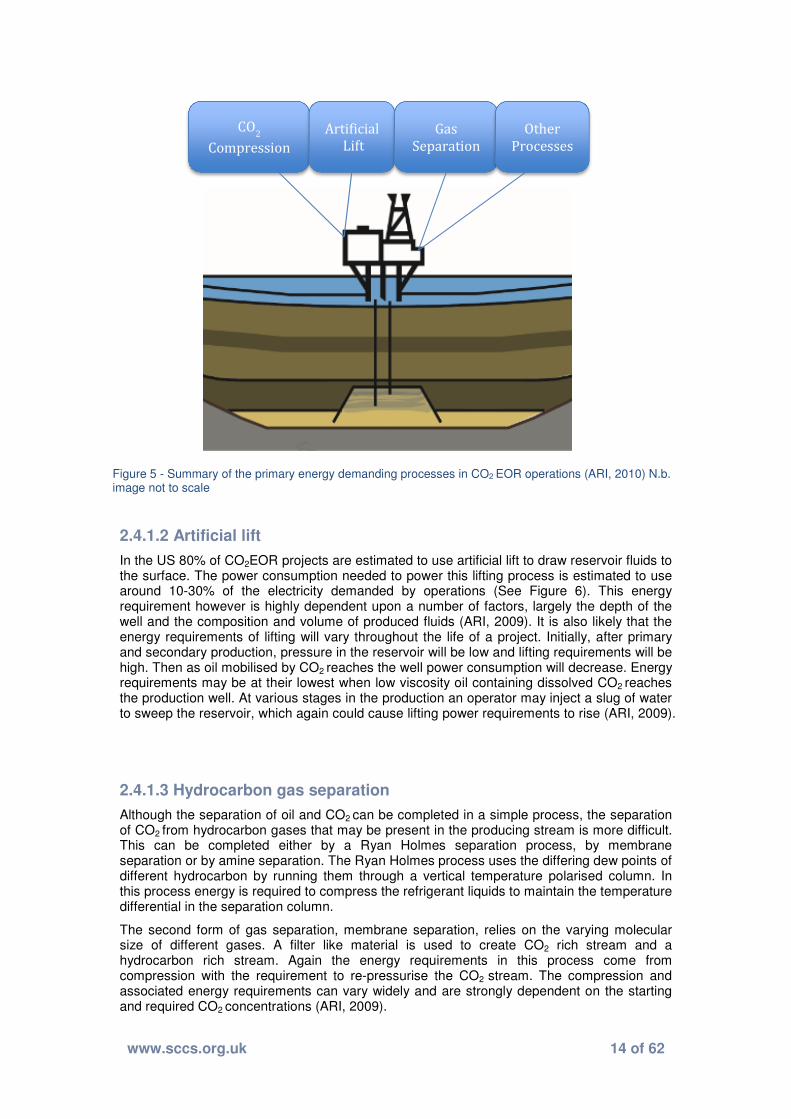
Much like traditional crude oil production operations, CO2EOR operations involve a number of processes that require equipment and infrastructure. In order to power this equipment a source of energy must be provided at the site of operations. This will have associated CO2 emissions. Onshore this energy usually comes from electricity derived from a grid. In offshore environments, such as the North Sea, the lack of interconnection to an electricity grid, requires offshore turbines to power equipment. Although the associated emissions related to these two methods may be significantly different (Hertwich et al., 2008), the energy requirements in offshore environments may not be as variable, and may more relate to parameters such as reservoir depth. With the lack of projects in offshore environments however, this hypothesis remains to be tested. The basic requirement of CO2EOR operations to inject and recycle CO2 whilst producing crude results in many processes being required at the surface. Typically surface operations require facilities associated with compression, gas and liquid separation and processing and oil/brine handling, and in some cases artificial lift and/or recovery of natural gas liquids. (ARI, 2010) The processes with the major energy demands within these operations are displayed in Figure 5 and discussed below.
2.4.1.1 Compression
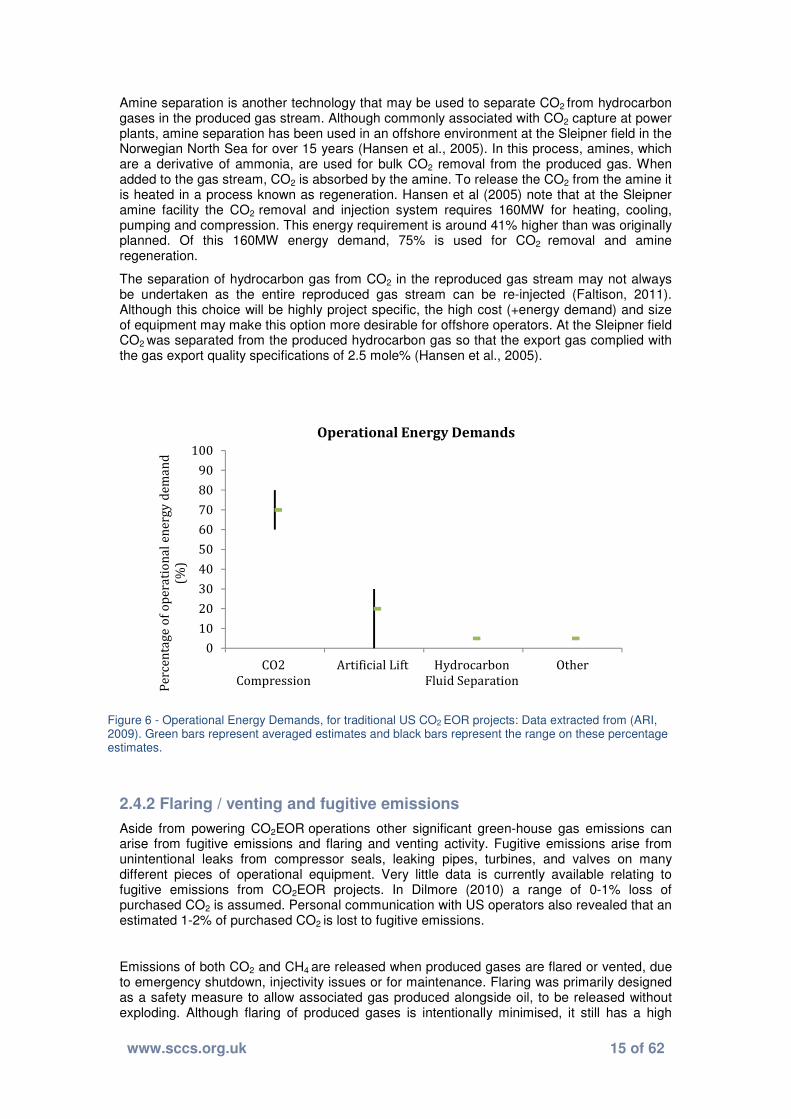
CO2 compression is the most energy intensive component of any CO2EOR operation, and in US projects is thought to use around 60-80% of the electricity demanded by operations (See Figure 6). The requirement to inject CO2 in supercritical form at depths greater than 800m, means that injection pressures are usually high. Alongside the total volume of injected gas, CO2 compression power requirements depend on the pressure differential between the pressure of delivered or recycled CO2 and the pressure that CO2 is injected at. The injection pressure is dependent on the reservoir pressure, which is principally a function of depth. The pressure of delivered or recycled CO2 may vary on a project by project basis. For this reason the compression needs of a specific project are likely to be unique to that project. Advanced Resources International (2010) estimated that in a typical US onshore CO2EOR project, CO2
is usually injected at around 1800 pounds per square inch absolute (psia), and reproduced at around 50psia.
www.sccs.org.uk 14 of 62
2.4.1.2 Artificial lift
In the US 80% of CO2EOR projects are estimated to use artificial lift to draw reservoir fluids to the surface. The power consumption needed to power this lifting process is estimated to use around 10-30% of the electricity demanded by operations (See Figure 6). This energy requirement however is highly dependent upon a number of factors, largely the depth of the well and the composition and volume of produced fluids (ARI, 2009). It is also likely that the energy requirements of lifting will vary throughout the life of a project. Initially, after primary and secondary production, pressure in the reservoir will be low and lifting requirements will be high. Then as oil mobilised by CO2 reaches the well power consumption will decrease. Energy requirements may be at their lowest when low viscosity oil containing dissolved CO2 reaches the production well. At various stages in the production an operator may inject a slug of water to sweep the reservoir, which again could cause lifting power requirements to rise (ARI, 2009).
2.4.1.3 Hydrocarbon gas separation
Although the separation of oil and CO2 can be completed in a simple process, the separation of CO2 from hydrocarbon gases that may be present in the producing stream is more difficult. This can be completed either by a Ryan Holmes separation process, by membrane separation or by amine separation. The Ryan Holmes process uses the differing dew points of different hydrocarbon by running them through a vertical temperature polarised column. In this process energy is required to compress the refrigerant liquids to maintain the temperature differential in the separation column.
The second form of gas separation, membrane separation, relies on the varying molecular size of different gases. A filter like material is used to create CO2 rich stream and a hydrocarbon rich stream. Again the energy requirements in this process come from compression with the requirement to re-pressurise the CO2 stream. The compression and associated energy requirements can vary widely and are strongly dependent on the starting and required CO2 concentrations (ARI, 2009).
CO2
Compression
Artificial
Lift
Gas
Separation
Other
Processes
Figure 5 - Summary of the primary energy demanding processes in CO2 EOR operations (ARI, 2010) N.b. image not to scale
www.sccs.org.uk 15 of 62
Amine separation is another technology that may be used to separate CO2 from hydrocarbon gases in the produced gas stream. Although commonly associated with CO2 capture at power plants, amine separation has been used in an offshore environment at the Sleipner field in the Norwegian North Sea for over 15 years (Hansen et al., 2005). In this process, amines, which are a derivative of ammonia, are used for bulk CO2 removal from the produced gas. When added to the gas stream, CO2 is absorbed by the amine. To release the CO2 from the amine it is heated in a process known as regeneration. Hansen et al (2005) note that at the Sleipner amine facility the CO2 removal and injection system requires 160MW for heating, cooling, pumping and compression. This energy requirement is around 41% higher than was originally planned. Of this 160MW energy demand, 75% is used for CO2 removal and amine regeneration.
The separation of hydrocarbon gas from CO2 in the reproduced gas stream may not always be undertaken as the entire reproduced gas stream can be re-injected (Faltison, 2011). Although this choice will be highly project specific, the high cost (+energy demand) and size of equipment may make this option more desirable for offshore operators. At the Sleipner field CO2 was separated from the produced hydrocarbon gas so that the export gas complied with the gas export quality specifications of 2.5 mole% (Hansen et al., 2005).
2.4.2 Flaring / venting and fugitive emissions
Aside from powering CO2EOR operations other significant green-house gas emissions can arise from fugitive emissions and flaring and venting activity. Fugitive emissions arise from unintentional leaks from compressor seals, leaking pipes, turbines, and valves on many different pieces of operational equipment. Very little data is currently available relating to fugitive emissions from CO2EOR projects. In Dilmore (2010) a range of 0-1% loss of purchased CO2 is assumed. Personal communication with US operators also revealed that an estimated 1-2% of purchased CO2 is lost to fugitive emissions.
Emissions of both CO2 and CH4 are released when produced gases are flared or vented, due to emergency shutdown, injectivity issues or for maintenance. Flaring was primarily designed as a safety measure to allow associated gas produced alongside oil, to be released without exploding. Although flaring of produced gases is intentionally minimised, it still has a high
Figure 6 - Operational Energy Demands, for traditional US CO2 EOR projects: Data extracted from (ARI, 2009). Green bars represent averaged estimates and black bars represent the range on these percentage estimates.
0
10
20
30
40
50
60
70
80
90
100
CO2
Compression
Artificial Lift Hydrocarbon
Fluid Separation
Other
Pe
rce
nta
ge
of
op
era
tio
na
l e
ne
rgy
de
ma
nd
(%)
Operational Energy Demands
www.sccs.org.uk 16 of 62
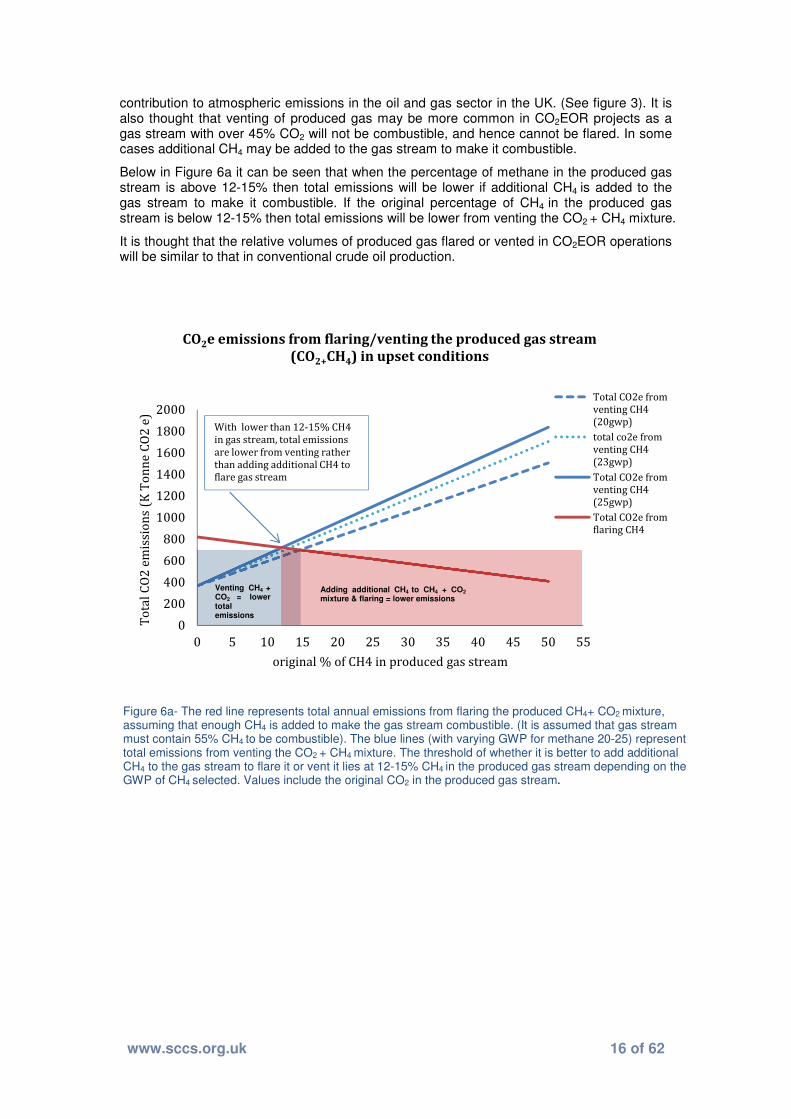
contribution to atmospheric emissions in the oil and gas sector in the UK. (See figure 3). It is also thought that venting of produced gas may be more common in CO2EOR projects as a gas stream with over 45% CO2 will not be combustible, and hence cannot be flared. In some cases additional CH4 may be added to the gas stream to make it combustible.
Below in Figure 6a it can be seen that when the percentage of methane in the produced gas stream is above 12-15% then total emissions will be lower if additional CH4 is added to the gas stream to make it combustible. If the original percentage of CH4 in the produced gas stream is below 12-15% then total emissions will be lower from venting the CO2 + CH4 mixture.
It is thought that the relative volumes of produced gas flared or vented in CO2EOR operations will be similar to that in conventional crude oil production.
0
200
400
600
800
1000
1200
1400
1600
1800
2000
0 5 10 15 20 25 30 35 40 45 50 55
To
tal
CO
2 e
mis
sio
ns
(K T
on
ne
CO
2 e
)
original % of CH4 in produced gas stream
CO2e emissions from flaring/venting the produced gas stream
(CO2+CH4) in upset conditions
Total CO2e from
venting CH4
(20gwp)
total co2e from
venting CH4
(23gwp)
Total CO2e from
venting CH4
(25gwp)
Total CO2e from
flaring CH4
With lower than 12-15% CH4
in gas stream, total emissions
are lower from venting rather
than adding additional CH4 to
flare gas stream
Adding additional CH4 to CH4 + CO2
mixture & flaring = lower emissions
Venting CH4 + CO2 = lower total emissions
Figure 6a- The red line represents total annual emissions from flaring the produced CH4+ CO2 mixture, assuming that enough CH4 is added to make the gas stream combustible. (It is assumed that gas stream must contain 55% CH4 to be combustible). The blue lines (with varying GWP for methane 20-25) represent total emissions from venting the CO2 + CH4 mixture. The threshold of whether it is better to add additional CH4 to the gas stream to flare it or vent it lies at 12-15% CH4 in the produced gas stream depending on the GWP of CH4 selected. Values include the original CO2 in the produced gas stream.
www.sccs.org.uk 17 of 62
2.5 CO2 Storage in EOR Projects
2.5.1 Retention vs. storage
In CO2 EOR operations, the term ‘retention’ is often used to represent the proportion of CO2
that is trapped within a reservoir. This phrase can be misleading. It is true that historical CO2EOR projects have been optimised for resource extraction and that the volume of CO2
retained in the reservoir is very site dependent, but averages at around 71% in the Permian Basin of Texas (Dilmore, 2010 and references within). However the fact that less than 100% of CO2 is retained in the reservoir, has been taken by some to imply that that CO2 that is not retained is then released to atmosphere. Primarily due to the fact that in historical projects CO2 is a commodity and has to be purchased, CO2 that is reproduced from the reservoir will be re-injected and not vented
2. CO2EOR operations therefore, in relation to CO2 act as a
“closed loop” system. The term retention can be defined by the volume of CO2 remaining in the reservoir at any given time, which equals the amount of CO2 injected less the amount of CO2 produced. Presented as a fraction this can be written as:
Retention = ((cumulative injection – cumulative production) – losses) / cumulative injection
The process of retention however does not consider CO2 that is permanently sequestered in the reservoir. After a certain period of time after active injection has ceased, CO2 that remains in the reservoir is said to be permanently stored. For CO2EOR, CO2 stored is the volume of gross CO2 retained through the period of active injection minus losses.
Storage = ((cumulative injection – cumulative production) – losses) / cumulative CO2
purchased
2.5.2 Storage factors
As previously stated, retention rates within a CO2 EOR operation vary depending on the reservoir properties, injection strategy and oil gravity along with other factors. The variance in these properties between projects also leads to varying storage factors (the mass of CO2
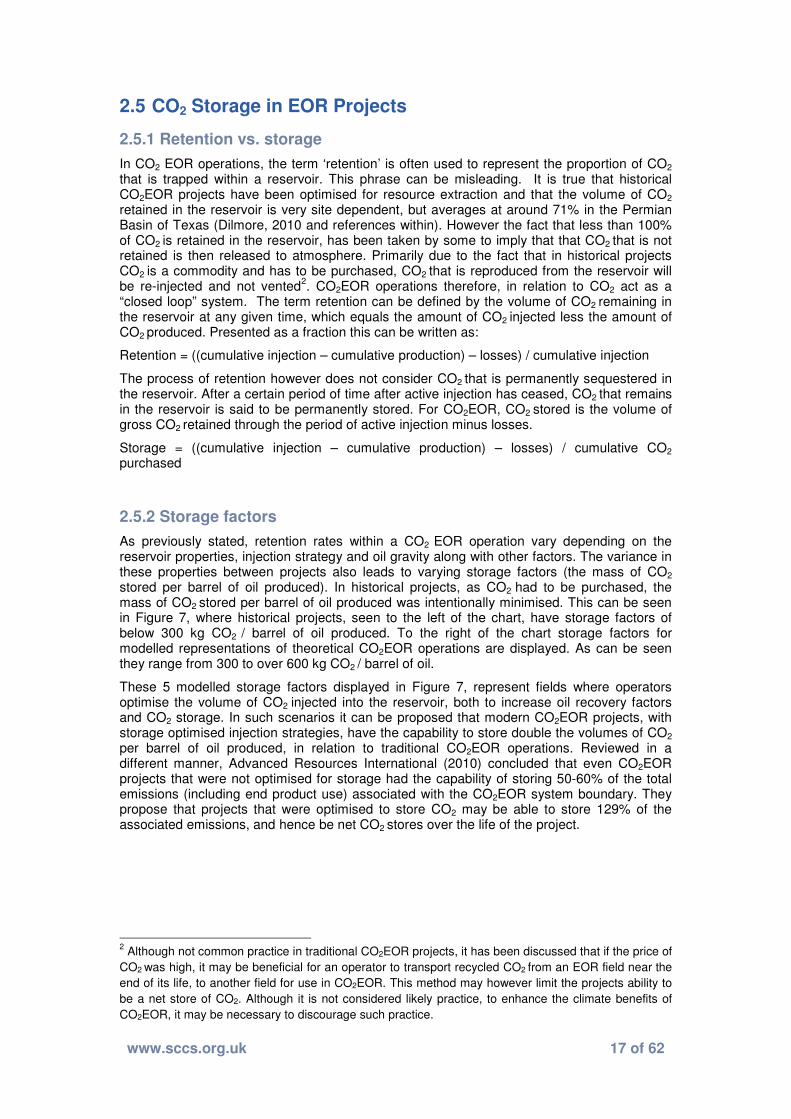
stored per barrel of oil produced). In historical projects, as CO2 had to be purchased, the mass of CO2 stored per barrel of oil produced was intentionally minimised. This can be seen in Figure 7, where historical projects, seen to the left of the chart, have storage factors of below 300 kg CO2 / barrel of oil produced. To the right of the chart storage factors for modelled representations of theoretical CO2EOR operations are displayed. As can be seen they range from 300 to over 600 kg CO2 / barrel of oil.
These 5 modelled storage factors displayed in Figure 7, represent fields where operators optimise the volume of CO2 injected into the reservoir, both to increase oil recovery factors and CO2 storage. In such scenarios it can be proposed that modern CO2EOR projects, with storage optimised injection strategies, have the capability to store double the volumes of CO2
per barrel of oil produced, in relation to traditional CO2EOR operations. Reviewed in a different manner, Advanced Resources International (2010) concluded that even CO2EOR projects that were not optimised for storage had the capability of storing 50-60% of the total emissions (including end product use) associated with the CO2EOR system boundary. They propose that projects that were optimised to store CO2 may be able to store 129% of the associated emissions, and hence be net CO2 stores over the life of the project.
2 Although not common practice in traditional CO2EOR projects, it has been discussed that if the price of
CO2 was high, it may be beneficial for an operator to transport recycled CO2 from an EOR field near the
end of its life, to another field for use in CO2EOR. This method may however limit the projects ability to
be a net store of CO2. Although it is not considered likely practice, to enhance the climate benefits of
CO2EOR, it may be necessary to discourage such practice.
www.sccs.org.uk 18 of 62
Figure 7- Summary plot of CO2 EOR storage factors. Sources displayed within diagram. It can be seen that modelled future storage factors may be double that of storage factors from traditional US onshore CO2 EOR projects.

www.sccs.org.uk 19 of 62
2.6 Displacement, additionality and carbon intensity
Previous assessments of the net emissions profile of CO2EOR projects show that a number of largely different conclusions have been drawn about the effectiveness of CO2EOR projects to store net CO2. In part this is due to the inclusion / exclusion of both end product refining and combustion in the system boundary of the analysis. In Faltison & Gunter (2011), an assessment of the net CO2 stored in 8 US CO2EOR projects, concludes that 7 of 8 projects store net CO2. The work strongly states that, because world oil production is controlled by demand, executing CO2EOR projects will not result in incremental aggregate oil consumption emissions. This theory is made under the assumption that if oil was not produced by CO2EOR, then another source would have to be developed to fill the gap. This theory therefore assumes that CO2EOR projects will hinder the development of oil production in other locations. Using this theory the study states that only relevant fugitive emissions that are directly associated with the CO2EOR project should be included in the life cycle assessment of the project. This theory however is not held by all. Gomersall (2009) state that this ‘displacement’ theory as described in (Faltison, 2011) is only viable if recovered EOR barrel results in the permanent stranding of conventional oil from an alternative location. Gomersall (2009) believe that this will not occur and therefor this ‘displacement’ theory, which is traditionally held by the oil and gas industry, should not be upheld. The opposing theory is known as the theory of ‘additionality’. This theory is also assumed by Condor & Suebsiri (2010) in their assessment of the carbon footprint of the Weyburn CO2EOR project in Canada.
In Jaramillo et al., (2009), the net life cycle emissions of 5 US CO2EOR projects are assessed. When including both downstream refining and end product combustion, all 5 projects were found to be net emitters of CO2 over their project life span- See Figure 8. This highlights the importance of the theory of additionality when conducting life cycle assessments. However this study also attempts to assess the theory of ‘displacement’. Although stating that “without a detailed economic model, that captures the complexity of oil use, it is difficult to be certain what sources, if any, will be displaced”, the study attempts to analyse what oil source a
Figure 8- Net Life Cycle GHG emissions during project lifetime. Taken from (Jaramillo, 2009). As can be seen all 5 modelled projects are net CO2 emitters over the life span of the project, when downstream refining and end product combustion are included within the system boundary.
www.sccs.org.uk 20 of 62
specific CO2EOR project would need to displace to be a net store of CO2. The study estimated that a carbon intensive energy source such as Canadian Oil sands will have to be displaced to allow CO2EOR projects to be net CO2 stores. Displacement of other sources such as Saudi crude, US domestic and Canadian crude would result in CO2EOR projects being net CO2 emitters.
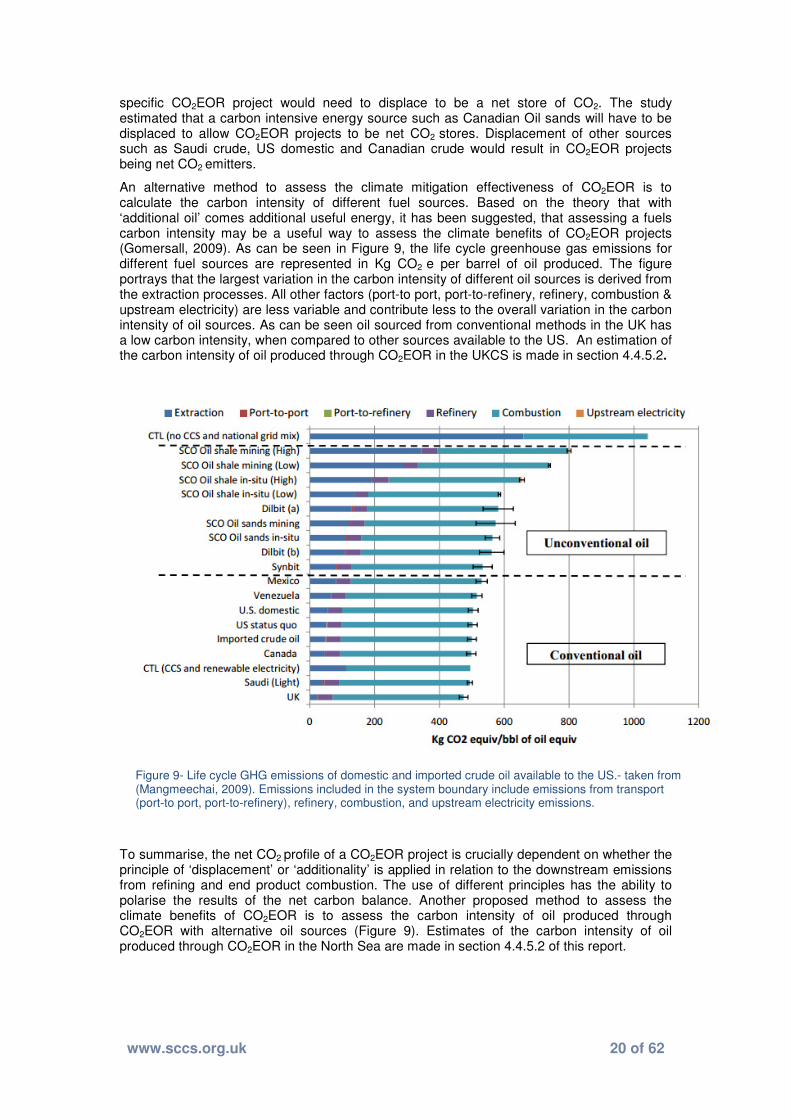
An alternative method to assess the climate mitigation effectiveness of CO2EOR is to calculate the carbon intensity of different fuel sources. Based on the theory that with ‘additional oil’ comes additional useful energy, it has been suggested, that assessing a fuels carbon intensity may be a useful way to assess the climate benefits of CO2EOR projects (Gomersall, 2009). As can be seen in Figure 9, the life cycle greenhouse gas emissions for different fuel sources are represented in Kg CO2 e per barrel of oil produced. The figure portrays that the largest variation in the carbon intensity of different oil sources is derived from the extraction processes. All other factors (port-to port, port-to-refinery, refinery, combustion & upstream electricity) are less variable and contribute less to the overall variation in the carbon intensity of oil sources. As can be seen oil sourced from conventional methods in the UK has a low carbon intensity, when compared to other sources available to the US. An estimation of the carbon intensity of oil produced through CO2EOR in the UKCS is made in section 4.4.5.2.
To summarise, the net CO2 profile of a CO2EOR project is crucially dependent on whether the principle of ‘displacement’ or ‘additionality’ is applied in relation to the downstream emissions from refining and end product combustion. The use of different principles has the ability to polarise the results of the net carbon balance. Another proposed method to assess the climate benefits of CO2EOR is to assess the carbon intensity of oil produced through CO2EOR with alternative oil sources (Figure 9). Estimates of the carbon intensity of oil produced through CO2EOR in the North Sea are made in section 4.4.5.2 of this report.
Figure 9- Life cycle GHG emissions of domestic and imported crude oil available to the US.- taken from (Mangmeechai, 2009). Emissions included in the system boundary include emissions from transport (port-to port, port-to-refinery), refinery, combustion, and upstream electricity emissions.

www.sccs.org.uk 21 of 62
3. Factors affecting the carbon balance- Onshore (US) vs offshore (UK)
Although onshore US CO2EOR operations provide useful analogues for offshore projects in the UKCS it must be recognised that substantial differences exist between them. The key issues that may vary between the US (onshore) and UK (offshore) and affect the carbon balance are listed below:
• Reservoir conditions (mmp / CO2 density / depth / pressure)
• Infrastructure requirements (well density)
• CO2 supply (volume / cost)
• Energy source (centralised electricity grid / gas turbines)
A number of studies (Goodyear et al., 2003; Tzimas, 2005; ARI, 2009)) have attempted to quantify these differences and assess how they may affect the success of CO2EOR activities (See table 2 below). Here a summary of the variations is given alongside how these parameters may affect the carbon balance of a CO2EOR project.
Parameter North Sea US
Reservoir Lithology Sandstone Carbonate
Permeability High (typically >500mD) Low (typically <20mD)
Reservoir Depth High Low
Well productivity High Low
Well spacing High Low
Stratigraphy Fault Blocks, Steeply dipping beds
Less Faulted, Horizontal beds
Oil Type Sweet, High API 28-42 API
3.1 Reservoir lithology
The majority of fields in the UKCS are in sandstone reservoirs. However many of the US CO2
injection projects are in carbonate reservoirs. The lithology of currently operating CO2EOR projects in the US and Canada is displayed in figure 10 below. Texas has the largest number of projects (65) with over 50% of them in carbonate reservoirs. Although the vast majority of CO2EOR operations in the US have been successful, it is unclear whether the higher porosity and permeability of sandstones in the UKCS will lead to as successful EOR operations.
Table 2 – Difference between US & North Sea reservoirs. Adapted from (E. Tzimas, 2005)

www.sccs.org.uk 22 of 62
3.2 Pressure and temperature
The pressure and temperature of both North American Fields and UKCS fields are displayed in Figure 15 below. As can be seen the deeper fields of the North Sea (Figure 12) have both higher reservoir pressures and temperatures. However as stated by Goodyear et al., (2003) injected CO2 would have similar CO2 densities (500-1000kg/m
3) to those in the Permian basin
fields of Texas. This is due to the higher temperatures counteracting the higher pressures from increasing CO2 density.
Figure 10 – US and Canadian CO2EOR projects. Size and division of pie charts represent the number of projects and lithology type respectively for each state. (Oil and Gas Journal , 2012)
Figure 11 – Comparison of CO2 density at onshore North American CO2 projects and UKCS reservoir conditions.

www.sccs.org.uk 23 of 62
Given these similarities between the injected CO2 densities, it can be considered that surface volumes of imported CO2 required for successful EOR operations would be similar in the North Sea. Goodyear et al., (2003) does however highlight the effect that existing cold water injection wells may have on reservoir temperature and hence CO2 density. They found that water injection wells may form cooled regions that will increase the CO2 density. This may have positive effects by increasing miscibility which reduces gravity segregation, but may also increase the chance of hydrate formation. Reducing the temperature, and hence increasing the CO2 density, may therefore be beneficial to UK CO2EOR projects where large volumes (5Mt/yr) are being imported to the platform for injection.
Advanced resources international (2009) also explore the effect of varying reservoir properties and injection strategy on the electricity demand of project. They found that the electricity demand can range from 35Kwh/Bbl to 98Kwh/Bbl depending on a number of parameters. They found that the lowest electricity demand came from fields that have optimised compression equipment, free flowing wells, straight CO2 injection and no hydrocarbon gas separation. They found that fields with a mid range demand 60Kwh/Bbl, inject additional CO2 into the reservoir, have a moderate need for artificial lift and reinject some produced water in a WAG injection scheme. Fields with the highest electricity demand inject large volumes of CO2 into a deep reservoir, that requires a high level of artificial lift. High demand fields will also utilise energy intensive hydrocarbon gas separation equipment and reinject water in a WAG scheme.
Using these same parameters to assess electricity demand, it is likely that a North sea field with no need for artificial lift (high reservoir pressure), no hydrocarbon gas separation, but large volumes of CO2 injection with high compresion requirement (high reservoir pressure) may fall into a mid range energy demand scenario.
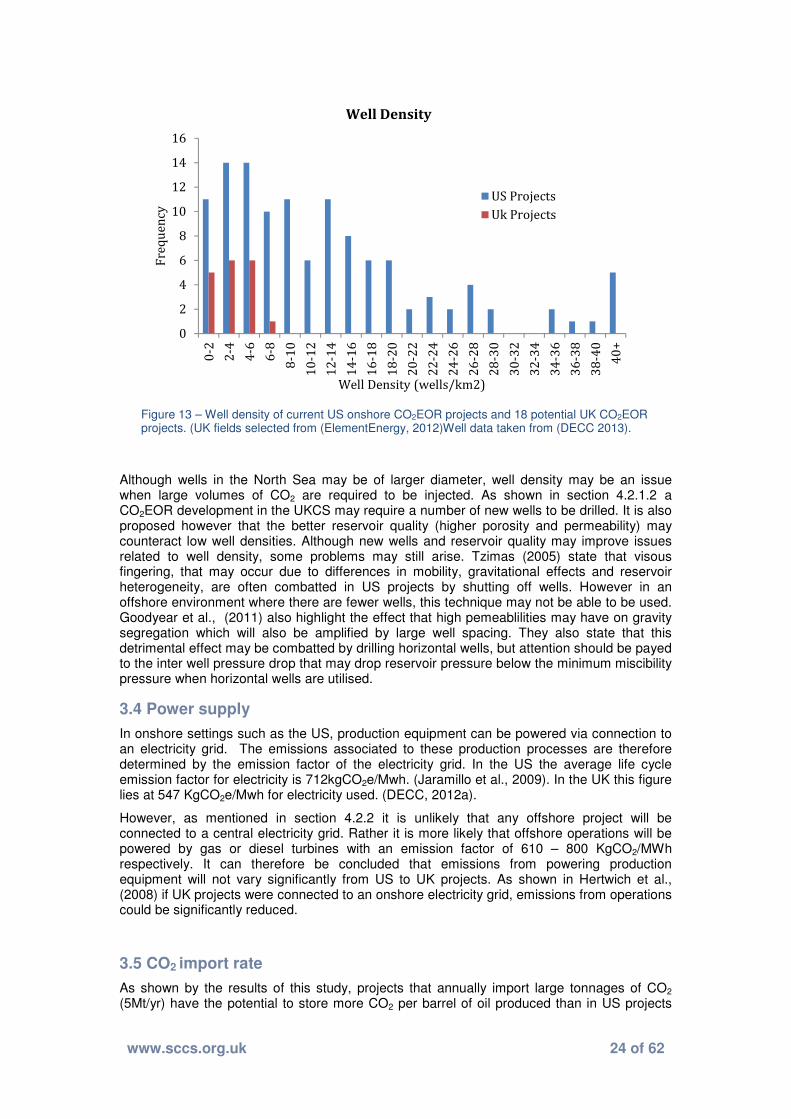
3.3 Well Density
One of the substantial differences between US and potential offshore UK CO2EOR projects is the density of wells. Given the high cost of drilling wells offshore wells are drilled at a lower density. This is displayed in figure 13 below.
0
1
2
3
4
5
6
0-2
50
25
1-5
00
50
1-7
50
75
1-1
00
0
10
01
-12
50
12
50
-15
00
15
01
-17
50
17
51
-20
00
20
01
-22
50
22
51
-25
00
25
01
-27
50
27
51
-30
00
30
01
-32
50
32
51
-35
00
35
01
-37
50
37
51
-40
00
Fre
qu
en
cy
Depth (m)
UK North Sea Potential CO2 EOR
Projects
0
5
10
15
20
25
30
35
40
45
0-2
50
25
1-5
00
50
1-7
50
75
1-1
00
0
10
01
-12
50
12
50
-15
00
15
01
-17
50
17
51
-20
00
20
01
-22
50
22
51
-25
00
25
01
-27
50
27
51
-30
00
30
01
-32
50
32
51
-35
00
35
01
-37
50
Fre
qu
en
cy
Depth (m)
US Current CO2 EOR Fields
Figure 12 - Comparison of depths of Current US projects (Oil and Gas Journal , 2012) and UKCS potential CO2EOR reservoirs selected from (ElementEnergy, 2012)
www.sccs.org.uk 24 of 62
Although wells in the North Sea may be of larger diameter, well density may be an issue when large volumes of CO2 are required to be injected. As shown in section 4.2.1.2 a CO2EOR development in the UKCS may require a number of new wells to be drilled. It is also proposed however that the better reservoir quality (higher porosity and permeability) may counteract low well densities. Although new wells and reservoir quality may improve issues related to well density, some problems may still arise. Tzimas (2005) state that visous fingering, that may occur due to differences in mobility, gravitational effects and reservoir heterogeneity, are often combatted in US projects by shutting off wells. However in an offshore environment where there are fewer wells, this technique may not be able to be used. Goodyear et al., (2011) also highlight the effect that high pemeablilities may have on gravity segregation which will also be amplified by large well spacing. They also state that this detrimental effect may be combatted by drilling horizontal wells, but attention should be payed to the inter well pressure drop that may drop reservoir pressure below the minimum miscibility pressure when horizontal wells are utilised.
3.4 Power supply
In onshore settings such as the US, production equipment can be powered via connection to an electricity grid. The emissions associated to these production processes are therefore determined by the emission factor of the electricity grid. In the US the average life cycle emission factor for electricity is 712kgCO2e/Mwh. (Jaramillo et al., 2009). In the UK this figure lies at 547 KgCO2e/Mwh for electricity used. (DECC, 2012a).
However, as mentioned in section 4.2.2 it is unlikely that any offshore project will be connected to a central electricity grid. Rather it is more likely that offshore operations will be powered by gas or diesel turbines with an emission factor of 610 – 800 KgCO2/MWh respectively. It can therefore be concluded that emissions from powering production equipment will not vary significantly from US to UK projects. As shown in Hertwich et al., (2008) if UK projects were connected to an onshore electricity grid, emissions from operations could be significantly reduced.
3.5 CO2 import rate
As shown by the results of this study, projects that annually import large tonnages of CO2 (5Mt/yr) have the potential to store more CO2 per barrel of oil produced than in US projects
0
2
4
6
8
10
12
14
16
0-2
2-4
4-6
6-8
8-1
0
10
-12
12
-14
14
-16
16
-18
18
-20
20
-22
22
-24
24
-26
26
-28
28
-30
30
-32
32
-34
34
-36
36
-38
38
-40
40
+
Fre
qu
en
cy
Well Density (wells/km2)
Well Density
US Projects
Uk Projects
Figure 13 – Well density of current US onshore CO2EOR projects and 18 potential UK CO2EOR projects. (UK fields selected from (ElementEnergy, 2012)Well data taken from (DECC 2013).

www.sccs.org.uk 25 of 62
where CO2 utilisation is intentionally minimised (443-938kgCO2/bbl vs 170-300kgCO2/bbl). However in early stage CO2EOR development, before the deployment of a CO2 network, any operational issues (such as injectivity loss/ compressor maintenance) may result in venting of imported CO2. There may be engineering solutions, such as surface interim storage that could be developed however to reduce significant volumes of CO2 from being released to atmosphere.
3.6 Injectivity issues
The loss of injectivity has the ability to affect the carbon balance of a project if imported CO2 has to be vented rather than injected. In a study completed by Goodyear et al., (2003) a number of injectivity issues that may affect CO2 injection are presented. These are summarised below.
• Hydrate formation- CO2 hydrates form at a temperature of approximately 10 degrees
celcius over the pressure range expected in UKCS. Hydrate formation has been
experienced in the North Cross Devonian Unit in the US, where it formed in wells with
high gas oil ratios and high CO2 cuts.
• Fines and particulate production- CO2 may leach minerals ( calcite and siderite) from
sandstone and carbonate, increasing pemeability. This may be important for UKCS
sandstone reservoirs as these minerlas may contribute to the cementation of the rock.
It is also debated as to whether particulates present in flue gas may contribute to this
problem.
• Scale formation and deposition – CO2 can increase the CaCO3 scaling issue due to
increased levels of bicarbonate in produced waters.
Although these injectivity issues are known to exist and have hampered a number of US onshore projects (Christensen et al., 1998), Rogers & Grigg (2000) found in a comprehensive review of injectivity completed in the year 2000, that injectivity alone had not significantly impaired the projects economics. What becomes clear however is that injectivity issues are highly project specific. Further research is needed to firmly conclude if injectivity issues are likely to affect the carbon balance of CO2EOR projetcs in the UKCS.
www.sccs.org.uk 26 of 62
4. Case study- A CO2EOR development in the North Sea
4.1 Introduction
4.1.1 Scope of this study
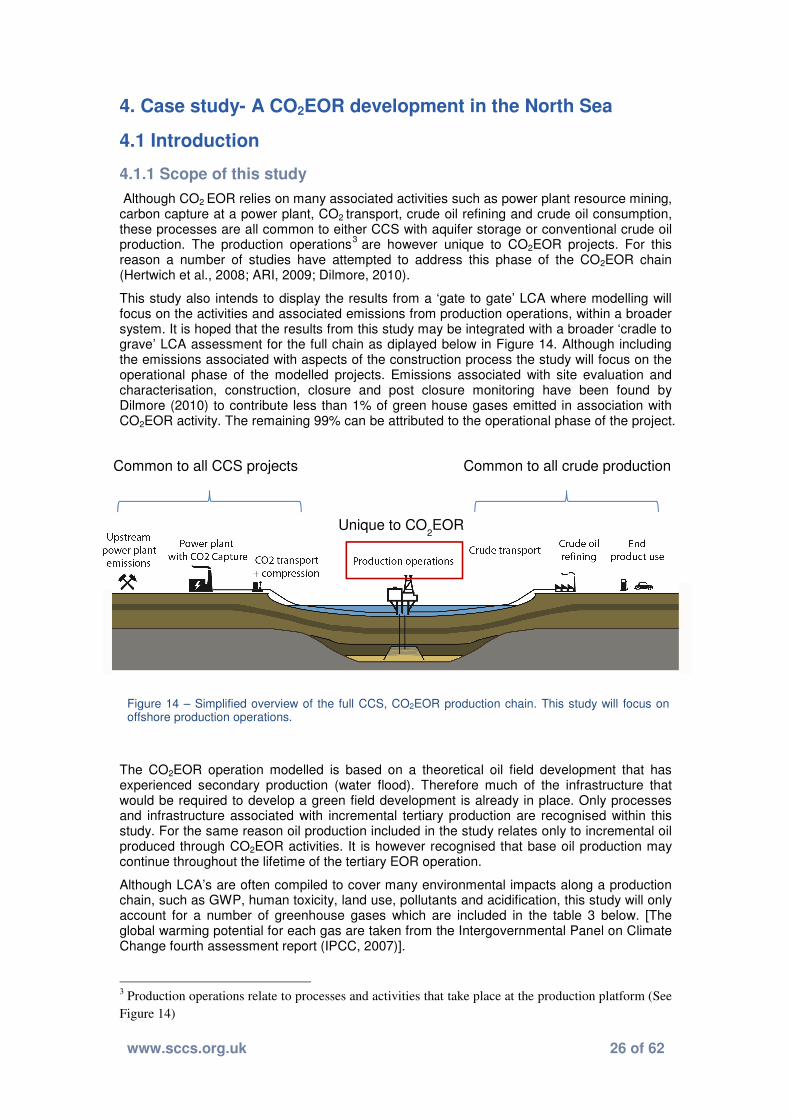
Although CO2 EOR relies on many associated activities such as power plant resource mining, carbon capture at a power plant, CO2 transport, crude oil refining and crude oil consumption, these processes are all common to either CCS with aquifer storage or conventional crude oil production. The production operations
3 are however unique to CO2EOR projects. For this
reason a number of studies have attempted to address this phase of the CO2EOR chain (Hertwich et al., 2008; ARI, 2009; Dilmore, 2010).
This study also intends to display the results from a ‘gate to gate’ LCA where modelling will focus on the activities and associated emissions from production operations, within a broader system. It is hoped that the results from this study may be integrated with a broader ‘cradle to grave’ LCA assessment for the full chain as diplayed below in Figure 14. Although including the emissions associated with aspects of the construction process the study will focus on the operational phase of the modelled projects. Emissions associated with site evaluation and characterisation, construction, closure and post closure monitoring have been found by Dilmore (2010) to contribute less than 1% of green house gases emitted in association with CO2EOR activity. The remaining 99% can be attributed to the operational phase of the project.
The CO2EOR operation modelled is based on a theoretical oil field development that has experienced secondary production (water flood). Therefore much of the infrastructure that would be required to develop a green field development is already in place. Only processes and infrastructure associated with incremental tertiary production are recognised within this study. For the same reason oil production included in the study relates only to incremental oil produced through CO2EOR activities. It is however recognised that base oil production may continue throughout the lifetime of the tertiary EOR operation.
Although LCA’s are often compiled to cover many environmental impacts along a production chain, such as GWP, human toxicity, land use, pollutants and acidification, this study will only account for a number of greenhouse gases which are included in the table 3 below. [The global warming potential for each gas are taken from the Intergovernmental Panel on Climate Change fourth assessment report (IPCC, 2007)].
3 Production operations relate to processes and activities that take place at the production platform (See
Figure 14)
Common to all CCS projects Common to all crude production
Unique to CO2EOR
Figure 14 – Simplified overview of the full CCS, CO2EOR production chain. This study will focus on offshore production operations.

www.sccs.org.uk 27 of 62
Emission Gas GWP- CO2equivalent, 100 year time horizon
Carbon Dioxide (CO2) 1
Methane (CH4) 25
Nitrous Oxide (N2O) 298
4.1.2 Life cycle analysis overview
Life Cycle Boundary Gate-to-gate (CO2 delivered at platform- crude oil production at sales pipeline)
Scenarios analysed - 20 years ‘continuous’ injection of captured anthropogenic CO2 into one field development
- 10 years continuous injection of captured anthropogenic CO2 into one field development followed by 10 years of recycle.
Geographic location Theoretical anchor field , Central North Sea, United Kingdom Continental Shelf
Impact assessment methodology GWP, IPCC 2007 100 year time frame
Reporting metric Mass of CO2e emitted over project life time, Bbl of oil produced
Data quality Objectives Med to High level LCA.
All significant activities and processes included
Aim to consider +95% of all emissions
Table 3- Greenhouse gases included in the system boundary. Global Warming Potential taken from (IPCC, Fourth Assessment Report. Working Group I: The Physical Science Basis, 2007)
Table 4 – Summary of Life Cycle Assessment
www.sccs.org.uk 28 of 62
4.1.3 CO2EOR process overview- defining the system boundary
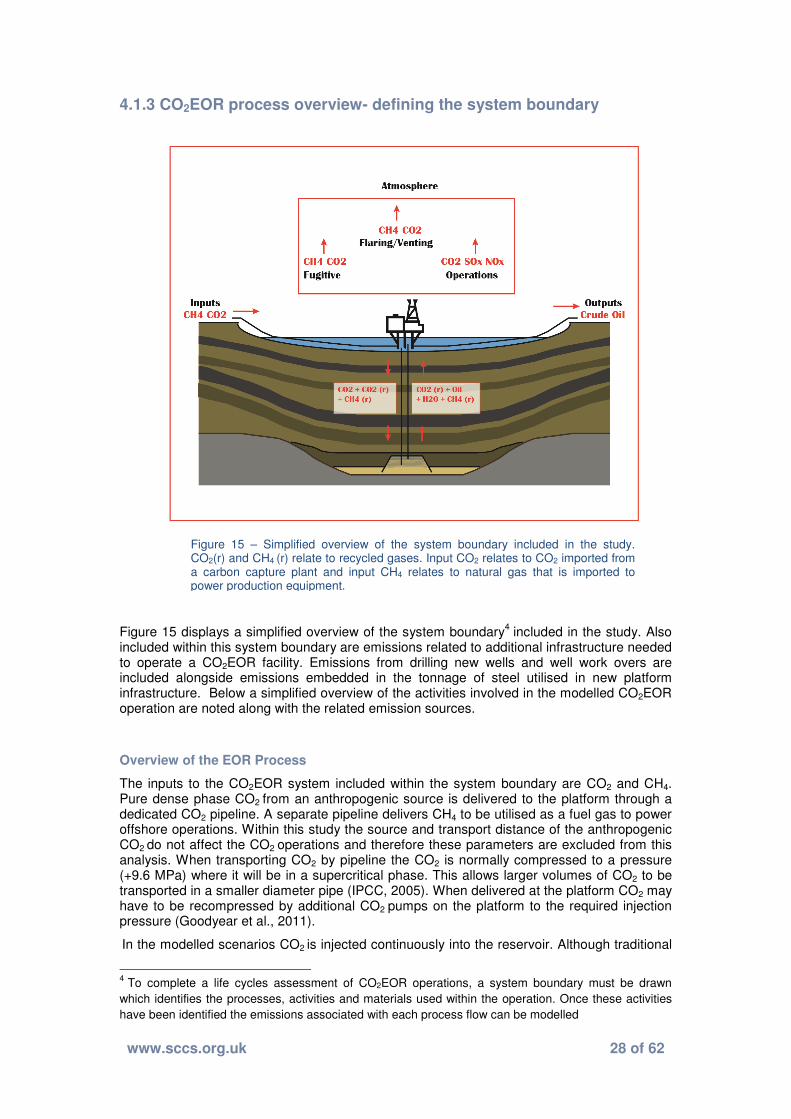
Figure 15 displays a simplified overview of the system boundary4 included in the study. Also
included within this system boundary are emissions related to additional infrastructure needed to operate a CO2EOR facility. Emissions from drilling new wells and well work overs are included alongside emissions embedded in the tonnage of steel utilised in new platform infrastructure. Below a simplified overview of the activities involved in the modelled CO2EOR operation are noted along with the related emission sources.
Overview of the EOR Process
The inputs to the CO2EOR system included within the system boundary are CO2 and CH4. Pure dense phase CO2 from an anthropogenic source is delivered to the platform through a dedicated CO2 pipeline. A separate pipeline delivers CH4 to be utilised as a fuel gas to power offshore operations. Within this study the source and transport distance of the anthropogenic CO2 do not affect the CO2 operations and therefore these parameters are excluded from this analysis. When transporting CO2 by pipeline the CO2 is normally compressed to a pressure (+9.6 MPa) where it will be in a supercritical phase. This allows larger volumes of CO2 to be transported in a smaller diameter pipe (IPCC, 2005). When delivered at the platform CO2 may have to be recompressed by additional CO2 pumps on the platform to the required injection pressure (Goodyear et al., 2011).
In the modelled scenarios CO2 is injected continuously into the reservoir. Although traditional
4 To complete a life cycles assessment of CO2EOR operations, a system boundary must be drawn
which identifies the processes, activities and materials used within the operation. Once these activities
have been identified the emissions associated with each process flow can be modelled
Figure 15 – Simplified overview of the system boundary included in the study. CO2(r) and CH4 (r) relate to recycled gases. Input CO2 relates to CO2 imported from a carbon capture plant and input CH4 relates to natural gas that is imported to power production equipment.
www.sccs.org.uk 29 of 62
projects have injected water at specific intervals to sweep the reservoir, this study presumes no water injection is undertaken. For further details and justification of this process see section 4.2.6.1. For a number of years CO2 injection commences. After a period incremental oil production will occur due to the increase of pressure in the reservoir as a result of CO2 injection. However it may take longer for injected CO2 to break through at the production wells. The volume of CO2 reproduced at the production wells will increase over time until the gas recycle capacity of the facility is reached. After CO2 breakthrough a four phase mixture of oil (with associated CH4), CO2 and water is produced at the platform. Using a number of processes the crude oil and water is separated from the CH4 and CO2 which is now in a gaseous phase. The crude oil can now be exported, and the water treated and disposed overboard. The operator can then choose to either re-inject the CH4 / CO2 mixture alongside the fresh CO2 delivered to the platform, or separate the CH4 from the CO2 to be used as a fuel gas or for export. A fifth phase of solid asphaltene precipitate may also be present (Goodyear et al., 2003).
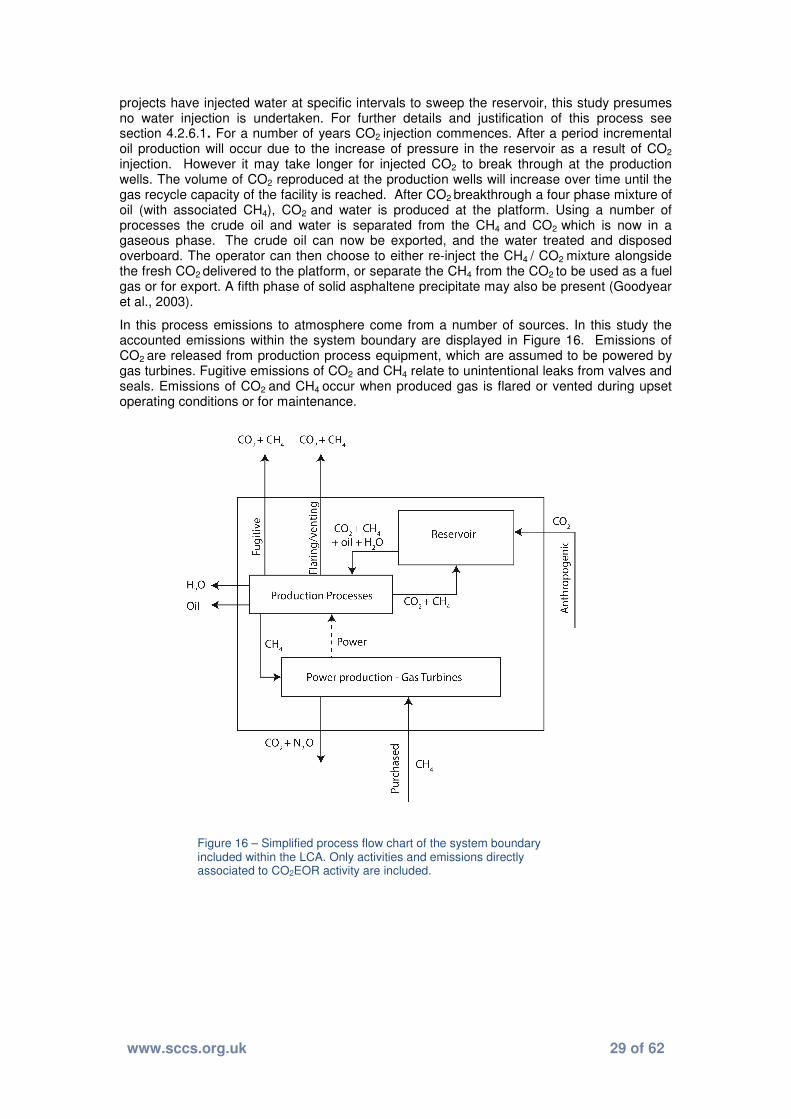
In this process emissions to atmosphere come from a number of sources. In this study the accounted emissions within the system boundary are displayed in Figure 16. Emissions of CO2 are released from production process equipment, which are assumed to be powered by gas turbines. Fugitive emissions of CO2 and CH4 relate to unintentional leaks from valves and seals. Emissions of CO2 and CH4 occur when produced gas is flared or vented during upset operating conditions or for maintenance.
Figure 16 – Simplified process flow chart of the system boundary included within the LCA. Only activities and emissions directly associated to CO2EOR activity are included.

www.sccs.org.uk 30 of 62
4.2 Methodology
4.2.1 Model design
The study models an ‘anchor field’ development that would be the first CO2EOR project in an area, with a field big enough to accommodate the CO2 supply from a post-demonstration size carbon capture plant. Out of the current proposed demonstration projects in the UK, the largest power output of the power plant with carbon capture is 570MW (DECC, 2012c). The theoretical field modelled here is designed to accept CO2 from a full scale carbon capture project with a gross power output of around 1GW and CO2 output of around 5Mt per annum. The CO2 supply of around 5Mt/yr is here considered to be required to allow EOR project economics to be justifiable.
Below a number of input parameters and assumptions made within the LCA are noted. The assumptions made are not based on a specific North Sea CO2EOR project, but more generally represent a theoretical, yet realistic, project development. Where other studies such as (ARI, Melzer Consulting, 2010; Dilmore, 2010) have based studies around ‘historical’, ‘best practice’ and ‘futuristic’ project design, this study aims to represent the most realistic project development that may take place in the UKCS given the current regulatory, economic and technical framework. Although the study aims to develop a realistic model for CO2EOR, the study also aims to address how parameters, such as injection strategy, affect the carbon balance of the EOR development.
4.2.1.1 Infrastructure
To facilitate a large CO2 supply the modelled anchor project includes a new bridge-link platform (BLP) to accommodate substantial new processing facilities. The construction of a new platform allows the operation to run with more flexibility and incorporate improvements in design that would not be available when only using an existing platform. The construction of a new platform, which can be completed onshore before offshore installation, also reduces the risk of construction costs escalation. Although this represents a significant capital cost the unit cost is lower when the project scale is large enough. The weight of steel required to construct a new BLP is estimated in this study to lie between 5-15 thousand tonnes.
4.2.1.2 Wells
The drilling of new wells in a CO2EOR project will be highly field specific. The IPCC (2005) report that the number of wells required for a storage project will depend on a number of factors, including total injection rate, permeability, formation thickness and maximum injection pressure. Although these parameters describe controlling factors for a storage project, the same parameters apply to a CO2EOR project. It is assumed that for an anchor project of this size 8 new wells will be drilled. It is also assumed that existing wells will need worked-over to accommodate CO2. For the modelled anchor project 17 well work-overs are included.
5
4.2.1.3 Reservoir dynamics
To allow estimates of both injected gas volumes and produced gas and fluids for each EOR scenario, simplified reservoir numerical models were constructed in Microsoft Excel. These models allow predictions of inputs and outputs as displayed in figure 17 & 19. The outputs of these models are displayed in the results section (section 4.3.1). Although these models were constructed through time, the timing of production profiles is often the parameter with the largest uncertainty. Here the timing of oil produced, for example, is representative of only one potential scenario. It is assumed however that the timing of produced / injected fluids will only have a small controlling factor on the final emission profile of an operation.
5 Assumption based on personal communication with CO2EOR developer
www.sccs.org.uk 31 of 62
4.2.2 Power generation/ fuel supply
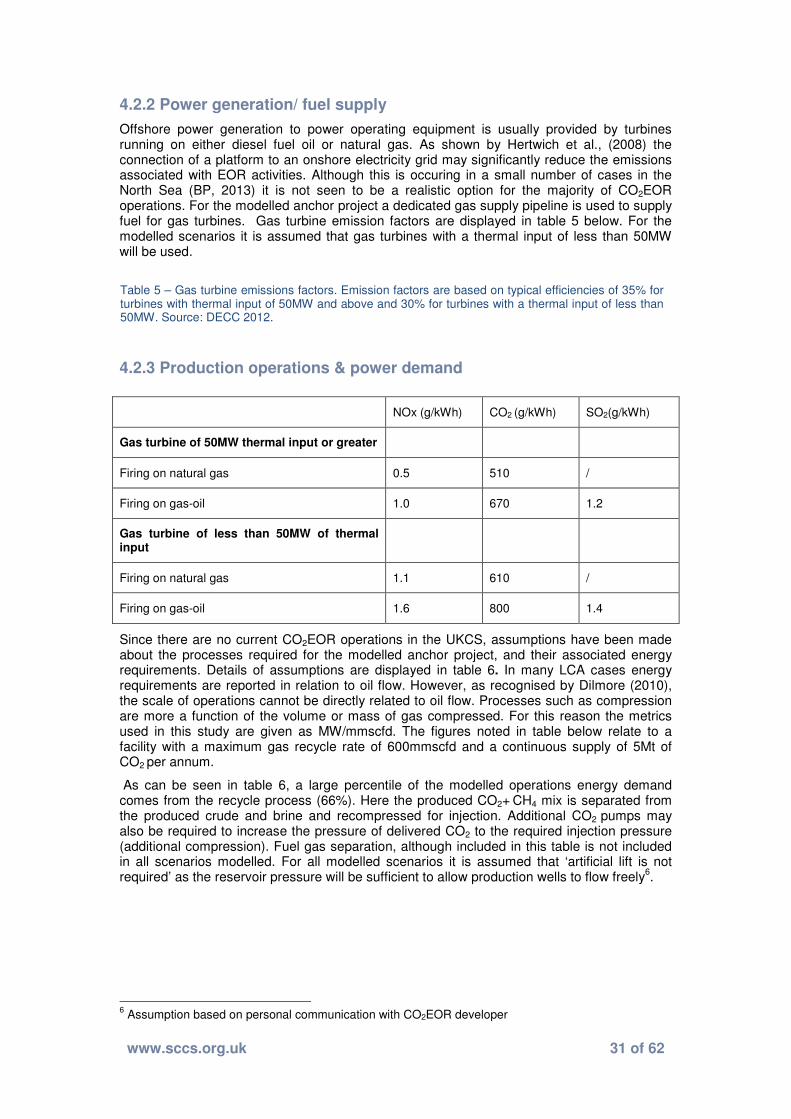
Offshore power generation to power operating equipment is usually provided by turbines running on either diesel fuel oil or natural gas. As shown by Hertwich et al., (2008) the connection of a platform to an onshore electricity grid may significantly reduce the emissions associated with EOR activities. Although this is occuring in a small number of cases in the North Sea (BP, 2013) it is not seen to be a realistic option for the majority of CO2EOR operations. For the modelled anchor project a dedicated gas supply pipeline is used to supply fuel for gas turbines. Gas turbine emission factors are displayed in table 5 below. For the modelled scenarios it is assumed that gas turbines with a thermal input of less than 50MW will be used.
4.2.3 Production operations & power demand
Since there are no current CO2EOR operations in the UKCS, assumptions have been made about the processes required for the modelled anchor project, and their associated energy requirements. Details of assumptions are displayed in table 6. In many LCA cases energy requirements are reported in relation to oil flow. However, as recognised by Dilmore (2010), the scale of operations cannot be directly related to oil flow. Processes such as compression are more a function of the volume or mass of gas compressed. For this reason the metrics used in this study are given as MW/mmscfd. The figures noted in table below relate to a facility with a maximum gas recycle rate of 600mmscfd and a continuous supply of 5Mt of CO2 per annum.
As can be seen in table 6, a large percentile of the modelled operations energy demand comes from the recycle process (66%). Here the produced CO2+ CH4 mix is separated from the produced crude and brine and recompressed for injection. Additional CO2 pumps may also be required to increase the pressure of delivered CO2 to the required injection pressure (additional compression). Fuel gas separation, although included in this table is not included in all scenarios modelled. For all modelled scenarios it is assumed that ‘artificial lift is not required’ as the reservoir pressure will be sufficient to allow production wells to flow freely
6.
6 Assumption based on personal communication with CO2EOR developer
NOx (g/kWh) CO2 (g/kWh) SO2(g/kWh)
Gas turbine of 50MW thermal input or greater
Firing on natural gas 0.5 510 /
Firing on gas-oil 1.0 670 1.2
Gas turbine of less than 50MW of thermal input
Firing on natural gas 1.1 610 /
Firing on gas-oil 1.6 800 1.4
Table 5 – Gas turbine emissions factors. Emission factors are based on typical efficiencies of 35% for turbines with thermal input of 50MW and above and 30% for turbines with a thermal input of less than 50MW. Source: DECC 2012.
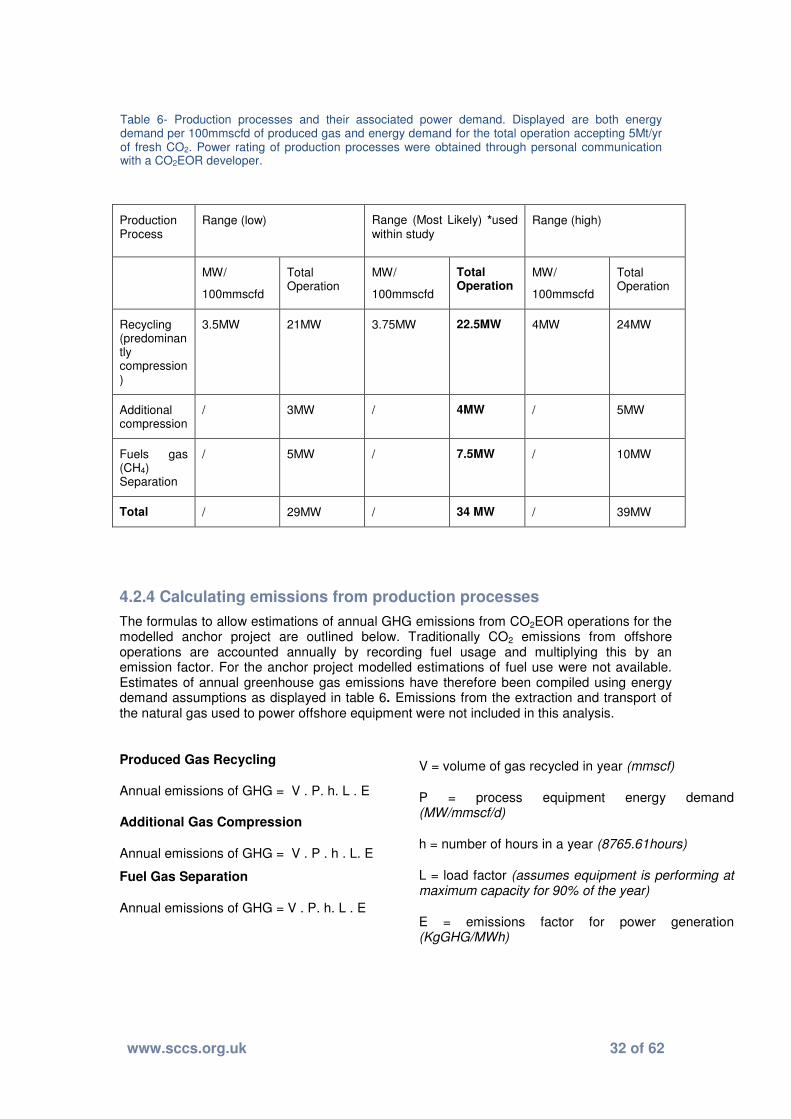
www.sccs.org.uk 32 of 62
4.2.4 Calculating emissions from production processes
The formulas to allow estimations of annual GHG emissions from CO2EOR operations for the modelled anchor project are outlined below. Traditionally CO2 emissions from offshore operations are accounted annually by recording fuel usage and multiplying this by an emission factor. For the anchor project modelled estimations of fuel use were not available. Estimates of annual greenhouse gas emissions have therefore been compiled using energy demand assumptions as displayed in table 6. Emissions from the extraction and transport of the natural gas used to power offshore equipment were not included in this analysis.
Produced Gas Recycling
Annual emissions of GHG = V . P. h. L . E
Additional Gas Compression
Annual emissions of GHG = V . P . h . L. E
Fuel Gas Separation
Annual emissions of GHG = V . P. h. L . E
Production Process
Range (low)
Range (Most Likely) *used within study
Range (high)
MW/
100mmscfd
Total Operation
MW/
100mmscfd
Total Operation
MW/
100mmscfd
Total Operation
Recycling (predominantly compression)
3.5MW 21MW 3.75MW 22.5MW 4MW 24MW
Additional compression
/ 3MW / 4MW / 5MW
Fuels gas (CH4) Separation
/ 5MW / 7.5MW / 10MW
Total / 29MW / 34 MW / 39MW
Table 6- Production processes and their associated power demand. Displayed are both energy demand per 100mmscfd of produced gas and energy demand for the total operation accepting 5Mt/yr of fresh CO2. Power rating of production processes were obtained through personal communication with a CO2EOR developer.
V = volume of gas recycled in year (mmscf)
P = process equipment energy demand (MW/mmscf/d)
h = number of hours in a year (8765.61hours)
L = load factor (assumes equipment is performing at maximum capacity for 90% of the year)
E = emissions factor for power generation (KgGHG/MWh)
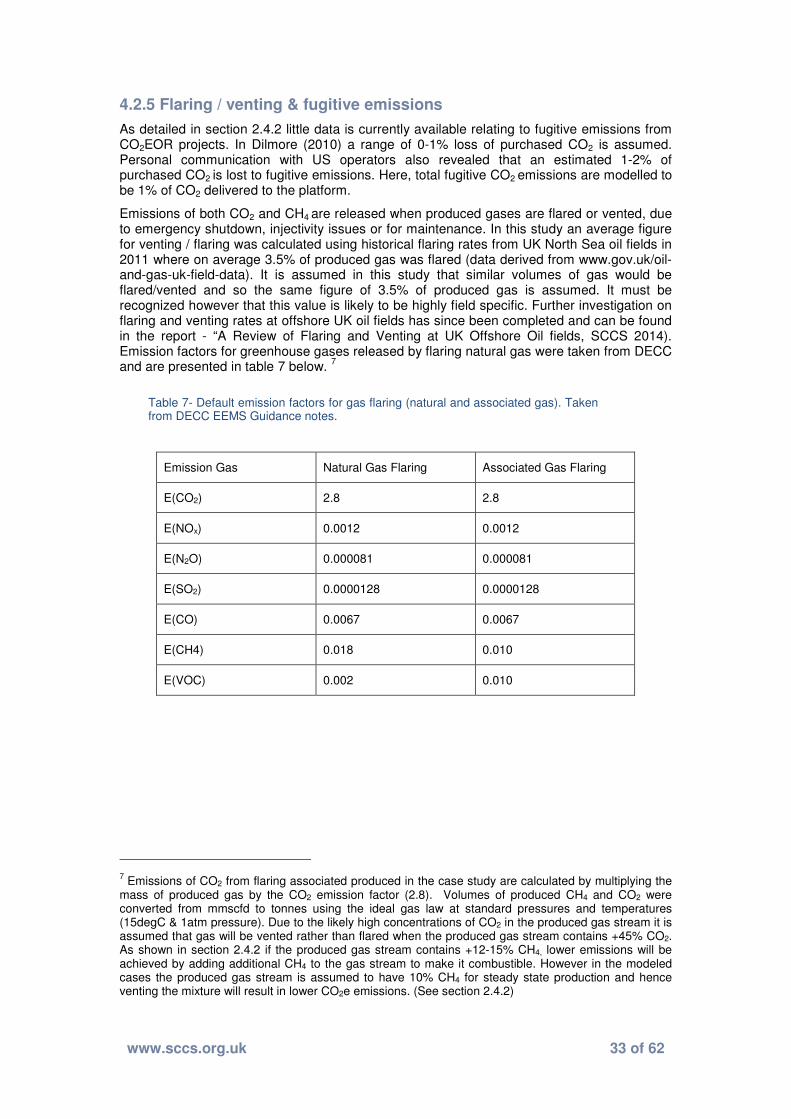
www.sccs.org.uk 33 of 62
4.2.5 Flaring / venting & fugitive emissions
As detailed in section 2.4.2 little data is currently available relating to fugitive emissions from CO2EOR projects. In Dilmore (2010) a range of 0-1% loss of purchased CO2 is assumed. Personal communication with US operators also revealed that an estimated 1-2% of purchased CO2 is lost to fugitive emissions. Here, total fugitive CO2 emissions are modelled to be 1% of CO2 delivered to the platform.
Emissions of both CO2 and CH4 are released when produced gases are flared or vented, due to emergency shutdown, injectivity issues or for maintenance. In this study an average figure for venting / flaring was calculated using historical flaring rates from UK North Sea oil fields in 2011 where on average 3.5% of produced gas was flared (data derived from www.gov.uk/oil-and-gas-uk-field-data). It is assumed in this study that similar volumes of gas would be flared/vented and so the same figure of 3.5% of produced gas is assumed. It must be recognized however that this value is likely to be highly field specific. Further investigation on flaring and venting rates at offshore UK oil fields has since been completed and can be found in the report - “A Review of Flaring and Venting at UK Offshore Oil fields, SCCS 2014). Emission factors for greenhouse gases released by flaring natural gas were taken from DECC and are presented in table 7 below.
7
Emission Gas Natural Gas Flaring Associated Gas Flaring
E(CO2) 2.8 2.8
E(NOx) 0.0012 0.0012
E(N2O) 0.000081 0.000081
E(SO2) 0.0000128 0.0000128
E(CO) 0.0067 0.0067
E(CH4) 0.018 0.010
E(VOC) 0.002 0.010
7 Emissions of CO2 from flaring associated produced in the case study are calculated by multiplying the
mass of produced gas by the CO2 emission factor (2.8). Volumes of produced CH4 and CO2 were converted from mmscfd to tonnes using the ideal gas law at standard pressures and temperatures (15degC & 1atm pressure). Due to the likely high concentrations of CO2 in the produced gas stream it is assumed that gas will be vented rather than flared when the produced gas stream contains +45% CO2. As shown in section 2.4.2 if the produced gas stream contains +12-15% CH4, lower emissions will be achieved by adding additional CH4 to the gas stream to make it combustible. However in the modeled cases the produced gas stream is assumed to have 10% CH4 for steady state production and hence venting the mixture will result in lower CO2e emissions. (See section 2.4.2)
Table 7- Default emission factors for gas flaring (natural and associated gas). Taken from DECC EEMS Guidance notes.
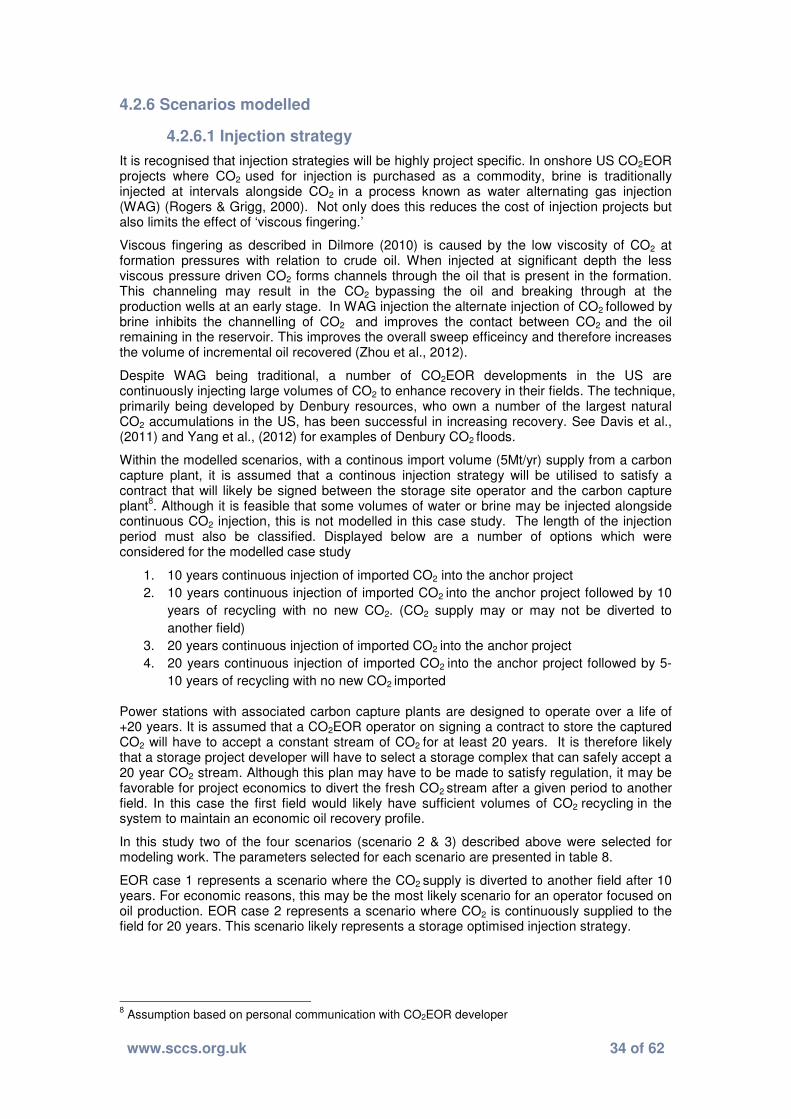
www.sccs.org.uk 34 of 62
4.2.6 Scenarios modelled
4.2.6.1 Injection strategy
It is recognised that injection strategies will be highly project specific. In onshore US CO2EOR projects where CO2 used for injection is purchased as a commodity, brine is traditionally injected at intervals alongside CO2 in a process known as water alternating gas injection (WAG) (Rogers & Grigg, 2000). Not only does this reduces the cost of injection projects but also limits the effect of ‘viscous fingering.’
Viscous fingering as described in Dilmore (2010) is caused by the low viscosity of CO2 at formation pressures with relation to crude oil. When injected at significant depth the less viscous pressure driven CO2 forms channels through the oil that is present in the formation. This channeling may result in the CO2 bypassing the oil and breaking through at the production wells at an early stage. In WAG injection the alternate injection of CO2 followed by brine inhibits the channelling of CO2 and improves the contact between CO2 and the oil remaining in the reservoir. This improves the overall sweep efficeincy and therefore increases the volume of incremental oil recovered (Zhou et al., 2012).
Despite WAG being traditional, a number of CO2EOR developments in the US are continuously injecting large volumes of CO2 to enhance recovery in their fields. The technique, primarily being developed by Denbury resources, who own a number of the largest natural CO2 accumulations in the US, has been successful in increasing recovery. See Davis et al., (2011) and Yang et al., (2012) for examples of Denbury CO2 floods.
Within the modelled scenarios, with a continous import volume (5Mt/yr) supply from a carbon capture plant, it is assumed that a continous injection strategy will be utilised to satisfy a contract that will likely be signed between the storage site operator and the carbon capture plant
8. Although it is feasible that some volumes of water or brine may be injected alongside
continuous CO2 injection, this is not modelled in this case study. The length of the injection period must also be classified. Displayed below are a number of options which were considered for the modelled case study
1. 10 years continuous injection of imported CO2 into the anchor project
2. 10 years continuous injection of imported CO2 into the anchor project followed by 10
years of recycling with no new CO2. (CO2 supply may or may not be diverted to
another field)
3. 20 years continuous injection of imported CO2 into the anchor project
4. 20 years continuous injection of imported CO2 into the anchor project followed by 5-
10 years of recycling with no new CO2 imported
Power stations with associated carbon capture plants are designed to operate over a life of +20 years. It is assumed that a CO2EOR operator on signing a contract to store the captured CO2 will have to accept a constant stream of CO2 for at least 20 years. It is therefore likely that a storage project developer will have to select a storage complex that can safely accept a 20 year CO2 stream. Although this plan may have to be made to satisfy regulation, it may be favorable for project economics to divert the fresh CO2 stream after a given period to another field. In this case the first field would likely have sufficient volumes of CO2 recycling in the system to maintain an economic oil recovery profile.
In this study two of the four scenarios (scenario 2 & 3) described above were selected for modeling work. The parameters selected for each scenario are presented in table 8.
EOR case 1 represents a scenario where the CO2 supply is diverted to another field after 10 years. For economic reasons, this may be the most likely scenario for an operator focused on oil production. EOR case 2 represents a scenario where CO2 is continuously supplied to the field for 20 years. This scenario likely represents a storage optimised injection strategy.
8 Assumption based on personal communication with CO2EOR developer

www.sccs.org.uk 35 of 62
EOR Case 1 EOR Case 2
Project design life 20 years 20 years
Fresh CO2 supply duration
10 years 20 years
Fresh CO2 supply volume
5Mt/yr 5Mt/yr
Injection strategy 10 yr continuous + recycle 20 yr continuous + 10 yr recycle
Maximum Gas Recycle Capacity
600mmscfd 600mmscfd
Utilisation factor (mmBbl / Mt CO2imported)
2 1
Table 8 – Input parameters selected for EOR case 1 & 2 used within the study

www.sccs.org.uk 36 of 62
4.3 Results
4.3.1 Emissions and storage through time
The outputs of the reservoir numerical models are displayed in figure 17 (case 1) and figure 19 (case 2). Although they are simplified and do not account for the complexities of CO2 oil interaction in the subsurface, they are here considered to be sufficient to allow informed estimates of produced and injected volumes to be calculated.
As can be seen in Figures 18 and 20 emissions in both cases increase steadily until the maximum gas recycle rate is reached after 5 years of CO2 injection. At this point gas venting/flaring of produced CH4 + CO2 and power consumption required to power the recycle process reach a constant maximum value. Emissions from additional CO2 pumps remain constant in the first ten years when the annual fresh CO2 supply is constant.
In EOR case 1 when the CO2 supply ceases after 10 years, operational emissions reduce but not substantially. Emissions from additional CO2 pumps reduces due to the reduction in total injected gas volume. Fugitive emissions of CO2 also reduce to the lower total volume of CO2 being handled. However as the recycle capacity remains constant emissions from both recycle equipment and flaring/venting remain constant.
As can be seen in Figure 17 and the total volume of injected CO2 in the second 10 year period lies below the total volume of CO2 recycled due to flaring/venting in upset operating conditions. This flaring/venting can also be seen to affect the storage profiles of both cases. As can be seen in Figure 18 & 20 the process of flaring/venting also results in the annual mass of CO2 stored decreasing through time as the recycle rate increases. When the maximum recycle rate is reached after 6 years of injection the mass of CO2 stored annually remains constant.

www.sccs.org.uk 37 of 62
0
2
4
6
8
10
12
14
16
18
0
2
4
6
8
10
12
14
16
Oil
Pr
od
uc
tio
n (
mm
Bb
l)
CO
2 I
nje
cti
on
(M
t)
EOR Case 1- Production/Injection Profile- 10 years continuous CO2 injection
10 years recycle
Oil Produced (mmbbl) Injected CO2 (Mt)
Fresh CO2 injection (Mt) Recycled CO2 (Mt)
-5.5
-5
-4.5
-4
-3.5
-3
-2.5
-2
-1.5
-1
-0.5
0
0.5
1
1.5
20
13
20
14
20
15
20
16
20
17
20
18
20
19
20
20
20
21
20
22
20
23
20
24
20
25
20
26
20
27
20
28
20
29
20
30
20
31
20
32
20
33
Em
iss
ion
s /
sto
ra
ge
(M
t C
O2
e)
EOR case 1- Emissions & storage profile
Steel Embedded Carbon (tCO2e) Flared CH4Vented CO2 Vented CH4CO2 Stored Well Workover
New wells Fugitive CO2Compression Gas Recycling
Figure 17 – EOR case 1 reservoir dynamics through time. Units for oil production (red bars) are displayed in mmBbl on the axis to the right of the chart. CO2 volumes injected / produced are displayed in Mt on the axis to the left of the chart. Values displayed represent volumes produced per year.
Figure 18 – EOR case 1 emission & storage profile. All bars above the horizontal axis represent annual CO2e emissions. Bars below the horizontal access represent annual CO2 stored in the reservoir.
CO2 import diverted
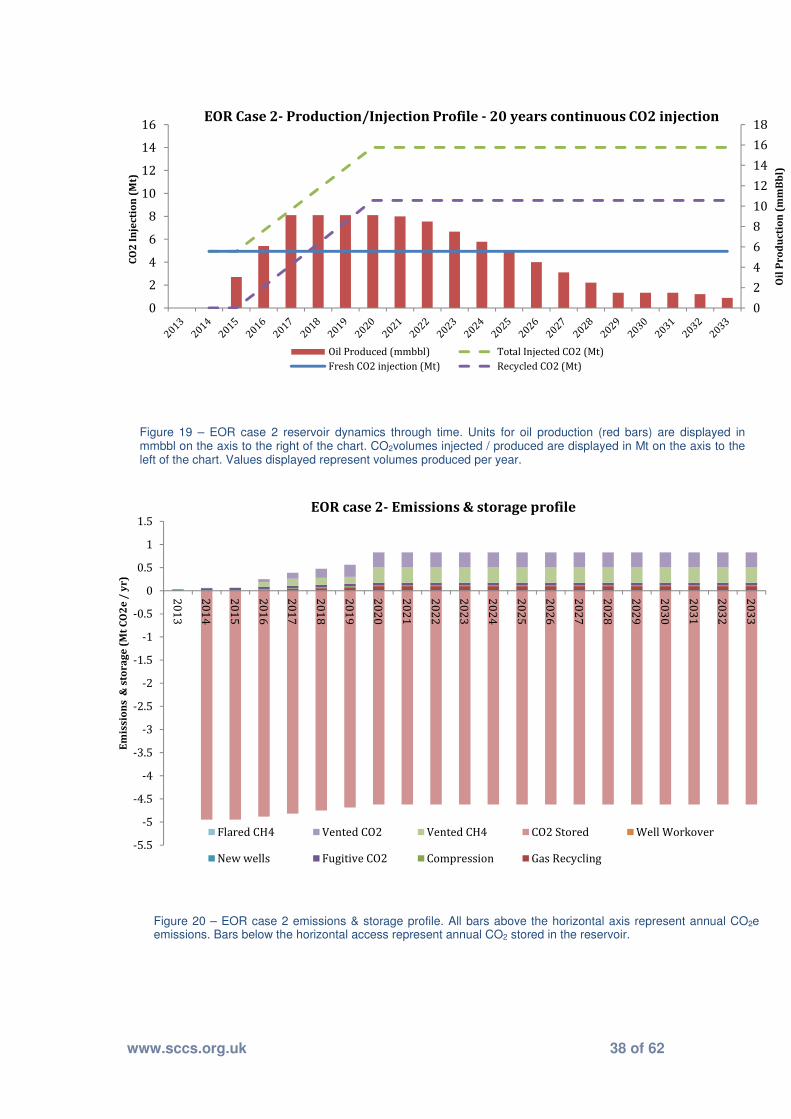
www.sccs.org.uk 38 of 62
0
2
4
6
8
10
12
14
16
18
0
2
4
6
8
10
12
14
16
Oil
Pr
od
uc
tio
n (
mm
Bb
l)
CO
2 I
nje
cti
on
(M
t)
EOR Case 2- Production/Injection Profile - 20 years continuous CO2 injection
Oil Produced (mmbbl) Total Injected CO2 (Mt)
Fresh CO2 injection (Mt) Recycled CO2 (Mt)
-5.5
-5
-4.5
-4
-3.5
-3
-2.5
-2
-1.5
-1
-0.5
0
0.5
1
1.5
20
13
20
14
20
15
20
16
20
17
20
18
20
19
20
20
20
21
20
22
20
23
20
24
20
25
20
26
20
27
20
28
20
29
20
30
20
31
20
32
20
33
Em
iss
ion
s &
sto
ra
ge
(M
t C
O2
e /
yr
)
EOR case 2- Emissions & storage profile
Flared CH4 Vented CO2 Vented CH4 CO2 Stored Well Workover
New wells Fugitive CO2 Compression Gas Recycling
Figure 19 – EOR case 2 reservoir dynamics through time. Units for oil production (red bars) are displayed in mmbbl on the axis to the right of the chart. CO2volumes injected / produced are displayed in Mt on the axis to the left of the chart. Values displayed represent volumes produced per year.
Figure 20 – EOR case 2 emissions & storage profile. All bars above the horizontal axis represent annual CO2e emissions. Bars below the horizontal access represent annual CO2 stored in the reservoir.

www.sccs.org.uk 39 of 62
4.3.2 Cumulative emissions
Total cumulative emissions for the 20 year project life time for both EOR cases are displayed in table 9. Total emissions from EOR case 1 accumulate to 12.9Mt CO2e over the 20 year life of the project.
Total cumulative emissions from EOR case 2 although larger at 13.5Mt CO2e, are relatively similar considering case 2 represents an additional injection of around 5Mt CO2 per year for an additional ten years. This is due to the largest contribution of emissions arising from the recycle process which remains constant in both cases.
Figure 21 also displays cumulative emissions from both EOR case 1 and EOR case 2 respectively. The percentage contribution of each activity to overall emissions over the 20 year lifetime of the operation are displayed in table 9. As can be seen in both EOR scenarios venting of CO2 and CH4 has the largest contribution (~40%) to greenhouse gas emissions over the 20 year life time of the project. Unlike most conventional oil operations (See Figures 3 & 4) flaring of produced associated gas, contributes a very small percentage to overall emissions. This is due to the high levels of CO2 in the produced gas stream preventing flaring.
Emissions associated with drilling new wells, working over old wells and for the manufacturing of a new bridge link platform, which are assumed to all occur prior to CO2 injection, have a very small contribution to overall emissions at <1 % for each. Of all the modelled production processes included in the system boundary, gas recycling in both cases gives the largest contribution with around 12% of emissions over the project life time.
.
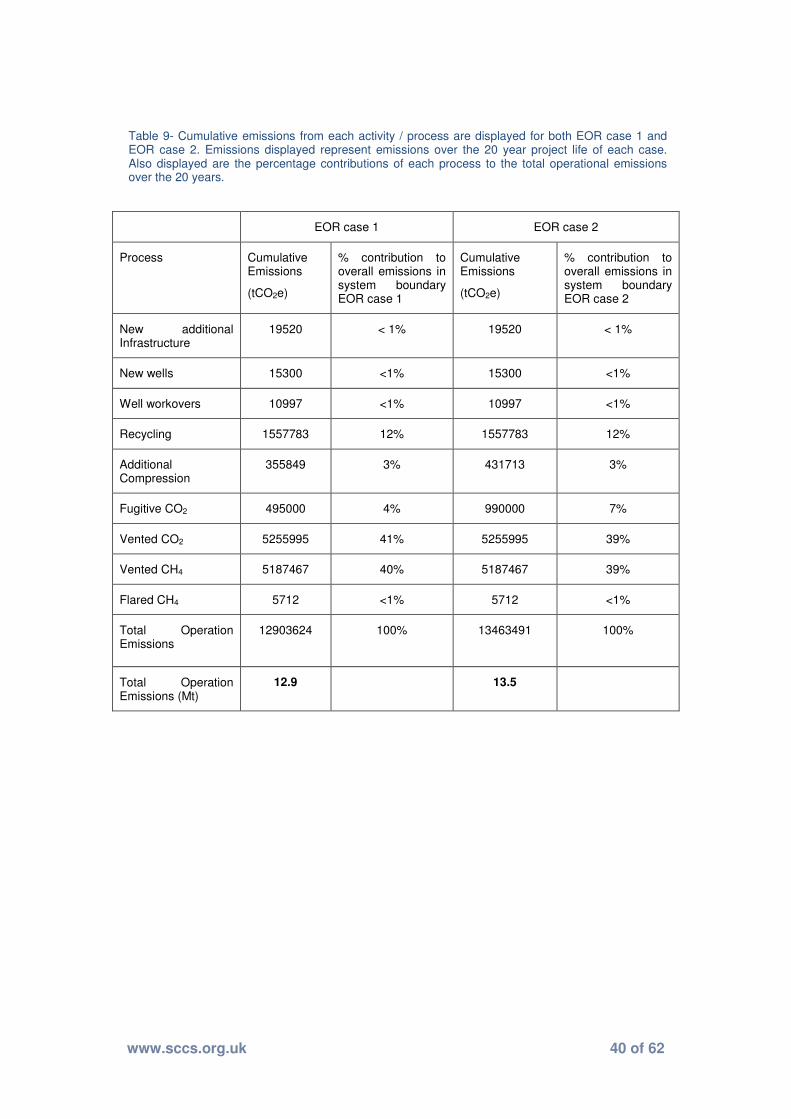
www.sccs.org.uk 40 of 62
EOR case 1 EOR case 2
Process Cumulative Emissions
(tCO2e)
% contribution to overall emissions in system boundary EOR case 1
Cumulative Emissions
(tCO2e)
% contribution to overall emissions in system boundary EOR case 2
New additional Infrastructure
19520 < 1% 19520 < 1%
New wells 15300 <1% 15300 <1%
Well workovers 10997 <1% 10997 <1%
Recycling 1557783 12% 1557783 12%
Additional Compression
355849 3% 431713 3%
Fugitive CO2 495000 4% 990000 7%
Vented CO2 5255995 41% 5255995 39%
Vented CH4 5187467 40% 5187467 39%
Flared CH4 5712 <1% 5712 <1%
Total Operation Emissions
12903624 100% 13463491
100%
Total Operation Emissions (Mt)
12.9 13.5
Table 9- Cumulative emissions from each activity / process are displayed for both EOR case 1 and EOR case 2. Emissions displayed represent emissions over the 20 year project life of each case. Also displayed are the percentage contributions of each process to the total operational emissions over the 20 years.
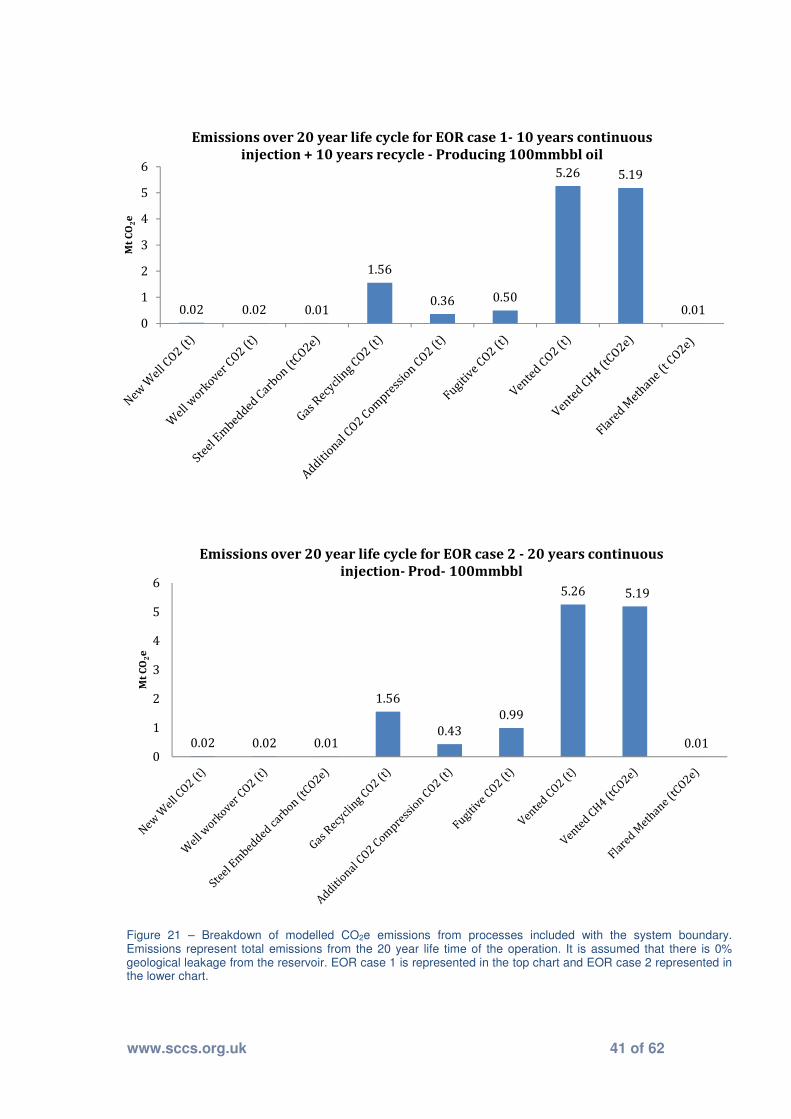
www.sccs.org.uk 41 of 62
0.02 0.02 0.01
1.56
0.36 0.50
5.26 5.19
0.010
1
2
3
4
5
6
Mt
CO
2e
Emissions over 20 year life cycle for EOR case 1- 10 years continuous
injection + 10 years recycle - Producing 100mmbbl oil
0.02 0.02 0.01
1.56
0.43
0.99
5.26 5.19
0.010
1
2
3
4
5
6
Mt
CO
2e
Emissions over 20 year life cycle for EOR case 2 - 20 years continuous
injection- Prod- 100mmbbl
Figure 21 – Breakdown of modelled CO2e emissions from processes included with the system boundary. Emissions represent total emissions from the 20 year life time of the operation. It is assumed that there is 0% geological leakage from the reservoir. EOR case 1 is represented in the top chart and EOR case 2 represented in the lower chart.

www.sccs.org.uk 42 of 62
4.3.3 Cumulative CO2 stored
Cumulative tonnages of CO2 imported, injected, recycled, lost and stored are displayed in table 10 below. Total CO2 losses displayed in the table represent CO2 lost from the system from both fugitive emissions and flaring/venting. Emissions from process equipment are not included in these figures. It is assumed that geological CO2 leakage through either the cap-rock or through abandoned wells is negligible for the studied time frame.
• In EOR case 1 5.75Mt of the imported 50Mt are estimated to escape from the system.
This equates to around 89% of the imported CO2 being permanently stored within the
20 year life span.
• In EOR case 2 6.25 Mt of the imported 100Mt are estimated to escape from the
system. This equates to 94% of the imported CO2 being permanently stored within the
system.
The total losses in each case are similar, even though the volumes of imported CO2 doubles between cases. This is due to the prominent effect of gas recycling on total emissions.
Total CO2
Imported (Mt)
Total CO2
Injected
(Mt)
Total CO2
recycled (Mt)
Total CO2
losses
(Mt)
CO2 stored at end of 20 year project life (Mt)
Percentage of imported CO2 stored
EOR Case 1
50 194 150 5.75 44.25 89%
EOR Case 2
100 244 150 6.25 93.75 94%
Table 10 – Cumulative tonnages of CO2 imported, injected, recycled, lost and stored for the 2 EOR cases. Total CO2 losses represent CO2 lost from the system from both fugitive emissions and flaring/venting. Emissions from process equipment are not included. Geological leakage is considered to be negligible over the 20 year case study.
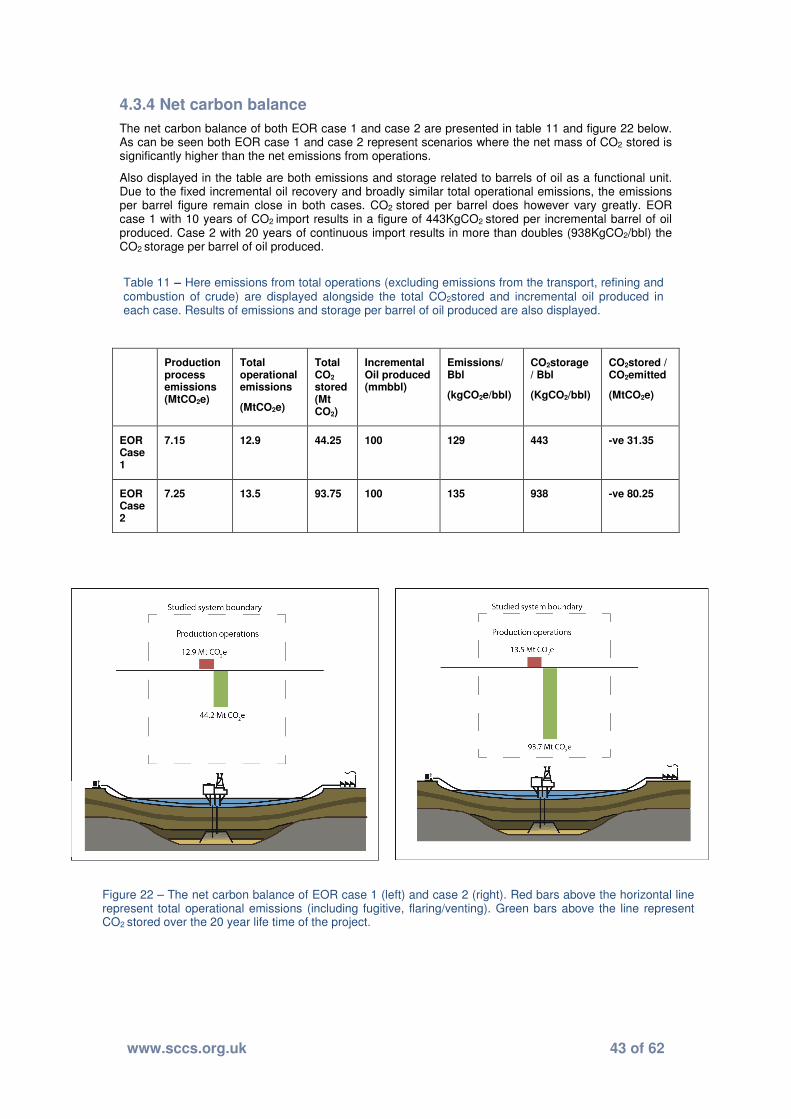
www.sccs.org.uk 43 of 62
4.3.4 Net carbon balance
The net carbon balance of both EOR case 1 and case 2 are presented in table 11 and figure 22 below. As can be seen both EOR case 1 and case 2 represent scenarios where the net mass of CO2 stored is significantly higher than the net emissions from operations.
Also displayed in the table are both emissions and storage related to barrels of oil as a functional unit. Due to the fixed incremental oil recovery and broadly similar total operational emissions, the emissions per barrel figure remain close in both cases. CO2 stored per barrel does however vary greatly. EOR case 1 with 10 years of CO2 import results in a figure of 443KgCO2 stored per incremental barrel of oil produced. Case 2 with 20 years of continuous import results in more than doubles (938KgCO2/bbl) the CO2 storage per barrel of oil produced.
Production process emissions (MtCO2e)
Total operational emissions
(MtCO2e)
Total CO2
stored (Mt CO2)
Incremental Oil produced (mmbbl)
Emissions/ Bbl
(kgCO2e/bbl)
CO2storage / Bbl
(KgCO2/bbl)
CO2stored / CO2emitted
(MtCO2e)
EOR Case 1
7.15 12.9 44.25 100 129 443 -ve 31.35
EOR Case 2
7.25 13.5 93.75 100 135 938 -ve 80.25
Table 11 – Here emissions from total operations (excluding emissions from the transport, refining and combustion of crude) are displayed alongside the total CO2stored and incremental oil produced in each case. Results of emissions and storage per barrel of oil produced are also displayed.
Figure 22 – The net carbon balance of EOR case 1 (left) and case 2 (right). Red bars above the horizontal line represent total operational emissions (including fugitive, flaring/venting). Green bars above the line represent CO2 stored over the 20 year life time of the project.
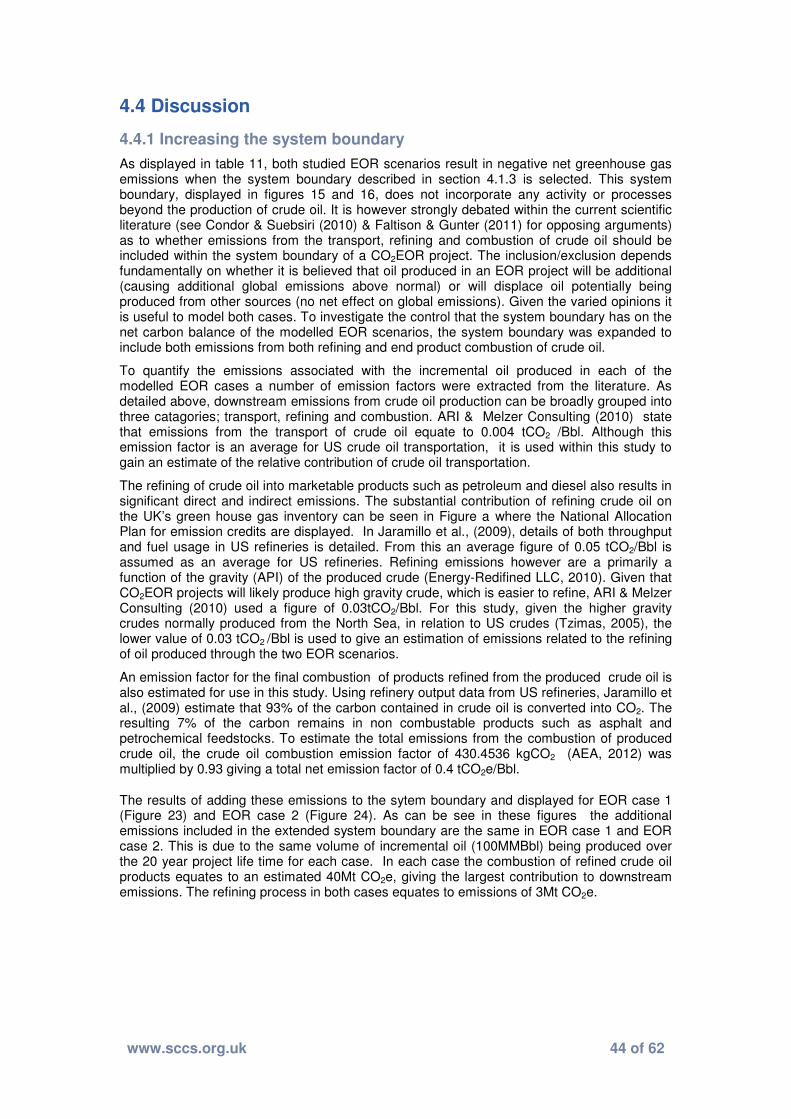
www.sccs.org.uk 44 of 62
4.4 Discussion
4.4.1 Increasing the system boundary
As displayed in table 11, both studied EOR scenarios result in negative net greenhouse gas emissions when the system boundary described in section 4.1.3 is selected. This system boundary, displayed in figures 15 and 16, does not incorporate any activity or processes beyond the production of crude oil. It is however strongly debated within the current scientific literature (see Condor & Suebsiri (2010) & Faltison & Gunter (2011) for opposing arguments) as to whether emissions from the transport, refining and combustion of crude oil should be included within the system boundary of a CO2EOR project. The inclusion/exclusion depends fundamentally on whether it is believed that oil produced in an EOR project will be additional (causing additional global emissions above normal) or will displace oil potentially being produced from other sources (no net effect on global emissions). Given the varied opinions it is useful to model both cases. To investigate the control that the system boundary has on the net carbon balance of the modelled EOR scenarios, the system boundary was expanded to include both emissions from both refining and end product combustion of crude oil.
To quantify the emissions associated with the incremental oil produced in each of the modelled EOR cases a number of emission factors were extracted from the literature. As detailed above, downstream emissions from crude oil production can be broadly grouped into three catagories; transport, refining and combustion. ARI & Melzer Consulting (2010) state that emissions from the transport of crude oil equate to 0.004 tCO2 /Bbl. Although this emission factor is an average for US crude oil transportation, it is used within this study to gain an estimate of the relative contribution of crude oil transportation.
The refining of crude oil into marketable products such as petroleum and diesel also results in significant direct and indirect emissions. The substantial contribution of refining crude oil on the UK’s green house gas inventory can be seen in Figure a where the National Allocation Plan for emission credits are displayed. In Jaramillo et al., (2009), details of both throughput and fuel usage in US refineries is detailed. From this an average figure of 0.05 tCO2/Bbl is assumed as an average for US refineries. Refining emissions however are a primarily a function of the gravity (API) of the produced crude (Energy-Redifined LLC, 2010). Given that CO2EOR projects will likely produce high gravity crude, which is easier to refine, ARI & Melzer Consulting (2010) used a figure of 0.03tCO2/Bbl. For this study, given the higher gravity crudes normally produced from the North Sea, in relation to US crudes (Tzimas, 2005), the lower value of 0.03 tCO2 /Bbl is used to give an estimation of emissions related to the refining of oil produced through the two EOR scenarios.
An emission factor for the final combustion of products refined from the produced crude oil is also estimated for use in this study. Using refinery output data from US refineries, Jaramillo et al., (2009) estimate that 93% of the carbon contained in crude oil is converted into CO2. The resulting 7% of the carbon remains in non combustable products such as asphalt and petrochemical feedstocks. To estimate the total emissions from the combustion of produced crude oil, the crude oil combustion emission factor of 430.4536 kgCO2 (AEA, 2012) was multiplied by 0.93 giving a total net emission factor of 0.4 tCO2e/Bbl.
The results of adding these emissions to the sytem boundary and displayed for EOR case 1 (Figure 23) and EOR case 2 (Figure 24). As can be see in these figures the additional emissions included in the extended system boundary are the same in EOR case 1 and EOR case 2. This is due to the same volume of incremental oil (100MMBbl) being produced over the 20 year project life time for each case. In each case the combustion of refined crude oil products equates to an estimated 40Mt CO2e, giving the largest contribution to downstream emissions. The refining process in both cases equates to emissions of 3Mt CO2e.
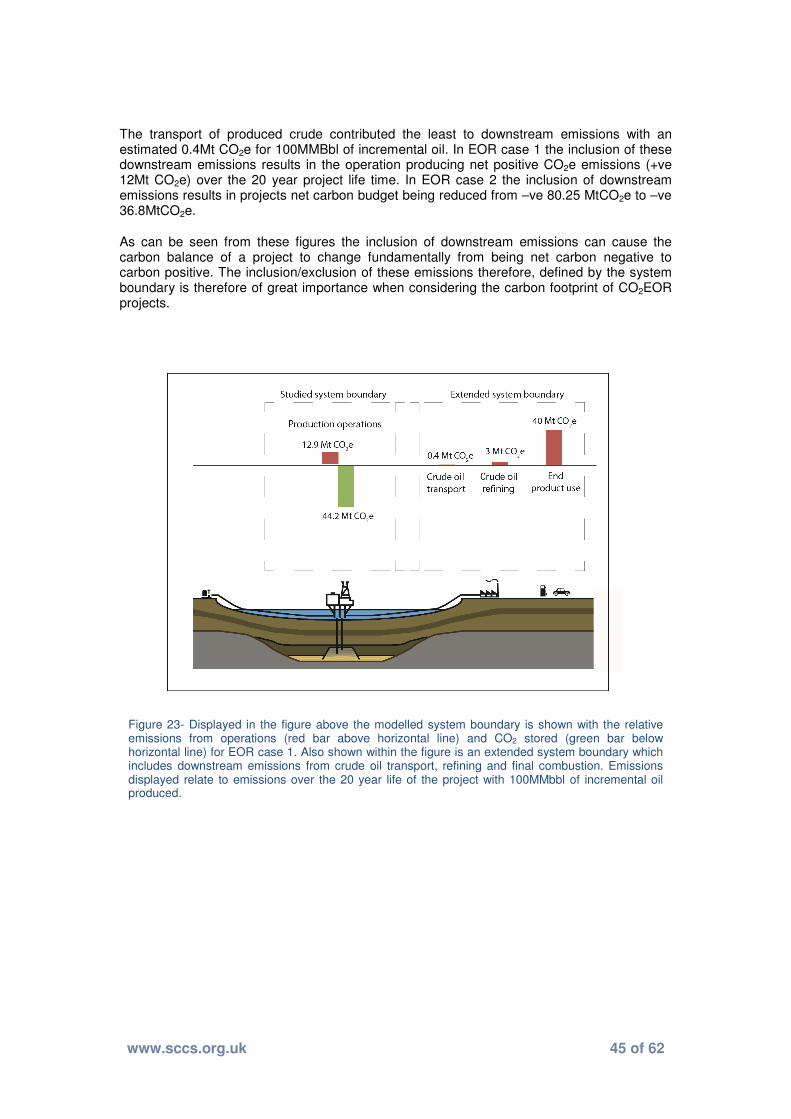
www.sccs.org.uk 45 of 62
The transport of produced crude contributed the least to downstream emissions with an estimated 0.4Mt CO2e for 100MMBbl of incremental oil. In EOR case 1 the inclusion of these downstream emissions results in the operation producing net positive CO2e emissions (+ve 12Mt CO2e) over the 20 year project life time. In EOR case 2 the inclusion of downstream emissions results in projects net carbon budget being reduced from –ve 80.25 MtCO2e to –ve 36.8MtCO2e.
As can be seen from these figures the inclusion of downstream emissions can cause the carbon balance of a project to change fundamentally from being net carbon negative to carbon positive. The inclusion/exclusion of these emissions therefore, defined by the system boundary is therefore of great importance when considering the carbon footprint of CO2EOR projects.
Figure 23- Displayed in the figure above the modelled system boundary is shown with the relative emissions from operations (red bar above horizontal line) and CO2 stored (green bar below horizontal line) for EOR case 1. Also shown within the figure is an extended system boundary which includes downstream emissions from crude oil transport, refining and final combustion. Emissions displayed relate to emissions over the 20 year life of the project with 100MMbbl of incremental oil produced.
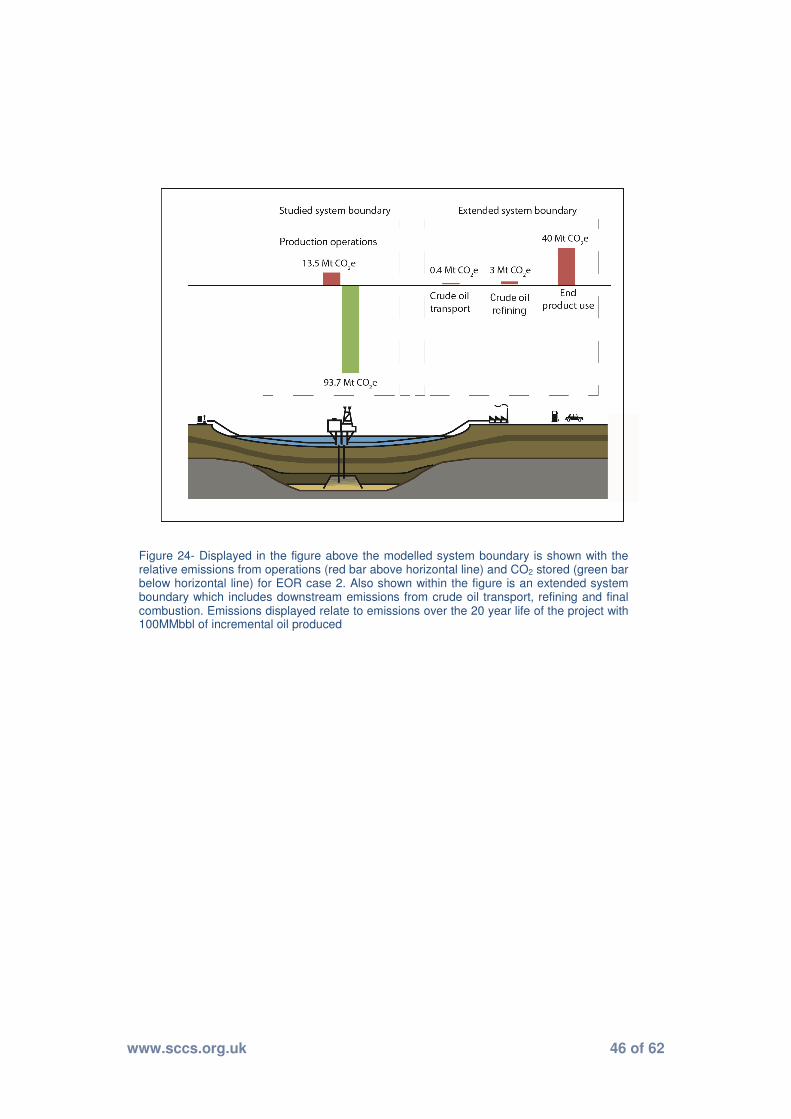
www.sccs.org.uk 46 of 62
Figure 24- Displayed in the figure above the modelled system boundary is shown with the relative emissions from operations (red bar above horizontal line) and CO2 stored (green bar below horizontal line) for EOR case 2. Also shown within the figure is an extended system boundary which includes downstream emissions from crude oil transport, refining and final combustion. Emissions displayed relate to emissions over the 20 year life of the project with 100MMbbl of incremental oil produced
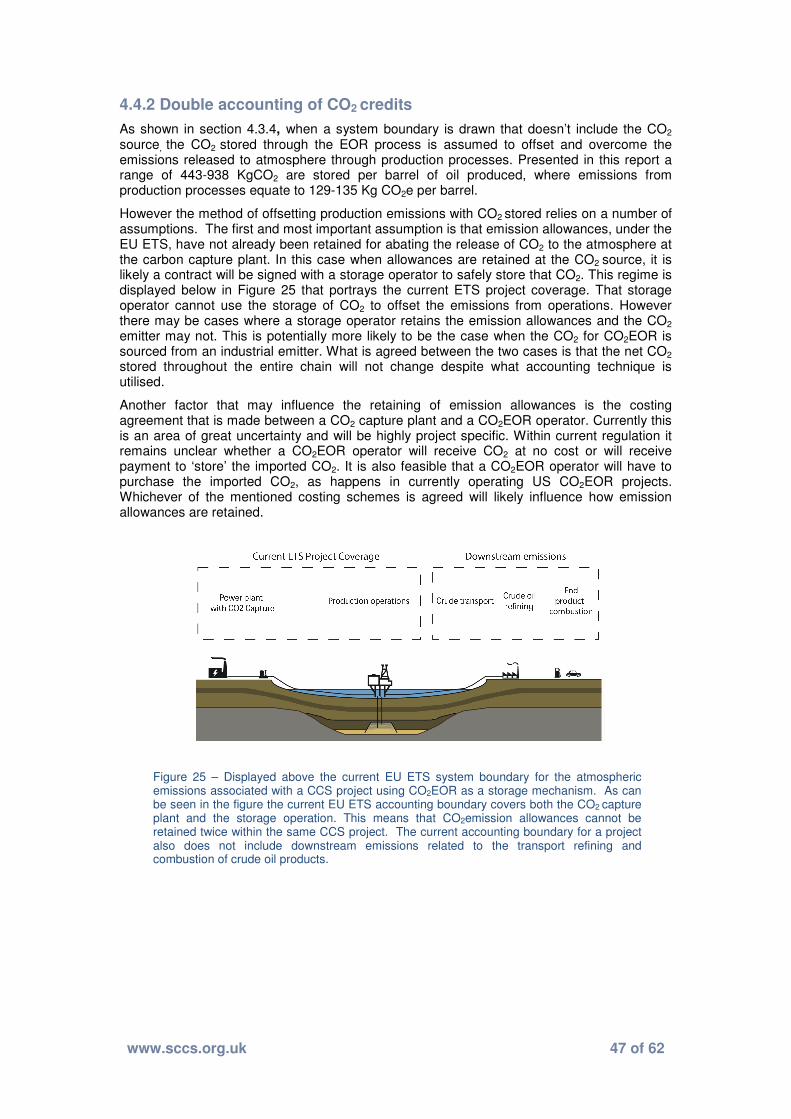
www.sccs.org.uk 47 of 62
4.4.2 Double accounting of CO2 credits
As shown in section 4.3.4, when a system boundary is drawn that doesn’t include the CO2 source, the CO2 stored through the EOR process is assumed to offset and overcome the emissions released to atmosphere through production processes. Presented in this report a range of 443-938 KgCO2 are stored per barrel of oil produced, where emissions from production processes equate to 129-135 Kg CO2e per barrel.
However the method of offsetting production emissions with CO2 stored relies on a number of assumptions. The first and most important assumption is that emission allowances, under the EU ETS, have not already been retained for abating the release of CO2 to the atmosphere at the carbon capture plant. In this case when allowances are retained at the CO2 source, it is likely a contract will be signed with a storage operator to safely store that CO2. This regime is displayed below in Figure 25 that portrays the current ETS project coverage. That storage operator cannot use the storage of CO2 to offset the emissions from operations. However there may be cases where a storage operator retains the emission allowances and the CO2 emitter may not. This is potentially more likely to be the case when the CO2 for CO2EOR is sourced from an industrial emitter. What is agreed between the two cases is that the net CO2 stored throughout the entire chain will not change despite what accounting technique is utilised.
Another factor that may influence the retaining of emission allowances is the costing agreement that is made between a CO2 capture plant and a CO2EOR operator. Currently this is an area of great uncertainty and will be highly project specific. Within current regulation it remains unclear whether a CO2EOR operator will receive CO2 at no cost or will receive payment to ‘store’ the imported CO2. It is also feasible that a CO2EOR operator will have to purchase the imported CO2, as happens in currently operating US CO2EOR projects. Whichever of the mentioned costing schemes is agreed will likely influence how emission allowances are retained.
Figure 25 – Displayed above the current EU ETS system boundary for the atmospheric emissions associated with a CCS project using CO2EOR as a storage mechanism. As can be seen in the figure the current EU ETS accounting boundary covers both the CO2 capture plant and the storage operation. This means that CO2emission allowances cannot be retained twice within the same CCS project. The current accounting boundary for a project also does not include downstream emissions related to the transport refining and combustion of crude oil products.
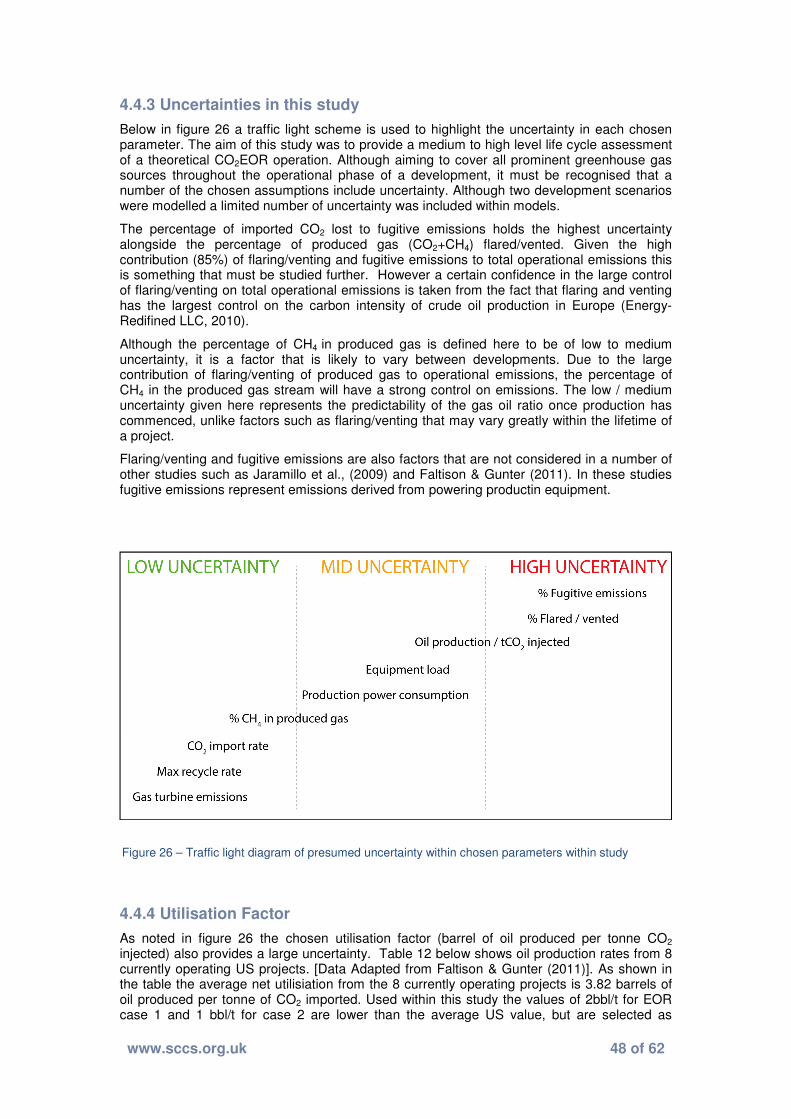
www.sccs.org.uk 48 of 62
4.4.3 Uncertainties in this study
Below in figure 26 a traffic light scheme is used to highlight the uncertainty in each chosen parameter. The aim of this study was to provide a medium to high level life cycle assessment of a theoretical CO2EOR operation. Although aiming to cover all prominent greenhouse gas sources throughout the operational phase of a development, it must be recognised that a number of the chosen assumptions include uncertainty. Although two development scenarios were modelled a limited number of uncertainty was included within models.
The percentage of imported CO2 lost to fugitive emissions holds the highest uncertainty alongside the percentage of produced gas (CO2+CH4) flared/vented. Given the high contribution (85%) of flaring/venting and fugitive emissions to total operational emissions this is something that must be studied further. However a certain confidence in the large control of flaring/venting on total operational emissions is taken from the fact that flaring and venting has the largest control on the carbon intensity of crude oil production in Europe (Energy-Redifined LLC, 2010).
Although the percentage of CH4 in produced gas is defined here to be of low to medium uncertainty, it is a factor that is likely to vary between developments. Due to the large contribution of flaring/venting of produced gas to operational emissions, the percentage of CH4 in the produced gas stream will have a strong control on emissions. The low / medium uncertainty given here represents the predictability of the gas oil ratio once production has commenced, unlike factors such as flaring/venting that may vary greatly within the lifetime of a project.
Flaring/venting and fugitive emissions are also factors that are not considered in a number of other studies such as Jaramillo et al., (2009) and Faltison & Gunter (2011). In these studies fugitive emissions represent emissions derived from powering productin equipment.
4.4.4 Utilisation Factor
As noted in figure 26 the chosen utilisation factor (barrel of oil produced per tonne CO2 injected) also provides a large uncertainty. Table 12 below shows oil production rates from 8 currently operating US projects. [Data Adapted from Faltison & Gunter (2011)]. As shown in the table the average net utilisiation from the 8 currently operating projects is 3.82 barrels of oil produced per tonne of CO2 imported. Used within this study the values of 2bbl/t for EOR case 1 and 1 bbl/t for case 2 are lower than the average US value, but are selected as
Figure 26 – Traffic light diagram of presumed uncertainty within chosen parameters within study

www.sccs.org.uk 49 of 62
conservative estimates for an offshore North Sea CO2EOR project9.
Values selected for the oil production rate are also not thought to substantially effect the emissions profile (with studied system boundary) of a project. Given that 85% of emissions are related to the gas recycle process which is here modelled to be broadly independent of the oil rate.
Varying the oil production rate does however have a large control on the values of emissions per barrel. As shown in table 11 EOR case 1 and 2 produce oil with a emissions inensity of 129 and 135 KgCO2e/bbl respectively. Using an oil production rate more similar to the US average (3.82) would substantially reduce the emissions intensity of oil produced (See Table 12). A similar thoery is presented in Hertwich et al., (2008) where the carbon intensity of produced CO2EOR oil is predicted to decrease due to to larger contribution of increased production in relation to the increase in emissions over conventional production.
However when the system boundary is extended (See section 4.4.1) the emissions associated with increasing the oil production profile will increase due to addition of emissions associated with crude transport, refining and combustion.
Key Point
Increasing oil production rate improves oil carbon intensity (lower CO2e/bbl) but produces a more positive carbon balance when the system boundary is extended.
Project Years Active
Incremental Oil (MMBbl)
CO2
purchased (Mt)
CO2
injected (Mt)
CO2
produced (Mt)
CO2
stored (Mt)
Gross Utilisation
(Bbl/t)
Net Utilisation
(Bbl/t)
Dollarhide 10 12 2.99 3.52 0.53 2.99 4.49 5.28
Lost Soldier
6 13.6 3.33 9.37 6.03 3.33 1.45 4.08
SACROC- 4 Pattern
5 2.740 0.74 1.31 0.58 0.74 2.09 3.73
SACROC- 17 Pattern
5 5.930 0.92 1.38 0.46 0.92 4.32 6.47
North Cross Unit
19 11 4.13 6.77 2.65 4.13 1.62 2.67
North Ward Estates
6 6.3 2.63 4.99 2.37 2.63 1.26 2.40
Joffre Viking
19 3.6 0.84 2.15 1.31 0.84 1.68 4.28
Wasson Denver
9 58 34.50 39.26 4.76 34.50 1.48 1.68
Average Net Utilisation
2.3 3.82
9 These values were selected after personal communication with a potential North Sea CO2EOR
operator.
Table 12 - Gross and net CO2 utilisation in US onshore CO2EOR projects. Data taken and adapted from Faltison et al (2011). (n.b. conversion of 1 tonne CO2 = 18.9Mscf used)
www.sccs.org.uk 50 of 62
4.4.5 Exploring the control of flared/vented produced gas
The percentage of produced gas (CO2 + CH4) that is flared or vented due to maintenance, safety or injectivity issues during CO2EOR operations, as discussed before, holds a high uncertainty. The value of 3.5% selected for this study is based on an average for currently operating fields in the North Sea, many of which may utilise different operating procedures when handling produced associated gas. Given the high contribution of emissions from flaring and venting on total operational emissions found within this study (80%) a sensitivity test was completed to explore the effect of reducing levels of flaring and venting. Two flaring/venting cases of 1% and 0% were modelled alongside 3.5% used within the study. The likelihood of a development flaring/venting near 0% of produced gases over the project lifetime is likely achievable, and here is modelled to show how advancements in engineering (low pressure gas gathering, interim storage etc.) may allow oil operations to develop with dramatically reduced flaring/venting.
The reduction of flaring/venting has the potential to significantly reduce operational emissions from 12.9MtCO2e to 5.4MtCO2e for EOR case 1 and from 13.5MtCO2e to 6MtCO2e for EOR case 2 over the project life time (see figure 27 below). Not only does the reduction of flaring/venting reduce the operational emissions, levels of net CO2 stored are also seen to increase significantly. With flaring/venting reduced to 1%, EOR case 1 stores 48Mt of the 50Mt imported. EOR case 2 stores 97.5Mt of the 100Mt imported (see figure 27). This study highlights the significant control that flaring/venting has on a developments emissions profile, and emphasises the importance of reducing, where possible, the flaring/venting of produced gases. We believe that this issue has not been properly considered when both assessing historical onshore projects and when considering new offshore CO2EOR developments. With the inevitability that some reproduced gases will have to be flared/vented rather than re-injected over a project lifetime, it is likely that future CO2EOR developments will have to compare the costs of emitting against the costs of engineering solutions to reduce those emissions.
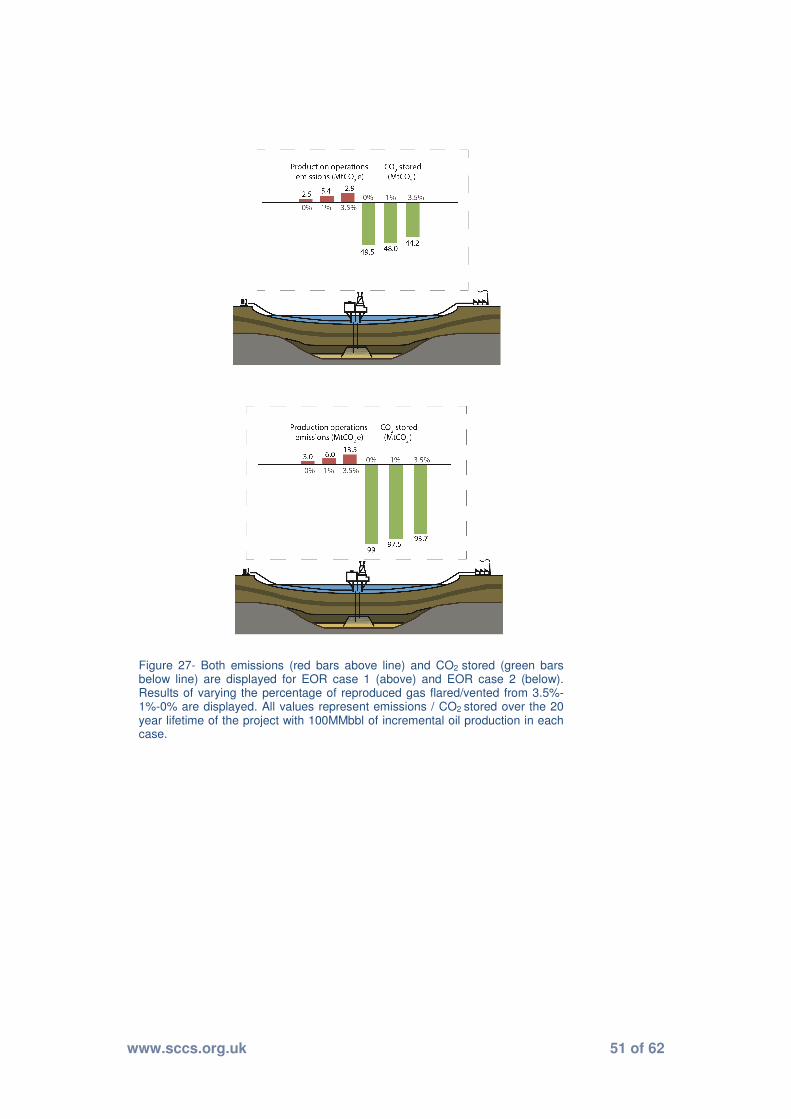
www.sccs.org.uk 51 of 62
Figure 27- Both emissions (red bars above line) and CO2 stored (green bars below line) are displayed for EOR case 1 (above) and EOR case 2 (below). Results of varying the percentage of reproduced gas flared/vented from 3.5%-1%-0% are displayed. All values represent emissions / CO2 stored over the 20 year lifetime of the project with 100MMbbl of incremental oil production in each case.
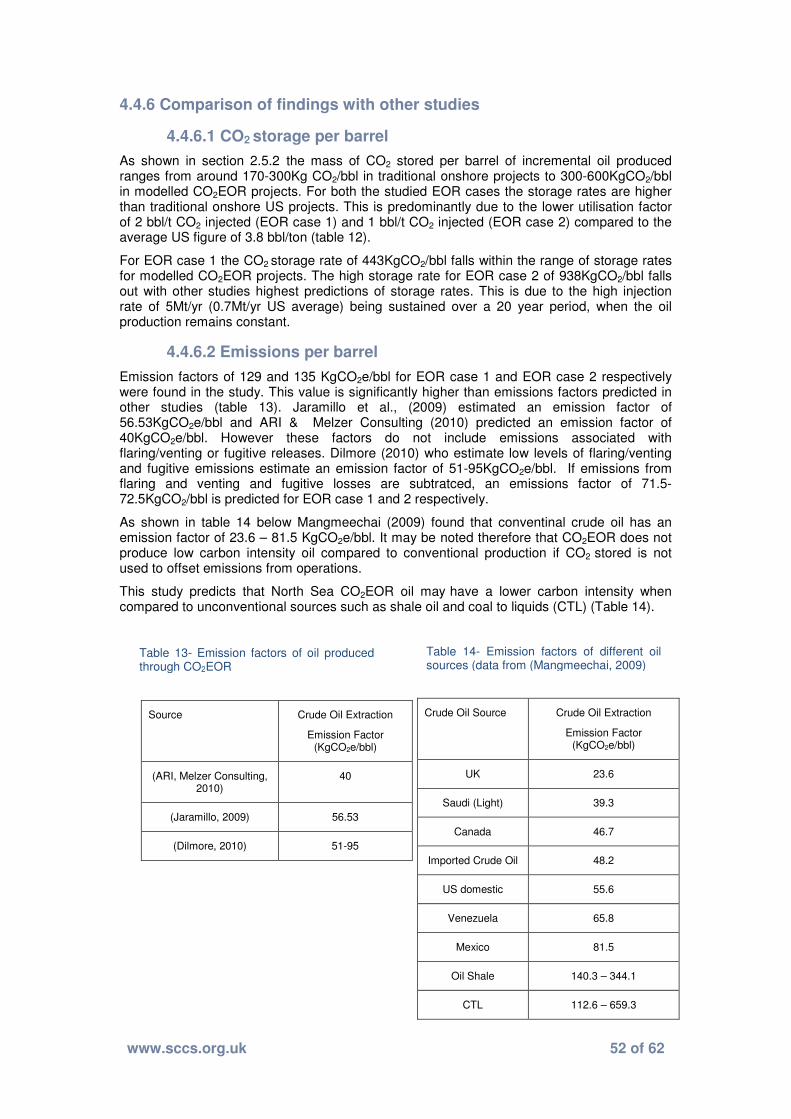
www.sccs.org.uk 52 of 62
4.4.6 Comparison of findings with other studies
4.4.6.1 CO2 storage per barrel
As shown in section 2.5.2 the mass of CO2 stored per barrel of incremental oil produced ranges from around 170-300Kg CO2/bbl in traditional onshore projects to 300-600KgCO2/bbl in modelled CO2EOR projects. For both the studied EOR cases the storage rates are higher than traditional onshore US projects. This is predominantly due to the lower utilisation factor of 2 bbl/t CO2 injected (EOR case 1) and 1 bbl/t CO2 injected (EOR case 2) compared to the average US figure of 3.8 bbl/ton (table 12).
For EOR case 1 the CO2 storage rate of 443KgCO2/bbl falls within the range of storage rates for modelled CO2EOR projects. The high storage rate for EOR case 2 of 938KgCO2/bbl falls out with other studies highest predictions of storage rates. This is due to the high injection rate of 5Mt/yr (0.7Mt/yr US average) being sustained over a 20 year period, when the oil production remains constant.
4.4.6.2 Emissions per barrel
Emission factors of 129 and 135 KgCO2e/bbl for EOR case 1 and EOR case 2 respectively were found in the study. This value is significantly higher than emissions factors predicted in other studies (table 13). Jaramillo et al., (2009) estimated an emission factor of 56.53KgCO2e/bbl and ARI & Melzer Consulting (2010) predicted an emission factor of 40KgCO2e/bbl. However these factors do not include emissions associated with flaring/venting or fugitive releases. Dilmore (2010) who estimate low levels of flaring/venting and fugitive emissions estimate an emission factor of 51-95KgCO2e/bbl. If emissions from flaring and venting and fugitive losses are subtratced, an emissions factor of 71.5-72.5KgCO2/bbl is predicted for EOR case 1 and 2 respectively.
As shown in table 14 below Mangmeechai (2009) found that conventinal crude oil has an emission factor of 23.6 – 81.5 KgCO2e/bbl. It may be noted therefore that CO2EOR does not produce low carbon intensity oil compared to conventional production if CO2 stored is not used to offset emissions from operations.
This study predicts that North Sea CO2EOR oil may have a lower carbon intensity when compared to unconventional sources such as shale oil and coal to liquids (CTL) (Table 14).
Source Crude Oil Extraction
Emission Factor (KgCO2e/bbl)
(ARI, Melzer Consulting, 2010)
40
(Jaramillo, 2009) 56.53
(Dilmore, 2010) 51-95
Crude Oil Source Crude Oil Extraction
Emission Factor (KgCO2e/bbl)
UK 23.6
Saudi (Light) 39.3
Canada 46.7
Imported Crude Oil 48.2
US domestic 55.6
Venezuela 65.8
Mexico 81.5
Oil Shale 140.3 – 344.1
CTL 112.6 – 659.3
Table 13- Emission factors of oil produced through CO2EOR
Table 14- Emission factors of different oil sources (data from (Mangmeechai, 2009)

www.sccs.org.uk 53 of 62
4.4.6.3 Emissions per kilogram of CO2stored
Emission factors for CO2 storage (gCO2e/Kg CO2stored) were found to be 144 – 291gCO2e/Kg for EOR case 1 and 2 respectively. This compares to storage emission factors of 259-368gCO2e/Kg CO2 from 5 currently operating onshore US CO2EOR projects (Data extracted from (Jaramillo et al., 2009)). The low values found in this study are due to the high continuous CO2 injection rates modelled in EOR case 1 and 2, compared to lower volume WAG injection in traditional onshore projects.
However due to the recycling process it is likely that emissions related to CO2 storage in all EOR cases, will be higher than in isolated CO2 storage projects. Wildbolz (2007) concluded that greenhouse gases associated with transporting and injecting CO2 into both saline aquifers and depleted gas fields equated to an emission factor of 5-18gCO2e/KgCO2stored.
4.5 Future Work
• A sensitivity analysis would be beneficial to help understand what parameters used within the study have the largest control on the carbon balance.
• Adding additional time scenarios along with varying more parameters within current scenarios would also be beneficial (i.e + CH4 separation, artificial lift, diesel powered equipment)
• To model alternative injection strategies such as water alternating gas (WAG) and further assess how the injection strategy can affect the carbon balance of a CO2EOR development.
• To further assess the variations between saline aquifer storage and CO2EOR
operations in storing CO2. It may be interesting to estimate further how activities such as venting and fugitive emissions may affect saline aquifer storage.
• The use of a reservoir simulator to compute both injected and produced volumes may
allow for more specific estimates of both operational emissions and CO2 storage to be made.

www.sccs.org.uk 54 of 62
4.6 Conclusions
• For the studied system boundary (excludes refining, transport and combustion of
produced crude) both EOR cases store more CO2 than was emitted through
operations. Emissions from each case were 12.9 and 13.5 MtCO2e for EOR case 1
and 2 respectively with 44.2 and 93.7 Mt of CO2 being stored. (For 100mmbbl
incremental oil production in each case).
• Operational emissions for each injection case do not vary greatly even when volumes
of CO2 stored over the 20 year period more than double. This is due to the recycle
process, which has the largest control on emissions, remaining constant between
each case. It is therefore strongly favorable to continue CO2 injection into a field even
if oil production will not increase at the same rate. Extending CO2 injection beyond the
twenty year period, when all EOR operations (recycling) has ceased would improve
the carbon balance even further.
• Flaring and venting is found to have a significant contribution to an operations total
greenhouse gas emissions. For both EOR cases modelled flaring/venting of produced
gases contributed to around 81% and 79% of total greenhouse gas emissions
respectively. Given this large contribution and the uncertainty in the percentage of
produced gas that will be flared/vented, this area has been investigated further (See
“A Review of Flaring and Venting at UK Offshore Oilfields” (SCCS, 2014)). Models
were also run with reduced rates of flaring and venting of reproduced gases (1% and
0%). It is thought that these flaring/venting rates are likely achievable and any new
CO2EOR development should strive to reach those lower rates.
• Due to fugitive losses of imported CO2 and venting of reproduced CO2, 89% and 94%
of all imported CO2 is permanently stored over the 20 year operational phase for each
case respectively.
• EOR case 1 and 2 store 443kgCO2/bbl and 938kgCO2/bbl respectively. Due to oil
production not increasing linearly with the volume of CO2 injected it can be seen that
injecting CO2 over longer periods can more than double the mass of CO2 stored per
barrel of incremental oil produced.
• When CO2 storage is not used to offset emissions from incremental oil production the
carbon intensity of CO2EOR oil is not lower than oil produced through conventional
operations. This study estimates that oil produced through CO2EOR in the North Sea
will have a carbon intensity of 129-135kgCO2e/bbl. These values could be lowered
with the reduction of flaring/venting or reproduced gases. Oil produced from CO2EOR
may however have a lower carbon intensity than other unconventional sources.
• The reporting metric of a study has the ability to alter the perceived environmental
performance of an operation. When environmental performance is judged by
embedded carbon of oil produced (CO2e/bbl) the utilization factor chosen is of great
importance. (Increased oil production with no modelled change in emissions results in
lower carbon intensity oil production)
www.sccs.org.uk 55 of 62
• Selecting a system boundary has a large control on the carbon balance of CO2EOR
projects. When the theory of additionality is followed and emissions from the transport,
refining and combustion of produced crude oil are included within the system
boundary, CO2EOR projects in the UKCS may have a positive carbon balance. This
study concluded that a period of CO2 injection beyond the period required to enhance
oil recovery was needed to produce a negative carbon balance for the studied system
boundary.
• Double accounting of CO2 emission credits under the ETS must be considered. If
allowances are retained for CO2 reduction at the capture plant then CO2 stored at the
EOR operation cannot be used to offset the emissions from oil production.
• Completing a sensitivity analysis on the results of this study would be beneficial in
clarifying what parameters have the largest control on the carbon footprint of an
offshore CO2EOR project.
Acknowledgements
Thanks to members of the SCCS for advice and assistance with conceptualising life cycle analysis. Funding was provided to SCCS by a group of government and oil company sponsors. But those sponsors have no control over the reporting of research results.

www.sccs.org.uk 56 of 62
References
AEA. (2012). 2012 Guidelines to Defra/DECC's GHG Conversion Factors for Company Reporting. DEFRA.
ARI. (2009). Electricity Use of Enhanced Oil Recovery with Carbon Dioxide. Pittsburgh: National Energy Technology Laboratory.
ARI, Melzer Consulting. (2010). Optimization of CO2 Storage in Enhanced Oil Recovery Projects. London: Department of Energy and Climate Change, Office of CCS.
Baumann, H. T. (2004). The Hitchhiker's Guide to LCA. Student litteratur Publishing Group.
BP. (2012). BP Statistical Review of World Energy. BP.
BP. (2013). Reducing emissions in the Norwegian North Sea. http://www.bp.com/sectiongenericarticle800.do?categoryId=9040506&contentId=7067661.
Christensen, R., Stenby, E.H., Skauge, A. (1998). Review of WAG field experience. Proceedings of the International petroleum conference and exhibition of Mexico . Villahermosa: SPE.
Condor, J. & Suebsiri, J. (2010). Carbon Footprint and Principle of Additionality in CO2-EOR Projects: The Weyburn Case. SPE Caribbean Petroleum Engineering Conference . Lima: Society of Petroleum Engineers.
Consoli, F. A. (1993). Guidelines for Life-Cycle Assessment: A code of practice. Society of Environmental Toxicology and Chemistry, Pensacola, Florida.
Davis, D., Scott, M., Roberson, K., Robinson, A. (2011). Large scale CO2 Flood begins along Texas Gulf Coast. SPE Enhanced Oil Recovery Conference. Kuala Lumpur, Malaysia: SPE.
DECC. (2011). The UK's National Implementation Measures for Phase III of the EU Emission Trading System. . http://www.decc.gov.uk/assets/decc/11/cutting-emissions/eu-ets/3846-uk-nat-imp-measures-phase3-euets.pdf.
DECC. (2012a). DECC GHG Energy Tables.
DECC. (2012b). EEMS Atmospheric Guidance Notes. Retrieved from http://og.decc.gov.uk/assets/og/environment/eems/tech-docs/atmos.pdf
DECC. (2012c, October 30). Press release- Short list for UK's £1Bn CCS competition announced.
DEFRA. (2012). EU Emissions Trading Scheme Phase II National Allocation Plan.
Dilmore, R. (2010). An Assessment of Gate-to-Gate Environmental Life Cycle Performance of Water-Alternating-Gas CO2-Enhanced Oil Recovery in the Permian Basin. DOE/NETL.
EC. (2003). Establishing a scheme for greenhouse gas emission allowance trading within the Community. Official Journey of the European Union.
EEMS, Oil and Gas UK, DECC. (2008). EEMS, Atmospheric Emissions Calculations. Retrieved from http://og.decc.gov.uk/assets/og/environment/eems/tech-docs/atmos.pdf
Element Energy. (2012). The impacts of CO2-enhanced oil recovery for Scotland. Cambridge: working report.
Energy-Redifined LLC. (2010). The Carbon Intensity of Crude Oil in Europe. The International Council on Clean Transportation.
Faltison, J., Gunter, B. (2011). Net CO2 Stored in North American EOR Projects. Society of Petroleum Engineers, Canadian Unconventional Resources and International Petroleum Conference. Calgary : SPE, 2011.
Gomersall, S. J. (2009, June). http://co2deepstore.com/news-items/OGES-CCS-paper-v2.pdf. Retrieved from www.co2deepstore.com: http://co2deepstore.com/news-items/OGES-CCS-paper-v2.pdf
Goodyear, S.G. Hawkyard, I.R., Masters, J.H.K., Woods, C.L., Jayasekera, A.J. (2003). Subsurface Issues for CO2 Flooding of UKCS reservoirs. Institution of Chemical Engineers,
www.sccs.org.uk 57 of 62
2003.
Goodyear, S.G., Koster, M.P., Marriott, K.A., Paterson, A., Sipkema, A.W., Young, I.M. (2011). Moving CO2 EOR offshore. SPE Offshore Europe Oil And Gas conference. Aberdeen: SPE.
Hansen, H., Eiken, O., Aasum, T. (2005). Tracing the Path of CO2 from a gas/condensate reservoir Through an Amine Plant and Back into a Subsurface Aquifer-Case Study: The Sleipner Area, Norwegian North Sea . Offshore Europe . Aberdeen : SPE.
Heijungs, R., Guinee, J.B., Huppes, G., Lankreijer, R.M., Udo de Haes, H.A., Wegener Sleeswijk, A., Ansems, A.M.M., Eggels, P.G., Duin, R., Goede, H.P. (1992). Environmental Life-Cycle Assessment of Products: Guide and backgrounds (Part 1. Center of Environmental Science, Leiden, Netherlands. .
Hertwich, E.G., Aaberg, M., Singh, B., Stromman, A. (2008). Life-cycle Assessment of Carbon Dioxide Capture for Enhanced Oil Recovery. Chinese Journal of Chemical Engineering 16 (3): 343-353
IMO. (2005). International Convention for the Prevention of Pollution from Ships (MARPOL). http://www.imo.org/about/conventions/listofconventions/pages/international-convention-for-the-prevention-of-pollution-from-ships-(marpol).aspx.
IPCC. (2005). Special Report on Carbon dioxide Capture and Storage. New York : Cambridge University Press.
IPCC. (2007). Fourth Assessment Report. Working Group I: The Physical Science Basis. IPCC.
ISO. (1997). ISO 14040 "Environmental management- Life cycle assessment- Principles and Framework. International Standard Organization.
Jaramillo, P., Griffin, M., McCoy, S. (2009). Life Cycle Inventory of CO2 in an Enhanced Oil Recovery System. Environmental Science and Technology, 49, pp 8027-8032.
Mangmeechai, A. (2009). Life cycle greenhouse gas emissions, consumptive water use and levelised costs of unconventional oil in North America. Pittsburgh: Carnegie Mellon University.
Oil and Gas Journal. (2012). Worldwide EOR Survey.
IPCC. (2007). Offshore Petroleum Production and Pipe-lines (Assessment of Environmental Effects) (Amendment) Regulations 2007. http://www.legislation.gov.uk/uksi/2007/933/regulation/1/made.
Petroleum Act. (1998). Petroleum Act. http://www.legislation.gov.uk/ukpga/1998/17/contents.
Rogers & Grigg. (2000). A literature analysis of the WAG injectivity abnormalities in the CO2 process. Proceedings of the SPE/DOE Symposium. Tusla: SPE.
SCCS. (2014). A Review of Flaring and Venting at UK Offshore Oilfields: An analogue for offshore Carbon Dioxide Enhanced Oil Recovery Projects. June 2014.
Tzimas, E. (2005). Enhanced Oil Recovery using Carbon Dioxide in the European Energy System. Petten: European Joint Research Centre.
Wildbolz, C. (2007). Life Cycle Assessment of Selected Technologies for CO2 Transport and Sequestration. Swiss Federal Institute of Technology.
Yang, C.,Romanuk, K., Holt, R., Lindner, J., Smith, L., Trevino, R., Roecker., F., Xia, Y., Rickerts, J., Hovorka, S. (2012). "Large Volume of CO2 Injection at the Cranfield, Early Field Test of the SECARB Phase III: Near-Surface Monitoring. Carbon management technology conference. Orlando, Florida: Society of Petroleum Engineers.
Zhou, D., Meisong, Y., Calvin, M. (2012). Optimisation of a mature CO2 Flood- From continuous injection to WAG. SPE Improved oil recovery Symposium. Tusla, Oklahoma: Society of Petroleum Engineers.

www.sccs.org.uk 58 of 62
Appendix
Previous work on the carbon balance of CO2EOR
Here previous work that has attempted to address the carbon balance of CO2EOR projects is summarised. Both reports and academic papers were sourced predominantly through the Google search engine, using a number of key words (Enhanced oil recovery, carbon, CO2, life cycle assessment). Although the works summarised in this section may not be fully comprehensive, to the best of the authors knowledge, the works listed represent all academic and industry reports to date that have contributed significantly to research in this field. The author’s discretion was used in this process. There are many studies that have addressed both the Carbon Capture and Storage system boundary and conventional oil production. Here however, 8 works that directly address a life cycle assessment of CO2EOR processes are summarised with details on: Title, Author, Year, Real/theoretical data, Location, Focus of Study and Key Findings.
In reviewing these studies it has become clear that they often discuss slightly different aspects and are therefore difficult to directly compare. The complex nature of life cycle assessment also means that a number of assumptions have to be made within calculations. This often due to a lack of availability of data, results in many studies having to make assumptions for different values. Weisser (2008) attempts to detail the specific parameters that have the ability to affect the results of fossil fuel LCAs.
• Fuel Characteristics (e.g. carbon content and calorific value)
• Fuel extraction practices (e.g. affect transport and methane release)
• Energy carrier transmission/transport losses (e.g. pipeline)
• Conversion efficiency
• Fuel mix for electricity needs associated with fuel supply and plant construction / decommissioning
• Installation rate and efficiency of emission control devices
• Lifetime and load factor
As discussed in the main text of this review, findings from the studies assessed showed that varying system boundaries has the largest control on the results of the life cycle assessments. Within the majority of studies reviewed similar life cycle assessment methodologies were used. One issue that this review has attempted to tackle however, is the manner in which results are presented. Often studies attempt to summarise emission factors or storage factors using a different units e.g (Kg CO2 e/bbl), (kg CO2 /Mwh), (m
3 CO2 / m
3 oil). Although these
units can be converted, it has the potential to cause confusion when comparing the results from life cycle assessments. 1) Title: Net CO2 stored in North American EOR Projects Author: Faltison, J., Gunter, B. Year: 2011 Publisher: Society of Petroleum Engineers Real data / theoretical: Real – data taken from literature for 8 CO2EOR projects Location: United States Focus of Study: To evaluate the effectiveness of CO2EOR in reducing CO2 emissions Key Findings: After evaluating real data from 8 US onshore CO2EOR projects the study found that these projects do store net positive CO2 in the subsurface. The study took into account direct fugitive emissions that are solely related to CO2EOR activity. Emissions from standard primary and water-flood equipment were not included. They found that the bulk of emissions related to powering equipment used for compression and gas separation. The study strongly portrays that CO2 emissions resulting from downstream refining and consumption of transportation products should not be included in the calculation of net CO2 stored by CO2EOR projects. The study states that world oil production is determined by world oil

www.sccs.org.uk 59 of 62
demand, and that if CO2EOR operations were not undertaken, another source of oil would step forward to fill the gap. They therefore believe that EOR production will not result in incremental aggregate refining and consumption emissions, and therefore these emissions should not be included carbon balance calculations. They then state that if this assumption is made, it is clear that CO2EOR projects are net stores of CO2 over the project lifetime.
2) Title: Life Cycle Inventory of CO2 in an Enhanced Oil Recovery System Author: Jaramillo, P. Griffin, M.W., McCoy, S.T. Year: 2009 Publisher: Environmental Science and Technology Real data / theoretical data: Real- data for 5 US CO2 EOR projects are used as case studies Location: United States Focus of Study: “To assess the overall life cycle emissions associated with sequestration via CO2- flood EOR under a number of different scenarios and explores the impact of various methods for allocating CO2 system emissions and the benefits of sequestration”. Key Findings: The study presents 5 case studies based on both assumed theoretical data for electricity generation at a power plant with carbon capture, and real data taken from 5 operational CO2EOR projects in the US. The case studies model emissions from all stages of the CO2EOR system boundary, as shown in Figure 1. The study found that the largest source of emissions in the system boundary was the ultimate combustion of hydrocarbon products. Although they found that oil produced within the system boundary had around 10% lower emissions than current oil, the study concluded that all 5 case studies resulted in net positive CO2 emissions. The study also tackles the subject of displacement, and tries to evaluate the carbon intensity of oil produced though CO2EOR against other oil sources. Whilst recognising the complexity of the displacement theory, the study concludes that without the displacement of a carbon intensive energy source, such as Canadian oil sands, CO2EOR systems will result in net carbon emissions.
3) Title: Life Cycle Assessment of Carbon Dioxide Capture for Enhanced Oil Recovery Author: Hertwich, E.G., Aaberg, M., Singh, B., Stomman, A.H. Year: 2008 Publisher: Chinese Journal of Chemical Engineering Real data / theoretical data: Theoretical / modelled data taken for one Norwegian case study Location: Norwegian North Sea Focus of Study: To assess the environmental impacts of a full carbon dioxide capture system with EOR. The study focusses on the on the modifications and operations of the platform during EOR. Key Findings: The study presents a Norwegian case study with a combined cycle power plant with amine carbon capture with the captured CO2 being utilised for EOR. The study modelled two offshore operation scenarios where an EOR scenario is modelled against a base case hydrocarbon production scenario. When modeling offshore EOR operations the study found that injection compressors, pumps and new wells were required. Additional recovery at the field was estimated to be 8.6% of OOIP. The study draws a number of primary conclusions. Firstly they state that the emissions related to offshore operations are significantly dependent on the source of energy used to power equipment. They state that after CO2 break through has occurred, produced gas can no longer be used to power turbines and therefore diesel generators, with a higher emissions profile must be used. The study also concludes that emissions related to powering offshore operations can be significantly reduced if the platform
www.sccs.org.uk 60 of 62
can be connected to an onshore electricity grid. A general conclusion drawn from the results of the study is that CO2EOR in this case has the potential to significantly reduce the emissions associated with oil production per unit of oil produced. They state however that this is due to the increased oil production.
4) Title: Reducing Carbon Dioxide Emissions with Enhanced Oil Recovery: A life cycle assessment approach Author: Aycaguer, A., Lev-On, M., Winer,A. Year: 2001 Publisher: Energy and Fuels Real data / theoretical data: Location: Permian Basin, United States. Focus of Study: “To conduct a life cycle assessment to determine the benefits derived from storing CO2 in active reservoirs while enhancing the extraction of oil and the impacts on the environment over the process lifetime” Key Findings: The study uses an oil reservoir in the Permian Basin of West Texas to demonstrate the CO2 storage potential through the use of EOR. The year of publish has resulted in the study drawing some basic yet strong conclusions from the modelling work. The study concludes that greenhouse gas emissions from the additional oil produced by the EOR process would almost be offset by CO2 storage in the reservoir, if the reservoirs full CO2 storage potential was utilised. However the study also states that combustion rates for both coal and natural gas used to power operations are quite high compared to the quantity of oil produced. The study also recognises a more modern concern that the final fate of CO2 within the reservoir will be dependent on economics. If the cost of CO2 is high and the price of emission allowances low, the CO2 retention rate in the reservoir will be intentionally minimised to optimise the recycling of CO2. 5) Title: Carbon Footprint and Principle of Additionality in CO2 EOR Projects: The Weyburn Case Author: Condor, J., Suebsiri, J. Year: 2010 Publisher: Society of Petroleum Engineers Real data / theoretical data: Real data- taken from the Weyburn CO2 EOR project in Sasketchwan, Canada. Location: Weyburn, Saskatchewan, Canada. Focus of Study: “To address the process of CO2EOR as both a driver to produce more oil from depleted oil reservoirs, while leading to effective CO2 abatement. The study focusses on two concepts: the carbon footprint of CO2EOR and the principle of additionality.” Key Findings: The study uses the Weyburn CO2 EOR project in Saskatchewan Canada as a case study. Although the study predominantly utilises data from this project a number of different scenarios are also modelled. The models are used to complete a full life cycle assessment along the full system boundary from coal mining to CO2EOR. The study states that in all 7 case scenarios only three major processes must be considered; coal mining, electrical generation and refinery product usage. They claim that other processes, although important, only account for less than 1% of total emissions. The study primarily concludes that any emissions trading benefits from CO2 storing as part of an EOR project should be discounted, according to a detailed analysis of the full carbon balance using the principle of additionality. The authors claim that a key exception to this should be when a commercially feasible CO2EOR project results in the development of pipeline infrastructure that would allow for the long term storage of CO2 beyond the life of the EOR project. Another conclusion drawn from the study is that the provision of petroleum tax breaks for CO2EOR projects on the grounds of their emissions reduction potential is not the best use of public funds.
www.sccs.org.uk 61 of 62
6) Title: Environmental implications of CO2-EOR Projects: in ‘Optimisation of CO2 Storage in CO2 Enhanced Oil Recovery Projects.’ Author: Advanced Resources International, Inc. & Melzer Consulting Year: 2010 Publisher: Department of Energy and Climate Change, Office of CCS Real data / theoretical data: Theoretical / modelled data taken for a number of case study scenarios Location: theoretical – standardised location Focus of Study: “To critically consider where the balance lies in terms of the potential climate benefits associated with the integrated application of CO2 storage with CO2 EOR, especially in comparison to other sources of crude oil supplies.“ Key Findings: The study presents the results of life cycle assessments of the CO2 emissions associated with the production of oil using CO2 EOR, refining, transportation and end product usage. The study clearly presents emissions profiles (in metric tons / bbl) for all of the aforementioned stages. The study highlighted again that ‘end use’ of petroleum products gives the largest contribution to the emissions profile of the CO2EOR system. The study models a number of scenarios that optimise the storage of CO2 in EOR projects to varying degrees. They conclude that even projects that are not optimised for storage have the capability to store 50-60% of the total emissions associated (including end product use) with the system boundary. They state however that projects that are optimised for storage have the capability to be net carbon negative and store up to 129% of the total emissions associated. The study concludes by stating that society has a critical choice between utilising oil produced through CO2 EOR and oil produced by other means, and states that the CO2 EOR has many environmental benefits over most oil produced by alternative operations.
7) Title: An assessment of gate to gate environmental life cycle performance of water-alternating-gas CO2EOR in the Permian Basin Author: Dilmore, R.M. Year: 2010 Publisher: Department of Energy / National Energy Technology Laboratory Real data / theoretical data: Theoretical / modelled data for a number of operational scenarios Location: Permian Basin, United States Focus of Study: “This study is intended to provide a detailed bottom up life cycle inventory of CO2 flood EOR operations, considering all associated significant infrastructure elements, process flows, and activities.” Key Findings: Using number of modelled operational scenarios the study assessed the performance of CO2EOR with respect to oil production, geological storage potential, and environmental performance. The study concludes that current CO2EOR best practices, (WAG injection in a typical Permian Basin Reservoir) generate greenhouse gas emissions that are nearly three times higher than the average for domestic oil produced in the US. The study states that for every barrel of crude produced through CO2EOR, energy feedstocks equivalent to between 13-27% of the energy content of that oil will be consumed. The study states that higher volumes of CO2 injection during operations correspond to longer flood durations and recycle larger volumes of gas. This results in higher associated emissions due to the energy intensive processing and compression required before re injection. The study therefore concludes that high volume CO2 injection is not favourable from an environmental and energy performance standpoint, but consideration of alternative “next generation” technologies and practices is warranted.

www.sccs.org.uk 62 of 62
8) Title: Electricity Use of Enhanced Oil Recovery with Carbon Dioxide Author: Advanced Resources International, Inc. Year: 2009 Publisher: National Energy Technology Laboratory Real data / theoretical data: Real data applied to three modelled CO2EOR scenarios Location: California & West Texas, United States Focus of Study: “To address and attempt to quantify the electricity requirements of CO2EOR technology, with the intent to provide a representative range of estimates, expressed in kWh of electricity consumed per Bbl of incremental oil produced.” Key Findings: The first part of the study attempts to estimate the electricity demands of CO2EOR operations. Although they state that electricity demands are highly variable, the study states that CO2
compression is the largest contributor to electricity use. They also state that this electricity requirement could potentially be doubled if pressures of produced CO2 are low or if volumes of recycled CO2 per barrel of oil are increased. The study also states that artificial lifting has the potential to be a considerable electricity user in an EOR project. They state that this electricity demand is likely to decrease after several years of CO2 flooding, as the injected CO2 re-pressurises the field and decreases the density of the produced fluids. If water is injected in a water-alternating-gas injection scheme the electricity requirement from artificial lifting may increase again. The third electricity demand found in the study to contribute significantly to the electricity demand of operations is gas separation facilities.