Embed Size (px)
Citation preview
Article
Carbon Dioxide Capture in a Fixed Bed of Coconut Shell Activated Carbon Impregnated With Sodium Hydroxide: Effects of Carbon Pore Texture and Alkali Loading Suravit Naksusuka, and Chaiyot Tangsathitkulchaib,*
School of Chemical Engineering, Institute of Engineering, Suranaree University of Technology, Nakhon Ratchasima 30000, Thailand E-mail: [email protected], [email protected] (Corresponding author) Abstract. Performance of CO2 adsorption was investigated in a fixed bed of coconut shell activated carbon impregnated with sodium hydroxide with emphasis on the effect of alkali loading and carbon pore texture. CO2 adsorption capacity increased with the increase of NaOH loading and passed through a maximum value at the optimum loading of 180 g NaOH/g carbon. This optimum loading appeared to be the same, independent of the surface area of activated carbon in the range of 766-1052 m2/g. A pore blocking phenomenon was proposed to account for the effect of alkali loading on the CO2 adsorption behavior. Empirical equations were also developed to correlate the breakthrough time, the adsorption capacity at breakthrough time and the equilibrium adsorption capacity with alkali loading and surface area of activated carbon. The breakthrough equation based on the LDF model was found to describe the experimental breakthrough data reasonably well. The transport of CO2 molecules in the pore structure of activated carbon to the adsorption sites is governed by the mechanism of surface diffusion and the surface diffusivity is about two orders of magnitude larger than the pore diffusivity. Keywords: Activated carbon, adsorption, breakthrough curves, CO2 adsorption, alkali impregnation.
ENGINEERING JOURNAL Volume 23 Issue 4 Received 6 November 2018 Accepted 26 April 2019 Published 8 August 2019 Online at http://www.engj.org/ DOI:10.4186/ej.2019.23.4.29

DOI:10.4186/ej.2019.23.4.29
30 ENGINEERING JOURNAL Volume 23 Issue 4, ISSN 0125-8281 (http://www.engj.org/)
1. Introduction CO2 generated from power plants burning fossil fuels and large industrial sectors has posed a serious problem and concern to global warming and climate change [1,2]. Worldwide, power generation alone emits nearly 10 billion tons of CO2 annually, accounting for about 25% of total CO2 emission [3]. As a result, there is an urgent need to be able to control the level of CO2 being released into the atmosphere from those anthropogenic sources. Current technologies dealing with CO2 removal have been achieved through the process of carbon capture and storage (CCS), consisting of three consecutive steps of carbon capture, transportation to the storage site and depositing in deep geological formations or in the form of mineral carbonates [4]. The capture of CO2 is achieved by pre-combustion capture, post-combustion capture and oxy-fuel combustion. Of these processes, the post-combustion capture is the most preferred choice due to the ease of retrofitting the existing power plants without affecting the overall process performance [5].
With regard to the post-combustion process, the separation of CO2 from flue gas by absorption with liquid solvents such as monoethanolamine (MEA) and diethanolamine (DEA) is the most mature technology. However, despite the high separation efficiency of the chemical absorption system, it has a number of inherent drawbacks, for example, amine degradation that results in solvent loss and the generation of many toxic substances, high corrosiveness of the solvents and high energy consumption for solvent recovery [6,7]. Due to these limitations, adsorption technology has emerged as a promising alternative for CO2 removal from flue gas. It offers many advantages including, low manufacturing cost, high thermal stability, high adsorption capacity, low energy requirement, and low sorbent regeneration cost [8-10]. Among the various available adsorbents for CO2 capture, the use of activated carbon is quite attractive. It has several desirable properties such as flexibility of controlling pore size distribution during preparation, large surface area, large micropore volume for effective CO2 adsorption, reasonably high pellet strength, fast regeneration for repeated usage, insensitivity to moisture due to surface hydrophobicity and capability of surface chemical modification for increased sorption selectivity [11]. There are a number of investigations on CO2 capture by physically- and chemically-activated carbon prepared from various biomass waste [12-14]. The equilibrium adsorption capacity for CO2 was reported to be in the range of 2-5 mmol/g at 25oC and decrease with increasing the adsorption temperature, hence indicating the physical adsorption between adsorbent and adsorbate molecules.
The adsorption capacity of CO2 from flue gas can be further increased by increasing the affinity and selectivity of CO2 toward the carbon surface. Since CO2 is an acid gas, the creation of basic sites onto the surface of activated carbon will help increase the adsorption selectivity by acid-base interaction [15]. The most commonly used method of introducing the basic sites is by wet impregnating the activated carbon with an alkali solution such as ethanolamine, KOH and NaOH [16-18]. However, in contrast to the CO2 adsorption with the unmodified activated carbon which requires a high proportion of microporosity, mesoporous carbon is more appropriate for the impregnation process to prevent the blocking of pore structure at high alkali loadings [5].
In general, adsorption study can be performed in batch mode or continuous mode. For a batch operation, information on both equilibrium (isotherm data) and kinetics (data on how fast the adsorbate molecules transport to the adsorption sites) are of prime interest. For a continuous operation, adsorption is often performed in a fixed bed of solid adsorbent due to its wide spread applications in industries. The present work is therefore focused on studying the capture of CO2 from a gas mixture of CO2 and N2 whose composition simulates that of the flue gas. Adsorption experiments were carried out in a fixed bed column and the adsorbent particles used were coconut shell activated carbon impregnated with a sodium hydroxide solution. Sodium hydroxide was employed as an impregnant because of its low cost and easy availability. Two major parameters, which directly affect the number of adsorption sites and hence the adsorption performance, including pore texture of the test carbon and the amount of alkali loading, were investigated. A model was proposed to explain the role of NaOH loading on the adsorption efficiency of carbon dioxide. In addition, empirical correlations were also proposed for the adsorption capacity of CO2 as functions of NaOH loading and surface area of the tested activated carbons.

DOI:10.4186/ej.2019.23.4.29
ENGINEERING JOURNAL Volume 23 Issue 4, ISSN 0125-8281 (http://www.engj.org/) 31
2. Theory 2.1. Adsorption Performance of a Fixed Bed The adsorption performance of an adsorbate in a fixed bed of adsorbent particles can be assessed by following the response of the exit concentration of the adsorbate as a function of time. The collected information presented as a plot of the ratio of the outlet and inlet adsorbate concentration (C/Co) versus time is called the breakthrough curve which has a characteristic of a S-shaped curve. The steepness (slope) and position on the time scale reflect the adsorption behavior of adsorbate inside the adsorbent bed. A steeper slope indicates the lowering of internal mass transfer resistance for transporting the adsorbate to the adsorption sites, while the shifting of the curve to a higher value of time scale signifies a strong affinity between the adsorbent and adsorbate molecules. Both characteristics imply the increased adsorption capacity of the adsorbate. The time at which C/Co = 0.05 is termed the breakthrough time (tB), which is the time that the adsorption operation is to be interrupted and the regeneration of the solid adsorbent is required. The time at which C/Co = 0.95, where the bed becomes fully exhausted, is called the equilibrium time (tE). The adsorption capacity of adsorbate at tB and tE can then be calculated from the breakthrough data by the following equations [16]
0
00
1( ) [ ]
Bt
B
C Q Cq dt
W C (1)
0
00
1( ) [ ]
Et
E
C Q Cq dt
W C (2)
where C and Co = outlet and inlet concentration of adsorbate, respectively, Q = volume flow rate of the feed gas and W = weight of adsorbent. The integral terms in Eqs. (1) and (2) can be estimated from the areas above the breakthrough curve at tB and tE, respectively. 2.2. Breakthrough Model A mathematical equation describing the breakthrough curve can be derived by performing a mass balance on a single adsorbate over a differential length of the adsorbent bed under an isothermal condition [19]. The resulting equation obtained reads
2
2
(1 )0b
Z
b
C C C qD u
z z t t (3)
and 2
3
0
3pR
p
q qr drR
(4)
where q = adsorbed-phase concentration, Dz = axial dispersion coefficient, C = adsorbate concentration in the fluid phase, u = interstitial gas velocity, Rp = radius of an adsorbent particle, εb = bed porosity, z = distance along the bed and t = time.
Equations (3) and (4) can be solved based on the complexity of the model assumptions, for example, isothermal or adiabatic operations, trace or high concentration of adsorbate, type of adsorption isotherms (linear or curved) to arrive at the concentration profile of the adsorbate inside the adsorption bed as a function of time. To obtain the breakthrough equation (C/Co vs. t), the axial distance (z) in the concentration profile equation is just replaced by the bed length (LB).
The simplest model to obtain the breakthrough equation is based on the concept of the linear driving force model (LDF) [20] which assumes that the effect of axial dispersion is negligible, the adsorption isotherm is linear and the rate of adsorption can be represented by the following linear rate equation.
DOI:10.4186/ej.2019.23.4.29
32 ENGINEERING JOURNAL Volume 23 Issue 4, ISSN 0125-8281 (http://www.engj.org/)
* *( ) ( )p p
qk q q k K C C
t (5)
where kp is the particle mass transfer coefficient, K is the Henry constant of the linear isotherm, q* is the adsorbed - phase concentration that is in equilibrium with the bulk phase concentration (C) and C* is the
bulk-phase concentration that is in equilibrium with the average adsorbed-phase concentration ( q ).
The breakthrough equation derived from the LDF theory is referred to as the Klinkenberg’s model [21]. The approximate equation for a long bed is given by
0
1 1 1[1 ( )]( 0.6% 2.0)
2 8 8
Cerf error for
C (6)
where (1 )/p B b bk KL u and [ ( / )]p Bk t L u
The term kpK in Eq. 5 is related to the external and internal mass transfer resistances as characterized by the film mass transfer coefficient (kc) and the effective pore diffusivity (De), respectively, as follows [19]
21
3 15
p p
p c e
R R
k K k D (7)
where Rp is the radius of the adsorbent particle.
The film mass transfer coefficient (kc) can be estimated from the correlation of Sherwood number (NSh) with correction for axial dispersion as proposed by Wakao and Funazkri [22]. The equation reads
0.6 1/32 1.1( ) ( )
c p p
Sh
m m
k d d GN
D D (8)
where dp = particle diameter, Dm = molecular diffusivity of the diffusing species, G = mass velocity of fluid, µ = fluid viscosity and ρ = fluid density.
The molecular diffusivity of CO2 in a binary mixture of CO2 and N2 is determined from the Chapman-Enskog equation [23] and has a value of 1.74x10⁻⁵ m2/s. The film mass transfer coefficient of CO2 (kc) calculated from Eq. (8) is equal to 0.0278 m/s.
3. Material and Method 3.1. Raw Materials The activated carbon used in this study is a commercial activated carbon produced from coconut shell by steam activation and supplied by C. Gigantic Carbon Co., Ltd., Nakhon Ratchasima, Thailand. It has an average particle size of 1.29 mm (14x16 mesh screen size). Two types of activated carbon (designated as AC1 and AC2) having different pore structures were employed in the present work. The BET surface area and total pore volume of AC1 and AC2 are 766 m2/g and 0.387 cm3/g, and 1,052 m2/g and 0.547 cm3/g, respectively. Carbon dioxide gas and nitrogen gas of high purity (99.99%) being used for the adsorption study were purchased from Linde Thailand. Sodium hydroxide pellets (AR grade) was purchased from Carlo Erba Reagents. 3.2. Alkali Impregnation Alkali impregnated activated carbon was prepared by mixing 50 g of activated carbon, corresponding to a bulk volume of 110 cm3 and void volume of 45 cm3, with 180 cm3 of NaOH solution of the desired concentration (3-15 wt% NaOH). Next, the mixture was shaken in a water bath at room temperature using

DOI:10.4186/ej.2019.23.4.29
ENGINEERING JOURNAL Volume 23 Issue 4, ISSN 0125-8281 (http://www.engj.org/) 33
the shaking speed of 180 rpm for 90 min to reach equilibrium. The whole sample was then dried in an electric oven at 110oC for 48 h. Each impregnated carbon was given a sample name by the type of activated carbon (AC1 or AC2) followed by the weight % of NaOH solution used for the impregnation. For example, sample AC1-5 indicates activated carbon AC1 which was impregnated with 5 wt% NaOH solution. 3.3. Pore Characterization of Activated Carbons
Porous properties of the original and alkali impregnated activated carbons were determined from the N2 adsorption isotherms measured at -196oC (77K) using the surface area analyzer (ASAP2010, Micromeritics, US). Specific surface area of each activated carbon sample was calculated from the derived N2 isotherms employing the BET equation [24]. The micropore volume was computed from the t-plot method [25]. The total pore volume was determined from the amount of gas adsorbed at the relative gas pressure (P/Po) of 0.98, and converted this number to the volume of N2 in liquid state. The average pore diameter was calculated from the equation 4V/A based on the assumption of cylindrical pore shape, where V and A represent the total pore volume and BET surface area, respectively. 3.4. Fixed-bed Adsorption of CO2 The study of CO2 adsorption in a fixed bed of virgin and alkali impregnated activated carbon was carried out at atmospheric pressure in a clear acrylic column of 1 cm in diameter and 60 cm in height. Figure 1 shows the experimental set up for CO2 adsorption experiments. The adsorption temperature was fixed at 35oC for all experimental runs by circulating water from a temperature-controlled water bath through the column jacket. The column was first purged with nitrogen gas flowing at the rate of 100 cm3/min for 15 min. After that, activated carbon was loaded into the column to the desired height. Next, nitrogen and carbon dioxide were allowed to flow from the supply tanks and mixed thoroughly along a long pipe section and passed through a by-pass line at the pre-calculated flow rates (measured with two separate rotameters for each gas) to give the gas mixture composition of 13 vol% CO2 (an average CO2 concentration in the flue gas burning a solid fuel). A portable gas analyzer (BIOGAS 5000, Geotech, UK) was used to check for the required inlet CO2 concentration. Now, the feed gas mixture was admitted into the adsorption column and the timing was started. The exit concentration of CO2 was recorded as a function of time using the gas analyzer until the measured concentration approached the inlet CO2 concentration. Table 1 summarizes the experimental conditions used for the adsorption study. Table 1. Experimental conditions for CO2 adsorption study
Conditions Values
NaOH concn. for impregnation (wt%)
0-15
Surface area of activated carbon (m2/g)
766, 1052
%CO2 in the feed gas (vol%) 13 Amount of activated carbon (g) 10 Bed height (cm) 28.2 Gas superficial velocity (m/min)
3.03
Temperature (oC) 35

DOI:10.4186/ej.2019.23.4.29
34 ENGINEERING JOURNAL Volume 23 Issue 4, ISSN 0125-8281 (http://www.engj.org/)
Fig. 1. Schematic of experimental set-up for CO2 adsorption study.
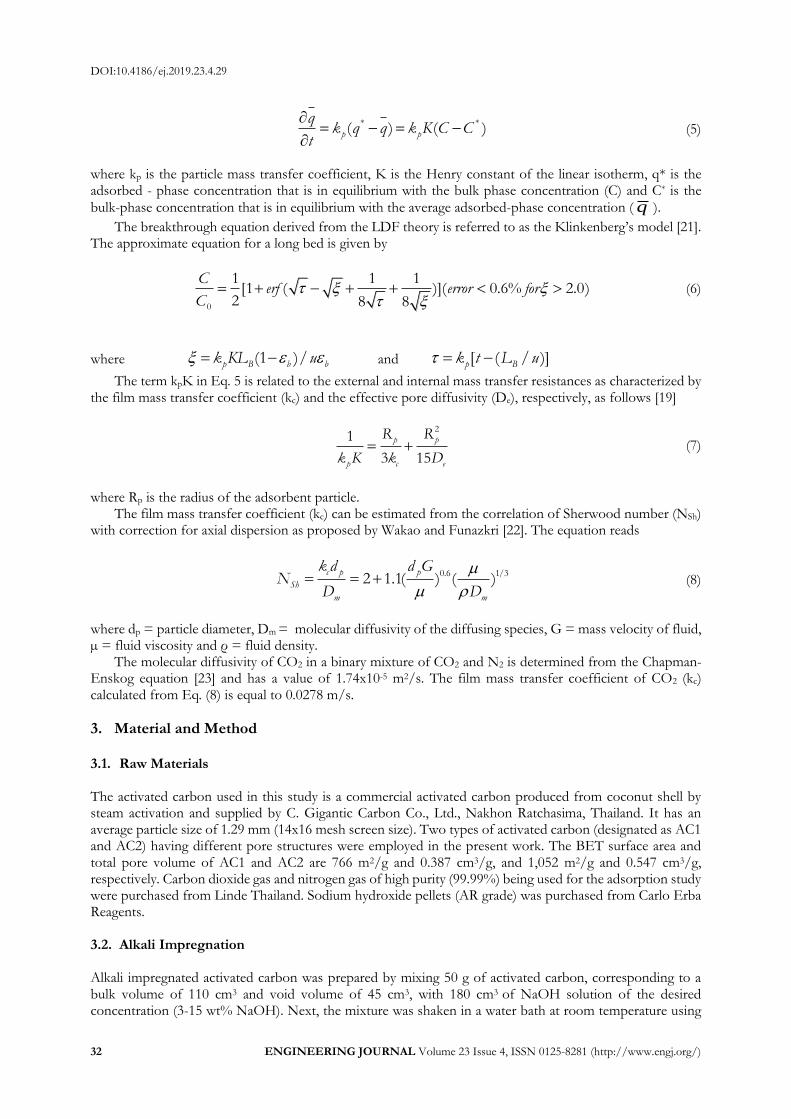
4. Results and Discussion 4.1. Pore Structure of Activated Carbons Figure 2 shows typical nitrogen adsorption-desorption isotherms of the tested activated carbons. All isotherms show Type I isotherm according to the IUPAC classification [26], typified by a sharp increase of the amount adsorbed at low pressures and followed by a plateau region at higher pressures. This type of isotherm indicates that the original activated carbons (AC1 and AC2) prepared from coconut shell contain mostly micropores (pore size smaller than 2 nm) (see Table 2) and the amount of N2 adsorbed by AC2 is higher than that of AC1, thus indicating larger surface area and pore volume of the AC2 sample.
The N2 isotherms in Fig. 2 also shows small hysteresis loops notably for the original AC1 and AC2, indicating the existence of some mesopores which was found to possess about 17.8 and 28.2 % of the total pore volume for AC1 and AC2, respectively (see Table 2). It is also observed that the size of hysteresis loop tends to decrease as the NaOH loading is increased, caused by the consequent decrease of the average pore size.
Table 2 lists the porous properties of the original and alkali modified activated carbons. Both the surface area and pore volume tend to decrease as the amount of NaOH depositing in the pores is increased. About a fivefold increase of NaOH loading from 0-540 mg NaOH/g carbon lowers the surface area of AC1 and AC2 by 43.5% and 51.1%, respectively. The continued decrease in surface area with increasing NaOH loading signifies the decreasing amount of N2 adsorption on the internal surface of activated carbon, as seen from Fig. 2. This result of lowering in surface area is possibly caused by the effect of pore restriction whereby the volume of pore space starts to decline with increasing amount of deposited layer of NaOH molecules inside the pores, giving less area for N2 adsorption to occur. At a very high NaOH loading, the pores will be completely blocked, thus preventing the diffusion of N2 to the inner adsorption sites. It is also noted from Table 2 that there is a slight decrease in the average pore size with the increase of NaOH loading.

DOI:10.4186/ej.2019.23.4.29
ENGINEERING JOURNAL Volume 23 Issue 4, ISSN 0125-8281 (http://www.engj.org/) 35
Table 2. Porous properties of original and NaOH impregnated activated carbons.
Samples %NaOH solution (wt%)
NaOH loading (mg/g)
BET surface
area (m2/g)
Micropore volume (cm3/g)
Mesopore volume (cm3/g)
Total pore volume (cm3/g)
Average pore
diameter (nm)
AC1 0 0 766 0.318 (82.2%)
0.069 (17.8%)
0.387 2.02
AC1-3 3 108 663 0.279 (84.5%)
0.051 (15.5%)
0.330 1.99
AC1-5 5 180 593 0.249 (83.8%)
0.048 (16.2%)
0.297 2.00
AC1-7.5 7.5 270 529 0.219 (82.6%)
0.046 (17.4%)
0.265 2.00
AC1-10 10 360 527 0.218 (80.7%)
0.042 (19.3%)
0.270 2.05
AC1-15 15 540 433 0.183 (85.1%)
0.052 (14.9%)
0.215 1.99
AC2 0 0 1052 0.393 (71.8%)
0.154 (28.2%)
0.547 2.08
AC2-3 3 108 841 0.330 (78.6%)
0.090 (21.4%)
0.420 2.03
AC2-5 5 180 827 0.319 (77.6%)
0.092 (22.4%)
0.411 2.03
AC2-7.5 7.5 270 750 0.297 (80.3%)
0.073 (19.7%)
0.370 2.01
AC2-10 10 360 659 0.264 (80.2%)
0.065 (19.8%)
0.329 2.00
AC2-15 15 540 514 0.198 (76.4%)
0.061 (23.6%)
0.259 2.01
DOI:10.4186/ej.2019.23.4.29
36 ENGINEERING JOURNAL Volume 23 Issue 4, ISSN 0125-8281 (http://www.engj.org/)
P/P0 (-)
0.0 .2 .4 .6 .8 1.0
Am
oun
t o
f N
2 a
dso
rbed
(cm
3 S
TP
/g)
0
50
100
150
200
250
300
AC1
AC1-3
AC1-5
AC1-7.5
AC1-10
AC1-15
P/P0 (-)
0.0 .2 .4 .6 .8 1.0
Am
oun
t o
f N
2 a
dso
rbed
(cm
3 S
TP
/g)
0
100
200
300
400
AC2
AC2-3
AC2-5
AC2-7.5
AC2-10
AC2-15
Fig. 2. N2 adsorption isotherm of the original and NaOH impregnated activated carbons at -196oC (77K). 4.2. Adsorption Performance The effects of surface area and NaOH loading on the breakthrough curves are illustrated in Figs. 3 and 4. It is clear that both variables exert a strong influence on the breakthrough time (tB) and equilibrium time (tE). However, there is virtually no effect of surface area and alkali loading on the slope of the breakthrough curves. In principle, the slope should consistently decrease with increasing alkali loading, caused by the consequent increase of mass transfer resistance that retards the transport of adsorbate molecules to the adsorption sites.
DOI:10.4186/ej.2019.23.4.29
ENGINEERING JOURNAL Volume 23 Issue 4, ISSN 0125-8281 (http://www.engj.org/) 37
Time (s)
0 200 400 600 800 1000 1200
C/C
0
0.0
.2
.4
.6
.8
1.0
AC1
AC1-3
AC1-5
AC1-7.5
AC1-10
AC1-15
Klinkenberg model
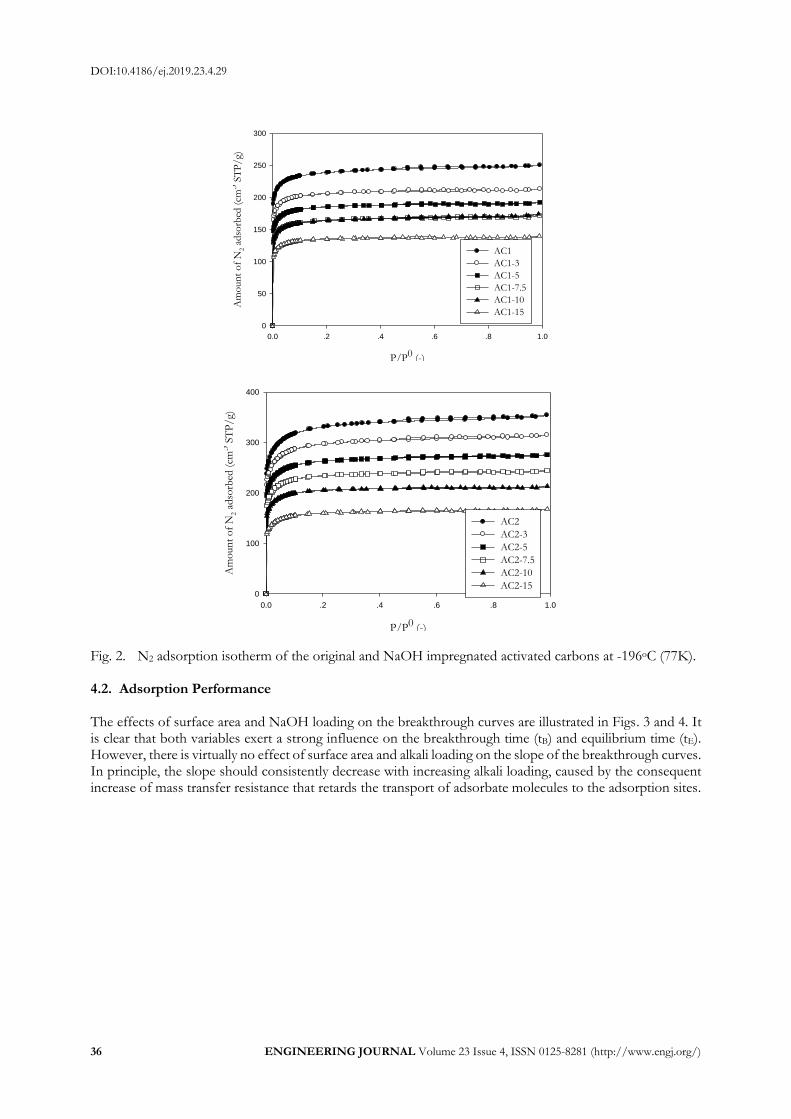
Fig. 3. Breakthrough curves for CO2 adsorption in a fixed bed of AC1 activated carbon impregnated with NaOH.
Time(s)
0 200 400 600 800 1000 1200
C/C
0
0.0
.2
.4
.6
.8
1.0
AC2
AC2-3
AC2-5
AC2-7.5
AC2-10
AC2-15
Klinkenberg model
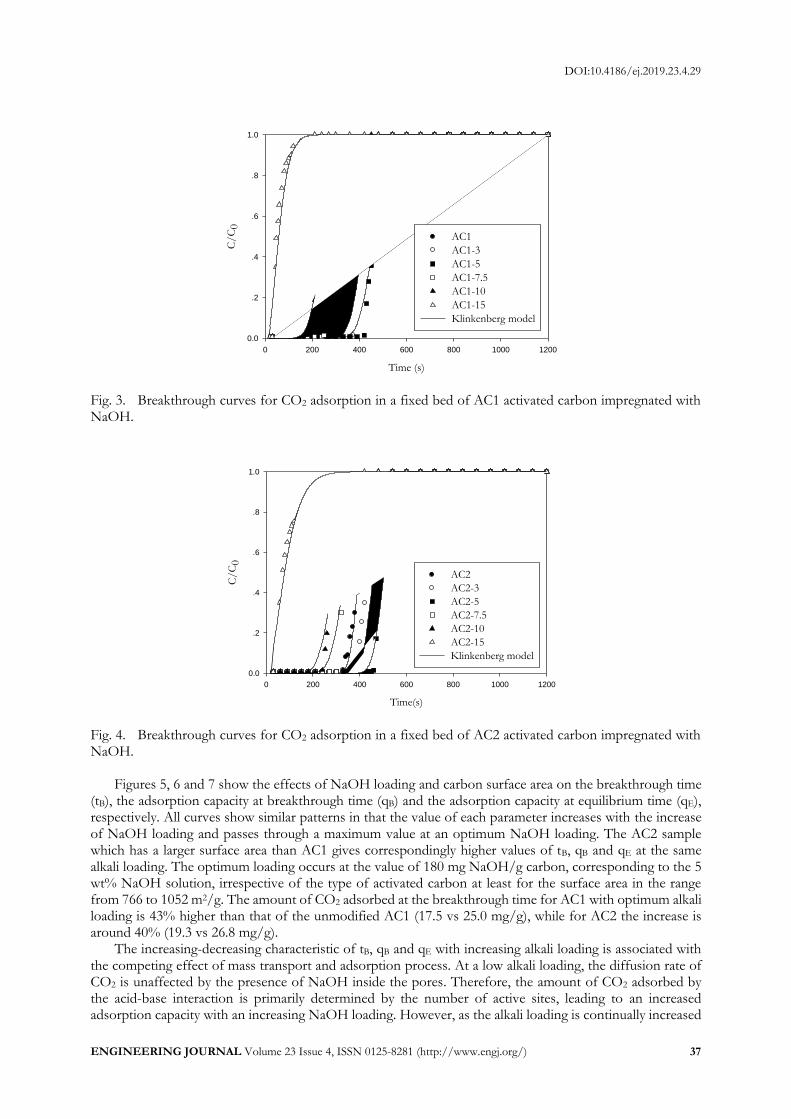
Fig. 4. Breakthrough curves for CO2 adsorption in a fixed bed of AC2 activated carbon impregnated with NaOH.
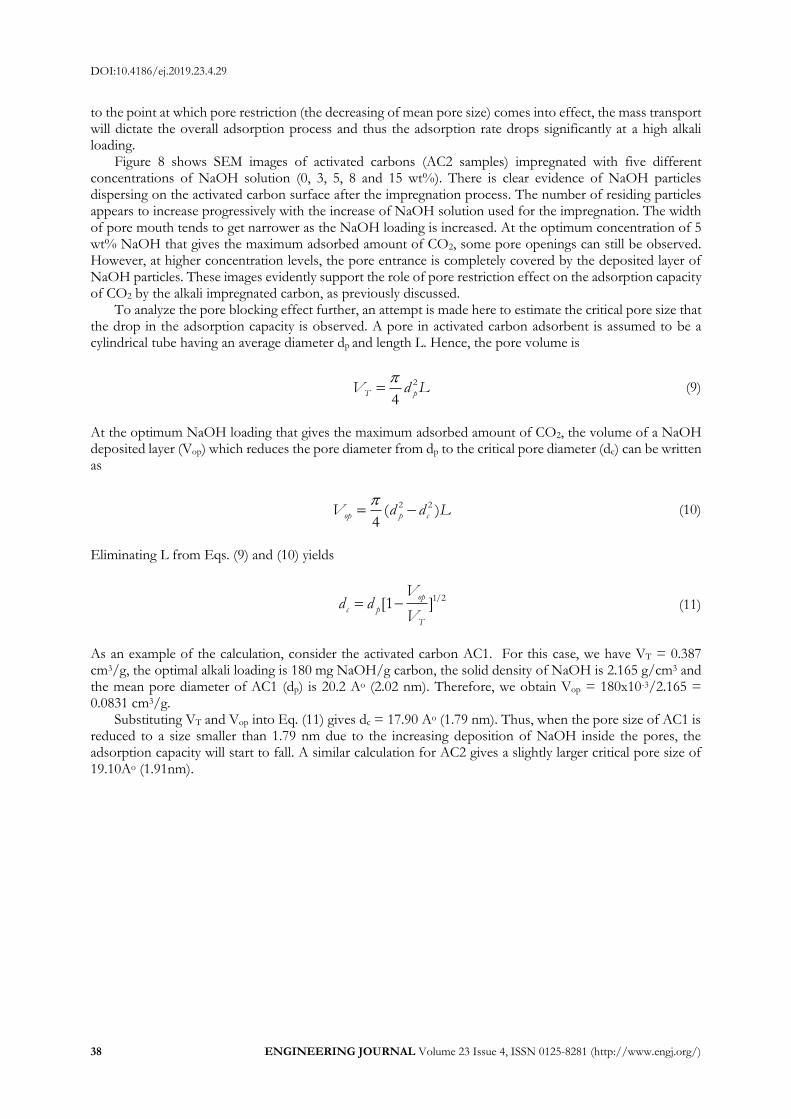
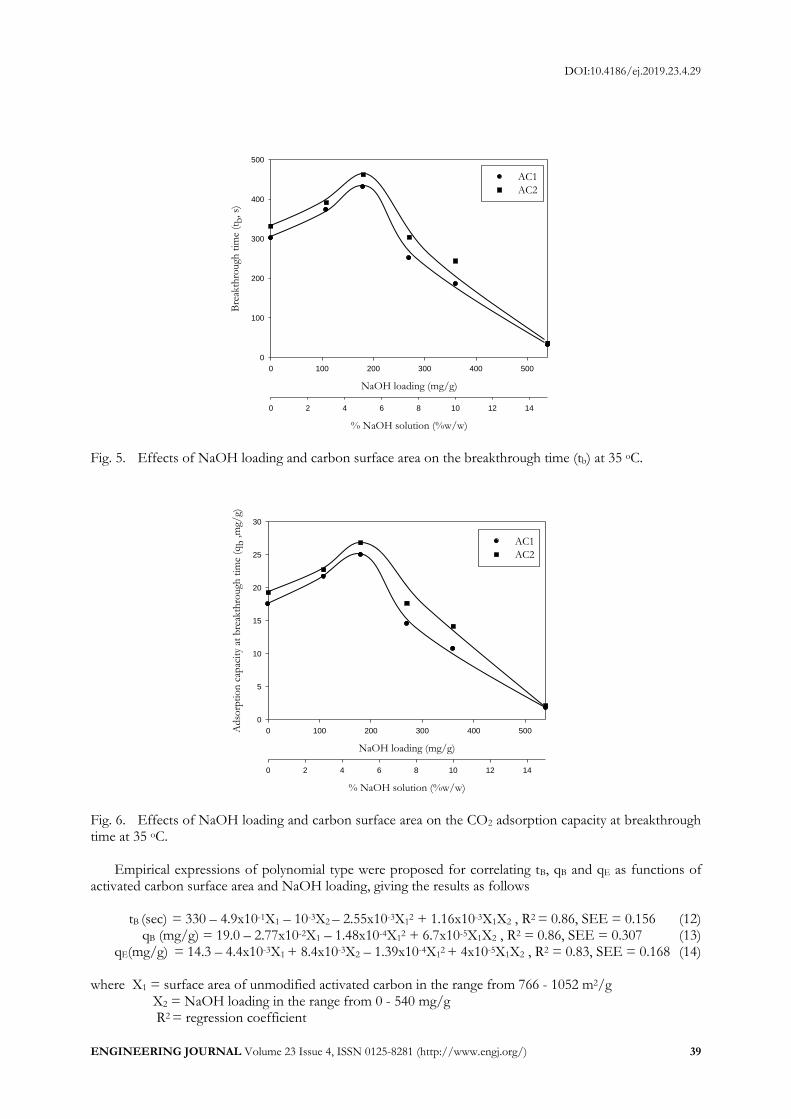
Figures 5, 6 and 7 show the effects of NaOH loading and carbon surface area on the breakthrough time (tB), the adsorption capacity at breakthrough time (qB) and the adsorption capacity at equilibrium time (qE), respectively. All curves show similar patterns in that the value of each parameter increases with the increase of NaOH loading and passes through a maximum value at an optimum NaOH loading. The AC2 sample which has a larger surface area than AC1 gives correspondingly higher values of tB, qB and qE at the same alkali loading. The optimum loading occurs at the value of 180 mg NaOH/g carbon, corresponding to the 5 wt% NaOH solution, irrespective of the type of activated carbon at least for the surface area in the range from 766 to 1052 m2/g. The amount of CO2 adsorbed at the breakthrough time for AC1 with optimum alkali loading is 43% higher than that of the unmodified AC1 (17.5 vs 25.0 mg/g), while for AC2 the increase is around 40% (19.3 vs 26.8 mg/g).
The increasing-decreasing characteristic of tB, qB and qE with increasing alkali loading is associated with the competing effect of mass transport and adsorption process. At a low alkali loading, the diffusion rate of CO2 is unaffected by the presence of NaOH inside the pores. Therefore, the amount of CO2 adsorbed by the acid-base interaction is primarily determined by the number of active sites, leading to an increased adsorption capacity with an increasing NaOH loading. However, as the alkali loading is continually increased
DOI:10.4186/ej.2019.23.4.29
38 ENGINEERING JOURNAL Volume 23 Issue 4, ISSN 0125-8281 (http://www.engj.org/)
to the point at which pore restriction (the decreasing of mean pore size) comes into effect, the mass transport will dictate the overall adsorption process and thus the adsorption rate drops significantly at a high alkali loading.
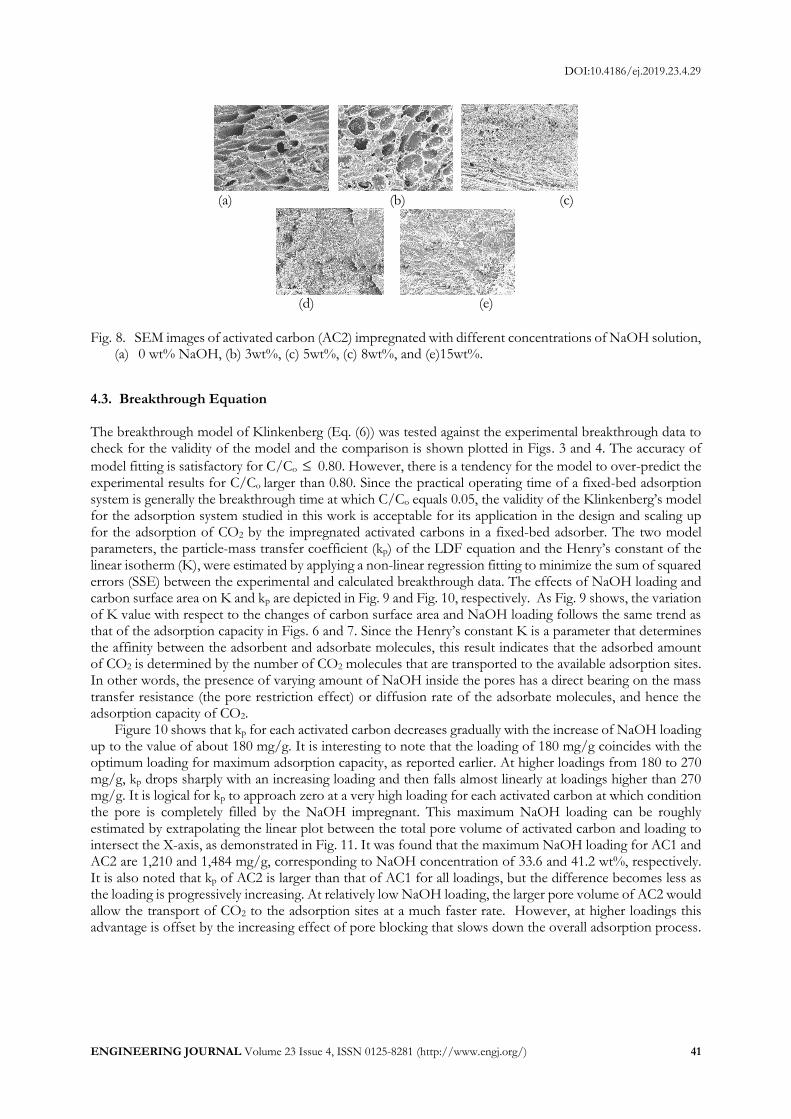
Figure 8 shows SEM images of activated carbons (AC2 samples) impregnated with five different concentrations of NaOH solution (0, 3, 5, 8 and 15 wt%). There is clear evidence of NaOH particles dispersing on the activated carbon surface after the impregnation process. The number of residing particles appears to increase progressively with the increase of NaOH solution used for the impregnation. The width of pore mouth tends to get narrower as the NaOH loading is increased. At the optimum concentration of 5 wt% NaOH that gives the maximum adsorbed amount of CO2, some pore openings can still be observed. However, at higher concentration levels, the pore entrance is completely covered by the deposited layer of NaOH particles. These images evidently support the role of pore restriction effect on the adsorption capacity of CO2 by the alkali impregnated carbon, as previously discussed.
To analyze the pore blocking effect further, an attempt is made here to estimate the critical pore size that the drop in the adsorption capacity is observed. A pore in activated carbon adsorbent is assumed to be a cylindrical tube having an average diameter dp and length L. Hence, the pore volume is
2
4T pV d L (9)
At the optimum NaOH loading that gives the maximum adsorbed amount of CO2, the volume of a NaOH deposited layer (Vop) which reduces the pore diameter from dp to the critical pore diameter (dc) can be written as
2 2( )4
op p cV d d L (10)
Eliminating L from Eqs. (9) and (10) yields
1/2[1 ]op
c p
T
Vd d
V (11)
As an example of the calculation, consider the activated carbon AC1. For this case, we have VT = 0.387 cm3/g, the optimal alkali loading is 180 mg NaOH/g carbon, the solid density of NaOH is 2.165 g/cm3 and the mean pore diameter of AC1 (dp) is 20.2 Ao (2.02 nm). Therefore, we obtain Vop = 180x10-3/2.165 = 0.0831 cm3/g.
Substituting VT and Vop into Eq. (11) gives dc = 17.90 Ao (1.79 nm). Thus, when the pore size of AC1 is reduced to a size smaller than 1.79 nm due to the increasing deposition of NaOH inside the pores, the adsorption capacity will start to fall. A similar calculation for AC2 gives a slightly larger critical pore size of 19.10Ao (1.91nm).
DOI:10.4186/ej.2019.23.4.29
ENGINEERING JOURNAL Volume 23 Issue 4, ISSN 0125-8281 (http://www.engj.org/) 39
NaOH loading (mg/g)
0 100 200 300 400 500
Bre
akth
rough
tim
e (t
b, s)
0
100
200
300
400
500
% NaOH solution (%w/w)
0 2 4 6 8 10 12 14
AC1
AC2
Fig. 5. Effects of NaOH loading and carbon surface area on the breakthrough time (tb) at 35 oC.
NaOH loading (mg/g)
0 100 200 300 400 500Adso
rpti
on
cap
acit
y at
bre
akth
rough
tim
e (q
b ,m
g/g)
0
5
10
15
20
25
30
% NaOH solution (%w/w)
0 2 4 6 8 10 12 14
AC1
AC2
Fig. 6. Effects of NaOH loading and carbon surface area on the CO2 adsorption capacity at breakthrough time at 35 oC.
Empirical expressions of polynomial type were proposed for correlating tB, qB and qE as functions of activated carbon surface area and NaOH loading, giving the results as follows tB (sec) = 330 – 4.9x10-1X1 – 10-3X2 – 2.55x10-3X1
2 + 1.16x10-3X1X2 , R2 = 0.86, SEE = 0.156 (12) qB (mg/g) = 19.0 – 2.77x10-2X1 – 1.48x10-4X1
2 + 6.7x10-5X1X2 , R2 = 0.86, SEE = 0.307 (13) qE(mg/g) = 14.3 – 4.4x10-3X1 + 8.4x10-3X2 – 1.39x10-4X1
2 + 4x10-5X1X2 , R2 = 0.83, SEE = 0.168 (14)
where X1 = surface area of unmodified activated carbon in the range from 766 - 1052 m2/g X2 = NaOH loading in the range from 0 - 540 mg/g R2 = regression coefficient

DOI:10.4186/ej.2019.23.4.29
40 ENGINEERING JOURNAL Volume 23 Issue 4, ISSN 0125-8281 (http://www.engj.org/)
SEE = overall standard error of estimate, defined as
2
,exp , ,
1
[( )/ ] /( 2)n
i i cal i cal
i
SEE x x x N
(15)
xi,exp and xi,cal = experimental and calculated value of each respective parameter, respectively N = number of data points.
NaOH loading (mg/g)
0 100 200 300 400 500
Ad
sorp
tio
n c
apac
ity
at e
quili
bri
um
tim
e (q
E ,m
g/g)
0
5
10
15
20
25
30
35
% NaOH solution (%w/w)
0 2 4 6 8 10 12 14
AC1
AC2
Fig. 7. Effects of NaOH loading and carbon surface area on the CO2 adsorption capacity at equilibrium time at 35 oC
Table 3 summarizes the previous works on CO2 adsorption by various alkali impregnated adsorbents in a fixed bed operation. It is observed that the alkali impregnated adsorbents can increase the CO2 adsorption capacity by 25 to 300%, as compared to the use of untreated adsorbents. Diethanolamine-impregnated carbons appear to give higher selectivity toward CO2 capture than with sodium hydroxide impregnation under comparable adsorption conditions. It is also interesting to note that adsorption of CO2 at a relatively high temperature of 75oC by amine impregnated titanium oxides gives a substantial increase of adsorption capacity. Other operating variables such as gas-solid contact time, adsorbent pore structure and feed compositions will also have a direct effect on the overall adsorption efficiency. A comparison was made on the adsorption capacity of CO2 from the present study and the work of Tan et al. [18] using coconut-shell activated carbon impregnated with NaOH. It was discovered that the alkali impregnated carbon was able to increase the amount of CO2 adsorbed by 41% and 56% for this work and the work of Tan et al., respectively, although the gas velocity of the latter was much higher.
DOI:10.4186/ej.2019.23.4.29
ENGINEERING JOURNAL Volume 23 Issue 4, ISSN 0125-8281 (http://www.engj.org/) 41
(a) (b) (c)
(d) (e)
Fig. 8. SEM images of activated carbon (AC2) impregnated with different concentrations of NaOH solution,
(a) 0 wt% NaOH, (b) 3wt%, (c) 5wt%, (c) 8wt%, and (e)15wt%.
4.3. Breakthrough Equation The breakthrough model of Klinkenberg (Eq. (6)) was tested against the experimental breakthrough data to check for the validity of the model and the comparison is shown plotted in Figs. 3 and 4. The accuracy of
model fitting is satisfactory for C/Co 0.80. However, there is a tendency for the model to over-predict the experimental results for C/Co larger than 0.80. Since the practical operating time of a fixed-bed adsorption system is generally the breakthrough time at which C/Co equals 0.05, the validity of the Klinkenberg’s model for the adsorption system studied in this work is acceptable for its application in the design and scaling up for the adsorption of CO2 by the impregnated activated carbons in a fixed-bed adsorber. The two model parameters, the particle-mass transfer coefficient (kp) of the LDF equation and the Henry’s constant of the linear isotherm (K), were estimated by applying a non-linear regression fitting to minimize the sum of squared errors (SSE) between the experimental and calculated breakthrough data. The effects of NaOH loading and carbon surface area on K and kp are depicted in Fig. 9 and Fig. 10, respectively. As Fig. 9 shows, the variation of K value with respect to the changes of carbon surface area and NaOH loading follows the same trend as that of the adsorption capacity in Figs. 6 and 7. Since the Henry’s constant K is a parameter that determines the affinity between the adsorbent and adsorbate molecules, this result indicates that the adsorbed amount of CO2 is determined by the number of CO2 molecules that are transported to the available adsorption sites. In other words, the presence of varying amount of NaOH inside the pores has a direct bearing on the mass transfer resistance (the pore restriction effect) or diffusion rate of the adsorbate molecules, and hence the adsorption capacity of CO2.
Figure 10 shows that kp for each activated carbon decreases gradually with the increase of NaOH loading up to the value of about 180 mg/g. It is interesting to note that the loading of 180 mg/g coincides with the optimum loading for maximum adsorption capacity, as reported earlier. At higher loadings from 180 to 270 mg/g, kp drops sharply with an increasing loading and then falls almost linearly at loadings higher than 270 mg/g. It is logical for kp to approach zero at a very high loading for each activated carbon at which condition the pore is completely filled by the NaOH impregnant. This maximum NaOH loading can be roughly estimated by extrapolating the linear plot between the total pore volume of activated carbon and loading to intersect the X-axis, as demonstrated in Fig. 11. It was found that the maximum NaOH loading for AC1 and AC2 are 1,210 and 1,484 mg/g, corresponding to NaOH concentration of 33.6 and 41.2 wt%, respectively. It is also noted that kp of AC2 is larger than that of AC1 for all loadings, but the difference becomes less as the loading is progressively increasing. At relatively low NaOH loading, the larger pore volume of AC2 would allow the transport of CO2 to the adsorption sites at a much faster rate. However, at higher loadings this advantage is offset by the increasing effect of pore blocking that slows down the overall adsorption process.

DOI:10.4186/ej.2019.23.4.29
42 ENGINEERING JOURNAL Volume 23 Issue 4, ISSN 0125-8281 (http://www.engj.org/)
Table 3. Typical adsorption capacity of CO2 in a fixed bed of alkali impregnated adsorbents.
Adsorbent Column
dia. (cm)
Surface area AC
(m2/g)
Bed ht.
(cm)
CO2 concn. (feed) (vol%)
Temp. (oC)
Gas veloc. (m/s)
Adsorption capacity (mg/g)
Ref. Original Impregd.
1.NaOH impregnated coconut shell AC
1.0 1052 28.2 13 35 0.033 22.8 32.1 This work
2. Diethanol amine impregnated palm shell AC
2.0 800 60 40 40 10.6 75.0 92.8 [27]
3. Diethanol amine functionalized waste tea AC
1.1 - 10 10 30 0.05 33.6 53.6 [28]
4. NaOH impregnated coconut shell AC
1.1 787 20 20 35 1.8 17.5 27.3 [18]
5. Diethanol amine functionalized activated alumina beads
1.1 205 5 10 35 0.02 - 55 [29]
6. Palm shell AC impregnated with sterically hindered amine
2.0 822 10 30 40 3.2 37.1 64 [30]
7. Amine impregnated titanium oxides
0.6 930 2 10 75 0.02 20.0 91.5 [31]
8. NaOH modified activated alumina
1.1 207 5 15 35 0.02 19.6 51.9 [32]

DOI:10.4186/ej.2019.23.4.29
ENGINEERING JOURNAL Volume 23 Issue 4, ISSN 0125-8281 (http://www.engj.org/) 43
NaOH loading (mg/g)
0 100 200 300 400 500
Hen
ry's
co
nst
ant
of
linea
r is
oth
erm
(K
, -)
0
2
4
6
8
10
12
14
16
18
20
% NaOH solution (%w/w)
0 2 4 6 8 10 12 14
AC1
AC2
Fig. 9. Effects of NaOH loading and carbon surface area on Henry’s constant of linear isotherm at 35 oC.
NaOH loading (mg/g)
0 100 200 300 400 500
Par
ticl
e m
ass
tran
sfer
co
effi
cien
t (k
p ,s-1
)
0.0
.2
.4
.6
.8
1.0
% NaOH solution (%w/w)
0 2 4 6 8 10 12 14
AC1
AC2
Fig. 10. Effects of NaOH loading and carbon surface area on particle mass transfer coefficient at 35 oC.

DOI:10.4186/ej.2019.23.4.29
44 ENGINEERING JOURNAL Volume 23 Issue 4, ISSN 0125-8281 (http://www.engj.org/)
NaOH loading (mg/g)
0 200 400 600 800 1000 1200 1400 1600
To
tal p
ore
vo
lum
e (c
m3/
g)
0.0
.1
.2
.3
.4
.5
.6
AC1
AC2
Curve fitting
Fig. 11. Variation of total pore volume with NaOH loading for activated carbon AC1 and AC2.
There are two expressions that can be used to arrive at the rate of adsorption ( /q t ) by a porous
adsorbent. The first equation is the linear driving force model characterized by the particle mass transfer coefficient (kp), as shown in Eq. (5). Another equation is derived from the mass balance equation performed on an adsorbate inside a spherical adsorbent, that is,
2
2[ ]eDq r q
t r r r
(16)
where De is the effective diffusivity that characterizes the diffusive flux of an adsorbate inside the particle and q is the adsorbed-phase concentration. Both De and kp are related according to Eq. (7), as shown previously.
NaOH loading (mg/g)
0 100 200 300 400 500
Eff
ecti
ve
dif
fusi
vit
y x 1
07(D
e ,m
2/
s)
0
1
2
3
4
5
% NaOH solution (%w/w)
0 2 4 6 8 10 12 14
AC1
AC2
Fig. 12. Effects of NaOH loading and carbon surface area on the effective pore diffusivity (De) at 35 oC.
DOI:10.4186/ej.2019.23.4.29
ENGINEERING JOURNAL Volume 23 Issue 4, ISSN 0125-8281 (http://www.engj.org/) 45
The effect of NaOH loading and surface area of the adsorbents on De is shown in Fig. 12. The variation trend of De resembles that of kp in Fig. 10, except that De remains relatively constant for loading below the critical loading of 180 mg NaOH/g carbon. This indicates that the increased deposition of NaOH has virtually no effect on the transport flux through the internal pores. Also, in this region AC2 shows a greater diffusivity than that of the AC1 carbon (3.8x10⁻⁷ vs. 1.57x10⁻⁷ m2/s), due principally to its larger pore volume and pore size. Again, at a very high alkali loading the transport flux of adsorbate to the adsorption sites will drop dramatically, causing the effective diffusivity to approach zero.
It has been reported by a number of investigators that the fixed-bed adsorption of CO2 on the surface of alkali impregnated activated carbon at temperatures lower than 40oC involves the physical interaction forces [18, 28, 29, 32], as demonstrated by the decreased amount of CO2 adsorption with an increasing adsorption temperature. On the contrary, Kongnoo et al. [27] reported a consistent increase of CO2 adsorption with the increase of temperature over the range from 40-70oC, indicating the chemisorption of adsorbent-adsorbate interaction. From this finding, it could be deduced that the demarcation between physical and chemical adsorption of CO2 by alkali impregnated activated carbons should occur at the temperature in the vicinity of 40oC.
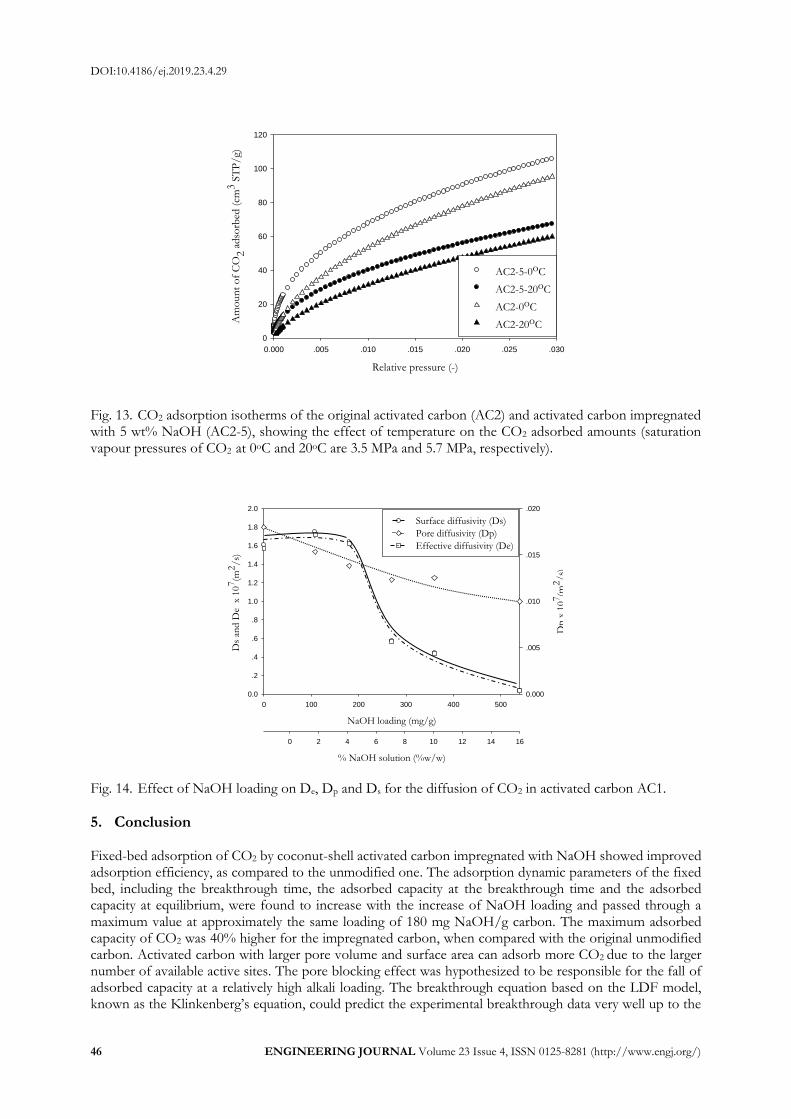
Based on the above argument, the adsorption of CO2 by the alkali-impregnated activated carbon in this work could be by physical interaction forces since the adsorption tests were conducted at 35oC. To check this further for the nature of adsorbent-adsorbate interaction forces, the equilibrium adsorption isotherms of CO2 by AC2 and AC2-5 were measured at 0 and 20oC using a surface area analyzer (ASAP2020, Micromeritics, US). The results are shown in Fig. 13. It is noted that the amount of CO2 adsorbed decreases with the increase of adsorption temperature for both types of activated carbon, indicating that the adsorption of CO2 in the virgin activated carbon and activated carbon loaded with NaOH over this low temperature range does occur by physical interaction forces. It is further observed that the shape of CO2 isotherms up to the relative pressure of 0.03 resembles that of N2 isotherms in the low pressure range as shown in Fig. 2, suggesting that the adsorption of N2 and CO2 occur in small micropores of the activated carbon.
For physical adsorption, there are two diffusion mechanisms of an adsorbate inside the pores of an adsorbent, namely pore diffusion through the internal pore space as characterized by the pore diffusivity (Dp) and the surface diffusion as characterized by the surface diffusivity (Ds). The correlation of the effective diffusivity (De) with Dp and Ds is by the following equation [33],
(1 )
(1 )
p p p s
e
p p
D KDD
K
(17)
The pore diffusivity (Dp) was first estimated from Eq. (18) and followed by the computation of Ds via Eq. (17), knowing the value of De and Dp.
1
, ,[(1/ ) (1/ )]p m eff k effD D D (18)
where Dm, eff = effective molecular diffusivity of CO2 = εp Dm /τ Dk,eff = effective Knudsen diffusivity = εpDk /τ2 Dm = molecular diffusivity of CO2 Dk = Knudsen diffusivity of CO2 εp = particle porosity that is dependent on NaOH loading τ = tortuosity factor = 5.75 for activated carbon [34]
Figure 14 shows typical variation of the three transport properties (De, Dp and Ds) for activated carbon AC1 as a function of NaOH loading. Both Dp and Ds have a general tendency to decrease with an increasing NaOH loading as expected. Also, it is seen that the surface diffusivity has a value close to that of the effective diffusivity and its value is about two orders of magnitude larger than that of the pore diffusivity. From these results, it can be concluded that surface diffusion is the major mechanism of CO2 transport in coconut-shell activated carbon impregnated with NaOH, resulting from the large adsorbate concentration on the pore surface caused by the strong interaction of CO2 molecules and NaOH active sites.
DOI:10.4186/ej.2019.23.4.29
46 ENGINEERING JOURNAL Volume 23 Issue 4, ISSN 0125-8281 (http://www.engj.org/)
Relative pressure (-)
0.000 .005 .010 .015 .020 .025 .030
Am
oun
t o
f C
O2 a
dso
rbed
(cm
3 S
TP
/g)
0
20
40
60
80
100
120
AC2-5-0oC
AC2-5-20oC
AC2-0oC
AC2-20oC
Fig. 13. CO2 adsorption isotherms of the original activated carbon (AC2) and activated carbon impregnated with 5 wt% NaOH (AC2-5), showing the effect of temperature on the CO2 adsorbed amounts (saturation vapour pressures of CO2
at 0oC and 20oC are 3.5 MPa and 5.7 MPa, respectively).
NaOH loading (mg/g)
0 100 200 300 400 500
Ds
and D
e x
107(m
2/s)
0.0
.2
.4
.6
.8
1.0
1.2
1.4
1.6
1.8
2.0
Dp
x 1
07(m
2/
s)
0.000
.005
.010
.015
.020
% NaOH solution (%w/w)
0 2 4 6 8 10 12 14 16
Surface diffusivity (Ds)
Pore diffusivity (Dp)
Effective diffusivity (De)
Fig. 14. Effect of NaOH loading on De, Dp and Ds for the diffusion of CO2 in activated carbon AC1.
5. Conclusion Fixed-bed adsorption of CO2 by coconut-shell activated carbon impregnated with NaOH showed improved adsorption efficiency, as compared to the unmodified one. The adsorption dynamic parameters of the fixed bed, including the breakthrough time, the adsorbed capacity at the breakthrough time and the adsorbed capacity at equilibrium, were found to increase with the increase of NaOH loading and passed through a maximum value at approximately the same loading of 180 mg NaOH/g carbon. The maximum adsorbed capacity of CO2 was 40% higher for the impregnated carbon, when compared with the original unmodified carbon. Activated carbon with larger pore volume and surface area can adsorb more CO2 due to the larger number of available active sites. The pore blocking effect was hypothesized to be responsible for the fall of adsorbed capacity at a relatively high alkali loading. The breakthrough equation based on the LDF model, known as the Klinkenberg’s equation, could predict the experimental breakthrough data very well up to the

DOI:10.4186/ej.2019.23.4.29
ENGINEERING JOURNAL Volume 23 Issue 4, ISSN 0125-8281 (http://www.engj.org/) 47
exit concentration ratio (C/Co) of 0.80. The model parameters (kp and K) varied with NaOH loading in a similar fashion to that of the adsorption capacity. Further analysis of the breakthrough model’s parameters showed that surface diffusion is the dominant transport mechanism of CO2 inside the pores of activated carbon and the value of surface diffusivity was about two orders of magnitude larger than the pore diffusivity for the parallel diffusion of adsorbate through the pore space.
Acknowledgements The support of this work in form of graduate scholarship to SN from Suranaree University of Technology is gratefully acknowledged.
References [1] Y. C. Chiang and R. S. Juang, “Surface modification of carbonaceous materials for carbon dioxide
adsorption: A review,” Journal of the Taiwan Institute of Chemical Engineers, vol. 71, pp. 214-234, 2017. [2] B. Metz, O. Davidson, H. de Coninck, M. Loos, and L. Meyes, Intergovernmental Panel on Climate Change
(IPCC). Special Report on Carbon Dioxide Capture and Storage, Cambridge, UK and New York, USA: Cambridge University Press, 2005.
[3] Science Daily. (2018). Carbon Dioxide Emissions from Power Plants Rated Worldwide [Online]. Available: www.sciencedaily.com/releases/2007/11/071114163448.htm
[4] D. Y. C. Leung, G. Caramanna, and M. M. Marotq-Vales, “An overview of current status of carbon dioxide capture and storage technologies,” Renewable and Sustainable Energy Reviews, vol. 39, pp. 426-443, 2014.
[5] N. A. Rashidi and S. Yusup, “An overview of activated carbon utilization for the post-combustion carbon dioxide capture,” Journal of CO2 utilization, vol. 13, pp. 1-16, 2016.
[6] A. L. Chaffee, G. P. Knowles, Z. Liang, I. Zhang, P. Xiao, and P. A. Webley, “CO2 capture by adsorption: Materials and process development,” International Journal of Greenhouse Gas Control, vol. 1, pp. 11-18, 2007.
[7] A. L. Yaumi, M. Z. Abu Bakar, and B. H. Hameed, “Melamine-nitrogenated mesoporous activated carbon derived from rice husk for carbon dioxide adsorption in fixed-bed,” Energy, vol. 155, pp. 46-55, 2018.
[8] A. E. Creamer, B. Gao, and S. Wang, “Carbon dioxide capture using various metal oxyhydroxide-biochar composites,” Chemical Engineering Journal, vol. 283, pp. 826-832, 2016.
[9] J. Singh, H. Bhunia, and S. Bagu, “Synthesis of porous carbon monolith adsorbents for carbon dioxide capture: Breakthrough adsorption study,” Journal of the Taiwan Institute of Chemical Engineers, vol. 89, pp. 140-150, 2018.
[10] O. Boujibar, A. Souikny, F. Ghamouss, O. Achak, M. Dahbi, and T. Chafik, “CO2 capture using N-containing nanoporous activated carbon obtained from argan fruit shell,” Journal of Environmental Chemical Engineering, vol. 6, pp. 1995-2002, 2018.
[11] N. A. Rashidi, S. Yusup, and A. Borhan, “Development of novel low-cost activated carbon for carbon dioxide capture,” International Journal of Chemical Engineering and Applications, vol. 5, pp. 90-94, 2014.
[12] A. S. Ello, L. K. C. de Souza, A. Trokourey, and M. Jaroniec, “Coconut shell-based microporous carbons for CO2 capture,” Microporous and Mesoporous Materials, vol. 180, pp. 280-283, 2013.
[13] E. David and J. Kopac, “Activated carbon derived from residual biomass pyrolysis and their CO2 adsorption study,” Journal of Analytical and Applied Pyrolysis, vol. 110, pp. 322-332, 2014.
[14] S. Shahkarami, R. Azargohar, A. K. Dalai, and J. Soltan, “Breakthrough CO2 adsorption in bio-based activated carbon,” Journal of Environmental Science, vol. 34, pp. 68-76, 2015.
[15] B. S. Caglayan and A. E. Aksoylu, “CO2 adsorption on chemically modified activated carbon,” Journal of Hazardous Materials, vol. 252-253, pp. 19-28, 2013.
[16] D. Das and B. C. Meikap, “Comparison of adsorption capacity of mono-ethanolamine and di-ehanolamine impregnated activated carbon in a multi-stage fluidized bed reactor for carbon-dioxide capture,” Fuel, vol. 224, pp. 47-56, 2018.
[17] Z. Chen, S. Deng, H. Wei, B. Wang, J. Huang, and G. Yu, “Activated carbons and amine-modified materials for carbon dioxide capture—A review,” Frontiers of Environmental Science & Engineering, vol. 7, pp. 326-340, 2013.
DOI:10.4186/ej.2019.23.4.29
48 ENGINEERING JOURNAL Volume 23 Issue 4, ISSN 0125-8281 (http://www.engj.org/)
[18] Y. L. Tan, Md. A. Islam, M. Asif, and B. H. Hameed, “Adsorption of carbon dioxide by sodium hydroxide modified granular coconut shell activated carbon in a fixed bed,” Energy, vol. 77, pp. 926-931, 2014.
[19] I. D. Seader and E. J. Henley, Separation Process Principles. John Wiley & Sons, 1998, ch. 15, p. 834. [20] R. T. Yang, Gas Separation by Adsorption Process. Imperial College Press, 1997, ch. 4, p. 125. [21] D. M. Ruthven, Principles of Adsorption and Adsorption Process. John Wiley & Sons, 1984, ch. 8, p. 236 [22] N. Wakao and T. Funazkri, “Effect of fluid dispersion coefficients on particle-to-fluid mass transfer
coefficients in packed beds: Correlation of Sherwood numbers,” Chemical Engineering Science, vol. 33, pp. 1375-1391, 1978.
[23] R. B. Bird, W. E. Stewart, and E. N. Lightfoot, Transport Phenomena. John Wiley & Sons, 1960, ch. 16, p. 510.
[24] D. D. Do, Adsorption Analysis: Equilibria and Kinetics. Imperial College Press, 1998, ch. 3, p. 84. [25] F. Rouguerol, J. Rouguerol, and K. Sing, Adsorption by Powders and Porous Solids. Academic Press, 1999,
ch. 6, p. 176. [26] K. S. W. Sing, D. H. Everett, R. A. W. Haul, L. Moscou, R. A. Pierotti, J. Rouqueral, and T.
Siemieniewska, “Reporting physisorption data for gas/solid systems with special reference to the determination of surface area and porosity,” Pure & Appl. Chem., vol. 57, pp. 603-619, 1985.
[27] A. Kongnoo, P. Intharapat, P. Worathanakul, and C. Phalakornkule, “Diethanol amine impregnated palm shell activated carbon for CO2 adsorption at elevated temperature,” Journal of Environmental Chemical Engineering, vol. 4, pp. 73-81, 2016.
[28] M. Auta, M. Umaru, M. D. Yahya, O. D. Adeniyi, I. M. Aris, and B. Suleiman, “Diethanilamine functionalized waste tea activated carbon for CO2 adsorption,” in International Conference on Chemical, Environment and Biological Science (CEBS-2015), Dubai (UAE), 2015.
[29] M. Auta and B. H. Hameed, “Adsorption of carbon dioxide by diethanolamine activated alumina beads in a fixed bed,” Chemical Engineering Journal, vol. 253, pp. 350-355, 2014.
[30] C. S. Lee, Y. L. Ong, M. K. Aroua, and W. M. A. W. Daud, “Impregnation of palm shell-based activated carbon with sterically hindered amines for CO2 adsorption,” Chemical Engineering Journal, vol. 219, pp. 558-564, 2013.
[31] L. Ma, R. Bai, G. Hu, R. Chen, X. Hu, W. Dai, and H. F. M. Dacosta, “Capturing CO2 with amine-impregnated titanium oxides,” Energy & Fuels, vol. 27, pp. 5433-5439, 2013.
[32] M. Auta, N. D. A. Darbis, A. T. M. Din, and B. H. Hameed, “Fixed-bed column adsorption of carbon dioxide by sodium hydroxide modified activated carbon,” Chemical Engineering Journal, vol. 233, pp. 80-87, 2013.
[33] C. Tien, Adsorption Calculations and Modeling. Butterworth-Heinemann, 1994, ch. 6, p. 88. [34] E. Costa, G. Calleja, and F. Domingo, “Adsorption of gaseous hydrocarbons on activated carbon:
Characteristic kinetic curve,” AIChE Journal, vol. 31, pp. 982-987, 1985.