Embed Size (px)
Citation preview

HERON Vol. 60 (2015) No. 1/2 113
Carbon footprint of concrete based on secondary materials
R.N. van Gijlswijk 1, S. Pascale 2, S.E. de Vos 1, G. Urbano 3
1 Netherlands Organisation for Applied Scientific Research TNO, P.O. Box 80015, 3508 TA
Utrecht, the Netherlands
2 Consorzio TRE – Technologies for Building Renovation, Vico II S.Nicola alla Dogana 9,
80133 Naples, Italy
3 D’Appolonia S.p.A, Via San Nazaro 19, 16145 Genova, Italy
The use of secondary materials instead of primary raw materials in concrete is a way to
decrease its environmental impact. On the one hand it gives a high grade use to the secondary
material, thereby avoiding disposal. On the other hand, the production of concrete no longer
involves preparation and/or mining of primary raw materials. This way, concrete from
secondary materials has the potential to save energy and associated CO2-emissions compared
to more traditional concrete. However, the conversion of secondary material into binders and
aggregates with desired properties requires an energy consuming process as well, and an
investment. How does it influence the overall impact on the environment?
This paper presents the exploration of the environmental advantages and disadvantages of
several secondary raw materials-based concrete formulations compared to traditional
lightweight concrete in building applications. Recommendations are provided on how the
environmental performance of concretes based on secondary raw materials can be improved
over their life cycle.
Keywords: Secondary raw materials, embodied energy, carbon footprint, disposal, life-cycle
assessment, SUS-CON
1 Introduction
The use of concrete in construction leads to environmental burdens. Raw materials such as
limestone, gravel and sand are mined and processed to produce the constituents of
concrete, which leads to emissions of CO2 and air pollutants. Furthermore, fossil fuels are
consumed, contributing to natural resource depletion. In the same way, transport, mixing

114
and curing lead to emissions and depletion of fossil fuel resources and mineral resources.
Post service, the construction is demolished, whereby energy is consumed. The same holds
for crushing, sorting and disposal of construction waste from demolition. Finally, if the
material is applied as e.g. aggregate in new concrete or in (sub)base courses for asphalt
roads, an environmental benefit arises from the fact that the use of primary raw materials
is avoided.
If the entire life cycle is considered, other studies have pointed out that for concrete the
main environmental impact is related to the production processes of the binder and, to a
lesser extent, the aggregate. A possible way to reduce the environmental impact of the
production of concrete is to use secondary raw materials as source materials for concrete.
Provided the material has the required properties and is available in sufficient quantities, it
can replace constituents of concrete that are otherwise made of virgin materials such as
sand, gravel and Portland cement. The SUS-CON project aims at reducing the embodied
energy and the CO2 footprint of concrete by replacing the current binders by novel binders
made from secondary materials. Furthermore, the SUS-CON project targets at producing
novel secondary material based aggregates that are lightweight and thermally insulating,
to replace current lightweight aggregates. The novel binders and aggregates are combined
into environmentally friendly lightweight non-structural concrete.
In the project a number of promising concrete formulations have been developed, for
application as precast concrete blocks and façade panels as well as for ready-mix concrete
for floor screed underlayment (also known as blinding layer). This paper describes an
environmental evaluation on these concrete formulations focused on the greenhouse gas
emissions1. In other words, a carbon footprint has been established of the promising
concrete varieties. To know to what extent this carbon footprint of concrete is affected by
the change of source materials, functionally similar benchmark concretes are introduced
for each of the three application fields.
1 In future work within the project, other environmental impacts are addressed as well, such as
the effects of air pollution (e.g. acidification and health effects caused by particulates), toxicity,
depletion of abiotic and biotic natural resources and land scarcity.

115
2 Scenarios
2.1 General
To be able to make a comparison of the carbon footprint of innovative concrete products
with their traditional counterparts, the environmental impact needs to be expressed
relative to the function of the construction they are used in. In other words, products
should be compared on a common ground, and expressed in a calculation unit that is
related to the function of the construction. Table 1 shows the calculation unit for each
product type. For instance, the function of a floor is to support the interior, which can be
expressed in m2 area. The floor screed underlay is part of the floor, and its function can be
expressed in m2 as well. One m2 has been chosen as the calculation unit. The thickness of
the floor screed underlay is set to 0.18 m, which means that for each calculation unit of 1
m2, 0.18 m3 of concrete is needed. The data in the thickness column in Table 1 have been
supplied by manufacturers in the project consortium.
Table 1: Calculation units
Product Construction Functional
unit
Thickness
(m)
Calculation
unit
Volume of
concrete per
calculation unit
(m3)
Block Block variable - 1 m3 * 1
Floor
screed
underlay
Floor supporting
1 m2 interior
0.18 1 m2 0.18
Façade
panel
Façade flashing 1
m2
0.20 1 m2 0.20
*) because of their versatility, for blocks a unit of volume was chosen as a calculation unit.
2.2 Benchmark concrete
Each of the three products has two respective benchmark products, traditional products
that are currently on the market. The two benchmarks differ in binder composition: the
conservative variety has ordinary Portland cement (OPC) as a binder (CEM I), the second,
more environmentally friendly variety has a CEM III/A 32.5 binder with a mix ratio of
50% OPC and 50% ground granulate blast furnace slag (GGBS). The conservative variety is
included because in southern Europe OPC is the binder of choice; it can be seen as a worst

116
case in terms of environmental impact. The second variety is a proxy for the average
European binder; it forms the middle ground between OPC and the in some northern
countries frequently applied CEM III/B which contains 70% slag.
The aggregates vary among the three products, and were selected in such a way, that the
resulting concrete mix density is in the same range as the density of the SUS-CON mixes.
For blocks, the benchmark is based on Liapor expanded clay, mixed with natural sand. For
floor screeds the aggregate consists of expanded polystyrene (EPS) and natural sand. For
the façade panel benchmarks more research needs to be done to find an aggregate with an
appropriate density. As a temporary solution, aerated autoclaved concrete (AAC) panels
were selected, of which the density is much lower than the corresponding secondary raw
material based formulations. The aggregate is natural sand, and gypsum and quicklime as
well as aluminum powder are added as active components.
2.3 SUS-CON concrete
In Visser et al. (2015) an overview is given of the eight mixtures that seemed initially
suitable as lightweight concrete for non-structural applications. The materials applied
therein are listed in table 2.
Table 2: Secondary binders and aggregates
Category Material Specifications
Binder Pulverized fly ash (PFA)
Ground granulated blast furnace slag (GGBS)
Aggregate Polyurethane (PU) rigid foam granulate PU foam scrap
Tyre rubber scrap Iron-free tyre rubber
granulate
Remix HD mixed plastics aggregate
Remix LD expanded mixed plastics
2.4 Mix designs
Various secondary material based binder-aggregate combinations and formulations were
considered for the three applications. The mix designs that have led to promising concrete
properties are listed in table 3, 4 and 5 for blocks, floor screeds, and façade panels
respectively. The first entries in the tables are the benchmarks, marked with code B. The
compositions in kilograms per cubic meter are provided in Annex 1.

117
Table 3: Mix designs considered for lightweight blocks; target density 1000-1400 kg/m3
Mix ID Binder Binder additives* Aggregate
B1 CEM I - Liapor, natural sand
B2 CEM III/A - Liapor, natural sand
2_1 PFA waterglass and sodium
hydroxide
PU foam 4-8 mm; natural sand 0-2
mm
2_2 PFA waterglass and sodium
hydroxide
PU foam
2_3 PFA waterglass and sodium
hydroxide
Tyre rubber 0-0.6 mm, tyre rubber
2-4 mm; natural sand 0-2 mm
3_3 PFA/GGBS waterglass and sodium
hydroxide
PU foam 0-4 mm, PU foam 4-8 mm
3_4 PFA/GGBS waterglass and sodium
hydroxide
Remix HD 1-4 mm, Remix LD 8-
12.5 mm
*) WG + NaOH: waterglass and sodium hydroxide
Table 4: Mix designs considered for lightweight floor screed (underlay); target density <1100 kg/m3
Mix ID Binder Binder additives Aggregate
B3 CEM I - EPS and natural sand
B4 CEM III/A - EPS and natural sand
3_1 PFA/GGBS waterglass and sodium
hydroxide
PU foam 0-4 mm, PU foam 4-8 mm
Table 5: Mix designs considered for lightweight façade panels; target density <1500 kg/m3
Mix ID Binder Binder additives Aggregate
B5 CEM I aluminium powder Gravel, natural sand
B6 CEM III/A aluminium powder natural sand
2_4 PFA waterglass and sodium
hydroxide
Remix HD 1-4 mm; natural sand 0-2
mm
3_2 PFA /
GGBS
waterglass and sodium
hydroxide
PU foam 0-4 mm, PU foam 4-8 mm

118
3 Approach
3.1 Scope
In environmental evaluations of products, the scope of the evaluation is an important
consideration, because one wants all consequences of changing from one to another option
to be inside the scope. The complete chain from mining/acquisition of raw materials up to
recycling and waste treatment should be included to ensure that a shift of the
environmental impact from one phase to the other is taken into account. For concrete from
non-traditional materials, it is important to be aware of possible additional impact at the
end-of-life treatment of concrete. The present environmental evaluation encompasses a full
life-cycle assessment (LCA). A number of guidelines and standards have been published
specifically for environmental assessments of building products. The present work has
been conducted according to the requirements and the provisions of:
- ILCD Handbook
- EN 15804:2012 Sustainability of construction works ― Environmental product
declarations ― Core rules for the product category of construction products
- EN 15978:2010 Sustainability of construction works - Assessment of
environmental performance of buildings - Calculation method
The environmental assessment in this paper has a ‘cradle-to-grave’ scope, covering the
chain of processes from acquisition of materials up to end-of-service-life recycling of
benchmark concrete and SUS-CON innovative concrete. The scope is illustrated in Figure 1
for innovative concrete. Primary raw materials (P) are used, such as waterglass activator.
Furthermore, secondary raw materials (S) are needed as an input. In the light of the aim in
the project, the secondary waste streams that have little or no economically viable
alternative uses at the moment have been shown separately (S0). This holds for e.g. PU
foam, tyre rubber and Remix plastics.
Figure 2 shows the scope for the benchmark products. Raw materials include primary raw
materials such as Portland cement and sand, as well as secondary raw materials, notably
GGBS.
Normally at this point the scope of the analysis would be complete. Yet, if we consider the
consequences of using SUS-CON innovative concrete instead of traditional, there is
another effect that is not addressed yet: recycling or, more likely, disposal of either PU, tyre
rubber or mixed plastics is avoided by using these materials as a constituent of concrete. In

119
other words, in the case of traditional concrete, processing of these ‘S0’ materials should
take place, while in the case of innovative concrete they are utilized. In Figure 2 therefore
treatment of ‘S0’ secondary raw materials is added to the scope.
The other way around this line of reasoning has no consequences: raw materials used in
traditional concrete are simply not mined in the case of SUS-CON concrete, or most likely
used for a different purpose in the case of PFA or GGBS. One could debate though that the
scope discussion has a local demand and supply component as well, which goes beyond
the scope of this paper.
The time horizon of the assessment is limited to 100 years. This means that for activities
that may generate emissions over a long period of time, such as maintaining a landfill site,
the emissions that occur after 100 years are cut off.
Figure 1: Scope of assessment for innovative concrete. P=primary raw materials, S=secondary
materials, S0=secondary raw materials with few alternative destinations
Figure 2: Scope of assessment for traditional concrete. P=primary raw materials, S=secondary
materials, S0=secondary raw materials with few alternative destinations

120
3.2 Methodology
Of each process within the scope of the assessment, the direct and indirect emissions of
greenhouse gases were collected, weighted and added up for one functional unit as in table
1. Greenhouse gases disturb the energy balance of the earth-atmosphere system, by
absorbing and re-emitting thermal infrared radiation that was emitted from the Earth’s
surface and would have normally disappeared into space. By this process, heat is retained
in the atmosphere. Disturbing the natural balance causes climate change. Greenhouse
gases include CO2, methane, dinitrogen monoxide, CFCs and HFCs, SF6 and some other
gases. The extent to which radiation into space is prevented by a greenhouse gas is called
radiative forcing. As a function of the concentration of a gas in the atmosphere, the
radiative forcing is expressed in W/m2. Apart from the radiative forcing, another factor
determining the contribution to climate change is the atmospheric lifetime of a greenhouse
gas. The longer the lifetime, the larger the contribution to climate change over time.
Thus, emitting greenhouse gases potentially contributes to climate change, depending on
their radiative forcing and their lifetime. The Intergovernmental Panel on Climate Change
(IPCC) has published a quantity to be able to compare this effect per kg of gas: Global
Warming Potential (GWP). The GWPs have been published in the IPCC Fourth
Assessment Report, 2007. The GWPs are expressed relative to the effect of CO2, for a
specific time scale. In this paper, the often-used time horizon of 100 years is maintained
(GWP100). The GWP100 of methane is 25 kg CO2-eq., meaning that the potential contribution
to climate change of 1 kg of methane emitted is equal to that of the emission of 25 kg of
CO2.
4 Environmental performance: cradle to gate
4.1 General
The formulation of each concrete mix considered is available in Annex 1. The production
processes of the various concrete components as well as other processes in the chain emit
greenhouse gases. The greenhouse gas emission factors for each process are included in
Annex 2.
To discuss the results in a logical way, the results in this paper are split in two parts. First,
results are shown with a limited scope: ‘cradle to gate’, which means production of
concrete up to the gate of the factory. These results are presented in paragraphs 4.2, 4.3 and
4.4, for the three target products. Secondly, in chapter 5 the full cradle to grave results are
shown, i.e. including end-of-life treatment.

121
4.2 Precast blocks 1 m3
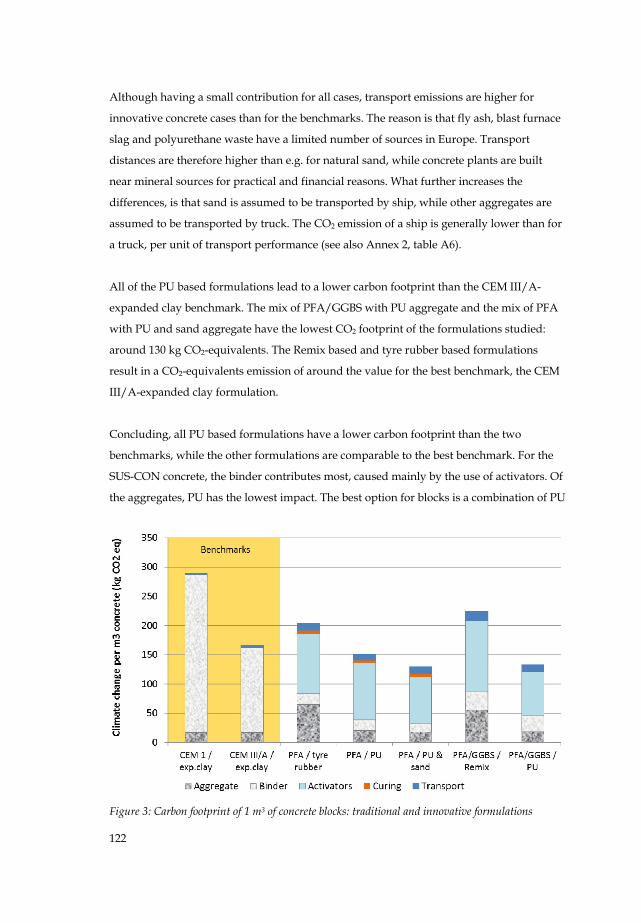
Figure 3 shows the carbon footprint of precast blocks. The benchmarks, CEM I and CEM
III/A, both with Liapor expanded clay aggregate, have a CO2 emission of just over 330 and
200 kg/m3, respectively. The high content of Portland cement in the CEM I benchmark
leads to a high CO2 emission in production, due to energy consumption and as a direct
emission from calcination of calcium carbonate. In the CEM III/A 32.5 mix the binder is a
mix of approximately 50% Portland cement with 50% GGBS, which leads to a lower
footprint for the binder than pure Portland cement as GGBS has a low CO2-emission. This
low CO2-emission results from the fact that it is a secondary product from the steel
industry, and size reduction and dewatering are the only activities to prepare it for use in
concrete.
As transport of raw materials contributes little and curing is done at room temperature, the
production of expanded clay aggregate is the only other significant source of CO2-
emissions for benchmark mixes. The energy consumption for clay expansion is largely
responsible for this.
All innovative concrete formulations have either pulverized fly ash (PFA) or a mix of PFA
and ground granulate blast furnace slag (GGBS) as a geopolymer binder. The carbon
footprint of preparing these binders is small compared to Portland cement containing
binders (roughly twenty times lower per kg; see table 6). Nevertheless, geopolymer
binders require significant amounts of waterglass and/or sodium hydroxide as activators.
The production of these two compounds causes the high CO2-eq. emissions. For PFA
binders, curing demands elevated temperatures, here 70 °C. This gives rise to CO2
emissions as well.
The production of the secondary aggregates is discussed in detail in Attanasio et al., 2015.
Generally speaking, several crushing, sieving and/or sorting steps are required to convert
PU scrap, old tyres and plastics waste into aggregate. Moreover PU needs a heated
pelletization process, and LD Remix needs a thermal expansion process. All of these
activities require energy, leading to CO2 emissions. Considering the mixes in figure 3, of
the three aggregates it is PU that leads to the least CO2 emissions. For a decrease of the CO2
emission, research should be targeted at, respectively, an energy efficient pelletization for
PU, the possible application of tyre rubber scrap that has been cleaned less thoroughly, or a
reduction of the heat requirement for the expansion of LD Remix. Also, the acceptance of a
larger average grain size can contribute to energy savings.
122
Although having a small contribution for all cases, transport emissions are higher for
innovative concrete cases than for the benchmarks. The reason is that fly ash, blast furnace
slag and polyurethane waste have a limited number of sources in Europe. Transport
distances are therefore higher than e.g. for natural sand, while concrete plants are built
near mineral sources for practical and financial reasons. What further increases the
differences, is that sand is assumed to be transported by ship, while other aggregates are
assumed to be transported by truck. The CO2 emission of a ship is generally lower than for
a truck, per unit of transport performance (see also Annex 2, table A6).
All of the PU based formulations lead to a lower carbon footprint than the CEM III/A-
expanded clay benchmark. The mix of PFA/GGBS with PU aggregate and the mix of PFA
with PU and sand aggregate have the lowest CO2 footprint of the formulations studied:
around 130 kg CO2-equivalents. The Remix based and tyre rubber based formulations
result in a CO2-equivalents emission of around the value for the best benchmark, the CEM
III/A-expanded clay formulation.
Concluding, all PU based formulations have a lower carbon footprint than the two
benchmarks, while the other formulations are comparable to the best benchmark. For the
SUS-CON concrete, the binder contributes most, caused mainly by the use of activators. Of
the aggregates, PU has the lowest impact. The best option for blocks is a combination of PU
Figure 3: Carbon footprint of 1 m3 of concrete blocks: traditional and innovative formulations

123
and a binder with low activator consumption.
4.3 Floor screed (underlay) 1 m2
In figure 4 two traditional concrete floor screed underlays (CEM I based and CEM III/A
based) are compared to a screed underlay from geopolymer concrete with PU aggregate.
The carbon footprint of the traditional mix concrete is approximately 60 kg of CO2-
equivalents per m2 for the formulation with CEM I (Portland cement) binder, and 35 kg for
CEM III/A binder based formulation. The binder contributes 65 to 80% to the total CO2
emission. The aggregates are 410 kg of natural sand and 20 kg of EPS (expanded
polystyrene) per m3. The impact of the latter is much higher, despite the limited weight.
The production of EPS from crude oil is an energy intensive process, while the excavation
and transportation of sand is not.
The footprint of the SUS-CON innovative floor screed underlay is over 40% lower than the
footprint of the lowest EPS concrete underlay. Both binder and aggregate contribute to that
result. For the polyurethane aggregate holds that the material is obtained ‘for free’, in other
words: no burden for the original production is taken into account, because this is
attributed to the previous product. Consequently, only the processing (and transport) is
accounted for: pulverisation and compression moulding.
As can be seen in figure 4, the PFA/GGBS binder has an advantage over CEM I and CEM
III/A as well. The footprint of the PFA/GGBS binder is mainly related to the production of
waterglass and sodium hydroxide activators, and not to the preparation of fly ash or blast
furnace slag.
Concluding, the carbon footprint of innovative floor screed underlay is over 40% lower
than those of the two benchmarks. The production of activators, used in a significant
amount, is the main cause of the emission of CO2. Transport related emissions are higher
than for the benchmarks, but contribute just a few percent.
4.4 Façade panels
In figure 5 a Remix/PFA based façade panel is compared to two benchmarks. Both
benchmarks are aerated autoclaved concrete. The binder consists of Portland cement and a
50%/50% Portland cement/GGBS mixture, respectively, supplemented with gypsum and
quicklime. The aggregate is sand. Aluminium powder is added and reacts with quicklime

124
Figure 4: Carbon footprint of 1 m2 of floor screed underlay: traditional and innovative formulations
to form hydrogen gas, resulting in bubbles in the concrete, which give it its low density.
The SUS-CON concrete panels have PFA as a binder, which performs better in terms of
CO2 emission than the binders containing Portland cement. Nevertheless, the production
of alkaline activators required for geopolymeric binders such as PFA makes the benefit of
PFA more than reversed in terms of CO2 emissions.
As can be seen in figure 5, the impact of sand as an aggregate is negligible. The
contribution of Remix aggregate is small as well, also compared to the Remix based block
in figure 3. The reason for the low impact is that for panels only high density Remix is
used, thereby avoiding the energy intensive expansion process for the low density Remix.
The benchmarks are hardened in an autoclave. The CO2-emissions resulting from the
production of steam for the autoclave are visible under the item ‘curing’. Curing energy is
also required for the PFA/Remix formulation.
Transport emissions are higher for the innovative concrete formulations, due to larger
delivery distances for secondary materials based aggregates, compared to the delivery
distance of sand for the benchmarks. Moreover trucks are used instead of the barges used
for sand.

125
Figure 5: Carbon footprint of 1 m2 of façade panels: traditional and innovative formulations
Concluding, SUS-CON façade panels have a carbon footprint that is around or slightly
higher than that of the CEM I based benchmark. The activator for the binder largely
determines the footprint. Transport related emissions are higher than for the benchmarks,
but contribute just a few percent.
5 Environmental performance: cradle to grave
5.1 General
So far in this paper the destination of materials at the end of life has not been taken into
consideration. This holds for both the (avoided) end-of-life treatment of the secondary
materials used as constituents of SUS-CON concrete, as well as end-of life processing of the
SUS-CON concrete products. To avoid repetition, the results in this chapter are illustrated
for concrete blocks only.
5.2 Avoided waste treatment
As explained in chapter 2, in innovative concrete either PU, tyre rubber or Remix is used
which would otherwise have no or little useful purpose. For traditional concrete where
neither of these materials is used, PU, tyre rubber or Remix would have to be incinerated
or landfilled. Therefore, the scope of the assessment needs to be enlarged. Because the

126
innovative concrete puts ‘waste’ to use, the greenhouse gas emissions associated with the
waste treatment should be added to the greenhouse gas emissions of traditional concrete.
This line of reasoning is only valid in direct comparisons; if one compares traditional
concrete with PU based innovative concrete, waste treatment of the corresponding amount
of PU should be added to the CO2 balance of the traditional concrete. Comparing with a
tyre rubber based innovative concrete, this should be the respective amount of tyre rubber,
and so on.
In Europe, incineration is mandatory for combustible waste. Given the high calorific value
of PU foam, tyre rubber and Remix, these materials shall be incinerated. To account for
incineration, the direct emissions related to combusting these materials are included.
Furthermore, because incineration plants are commonly fitted with equipment to produce
electric power and heat , an environmental credit is awarded for the avoided production of
electricity in a power station and heat in a boiler.
For PFA and GGBS used in innovative concrete, no waste treatment has to be ‘charged’
onto the traditional concrete in the comparison, because these materials would otherwise
be used as cement replacements, or otherwise usefully applied, e.g. as a filler for asphalt;
see Attanasio et al., 2015 and Pascale et al., 2015. Thus, no benefits are accounted to
innovative concrete for PFA nor GGBS.
Figure 6 shows a comparison of the carbon footprint of concrete blocks: one Portland
cement based benchmark concrete, and one PFA based concrete with tyre rubber aggregate
(see also figure 3, the first and third column). The greenhouse gas emissions of incineration
of tyre rubber have been added for the benchmark case. As can be seen, this increases its
carbon footprint by more than a factor of 3.
Similarly, results were generated for all other benchmark-innovative concrete block
combinations. In order to avoid having to show a large number of graphs2, an attempt has
been made to simplify the presentation. In the next graphs the waste treatment related
greenhouse gas emissions are not added to the benchmark, but rather subtracted from the
2 For each innovative concrete a different waste treatment-related CO2 emission is to be added to
the benchmark, since it is related to the material (and amount) used in the innovative concrete:
PU, tyre rubber or Remix. This leads to a large number of graphs.

127
Figure 6: Carbon footprint of 1 m3 of concrete blocks: influence of avoided end-of-life treatment
(burden of waste treatment added to greenhouse gas emissions of benchmark concrete)
results for innovative concrete. In the comparison this leads to the same absolute
differences between traditional and innovative concrete footprints.
In figure 7, the influence of the avoided end-of-life treatment of secondary materials on the
carbon footprint is shown for concrete blocks. It can be seen that for each of the secondary
aggregates used in innovative concrete, there is an significant additional benefit for the
environment. After all, the alternative route for the secondary materials was less
environmentally friendly. The benefit is even larger than the environmental burden to
manufacture the concrete (the bars below zero are larger than the bars above zero), leading
to a net saving of CO2-eq. emissions. The net values, which are written in the graph, are
negative in that case. Obviously the balance is only complete when end-of-life treatment of
SUS-CON concrete is incorporated as well.
The bonus for not incinerating PU, Remix and tyre rubber is the main effect in figure 7. The
contribution of avoided recycling as aggregate of PFA and GGBS to the results is very
small.

128
Figure 7: Carbon footprint of 1 m3 of concrete blocks: influence of avoided end-of-life treatment of
secondary material
5.3 End-of-life treatment of traditional and innovative concrete
To make the balance complete, the foreseen end-of-life treatment of the building products
(SUS-CON innovative concrete and benchmark concrete products) should be included as
well. Several scenarios are possible. Given the life span of concrete products end-of-life
treatment will take place in the far future, which makes it difficult to predict which options
are realistic.
If it will be possible to separate polymer/rubber aggregates from binders, the polymers
can be incinerated while the binders can be reused as aggregate material for other
purposes. This would undo the environmental benefits shown in figure 7; effectively the
end-of-life treatment of the secondary materials is delayed by the life span of the concrete.
Obviously there is an additional burden due to energy consumption and possibly
chemicals consumption for the separation process. While it is a theoretical route, it can
serve as a worst case scenario.
If binders and aggregates of SUS-CON concrete formulations cannot be separated, it is
more likely that the concrete is either recycled into fresh concrete (if the properties are
acceptable), thereby replacing sand or gravel, or landfilled. Replacing sand and gravel has
a (small) benefit because it avoids mining of these materials. With respect to landfill,
controlled conditions are needed to prevent leaching of metals from the blast furnace slag

129
content, and emission of these metals to soil. The controlled conditions also prevent full
biological decomposition of plastics or rubber.
For the benchmarks the most likely scenario would be recycling into fresh concrete as
aggregate material. No market effects of oversupply are assumed.
Figure 8 and 9 indicate the environmental consequences of recycling of concrete and
landfill of concrete on the life cycle of concrete blocks. The modelling is based on Ecoinvent
database version 2.2, 2010.
As can be observed, the benefits of recycling of concrete are hardly visible in the graph; the
effect is negligible on the total carbon footprint of concrete blocks. The effect of landfill on
the other hand is clearly visible, mainly in the case of SUS-CON concrete, and is caused by
CO2 and methane emissions from landfill. These emissions are a result of the use of
machines to construct and maintain the landfill site, as well as of partial biodegradation of
plastics and rubber. The total greenhouse gas emissions over 100 years (see paragraph 3.1)
are approximately 80 g CO2-eq. per kilogram of landfilled plastics or rubber. The order of
preference of the concrete mixtures is not different if landfill is assumed.
Figure 8: Carbon footprint of 1 m3 of concrete blocks: influence of recycling of end-of-life concrete

130
Figure 9: Carbon footprint of 1 m3 of concrete blocks: influence of landfill of end-of-life concrete
Concluding, the avoided end-of-life treatment of the secondary materials used in SUS-
CON innovative concrete may have a significant influence on the results. If the aggregate
materials would have been incinerated, innovative products get a large credit for avoiding
that to happen. If the aggregate materials would have been recycled, SUS-CON products
should get an additional burden. The avoided end-of-life treatment of PFA and GGBS has
no significant influence on the carbon footprint of concrete products.
The destination of SUS-CON concrete and benchmark concrete at the end of their service
life has a limited influence on the results presented in this paper.
6 Environmental performance: sensitivity analysis
Since the information that the carbon footprint was built upon is somewhat uncertain, and
assumptions were made on some occasions, it is important to have an indication of the
robustness of the conclusions with regard to these uncertainties. This can be done by
testing the sensitivity of the results to a variation in input data or assumptions, within
reasonable boundaries.
The production of activators has a large share in the carbon footprint of the innovative
concrete cases. The CO2 emission of the production of sodium hydroxide and waterglass
was taken from the ecoinvent database version 2.2. For sodium hydroxide (50% in water)

131
this is a production mix of three production routes: diaphragm cell, membrane cell and
mercury cell. The carbon emissions vary approximately 15% among these routes. This is
mainly a result of differences in electricity consumption - the main driver for CO2 emission
in the production of sodium hydroxide, see figure 10.
Figure 10: Contribution of electricity consumption in carbon footprint of sodium hydroxide (50%)
production
For waterglass activator (37% waterglass in water), greenhouse gas emission data was
taken for the furnace process, which has an approximately 10% lower carbon footprint
than the alternative, a hydrothermal process. The choice for the furnace process is an
arbitrary one, no details have been requested from waterglass manufacturers. Figure 11
shows the breakdown of the carbon footprint of waterglass solution. Besides heat and
electricity, significant emissions emerge from the process itself, as well as in the production
of soda, one of the two main raw materials (the other one being silica).
Figure 11: Breakdown of carbon footprint of waterglass (37%) production via the furnace route
Apart from the variations in the production route, the data source is also of influence. If the
GaBi database is used (PE International, 2014) instead of the Ecoinvent database
(ecoinvent, 2010), the resulting carbon emissions are different. The reasons are that data
from different factories were used, and that different methodological choices were made
while interpreting the data. For instance, a German electricity mix is considered in the
132
sodium hydroxide production process in the GaBi database, as opposed to a European
average mix in the data set in the Ecoinvent database.
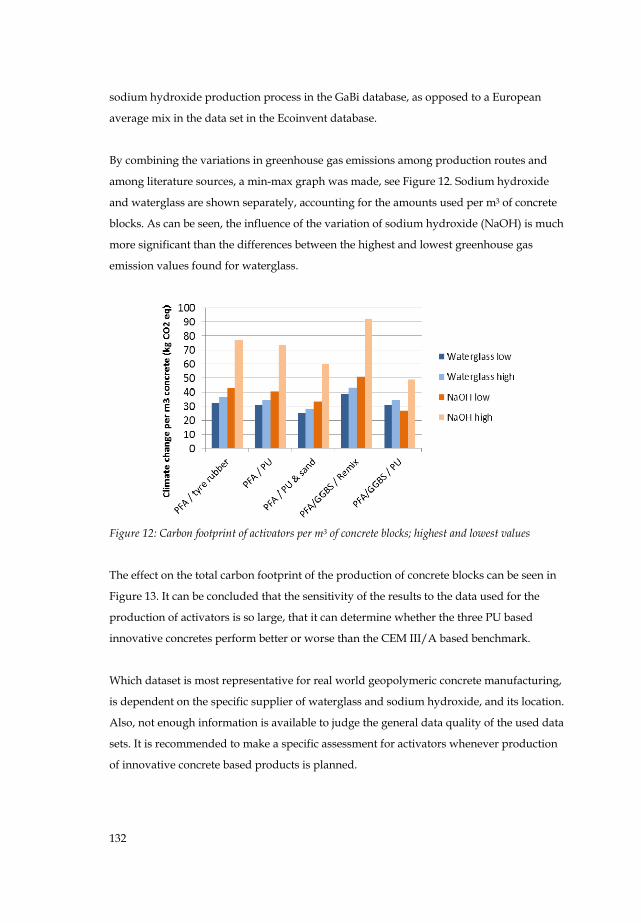
By combining the variations in greenhouse gas emissions among production routes and
among literature sources, a min-max graph was made, see Figure 12. Sodium hydroxide
and waterglass are shown separately, accounting for the amounts used per m3 of concrete
blocks. As can be seen, the influence of the variation of sodium hydroxide (NaOH) is much
more significant than the differences between the highest and lowest greenhouse gas
emission values found for waterglass.
Figure 12: Carbon footprint of activators per m3 of concrete blocks; highest and lowest values
The effect on the total carbon footprint of the production of concrete blocks can be seen in
Figure 13. It can be concluded that the sensitivity of the results to the data used for the
production of activators is so large, that it can determine whether the three PU based
innovative concretes perform better or worse than the CEM III/A based benchmark.
Which dataset is most representative for real world geopolymeric concrete manufacturing,
is dependent on the specific supplier of waterglass and sodium hydroxide, and its location.
Also, not enough information is available to judge the general data quality of the used data
sets. It is recommended to make a specific assessment for activators whenever production
of innovative concrete based products is planned.

133
In general, it is recommended to attempt optimization of the consumption of sodium
hydroxide and waterglass, and to do further research into utilizing secondary alkaline
materials for geopolymeric concrete.
Figure 13: Carbon footprint of the production of concrete blocks; highest and lowest emission values
for activators; L=lowest emission data, H=highest emission data
7 Conclusions
Secondary raw material based concrete products have the potential to decrease the carbon
footprint of state of the art concrete products. The potential is influenced by: 1) the
footprint of the production of activators for geopolymer binders, which are currently not
based on secondary materials, 2) the amount of energy needed for processing the
secondary materials into binders or aggregates, 3) the CO2 footprints of the traditional
constituents that are replaced by the secondary materials, such as Portland cement, and 4)
the avoided end-of-life treatment of the secondary materials utilized.
For the innovative products considered – blocks, floor screed underlays and façade panels,
activators contribute most to the carbon footprint. For blocks, in terms of production the
best option is a combination of PU and a binder with low activator consumption. The
carbon footprint of its production is 20% lower than the best benchmark. For the floor
screed underlay, the mix design considered is performing 40% better than the best
benchmark (CEM III/A based) in terms of carbon footprint. Transport related emissions
134
are higher than for the benchmarks due to longer distances, but contribute just a few
percent. The mix designs considered for façade panels perform marginally worse than
either of the two benchmarks. Also for panels transport related emissions are higher than
for the benchmarks, but contribute just a few percent.
In this article particular attention is paid to end-of-life treatment. Using secondary
materials with few alternative uses, such as PU foam waste, tyre rubber and Remix
plastics, avoids incineration of these materials. If the CO2 emissions from avoided
incineration are credited to the innovative concrete, the results change considerably. The
benefits of keeping PU, tyre rubber or Remix from being incinerated are larger than the
burdens from producing the concrete, expressed in terms of greenhouse gas emissions.
The true effect depends on the destination of innovative concrete after use. If aggregate
and binder can be separated in any way, and the aggregates are incinerated after all, the
sole effect is that incineration of PU, tyre rubber or Remix is delayed.
It is more likely that traditional and innovative concrete are reused as aggregate material
after the use phase. In that case, the end-of-life processing of concrete products has a
limited influence on the results presented in this paper.
The production of alkaline activators contributes over 50% to the greenhouse gas emissions
of the production of any of the innovative concrete mixes proposed. A sensitivity analysis
has been carried out of the main results for concrete blocks to variations in manufacturing
data of waterglass and sodium hydroxide. The results show that the total CO2-eq.
emissions of the production of concrete can vary up to 40% as a result of variations in
activator production data. The sensitivity of the results to the data used for the production
of activators is large enough to determine whether PU based innovative concrete blocks
perform better or worse than the CEM III/A based benchmark.
Efforts to improve the carbon footprint of the innovative concretes proposed, should first
be directed towards optimizing activator use or replacing the alkaline activator by a
secondary flow. Nevertheless, in SUS-CON the latter option was rejected after research,
due to a lack of availability of suitable flows. Other improvement directions are to reduce
energy consumption in pelletization of PU and the expansion of LD Remix, and using
larger average grain sizes for aggregates if possible.

135
Literature
Attanasio, A. et al., Waste materials as innovative aggregates for sustainable concrete, 2015
(unpublished).
Corti, A. and L. Lombardi, End life tyres: alternative final disposal processes compared by
LCA, Energy 29 (2004) 2089-2108, 2004.
Ecoinvent, Ecoinvent database 2.2, www.ecoinvent.ch, 2010.
EN 15804:2012 Sustainability of construction works ― Environmental product declarations
― Core rules for the product category of construction products, 2012.
EN 15978:2010 Sustainability of construction works - Assessment of environmental
performance of buildings - Calculation method, 2012.
Institut Bauen und Umwelt e.V., Environmental Product Declaration of Ytong Autoclaved
Aerated Concrete, Declaration number EPD-XEL-2009112-E, 2009.
Internal information FP7 SUS-CON
JRC-IES, International Reference Life Cycle Data System (ILCD) Handbook - General guide
for Life Cycle Assessment - Provisions and Action Steps, 2010.
Pascale, S. et al., Useable secondary materials for concrete products around Europe and the
barriers for general use, 2015 (unpublished).
PE International, GaBi LCA databases, 2014
Quadrini, F., D. Bellisario and L. Santo, Recycling of thermoset polyurethane foams, 2013.
Roorda, A.A.H., E. Langerak and B.L. van der Ven, Milieu-analyse verwerkingsmethoden
van kunststofonderdelen van afgedankte auto's, TNO, 1996.
SBR CUR net, Ontwerptool Groen Beton (Designtool Green Concrete), 2013.
United Nations Intergovernmental Panel on Climate Change, Climate Change 2007, Fourth
Assessment Report, 2007.
Visser, J.H.M. et al., Sustainable concrete: design and testing, HERON Vol. 60 (2015) No.
1/2, pp. 59–91.
Wittstock et al. 2012, EeBGuide Guidance Document - Part A: Products – Operational
guidance for Life Cycle Assessment studies of the Energy Efficient Buildings Initiative,
2012.

136
Annex 1 Mix formulations
Numbers are per m3 of concrete.
In the benchmark products, CEM I has a slag content of 0% and CEM III/A has a slag
content of 50%. Slag in this context is ground granulated blast furnace slag.
Table A1: Mix designs considered for lightweight blocks
Mix ID Binder Binder
additives*
Aggregate Other Density
fresh state
(kg/m3)
B1 CEM I
330 kg
- Liapor 54 kg natural
sand 83 kg
Water 165
kg
632
B2 CEM III/A
330 kg
- Liapor 54 kg, natural
sand 83 kg
Water 165
kg
632
2_1 PFA 459 kg WG 92 kg and
NaOH 53 kg
PU foam 4-8 mm 139
kg; natural sand 0-2
mm 477 kg
Water 116
kg
1336
2_2 PFA
558 kg
WG 112 kg
and NaOH 65
kg
PU foam 165 kg Water 70
kg
970
2_3 PFA 589 kg WG 118 kg
and NaOH 68
kg
Tyre rubber 0-0.6
mm 49 kg, tyre
rubber 2-4 mm 315
kg; natural sand 0-2
mm 331 kg
Water 135
kg
1605
3_3 PFA 76 kg
and GGBS
433 kg
WG 112 kg
and NaOH 43
kg
PU foam 0-4 mm 52
kg, PU foam 4-8 mm
97 kg
Water 149
kg
962
3_4 PFA 350 kg
and GGBS
350 kg
WG 140 kg
and NaOH 81
kg
Remix HD 1-4 mm
259 kg, Remix LD 8-
12.5 mm 53 kg
Water 171
kg
1404
*) WG: waterglass; NaOH: sodium hydroxide (50%).

137
Table A2: Mix designs considered for lightweight floor screed (underlay)
Mix ID Binder Binder
additives*
Aggregate Other Density
fresh state
(kg/m3)
B3 CEM I
310 kg
- EPS 19 kg, natural
sand 410 kg
Water 170
kg
909
B4 CEM III/A
310 kg
- EPS 19 kg, natural
sand 410 kg
Water 170
kg
909
3_1 PFA
367 kg and
GGBS 122 kg
WG 98 kg and
NaOH 38 kg
PU foam 0-4 mm
52 kg, PU foam 4-
8 mm 97 kg
Water 148
kg
922
Table A3: Mix designs considered for lightweight façade panels
Mix
ID
Binder Binder
additives*
Aggregate Other Density
fresh
state
(kg/m3)
B5 CEM I
86 kg, gypsum
13 kg, quick-
lime 45 kg
Aluminium
powder 0.5
kg
Natural sand 227
kg
Water 167 kg 599
B6 CEM III/A
86 kg, gypsum
13 kg, quick-
lime 45 kg
Aluminium
powder 0.5
kg
Natural sand 227
kg
Water 167 kg 599
2_4 PFA
648 kg
WG 130 kg
and NaOH
75 kg
Remix HD 1-4 mm
255 kg, natural
sand 0-2 mm 358
kg
Water 130 kg 1596
3_2 PFA 481 kg
and GGBS 85
kg
WG 113 kg
and NaOH
66 kg
PU foam 0-4 mm
74 kg, PU foam 4-
8 mm 74 kg
Water 166 kg 1059

138
Annex 2 Inventory of greenhouse gas emission data
In Table A4 greenhouse gas emissions are listed per process for manufacturing of concrete
components. The information has been derived from the Ecoinvent database version 2.2,
Table A4: CO2-equivalent emission factors of manufacturing concrete components
Material CO2-eq. emission factor
(g of CO2-eq. per kg)
Based upon
CEM I 816 Ecoinvent
CEM III/A (50% slag) 440 Ecoinvent
Pulverized fly ash (PFA) 32 Ecoinvent
Ground granulated blast
furnace slag (GGBS)
57 Ecoinvent
Natural sand 2 Ecoinvent
Gravel 2 Ecoinvent, assumed equal to sand
EPS 3376 Ecoinvent
Liapor 320 Ontwerptool Groen Beton 2013
PU rigid foam granulate 126 Ecoinvent + Quadrini 2013,
Roorda 1996
Tyre rubber scrap 178 Ecoinvent + Corti 2004
Remix HD 28 Ecoinvent + Internal information
from Centro Riciclo
Remix LD 922 Ecoinvent + Internal information
from Centro Riciclo
Waterglass activator,
37%
277 Ecoinvent (sensitivity analysis: PE
International 2014)
Sodium hydroxide
solution, 50%
1013 Ecoinvent (sensitivity analysis: PE
International 2014)
Aluminium powder 11740 Ecoinvent
Tap water 0 Ecoinvent

139
For tyre rubber scrap, the process results in recyclable steel threads. The environmental
benefits of recycling this steel have not been attributed to the rubber scrap aggregate.
Table A5 shows CO2 emission factors for waste disposal processes. All information in the
table has been derived from the Ecoinvent database version 2.2.
Table A5: CO2-equivalent emission factors of waste disposal processes
Process CO2-eq. emission factor
(gram of CO2-eq. per kg)
Landfill of inert material 2.4
Landfill of PFA 2.9
Landfill of GGBS (with immobilization) 312
Landfill of PU foam 85
Landfill of Remix 82
Landfill of rubber from tyres 82
Incineration of PU foam* 1140
Incineration of Remix* 1020
Incineration of rubber from tyres* 1960
*) with energy recovery
Table A6 shows CO2 emission factors for some key processes in the concrete life cycle. All
information in the table has been derived from the Ecoinvent database version 2.2.
Table A6: CO2-equivalent emission factors of other processes
Process CO2-eq. emission factor
(gram of CO2-eq. per unit)
Transport by truck (1 ton.km) 106
Transport by inland vessel (1 ton.km) 35
Transport by seagoing vessel (1 ton.km) 9
Electricity (1 kWh) 583
Heat from natural gas (1 MJ) 70

140