Embed Size (px)
Citation preview

Carbon Reduction Options in Power GenerationFederal Reserve Bank of ChicagoDetroit Branch
Conference on Cost-Effective Carbon ReductionDetroit, MIOctober 15, 2007
David K. Schmalzer, PhD, P.E.Manager, Fossil Energy ProgramArgonne National Laboratory

Disclaimer
The views and opinions of the author expressed herein do not necessarily state or reflect those of Argonne National Laboratory, the United States Government, or any agency thereof.

Overview
What needs to be doneWhen does it need to be doneWhere does electrical generation fitWhat are the options in generation US Generation Fleet Characteristics Retrofitting Existing PC Plants Fleet Impact of Retrofit CO2 Capture Issues Outside the Plant GateRegional Considerations

What Needs to be Done about CO2
UK's Stern calls on 'rich' nations for 75% cut in greenhouse gases– September 27, 2007 (Emissions Daily) -- Sir Nicholas Stern, told US
congressional staff on September 21 that the United States, EU countries and other industrialized nations should agree this year to cut emissions 75% below 1990 levels by 2050.
What constitutes an appropriate level of GHG in the atmosphere remains open to debate, but even modest scenarios for stabilization would eventually require a reduction in worldwide GHG emissions of 50 to 90 percent below current levels. Source: “Carbon Sequestration Program Environmental Reference Document”, August 2007, DE-AT26-04NT42070 National Energy Technology Laboratory
When Should CO2 Capture be Required
“The Future of Coal”, MIT, 2007– Recommendation #6b: Congress should act to close this potential
“grandfathering” loophole before it becomes a problem for new power plants of all types that are being planned for construction. (Page 100)
EPRI, “The Power to Reduce CO2 Emissions”, 2007– The technology development pathways outlined in this section are
intended to achieve two key targets: first, increase the efficiency of PC and IGCC baseload plants (with CO2 capture) to the 43-45% range by 2030; and second, ensure that all coal plants built after 2020 have the capability to capture and store 90% of the CO2 produced.

Carbon Dioxide Sources
US 2005: 5945 million tonnes CO2 all sectorsElectrical generation: 2375 million tonnesTransportation: 1953 million tonnesElectric power and transportation are roughly ¾ of the total
Source: EIA Annual Energy Review 2006

Why Electricity Generation is a Target
Transportation and coal-fired generation have similar CO2emissions– 1953 Million tonnes – coal 2005– 1944 Million tonnes – transportation sector 2005
There are about 1500 coal-fired generators, about 240 million cars and trucksThe average coal plant emitted 1.6 million tonnes, the average vehicle emitted 8.1 tonnes
Sources: Emissions: EIA Annual Energy Review 2006
Transportation: Transportation Energy Data Book, 26th Ed., ORNL, 2007

Electricity and Transportation
US Power Plants > 100 MW
Source: EIA Website 1536 total power plants greater than 100 MW

What are the Options in Electricity
Fuel switching– Substituting natural gas for coal
Post combustion capture– Conventional PC with amine scrubbing of flue gas– Oxyfuel PC with amine scrubbing of flue gas
Pre-combustion capture– IGCC
• FutureGen prototypeChemical looping and other approachesNuclear and renewables– These are subjects of other presentations today

Fuel Switching – Coal to Natural Gas
Existing coal fleet has 72.2% capacity factor, 32.8% thermal efficiencyExisting gas fleet has 23.7% capacity factor, 39% thermal efficiencySubstituting gas for coal reduces emissions about 53%, not 70-90% neededWe don’t have either the gas resources or deliverability to make this substitution

Post Combustion Capture
Conventional PC with Scrubbing– Costs– Derating, Efficiency reduction– Lack of utility-scale experience
Oxyfuel PC with Scrubbing– Cost, complexity– Air separation reduces efficiency, derates output– Lack of experience base

Pulverized Coal – No Capture

Current TechnologyPulverized Coal Power Plant
Source: Cost and Performance Baseline for Fossil Energy Plants, National Energy Technology Laboratory, April 10, 2007
Orange blocks added for carbon captureOrange blocks added for carbon capture

Oxyfuel PC with CO2 Capture

Oxyfuel Combustion
Source: NETL Carbon Sequestration ProgramUS Perspective on CO2 Capture and Separation, Jared P. Ciferno, April 27, 2004Stanford University

IGCC with Carbon Capture
Orange blocks added for carbon capture
Source: Cost and Performance Baseline for Fossil Energy Plants, National Energy Technology Laboratory, April 10, 2007

Existing US IGCC Plants
Wabash River
Tampa Electric
Source: http://www.netl.doe.gov/technologies/coalpower/gasification/pubs/photo.html
Both plants were built under the Clean Coal Technology Program of DOE

NGCC with Carbon Capture
HRSG
MEA
Combustion Turbine
Stack
Direct ContactCooler
BlowerCooling Water
Stack Gas
CO22200 psig
Reboiler Steam
Condensate Return
Source: Cost and Performance Baseline for Fossil Energy Plants, National Energy Technology Laboratory, April 10, 2007
Orange blocks added for carbon capture

Current Generation Capacity
Scale of current generation fleet– 970+ GW capacity, 16,000+ units– 1500 >100 MW plants, 400+ are PC – Pre-combustion fleet very small
• Wabash River, IN• Tampa, FL
Oxyfuel is a possible path from PC to IGCC with CCS– No utility-scale currently

US Generation Fleet Characteristics
Source: EIA Electricity Website, http://www.eia.doe.gov/neic/brochure/elecinfocard.html
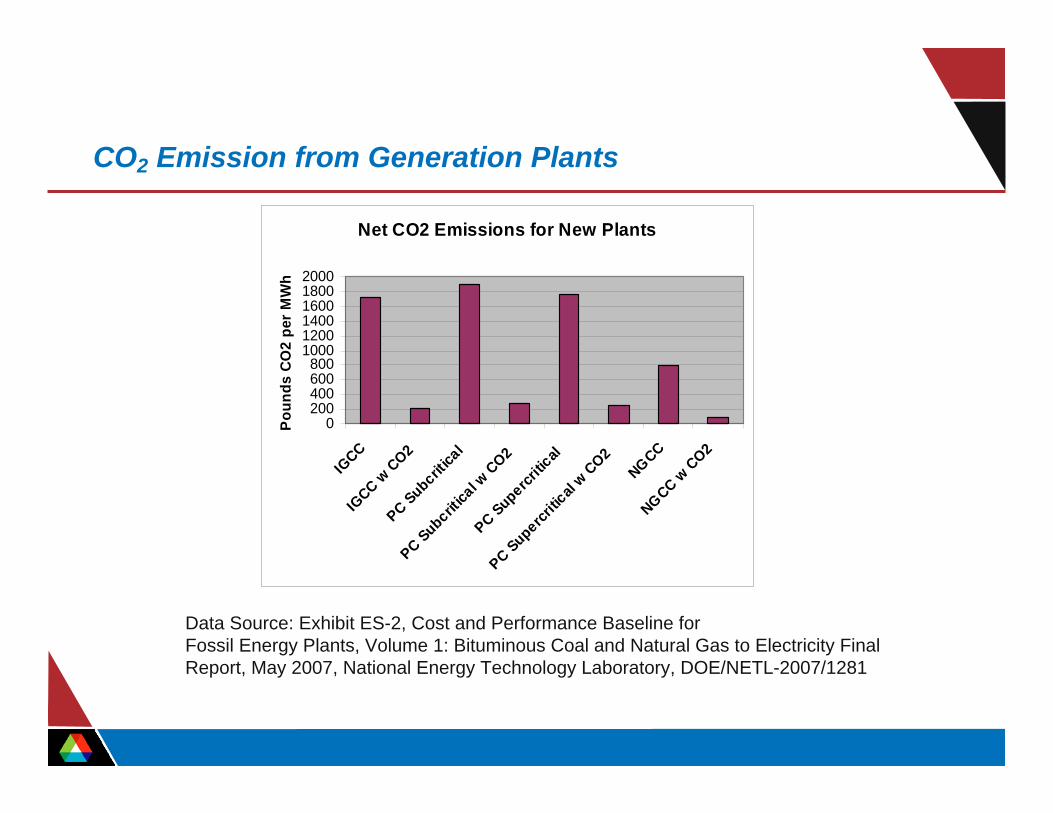
CO2 Emission from Generation Plants
Net CO2 Emissions for New Plants
0200400600800
100012001400160018002000
IGCC
IGCC w
CO2
PC Subcritica
l
PC Subcritica
l w C
O2
PC Supercritic
al
PC Supercritic
al w C
O2
NGCCNGCC w
CO2
Pou
nds
CO2
per
MW
h
Data Source: Exhibit ES-2, Cost and Performance Baseline forFossil Energy Plants, Volume 1: Bituminous Coal and Natural Gas to Electricity Final Report, May 2007, National Energy Technology Laboratory, DOE/NETL-2007/1281

Plant Cost Comparison
1841
2496
1549
2895
1575
2870
554
1172
0
500
1000
1500
2000
2500
3000
Avg IGCC Avg IGCCw/ CO2Capture
PC-Sub PC-Sub w/CO2
Capture
PC-Super PC-Superw/ CO2Capture
NGCC NGCC w/CO2
Capture
$/kW
($20
06)
Source: Cost and Performance Baseline for Fossil Energy Plants, May 15, 2007Revised August 2007, National Energy Technology Laboratory

Cost of Electricity Impacts
7.79
10.63
6.40
11.88
6.33
11.48
6.84
9.74
0.00
2.00
4.00
6.00
8.00
10.00
12.00
14.00
Avg IGCC Avg IGCCw/ CO2Capture
PC-Sub PC-Sub w/CO2
Capture
PC-Super PC-Superw/ CO2Capture
NGCC NGCC w/CO2
Capture
cent
s/kW
h ($
2007
)
January 2007 Dollars, Coal cost $1.80/106Btu. Gas cost $6.75/106BtuSource: Cost and Performance Baseline for Fossil Energy Plants, May 15, 2007Revised August 2007, National Energy Technology Laboratory

Retrofitting an Existing PC Plant
Conesville Unit #5 studied
Subcritical steam cycle
463 MW gross, 430 MW net
Bituminous coal
ESP and wet lime FGD
Source: CO2Capture From Existing Coal-FiredPower Plants, Jared P. Ciferno -National Energy Technology Laboratory, April 2007

Schematic of Plant Modifications
Source: CO2Capture From Existing Coal-FiredPower Plants, Jared P. Ciferno -National Energy Technology Laboratory, April 2007
This type of FGD would be needed for most coals, retrofit or new

Impacts on Net Output and CO2 Emissions
Source: CO2 Capture From Existing Coal-FiredPower Plants, Jared P. Ciferno -National Energy Technology Laboratory, April 2007
Capital costs ranged from 417 $/kW at 30% capture to 1010 $/kW at 90% capture

Fleet Impact of Retrofit CO2 Capture
Roughly 250 MW of incremental capacity needed for every 1000 MW of capacity retrofitted at 70% carbon captureNETL and Argonne are beginning a joint study to better understand the grid-level implications of retrofitting significant levels of generation capacity with CO2 capture– Midwest will be initial focus– Least-cost replacement power sources and impacts will
be examined

Issues Outside the Plant Gate
Pipeline costs, rights-of-ways, regulationsAvailability of adequate storage (sequestration) capacityUnsettled legal and regulatory issues– Who owns the CO2
• Is the CO2 a ‘waste’ or a product– Who owns the mineral rights and/or property rights at the
sequestration site– What will the monitoring requirements be
• How long will they run– If cap and trade, how will the trading regimen work– Who owns the short-term and long-term liabilities

US Power Plants and CO2 Pipelines
Top map from EIA websiteBottom map from “Prospects for Early Deployment of Power Plants Employing Carbon Capture”, Electric Utilities Environmental ConferenceTucson, AZ January 22-25, 2002, National Energy Technology Laboratory,

How does the Chicago FRB Region Compare to US
States of Illinois, Indiana, Iowa, Michigan, and Wisconsin taken as surrogate for FRB region
US Total
50%
3%19%
0%
19%
7%
2%
Coal
Petroleum
Natural Gas
Other Gases
Nuclear
Hydroelectric
Illinois, Indiana, Iowa, Michigan, Wisconsin
66%6%
25%

Regional Capacity and Generation
Illinois
48%
4%
48%
Indiana
95%
2%3%
Regional Generation 2005
0
50100150200
Illinois
Indiana
IowaMich
iganWisc
onsinM
illio
ns o
f Meg
awat
thou
rs
Other Renewables
Hydroelectric Nuclear
Other Gases Natural Gas
Petroleum
Coal

Contact Information
David SchmalzerArgonne National Laboratory(202) 488-2415(630) [email protected]
Thank you for your attention
Useful URLs
www.eia.doe.gov
www.netl.doe.gov
www.anl.gov