Embed Size (px)
Citation preview
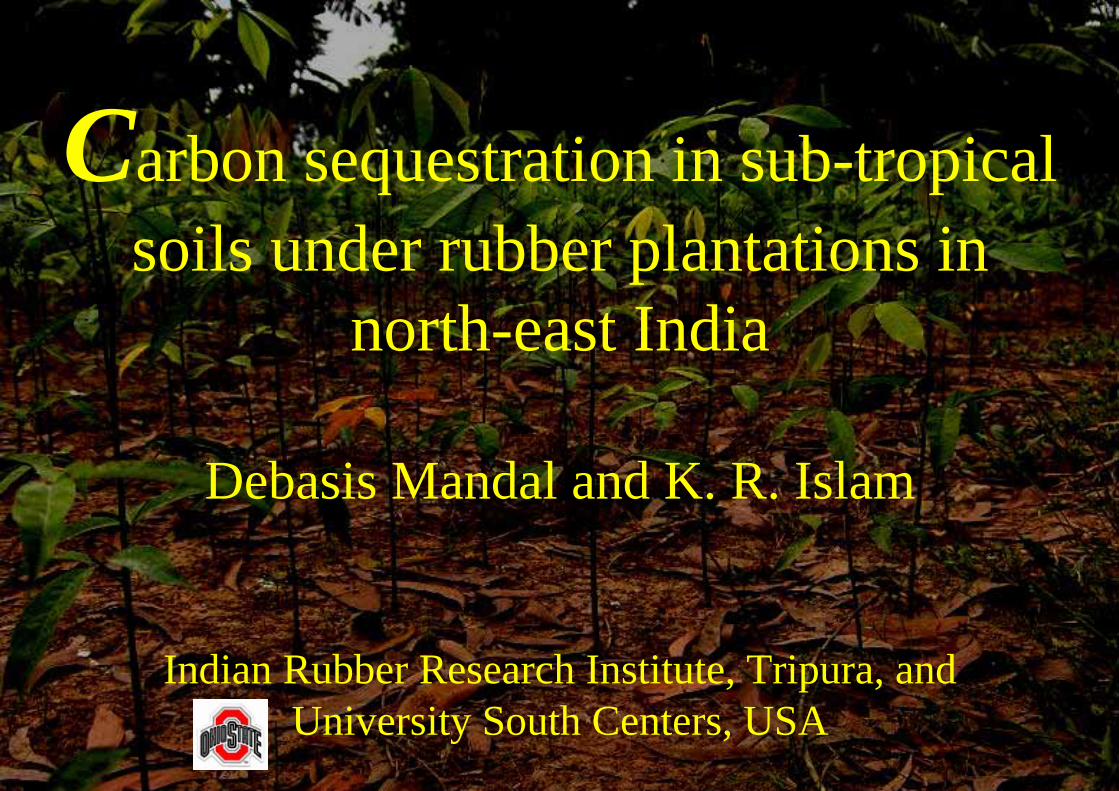
Carbon sequestration in sub-tropical soils under rubber plantations in
north-east India
Debasis Mandal and K. R. Islam
Indian Rubber Research Institute, Tripura, andUniversity South Centers, USA
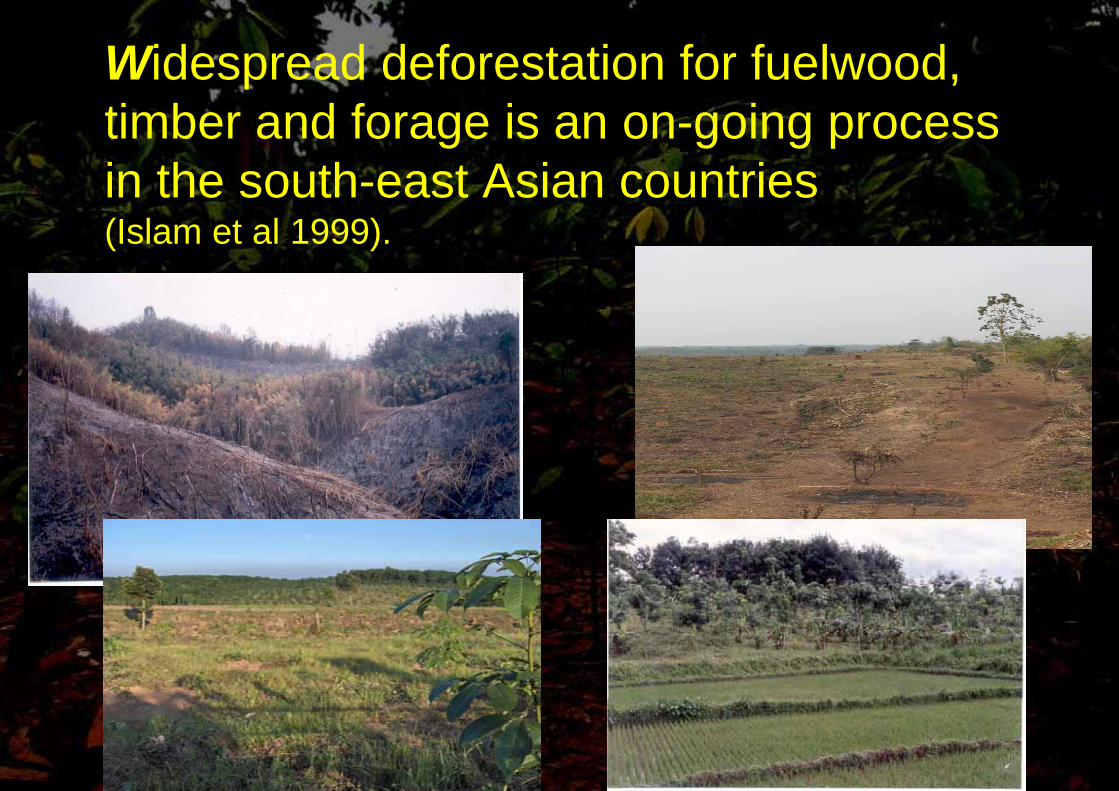
Widespread deforestation for fuelwood, timber and forage is an on-going process in the south-east Asian countries(Islam et al 1999).
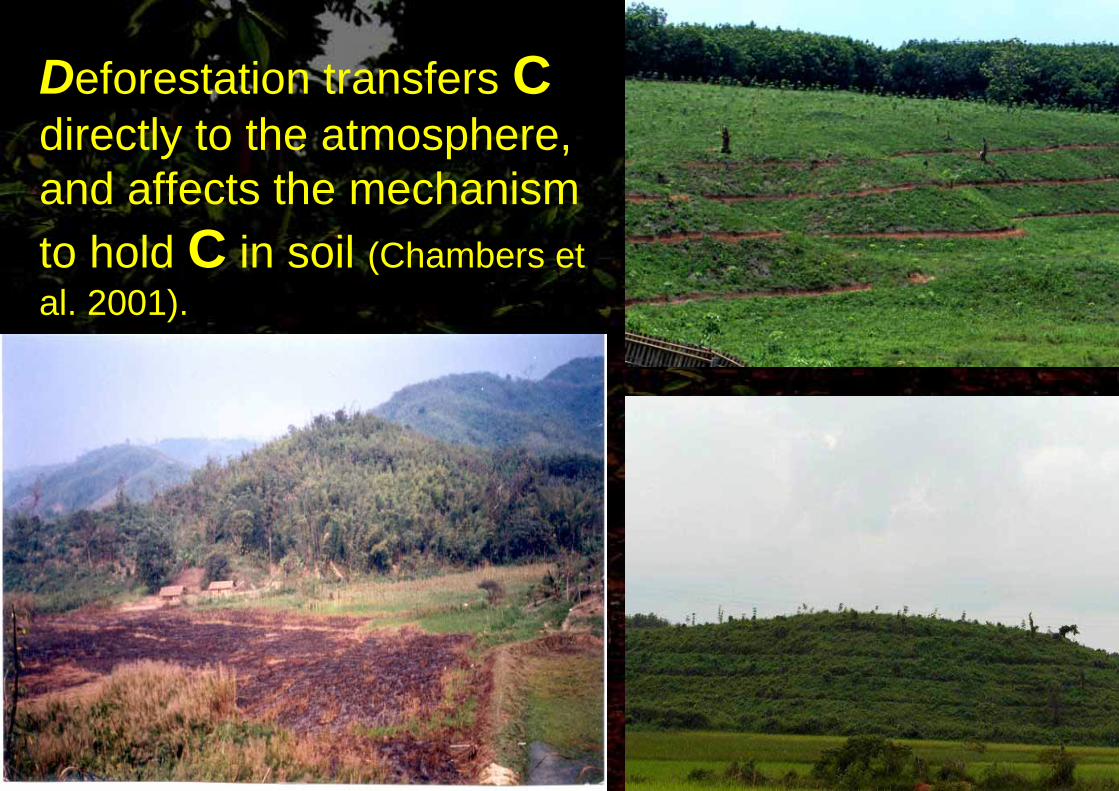
Deforestation transfers Cdirectly to the atmosphere, and affects the mechanism to hold C in soil (Chambers et al. 2001).
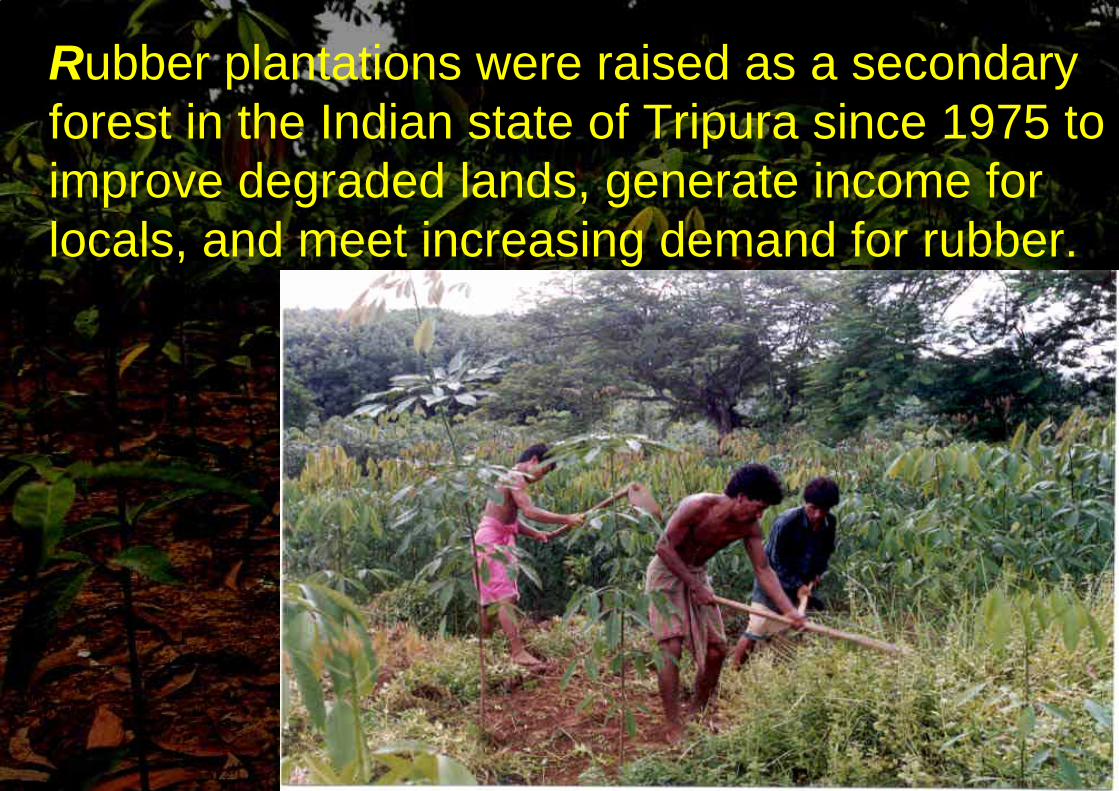
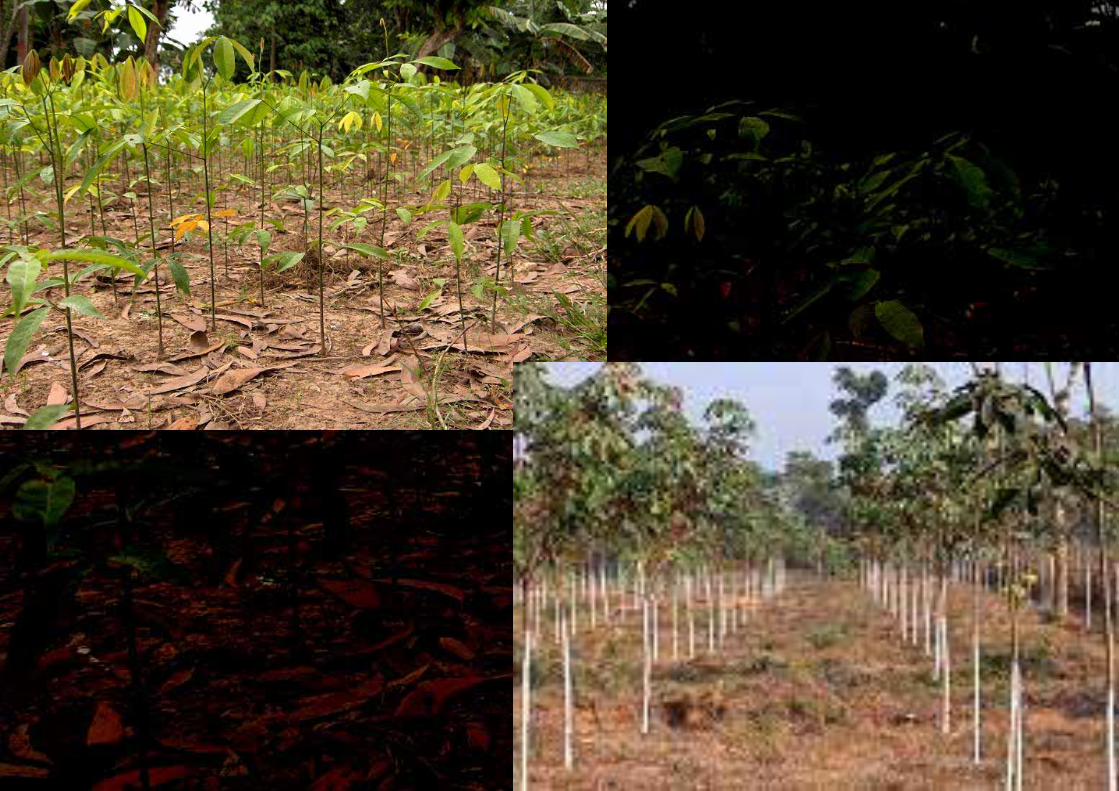
Rubber plantations were raised as a secondary forest in the Indian state of Tripura since 1975 to improve degraded lands, generate income for locals, and meet increasing demand for rubber.
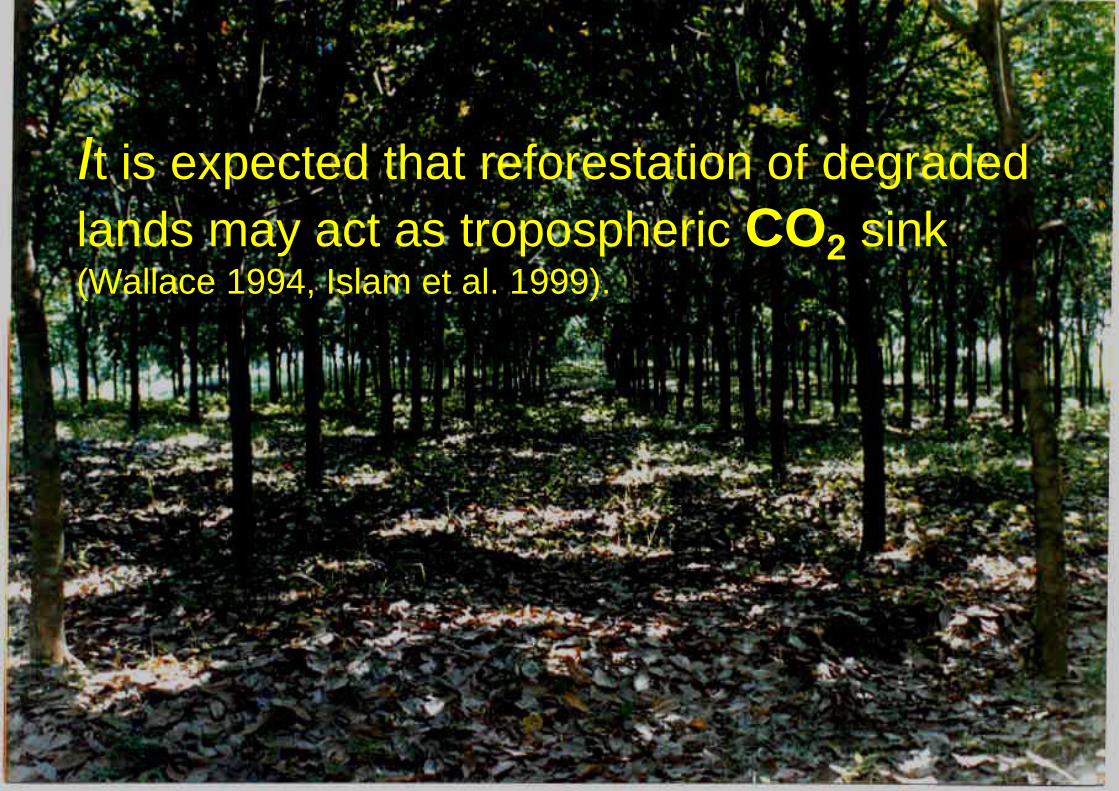
It is expected that reforestation of degraded lands may act as tropospheric CO2 sink (Wallace 1994, Islam et al. 1999).
This study was conducted to evaluate the impact of rubber plantations on C fractions, stocks, and sequestration in reforested degraded sub-tropical forest lands in Tripura, India.
Materials and methods
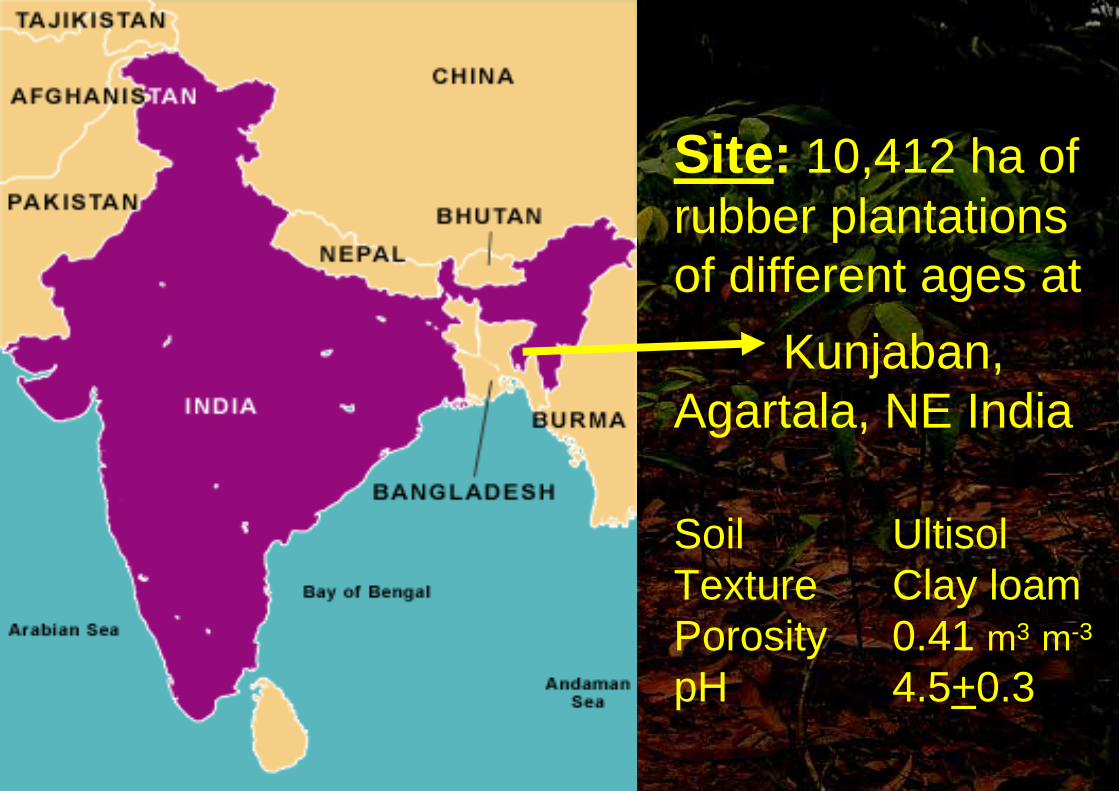
Site: 10,412 ha of rubber plantationsof different ages at
Kunjaban,Agartala, NE India
Soil UltisolTexture Clay loamPorosity 0.41 m3 m-3
pH 4.5+0.3
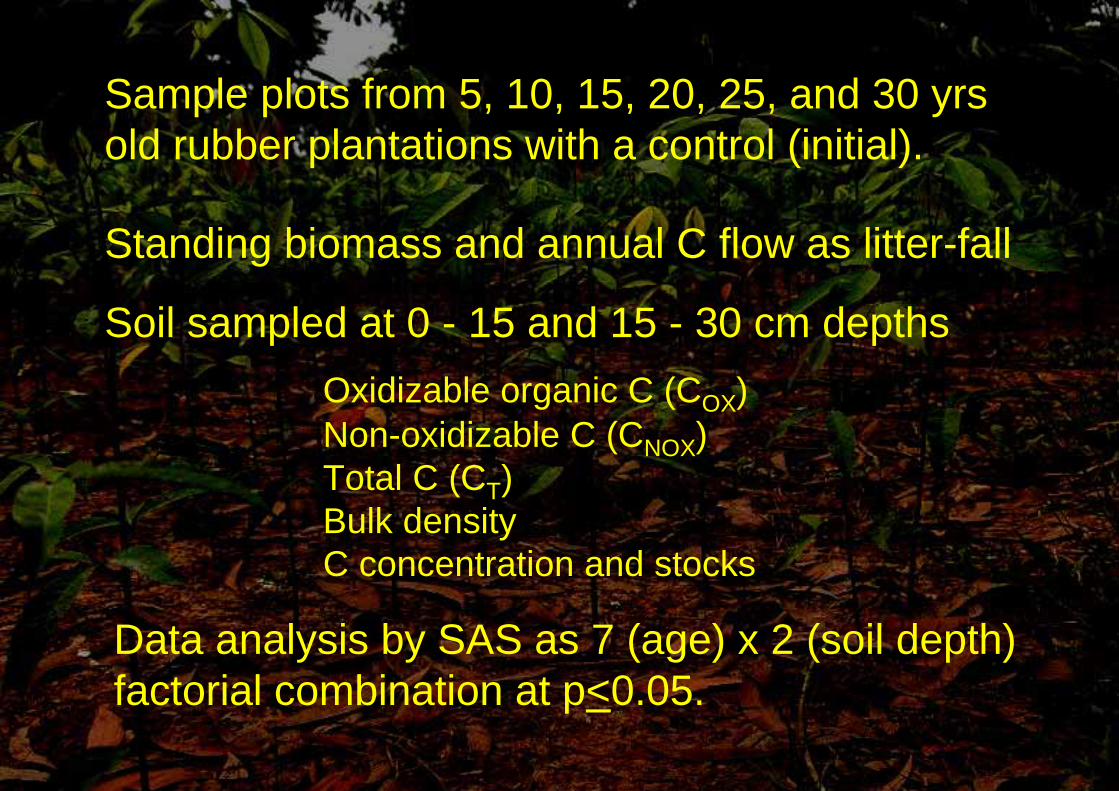
Sample plots from 5, 10, 15, 20, 25, and 30 yrs old rubber plantations with a control (initial).
Standing biomass and annual C flow as litter-fall
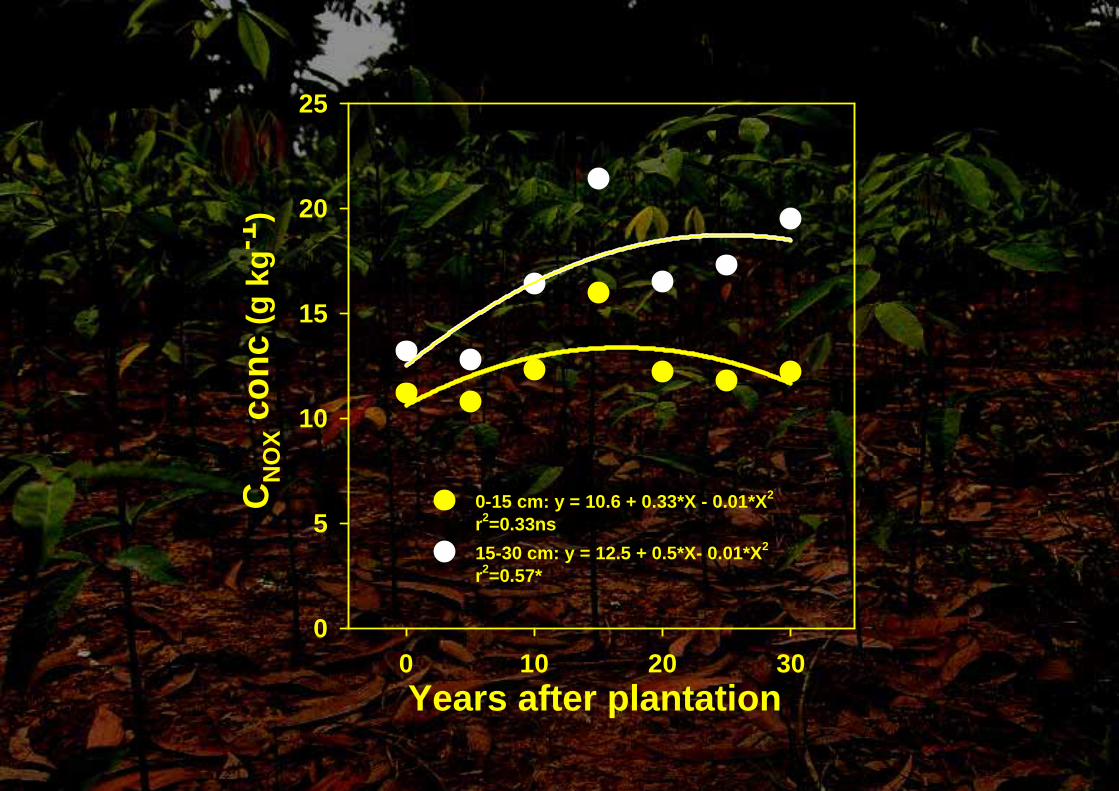
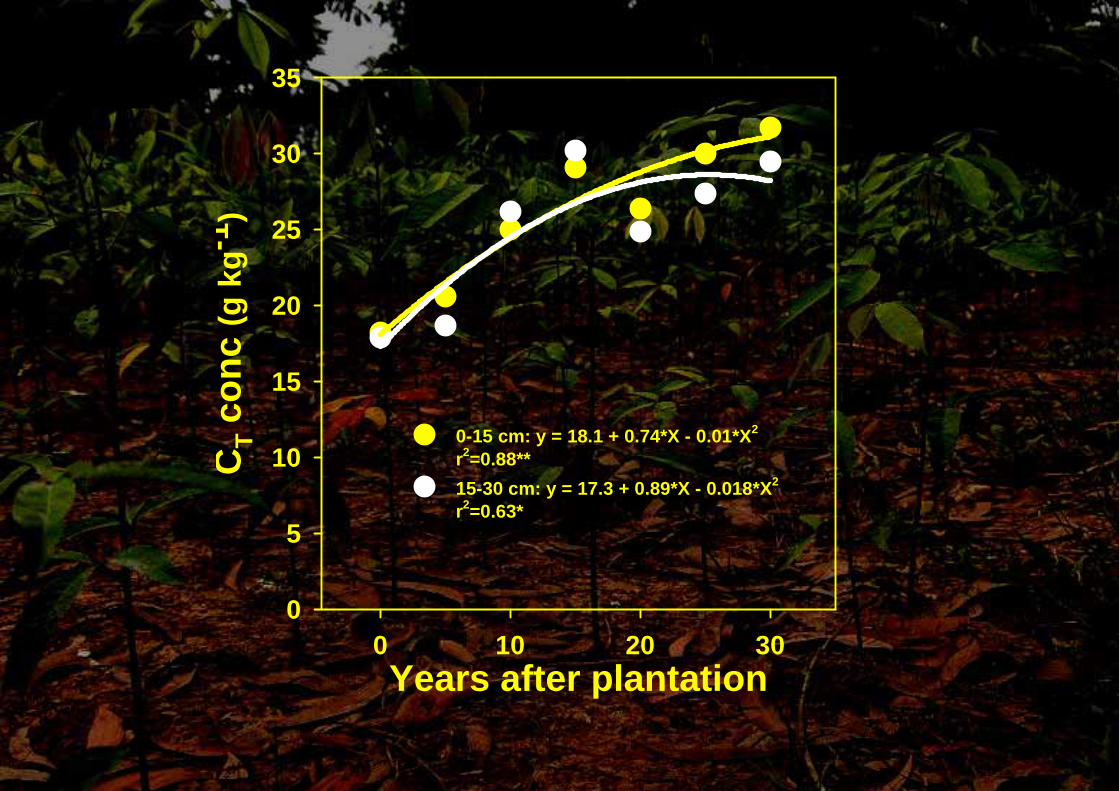
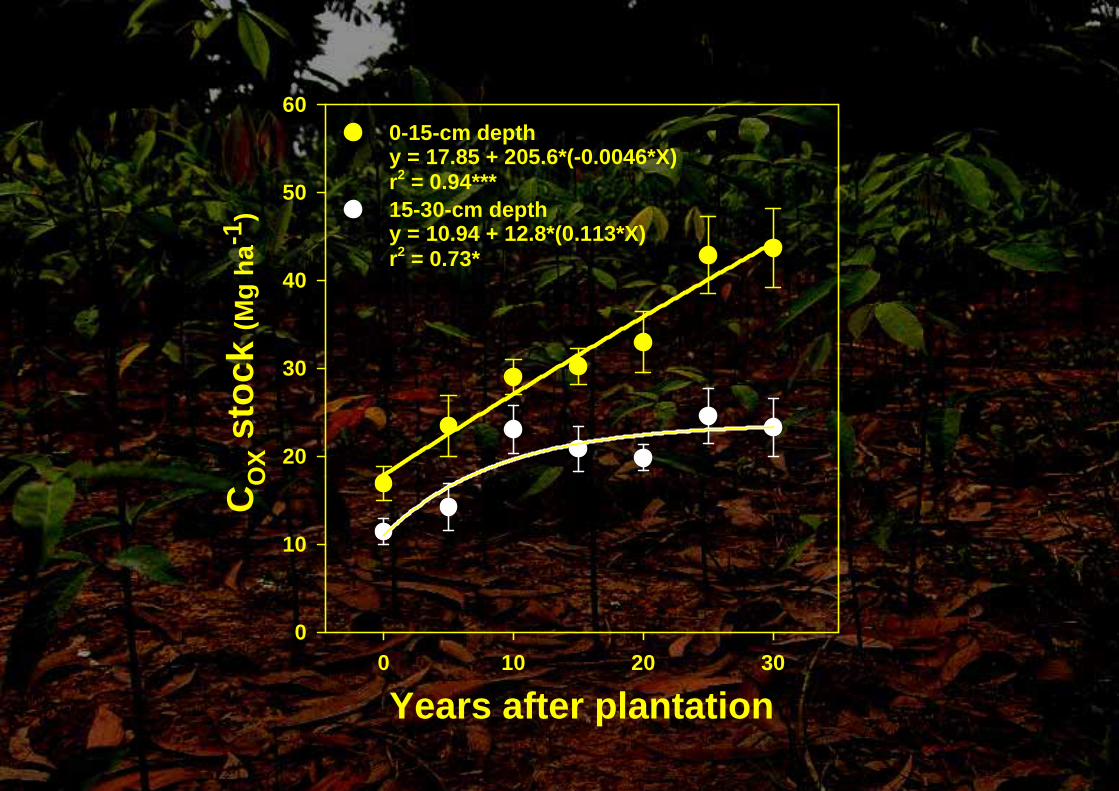
Soil sampled at 0 - 15 and 15 - 30 cm depthsOxidizable organic C (COX)Non-oxidizable C (CNOX)Total C (CT)Bulk densityC concentration and stocks
Data analysis by SAS as 7 (age) x 2 (soil depth) factorial combination at p<0.05.

Results and Discussion
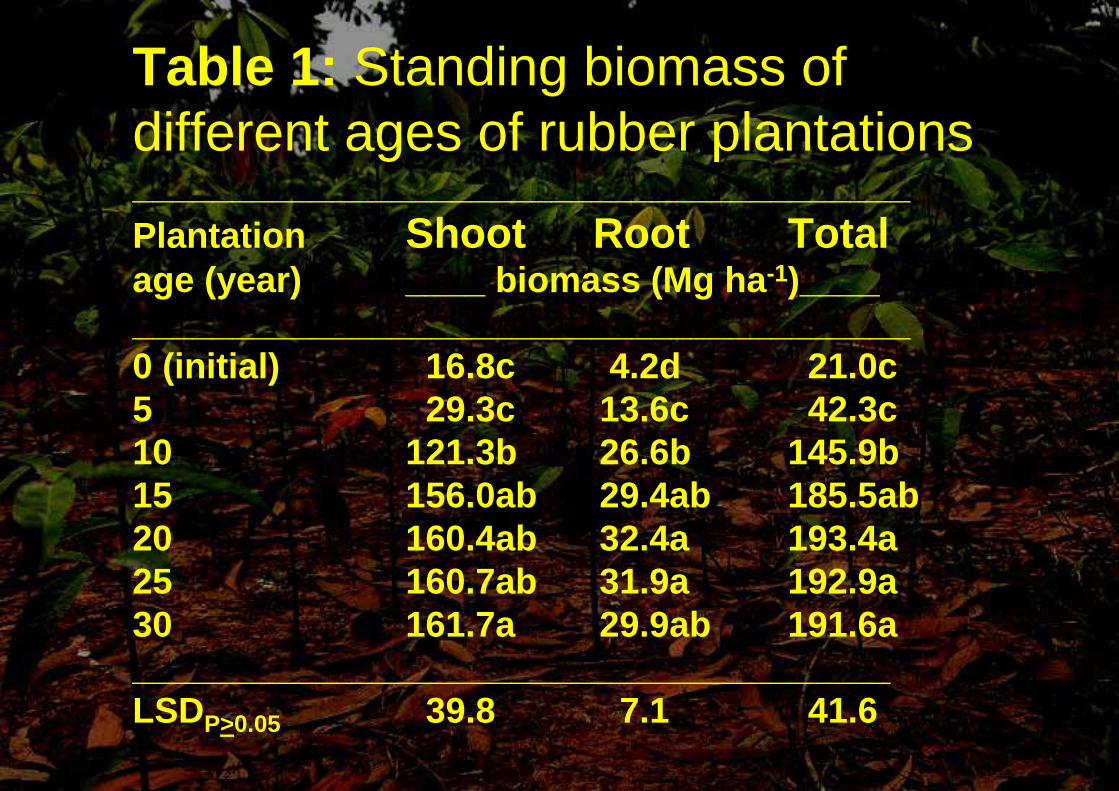
Table 1: Standing biomass of different ages of rubber plantations_______________________________________Plantation Shoot Root Totalage (year) ____ biomass (Mg ha-1)___________________________________________0 (initial) 16.8c 4.2d 21.0c5 29.3c 13.6c 42.3c10 121.3b 26.6b 145.9b15 156.0ab 29.4ab 185.5ab20 160.4ab 32.4a 193.4a25 160.7ab 31.9a 192.9a30 161.7a 29.9ab 191.6a______________________________________LSDP>0.05 39.8 7.1 41.6
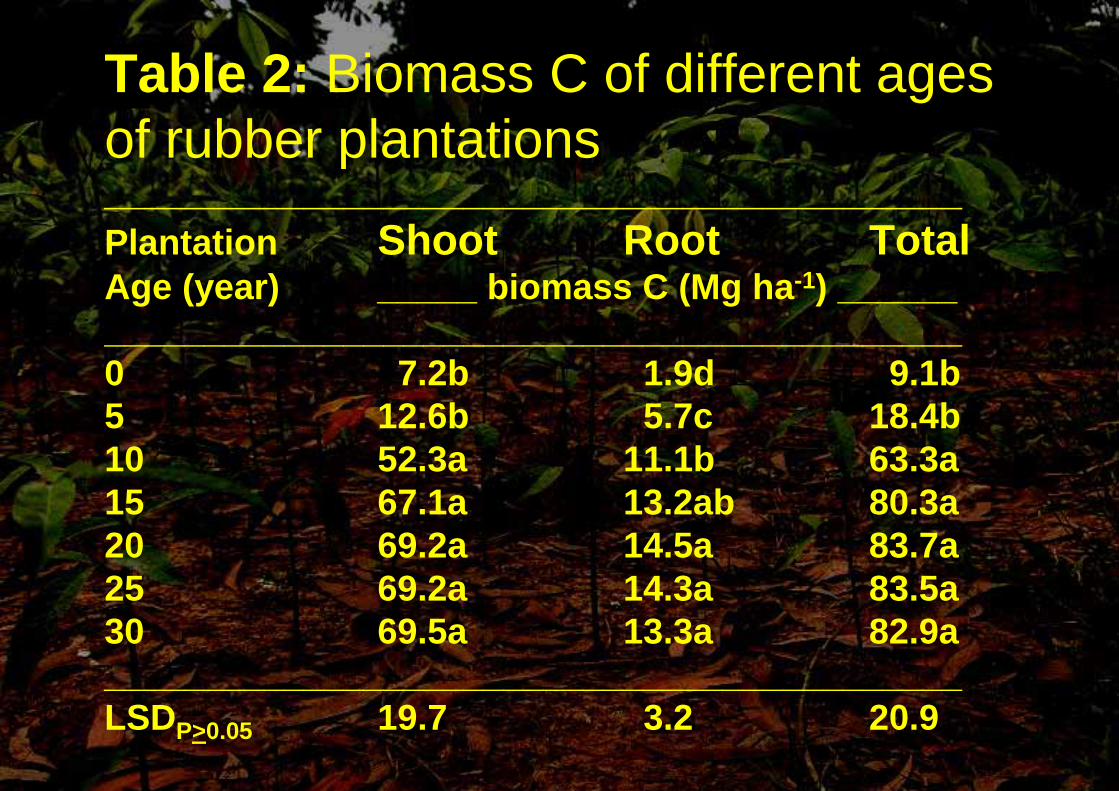
Table 2: Biomass C of different ages of rubber plantations___________________________________________Plantation Shoot Root TotalAge (year) _____ biomass C (Mg ha-1) _________________________________________________0 7.2b 1.9d 9.1b5 12.6b 5.7c 18.4b10 52.3a 11.1b 63.3a15 67.1a 13.2ab 80.3a20 69.2a 14.5a 83.7a25 69.2a 14.3a 83.5a30 69.5a 13.3a 82.9a___________________________________________LSDP>0.05 19.7 3.2 20.9
Years after plantation0 10 20 30
Litte
r-fa
ll (M
g ha
-1 y
r-1)
0
2
4
6
8
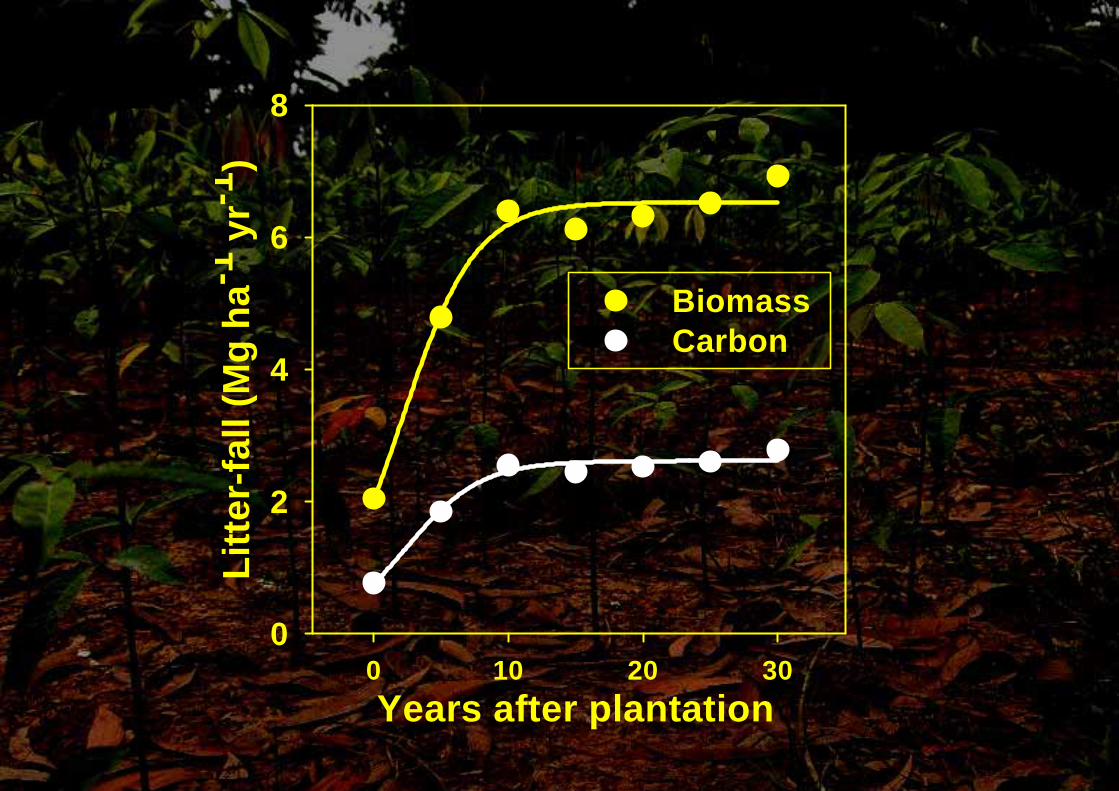
Biomass Carbon
Years after plantation0 10 20 30
Bul
k de
nsity
(g c
m-3
)
1.0
1.1
1.2
1.3
1.4
1.5
1.6
1.7
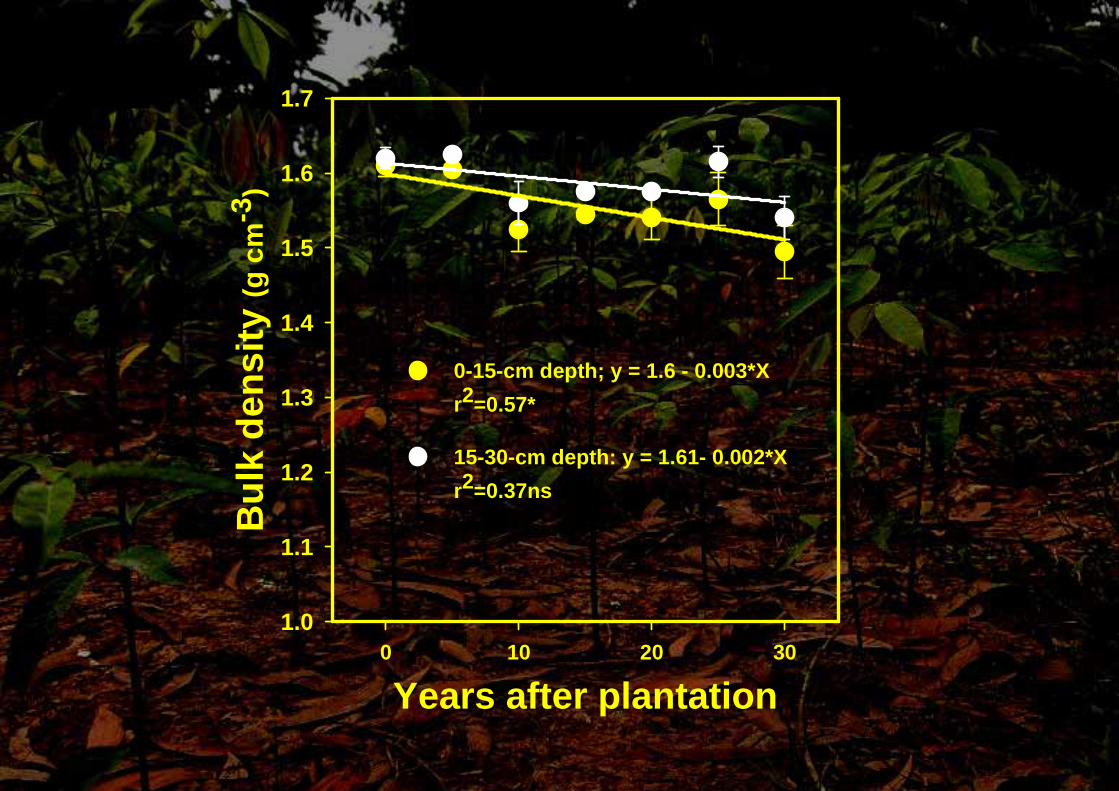
0-15-cm depth; y = 1.6 - 0.003*Xr2=0.57*
15-30-cm depth: y = 1.61- 0.002*Xr2=0.37ns
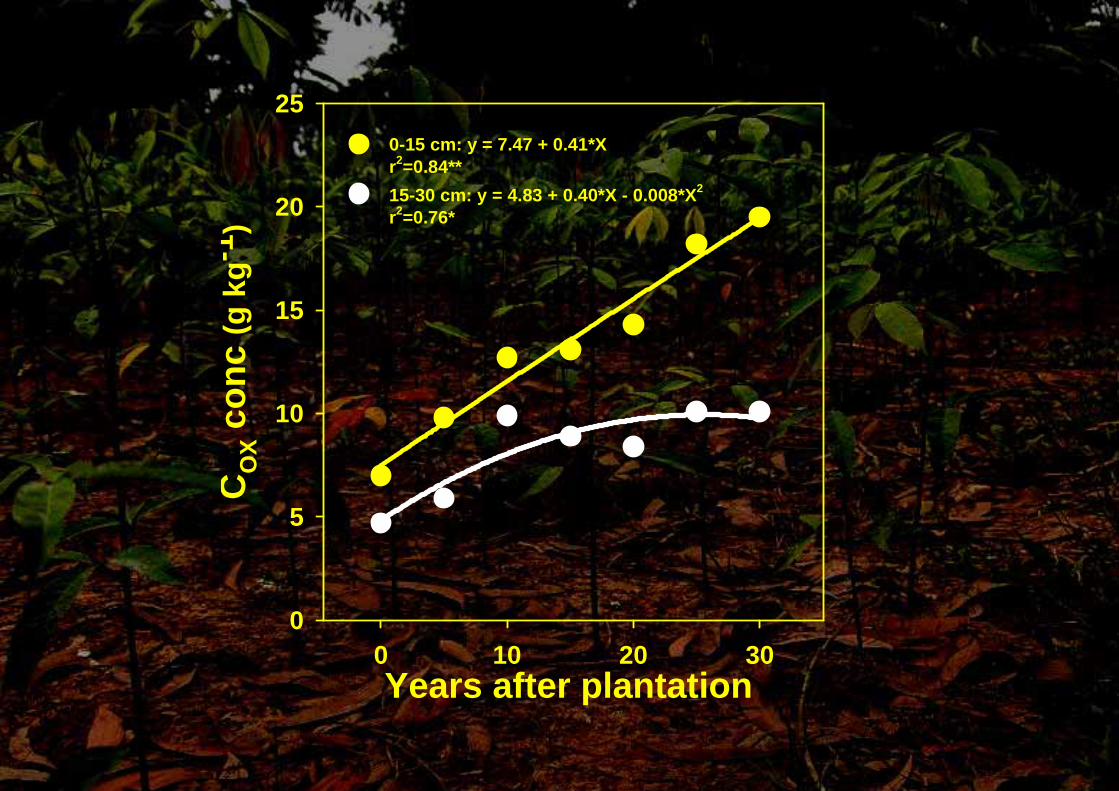
Years after plantation 0 10 20 30
CO
X co
nc (g
kg-
1 )
0
5
10
15
20
250-15 cm: y = 7.47 + 0.41*Xr2=0.84** 15-30 cm: y = 4.83 + 0.40*X - 0.008*X2
r2=0.76*
Years after plantation 0 10 20 30
CN
OX
conc
(g k
g-1 )
0
5
10
15
20
25
0-15 cm: y = 10.6 + 0.33*X - 0.01*X2
r2=0.33ns15-30 cm: y = 12.5 + 0.5*X- 0.01*X2
r2=0.57*
Years after plantation0 10 20 30
CT c
onc
(g k
g-1 )
0
5
10
15
20
25
30
35
0-15 cm: y = 18.1 + 0.74*X - 0.01*X2
r2=0.88**15-30 cm: y = 17.3 + 0.89*X - 0.018*X2
r2=0.63*
Years after plantation0 10 20 30
CO
X st
ock
(Mg
ha-1
)
0
10
20
30
40
50
600-15-cm depthy = 17.85 + 205.6*(-0.0046*X)r2 = 0.94***15-30-cm depthy = 10.94 + 12.8*(0.113*X)r2 = 0.73*
Years after plantation0 10 20 30
CN
OX
stoc
k (M
g ha
-1)
0
10
20
30
40
50
60
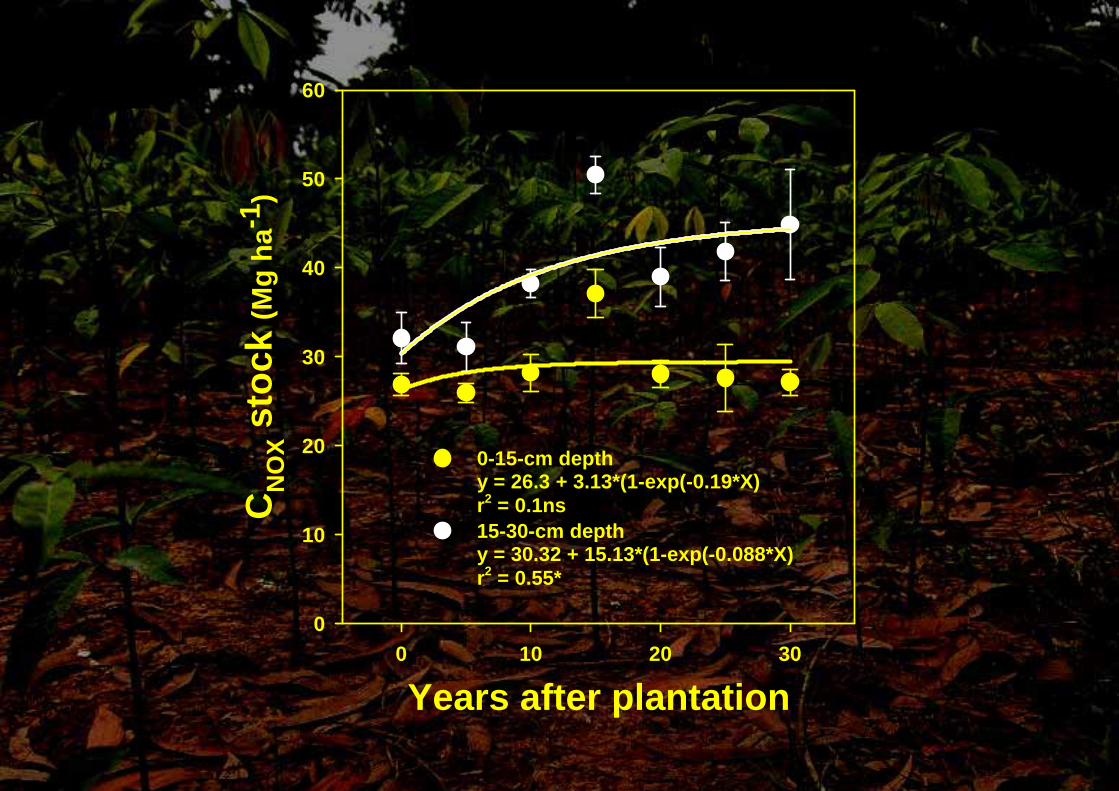
0-15-cm depthy = 26.3 + 3.13*(1-exp(-0.19*X)r2 = 0.1ns15-30-cm depthy = 30.32 + 15.13*(1-exp(-0.088*X)r2 = 0.55*
Years after plantation0 10 20 30
CT s
tock
(Mg
ha-1
)
0
20
40
60
80
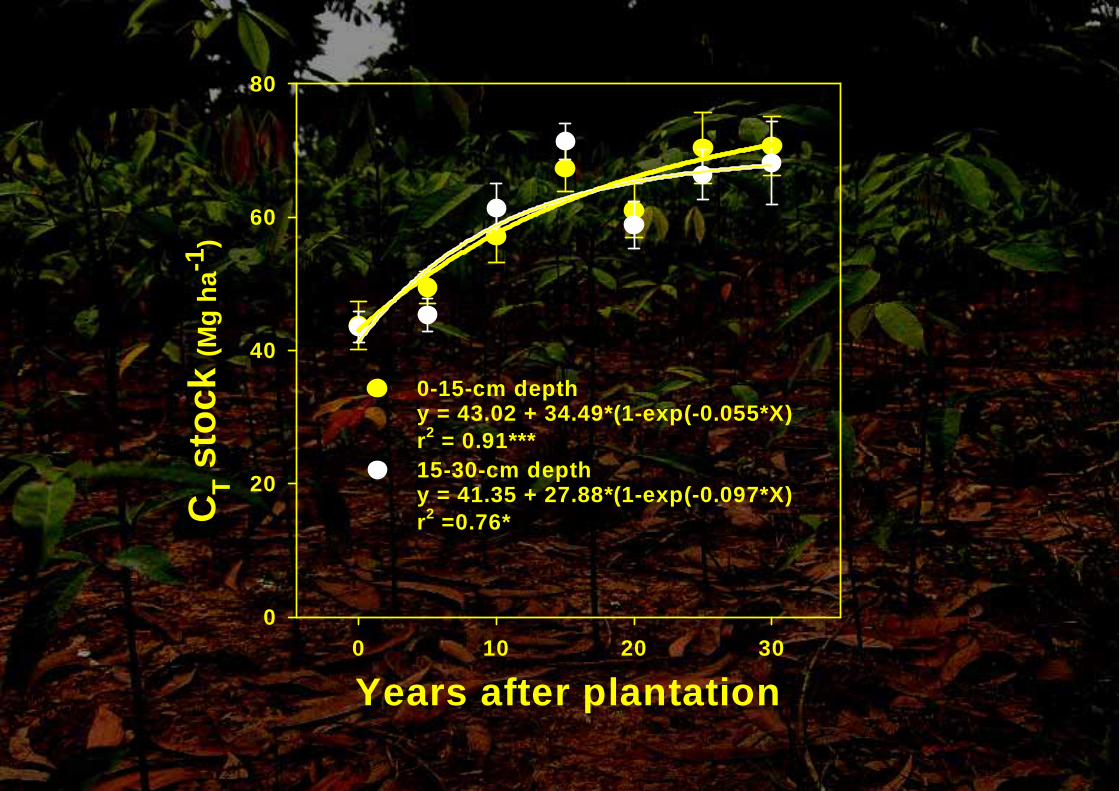
0-15-cm depthy = 43.02 + 34.49*(1-exp(-0.055*X)r2 = 0.91***15-30-cm depthy = 41.35 + 27.88*(1-exp(-0.097*X)r2 =0.76*
Years after plantation0 10 20 30
Prof
ile C
sto
ck (M
g ha
-1)
0
20
40
60
80
100
120
140
160
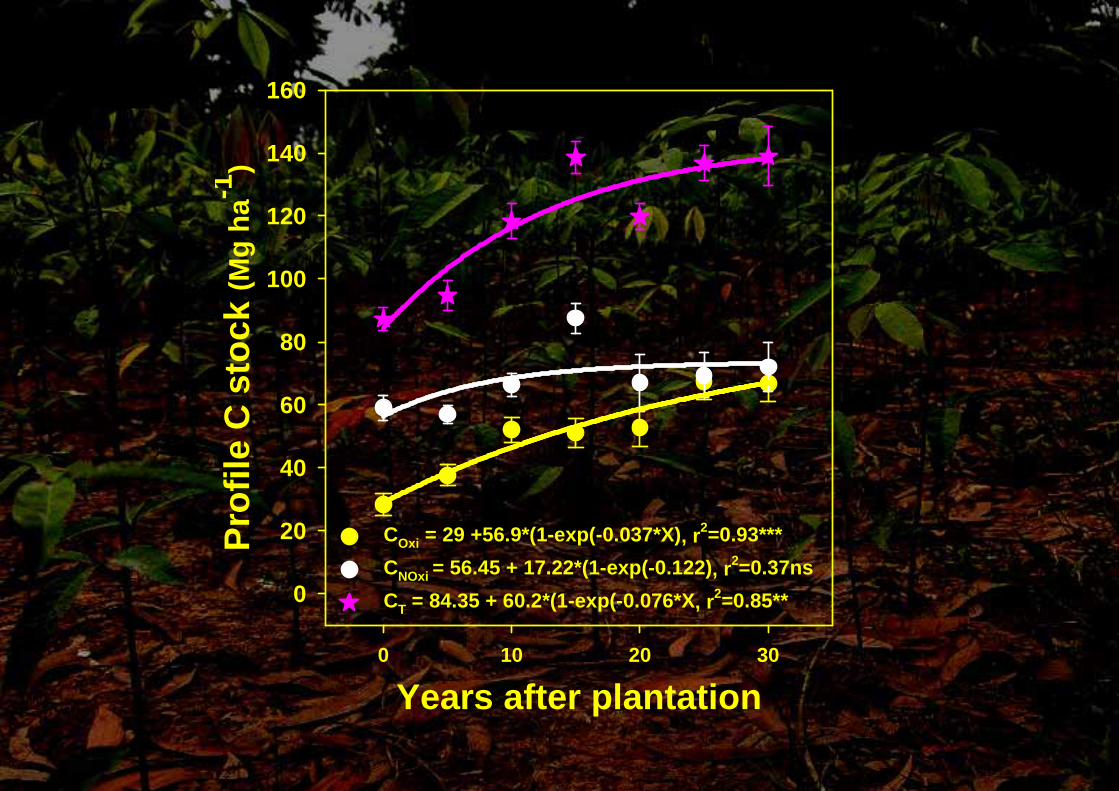
COxi = 29 +56.9*(1-exp(-0.037*X), r2=0.93***CNOxi = 56.45 + 17.22*(1-exp(-0.122), r2=0.37nsCT = 84.35 + 60.2*(1-exp(-0.076*X, r2=0.85**
Years after plantation 0 10 20 30
Cox
seq
uest
ratio
n (k
g ha
-1 y
r-1)
0
200
400
600
800
1000
1200
1400
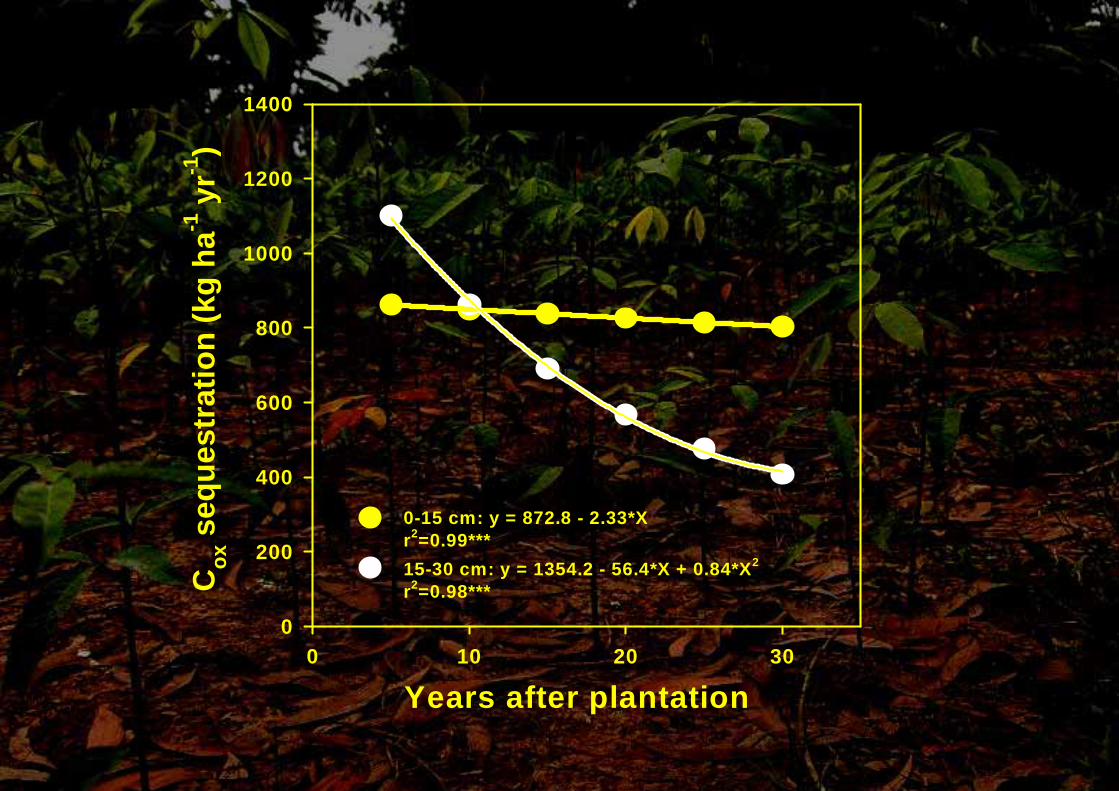
0-15 cm: y = 872.8 - 2.33*Xr2=0.99***15-30 cm: y = 1354.2 - 56.4*X + 0.84*X2
r2=0.98***
Years after plantation 0 10 20 30
CN
ox s
eque
stra
tion
(Mg
ha-1
yr-1
)
0.0
0.2
0.4
0.6
0.8
1.0
1.2
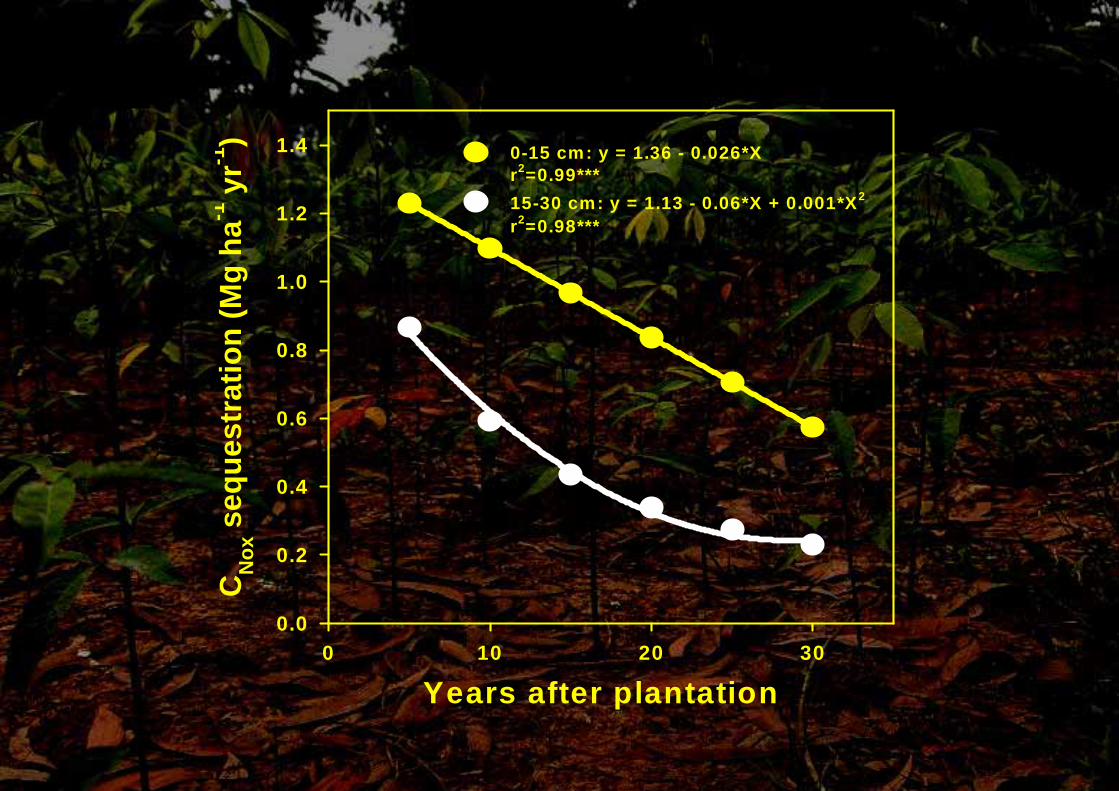
1.4 0-15 cm: y = 1.36 - 0.026*Xr2=0.99***15-30 cm: y = 1.13 - 0.06*X + 0.001*X2
r2=0.98***
Years after plantation 0 10 20 30
CT s
eque
stra
tion
(Mg
ha-1
yr-1
)
0.0
0.5
1.0
1.5
2.0
2.5
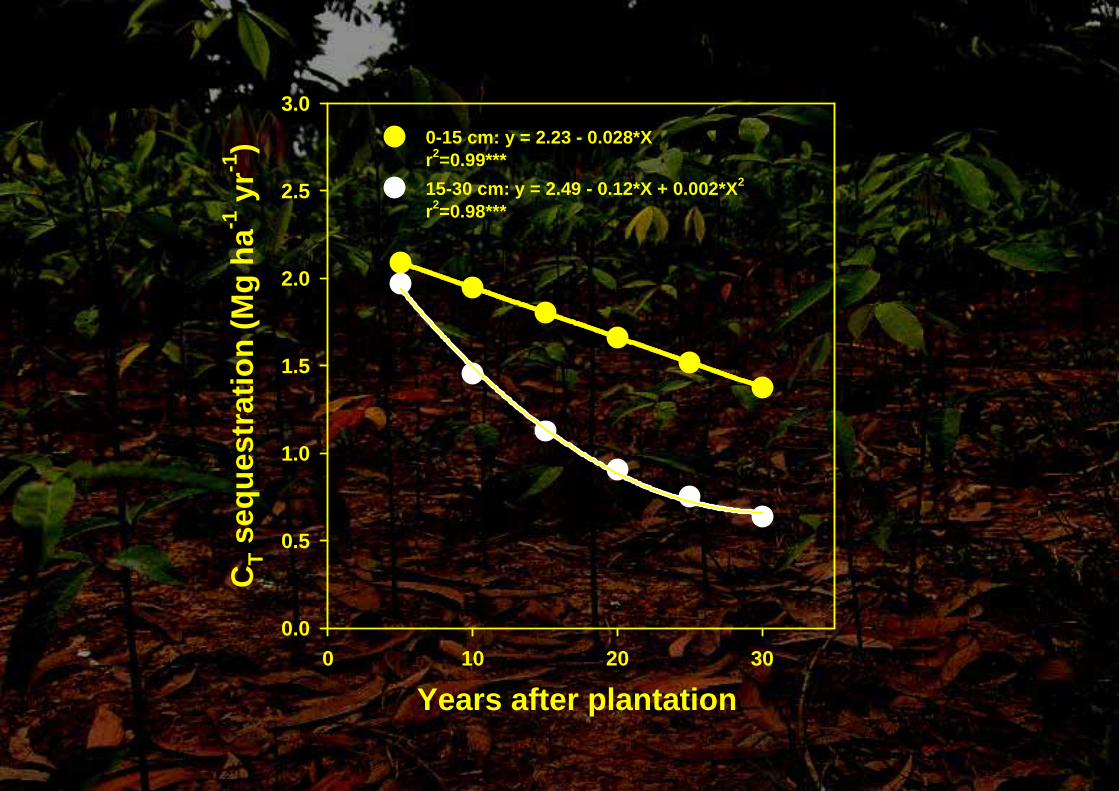
3.00-15 cm: y = 2.23 - 0.028*Xr2=0.99***15-30 cm: y = 2.49 - 0.12*X + 0.002*X2
r2=0.98***
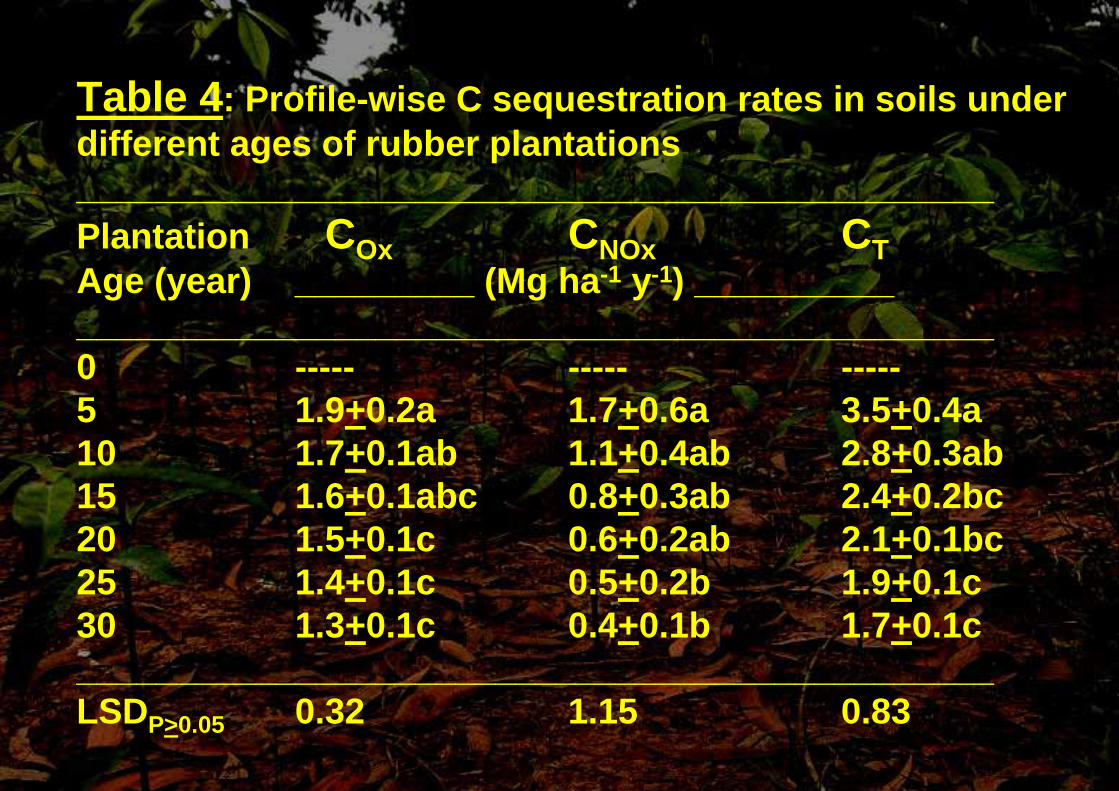
Table 4: Profile-wise C sequestration rates in soils under different ages of rubber plantations______________________________________________Plantation COx CNOx CTAge (year) _________ (Mg ha-1 y-1) ________________________________________________________0 ----- ----- -----5 1.9+0.2a 1.7+0.6a 3.5+0.4a10 1.7+0.1ab 1.1+0.4ab 2.8+0.3ab15 1.6+0.1abc 0.8+0.3ab 2.4+0.2bc20 1.5+0.1c 0.6+0.2ab 2.1+0.1bc25 1.4+0.1c 0.5+0.2b 1.9+0.1c30 1.3+0.1c 0.4+0.1b 1.7+0.1c______________________________________________LSDP>0.05 0.32 1.15 0.83
ConclusionsStanding biomass, biomass C content, and annual litter-fall of rubber plants quadratically and significantly increased.
Greater accumulation litter-fall on the surface linearly and significantly decreased soil compaction. The beneficial effects of litter-fall on decreasing compaction was greatest on surface soil.
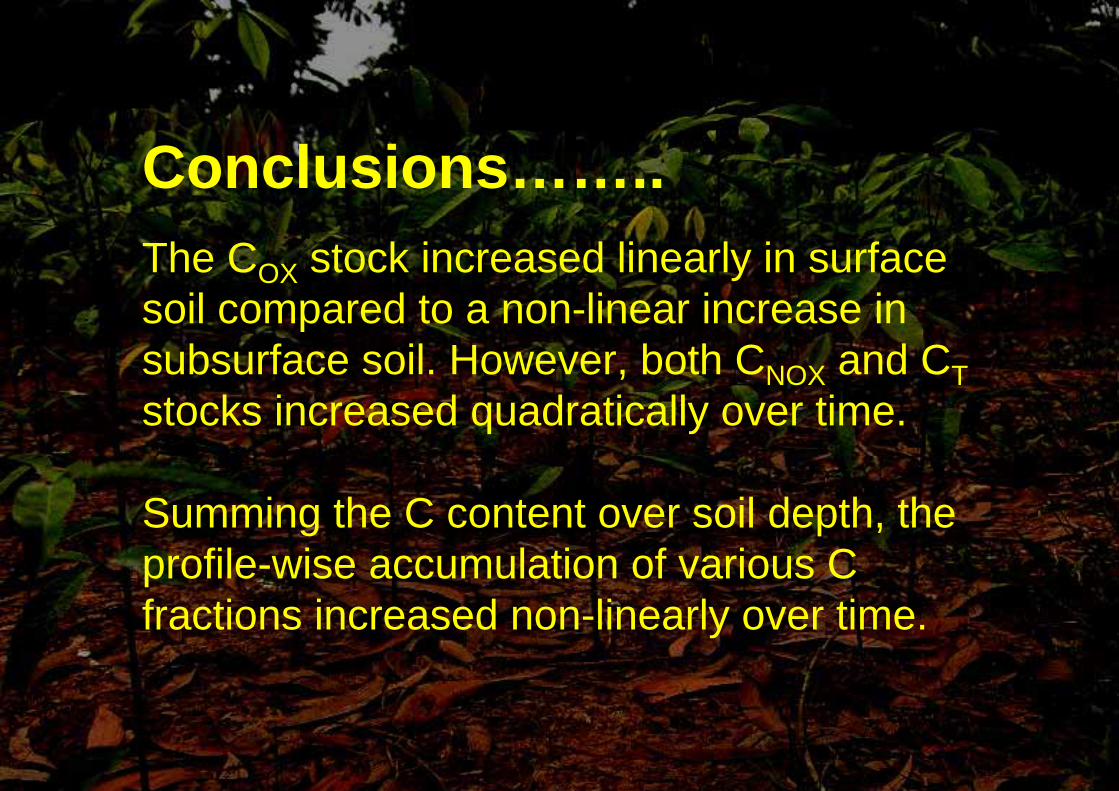
Conclusions……..The COX stock increased linearly in surface soil compared to a non-linear increase in subsurface soil. However, both CNOX and CTstocks increased quadratically over time.
Summing the C content over soil depth, the profile-wise accumulation of various C fractions increased non-linearly over time.

Thanks


![Carbon Sequestration in European Agricultural Soils by 2010 - Potential, Uncertainties, Policy Impacts Annette Freibauer [afreib@bgc-jena.mpg.de] Mark](https://img.pdfslide.net/doc/110x75/551b1511550346cf5a8b5243/carbon-sequestration-in-european-agricultural-soils-by-2010-potential-uncertainties-policy-impacts-annette-freibauer-afreibbgc-jenampgde-mark.jpg)