Embed Size (px)
Citation preview

ACAAR Symposium, 15 May 2014 1
Carbonaceous aerosol: properties, sources and analytical methods
Willy Maenhaut1,2
1 Ghent University (UGent), Department of Analytical Chemistry,
Krijgslaan 281, S12, 9000 Gent, Belgium
2 University of Antwerp (UA), Department of Pharmaceutical Sciences, Universiteitsplein 1, 2610 Antwerpen, Belgium
ACAAR Symposium, 15 May 2014 2
Carbonaceous aerosols consist of organic matter (OM) and black or elemental carbon (BC/EC) BC and EC refer to roughly the same component, but term BC is used when the component is measured with an optical
technique term EC used when the measurement is done with a thermal
technique There may also be inorganic carbon [mostly carbonate carbon (CC)] present in the carbonaceous aerosol (especially in PM10 or TSP), but this will not be discussed

ACAAR Symposium, 15 May 2014 3
Organic matter (OM) and EC Primary sources of OM incomplete combustion of fossil fuels and biomass biological particles (PBAP)
Secondary sources of OM (SOA) oxidation of volatile organic compounds (VOCs) of natural and
anthropogenic origin
EC / BC / soot primary aerosol component formed by incomplete combustion of fossil fuels (e.g., diesel) or of
biomass
Distinction between OM and EC not so straightforward more on this later there is also something like brown carbon (normally included with OM)
Distinction between primary and secondary OM also less clear in recent years oxidized (aged) primary OM counted as secondary OM
ACAAR Symposium, 15 May 2014 4
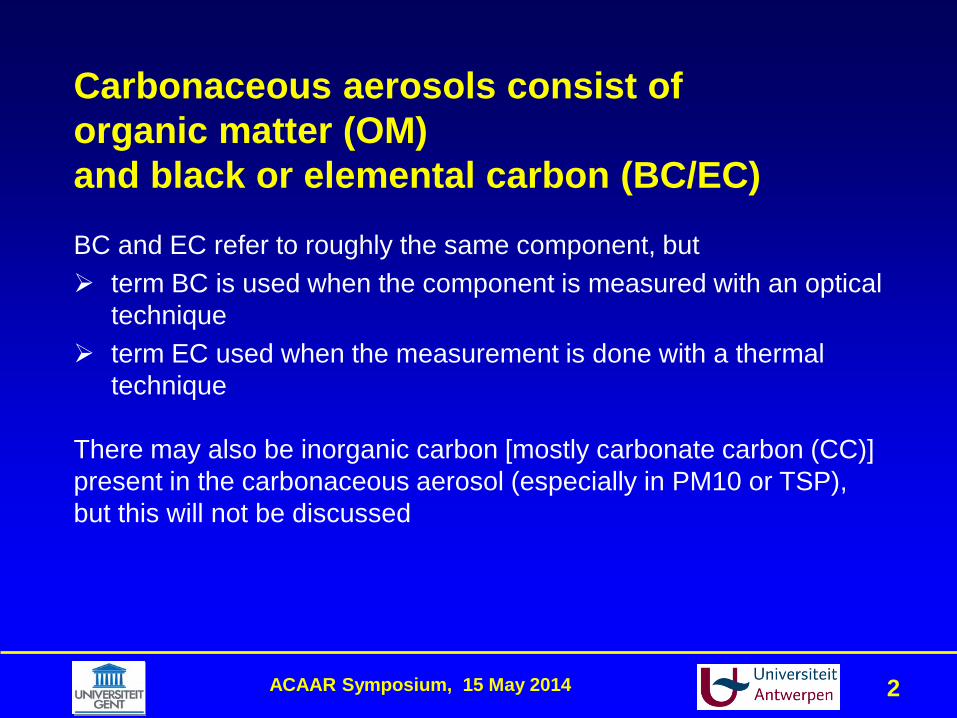
Primary biological aerosol particles (PBAP)
POLLEN
BACTERIA VIRUSES
FUNGI
ALGAE PLANT DEBRIS
PBAP have not traditionally been considered part of the OA budget, but this has been revised in recent years
Not much is known about emissions, processing, climate effects
Very large and likely short-lived
ACAAR Symposium, 15 May 2014 5
VOC oxidized to less-volatile OC
Partitioning to aerosol phase depends on vapor pressure high equilibrium vapor pressure high tendency to stay in
gas phase low equilibrium vapor pressure partitions to aerosol
phase – non-volatiles
Large organics (C> 6) tend to form aerosols while organics with C<6 do not
Oligomerization on/in acid aerosol
Secondary organic aerosol (SOA) formation
ACAAR Symposium, 15 May 2014 6
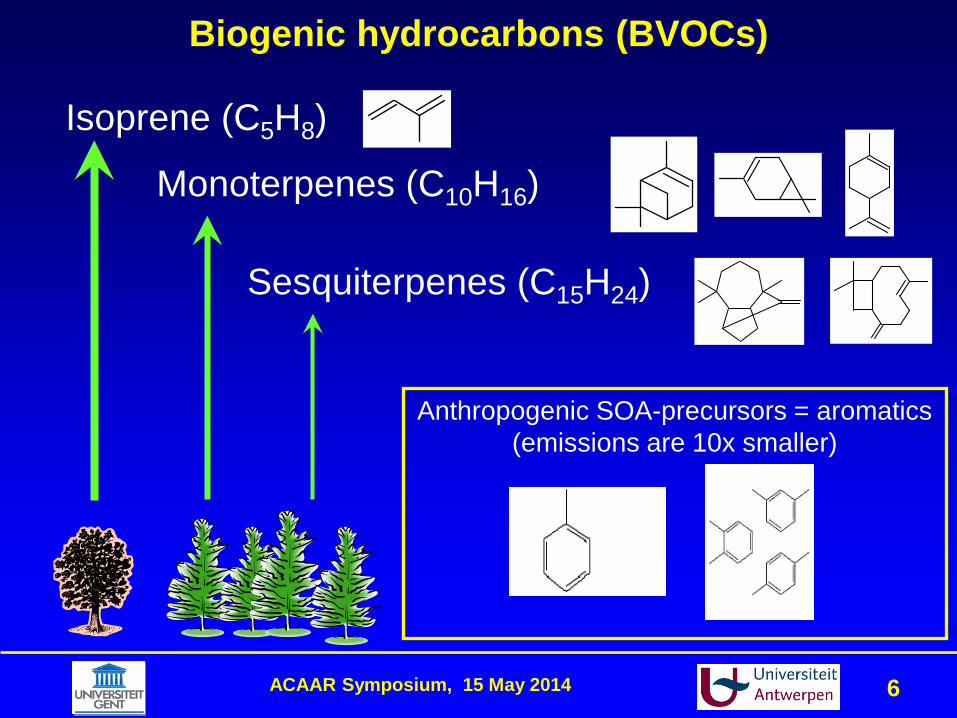
Anthropogenic SOA-precursors = aromatics (emissions are 10x smaller)
Isoprene (C5H8)
Monoterpenes (C10H16)
Sesquiterpenes (C15H24)
Biogenic hydrocarbons (BVOCs)

ACAAR Symposium, 15 May 2014 7
SOA production from BVOCs
Biogenic VOC
Emissions
Oxidation Reactions (OH, O3,
NO3)
Nucleation (oxidation products)
Growth
Condensation on pre-existing aerosol
Over 500 reactions to describe the formation of SOA precursors, ozone, and other photochemical pollutants [Griffin et al., 2002; Griffin et al., 2005; Chen and Griffin, 2005]
ACAAR Symposium, 15 May 2014 8
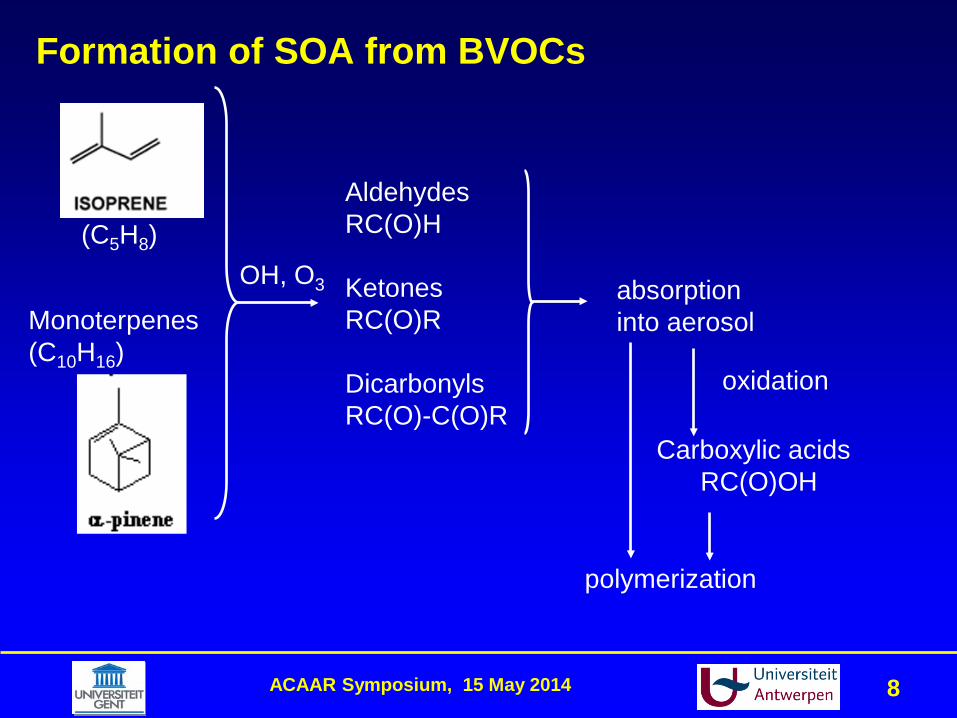
Formation of SOA from BVOCs
(C5H8)
Monoterpenes (C10H16)
OH, O3
Aldehydes RC(O)H Ketones RC(O)R Dicarbonyls RC(O)-C(O)R
absorption into aerosol
oxidation
Carboxylic acids RC(O)OH
polymerization
ACAAR Symposium, 15 May 2014 9
Properties and environmental importance of carbonaceous aerosols Carbonaceous aerosols
have effects on human health (e.g., respiration, cardiovascular problems) scatter (OM) or absorb (BC) solar and IR radiation decrease visibility have effects on climate direct (the particles themselves) indirect (particles can act as CCN)
water-soluble and/or hydrophilic OM can act as CCN and plays thus a role in cloud formation are involved in heterogeneous (and multi-phase) reactions …

ACAAR Symposium, 15 May 2014 10
Off-line chemical analysis of aerosol samples for
carbonaceous components
Aerosol samples collected with filter devices or cascade impactors
at ground level (or towers) on land on ship platforms with aircraft platforms

ACAAR Symposium, 15 May 2014 11
OC/EC differentiation
Pöschl, 2005

ACAAR Symposium, 15 May 2014 12
OC/EC analysis by thermal-optical methods
quartz fibre filter punch heated in quartz oven first phase (in pure He): OM compounds desorb -> CO2 -> CH4 second phase (in He/O2 mixture): EC and PC combusted -> CO2 -> CH4
transmission (TOT) or reflectance (TOR) of laser light through/by the filter punch continuously monitored

ACAAR Symposium, 15 May 2014 13
Thermogram for Gent PM10 sample of 13 July 2010 (transmission)
0
500
1000
1500
2000
2500
3000
3500
4000
0 50 100 150 200 250 300 350 400 450 500 550 600 650 700 750Time (s)
Lase
r T (r
el. u
nits
)
0
200
400
600
800
1000
1200
Tem
p. (°
C);
FID
(rel
. uni
ts)
HeHe:O2Laser TTemp.FIDSplit
EC OC1 PC
OC = OC1 + PC (with PC: pyrolytic carbon) : area below the blue line prior to the OC/EC split point (vertical brown line)
EC : area below the blue line after the OC/EC split point
ACAAR Symposium, 15 May 2014 14
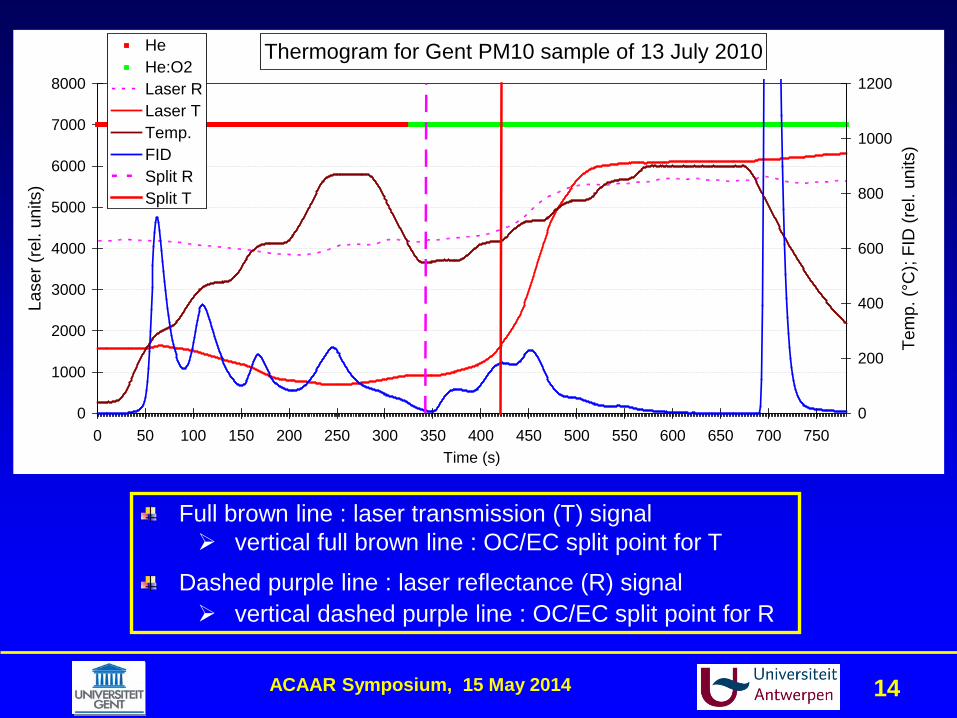
Thermogram for Gent PM10 sample of 13 July 2010
0
1000
2000
3000
4000
5000
6000
7000
8000
0 50 100 150 200 250 300 350 400 450 500 550 600 650 700 750Time (s)
Lase
r (re
l. un
its)
0
200
400
600
800
1000
1200
Tem
p. (°
C);
FID
(rel
. uni
ts)
HeHe:O2Laser RLaser TTemp.FIDSplit RSplit T
Full brown line : laser transmission (T) signal vertical full brown line : OC/EC split point for T
Dashed purple line : laser reflectance (R) signal vertical dashed purple line : OC/EC split point for R
ACAAR Symposium, 15 May 2014 15
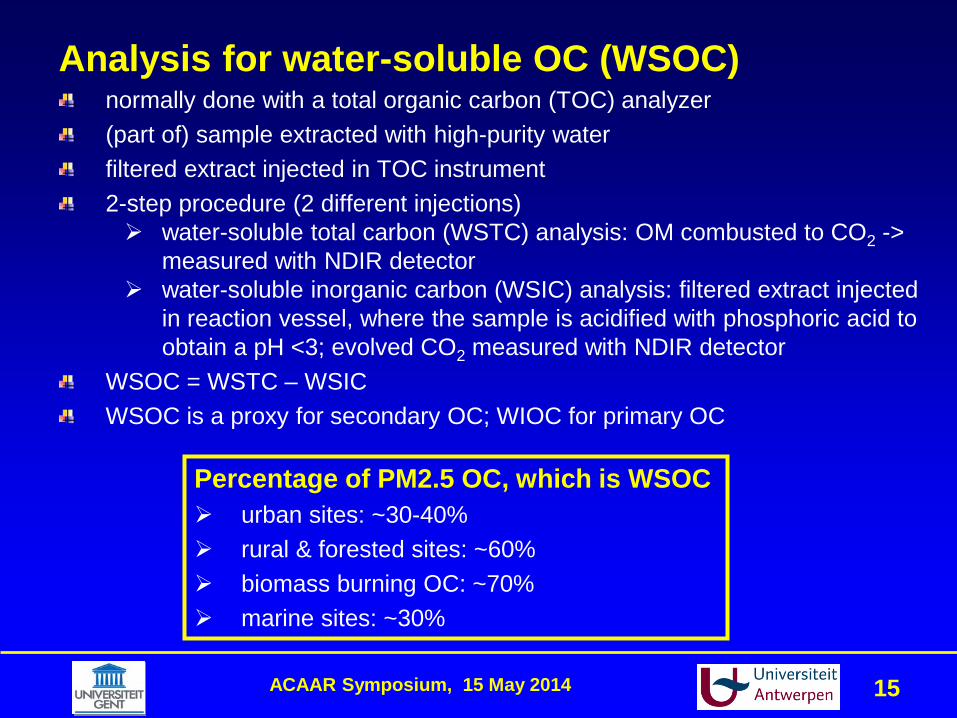
Analysis for water-soluble OC (WSOC) normally done with a total organic carbon (TOC) analyzer (part of) sample extracted with high-purity water filtered extract injected in TOC instrument 2-step procedure (2 different injections) water-soluble total carbon (WSTC) analysis: OM combusted to CO2 ->
measured with NDIR detector water-soluble inorganic carbon (WSIC) analysis: filtered extract injected
in reaction vessel, where the sample is acidified with phosphoric acid to obtain a pH <3; evolved CO2 measured with NDIR detector
WSOC = WSTC – WSIC WSOC is a proxy for secondary OC; WIOC for primary OC
Percentage of PM2.5 OC, which is WSOC urban sites: ~30-40%
rural & forested sites: ~60% biomass burning OC: ~70% marine sites: ~30%

ACAAR Symposium, 15 May 2014 16
(part of) sample extracted with high-purity water; filtered extract injected separation with ion exchange column eluent for anions: hydroxide (OH-) gradient
suppression of conductivity of the eluent conductivity of analyte ionic species measured
Analysis for water-soluble inorganic (and LMW organic) species by ion chromatography (IC)

ACAAR Symposium, 15 May 2014 17
Isotopic analysis of carbonaceous aerosols
e.g., 14C analysis with accelerator mass spectrometry (AMS) to differentiate between old (fossil fuel) and new (biogenic or
biomass burning) carbon
ACAAR Symposium, 15 May 2014 18
Analysis of atmospheric aerosols for individual organic compounds
ion chromatography (for C1 – C5 ionic species): aqueous extracts capillary electrophoresis
Organic mass spectrometry Sample preparation
sample extracted with organic solvent (e.g., methanol; CH2Cl2) extract pre-concentrated (evaporation) + re-dissolved derivatisation (methylation, trimethylsilylation) for gas chromatography (GC)
Techniques gas chromatography / mass spectrometry (GC/MS) liquid chromatography / mass spectrometry (LC/MS)
chromatographic separation with suitable column

ACAAR Symposium, 15 May 2014 19
0
50
100
0 20 40 60 80
Time (min)
%
A (acetic acid 0.1%) B (methanol)
0 10 20 30 40 50 60 70
Time (min)
0
10000
20000
30000
40000
50000
60000
Inte
nsity
2.3
18.0
22.4 17.6 15.1
25.7 20.5
3.5 5.6 6.8
LC/MS analysis of PM2.5 sample from Brasschaat TIC chromatogram [Gómez González, ACP, 2010]

ACAAR Symposium, 15 May 2014 20
Extent of OC explained by detailed organic analysis
PM2.5 samples from 2007 summer campaign in Brasschaat
Mean ± std.dev. WSOC % of OC 51 ± 9
MSA- C % of WSOC 1.43 ± 1.19 Oxalate C % of WSOC 2.9 ± 1.4 Malonate C % of WSOC 2.3 ± 1.1 Succinate C % of WSOC 1.09 ± 1.06 Glutarate C % of WSOC 0.33 ± 0.23 19 LC/MS species C % of WSOC 2.3 ± 0.9
∑(24 compounds) C % of OC 5.3 ± 2.1 ∑(24 compounds) C % of WSOC 10.3 ± 3.1
} measured by IC

ACAAR Symposium, 15 May 2014 21
Extent of OC explained by detailed organic analysis PM10 samples from 1998 W & S campaigns in Ghent [Kubátová et al., JGR, 2002]
samples analysed by GC/MS ~100 compounds identified and quantified identified compounds accounted for ~3.1% of the organic matter (OM)

ACAAR Symposium, 15 May 2014 22
On-line (in-situ) chemical analysis of atmospheric aerosols
for carbonaceous components
ACAAR Symposium, 15 May 2014 23
Measurement of OC/EC (thermal) & BC (optical, PASS) OC/EC measurement
semi-continuous OC-EC field analyzer (Sunset Lab) 45 min filtration followed by 15 min analysis analysis based on TOT (cfr. lab OC-EC analyzer)
BC (LAC) measurement aethalometer (7-wavelength) aerosol collected on filter tape light absorption by the aerosol measured at 7 wavelengths
multi-angle absorption photometer (MAAP) aerosol collected on filter tape
photo acoustic soot spectrometer (PASS) measures aerosol absorption at three wavelengths without first
collecting particles on a filter
ACAAR Symposium, 15 May 2014 24
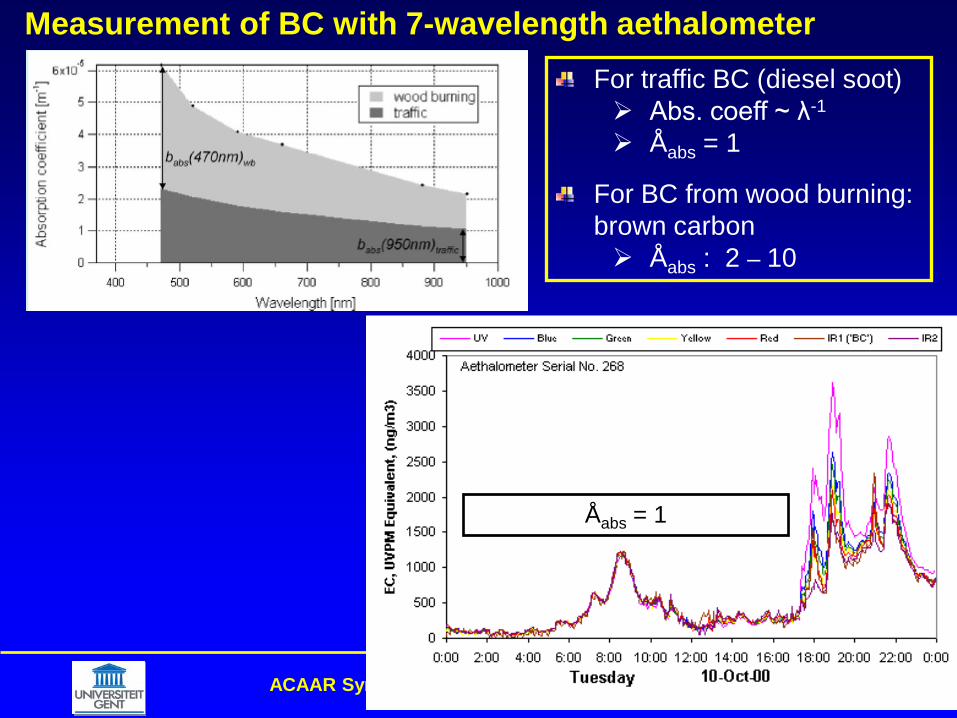
Measurement of BC with 7-wavelength aethalometer
Åabs = 1
For traffic BC (diesel soot) Abs. coeff ~ λ-1
Åabs = 1
For BC from wood burning: brown carbon Åabs : 2 – 10
ACAAR Symposium, 15 May 2014 25
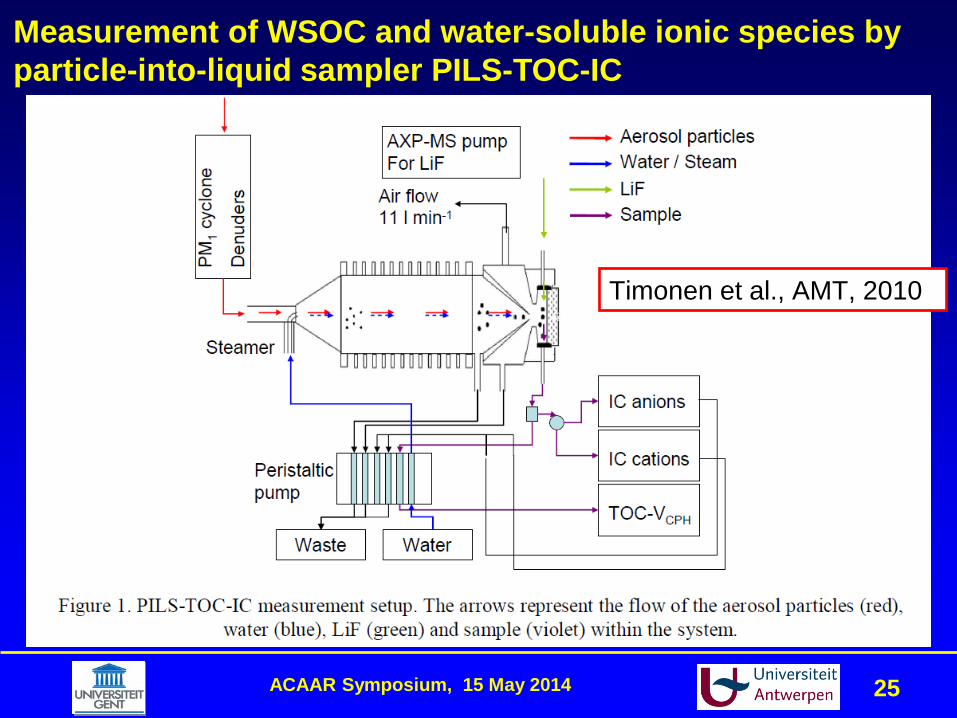
Timonen et al., AMT, 2010
Measurement of WSOC and water-soluble ionic species by particle-into-liquid sampler PILS-TOC-IC

ACAAR Symposium, 15 May 2014 26
Saarnio et al., AMT, 2013
Measurement of levoglucosan with Particle-into-Liquid Sampler – High-Performance Anion Exchange Chromatography – Mass Spectrometry (PILS-HPAEC-MS)

ACAAR Symposium, 15 May 2014 27
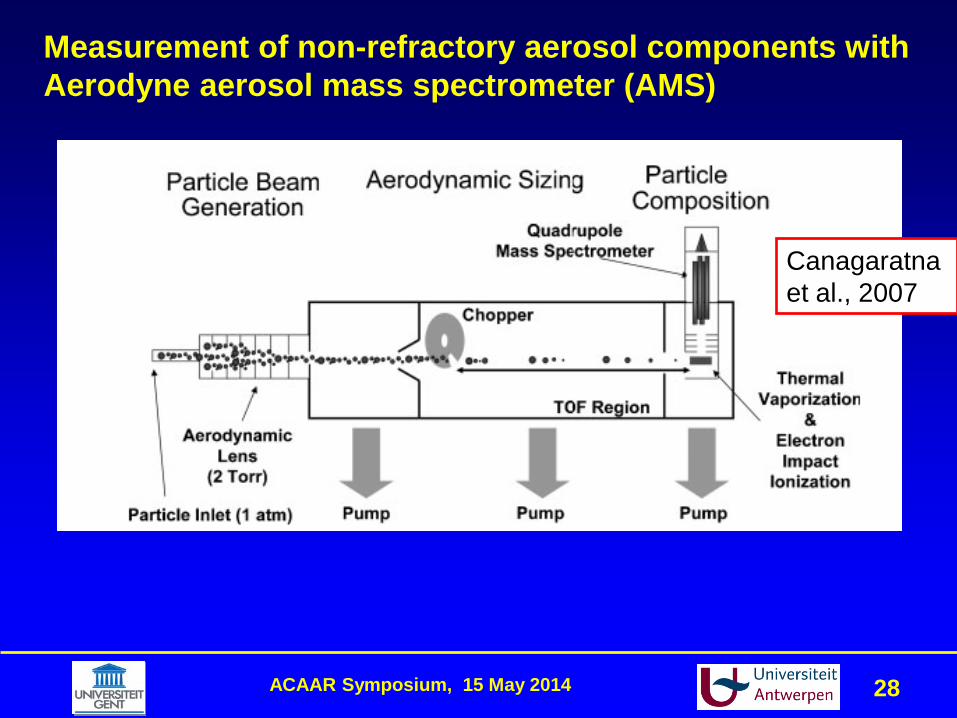
Several AMS instruments available from Aerodyne, including Aerosol Chemical Speciation Monitor (ACSM) High-resolution (HR) Time-of-Flight (TOF) AMS
The instruments collect the PM1 aerosol
In most instrument types only the non-refractory (NR) components of the aerosol are analysed NH4
+, NO3-, SO4
2-, Cl- organic matter (OM)
The contribution from the various aerosol types (and for the organic matter from HOA, OOA, BBOA, …) is obtained by PMF of the data set (time series of intensities of m/z ions)
m/z marker ions for levoglucosan 60 (and 73)
− there are contributions from several other species
Aerosol Mass Spectrometry (AMS)
ACAAR Symposium, 15 May 2014 28
Measurement of non-refractory aerosol components with Aerodyne aerosol mass spectrometer (AMS)
Canagaratna et al., 2007

ACAAR Symposium, 15 May 2014 29
Organic aerosol components worldwide (PM1)
Jimenez et al., Science, 2009

ACAAR Symposium, 15 May 2014 30
Ng et al., ACP, 2010
CO2+
mostly C2H3O+

ACAAR Symposium, 15 May 2014 31
Off-line: sample collection in the field followed by chemical analysis in the lab collection with filters or cascade impactors analysis for inorganic and/or organic constituents
On-line: in situ sampling and analysis (in real time) Aerosol Mass Spectrometry (AMS) Aethalometer Model (AeM) Particle-into-Liquid Sampler (PILS) and analysis for levoglucosan
Off-line techniques vs On-line (real-time) techniques for assessing the contribution from biomass burning
ACAAR Symposium, 15 May 2014 32
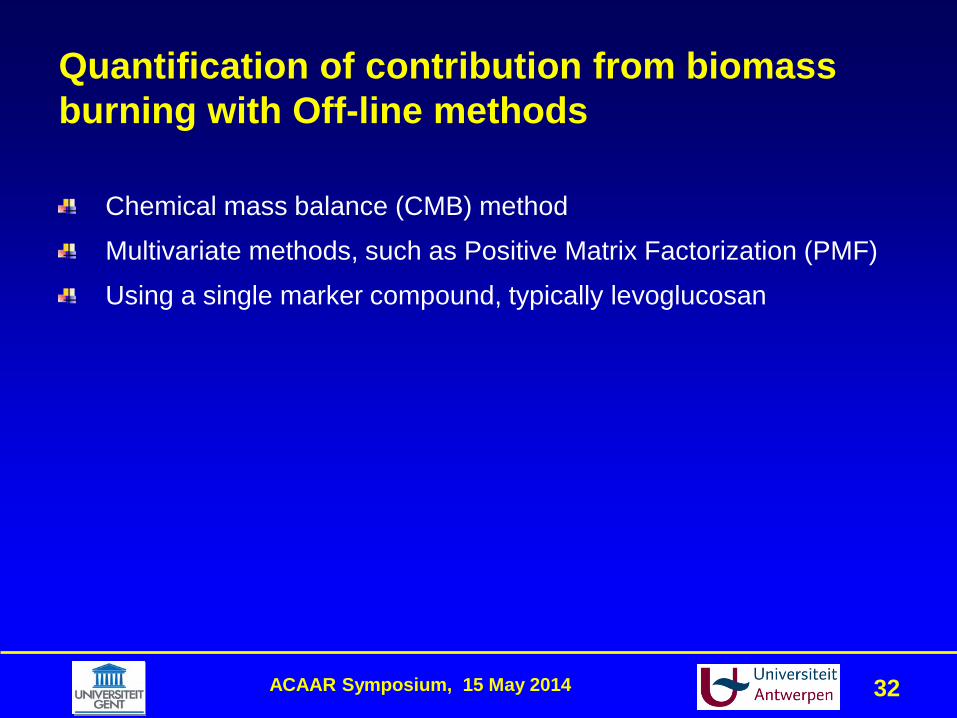
Chemical mass balance (CMB) method
Multivariate methods, such as Positive Matrix Factorization (PMF)
Using a single marker compound, typically levoglucosan
Quantification of contribution from biomass burning with Off-line methods
ACAAR Symposium, 15 May 2014 33
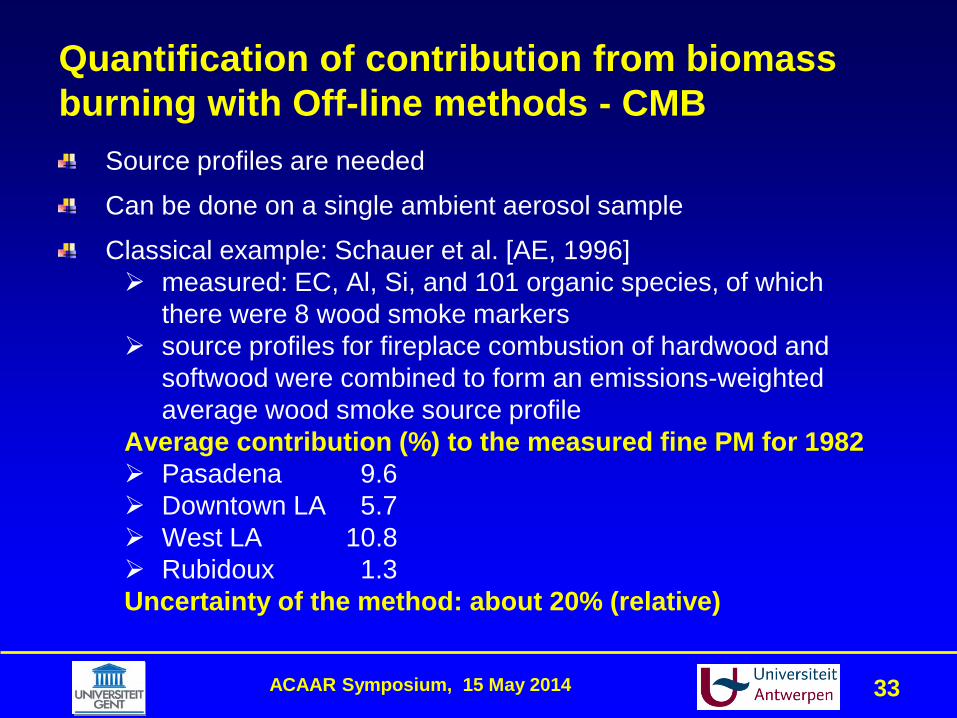
Source profiles are needed
Can be done on a single ambient aerosol sample
Classical example: Schauer et al. [AE, 1996] measured: EC, Al, Si, and 101 organic species, of which
there were 8 wood smoke markers source profiles for fireplace combustion of hardwood and
softwood were combined to form an emissions-weighted average wood smoke source profile
Average contribution (%) to the measured fine PM for 1982 Pasadena 9.6 Downtown LA 5.7 West LA 10.8 Rubidoux 1.3 Uncertainty of the method: about 20% (relative)
Quantification of contribution from biomass burning with Off-line methods - CMB

ACAAR Symposium, 15 May 2014 34
NO source profiles needed
Several species are needed
A series of samples is needed (> 30)
Recent example Gianini et al. [STE, 2013]
Quantification of contribution from biomass burning with Off-line methods - PMF
ACAAR Symposium, 15 May 2014 35
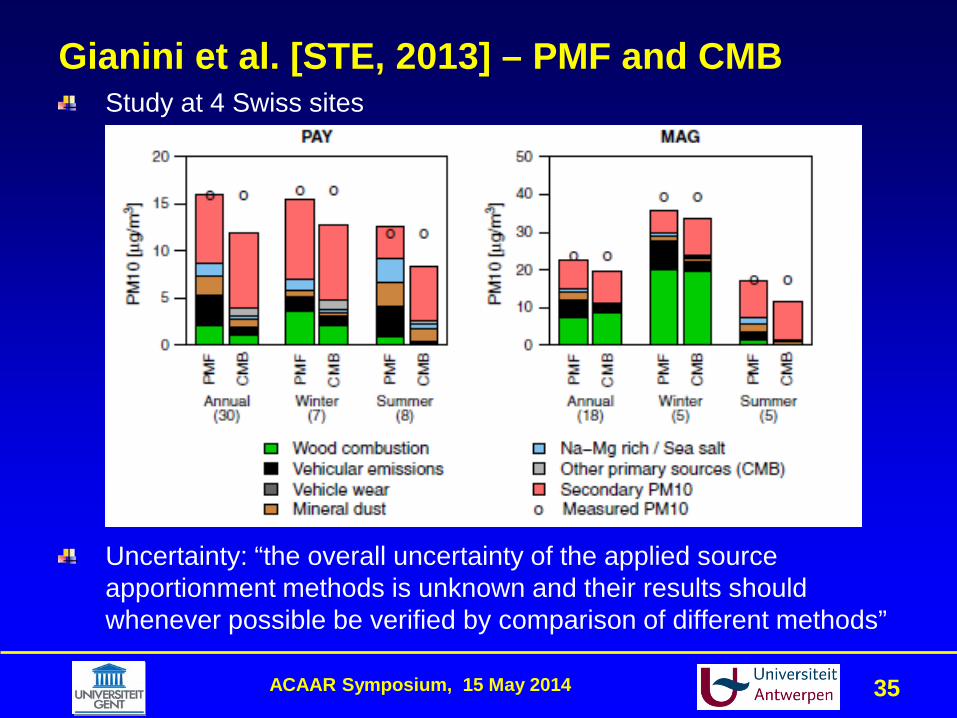
Study at 4 Swiss sites
Uncertainty: “the overall uncertainty of the applied source apportionment methods is unknown and their results should whenever possible be verified by comparison of different methods”
Gianini et al. [STE, 2013] – PMF and CMB
ACAAR Symposium, 15 May 2014 36
Concentration ratio of the PM mass to a marker compound in biomass smoke needs to be known
Concentration of marker compound in each ambient sample then multiplied by that ratio implies that the marker compound in the ambient sample originates
exclusively from biomass burning
The concentration ratio of the PM mass to a marker compound in wood smoke depends on many parameters type of fuel burnt (hard wood / soft wood) type of wood stove or fireplace operating / burning conditions (flaming / smoldering) the PM size fraction
Ratios used in studies for the VMM [Maenhaut et al., STE, 2012] PM10 mass / levoglucosan: 10.7 PM10 OC / levoglucosan: 5.6
− estimated that the uncertainty that is associated with the wood smoke OC and PM mass contributions is around 30%
Quantification of contribution from biomass burning with Off-line methods, using a single marker compound, typically levoglucosan

ACAAR Symposium, 15 May 2014 37
Using mass spectrometry (MS) for detection Gas Chromatography (GC)/MS Thermal Desorption (TD)-GC/MS High-Performance Liquid Chromatography (HPLC)-MS High-Performance Anion Exchange Chromatography
(HPAEC)-MS
Using pulsed amperometric detection (PAD) Ion Chromatography (IC)-PAD HPLC-PAD HPAEC-PAD
Methods for the determination of levoglucosan (in ACTRIS 2013 intercomparison)

ACAAR Symposium, 15 May 2014 38
%PM10 from wood burning as a function of season
5 5 6 13 6 6 52.8 2.7 3.8 7.3 3.5 3.4 1.90.7 0.7 0.9 5.0 1.0 1.1 0.57 8 9 19 10 9 79 9 11 22 11 10 90
5
10
15
20
25
Borgerhout Gent Mechelen Hamme Lier Retie Houtem
mea
n ±
s.d.
ALL Spring Summer Fall Winter
In winter (blue) for 6 of the 7 sites: around 10% of PM10 mass, on average, from wood burning At Hamme in winter: 22% of PM10 mass, on average, from wood burning
7-site study in Flanders in 2010-2011 (Chemkar-3) [Maenhaut et al., STE, 2012]

ACAAR Symposium, 15 May 2014 39
Techniques Aerosol Mass Spectrometry (AMS) Aethalometer Model (AeM) Particle-into-Liquid Sampler (PILS) and analysis for levoglucosan,
e.g., Saarnio et al. [AMT, 2013] − is less sensitive than Off-line methods
Common features provide much better time resolution than Off-line methods assessing the contribution from biomass burning with AMS and
AeM is more involved (and has thus a larger uncertainty) than in the case of Off-line methods
On-line (real-time) techniques for assessing the contribution from biomass burning

ACAAR Symposium, 15 May 2014 40
Example of AMS study: Elsasser et al. [ACP, 2012]
Other sources than levoglucosan contribute to the intensity of the m/z = 60 ion
ACAAR Symposium, 15 May 2014 41
Uses a 7-wavelength Aethalometer
Introduced by Sandradewi et al. [EST, 2008]
PMWB = c babs(490 nm)WB
with absorption coefficient babs(490 nm)WB derived from the Aethalometer data
for estimating c independent data are needed (e.g., 14C, AMS, HiVol filter data) − c can be considered a site-specific constant
Aethalometer Model (AeM)
ACAAR Symposium, 15 May 2014 42
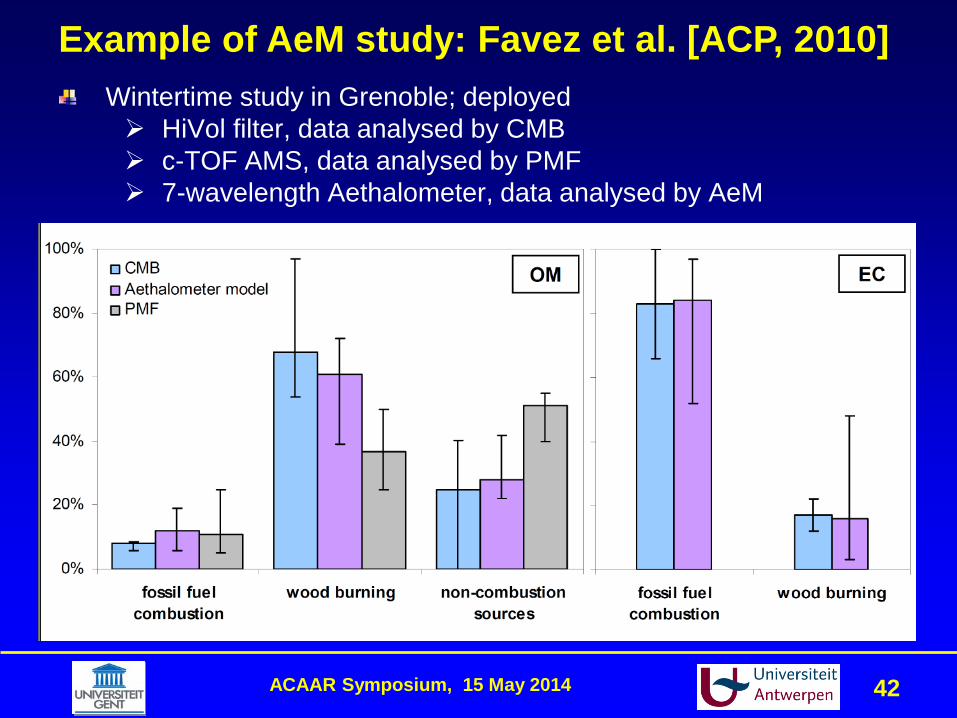
Wintertime study in Grenoble; deployed HiVol filter, data analysed by CMB c-TOF AMS, data analysed by PMF 7-wavelength Aethalometer, data analysed by AeM
Example of AeM study: Favez et al. [ACP, 2010]
ACAAR Symposium, 15 May 2014 43
It is increasingly realized in recent years that biomass burning gives also rise to SOA, e.g., Yee et al. [ACP, 2013] chamber study on SOA formation from biomass burning
intermediates: phenol and methoxyphenols
SOA compounds from wood or biomass burning in field samples methyl-nitrocatechols [Iinuma et al., EST, 2010] several nitro-aromatic compounds [Kitanovski et al.,
JChrA, 2012] several nitro-organic compounds [Kahnt et al., AE, 2013]
− their summed concentration at Hamme in winter was only 7% of the concentration of levoglucosan
It is unclear how much SOA from biomass burning is included (if any) in the several apportionment or contribution calculations discussed in this presentation
Some words on SOA from biomass burning

ACAAR Symposium, 15 May 2014 44
Thank you


![Airborne measurements of carbonaceous aerosol soluble in ... · recently been used to quantify carbonaceous aerosol online from aircraft [Bahreini et al., 2003]. These methods provide](https://img.pdfslide.net/doc/110x75/5f12744e800d890f890d626f/airborne-measurements-of-carbonaceous-aerosol-soluble-in-recently-been-used.jpg)