Embed Size (px)
Citation preview
Karolinska Institutet, Department of MedicineCardiology Unit, Karolinska University Hospital
Stockholm, Sweden
Cardiac Memory Studies in Two Human Models
Liliane Wecke
Stockholm 2006

Cardiac Memory Studies in Two Human Modelsby Liliane Wecke
Printed at ReproPrint AB, StockholmISBN 91-7140-614-X

“You’d better start studying memory while you still have one.”
Mauricio B. Rosenbaum 1

4 Liliane Wecke
Cardiac memory 5
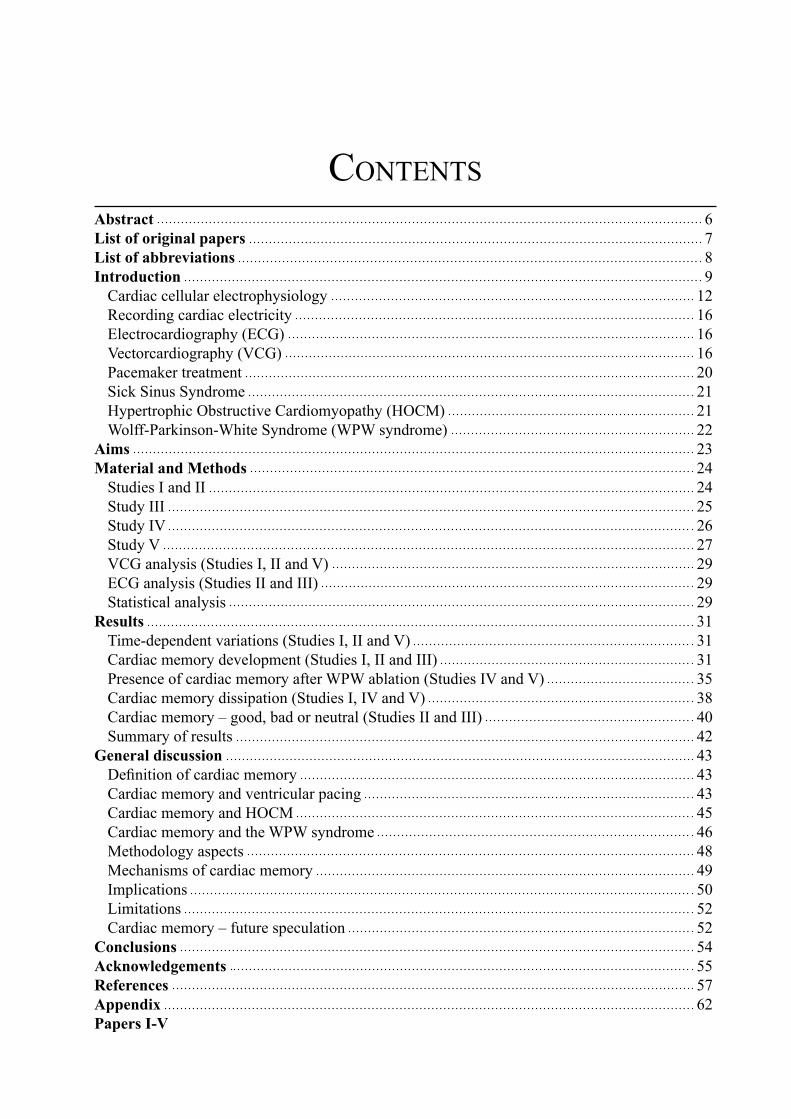
CONTENTSAbstract 6List of original papers 7List of abbreviations 8Introduction 9
Cardiac cellular electrophysiology 12Recording cardiac electricity 16Electrocardiography (ECG) 16Vectorcardiography (VCG) 16Pacemaker treatment 20Sick Sinus Syndrome 21Hypertrophic Obstructive Cardiomyopathy (HOCM) 21Wolff-Parkinson-White Syndrome (WPW syndrome) 22
Aims 23Material and Methods 24
Studies I and II 24Study III 25Study IV 26Study V 27VCG analysis (Studies I, II and V) 29ECG analysis (Studies II and III) 29Statistical analysis 29
Results 31Time-dependent variations (Studies I, II and V) 31Cardiac memory development (Studies I, II and III) 31Presence of cardiac memory after WPW ablation (Studies IV and V) 35Cardiac memory dissipation (Studies I, IV and V) 38Cardiac memory – good, bad or neutral (Studies II and III) 40Summary of results 42
General discussion 43Definition of cardiac memory 43Cardiac memory and ventricular pacing 43Cardiac memory and HOCM 45Cardiac memory and the WPW syndrome 46Methodology aspects 48Mechanisms of cardiac memory 49Implications 50Limitations 52Cardiac memory – future speculation 52
Conclusions 54Acknowledgements 55References 57Appendix 62Papers I-V
ABSTRACT
6 Liliane Wecke
BackgroundCardiac memory is a form of electrical remodeling of the ventricles, where the T vector follows (“remembers”) a previously altered QRS vector. On the electrocardiogram (ECG), it presents as T-wave inversions. It has been observed after periods of ventricular pacing, ventricular tachycardia, intermittent bundle branch block and after periods of preexcitation in patients with the Wolff-Parkinson-White (WPW) syndrome.AimsTo study the occurrence, development and dissipation of cardiac memory in two human models, ventricular pacing and WPW ablation. In addition to conventional ECG analysis, the spatial vectorcardiogram (VCG) was analyzed in 3 dimensions, including T-vector loop morphology.Studies I-IITwenty patients who received DDD-R pacemakers due to symptomatic sinus bradycardia were followed daily for 1 week (n=6) or weekly for 5-8 weeks (n=14). A baseline ECG and VCG were recorded prior to pacemaker implantation. The patients were all paced endocardially in the right ventricle and the pacemakers were programmed to a short AV delay to achieve maximum ventricular stimulation. At each follow-up, the pacemakers were temporarily programmed to AAI mode to re-establish normal ventricular activation and an ECG and VCG were recorded. After this protocol, the 14 patients who were studied weekly had their pacemakers reprogrammed to individually optimized AV delays and, after 4-5 weeks, they were seen at one last follow-up. Repolarization changes assessed by T-vector amplitude and morphology changes were already present within 24 hours after the initiation of pacing. Cardiac memory was fully developed within one week and the VCG revealed a backward and upward rotation of the maximum T vector. After the cessation of ventricular pacing, cardiac memory disappeared within 4 weeks. When ventricular pacing was continued, cardiac memory was preserved in proportion to the percentage of ventricular pacing. After the abrupt termination of ventricular pacing, the prolongation of repolarization time (QTc) and changes in T-loop morphology suggested unfa-vorable effects on repolarization. During continuous ventricular pacing, the repolarization time decreased.Study IIIThe effects of ventricular pacing on repolarization and cardiac memory were compared in 15 patients with hyper-trophic obstructive cardiomyopathy (HOCM) and the patients from Studies I and II. A baseline ECG was recorded prior to pacemaker implantation. The HOCM patients were evaluated after 3 months of right ventricular endocardial pacing with a short AV delay. An ECG was first recorded during DDD pacing and then during sinus rhythm after pac-ing was temporarily switched off. T-wave inversions consistent with cardiac memory were observed in all HOCM patients and similar to controls. In contrast to sick sinus patients, there was no change in repolarization time in the HOCM group. Baseline myocardial structure and function thus make a difference to the repolarization response re-lated to cardiac memory.Studies IV-VThe occurrence and dissipation of cardiac memory after an accessory pathway ablation in WPW patients were studied retrospectively (Study IV) and prospectively (Study V). In Study IV, T-wave inversions in leads II, aVF and III were evaluated on ECGs from 125 patients ablated due to a posteroseptal (PS) accessory pathway. Within one day after ablation, 123 (98%) of the patients showed cardiac memory (T-wave inversions). In most patients, cardiac memory disappeared within 3 months. In Study V, ECGs and VCGs were used to compare the occurrence of cardiac memory after the ablation of PS (n=11) and left lateral (LL) (n=6) accessory pathways. Cardiac memory in the form of T-wave inversions on ECG was only seen in the PS group. Evaluation by VCG, however, revealed T-vector changes in the transverse plane in the LL group and vertical T-vector changes in the PS group. In 82% of the patients, cardiac memory disappeared within 3-4 weeks.ConclusionsIn humans, cardiac memory developed and reached steady state within 1 week after the onset of right ventricular endocardial pacing. After WPW ablation, cardiac memory was present, independent of accessory pathway site. Cardiac memory is probably an adaptation mechanism of the heart, involving a gradual change in repolarization when the activation sequence (depolarization) is altered. VCG including T-vector loop morphology is a useful and sensitive method for evaluating repolarization changes.
Key words: Cardiac memory, repolarization, pacing, WPW ablation
LIST OF ORIGINAL PAPERS
Cardiac memory 7
This thesis is based on the following studies, which will be referred to by their Roman numerals.
IWecke L, Gadler F, Linde C, Lundahl G, Rosen MR, Bergfeldt L.Temporal characteristics of cardiac memory in humans: vectorcar-
diographic quantification in a model of cardiac pacing.Heart Rhythm 2005;2:28-34
IIWecke L, Lundahl G, Bergfeldt L.
Pacing-induced cardiac memory in the human ventricle: rapid and po-tentially deleterious electrophysiological remodeling.
In manuscript
IIINowinski K, Wecke L, Gadler F, Linde C, Bergfeldt L.
Pacing-induced electrophysiological remodeling in hypertrophic obstructive cardiomyopathy – observations on cardiac memory.
Pacing Clin Electrophysiol 2005;28:561-567
IVAunes-Jansson M, Wecke L, Lurje L, Bergfeldt L, Edvardsson N.
T wave inversions following ablation of 125 posteroseptal accessory pathways.Int J Cardiol 2006;106:75-81
VWecke L, Poçi D, Schwieler J, Johansson B, Lundahl G, Bergfeldt L.
The heart remembers preexcitation independent of pathway site – a vectorcardiographic study.In manuscript
LIST OF ABBREVIATIONS
8 Liliane Wecke
AAI Atrial single chamber pacing modeACE Angiotensin converting enzymeACh AcetylcholineAP Action potentialAPD Action potential durationARI Activation-recovery intervalARP Absolute refractory periodAT Activation timeATP Adenosine tri-phosphateAV AtrioventricularCa2+ Calcium ionCl- Chloride ionCI Confidence intervalCNS Central nervous systemCx43 Connexin43DC Direct currentDDD Dual chamber pacing modeECG Electrocardiogram / ElectrocardiographyHOCM Hypertrophic obstructive cardiomyopathyHz HertzICa Calcium currentIK Potassium currentINa Sodium currentIto Transient outward current K+ Potassium ionLBBB Left bundle branch blockLL Left lateralLT Long-termMIDA Myocardial Infarction Dynamic Analysis (Ortivus AB, Täby, Sweden)ms MillisecondmV MillivoltNa+ Sodium ionPS PosteroseptalRBBB Right bundle branch blockRF RadiofrequencyRP Refractory periodRPS Right posteroseptalRRP Relative refractory periodSA SinoatrialSR Sarcoplasmic reticulumSSS Sick sinus syndromeST Short-termVCG Vectorcardiogram / VectorcardiographyVG Ventricular gradientVVI Ventricular single chamber pacing modeWPW Wolff-Parkinson-White
Cardiac memory 9
INTRODUCTION
Until the 1960s, reports of T-wave negativi-ties (inversions) on the electrocardiogram
(ECG) recorded in patients in different clinical situations were mainly attributed to myocardial ischemia, even in the absence of other signs or symptoms. During the 1960s, a re-evalua-tion of this phenomenon began and alternative causes were considered. In 1969, Chatterjee et al. described T-wave inversions after periods of ventricular pacing 2, 3. In the same year, transient T-wave inversions were described after repeated episodes of supraventricular tachycardia with a right bundle branch block (RBBB) configu-ration in a patient without any other evidence of cardiac disease (including normal coronary angiography) 4. A few years later, T-wave inver-sions were also described after intermittent left bundle branch block (LBBB) 5, 6 and after peri-ods of preexcitation in patients with the Wolff-Parkinson-White (WPW) syndrome 7.
After having been considered as possible signs of ischemia, these T-wave inversions were now regarded as some kind of curiosity. In spite of this, all the situations described above have in common a period of altered ventricular activa-tion sequence, followed by the restitution of the normal activation pattern after a variable amount of time; Figure 1.In addition, it was concluded back in 1969 by Chatterjee et al. that the post-pacing T-wave changes were the result of an abnormal ven-tricular activation sequence and were not due to artificial stimulation per se 3. This was de-termined by stimulating the right ventricle dur-ing the absolute refractory period which did not give capture. Consequently, normal ventricular activation was preserved and there were no T-wave changes. These authors also concluded that the du-ration of the T-wave changes depended on the duration of the preceding ventricular pacing pe-riod 3. T-wave inversions after intermittent LBBB
were studied in 46 patients by Engel et al. They concluded that right precordial T-wave inver-sions may result from recent LBBB itself, since 17 of the patients had no evidence of coronary heart disease 5. Interestingly, T-wave inversions during normal conduction had been taken as evidence of ischemia being the cause of previ-ous episodes of LBBB.Subsequently, WPW studies excluded a rela-tionship between post-ablation T-wave changes and myocardial lesions induced by the ablation procedure. This was done by comparing pa-tients with overt and concealed accessory path-ways 8-13 and by following cardiac enzymes and echocardiographic evaluations 8, 10-13.The topic of this thesis is therefore a phenome-non, which is characterized by transient T-wave abnormalities occurring after a period of altered ventricular activation sequence (depolariza-tion). Furthermore, the T vector has the same direction as the vector of the previous altered QRS complex; Figure 2.In 1982, Rosenbaum et al. found that there is an accumulation of these T-wave changes: mean-ing that repeated periods of pacing augmented the response which, together with the T wave “remembering” the paced QRS vector, suggested similarities between cardiac and central nervous system (CNS) memory 14. Rosenbaum was thus the one who introduced the expression “cardiac memory”, although Denes et al. in 1978 used the word “remember” when describing T-wave in-versions after intermittent LBBB 6. Experience from memory research in the CNS has served as a guide for exploring features of cardiac memory 15. In parallel with memory in the CNS, Rosen et al. divided cardiac memory into short-term and long-term memory, although the definite time frames are not clear 15. In the CNS, short-term memory (lasting minutes to hours) involves the modification of existing proteins, while long-term memory (lasting days to weeks) depends on new protein synthesis 16.
10 Liliane Wecke
Purkinje-fibers
SA RA LA
AV
RV LV
SA
RA LA
AV
RV LV
SA
RA LA
AV
RV LV
SA
RA LA
AV
RV LV
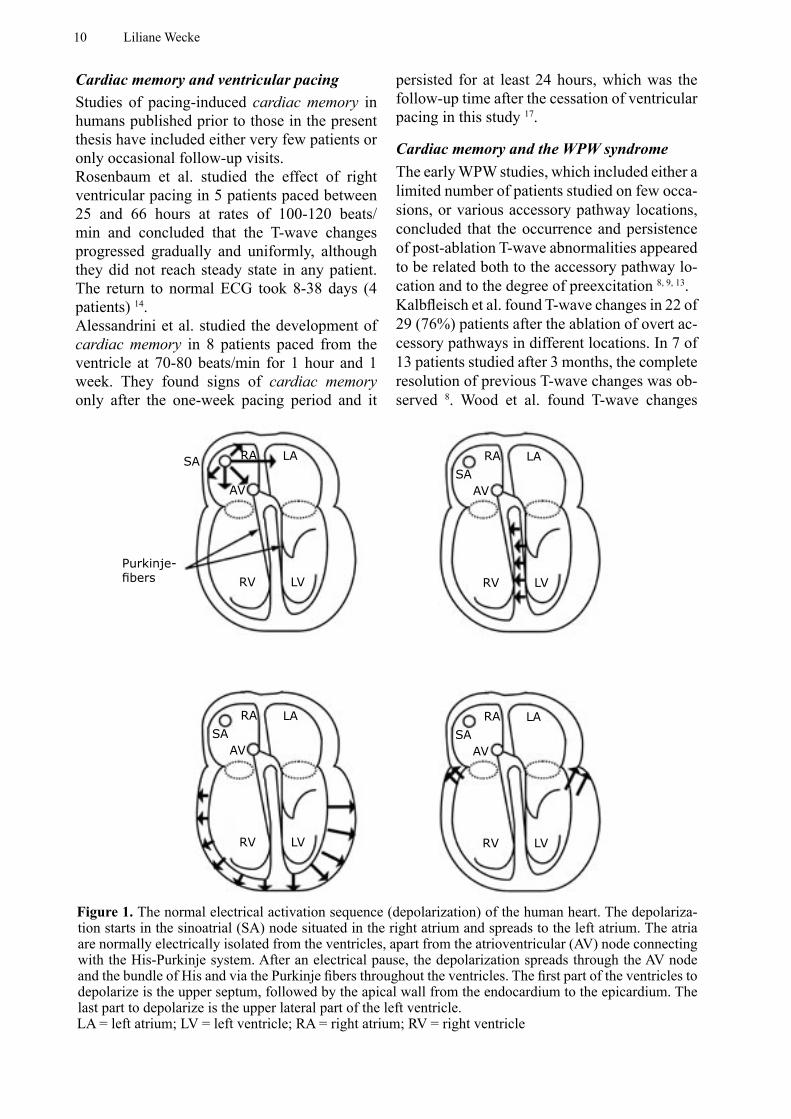
Figure 1. The normal electrical activation sequence (depolarization) of the human heart. The depolariza-tion starts in the sinoatrial (SA) node situated in the right atrium and spreads to the left atrium. The atria are normally electrically isolated from the ventricles, apart from the atrioventricular (AV) node connecting with the His-Purkinje system. After an electrical pause, the depolarization spreads through the AV node and the bundle of His and via the Purkinje fibers throughout the ventricles. The first part of the ventricles to depolarize is the upper septum, followed by the apical wall from the endocardium to the epicardium. The last part to depolarize is the upper lateral part of the left ventricle. LA = left atrium; LV = left ventricle; RA = right atrium; RV = right ventricle
Cardiac memory and ventricular pacingStudies of pacing-induced cardiac memory in humans published prior to those in the present thesis have included either very few patients or only occasional follow-up visits.Rosenbaum et al. studied the effect of right ventricular pacing in 5 patients paced between 25 and 66 hours at rates of 100-120 beats/min and concluded that the T-wave changes progressed gradually and uniformly, although they did not reach steady state in any patient. The return to normal ECG took 8-38 days (4 patients) 14. Alessandrini et al. studied the development of cardiac memory in 8 patients paced from the ventricle at 70-80 beats/min for 1 hour and 1 week. They found signs of cardiac memory only after the one-week pacing period and it
persisted for at least 24 hours, which was the follow-up time after the cessation of ventricular pacing in this study 17.
Cardiac memory and the WPW syndromeThe early WPW studies, which included either a limited number of patients studied on few occa-sions, or various accessory pathway locations, concluded that the occurrence and persistence of post-ablation T-wave abnormalities appeared to be related both to the accessory pathway lo-cation and to the degree of preexcitation 8, 9, 13. Kalbfleisch et al. found T-wave changes in 22 of 29 (76%) patients after the ablation of overt ac-cessory pathways in different locations. In 7 of 13 patients studied after 3 months, the complete resolution of previous T-wave changes was ob-served 8. Wood et al. found T-wave changes
Cardiac memory 11
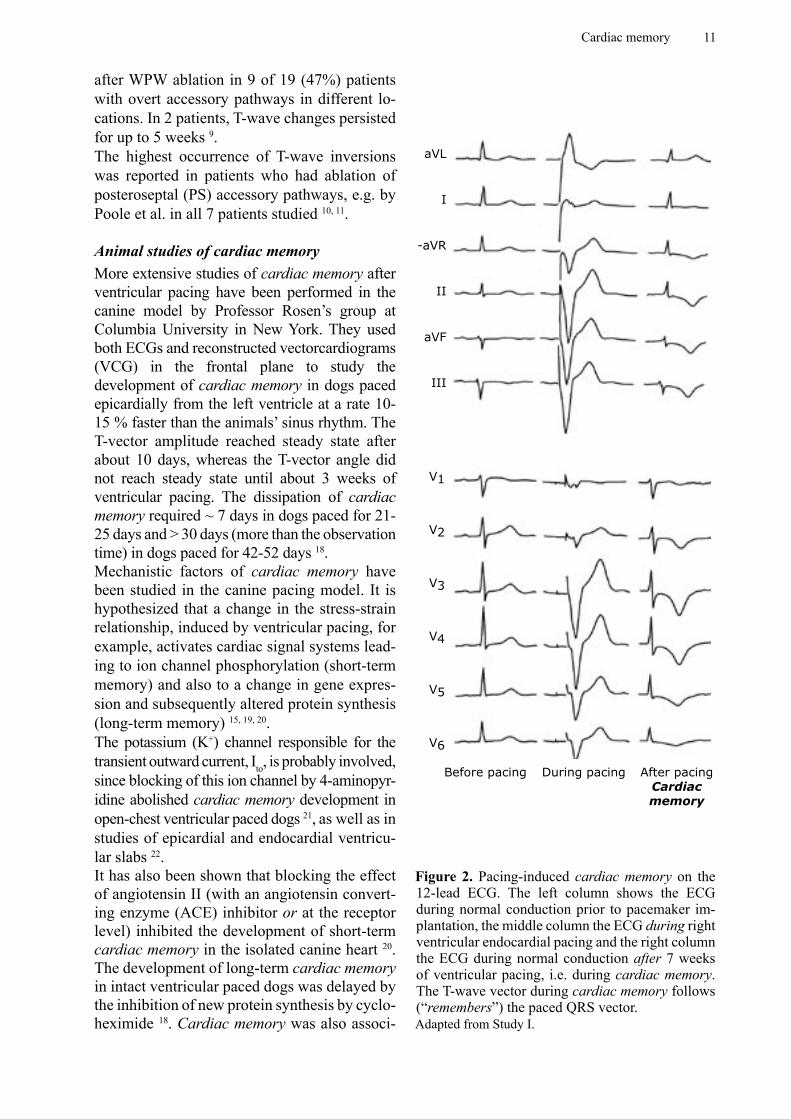
Figure 2. Pacing-induced cardiac memory on the 12-lead ECG. The left column shows the ECG during normal conduction prior to pacemaker im-plantation, the middle column the ECG during right ventricular endocardial pacing and the right column the ECG during normal conduction after 7 weeks of ventricular pacing, i.e. during cardiac memory. The T-wave vector during cardiac memory follows (“remembers”) the paced QRS vector.Adapted from Study I.
During pacing
aVL
I
-aVR
II
aVF
III
V1
V2
V3
V4
V5
V6
Before pacing After pacingCardiac memory
after WPW ablation in 9 of 19 (47%) patients with overt accessory pathways in different lo-cations. In 2 patients, T-wave changes persisted for up to 5 weeks 9.The highest occurrence of T-wave inversions was reported in patients who had ablation of posteroseptal (PS) accessory pathways, e.g. by Poole et al. in all 7 patients studied 10, 11.
Animal studies of cardiac memoryMore extensive studies of cardiac memory after ventricular pacing have been performed in the canine model by Professor Rosen’s group at Columbia University in New York. They used both ECGs and reconstructed vectorcardiograms (VCG) in the frontal plane to study the development of cardiac memory in dogs paced epicardially from the left ventricle at a rate 10-15 % faster than the animals’ sinus rhythm. The T-vector amplitude reached steady state after about 10 days, whereas the T-vector angle did not reach steady state until about 3 weeks of ventricular pacing. The dissipation of cardiac memory required ~ 7 days in dogs paced for 21-25 days and > 30 days (more than the observation time) in dogs paced for 42-52 days 18.Mechanistic factors of cardiac memory have been studied in the canine pacing model. It is hypothesized that a change in the stress-strain relationship, induced by ventricular pacing, for example, activates cardiac signal systems lead-ing to ion channel phosphorylation (short-term memory) and also to a change in gene expres-sion and subsequently altered protein synthesis (long-term memory) 15, 19, 20.The potassium (K+) channel responsible for the transient outward current, Ito, is probably involved, since blocking of this ion channel by 4-aminopyr-idine abolished cardiac memory development in open-chest ventricular paced dogs 21, as well as in studies of epicardial and endocardial ventricu-lar slabs 22.It has also been shown that blocking the effect of angiotensin II (with an angiotensin convert-ing enzyme (ACE) inhibitor or at the receptor level) inhibited the development of short-term cardiac memory in the isolated canine heart 20. The development of long-term cardiac memory in intact ventricular paced dogs was delayed by the inhibition of new protein synthesis by cyclo-heximide 18. Cardiac memory was also associ-
12 Liliane Wecke
ated with a prolongation of the action potential duration (APD) in epicardial and endocardial cells, but not in midmyocardial cells, measured in strips of canine myocardium from controls and long-term paced dogs 18.
Background to this thesisThis was the state of knowledge when this PhD project was initiated.The primary goal of the thesis was to study the temporal characteristics of the development and dissipation of cardiac memory in humans. Al-though it had been shown that cardiac memory development in the human pacing model de-pends on pacing duration and rate 3, 14, 17, the ex-act occurrence and the rate of its development and dissipation had not been defined.Secondly, cardiac memory after the ablation of an accessory pathway in the WPW syndrome had been reported to last for several months in some patients 8. However, the true occurrence of T-wave changes after the ablation of accessory pathways in different locations and the time frame for its dissipation was mainly unknown.
We hypothesized that pacing-induced cardiac memory would display similar general character-istics in humans compared with dogs, although the lower heart rates in humans would proba-bly lead to the slower development of cardiac memory (something that proved to be wrong). We also thought that the varying clinical back-ground would lead to a more pronounced tem-poral heterogeneity. Previous studies of cardiac memory in humans used the 12-lead ECG to define T-wave changes, whereas a reconstructed VCG in the frontal plane was used in the dog model 18. The VCG offers a method more easily to quantify the T-vector changes than the ECG and the VCG also provides information in all directions (if analyzed in 3 dimensions). We therefore chose to use the VCG analyzed in space for 3 of our 4 prospective studies. The study of patients paced to reduce the outflow tract obstruction (Study III) was initiated before we had begun with the VCG.
Cardiac memory has previously been regarded as a differential diagnostic problem masquerad-ing as myocardial ischemia 5, but it is currently recognized as a variant of electrophysiological
remodeling 15. Whether it is good, bad or neu-tral is still an unanswered question, although pronounced repolarization changes are known to increase the risk of arrhythmias. It therefore became important to investigate this issue fur-ther, since both pacemaker treatment and WPW ablation have increased during the last decade. The true occurrence of cardiac memory and the time factors for its development and dissipa-tion are crucial factors to define in a first step. Further studies of, for example, interactions be-tween cardiac memory and drugs, or attempts to modify or prevent cardiac memory, might then be performed.
Cardiac cellular electrophysiologyIn order to appreciate the concepts related to the mechanistic discussion of cardiac memory, some basic electrophysiological concepts need to be explained.
Membrane potentials 23
The cell membrane consists of a lipid bilayer which, from an electrical point of view, func-tions as a capacitor. The membrane potential is electro-chemical in origin and is mainly deter-mined by the concentration of K+ ions, which is relatively high inside the cell compared with the outside, and sodium (Na+) ions, which have a higher concentration outside the cell. The nor-mal resting potential of a cardiac myocyte is approximately the equilibrium potential for K+ (-90 mV) determined by the Nernst equation, although to be exact Na+ and chloride (Cl-) ions should be taken into account as well:
EK = RT/F x ln([Ko] / [Ki])
where EK = the equilibrium potential for K+ in volts (V) R = the universal gas constant = 8.314 J/(mole K)
J= joule, K = Kelvin)T = the absolute temperature in Kelvin (K)F = the Faraday constant = 96485 C/mole
(C = coulomb)Ko = K+ concentration outside the cell
(moles per liter)Ki = K+ concentration inside the cell
(moles per liter)
Cardiac memory 13
mV
0
-90
0 100 200 300 ms
Phase 4
Phase 0
Phase 1
Phase 2
Phase 3
Phase 4
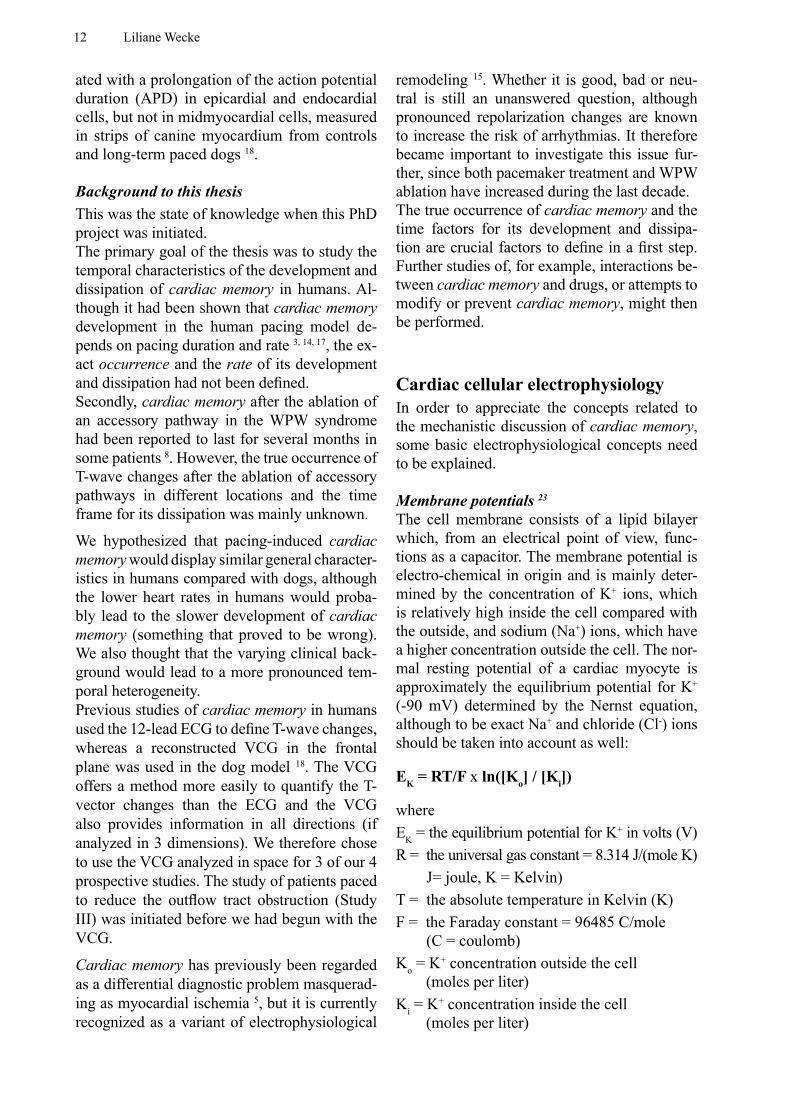
Figure 3. A typical ventricular myocardial action potential (AP) with its different phases. The broken line shows the more pronounced “notch” in epicar-dial cells. For details see the text.
Amplitude APD50
APD90
ARP RRP
RP
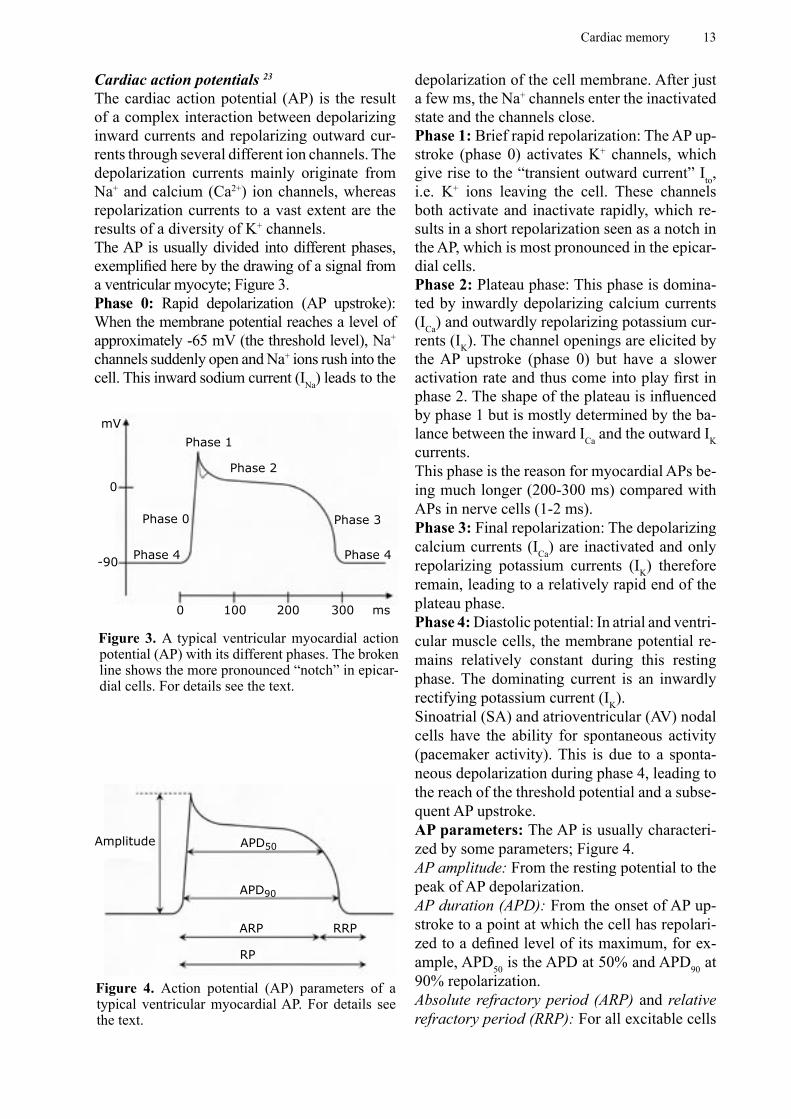
Figure 4. Action potential (AP) parameters of a typical ventricular myocardial AP. For details see the text.
Cardiac action potentials 23
The cardiac action potential (AP) is the result of a complex interaction between depolarizing inward currents and repolarizing outward cur-rents through several different ion channels. The depolarization currents mainly originate from Na+ and calcium (Ca2+) ion channels, whereas repolarization currents to a vast extent are the results of a diversity of K+ channels.The AP is usually divided into different phases, exemplified here by the drawing of a signal from a ventricular myocyte; Figure 3.Phase 0: Rapid depolarization (AP upstroke): When the membrane potential reaches a level of approximately -65 mV (the threshold level), Na+ channels suddenly open and Na+ ions rush into the cell. This inward sodium current (INa) leads to the
depolarization of the cell membrane. After just a few ms, the Na+ channels enter the inactivated state and the channels close.Phase 1: Brief rapid repolarization: The AP up-stroke (phase 0) activates K+ channels, which give rise to the “transient outward current” Ito, i.e. K+ ions leaving the cell. These channels both activate and inactivate rapidly, which re-sults in a short repolarization seen as a notch in the AP, which is most pronounced in the epicar-dial cells.Phase 2: Plateau phase: This phase is domina-ted by inwardly depolarizing calcium currents (ICa) and outwardly repolarizing potassium cur-rents (IK). The channel openings are elicited by the AP upstroke (phase 0) but have a slower activation rate and thus come into play first in phase 2. The shape of the plateau is influenced by phase 1 but is mostly determined by the ba-lance between the inward ICa and the outward IK currents. This phase is the reason for myocardial APs be-ing much longer (200-300 ms) compared with APs in nerve cells (1-2 ms).Phase 3: Final repolarization: The depolarizing calcium currents (ICa) are inactivated and only repolarizing potassium currents (IK) therefore remain, leading to a relatively rapid end of the plateau phase.Phase 4: Diastolic potential: In atrial and ventri-cular muscle cells, the membrane potential re-mains relatively constant during this resting phase. The dominating current is an inwardly rectifying potassium current (IK).Sinoatrial (SA) and atrioventricular (AV) nodal cells have the ability for spontaneous activity (pacemaker activity). This is due to a sponta-neous depolarization during phase 4, leading to the reach of the threshold potential and a subse-quent AP upstroke.AP parameters: The AP is usually characteri-zed by some parameters; Figure 4.AP amplitude: From the resting potential to the peak of AP depolarization.AP duration (APD): From the onset of AP up-stroke to a point at which the cell has repolari-zed to a defined level of its maximum, for ex-ample, APD50 is the APD at 50% and APD90 at 90% repolarization.Absolute refractory period (ARP) and relative refractory period (RRP): For all excitable cells
14 Liliane Wecke
RESTING STATE(Closed)
INACTIVATED(Closed)
ACTIVATED(Open)
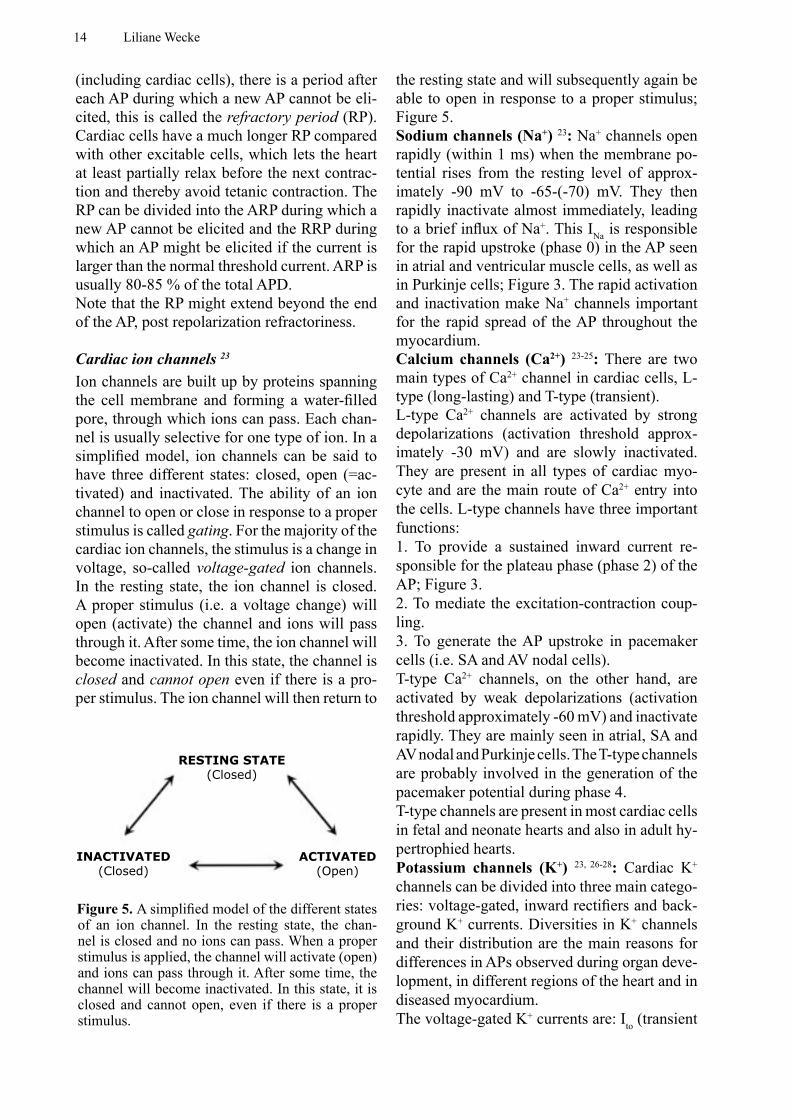
Figure 5. A simplified model of the different states of an ion channel. In the resting state, the chan-nel is closed and no ions can pass. When a proper stimulus is applied, the channel will activate (open) and ions can pass through it. After some time, the channel will become inactivated. In this state, it is closed and cannot open, even if there is a proper stimulus.
(including cardiac cells), there is a period after each AP during which a new AP cannot be eli-cited, this is called the refractory period (RP). Cardiac cells have a much longer RP compared with other excitable cells, which lets the heart at least partially relax before the next contrac-tion and thereby avoid tetanic contraction. The RP can be divided into the ARP during which a new AP cannot be elicited and the RRP during which an AP might be elicited if the current is larger than the normal threshold current. ARP is usually 80-85 % of the total APD.Note that the RP might extend beyond the end of the AP, post repolarization refractoriness.
Cardiac ion channels 23
Ion channels are built up by proteins spanning the cell membrane and forming a water-filled pore, through which ions can pass. Each chan-nel is usually selective for one type of ion. In a simplified model, ion channels can be said to have three different states: closed, open (=ac-tivated) and inactivated. The ability of an ion channel to open or close in response to a proper stimulus is called gating. For the majority of the cardiac ion channels, the stimulus is a change in voltage, so-called voltage-gated ion channels. In the resting state, the ion channel is closed. A proper stimulus (i.e. a voltage change) will open (activate) the channel and ions will pass through it. After some time, the ion channel will become inactivated. In this state, the channel is closed and cannot open even if there is a pro-per stimulus. The ion channel will then return to
the resting state and will subsequently again be able to open in response to a proper stimulus; Figure 5.Sodium channels (Na+) 23: Na+ channels open rapidly (within 1 ms) when the membrane po-tential rises from the resting level of approx-imately -90 mV to -65-(-70) mV. They then rapidly inactivate almost immediately, leading to a brief influx of Na+. This INa is responsible for the rapid upstroke (phase 0) in the AP seen in atrial and ventricular muscle cells, as well as in Purkinje cells; Figure 3. The rapid activation and inactivation make Na+ channels important for the rapid spread of the AP throughout the myocardium.Calcium channels (Ca2+) 23-25: There are two main types of Ca2+ channel in cardiac cells, L-type (long-lasting) and T-type (transient). L-type Ca2+ channels are activated by strong depolarizations (activation threshold approx-imately -30 mV) and are slowly inactivated. They are present in all types of cardiac myo-cyte and are the main route of Ca2+ entry into the cells. L-type channels have three important functions: 1. To provide a sustained inward current re-sponsible for the plateau phase (phase 2) of the AP; Figure 3. 2. To mediate the excitation-contraction coup-ling. 3. To generate the AP upstroke in pacemaker cells (i.e. SA and AV nodal cells).T-type Ca2+ channels, on the other hand, are activated by weak depolarizations (activation threshold approximately -60 mV) and inactivate rapidly. They are mainly seen in atrial, SA and AV nodal and Purkinje cells. The T-type channels are probably involved in the generation of the pacemaker potential during phase 4.T-type channels are present in most cardiac cells in fetal and neonate hearts and also in adult hy-pertrophied hearts.Potassium channels (K+) 23, 26-28: Cardiac K+ channels can be divided into three main catego-ries: voltage-gated, inward rectifiers and back-ground K+ currents. Diversities in K+ channels and their distribution are the main reasons for differences in APs observed during organ deve-lopment, in different regions of the heart and in diseased myocardium.The voltage-gated K+ currents are: Ito (transient
Cardiac memory 15
outward current), IKur (ultra-rapid delayed rec-tifier), IKr (rapid delayed rectifier) and IKs (slow delayed rectifier). There is also one voltage-gated inward rectifier, IK1.Ito is responsible for the early repolarization (phase 1) of atrial and ventricular APs; Figure 3.The three delayed rectifier K+ currents are dis-tinguished by different rates of activation with IKur (ultra-rapid) > IKr (rapid) > IKs (slow). They are mainly responsible for repolarization from the plateau phase in cardiac myocytes and Pur-kinje cells. In humans, IKur is the dominant de-layed rectifier in the atrium, but it is not present in the ventricle. IKr is relatively low during the AP plateau (phase 2) but increases during phase 3, leading to the repolarization of the cell. IKs on the other hand, increases gradually during the AP plateau and remains active during phase 3. The inward rectifier IK1 is active in final repola-rization (phase 3) and is also a major contribu-tor to the resting membrane potential (phase 4); Figure 3.Other inward rectifiers are IKATP, which proba-bly activates primarily during ischemia, and IKACh, which is activated by acetylcholine.
Cardiac membrane pumps and ion exchangers 23
After an AP, the ion gradients across the cell membrane have to be re-established. This is ac-complished by membrane pumps, which use energy (ATP) to transport ions across the cell membrane, or by ion exchangers, which use the electrochemical gradient of one type of ions to transport another type of ions across the cell membrane. The most important are the Na+-K+- pump and the Na+-Ca2+-exchanger.
Excitation-contraction coupling (electro-mechanical coupling) 29
The influx of Ca2+ ions during the AP plateau (phase 2) triggers a massive release of Ca2+ ions from the sarcoplasmic reticulum (SR), which serves as a Ca2+ store. The subsequent rise in intracellular Ca2+ concentration leads to the contraction of the cardiac myocyte via binding to contractile proteins.
Gap junctions 30-32
Gap junctions are essentially non-selective channels that connect adjacent cardiac myocy-tes to each other, creating a functional syncy-
tium. They are important for the rapid spread of the AP along cardiac cells, as well as for the spread of signal and metabolic molecules. Gap junctions are concentrated at the end of a ty-pical cardiac myocyte but are also present all along the surface of the cell, creating a three-dimensional syncytium. Gap junctions are built up by proteins called connexins, where connexin43 (Cx43) is the most important in the human heart. Six con-nexins form a connexon (“hemi-channel”) and two connexons from adjacent cells dock to form a gap junction channel. The distribution of gap junctions shows regional differences in the heart and there are also differences in distri-bution in the fetal and young myocardium. The distribution and expression of connexins may be changed by pathological conditions, resul-ting in a pattern resembling the fetal or young heart. The conduction of gap junctions can also be modulated by the phosphorylation of Cx43.
Propagation 33
When an AP is elicited, the depolarization spreads to surrounding cells. The propagation throughout the myocardium depends on the ba-lance between the depolarizing current (current source) and the current needed to depolarize adjacent resting cells (current sink) and also on the ability of the current to move through gap junctions.
Diversity of cardiac cells 26, 28, 34 The AP waveform varies in different regions of the human heart, which influences excitation-contraction coupling, propagation and also the heterogeneity of repolarization. The difference in AP is mainly due to different expressions of voltage-gated K+ channels. Furthermore, cardiac disease often leads to changes in the distribution or properties of vol-tage-gated K+ channels and subsequently to changes in the AP, which may in turn create a substrate for arrhythmias. There are also local differences in APs within the myocardium, with ventricular endocardial cells having a longer APD without the phase 1 notch, compared with the epicardial cells with a shorter APD and a pronounced phase 1 notch. The midmyocardial M-cells have an even longer APD, which also has the ability to
16 Liliane Wecke
P
Q
R
S
T
ARIQT interval
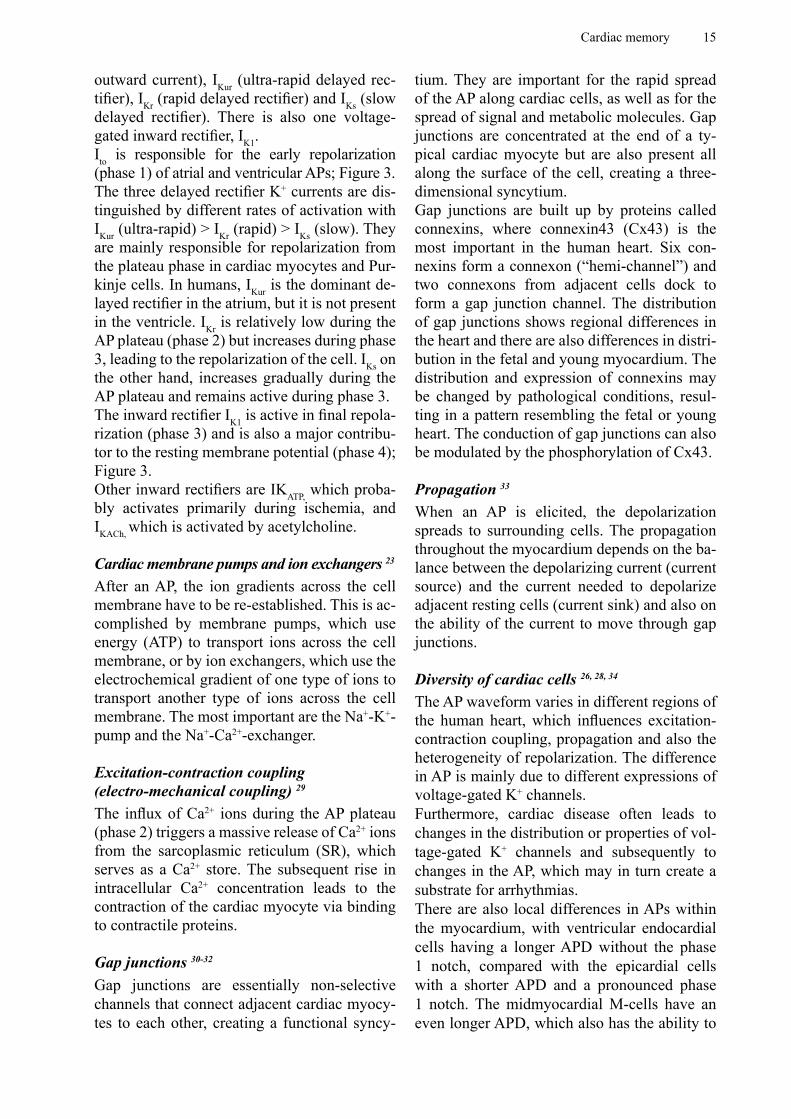
Figure 6. The relationship between the ECG and a typical ventricular action potential. The QRS complex depicts the depolarization of ventricular myocardial cells and the T wave their subsequent repolarization. The QT interval is a measure of ven-tricular repolarization time. Sometimes the activa-tion-recovery interval (ARI) is used to represent the repolarization time.
L
+Q
-Q
d
P
VP
Axis of dipole
VP = μ x cos θ / d2
θ
μ = Q x L
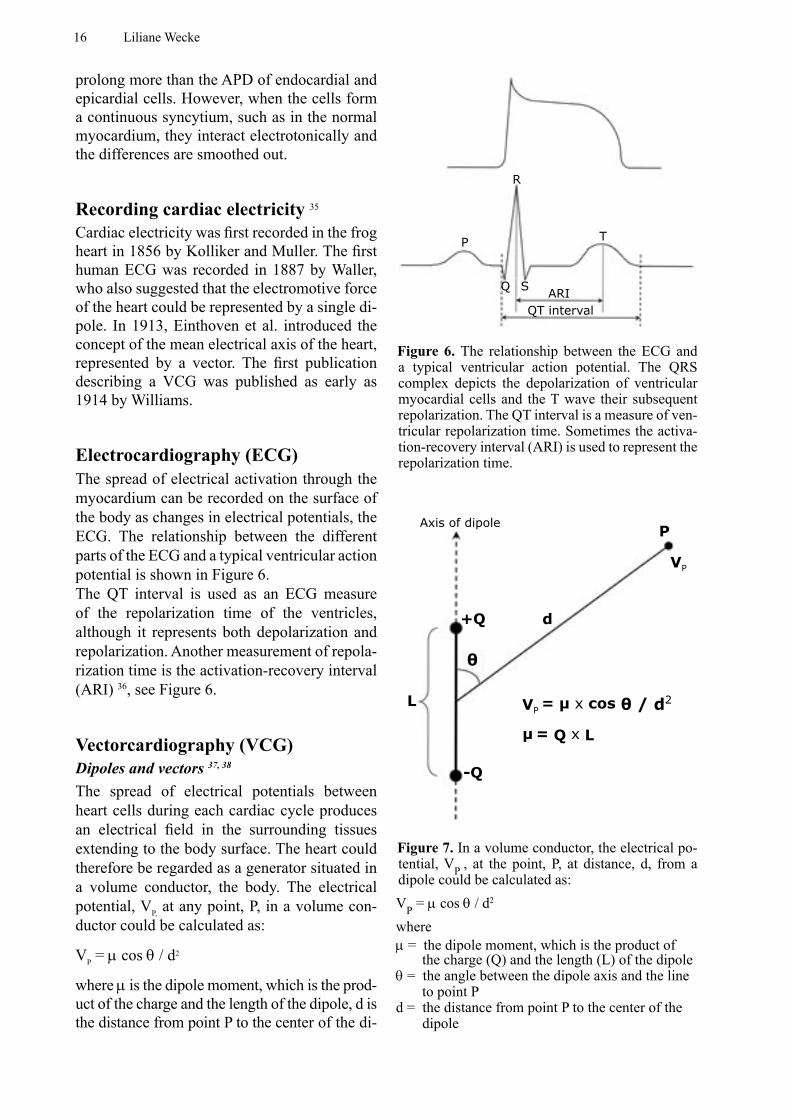
Figure 7. In a volume conductor, the electrical po-tential, VP , at the point, P, at distance, d, from a dipole could be calculated as: VP = µ cos θ / d2
whereµ = the dipole moment, which is the product of
the charge (Q) and the length (L) of the dipoleθ = the angle between the dipole axis and the line
to point Pd = the distance from point P to the center of the
dipole
prolong more than the APD of endocardial and epicardial cells. However, when the cells form a continuous syncytium, such as in the normal myocardium, they interact electrotonically and the differences are smoothed out.
Recording cardiac electricity 35 Cardiac electricity was first recorded in the frog heart in 1856 by Kolliker and Muller. The first human ECG was recorded in 1887 by Waller, who also suggested that the electromotive force of the heart could be represented by a single di-pole. In 1913, Einthoven et al. introduced the concept of the mean electrical axis of the heart, represented by a vector. The first publication describing a VCG was published as early as 1914 by Williams.
Electrocardiography (ECG)The spread of electrical activation through the myocardium can be recorded on the surface of the body as changes in electrical potentials, the ECG. The relationship between the different parts of the ECG and a typical ventricular action potential is shown in Figure 6. The QT interval is used as an ECG measure of the repolarization time of the ventricles, although it represents both depolarization and repolarization. Another measurement of repola-rization time is the activation-recovery interval (ARI) 36, see Figure 6.
Vectorcardiography (VCG)Dipoles and vectors 37, 38
The spread of electrical potentials between heart cells during each cardiac cycle produces an electrical field in the surrounding tissues extending to the body surface. The heart could therefore be regarded as a generator situated in a volume conductor, the body. The electrical potential, VP, at any point, P, in a volume con-ductor could be calculated as:
VP = µ cos θ / d2
where µ is the dipole moment, which is the prod-uct of the charge and the length of the dipole, d is the distance from point P to the center of the di-
Cardiac memory 17
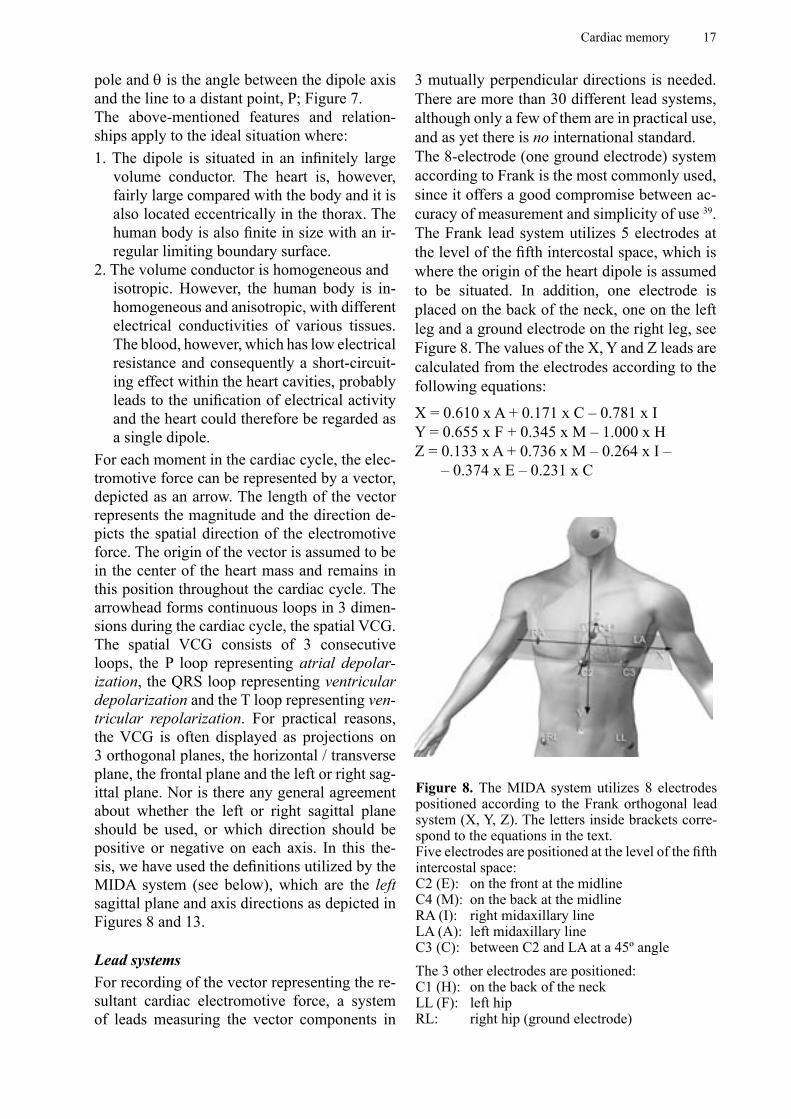
Figure 8. The MIDA system utilizes 8 electrodes positioned according to the Frank orthogonal lead system (X, Y, Z). The letters inside brackets corre-spond to the equations in the text.Five electrodes are positioned at the level of the fifth intercostal space:C2 (E): on the front at the midlineC4 (M): on the back at the midlineRA (I): right midaxillary lineLA (A): left midaxillary lineC3 (C): between C2 and LA at a 45º angleThe 3 other electrodes are positioned:C1 (H): on the back of the neckLL (F): left hipRL: right hip (ground electrode)
pole and θ is the angle between the dipole axis and the line to a distant point, P; Figure 7.The above-mentioned features and relation-ships apply to the ideal situation where:1. The dipole is situated in an infinitely large
volume conductor. The heart is, however, fairly large compared with the body and it is also located eccentrically in the thorax. The human body is also finite in size with an ir-regular limiting boundary surface.
2. The volume conductor is homogeneous andisotropic. However, the human body is in-homogeneous and anisotropic, with different electrical conductivities of various tissues. The blood, however, which has low electrical resistance and consequently a short-circuit-ing effect within the heart cavities, probably leads to the unification of electrical activity and the heart could therefore be regarded as a single dipole.
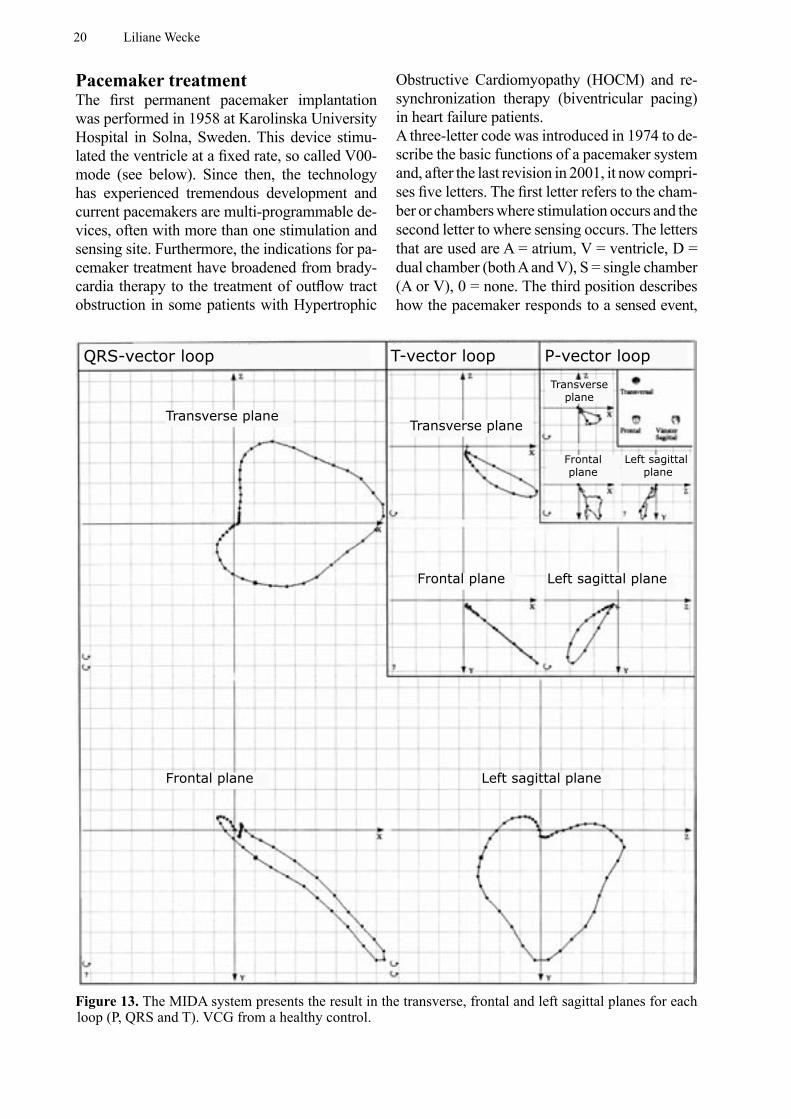
For each moment in the cardiac cycle, the elec-tromotive force can be represented by a vector, depicted as an arrow. The length of the vector represents the magnitude and the direction de-picts the spatial direction of the electromotive force. The origin of the vector is assumed to be in the center of the heart mass and remains in this position throughout the cardiac cycle. The arrowhead forms continuous loops in 3 dimen-sions during the cardiac cycle, the spatial VCG. The spatial VCG consists of 3 consecutive loops, the P loop representing atrial depolar-ization, the QRS loop representing ventricular depolarization and the T loop representing ven-tricular repolarization. For practical reasons, the VCG is often displayed as projections on 3 orthogonal planes, the horizontal / transverse plane, the frontal plane and the left or right sag-ittal plane. Nor is there any general agreement about whether the left or right sagittal plane should be used, or which direction should be positive or negative on each axis. In this the-sis, we have used the definitions utilized by the MIDA system (see below), which are the left sagittal plane and axis directions as depicted in Figures 8 and 13.
Lead systemsFor recording of the vector representing the re-sultant cardiac electromotive force, a system of leads measuring the vector components in
3 mutually perpendicular directions is needed. There are more than 30 different lead systems, although only a few of them are in practical use, and as yet there is no international standard. The 8-electrode (one ground electrode) system according to Frank is the most commonly used, since it offers a good compromise between ac-curacy of measurement and simplicity of use 39. The Frank lead system utilizes 5 electrodes at the level of the fifth intercostal space, which is where the origin of the heart dipole is assumed to be situated. In addition, one electrode is placed on the back of the neck, one on the left leg and a ground electrode on the right leg, see Figure 8. The values of the X, Y and Z leads are calculated from the electrodes according to the following equations:
X = 0.610 x A + 0.171 x C – 0.781 x IY = 0.655 x F + 0.345 x M – 1.000 x HZ = 0.133 x A + 0.736 x M – 0.264 x I –
– 0.374 x E – 0.231 x C
18 Liliane Wecke
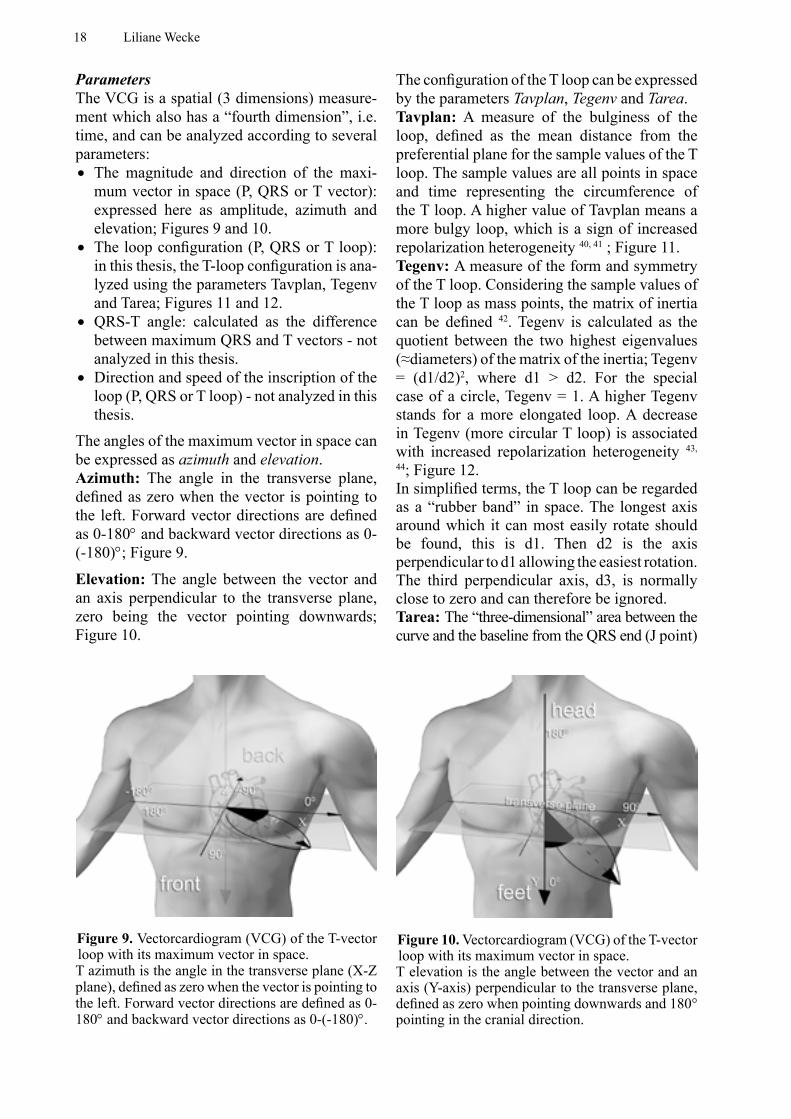
Figure 9. Vectorcardiogram (VCG) of the T-vector loop with its maximum vector in space. T azimuth is the angle in the transverse plane (X-Z plane), defined as zero when the vector is pointing to the left. Forward vector directions are defined as 0-180° and backward vector directions as 0-(-180)°.
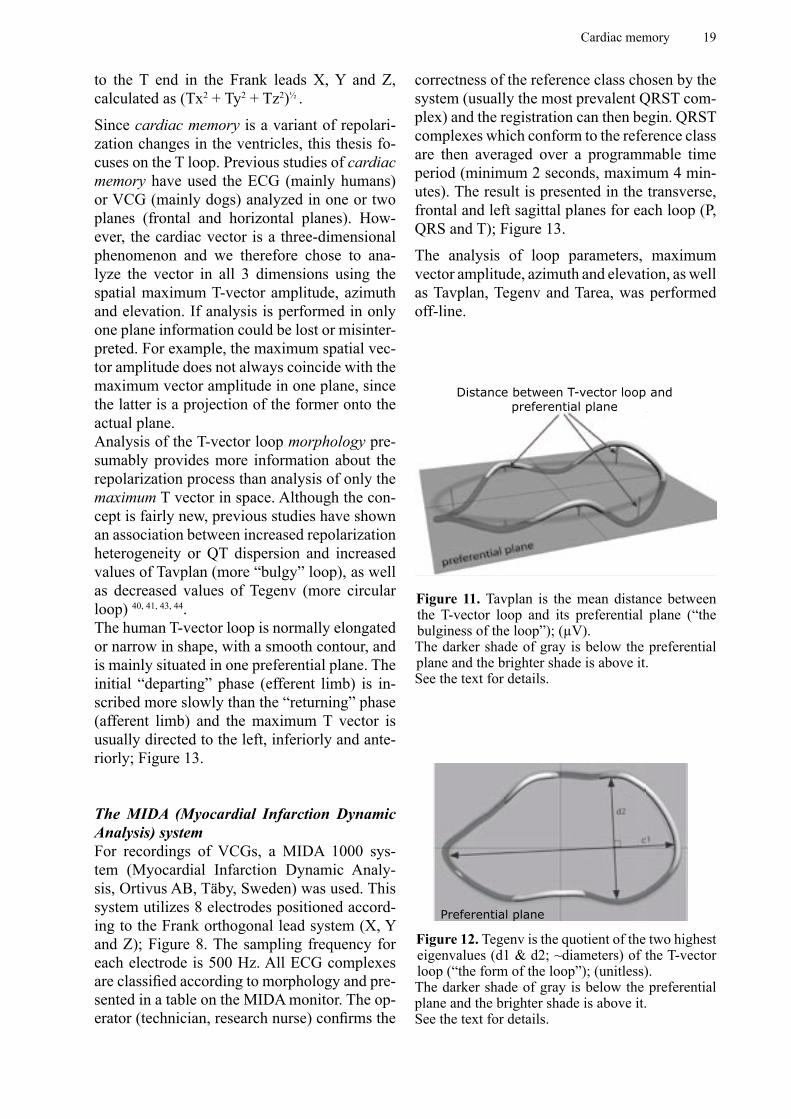
Figure 10. Vectorcardiogram (VCG) of the T-vector loop with its maximum vector in space. T elevation is the angle between the vector and an axis (Y-axis) perpendicular to the transverse plane, defined as zero when pointing downwards and 180° pointing in the cranial direction.
ParametersThe VCG is a spatial (3 dimensions) measure-ment which also has a “fourth dimension”, i.e. time, and can be analyzed according to several parameters:• The magnitude and direction of the maxi-
mum vector in space (P, QRS or T vector): expressed here as amplitude, azimuth and elevation; Figures 9 and 10.
• The loop configuration (P, QRS or T loop): in this thesis, the T-loop configuration is ana-lyzed using the parameters Tavplan, Tegenv and Tarea; Figures 11 and 12.
• QRS-T angle: calculated as the difference between maximum QRS and T vectors - not analyzed in this thesis.
• Direction and speed of the inscription of the loop (P, QRS or T loop) - not analyzed in this thesis.
The angles of the maximum vector in space can be expressed as azimuth and elevation.Azimuth: The angle in the transverse plane, defined as zero when the vector is pointing to the left. Forward vector directions are defined as 0-180° and backward vector directions as 0-(-180)°; Figure 9.
Elevation: The angle between the vector and an axis perpendicular to the transverse plane, zero being the vector pointing downwards; Figure 10.
The configuration of the T loop can be expressed by the parameters Tavplan, Tegenv and Tarea.Tavplan: A measure of the bulginess of the loop, defined as the mean distance from the preferential plane for the sample values of the T loop. The sample values are all points in space and time representing the circumference of the T loop. A higher value of Tavplan means a more bulgy loop, which is a sign of increased repolarization heterogeneity 40, 41 ; Figure 11.Tegenv: A measure of the form and symmetry of the T loop. Considering the sample values of the T loop as mass points, the matrix of inertia can be defined 42. Tegenv is calculated as the quotient between the two highest eigenvalues (≈diameters) of the matrix of the inertia; Tegenv = (d1/d2)2, where d1 > d2. For the special case of a circle, Tegenv = 1. A higher Tegenv stands for a more elongated loop. A decrease in Tegenv (more circular T loop) is associated with increased repolarization heterogeneity 43,
44; Figure 12.In simplified terms, the T loop can be regarded as a “rubber band” in space. The longest axis around which it can most easily rotate should be found, this is d1. Then d2 is the axis perpendicular to d1 allowing the easiest rotation. The third perpendicular axis, d3, is normally close to zero and can therefore be ignored.Tarea: The “three-dimensional” area between the curve and the baseline from the QRS end (J point)
Cardiac memory 19
correctness of the reference class chosen by the system (usually the most prevalent QRST com-plex) and the registration can then begin. QRST complexes which conform to the reference class are then averaged over a programmable time period (minimum 2 seconds, maximum 4 min-utes). The result is presented in the transverse, frontal and left sagittal planes for each loop (P, QRS and T); Figure 13.
The analysis of loop parameters, maximum vector amplitude, azimuth and elevation, as well as Tavplan, Tegenv and Tarea, was performed off-line.
Distance between T-vector loop and preferential plane
Figure 11. Tavplan is the mean distance between the T-vector loop and its preferential plane (“the bulginess of the loop”); (µV).The darker shade of gray is below the preferential plane and the brighter shade is above it.See the text for details.
Figure 12. Tegenv is the quotient of the two highest eigenvalues (d1 & d2; ~diameters) of the T-vector loop (“the form of the loop”); (unitless).The darker shade of gray is below the preferential plane and the brighter shade is above it.See the text for details.
Preferential plane
to the T end in the Frank leads X, Y and Z, calculated as (Tx2 + Ty2 + Tz2)½ .
Since cardiac memory is a variant of repolari-zation changes in the ventricles, this thesis fo-cuses on the T loop. Previous studies of cardiac memory have used the ECG (mainly humans) or VCG (mainly dogs) analyzed in one or two planes (frontal and horizontal planes). How-ever, the cardiac vector is a three-dimensional phenomenon and we therefore chose to ana-lyze the vector in all 3 dimensions using the spatial maximum T-vector amplitude, azimuth and elevation. If analysis is performed in only one plane information could be lost or misinter-preted. For example, the maximum spatial vec-tor amplitude does not always coincide with the maximum vector amplitude in one plane, since the latter is a projection of the former onto the actual plane. Analysis of the T-vector loop morphology pre-sumably provides more information about the repolarization process than analysis of only the maximum T vector in space. Although the con-cept is fairly new, previous studies have shown an association between increased repolarization heterogeneity or QT dispersion and increased values of Tavplan (more “bulgy” loop), as well as decreased values of Tegenv (more circular loop) 40, 41, 43, 44. The human T-vector loop is normally elongated or narrow in shape, with a smooth contour, and is mainly situated in one preferential plane. The initial “departing” phase (efferent limb) is in-scribed more slowly than the “returning” phase (afferent limb) and the maximum T vector is usually directed to the left, inferiorly and ante-riorly; Figure 13.
The MIDA (Myocardial Infarction Dynamic Analysis) system For recordings of VCGs, a MIDA 1000 sys-tem (Myocardial Infarction Dynamic Analy-sis, Ortivus AB, Täby, Sweden) was used. This system utilizes 8 electrodes positioned accord-ing to the Frank orthogonal lead system (X, Y and Z); Figure 8. The sampling frequency for each electrode is 500 Hz. All ECG complexes are classifi ed according to morphology and pre-sented in a table on the MIDA monitor. The op-erator (technician, research nurse) confi rms the
20 Liliane Wecke
Obstructive Cardiomyopathy (HOCM) and re-synchronization therapy (biventricular pacing) in heart failure patients.A three-letter code was introduced in 1974 to de-scribe the basic functions of a pacemaker system and, after the last revision in 2001, it now compri-ses five letters. The first letter refers to the cham-ber or chambers where stimulation occurs and the second letter to where sensing occurs. The letters that are used are A = atrium, V = ventricle, D = dual chamber (both A and V), S = single chamber (A or V), 0 = none. The third position describes how the pacemaker responds to a sensed event,
Pacemaker treatmentThe first permanent pacemaker implantation was performed in 1958 at Karolinska University Hospital in Solna, Sweden. This device stimu-lated the ventricle at a fixed rate, so called V00-mode (see below). Since then, the technology has experienced tremendous development and current pacemakers are multi-programmable de-vices, often with more than one stimulation and sensing site. Furthermore, the indications for pa-cemaker treatment have broadened from brady-cardia therapy to the treatment of outflow tract obstruction in some patients with Hypertrophic
Figure 13. The MIDA system presents the result in the transverse, frontal and left sagittal planes for each loop (P, QRS and T). VCG from a healthy control.
QRS-vector loop T-vector loop P-vector loop
Transverse plane
Frontal plane Left sagittal plane
Transverse plane
Frontal plane Left sagittal plane
Transverse plane
Frontalplane
Left sagittal plane
Cardiac memory 21
Purkinje-fibers
SA RA LA
AV
RV LV
SA
RA LA
AV
RV LV
P
R
S
TΔ
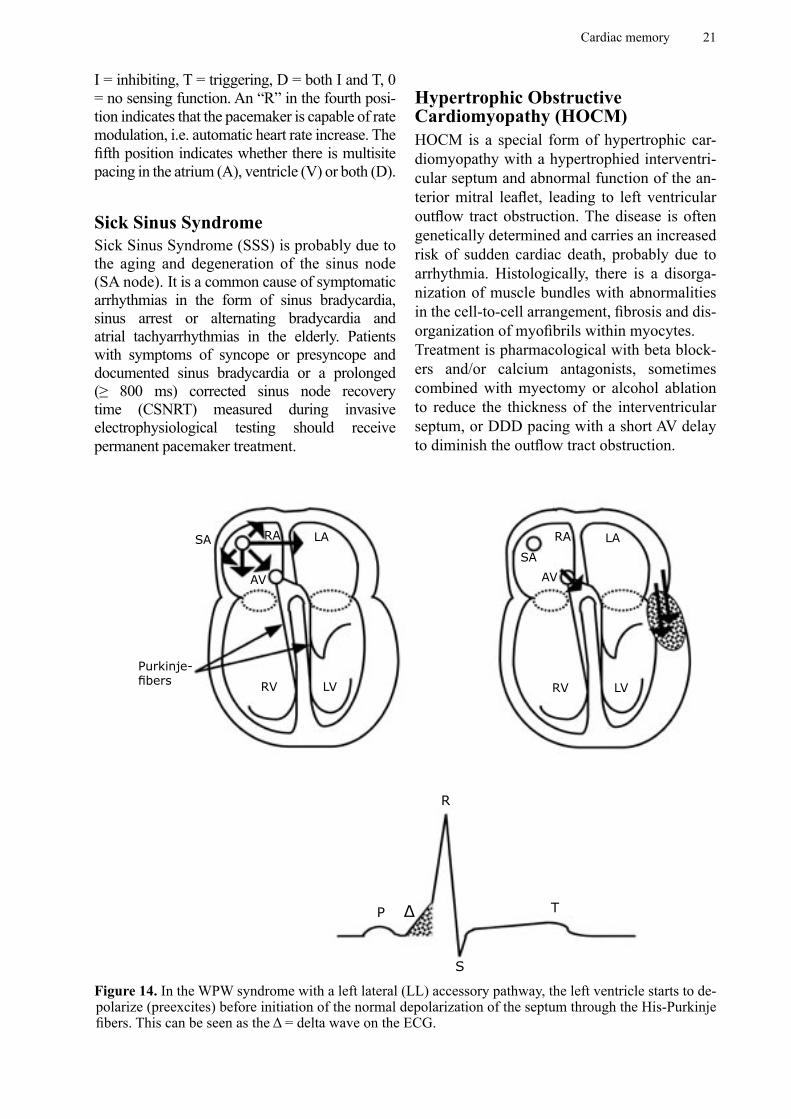
Figure 14. In the WPW syndrome with a left lateral (LL) accessory pathway, the left ventricle starts to de-polarize (preexcites) before initiation of the normal depolarization of the septum through the His-Purkinje fibers. This can be seen as the Δ = delta wave on the ECG.
I = inhibiting, T = triggering, D = both I and T, 0 = no sensing function. An “R” in the fourth posi-tion indicates that the pacemaker is capable of rate modulation, i.e. automatic heart rate increase. The fifth position indicates whether there is multisite pacing in the atrium (A), ventricle (V) or both (D).
Sick Sinus SyndromeSick Sinus Syndrome (SSS) is probably due to the aging and degeneration of the sinus node (SA node). It is a common cause of symptomatic arrhythmias in the form of sinus bradycardia, sinus arrest or alternating bradycardia and atrial tachyarrhythmias in the elderly. Patients with symptoms of syncope or presyncope and documented sinus bradycardia or a prolonged (≥ 800 ms) corrected sinus node recovery time (CSNRT) measured during invasive electrophysiological testing should receive permanent pacemaker treatment.
Hypertrophic Obstructive Cardiomyopathy (HOCM)HOCM is a special form of hypertrophic car-diomyopathy with a hypertrophied interventri-cular septum and abnormal function of the an-terior mitral leaflet, leading to left ventricular outflow tract obstruction. The disease is often genetically determined and carries an increased risk of sudden cardiac death, probably due to arrhythmia. Histologically, there is a disorga-nization of muscle bundles with abnormalities in the cell-to-cell arrangement, fibrosis and dis-organization of myofibrils within myocytes. Treatment is pharmacological with beta block-ers and/or calcium antagonists, sometimes combined with myectomy or alcohol ablation to reduce the thickness of the interventricular septum, or DDD pacing with a short AV delay to diminish the outflow tract obstruction.
22 Liliane Wecke
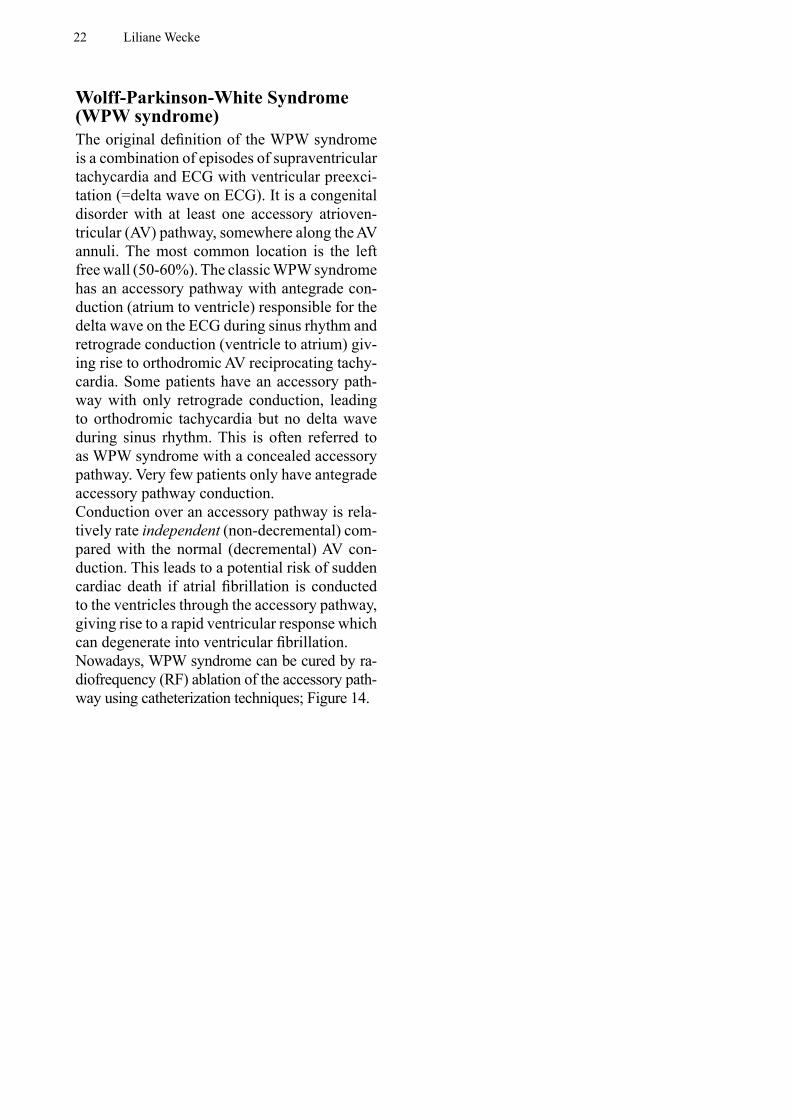
Wolff-Parkinson-White Syndrome (WPW syndrome)The original definition of the WPW syndrome is a combination of episodes of supraventricular tachycardia and ECG with ventricular preexci-tation (=delta wave on ECG). It is a congenital disorder with at least one accessory atrioven-tricular (AV) pathway, somewhere along the AV annuli. The most common location is the left free wall (50-60%). The classic WPW syndrome has an accessory pathway with antegrade con-duction (atrium to ventricle) responsible for the delta wave on the ECG during sinus rhythm and retrograde conduction (ventricle to atrium) giv-ing rise to orthodromic AV reciprocating tachy-cardia. Some patients have an accessory path-way with only retrograde conduction, leading to orthodromic tachycardia but no delta wave during sinus rhythm. This is often referred to as WPW syndrome with a concealed accessory pathway. Very few patients only have antegrade accessory pathway conduction.Conduction over an accessory pathway is rela-tively rate independent (non-decremental) com-pared with the normal (decremental) AV con-duction. This leads to a potential risk of sudden cardiac death if atrial fibrillation is conducted to the ventricles through the accessory pathway, giving rise to a rapid ventricular response which can degenerate into ventricular fibrillation.Nowadays, WPW syndrome can be cured by ra-diofrequency (RF) ablation of the accessory path-way using catheterization techniques; Figure 14.
Cardiac memory 23
AIMSThe main goal for this thesis was to study the occurrence, development and dissipation (resolution) of cardiac memory in two different human models (ventricular pacing and WPW syndrome), using electrocardiography (ECG) and vectorcardiography (VCG). The sequence below represents the order chosen for presentation rather than the temporal process of the PhD project, which followed different parallel tracks.
In more detail:
• To define the temporal characteristics of the development of pacing-induced cardiac memory and shed some light on its dissipation (Study I)
• To describe the sequence of appearance of repolarization changes related to pacing- induced cardiac memory as reflected by different ECG and VCG parameters (Study II)
• To shed some light on possible positive and negative effects on ventricular repolarization as a consequence of pacing-induced cardiac memory (Studies II & III)
• To compare pacing-induced cardiac memory in patients with and without (controls) hyper-trophic obstructive cardiomyopathy (HOCM) (Study III)
• To study the occurrence of and time frame for the dissipation of cardiac memory after WPW ablation (Studies IV & V)
• To compare the incidence and characteristics of cardiac memory after WPW ablation of posteroseptal and left lateral accessory pathways (Study V)
24 Liliane Wecke
MATERIAL AND METHODS
Two different models were used to study car-diac memory in humans, endocardial right
ventricular pacing and the ablation of accessory pathways in patients with the WPW syndrome. The two models are complementary. The pacing model (Studies I-III) provides an opportunity to study cardiac memory development, as well as its dissipation, since pacemaker stimulation can be set at on or off. Translational research is pos-sible because both experimental in vitro and in vivo models are available. In contrast, the treatment of WPW patients (Studies IV-V) provides a model that is unique to humans. Compared with the pacing model, this is a completely different situation, with an abnormal activation pattern that is congenital, and after ablation a normal pattern is acquired. However, only cardiac memory dissipation can be studied in this model, but the “memory” has been induced during a period of years and even decades.
Studies I and IIThe time frame for the development of pacing-induced cardiac memory and related repolariza-tion changes was studied in a group of patients with only mild structural heart disease. In ad-dition, some data on the dissipation of cardiac memory was also achieved.
PatientsThese studies were conducted on two series of patients who received DDD-R pacemakers due to symptomatic sinus bradycardia. They had no or only mild structural heart disease and their standard 12-lead ECGs were classified as nor-mal or with only minor changes. The first series of patients who were enrolled are referred to as the “long-term” (LT) patients. This series consisted of 14 patients (8 women, mean age 71 ± 13 years, range 41-84 years), who were followed weekly for 5-8 weeks after pacemaker implantation. Since cardiac memory
development turned out to be much faster than anticipated, a second series of patients was in-cluded. These “short-term” (ST) patients were followed daily during the first week after pace-maker implantation and the series consisted of 6 patients (4 men, mean age 58 ± 18 years, range 27-79 years). Baseline characteristics for the study patients are presented in Table 1 and detailed data on the actual pacemaker program-ming can be found in Appendix 1.A control group of 10 healthy individuals (5 women), mean age 41 ± 7 years (range 28-51), was included to assess the time-dependent variability in T-vector angles. In this group, VCGs were recorded twice with one week’s interval.
ProtocolsWithin 24 hours prior to pacemaker implanta-tion, a 12-lead ECG and a VCG were recorded during sinus rhythm. All patients received a DDD-R pacemaker connected to leads in the right atrium and the right ventricular apex. With-in 4 hours after the implantation, the pacemaker was programmed to DDD or DDD-R mode with a short AV delay to ascertain maximum ventricular stimulation. The patients were seen the day after pacemaker implantation and then weekly for 5-8 weeks (LT patients) or daily for one week (ST patients). At each visit, the pace-maker was temporarily programmed to AAI mode to re-establish normal ventricular activa-tion. An ECG and VCG were recorded and the pacemaker log was reviewed for the percentage of ventricular paced cardiac cycles since the last follow-up. This first phase of the protocol provided information about the development of pacing-induced cardiac memory. During the second phase, the pacemaker was programmed to an AV delay optimized for each individual patient to reduce the amount of ventricular pac-ing. To obtain information on cardiac memory dissipation, the LT patients were then seen once more after 4-5 weeks. The same procedure as
Cardiac memory 25
during the first part of the protocol was used, with ECG and VCG recordings performed dur-ing AAI pacing.
Analyses in Study IThe ECGs were analyzed qualitatively to define the presence or absence of cardiac memory (T-wave inversions).The VCGs were analyzed quantitatively (maxi-mum T-vector azimuth and elevation) to define the temporal characteristics of cardiac memory development and dissipation.
Analyses in Study IIThe ECGs were analyzed quantitatively during normal activation and during ventricular pacing and the QRS, QT, QTc, JT and JTc intervals were assessed, together with QT and JT dispersion.The VCGs were further analyzed quantitatively
adding the parameter maximum T-vector am-plitude and the T-vector loop morphology pa-rameters Tavplan, Tegenv and Tarea.
Study IIIThe effect of ventricular pacing on repolariza-tion and cardiac memory in HOCM patients was compared with the effects in patients with-out HOCM.
PatientsThe HOCM group consisted of 15 patients (9 men) with a mean age of 66 ± 11 years (range 48-89 years). They were accepted for pacemaker therapy designed to reduce the left ventricular outflow tract obstruction because of significant symptoms despite optimal pharmacological treatment. For a comparison of ECG parameters
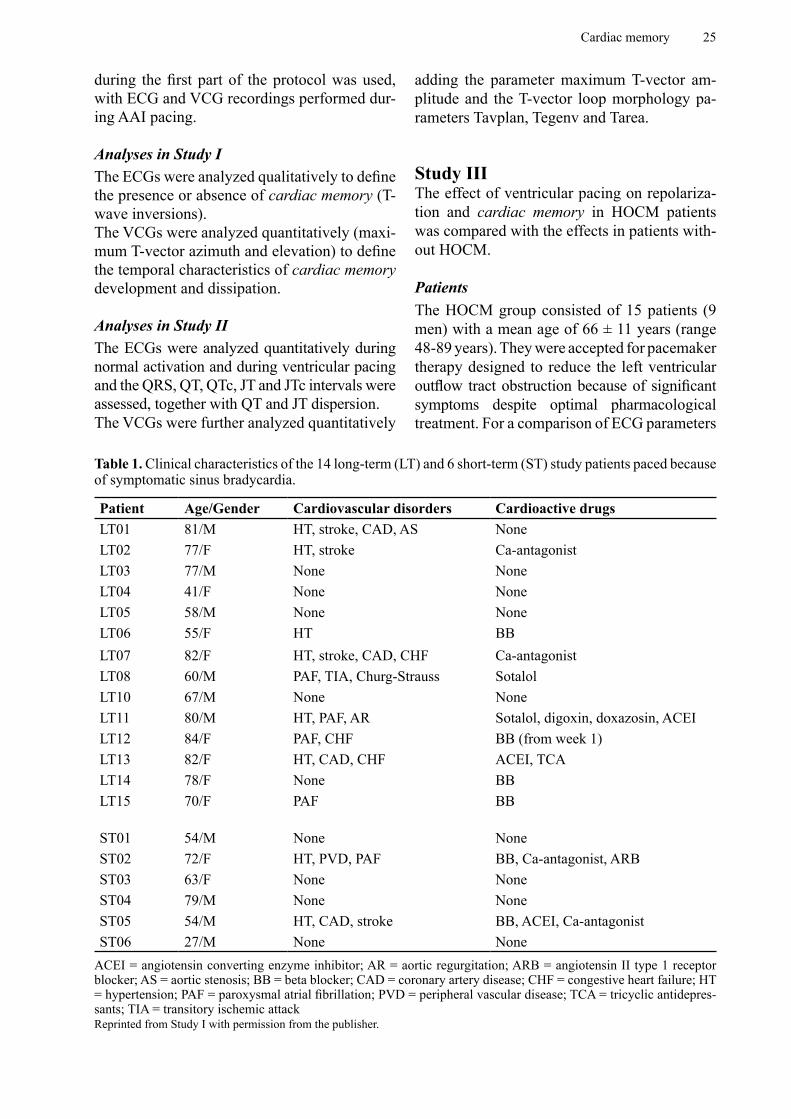
Table 1. Clinical characteristics of the 14 long-term (LT) and 6 short-term (ST) study patients paced because of symptomatic sinus bradycardia.
Patient Age/Gender Cardiovascular disorders Cardioactive drugsLT01 81/M HT, stroke, CAD, AS NoneLT02 77/F HT, stroke Ca-antagonistLT03 77/M None NoneLT04 41/F None NoneLT05 58/M None NoneLT06 55/F HT BBLT07 82/F HT, stroke, CAD, CHF Ca-antagonistLT08 60/M PAF, TIA, Churg-Strauss SotalolLT10 67/M None NoneLT11 80/M HT, PAF, AR Sotalol, digoxin, doxazosin, ACEILT12 84/F PAF, CHF BB (from week 1)LT13 82/F HT, CAD, CHF ACEI, TCALT14 78/F None BBLT15 70/F PAF BB
ST01 54/M None NoneST02 72/F HT, PVD, PAF BB, Ca-antagonist, ARBST03 63/F None NoneST04 79/M None NoneST05 54/M HT, CAD, stroke BB, ACEI, Ca-antagonistST06 27/M None None
ACEI = angiotensin converting enzyme inhibitor; AR = aortic regurgitation; ARB = angiotensin II type 1 receptor blocker; AS = aortic stenosis; BB = beta blocker; CAD = coronary artery disease; CHF = congestive heart failure; HT = hypertension; PAF = paroxysmal atrial fibrillation; PVD = peripheral vascular disease; TCA = tricyclic antidepres-sants; TIA = transitory ischemic attackReprinted from Study I with permission from the publisher.
26 Liliane Wecke
recorded during ventricular pacing and post-pacing sinus rhythm (after abruptly stopping pacing), 30 more HOCM patients were added. They had received their pacemaker systems before the present study was started and were not studied at baseline.The control group was identical with the 14 LT patients from Studies I and II (see above).
ProtocolBefore pacemaker implantation, a standard 12-lead ECG was recorded in both groups. All patients received a DDD/DDD-R pacemaker connected to leads in the right atrium and right ventricular apex. Within one day after implan-tation, the pacemakers were programmed to a short AV delay to achieve maximum ventricular preexcitation.The HOCM group (n=15) was then evaluated after ≥ 3 months of DDD pacing. An ECG was first recorded during DDD pacing and then dur-ing sinus rhythm after pacing was temporarily switched off.The control group (n=14) was evaluated as de-scribed above.
AnalysesThe ECGs were analyzed qualitatively as well as quantitatively. Cardiac memory was defined as the presence of negative T waves in the infe-rior leads (II, aVF, III) during normal AV con-duction (sinus rhythm or AAI pacing) tracking the vector of the previously paced QRS com-plex. The ECG parameters RR, QRS, QT, QTc, JT and JTc intervals were assessed, as well as QT, QTc, JT and JTc dispersion.For the HOCM group (n=15), as well as for the extended HOCM group (n=45), ECG record-ings during ventricular pacing after the de-velopment of cardiac memory were analyzed quantitatively and compared with the post-pac-ing sinus rhythm.
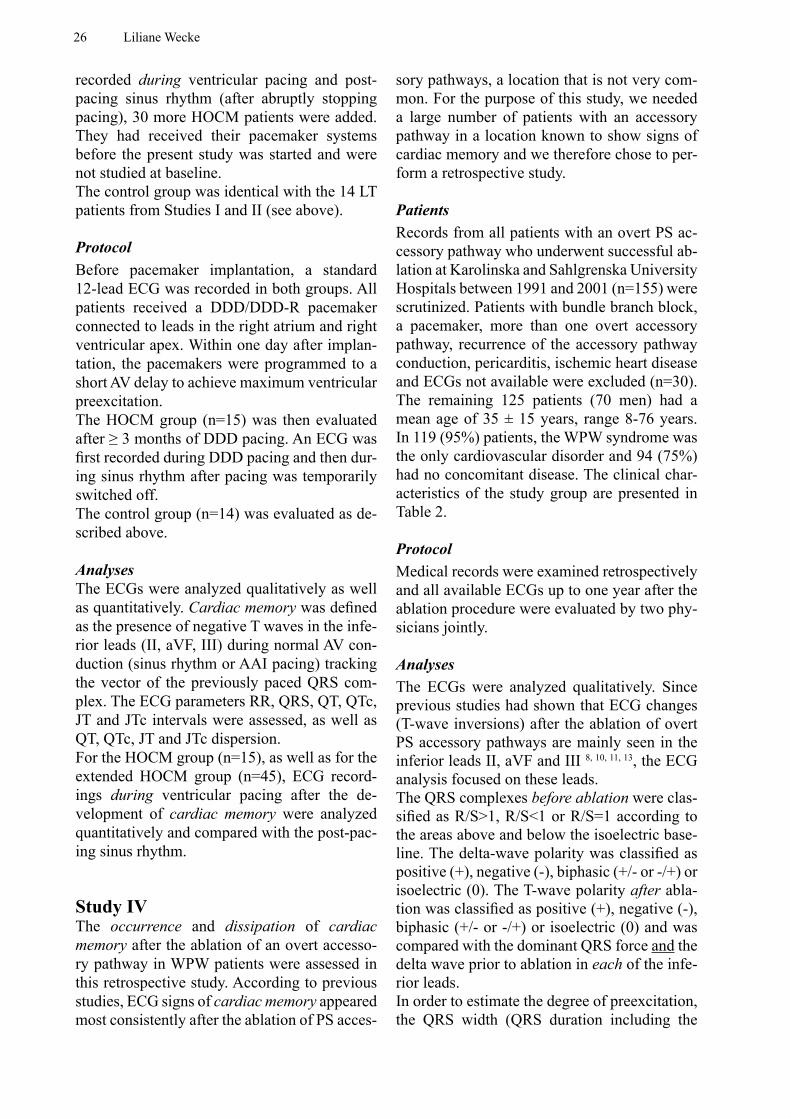
Study IVThe occurrence and dissipation of cardiac memory after the ablation of an overt accesso-ry pathway in WPW patients were assessed in this retrospective study. According to previous studies, ECG signs of cardiac memory appeared most consistently after the ablation of PS acces-
sory pathways, a location that is not very com-mon. For the purpose of this study, we needed a large number of patients with an accessory pathway in a location known to show signs of cardiac memory and we therefore chose to per-form a retrospective study.
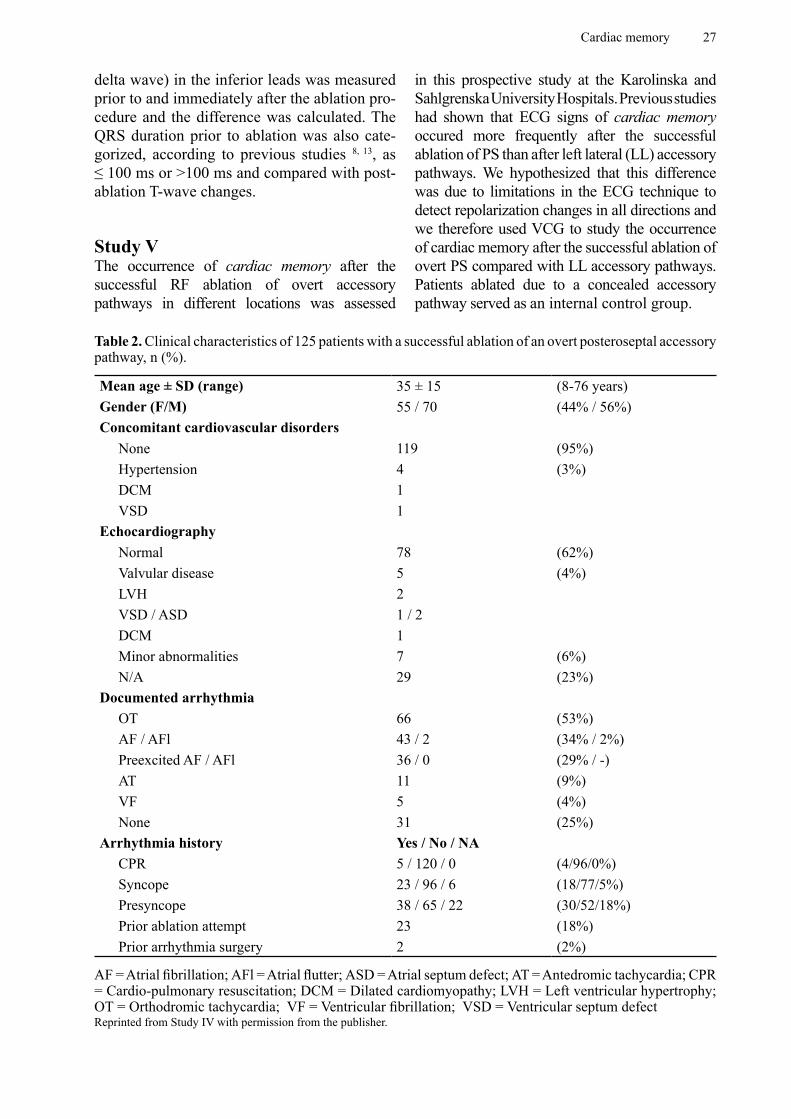
PatientsRecords from all patients with an overt PS ac-cessory pathway who underwent successful ab-lation at Karolinska and Sahlgrenska University Hospitals between 1991 and 2001 (n=155) were scrutinized. Patients with bundle branch block, a pacemaker, more than one overt accessory pathway, recurrence of the accessory pathway conduction, pericarditis, ischemic heart disease and ECGs not available were excluded (n=30). The remaining 125 patients (70 men) had a mean age of 35 ± 15 years, range 8-76 years. In 119 (95%) patients, the WPW syndrome was the only cardiovascular disorder and 94 (75%) had no concomitant disease. The clinical char-acteristics of the study group are presented in Table 2.
ProtocolMedical records were examined retrospectively and all available ECGs up to one year after the ablation procedure were evaluated by two phy-sicians jointly.
AnalysesThe ECGs were analyzed qualitatively. Since previous studies had shown that ECG changes (T-wave inversions) after the ablation of overt PS accessory pathways are mainly seen in the inferior leads II, aVF and III 8, 10, 11, 13, the ECG analysis focused on these leads. The QRS complexes before ablation were clas-sified as R/S>1, R/S<1 or R/S=1 according to the areas above and below the isoelectric base-line. The delta-wave polarity was classified as positive (+), negative (-), biphasic (+/- or -/+) or isoelectric (0). The T-wave polarity after abla-tion was classified as positive (+), negative (-), biphasic (+/- or -/+) or isoelectric (0) and was compared with the dominant QRS force and the delta wave prior to ablation in each of the infe-rior leads.In order to estimate the degree of preexcitation, the QRS width (QRS duration including the
Cardiac memory 27
delta wave) in the inferior leads was measured prior to and immediately after the ablation pro-cedure and the difference was calculated. The QRS duration prior to ablation was also cate-gorized, according to previous studies 8, 13, as ≤ 100 ms or >100 ms and compared with post-ablation T-wave changes.
Study VThe occurrence of cardiac memory after the successful RF ablation of overt accessory pathways in different locations was assessed
in this prospective study at the Karolinska and Sahlgrenska University Hospitals. Previous studies had shown that ECG signs of cardiac memory occured more frequently after the successful ablation of PS than after left lateral (LL) accessory pathways. We hypothesized that this difference was due to limitations in the ECG technique to detect repolarization changes in all directions and we therefore used VCG to study the occurrence of cardiac memory after the successful ablation of overt PS compared with LL accessory pathways. Patients ablated due to a concealed accessory pathway served as an internal control group.
Table 2. Clinical characteristics of 125 patients with a successful ablation of an overt posteroseptal accessory pathway, n (%).
Mean age ± SD (range) 35 ± 15 (8-76 years)Gender (F/M) 55 / 70 (44% / 56%)Concomitant cardiovascular disorders
None 119 (95%)Hypertension 4 (3%)DCM 1VSD 1
EchocardiographyNormal 78 (62%)Valvular disease 5 (4%)LVH 2VSD / ASD 1 / 2DCM 1Minor abnormalities 7 (6%)N/A 29 (23%)
Documented arrhythmia OT 66 (53%)AF / AFl 43 / 2 (34% / 2%)Preexcited AF / AFl 36 / 0 (29% / -)AT 11 (9%)VF 5 (4%)None 31 (25%)
Arrhythmia history Yes / No / NACPR 5 / 120 / 0 (4/96/0%)Syncope 23 / 96 / 6 (18/77/5%)Presyncope 38 / 65 / 22 (30/52/18%)Prior ablation attempt 23 (18%)Prior arrhythmia surgery 2 (2%)
AF = Atrial fibrillation; AFl = Atrial flutter; ASD = Atrial septum defect; AT = Antedromic tachycardia; CPR = Cardio-pulmonary resuscitation; DCM = Dilated cardiomyopathy; LVH = Left ventricular hypertrophy; OT = Orthodromic tachycardia; VF = Ventricular fibrillation; VSD = Ventricular septum defectReprinted from Study IV with permission from the publisher.
28 Liliane Wecke
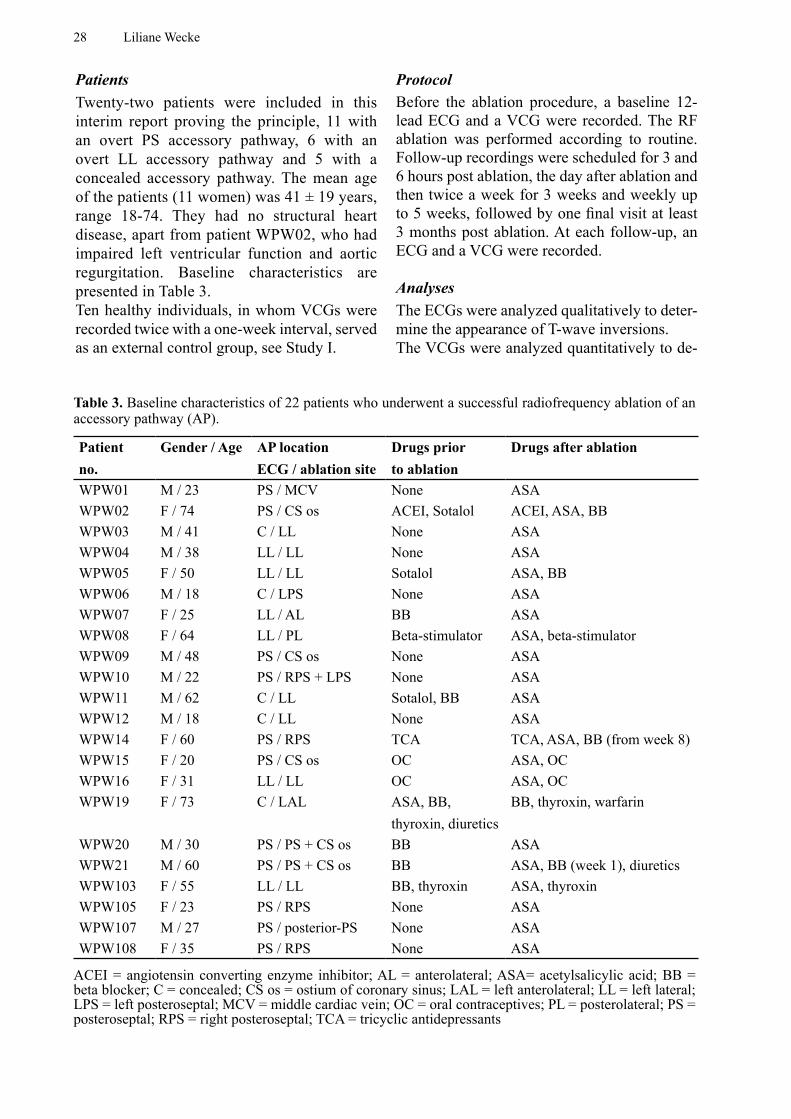
PatientsTwenty-two patients were included in this interim report proving the principle, 11 with an overt PS accessory pathway, 6 with an overt LL accessory pathway and 5 with a concealed accessory pathway. The mean age of the patients (11 women) was 41 ± 19 years, range 18-74. They had no structural heart disease, apart from patient WPW02, who had impaired left ventricular function and aortic regurgitation. Baseline characteristics are presented in Table 3.Ten healthy individuals, in whom VCGs were recorded twice with a one-week interval, served as an external control group, see Study I.
ProtocolBefore the ablation procedure, a baseline 12-lead ECG and a VCG were recorded. The RF ablation was performed according to routine. Follow-up recordings were scheduled for 3 and 6 hours post ablation, the day after ablation and then twice a week for 3 weeks and weekly up to 5 weeks, followed by one final visit at least 3 months post ablation. At each follow-up, an ECG and a VCG were recorded.
AnalysesThe ECGs were analyzed qualitatively to deter-mine the appearance of T-wave inversions. The VCGs were analyzed quantitatively to de-
Table 3. Baseline characteristics of 22 patients who underwent a successful radiofrequency ablation of an accessory pathway (AP).
Patient no.
Gender / Age AP location ECG / ablation site
Drugs prior to ablation
Drugs after ablation
WPW01 M / 23 PS / MCV None ASAWPW02 F / 74 PS / CS os ACEI, Sotalol ACEI, ASA, BBWPW03 M / 41 C / LL None ASAWPW04 M / 38 LL / LL None ASAWPW05 F / 50 LL / LL Sotalol ASA, BBWPW06 M / 18 C / LPS None ASAWPW07 F / 25 LL / AL BB ASAWPW08 F / 64 LL / PL Beta-stimulator ASA, beta-stimulatorWPW09 M / 48 PS / CS os None ASAWPW10 M / 22 PS / RPS + LPS None ASAWPW11 M / 62 C / LL Sotalol, BB ASAWPW12 M / 18 C / LL None ASAWPW14 F / 60 PS / RPS TCA TCA, ASA, BB (from week 8)WPW15 F / 20 PS / CS os OC ASA, OCWPW16 F / 31 LL / LL OC ASA, OCWPW19 F / 73 C / LAL ASA, BB,
thyroxin, diureticsBB, thyroxin, warfarin
WPW20 M / 30 PS / PS + CS os BB ASAWPW21 M / 60 PS / PS + CS os BB ASA, BB (week 1), diureticsWPW103 F / 55 LL / LL BB, thyroxin ASA, thyroxinWPW105 F / 23 PS / RPS None ASAWPW107 M / 27 PS / posterior-PS None ASAWPW108 F / 35 PS / RPS None ASA
ACEI = angiotensin converting enzyme inhibitor; AL = anterolateral; ASA= acetylsalicylic acid; BB = beta blocker; C = concealed; CS os = ostium of coronary sinus; LAL = left anterolateral; LL = left lateral; LPS = left posteroseptal; MCV = middle cardiac vein; OC = oral contraceptives; PL = posterolateral; PS = posteroseptal; RPS = right posteroseptal; TCA = tricyclic antidepressants
Cardiac memory 29
termine the maximum T-vector amplitude, azi-muth and elevation. The VCG parameters from the first day after ablation were compared with the values 1-2 weeks later for each of the 3 groups (PS, LL and concealed accessory path-ways). Each parameter was also compared be-tween groups and with the external controls.
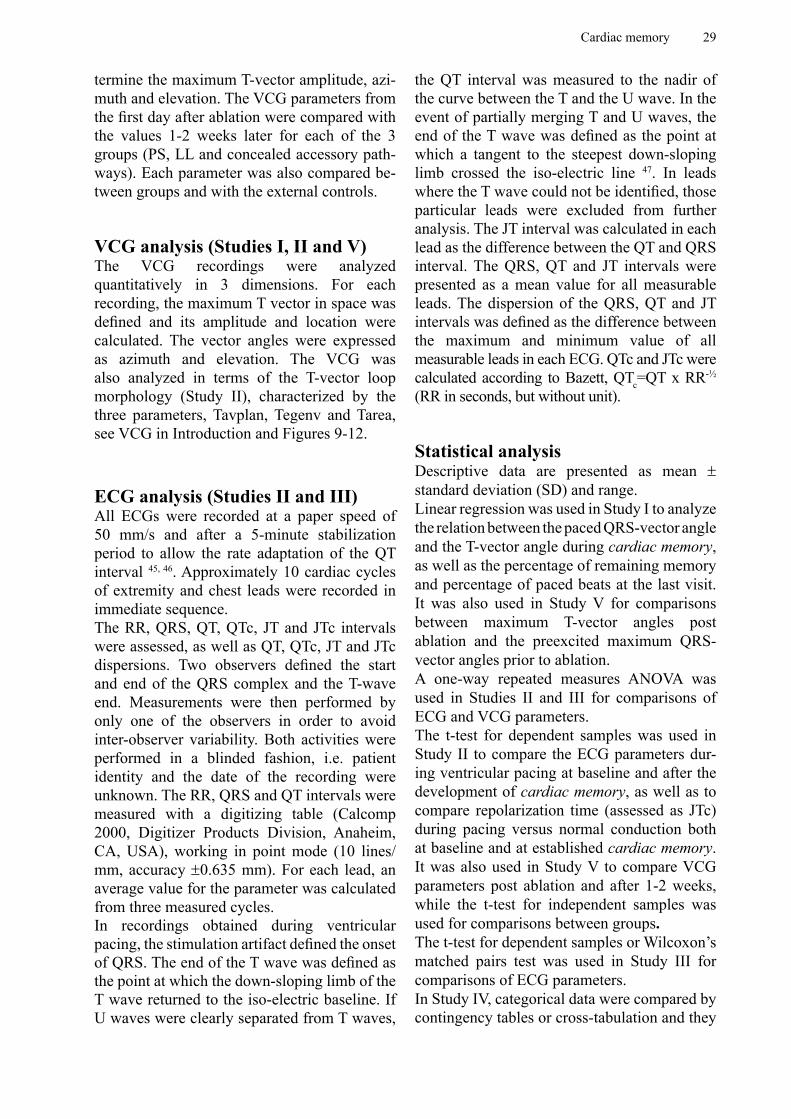
VCG analysis (Studies I, II and V)The VCG recordings were analyzed quantitatively in 3 dimensions. For each recording, the maximum T vector in space was defined and its amplitude and location were calculated. The vector angles were expressed as azimuth and elevation. The VCG was also analyzed in terms of the T-vector loop morphology (Study II), characterized by the three parameters, Tavplan, Tegenv and Tarea, see VCG in Introduction and Figures 9-12.
ECG analysis (Studies II and III)All ECGs were recorded at a paper speed of 50 mm/s and after a 5-minute stabilization period to allow the rate adaptation of the QT interval 45, 46. Approximately 10 cardiac cycles of extremity and chest leads were recorded in immediate sequence.The RR, QRS, QT, QTc, JT and JTc intervals were assessed, as well as QT, QTc, JT and JTc dispersions. Two observers defined the start and end of the QRS complex and the T-wave end. Measurements were then performed by only one of the observers in order to avoid inter-observer variability. Both activities were performed in a blinded fashion, i.e. patient identity and the date of the recording were unknown. The RR, QRS and QT intervals were measured with a digitizing table (Calcomp 2000, Digitizer Products Division, Anaheim, CA, USA), working in point mode (10 lines/mm, accuracy ±0.635 mm). For each lead, an average value for the parameter was calculated from three measured cycles.In recordings obtained during ventricular pacing, the stimulation artifact defined the onset of QRS. The end of the T wave was defined as the point at which the down-sloping limb of the T wave returned to the iso-electric baseline. If U waves were clearly separated from T waves,
the QT interval was measured to the nadir of the curve between the T and the U wave. In the event of partially merging T and U waves, the end of the T wave was defined as the point at which a tangent to the steepest down-sloping limb crossed the iso-electric line 47. In leads where the T wave could not be identified, those particular leads were excluded from further analysis. The JT interval was calculated in each lead as the difference between the QT and QRS interval. The QRS, QT and JT intervals were presented as a mean value for all measurable leads. The dispersion of the QRS, QT and JT intervals was defined as the difference between the maximum and minimum value of all measurable leads in each ECG. QTc and JTc were calculated according to Bazett, QTc=QT x RR-½ (RR in seconds, but without unit).
Statistical analysis Descriptive data are presented as mean ± standard deviation (SD) and range. Linear regression was used in Study I to analyze the relation between the paced QRS-vector angle and the T-vector angle during cardiac memory, as well as the percentage of remaining memory and percentage of paced beats at the last visit. It was also used in Study V for comparisons between maximum T-vector angles post ablation and the preexcited maximum QRS-vector angles prior to ablation.A one-way repeated measures ANOVA was used in Studies II and III for comparisons of ECG and VCG parameters.The t-test for dependent samples was used in Study II to compare the ECG parameters dur-ing ventricular pacing at baseline and after the development of cardiac memory, as well as to compare repolarization time (assessed as JTc) during pacing versus normal conduction both at baseline and at established cardiac memory. It was also used in Study V to compare VCG parameters post ablation and after 1-2 weeks, while the t-test for independent samples was used for comparisons between groups.The t-test for dependent samples or Wilcoxon’s matched pairs test was used in Study III for comparisons of ECG parameters.In Study IV, categorical data were compared by contingency tables or cross-tabulation and they

30 Liliane Wecke
were statistically evaluated using the Chi-square test, Fisher’s exact test or the Wilcoxon-Mann-Whitney test. The 95% confidence interval was calculated and presented when appropriate.A p-value of <0.05 was considered statistically significant.For details, see Paper I-V.
Cardiac memory 31
RESULTS
Time-dependent variations (Studies I, II and V)The time-dependent variations in repeated VCG recordings were assessed by analyzing the azi-muth and elevation of the maximum QRS vec-tor during normal conduction (AAI pacing) in the LT patients at each follow-up visit. The as-sumption was that the QRS vector would only be minimally affected by periods of ventricular pacing. The mean values for the variations in the QRS vectors compared with baseline were 10 ± 4 º for azimuth and 5 ± 2 º for elevation. The time-dependent variations in the maximum T-vector azimuth and elevation were assessed in a group of 10 healthy individuals, in whom VCG was recorded twice with a one-week interval. The mean value for maximum T-vector azimuth was 37 ± 11 º (range 7-54 º) and 62 ± 11 º (range
37-76 º) for T-vector elevation. The variations between the two recordings were 7 ± 5 º for azi-muth and 4 ± 3 º for elevation.
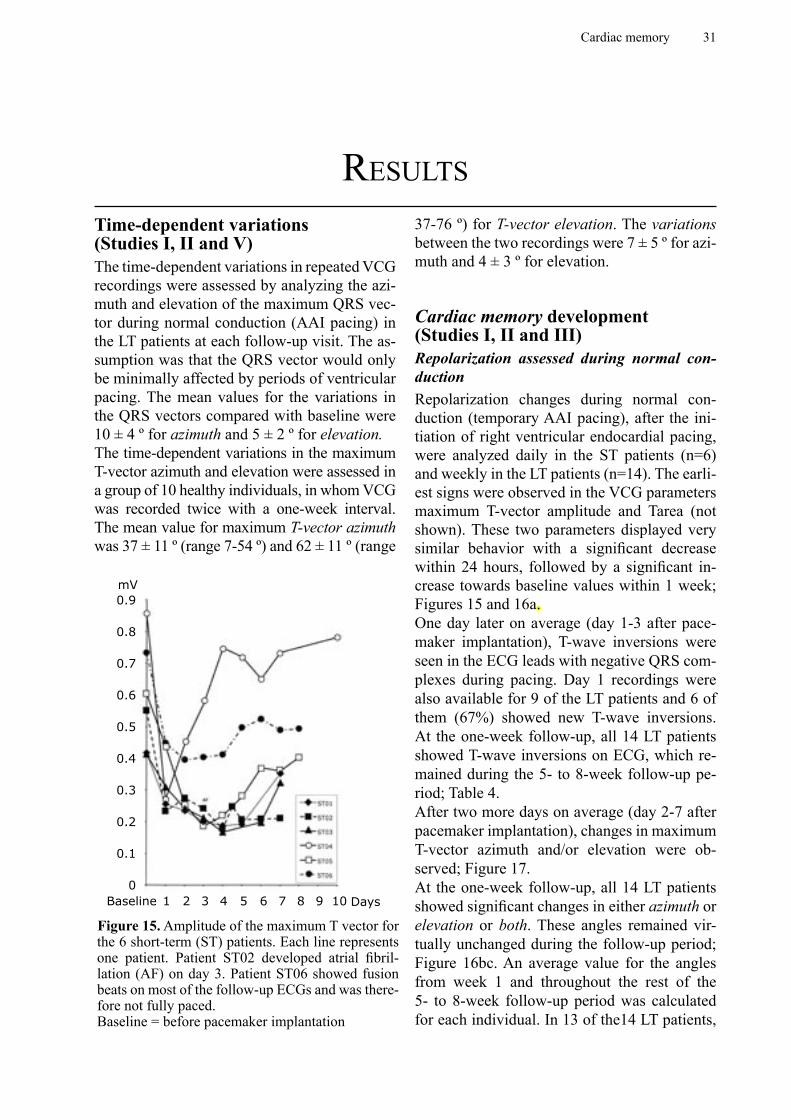
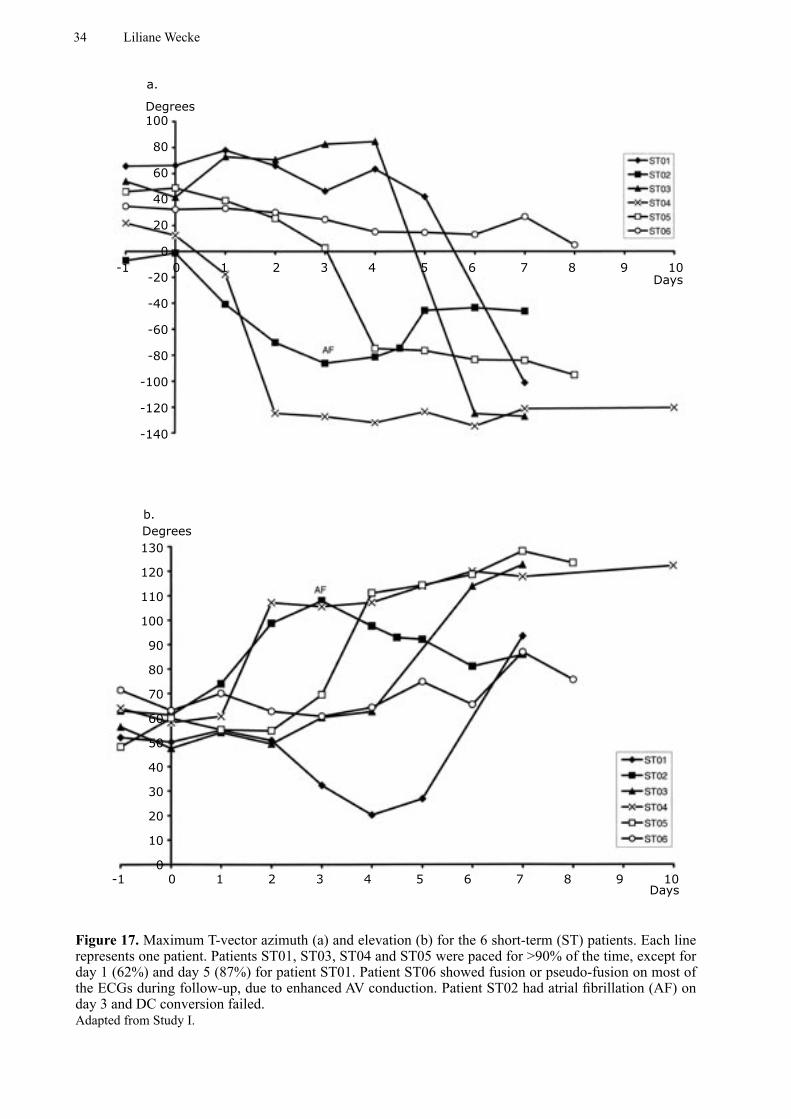
Cardiac memory development (Studies I, II and III)Repolarization assessed during normal con-ductionRepolarization changes during normal con-duction (temporary AAI pacing), after the ini-tiation of right ventricular endocardial pacing, were analyzed daily in the ST patients (n=6) and weekly in the LT patients (n=14). The earli-est signs were observed in the VCG parameters maximum T-vector amplitude and Tarea (not shown). These two parameters displayed very similar behavior with a significant decrease within 24 hours, followed by a significant in-crease towards baseline values within 1 week; Figures 15 and 16a.One day later on average (day 1-3 after pace-maker implantation), T-wave inversions were seen in the ECG leads with negative QRS com-plexes during pacing. Day 1 recordings were also available for 9 of the LT patients and 6 of them (67%) showed new T-wave inversions. At the one-week follow-up, all 14 LT patients showed T-wave inversions on ECG, which re-mained during the 5- to 8-week follow-up pe-riod; Table 4.After two more days on average (day 2-7 after pacemaker implantation), changes in maximum T-vector azimuth and/or elevation were ob-served; Figure 17.At the one-week follow-up, all 14 LT patients showed significant changes in either azimuth or elevation or both. These angles remained vir-tually unchanged during the follow-up period; Figure 16bc. An average value for the angles from week 1 and throughout the rest of the 5- to 8-week follow-up period was calculated for each individual. In 13 of the14 LT patients,
Figure 15. Amplitude of the maximum T vector for the 6 short-term (ST) patients. Each line represents one patient. Patient ST02 developed atrial fibril-lation (AF) on day 3. Patient ST06 showed fusion beats on most of the follow-up ECGs and was there-fore not fully paced. Baseline = before pacemaker implantation
0.9
0.8
0.7
0.6
0.5
0.4
0.3
0.2
0.1
0Baseline 1 2 3 4 5 6 7 8 9 10 Days
mV

32 Liliane Wecke
a. Amplitude
b. Azimuth
110
100
90
80
70
60
50
40
30
20
10
0
%
Baseline 5 10 15 20 25 30 35 40 45 50 55 60Days
NS NS NS NS NS NSp<0.001
p<0.0001
100
80
60
40
20
0
-20
-40
-60
-80
-100
-120
-140
%
Baseline 5 10 15 20 25 30 35 40 45 50 55 60Days
B d1 w1 w2 w3 w4 w5 w6 w7
p<0.01p<0.0001 NS NS NS NS NS NS
B d1 w1 w2 w3 w4 w5 w6 w7
Cardiac memory 33
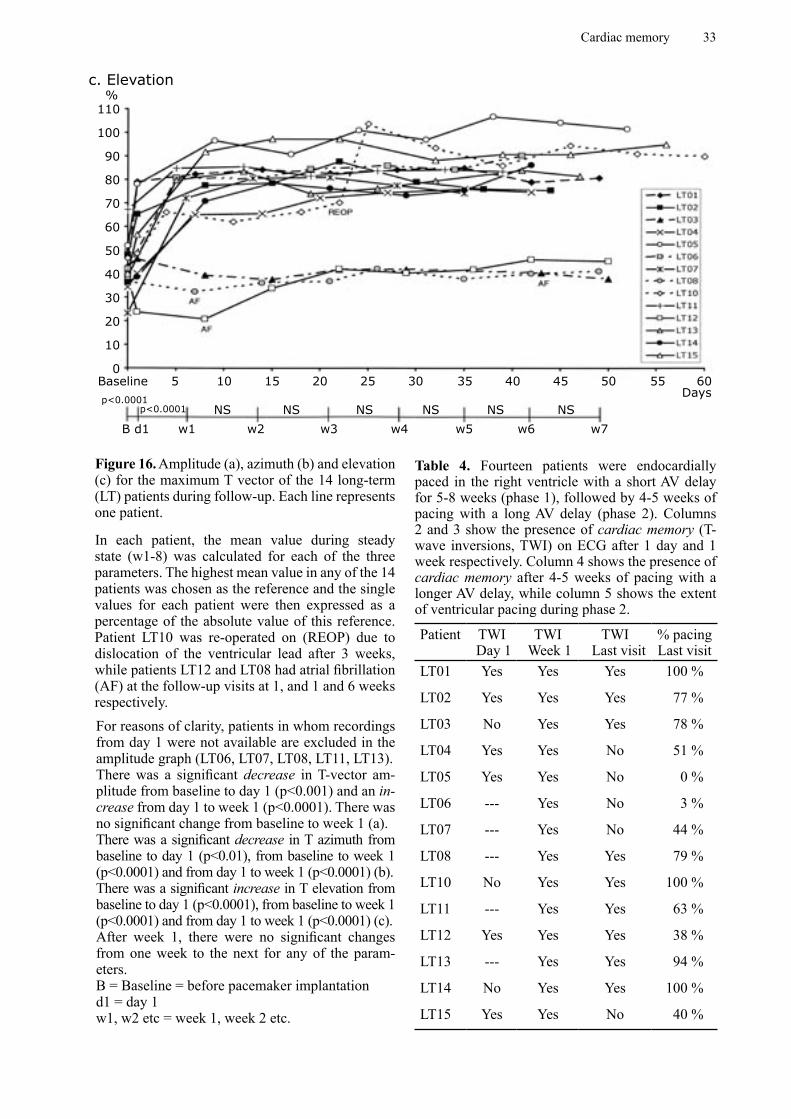
Figure 16. Amplitude (a), azimuth (b) and elevation (c) for the maximum T vector of the 14 long-term (LT) patients during follow-up. Each line represents one patient.
In each patient, the mean value during steady state (w1-8) was calculated for each of the three parameters. The highest mean value in any of the 14 patients was chosen as the reference and the single values for each patient were then expressed as a percentage of the absolute value of this reference. Patient LT10 was re-operated on (REOP) due to dislocation of the ventricular lead after 3 weeks, while patients LT12 and LT08 had atrial fibrillation (AF) at the follow-up visits at 1, and 1 and 6 weeks respectively.For reasons of clarity, patients in whom recordings from day 1 were not available are excluded in the amplitude graph (LT06, LT07, LT08, LT11, LT13). There was a significant decrease in T-vector am-plitude from baseline to day 1 (p<0.001) and an in-crease from day 1 to week 1 (p<0.0001). There was no significant change from baseline to week 1 (a).There was a significant decrease in T azimuth from baseline to day 1 (p<0.01), from baseline to week 1 (p<0.0001) and from day 1 to week 1 (p<0.0001) (b).There was a significant increase in T elevation from baseline to day 1 (p<0.0001), from baseline to week 1 (p<0.0001) and from day 1 to week 1 (p<0.0001) (c).After week 1, there were no significant changes from one week to the next for any of the param-eters.B = Baseline = before pacemaker implantationd1 = day 1w1, w2 etc = week 1, week 2 etc.
c. Elevation
110
100
90
80
70
60
50
40
30
20
10
0
%
Baseline 5 10 15 20 25 30 35 40 45 50 55 60Days
p<0.0001p<0.0001
B d1 w1 w2 w3 w4 w5 w6 w7
NS NS NS NS NS NS
Table 4. Fourteen patients were endocardially paced in the right ventricle with a short AV delay for 5-8 weeks (phase 1), followed by 4-5 weeks of pacing with a long AV delay (phase 2). Columns 2 and 3 show the presence of cardiac memory (T-wave inversions, TWI) on ECG after 1 day and 1 week respectively. Column 4 shows the presence of cardiac memory after 4-5 weeks of pacing with a longer AV delay, while column 5 shows the extent of ventricular pacing during phase 2.
Patient TWI Day 1
TWI Week 1
TWI Last visit
% pacing Last visit
LT01 Yes Yes Yes 100 %
LT02 Yes Yes Yes 77 %
LT03 No Yes Yes 78 %
LT04 Yes Yes No 51 %
LT05 Yes Yes No 0 %
LT06 --- Yes No 3 %
LT07 --- Yes No 44 %
LT08 --- Yes Yes 79 %
LT10 No Yes Yes 100 %
LT11 --- Yes Yes 63 %
LT12 Yes Yes Yes 38 %
LT13 --- Yes Yes 94 %
LT14 No Yes Yes 100 %
LT15 Yes Yes No 40 %
34 Liliane Wecke
100
80
60
40
20
0
-20
-40
-60
-80
-100
-120
-140
-1 0 1 2 3 4 5 6 7 8 9 10Days
Degrees
a.
Degreesb.
130
120
110
100
90
80
70
60
50
40
30
20
10
0-1 0 1 2 3 4 5 6 7 8 9 10
Days
Figure 17. Maximum T-vector azimuth (a) and elevation (b) for the 6 short-term (ST) patients. Each line represents one patient. Patients ST01, ST03, ST04 and ST05 were paced for >90% of the time, except for day 1 (62%) and day 5 (87%) for patient ST01. Patient ST06 showed fusion or pseudo-fusion on most of the ECGs during follow-up, due to enhanced AV conduction. Patient ST02 had atrial fibrillation (AF) on day 3 and DC conversion failed.Adapted from Study I.
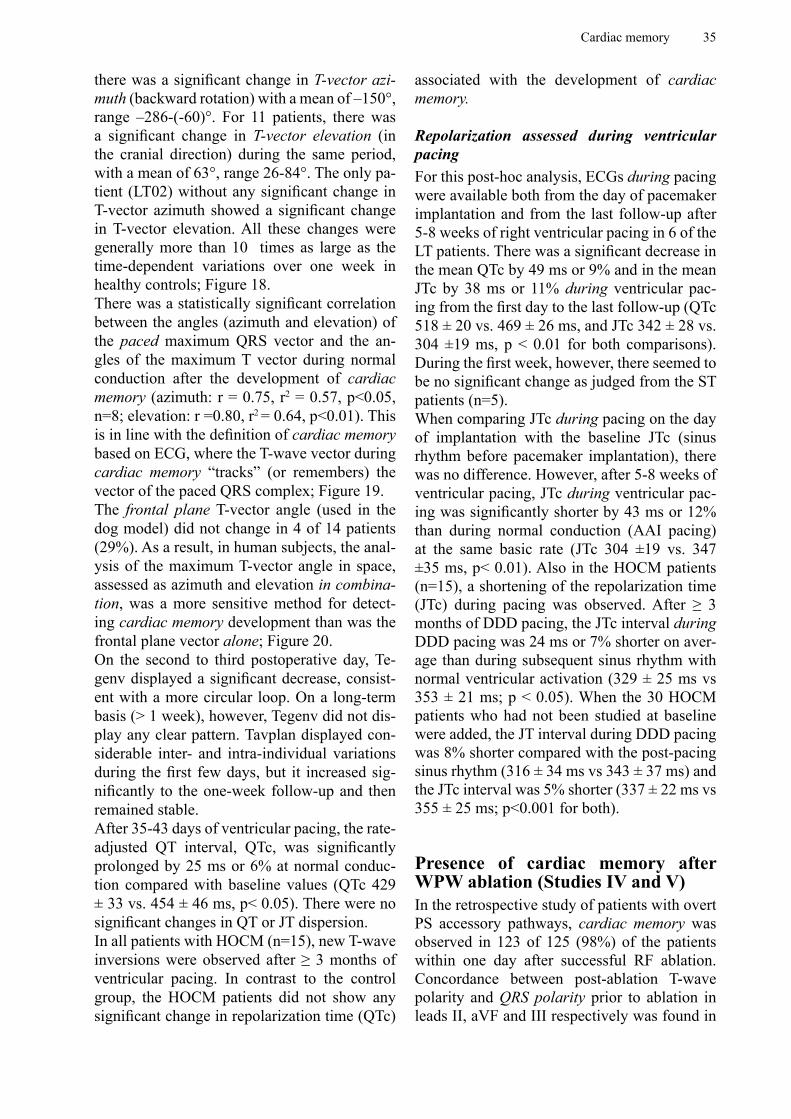
Cardiac memory 35
there was a significant change in T-vector azi-muth (backward rotation) with a mean of –150°, range –286-(-60)°. For 11 patients, there was a significant change in T-vector elevation (in the cranial direction) during the same period, with a mean of 63°, range 26-84°. The only pa-tient (LT02) without any significant change in T-vector azimuth showed a significant change in T-vector elevation. All these changes were generally more than 10 times as large as the time-dependent variations over one week in healthy controls; Figure 18.There was a statistically significant correlation between the angles (azimuth and elevation) of the paced maximum QRS vector and the an-gles of the maximum T vector during normal conduction after the development of cardiac memory (azimuth: r = 0.75, r2 = 0.57, p<0.05, n=8; elevation: r =0.80, r2 = 0.64, p<0.01). This is in line with the definition of cardiac memory based on ECG, where the T-wave vector during cardiac memory “tracks” (or remembers) the vector of the paced QRS complex; Figure 19.The frontal plane T-vector angle (used in the dog model) did not change in 4 of 14 patients (29%). As a result, in human subjects, the anal-ysis of the maximum T-vector angle in space, assessed as azimuth and elevation in combina-tion, was a more sensitive method for detect-ing cardiac memory development than was the frontal plane vector alone; Figure 20.On the second to third postoperative day, Te-genv displayed a significant decrease, consist-ent with a more circular loop. On a long-term basis (> 1 week), however, Tegenv did not dis-play any clear pattern. Tavplan displayed con-siderable inter- and intra-individual variations during the first few days, but it increased sig-nificantly to the one-week follow-up and then remained stable.After 35-43 days of ventricular pacing, the rate-adjusted QT interval, QTc, was significantly prolonged by 25 ms or 6% at normal conduc-tion compared with baseline values (QTc 429 ± 33 vs. 454 ± 46 ms, p< 0.05). There were no significant changes in QT or JT dispersion.In all patients with HOCM (n=15), new T-wave inversions were observed after ≥ 3 months of ventricular pacing. In contrast to the control group, the HOCM patients did not show any significant change in repolarization time (QTc)
associated with the development of cardiac memory.
Repolarization assessed during ventricular pacingFor this post-hoc analysis, ECGs during pacing were available both from the day of pacemaker implantation and from the last follow-up after 5-8 weeks of right ventricular pacing in 6 of the LT patients. There was a significant decrease in the mean QTc by 49 ms or 9% and in the mean JTc by 38 ms or 11% during ventricular pac-ing from the first day to the last follow-up (QTc 518 ± 20 vs. 469 ± 26 ms, and JTc 342 ± 28 vs. 304 ±19 ms, p < 0.01 for both comparisons). During the first week, however, there seemed to be no significant change as judged from the ST patients (n=5).When comparing JTc during pacing on the day of implantation with the baseline JTc (sinus rhythm before pacemaker implantation), there was no difference. However, after 5-8 weeks of ventricular pacing, JTc during ventricular pac-ing was significantly shorter by 43 ms or 12% than during normal conduction (AAI pacing) at the same basic rate (JTc 304 ±19 vs. 347 ±35 ms, p< 0.01). Also in the HOCM patients (n=15), a shortening of the repolarization time (JTc) during pacing was observed. After ≥ 3 months of DDD pacing, the JTc interval during DDD pacing was 24 ms or 7% shorter on aver-age than during subsequent sinus rhythm with normal ventricular activation (329 ± 25 ms vs 353 ± 21 ms; p < 0.05). When the 30 HOCM patients who had not been studied at baseline were added, the JT interval during DDD pacing was 8% shorter compared with the post-pacing sinus rhythm (316 ± 34 ms vs 343 ± 37 ms) and the JTc interval was 5% shorter (337 ± 22 ms vs 355 ± 25 ms; p<0.001 for both).
Presence of cardiac memory after WPW ablation (Studies IV and V)In the retrospective study of patients with overt PS accessory pathways, cardiac memory was observed in 123 of 125 (98%) of the patients within one day after successful RF ablation. Concordance between post-ablation T-wave polarity and QRS polarity prior to ablation in leads II, aVF and III respectively was found in
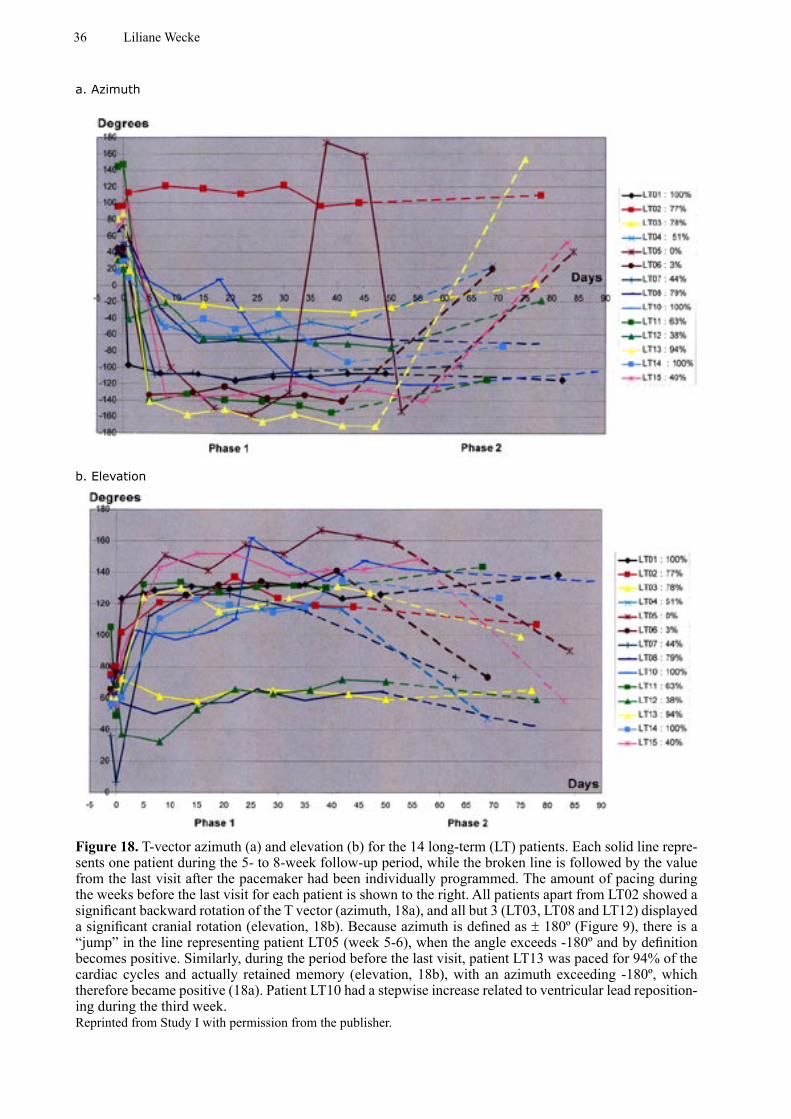
36 Liliane Wecke
Figure 18. T-vector azimuth (a) and elevation (b) for the 14 long-term (LT) patients. Each solid line repre-sents one patient during the 5- to 8-week follow-up period, while the broken line is followed by the value from the last visit after the pacemaker had been individually programmed. The amount of pacing during the weeks before the last visit for each patient is shown to the right. All patients apart from LT02 showed a significant backward rotation of the T vector (azimuth, 18a), and all but 3 (LT03, LT08 and LT12) displayed a significant cranial rotation (elevation, 18b). Because azimuth is defined as ± 180º (Figure 9), there is a “jump” in the line representing patient LT05 (week 5-6), when the angle exceeds -180º and by definition becomes positive. Similarly, during the period before the last visit, patient LT13 was paced for 94% of the cardiac cycles and actually retained memory (elevation, 18b), with an azimuth exceeding -180º, which therefore became positive (18a). Patient LT10 had a stepwise increase related to ventricular lead reposition-ing during the third week.Reprinted from Study I with permission from the publisher.
a. Azimuth
b. Elevation
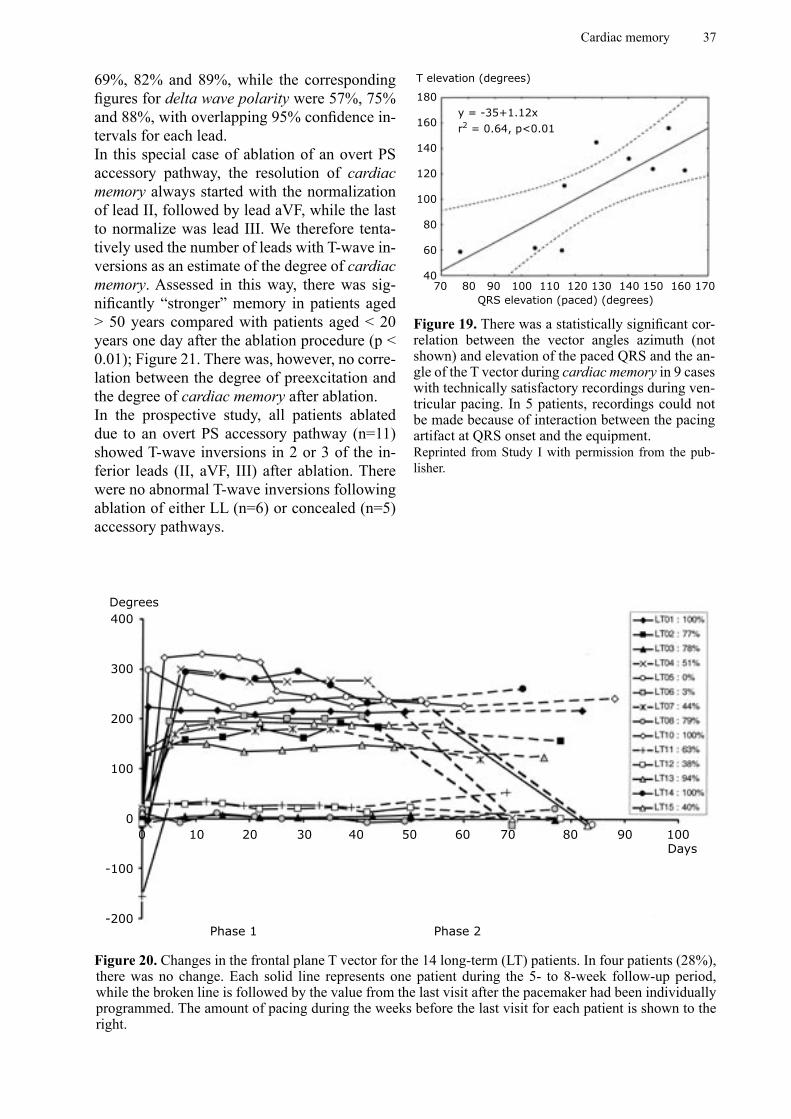
Cardiac memory 37
69%, 82% and 89%, while the corresponding figures for delta wave polarity were 57%, 75% and 88%, with overlapping 95% confidence in-tervals for each lead.In this special case of ablation of an overt PS accessory pathway, the resolution of cardiac memory always started with the normalization of lead II, followed by lead aVF, while the last to normalize was lead III. We therefore tenta-tively used the number of leads with T-wave in-versions as an estimate of the degree of cardiac memory. Assessed in this way, there was sig-nificantly “stronger” memory in patients aged > 50 years compared with patients aged < 20 years one day after the ablation procedure (p < 0.01); Figure 21. There was, however, no corre-lation between the degree of preexcitation and the degree of cardiac memory after ablation.In the prospective study, all patients ablated due to an overt PS accessory pathway (n=11) showed T-wave inversions in 2 or 3 of the in-ferior leads (II, aVF, III) after ablation. There were no abnormal T-wave inversions following ablation of either LL (n=6) or concealed (n=5) accessory pathways.
180
160
140
120
100
80
60
4070 80 90 100 110 120 130 140 150 160 170
Figure 19. There was a statistically significant cor-relation between the vector angles azimuth (not shown) and elevation of the paced QRS and the an-gle of the T vector during cardiac memory in 9 cases with technically satisfactory recordings during ven-tricular pacing. In 5 patients, recordings could not be made because of interaction between the pacing artifact at QRS onset and the equipment.Reprinted from Study I with permission from the pub-lisher.
T elevation (degrees)
QRS elevation (paced) (degrees)
y = -35+1.12xr2 = 0.64, p<0.01
400
300
200
100
0
-100
-200
0 10 20 30 40 50 60 70 80 90 100Days
Phase 1 Phase 2
Figure 20. Changes in the frontal plane T vector for the 14 long-term (LT) patients. In four patients (28%), there was no change. Each solid line represents one patient during the 5- to 8-week follow-up period, while the broken line is followed by the value from the last visit after the pacemaker had been individually programmed. The amount of pacing during the weeks before the last visit for each patient is shown to the right.
Degrees
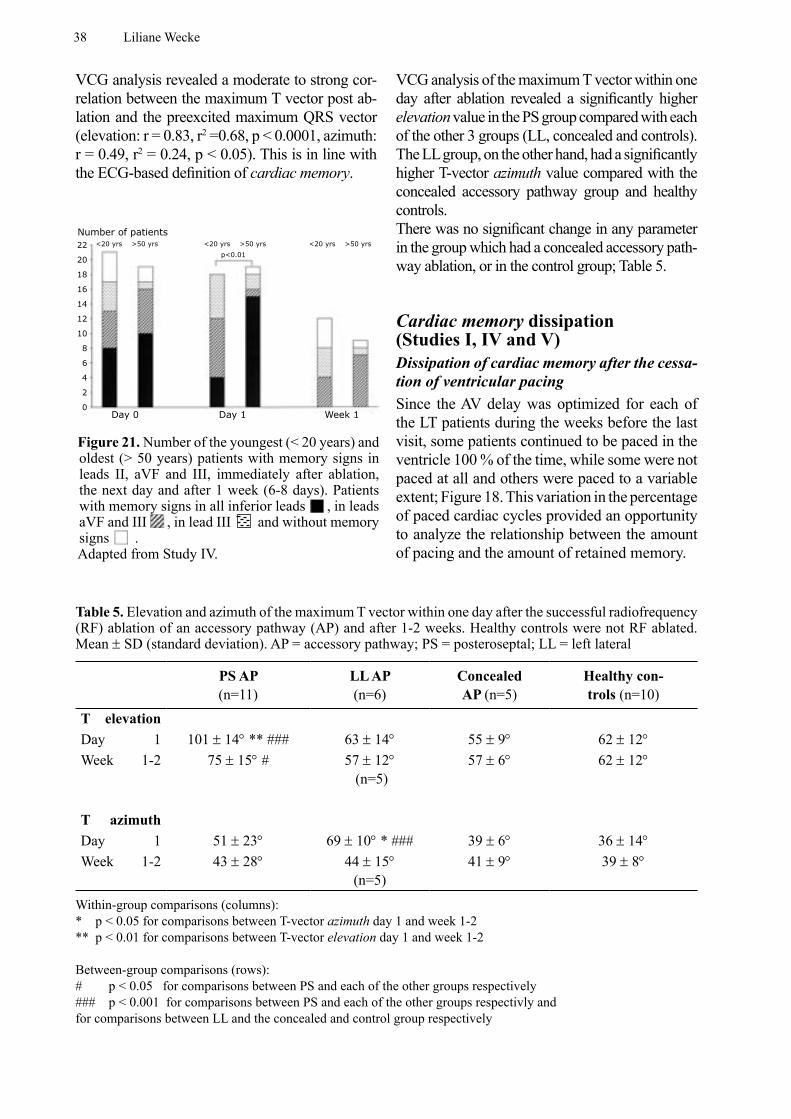
38 Liliane Wecke
VCG analysis revealed a moderate to strong cor-relation between the maximum T vector post ab-lation and the preexcited maximum QRS vector (elevation: r = 0.83, r2 =0.68, p < 0.0001, azimuth: r = 0.49, r2 = 0.24, p < 0.05). This is in line with the ECG-based definition of cardiac memory.
VCG analysis of the maximum T vector within one day after ablation revealed a significantly higher elevation value in the PS group compared with each of the other 3 groups (LL, concealed and controls). The LL group, on the other hand, had a significantly higher T-vector azimuth value compared with the concealed accessory pathway group and healthy controls.There was no significant change in any parameter in the group which had a concealed accessory path-way ablation, or in the control group; Table 5.
Cardiac memory dissipation (Studies I, IV and V)Dissipation of cardiac memory after the cessa-tion of ventricular pacingSince the AV delay was optimized for each of the LT patients during the weeks before the last visit, some patients continued to be paced in the ventricle 100 % of the time, while some were not paced at all and others were paced to a variable extent; Figure 18. This variation in the percentage of paced cardiac cycles provided an opportunity to analyze the relationship between the amount of pacing and the amount of retained memory.
22
20
18
16
14
12
10
8
6
4
2
0
Number of patients<20 yrs >50 yrs <20 yrs >50 yrs <20 yrs >50 yrs
p<0.01
Day 0 Day 1 Week 1
Figure 21. Number of the youngest (< 20 years) and oldest (> 50 years) patients with memory signs in leads II, aVF and III, immediately after ablation, the next day and after 1 week (6-8 days). Patients with memory signs in all inferior leads , in leads aVF and III , in lead III and without memory signs .Adapted from Study IV.
Table 5. Elevation and azimuth of the maximum T vector within one day after the successful radiofrequency (RF) ablation of an accessory pathway (AP) and after 1-2 weeks. Healthy controls were not RF ablated. Mean ± SD (standard deviation). AP = accessory pathway; PS = posteroseptal; LL = left lateral
PS AP (n=11)
LL AP (n=6)
Concealed AP (n=5)
Healthy con-trols (n=10)
T elevation Day 1 101 ± 14° ** ### 63 ± 14° 55 ± 9° 62 ± 12°Week 1-2 75 ± 15° # 57 ± 12°
(n=5)57 ± 6° 62 ± 12°
T azimuth Day 1 51 ± 23° 69 ± 10° * ### 39 ± 6° 36 ± 14° Week 1-2 43 ± 28° 44 ± 15°
(n=5)41 ± 9° 39 ± 8°
Within-group comparisons (columns):* p < 0.05 for comparisons between T-vector azimuth day 1 and week 1-2** p < 0.01 for comparisons between T-vector elevation day 1 and week 1-2
Between-group comparisons (rows):# p < 0.05 for comparisons between PS and each of the other groups respectively### p < 0.001 for comparisons between PS and each of the other groups respectivly and for comparisons between LL and the concealed and control group respectively
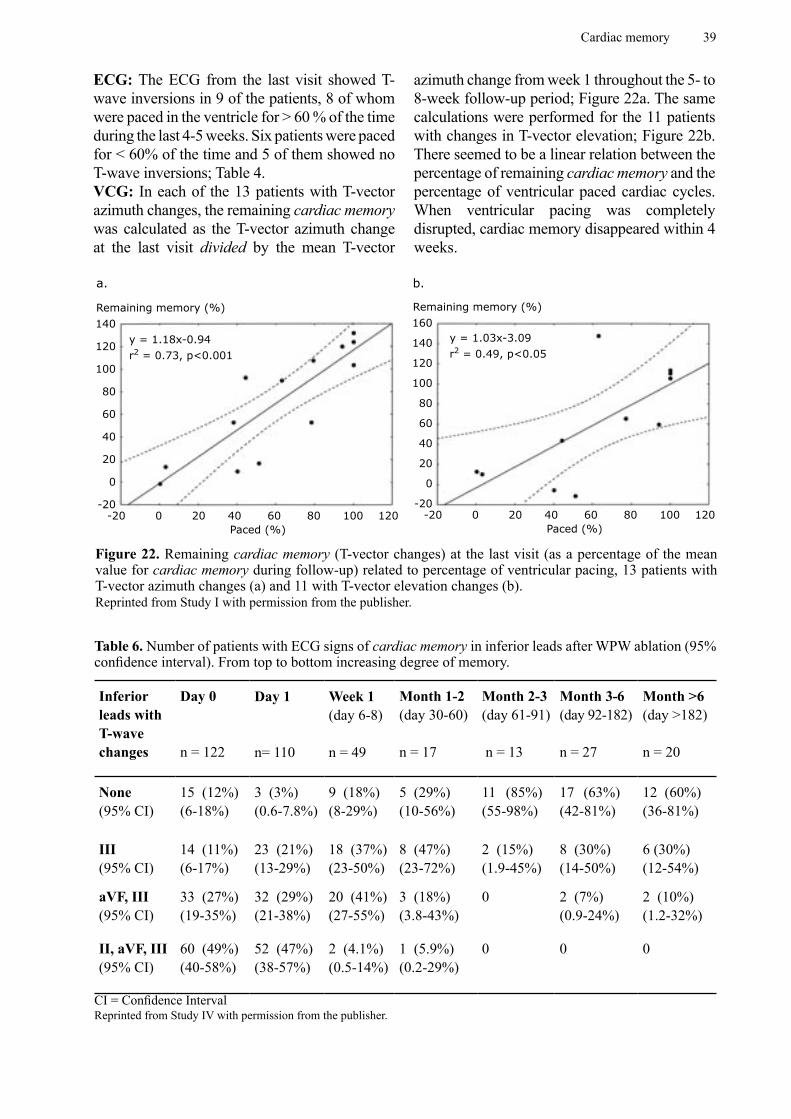
Cardiac memory 39
140
120
100
80
60
40
20
0
-20-20 0 20 40 60 80 100 120
Remaining memory (%)
Paced (%)
160
140
120
100
80
60
40
20
0
-20-20 0 20 40 60 80 100 120
Remaining memory (%)
Paced (%)
a. b.
Figure 22. Remaining cardiac memory (T-vector changes) at the last visit (as a percentage of the mean value for cardiac memory during follow-up) related to percentage of ventricular pacing, 13 patients with T-vector azimuth changes (a) and 11 with T-vector elevation changes (b).Reprinted from Study I with permission from the publisher.
y = 1.18x-0.94r2 = 0.73, p<0.001
y = 1.03x-3.09r2 = 0.49, p<0.05
ECG: The ECG from the last visit showed T-wave inversions in 9 of the patients, 8 of whom were paced in the ventricle for > 60 % of the time during the last 4-5 weeks. Six patients were paced for < 60% of the time and 5 of them showed no T-wave inversions; Table 4.VCG: In each of the 13 patients with T-vector azimuth changes, the remaining cardiac memory was calculated as the T-vector azimuth change at the last visit divided by the mean T-vector
azimuth change from week 1 throughout the 5- to 8-week follow-up period; Figure 22a. The same calculations were performed for the 11 patients with changes in T-vector elevation; Figure 22b. There seemed to be a linear relation between the percentage of remaining cardiac memory and the percentage of ventricular paced cardiac cycles. When ventricular pacing was completely disrupted, cardiac memory disappeared within 4 weeks.
Table 6. Number of patients with ECG signs of cardiac memory in inferior leads after WPW ablation (95% confidence interval). From top to bottom increasing degree of memory.
Inferior leads with T-wave changes
Day 0
n = 122
Day 1
n= 110
Week 1(day 6-8)
n = 49
Month 1-2 (day 30-60)
n = 17
Month 2-3 (day 61-91)
n = 13
Month 3-6 (day 92-182)
n = 27
Month >6(day >182)
n = 20
None(95% CI)
15 (12%)(6-18%)
3 (3%)(0.6-7.8%)
9 (18%)(8-29%)
5 (29%)(10-56%)
11 (85%)(55-98%)
17 (63%)(42-81%)
12 (60%)(36-81%)
III(95% CI)
14 (11%)(6-17%)
23 (21%)(13-29%)
18 (37%)(23-50%)
8 (47%)(23-72%)
2 (15%)(1.9-45%)
8 (30%)(14-50%)
6 (30%)(12-54%)
aVF, III(95% CI)
33 (27%)(19-35%)
32 (29%)(21-38%)
20 (41%)(27-55%)
3 (18%)(3.8-43%)
0 2 (7%)(0.9-24%)
2 (10%)(1.2-32%)
II, aVF, III(95% CI)
60 (49%) (40-58%)
52 (47%)(38-57%)
2 (4.1%)(0.5-14%)
1 (5.9%)(0.2-29%)
0 0 0
CI = Confidence IntervalReprinted from Study IV with permission from the publisher.
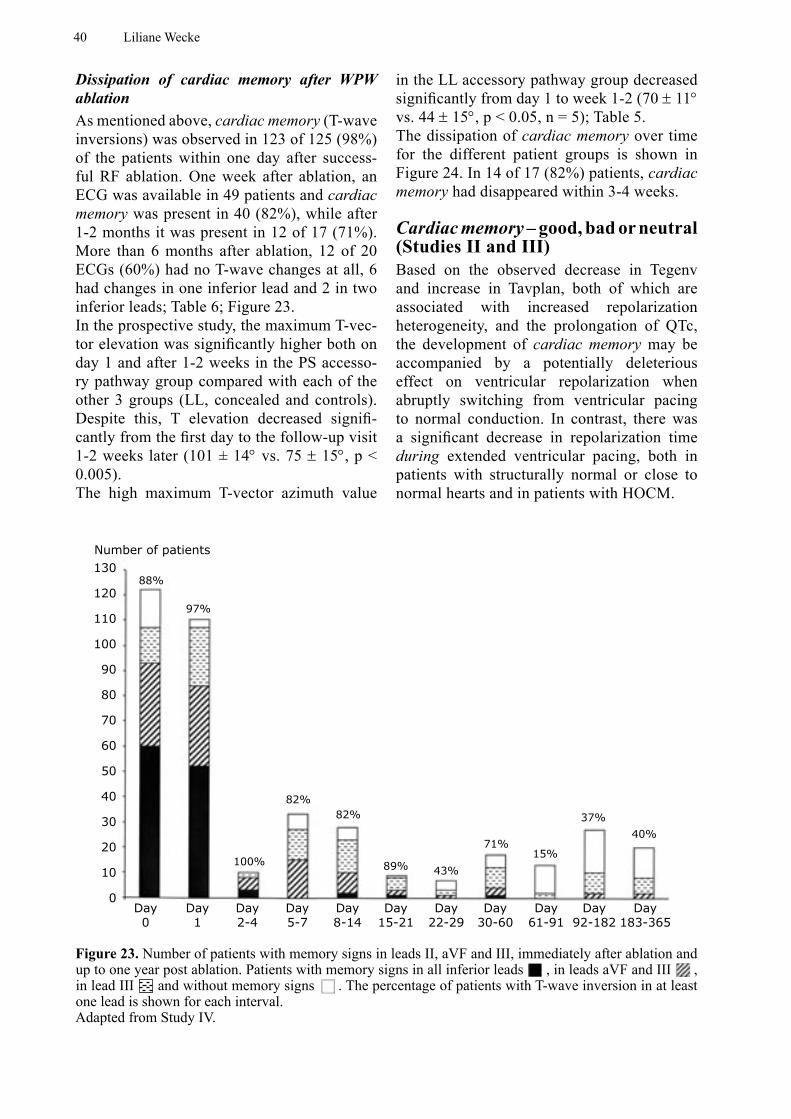
40 Liliane Wecke
Dissipation of cardiac memory after WPW ablationAs mentioned above, cardiac memory (T-wave inversions) was observed in 123 of 125 (98%) of the patients within one day after success-ful RF ablation. One week after ablation, an ECG was available in 49 patients and cardiac memory was present in 40 (82%), while after 1-2 months it was present in 12 of 17 (71%). More than 6 months after ablation, 12 of 20 ECGs (60%) had no T-wave changes at all, 6 had changes in one inferior lead and 2 in two inferior leads; Table 6; Figure 23.In the prospective study, the maximum T-vec-tor elevation was significantly higher both on day 1 and after 1-2 weeks in the PS accesso-ry pathway group compared with each of the other 3 groups (LL, concealed and controls). Despite this, T elevation decreased signifi-cantly from the first day to the follow-up visit 1-2 weeks later (101 ± 14° vs. 75 ± 15°, p < 0.005). The high maximum T-vector azimuth value
in the LL accessory pathway group decreased significantly from day 1 to week 1-2 (70 ± 11° vs. 44 ± 15°, p < 0.05, n = 5); Table 5.The dissipation of cardiac memory over time for the different patient groups is shown in Figure 24. In 14 of 17 (82%) patients, cardiac memory had disappeared within 3-4 weeks.
Cardiac memory – good, bad or neutral (Studies II and III)Based on the observed decrease in Tegenv and increase in Tavplan, both of which are associated with increased repolarization heterogeneity, and the prolongation of QTc, the development of cardiac memory may be accompanied by a potentially deleterious effect on ventricular repolarization when abruptly switching from ventricular pacing to normal conduction. In contrast, there was a significant decrease in repolarization time during extended ventricular pacing, both in patients with structurally normal or close to normal hearts and in patients with HOCM.
130
120
110
100
90
80
70
60
50
40
30
20
10
0
Number of patients
88%
97%
100%
82%82%
89% 43%
71%15%
37%
40%
Day0
Day1
Day2-4
Day5-7
Day8-14
Day15-21
Day22-29
Day30-60
Day61-91
Day92-182
Day183-365
Figure 23. Number of patients with memory signs in leads II, aVF and III, immediately after ablation and up to one year post ablation. Patients with memory signs in all inferior leads , in leads aVF and III , in lead III and without memory signs . The percentage of patients with T-wave inversion in at least one lead is shown for each interval.Adapted from Study IV.
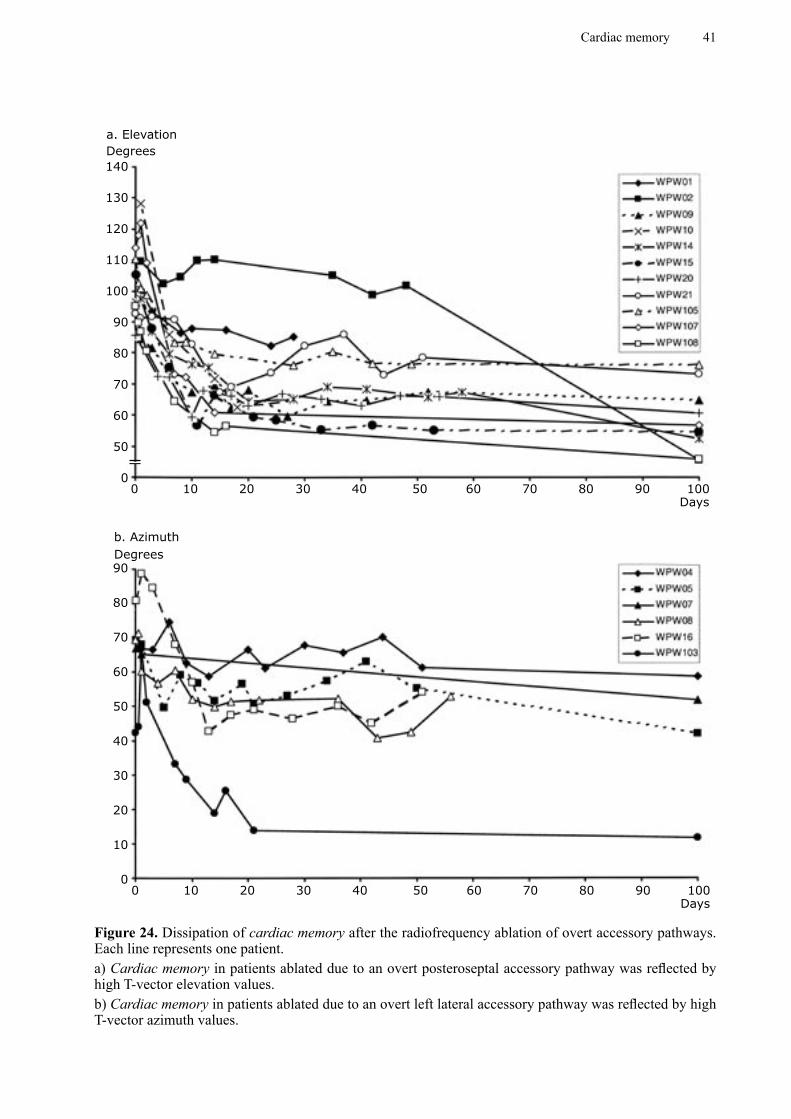
Cardiac memory 41
140
130
120
110
100
90
80
70
60
50
0
Degrees
0 10 20 30 40 50 60 70 80 90 100Days
90
80
70
60
50
40
30
20
10
00 10 20 30 40 50 60 70 80 90 100
Days
Degrees
a. Elevation
b. Azimuth
Figure 24. Dissipation of cardiac memory after the radiofrequency ablation of overt accessory pathways. Each line represents one patient.a) Cardiac memory in patients ablated due to an overt posteroseptal accessory pathway was reflected by high T-vector elevation values. b) Cardiac memory in patients ablated due to an overt left lateral accessory pathway was reflected by high T-vector azimuth values.
42 Liliane Wecke
Summary of results
• The T vector during cardiac memory (normal conduction) correlated with the QRS vector during the previously altered activation sequence. This was true for both the pacing and the WPW (preexcitation) model and was consistent with the original ECG-based definition of cardiac memory.
• The VCG parameters maximum T-vector amplitude and Tarea detected cardiac memory related repolarization changes in the human pacing model within 24 hours. This was before T-wave inversions could be recognized on the conventional 12-lead ECG.
• Cardiac memory development reached steady state within one week after the onset of right ventricular endocardial pacing at physiologic rates and was faster and more homogeneous in time than expected.
• Cardiac memory development might result in different repolarization responses depending upon baseline structure and electrophysiology. HOCM patients displayed similar morphological T-wave changes, but the repolarization time response was different compared with controls.
• In the pacing model, after approximately 4 weeks of pacing with a longer AV delay, cardiac memory was preserved in proportion to the percentage of ventricular pacing. This relation seemed to be linear.
• If ventricular pacing was completely discontinued, cardiac memory disappeared within 4 weeks.
• Changes in the QT interval and T-vector loop morphology imply that cardiac memory development might be accompanied by unfavorable repolarization changes.
• Cardiac memory was observed in 98% of the patients within one day after the successful RF ablation of an overt PS accessory pathway.
• Cardiac memory was present after the successful RF ablation of overt accessory pathways, independent of the accessory pathway location. Repolarization changes after the ablation of PS accessory pathways were mainly expressed in the vertical direction and, after the ablation of LL accessory pathways, mainly in the transverse plane.
• Cardiac memory appearing after the successful RF ablation of an overt PS accessory pathway disappeared in the majority of available ECGs within 3 months but persisted for longer than 6 months in some patients.
Cardiac memory 43
GENERAL DISCUSSION
In recent decades, cardiac memory has evolved from being an electrocardiographic
curiosity to a concept of potential clinical im-portance, not only as a diagnostic confounder regarding myocardial ischemia. This thesis focuses on the occurrence, development and dissipation of cardiac memory in two human models, ventricular pacing and ablation of the WPW syndrome. In order to expand our knowledge of repolarization changes associ-ated with cardiac memory, we used VCG an-alyzed in 3 dimensions, including the T-loop morphology analysis, as well as conventional ECG. VCG facilitates the quantification of T-vector changes, which was shown as part of the methodological development. In addi-tion, potential positive and negative effects of cardiac memory on repolarization in the human heart were addressed. In parallel with our studies, other groups have focused on the mechanisms of cardiac memory, mainly by pursuing studies in the canine model of ven-tricular pacing.
Definition of cardiac memoryThe definition of cardiac memory, which has primarily been established from ECG studies, is as follows:
T-wave inversions on ECG during normal ventricular activation following a period of previous abnormal ventricular activation, where the T- wave vector tracks the previously altered QRS vector. During continuous normal ventricular activation, the T wave will slowly normalize.
Our studies using VCG confirmed that the T vector tracks the previously altered QRS vector, both in the human pacing model and after the ablation of the WPW syndrome, results that corroborate the definition of cardiac memory.
Cardiac memory and ventricular pacingIn humans, cardiac memory developed and reached steady state within one week after the onset of endocardial pacing in the right ventricular apex at physiologic rates. This was the main finding in Study I, where cardiac memory was evaluated by means of qualitative ECG analysis and analysis of the T-vector angles of the VCG. Further analysis (Study II) showed that repolarization changes in the form of reduced maximum T-vector amplitude and decreased Tarea could already be detected within the first 24 hours after the onset of right ventricular endocardial pacing.
Other studies of cardiac memory related to ventricular pacing in humans have mainly used the ECG 3, 14, 17, whereas VCG has been applied in studies of dogs 18. Chatterjee et al. studied 31 patients, 30 who were paced endocardially and one epicardially, and found massive T-wave inversions post pacing in all patients, apart from two who had LBBB. The duration of ventricular pacing varied from 10 minutes to 4 years. Five patients were followed for up to 2 weeks and they showed increasing T-wave inversions. The authors did not specifically study the temporal characteristics of cardiac memory dissipation but noted that 10 minutes of ventricular pacing led to T-wave changes that persisted for 15 minutes, while 2 years of pacing caused changes that were still present after 18 months. It is not clear whether the latter patients were temporarily paced during this period 3.
Rosenbaum et al., who introduced the concept of cardiac memory, studied 85 patients with intermittent LBBB and found T-wave changes during normal conduction which “remembered” the QRS of the abnormal conducted beats (i.e. had the same vector) verified by both ECG and VCG. They also studied (using ECG) the effect of right ventricular pacing, usually creating a
44 Liliane Wecke
LBBB pattern, in 5 patients paced for between 25 and 66 hours at rates of 100-120 beats/min, and concluded that the T-wave changes progressed gradually and uniformly, although they did not reach steady state in any of the patients. The return to a normal ECG took 8-38 days (4 patients), although not from a steady state level (fully developed cardiac memory). In addition to the cumulative effect of cardiac memory, they also found that repeated trains of ventricular pacing of 15 minutes’ duration, separated by non-pacing intervals allowing for T-wave changes to disappear, induced a greater degree of T-wave changes for each successive train. The heart therefore appeared to “remember” that the activation sequence had been abnormal some time ago, as well as the direction of it 14.
Alessandrini et al. studied cardiac memory in 8 patients paced from the ventricle at 70-80 beats/min for 1 hour and 1 week respectively but only observed cardiac memory in the one-week group. The question of whether or not steady state was reached after 1 week of pacing was not addressed. The T-wave inversions persisted for the entire observation time of 24 hours 17.
In dogs, Shvilkin et al. applied both ECG and reconstructed VCG in the frontal plane to study cardiac memory development and dissipation. The animals were paced epicardially from the left ventricle and at a rate 10-15% faster than the animals’ sinus rhythm. While the T-vector amplitude increased and reached steady state after about 10 days, the T-vector angle did not reach steady state until about 3 weeks of ventricular pacing 18. This is partly different from our results in humans. Firstly, we found an initial decrease in maximum T-vector amplitude within 24 hours after the onset of ventricular pacing, followed by an increase towards baseline values within one week. Secondly, changes in the maximum T-vector angle (azimuth and/or elevation) reached steady state within one week after the initiation of ventricular pacing in humans, which is about 3 times faster than in the dog model.
The different results were unexpected, since our hypothesis was that the development of cardiac memory in humans would be both slower, due to
a lower heart rate, and more heterogeneous than in the dog model. Possible explanations for the different results in humans compared with dogs in these studies are:
1. Different species: humans vs. dogs.
2. Different pacing sites: endocardial right ventricular pacing in humans vs. epicardial left ventricular pacing in dogs.
3. Different extent of ventricular pacing: > 90% ventricular pacing in humans vs. > 75% ventricular pacing in dogs.
4. Different analysis of the VCG: 3-dimensional analysis in humans vs. only
frontal plane analysis of a reconstructed (from ECG) VCG in dogs.
In general, the ECG features were very similar in dogs and humans. It therefore appears to be unlikely that species differences play a major role.With regard to pacing site, there were two differences; i.e. the left versus the right ventricle and epicardial versus endocardial pacing. As judged from the WPW experience, where there were no major differences in memory expression between left and right accessory pathway sites, it does not seem very likely that the difference in stimulated ventricle plays a major role. When it comes to epicardial versus endocardial pacing, there are some intriguing differences to consider. Epicardial stimulation originates remotely from the specialized Purkinje system compared with endocardial pacing. In addition, the myocardial layers are arranged differently. So, in the canine wedge preparation, epicardial stimulation resulted in a slower transmural conduction velocity and a longer conduction time, as well as a less planar activation wave front, compared with endocardial stimulation 48. The morphology of the wave front is important for the safety of conduction (source to sink relationship, see page 15). These heterogeneities across the transmural wall are probably due to the reduced expression of gap junctions in the subepicardial layers relative to the deeper myocardial layers 49. For this reason, the temporal differences are most likely related to the different pacing sites, but this needs to be confirmed. According to preliminary data right ventricular endocardial pacing in the dog
Cardiac memory 45
gives similar results as in our human model (MR Rosen, personal communication).The extent of ventricular pacing (percentage of impulses with altered activation) required to reach a steady state of cardiac memory is uncertain. We arbitrarily chose a goal of > 90% ventricular paced cardiac cycles, which was met for the majority of the patients according to the pacemaker log. Shvilkin et al. monitored 4 dogs for 24 hours on random days and found capture > 75% of the time 18. It is possible that the temporal difference mentioned above is partly explained by the different extent of ventricular pacing, which may also have been < 75% in the dogs for some time.The different behavior of maximum T-vector amplitude may be explained by the different analyses that were used. When only the frontal plane was analyzed in humans, 4 of 14 (29%) patients did not show any change in the T-vector angle.
The dissipation of cardiac memory required approximately 7 days in dogs paced for 21-25 days and > 30 days (more than the observation time) in dogs paced for 42-52 days 18.In our study, cardiac memory in humans disappeared within 4 weeks when pacing was disrupted after 5-8 weeks of ventricular pacing. According to the ECG analysis, T-wave changes persisted when the amount of ventricular pacing was > 60% of the time. However, this reflects the amount required to retain already established cardiac memory. VCG analysis (T-vector azimuth/elevation) showed that, after approximately 4 weeks of pacing with a longer AV delay, cardiac memory was conserved in proportion to the percentage of ventricular pacing, a relation that seemed to be linear. This is a novel finding, which shows similarities with psychological memory studies 16.
When we compared the rate-adjusted QT interval (QTc) during normal conduction before pacemaker implantation with that during normal conduction (temporary AAI pacing) after 5-6 weeks of ventricular pacing, i.e. during cardiac memory, we found a significant prolongation of 25 ms or 6 %. Data from previous studies in humans are conflicting. Neither Chatterjee et al. nor Rosenbaum et al. found any consistent changes in QTc 3, 14. Chatterjee et al. found an
increase in 13 patients and a decrease in 15 but the duration of pacing varied tremendously, from 10 minutes to > 4 years 3. Alessandrini et al., on the other hand, found a non-significant prolongation of QT of 3% at 3 minutes after the cessation of 1 week of ventricular pacing compared with baseline values. Thereafter, QT decreased significantly by 4% to the next day 17, which is in line with our results. In right ventricular epicardially paced dogs, no consistent change in QTc was observed in the short-term memory model (3 x 20 minutes of pacing) 21. In the long-term memory model, Plotnikov et al. found an increase in QT interval of approximately 7% during normal conduction after 21 days of epicardial left ventricular pacing compared with baseline values 50, similar to our results. In two other long-term memory studies using the same model, a prolongation of APD of endocardial and epicardial myocytes was found when analyzing myocardial strips, but QT and QTc were unchanged 18, 51.
When the repolarization time during ventricular pacing was assessed, the opposite result was obtained. After 5-8 weeks of right ventricular pacing, we found a significant decrease in the mean QTc of 49 ms or 9 % and in the mean JTc of 38 ms or 11 %. This is in line with the results reported by Alessandrini et al., who observed that the QT interval during pacing was significantly longer after 1 hour compared with after 1 week of ventricular pacing in humans 17. In the long-term dog model, on the other hand, a prolongation of QT during pacing was observed after 21 days of epicardial left ventricular pacing 50.
The changes in QTc associated with the development of cardiac memory in humans suggest an adaptive process to the new activation sequence, in accordance with the observations in the Langendorff-perfused rabbit heart 52.
Cardiac memory and HOCMThe right ventricular endocardially paced HOCM patients displayed a similar morpho-logical ECG pattern of cardiac memory to that displayed by the control patients with structur-ally normal or almost normal hearts. This is in line with a previous study by McAreavey et al.,
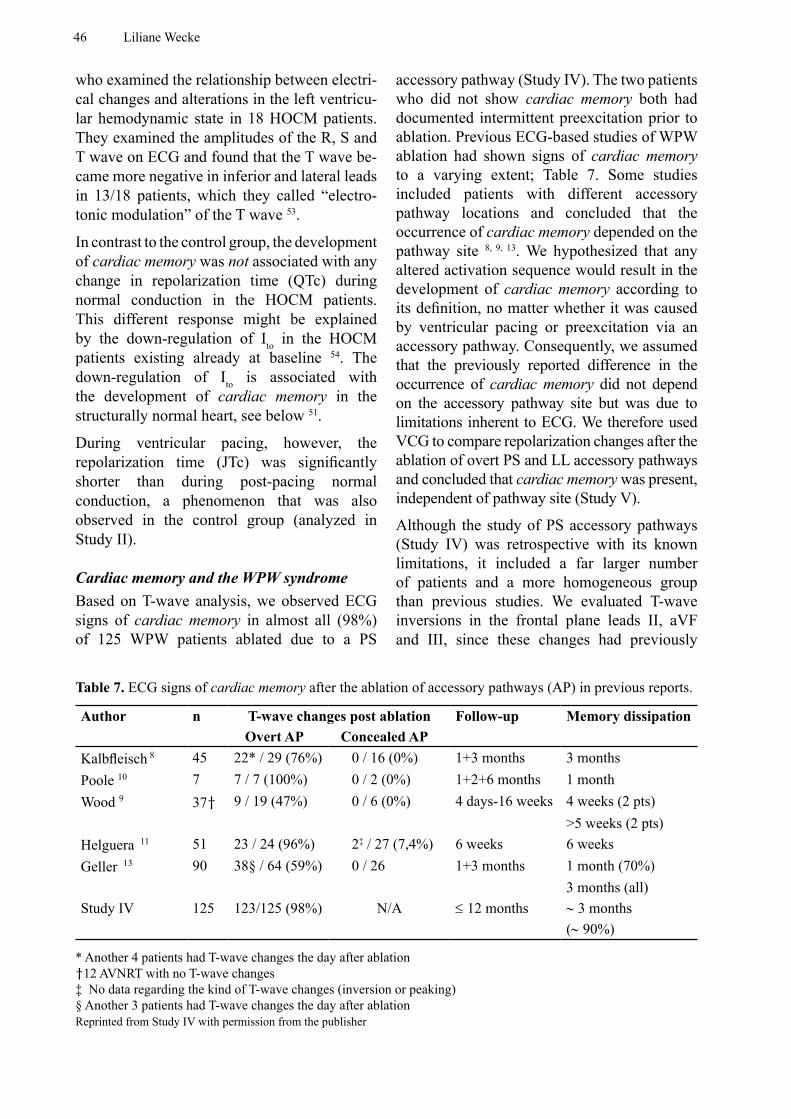
46 Liliane Wecke
who examined the relationship between electri-cal changes and alterations in the left ventricu-lar hemodynamic state in 18 HOCM patients. They examined the amplitudes of the R, S and T wave on ECG and found that the T wave be-came more negative in inferior and lateral leads in 13/18 patients, which they called “electro-tonic modulation” of the T wave 53.
In contrast to the control group, the development of cardiac memory was not associated with any change in repolarization time (QTc) during normal conduction in the HOCM patients. This different response might be explained by the down-regulation of Ito in the HOCM patients existing already at baseline 54. The down-regulation of Ito is associated with the development of cardiac memory in the structurally normal heart, see below 51.
During ventricular pacing, however, the repolarization time (JTc) was significantly shorter than during post-pacing normal conduction, a phenomenon that was also observed in the control group (analyzed in Study II).
Cardiac memory and the WPW syndromeBased on T-wave analysis, we observed ECG signs of cardiac memory in almost all (98%) of 125 WPW patients ablated due to a PS
accessory pathway (Study IV). The two patients who did not show cardiac memory both had documented intermittent preexcitation prior to ablation. Previous ECG-based studies of WPW ablation had shown signs of cardiac memory to a varying extent; Table 7. Some studies included patients with different accessory pathway locations and concluded that the occurrence of cardiac memory depended on the pathway site 8, 9, 13. We hypothesized that any altered activation sequence would result in the development of cardiac memory according to its definition, no matter whether it was caused by ventricular pacing or preexcitation via an accessory pathway. Consequently, we assumed that the previously reported difference in the occurrence of cardiac memory did not depend on the accessory pathway site but was due to limitations inherent to ECG. We therefore used VCG to compare repolarization changes after the ablation of overt PS and LL accessory pathways and concluded that cardiac memory was present, independent of pathway site (Study V).
Although the study of PS accessory pathways (Study IV) was retrospective with its known limitations, it included a far larger number of patients and a more homogeneous group than previous studies. We evaluated T-wave inversions in the frontal plane leads II, aVF and III, since these changes had previously
Table 7. ECG signs of cardiac memory after the ablation of accessory pathways (AP) in previous reports.
Author n T-wave changes post ablation Follow-up Memory dissipation Overt AP Concealed AP
Kalbfleisch 8 45 22* / 29 (76%) 0 / 16 (0%) 1+3 months 3 monthsPoole 10 7 7 / 7 (100%) 0 / 2 (0%) 1+2+6 months 1 monthWood 9 37† 9 / 19 (47%) 0 / 6 (0%) 4 days-16 weeks 4 weeks (2 pts)
>5 weeks (2 pts)Helguera 11 51 23 / 24 (96%) 2‡ / 27 (7,4%) 6 weeks 6 weeksGeller 13 90 38§ / 64 (59%) 0 / 26 1+3 months 1 month (70%)
3 months (all)Study IV 125 123/125 (98%) N/A ≤ 12 months ∼ 3 months
(∼ 90%)
* Another 4 patients had T-wave changes the day after ablation†12 AVNRT with no T-wave changes‡ No data regarding the kind of T-wave changes (inversion or peaking)§ Another 3 patients had T-wave changes the day after ablation Reprinted from Study IV with permission from the publisher
Cardiac memory 47
been reported to occur after the ablation of PS accessory pathways 10, 11. Other studies including accessory pathways with different locations assessed both T-wave inversion and peaking 8, 11, 13. This should be borne in mind when comparing studies in Table 7.
Some authors have emphasized that the direc-tion of the post-ablation T-wave vector was similar to the direction of the delta-wave vec-tor 8, 10, 11, 13, while others have stated that it was similar to the direction of the main preexcited QRS vector 55. According to our results, both are equally correct (Study IV). Furthermore, the prospective VCG study (Study V) showed a moderate to strong correlation between the angle of the maximum T vector post ablation and the angle of the preexcited maximum QRS vector.
A correlation between the degree of preexcitation measured as QRS duration prior to ablation and the extent of post-ablation T-wave changes has previously been reported 8, 9, 13. No correlation of this kind was confirmed in our study. This could be explained by the use of different methods for measuring the degree of T-wave changes. We used the number of inferior leads (II, aVF, III) with T-wave inversion after ablation as an estimate of the degree of cardiac memory, whereas others have graded the T-wave changes as none, mild or marked 8, 13 or have divided the patients into one group with T-wave changes and another without them 9.
In a few patients, T-wave inversions did not occur until the day after ablation. This phenomenon was also reported by Kalbfleisch et al., who found 14% 8, and Geller et al., who found 5% 13, compared with our 11% of patients with the delayed onset of T-wave changes. The reason for this is unclear, but it may be due to methodological and/or biological factors, such as a change in the position of the heart due to several hours in the supine position during and after the ablation procedure.
When comparing cardiac memory after the ab-lation of accessory pathways in different loca-tions (Study V), we found T-wave inversions on ECG after the ablation of PS but not after the ablation of LL accessory pathways. The VCG
analysis, on the other hand, revealed T-vector changes in the horizontal / transverse plane (high maximum T-vector azimuth values) after the ablation of LL and in the vertical direction (high T-vector elevation values) after the abla-tion of PS accessory pathways. This confirmed our hypothesis that the development of cardiac memory is independent of the accessory path-way site and probably explains why ECG-based studies of the post-ablation T wave report signs of cardiac memory in a varying percentage of patients with different accessory pathways.
QRS-T angles in the frontal and horizontal planes measured from 12-lead ECGs were analyzed by Helguera et al. They only found changes in the frontal plane, although they included patients with both right- and left-sided accessory pathways 11. Herweg et al. analyzed the QRS and T vector and the QRS-T angle in the frontal plane from ECG and concluded that cardiac memory was more pronounced in patients with posterior accessory pathways 55.
Our results are, however, in line with previous studies of repolarization changes during preex-citation and after the ablation of overt acces-sory pathways using body surface QRST time integrals. These are achieved by integrating each lead over the time interval from the be-ginning of the QRS complex to the end of the T wave; (unit: mV • ms). Abnormal QRST val-ues were found before and 1 day, but not 1 week, after ablation in leads reflecting the frontal plane in right-sided accessory pathways and in leads re-flecting the horizontal plane in left-sided accessory pathways 12, 56. Studies of QRST time integrals have also demonstrated that repolarization abnormalities do not exist in patients with concealed accessory pathways 12, 56, 57. Analysis of the QRST time inte-gral, however, is performed on the assumption that it is independent of activation sequence. Cardiac memory, on the other hand, is crucially dependent on activation sequence and these re-sults therefore require confirmation.
Another method of analysis is the spatial ventricular gradient (VG) assessed by the VCG. Each of the Frank orthogonal leads (X, Y, Z) was integrated over the time interval from the beginning of the QRS complex to the end of the T wave; (unit: mV • ms). The spatial VG was
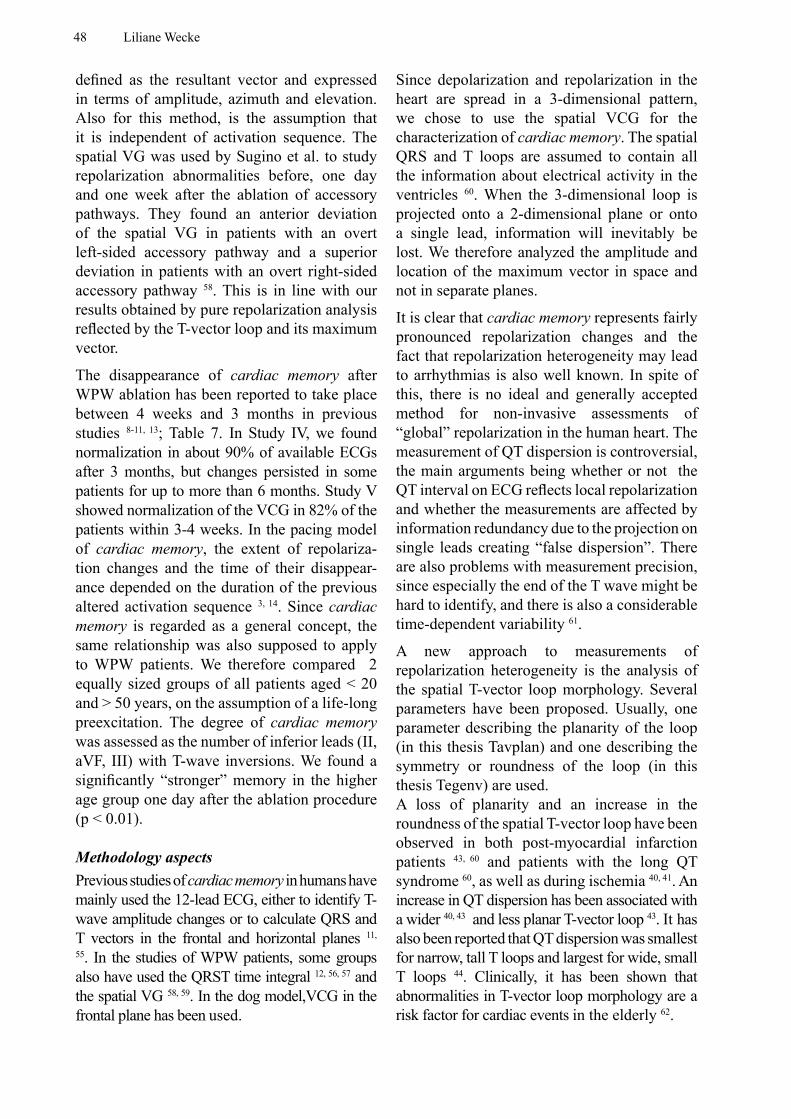
48 Liliane Wecke
defined as the resultant vector and expressed in terms of amplitude, azimuth and elevation. Also for this method, is the assumption that it is independent of activation sequence. The spatial VG was used by Sugino et al. to study repolarization abnormalities before, one day and one week after the ablation of accessory pathways. They found an anterior deviation of the spatial VG in patients with an overt left-sided accessory pathway and a superior deviation in patients with an overt right-sided accessory pathway 58. This is in line with our results obtained by pure repolarization analysis reflected by the T-vector loop and its maximum vector.
The disappearance of cardiac memory after WPW ablation has been reported to take place between 4 weeks and 3 months in previous studies 8-11, 13; Table 7. In Study IV, we found normalization in about 90% of available ECGs after 3 months, but changes persisted in some patients for up to more than 6 months. Study V showed normalization of the VCG in 82% of the patients within 3-4 weeks. In the pacing model of cardiac memory, the extent of repolariza-tion changes and the time of their disappear-ance depended on the duration of the previous altered activation sequence 3, 14. Since cardiac memory is regarded as a general concept, the same relationship was also supposed to apply to WPW patients. We therefore compared 2 equally sized groups of all patients aged < 20 and > 50 years, on the assumption of a life-long preexcitation. The degree of cardiac memory was assessed as the number of inferior leads (II, aVF, III) with T-wave inversions. We found a significantly “stronger” memory in the higher age group one day after the ablation procedure (p < 0.01).
Methodology aspectsPrevious studies of cardiac memory in humans have mainly used the 12-lead ECG, either to identify T-wave amplitude changes or to calculate QRS and T vectors in the frontal and horizontal planes 11,
55. In the studies of WPW patients, some groups also have used the QRST time integral 12, 56, 57 and the spatial VG 58, 59. In the dog model,VCG in the frontal plane has been used.
Since depolarization and repolarization in the heart are spread in a 3-dimensional pattern, we chose to use the spatial VCG for the characterization of cardiac memory. The spatial QRS and T loops are assumed to contain all the information about electrical activity in the ventricles 60. When the 3-dimensional loop is projected onto a 2-dimensional plane or onto a single lead, information will inevitably be lost. We therefore analyzed the amplitude and location of the maximum vector in space and not in separate planes.
It is clear that cardiac memory represents fairly pronounced repolarization changes and the fact that repolarization heterogeneity may lead to arrhythmias is also well known. In spite of this, there is no ideal and generally accepted method for non-invasive assessments of “global” repolarization in the human heart. The measurement of QT dispersion is controversial, the main arguments being whether or not the QT interval on ECG reflects local repolarization and whether the measurements are affected by information redundancy due to the projection on single leads creating “false dispersion”. There are also problems with measurement precision, since especially the end of the T wave might be hard to identify, and there is also a considerable time-dependent variability 61.
A new approach to measurements of repolarization heterogeneity is the analysis of the spatial T-vector loop morphology. Several parameters have been proposed. Usually, one parameter describing the planarity of the loop (in this thesis Tavplan) and one describing the symmetry or roundness of the loop (in this thesis Tegenv) are used. A loss of planarity and an increase in the roundness of the spatial T-vector loop have been observed in both post-myocardial infarction patients 43, 60 and patients with the long QT syndrome 60, as well as during ischemia 40, 41. An increase in QT dispersion has been associated with a wider 40, 43 and less planar T-vector loop 43. It has also been reported that QT dispersion was smallest for narrow, tall T loops and largest for wide, small T loops 44. Clinically, it has been shown that abnormalities in T-vector loop morphology are a risk factor for cardiac events in the elderly 62.
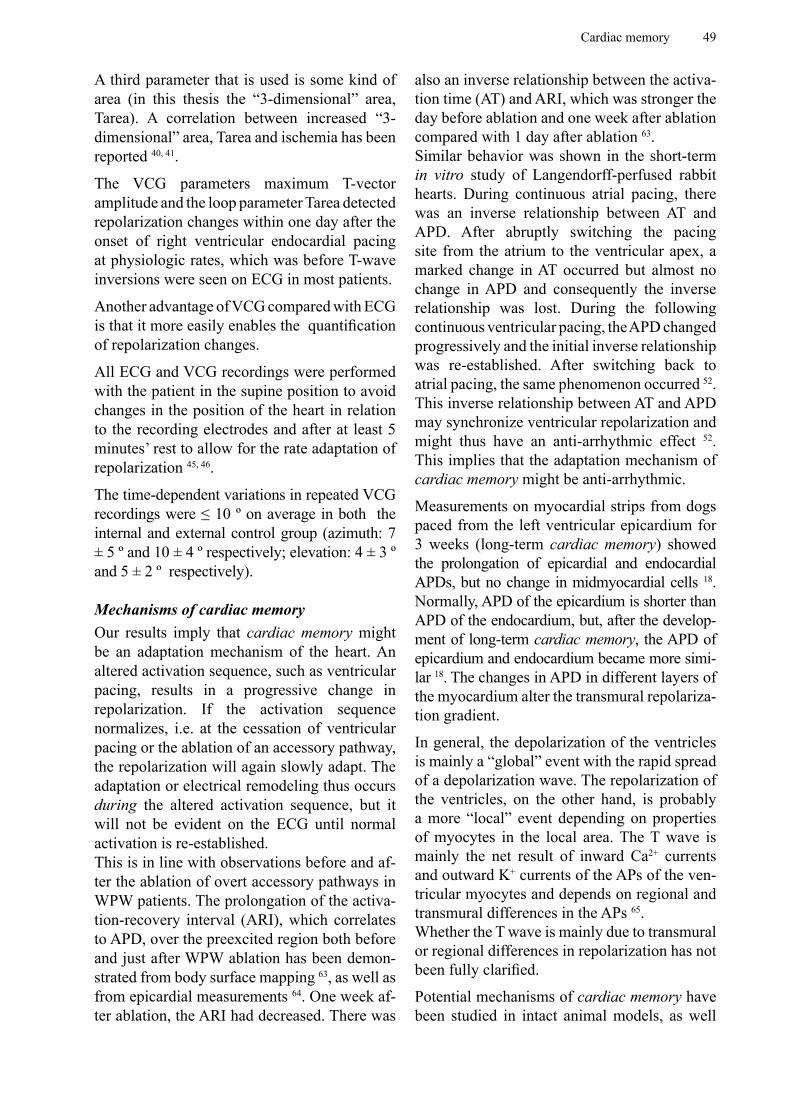
Cardiac memory 49
A third parameter that is used is some kind of area (in this thesis the “3-dimensional” area, Tarea). A correlation between increased “3-dimensional” area, Tarea and ischemia has been reported 40, 41.
The VCG parameters maximum T-vector amplitude and the loop parameter Tarea detected repolarization changes within one day after the onset of right ventricular endocardial pacing at physiologic rates, which was before T-wave inversions were seen on ECG in most patients.
Another advantage of VCG compared with ECG is that it more easily enables the quantification of repolarization changes.
All ECG and VCG recordings were performed with the patient in the supine position to avoid changes in the position of the heart in relation to the recording electrodes and after at least 5 minutes’ rest to allow for the rate adaptation of repolarization 45, 46.
The time-dependent variations in repeated VCG recordings were ≤ 10 º on average in both the internal and external control group (azimuth: 7 ± 5 º and 10 ± 4 º respectively; elevation: 4 ± 3 º and 5 ± 2 º respectively).
Mechanisms of cardiac memoryOur results imply that cardiac memory might be an adaptation mechanism of the heart. An altered activation sequence, such as ventricular pacing, results in a progressive change in repolarization. If the activation sequence normalizes, i.e. at the cessation of ventricular pacing or the ablation of an accessory pathway, the repolarization will again slowly adapt. The adaptation or electrical remodeling thus occurs during the altered activation sequence, but it will not be evident on the ECG until normal activation is re-established.This is in line with observations before and af-ter the ablation of overt accessory pathways in WPW patients. The prolongation of the activa-tion-recovery interval (ARI), which correlates to APD, over the preexcited region both before and just after WPW ablation has been demon-strated from body surface mapping 63, as well as from epicardial measurements 64. One week af-ter ablation, the ARI had decreased. There was
also an inverse relationship between the activa-tion time (AT) and ARI, which was stronger the day before ablation and one week after ablation compared with 1 day after ablation 63. Similar behavior was shown in the short-term in vitro study of Langendorff-perfused rabbit hearts. During continuous atrial pacing, there was an inverse relationship between AT and APD. After abruptly switching the pacing site from the atrium to the ventricular apex, a marked change in AT occurred but almost no change in APD and consequently the inverse relationship was lost. During the following continuous ventricular pacing, the APD changed progressively and the initial inverse relationship was re-established. After switching back to atrial pacing, the same phenomenon occurred 52. This inverse relationship between AT and APD may synchronize ventricular repolarization and might thus have an anti-arrhythmic effect 52. This implies that the adaptation mechanism of cardiac memory might be anti-arrhythmic.
Measurements on myocardial strips from dogs paced from the left ventricular epicardium for 3 weeks (long-term cardiac memory) showed the prolongation of epicardial and endocardial APDs, but no change in midmyocardial cells 18. Normally, APD of the epicardium is shorter than APD of the endocardium, but, after the develop-ment of long-term cardiac memory, the APD of epicardium and endocardium became more simi-lar 18. The changes in APD in different layers of the myocardium alter the transmural repolariza-tion gradient.
In general, the depolarization of the ventricles is mainly a “global” event with the rapid spread of a depolarization wave. The repolarization of the ventricles, on the other hand, is probably a more “local” event depending on properties of myocytes in the local area. The T wave is mainly the net result of inward Ca2+ currents and outward K+ currents of the APs of the ven-tricular myocytes and depends on regional and transmural differences in the APs 65.Whether the T wave is mainly due to transmural or regional differences in repolarization has not been fully clarified.
Potential mechanisms of cardiac memory have been studied in intact animal models, as well
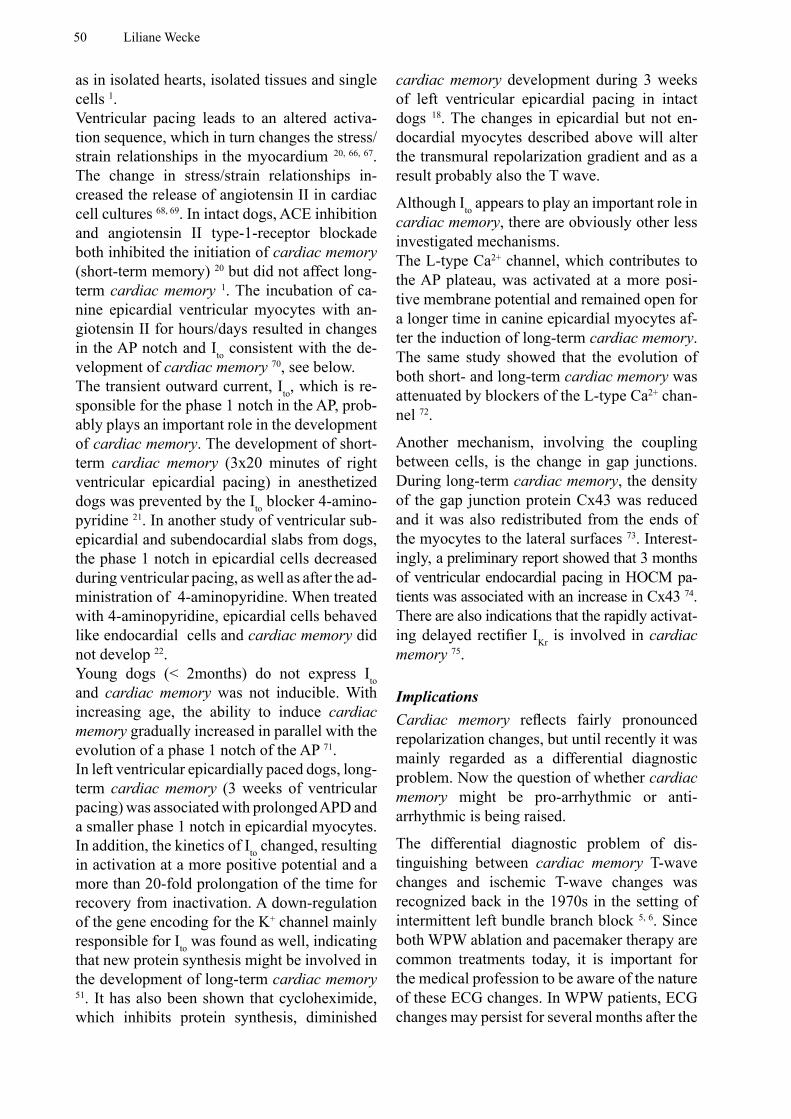
50 Liliane Wecke
as in isolated hearts, isolated tissues and single cells 1.Ventricular pacing leads to an altered activa-tion sequence, which in turn changes the stress/strain relationships in the myocardium 20, 66, 67. The change in stress/strain relationships in-creased the release of angiotensin II in cardiac cell cultures 68, 69. In intact dogs, ACE inhibition and angiotensin II type-1-receptor blockade both inhibited the initiation of cardiac memory (short-term memory) 20 but did not affect long-term cardiac memory 1. The incubation of ca-nine epicardial ventricular myocytes with an-giotensin II for hours/days resulted in changes in the AP notch and Ito consistent with the de-velopment of cardiac memory 70, see below.The transient outward current, Ito, which is re-sponsible for the phase 1 notch in the AP, prob-ably plays an important role in the development of cardiac memory. The development of short-term cardiac memory (3x20 minutes of right ventricular epicardial pacing) in anesthetized dogs was prevented by the Ito blocker 4-amino-pyridine 21. In another study of ventricular sub-epicardial and subendocardial slabs from dogs, the phase 1 notch in epicardial cells decreased during ventricular pacing, as well as after the ad-ministration of 4-aminopyridine. When treated with 4-aminopyridine, epicardial cells behaved like endocardial cells and cardiac memory did not develop 22.Young dogs (< 2months) do not express Ito and cardiac memory was not inducible. With increasing age, the ability to induce cardiac memory gradually increased in parallel with the evolution of a phase 1 notch of the AP 71. In left ventricular epicardially paced dogs, long-term cardiac memory (3 weeks of ventricular pacing) was associated with prolonged APD and a smaller phase 1 notch in epicardial myocytes. In addition, the kinetics of Ito changed, resulting in activation at a more positive potential and a more than 20-fold prolongation of the time for recovery from inactivation. A down-regulation of the gene encoding for the K+ channel mainly responsible for Ito was found as well, indicating that new protein synthesis might be involved in the development of long-term cardiac memory 51. It has also been shown that cycloheximide, which inhibits protein synthesis, diminished
cardiac memory development during 3 weeks of left ventricular epicardial pacing in intact dogs 18. The changes in epicardial but not en-docardial myocytes described above will alter the transmural repolarization gradient and as a result probably also the T wave.
Although Ito appears to play an important role in cardiac memory, there are obviously other less investigated mechanisms.The L-type Ca2+ channel, which contributes to the AP plateau, was activated at a more posi-tive membrane potential and remained open for a longer time in canine epicardial myocytes af-ter the induction of long-term cardiac memory. The same study showed that the evolution of both short- and long-term cardiac memory was attenuated by blockers of the L-type Ca2+ chan-nel 72.
Another mechanism, involving the coupling between cells, is the change in gap junctions. During long-term cardiac memory, the density of the gap junction protein Cx43 was reduced and it was also redistributed from the ends of the myocytes to the lateral surfaces 73. Interest-ingly, a preliminary report showed that 3 months of ventricular endocardial pacing in HOCM pa-tients was associated with an increase in Cx43 74. There are also indications that the rapidly activat-ing delayed rectifier IKr is involved in cardiac memory 75.
Implications Cardiac memory reflects fairly pronounced repolarization changes, but until recently it was mainly regarded as a differential diagnostic problem. Now the question of whether cardiac memory might be pro-arrhythmic or anti-arrhythmic is being raised.
The differential diagnostic problem of dis-tinguishing between cardiac memory T-wave changes and ischemic T-wave changes was recognized back in the 1970s in the setting of intermittent left bundle branch block 5, 6. Since both WPW ablation and pacemaker therapy are common treatments today, it is important for the medical profession to be aware of the nature of these ECG changes. In WPW patients, ECG changes may persist for several months after the
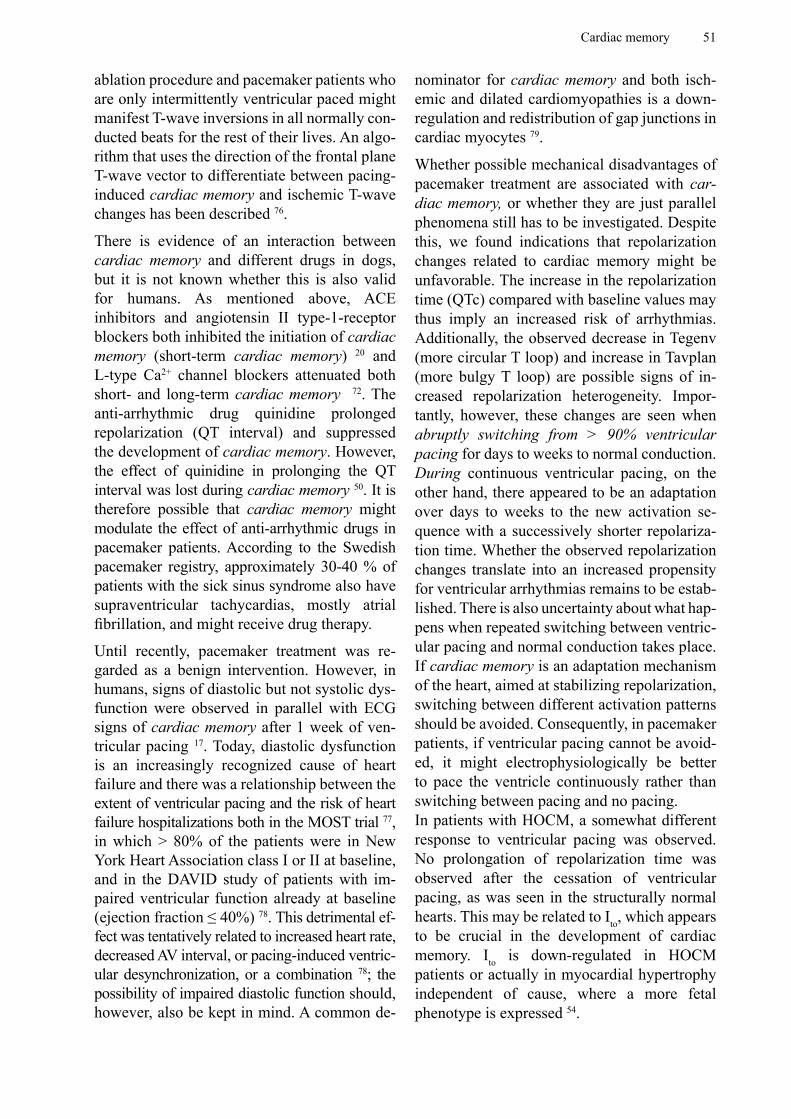
Cardiac memory 51
ablation procedure and pacemaker patients who are only intermittently ventricular paced might manifest T-wave inversions in all normally con-ducted beats for the rest of their lives. An algo-rithm that uses the direction of the frontal plane T-wave vector to differentiate between pacing-induced cardiac memory and ischemic T-wave changes has been described 76.
There is evidence of an interaction between cardiac memory and different drugs in dogs, but it is not known whether this is also valid for humans. As mentioned above, ACE inhibitors and angiotensin II type-1-receptor blockers both inhibited the initiation of cardiac memory (short-term cardiac memory) 20 and L-type Ca2+ channel blockers attenuated both short- and long-term cardiac memory 72. The anti-arrhythmic drug quinidine prolonged repolarization (QT interval) and suppressed the development of cardiac memory. However, the effect of quinidine in prolonging the QT interval was lost during cardiac memory 50. It is therefore possible that cardiac memory might modulate the effect of anti-arrhythmic drugs in pacemaker patients. According to the Swedish pacemaker registry, approximately 30-40 % of patients with the sick sinus syndrome also have supraventricular tachycardias, mostly atrial fibrillation, and might receive drug therapy.
Until recently, pacemaker treatment was re-garded as a benign intervention. However, in humans, signs of diastolic but not systolic dys-function were observed in parallel with ECG signs of cardiac memory after 1 week of ven-tricular pacing 17. Today, diastolic dysfunction is an increasingly recognized cause of heart failure and there was a relationship between the extent of ventricular pacing and the risk of heart failure hospitalizations both in the MOST trial 77, in which > 80% of the patients were in New York Heart Association class I or II at baseline, and in the DAVID study of patients with im-paired ventricular function already at baseline (ejection fraction ≤ 40%) 78. This detrimental ef-fect was tentatively related to increased heart rate, decreased AV interval, or pacing-induced ventric-ular desynchronization, or a combination 78; the possibility of impaired diastolic function should, however, also be kept in mind. A common de-
nominator for cardiac memory and both isch-emic and dilated cardiomyopathies is a down-regulation and redistribution of gap junctions in cardiac myocytes 79.
Whether possible mechanical disadvantages of pacemaker treatment are associated with car-diac memory, or whether they are just parallel phenomena still has to be investigated. Despite this, we found indications that repolarization changes related to cardiac memory might be unfavorable. The increase in the repolarization time (QTc) compared with baseline values may thus imply an increased risk of arrhythmias. Additionally, the observed decrease in Tegenv (more circular T loop) and increase in Tavplan (more bulgy T loop) are possible signs of in-creased repolarization heterogeneity. Impor-tantly, however, these changes are seen when abruptly switching from > 90% ventricular pacing for days to weeks to normal conduction. During continuous ventricular pacing, on the other hand, there appeared to be an adaptation over days to weeks to the new activation se-quence with a successively shorter repolariza-tion time. Whether the observed repolarization changes translate into an increased propensity for ventricular arrhythmias remains to be estab-lished. There is also uncertainty about what hap-pens when repeated switching between ventric-ular pacing and normal conduction takes place. If cardiac memory is an adaptation mechanism of the heart, aimed at stabilizing repolarization, switching between different activation patterns should be avoided. Consequently, in pacemaker patients, if ventricular pacing cannot be avoid-ed, it might electrophysiologically be better to pace the ventricle continuously rather than switching between pacing and no pacing.In patients with HOCM, a somewhat different response to ventricular pacing was observed. No prolongation of repolarization time was observed after the cessation of ventricular pacing, as was seen in the structurally normal hearts. This may be related to Ito, which appears to be crucial in the development of cardiac memory. Ito is down-regulated in HOCM patients or actually in myocardial hypertrophy independent of cause, where a more fetal phenotype is expressed 54.
52 Liliane Wecke
Questions have also been raised about whether there is cardiac memory in the atria as well and, if so, whether there is any association with atrial fibrillation.
LimitationsThe number of patients in Studies I and II was fairly small and their age and clinical back-ground were heterogeneous. Despite this, the temporal pattern of memory development was very consistent. However, conclusions relating to any influence by different drugs and unipolar versus bipolar pacing could not be reached.In a few patients, atrial fibrillation attenuated the development of cardiac memory. Furthermore, although the pacemaker log is a valuable tool, it cannot differentiate between complete or incomplete stimulation of the ventricle (fusion or pseudo-fusion). The latter might lead to the reduced development of cardiac memory, while frequent ventricular extra-systoles would have the opposite effect. In fact, memory development might have occurred even more rapidly if the ventricle in all patients had been fully preexcited 100% of the time.
In Study II and III, the QT interval was mea-sured, which is a well-recognized challenge. We adhered to standard criteria and only one person measured the QT intervals in order to minimize inter-observer variability.
The possible negative and positive effects on ventricular repolarization observed in Studies II and III in relation to cardiac memory development might be linked only by inference to an increased or decreased risk of arrhythmias. Effects on the prevalence of ventricular arrhythmias and on even harder end-points, such as sudden cardiac death, have not been presented. However, both animal and human data strongly suggest that the magnitude of repolarization changes observed in this study might be clinically relevant 80-84.
Study IV has the known limitations of a retrospective study, but the patient group was large and homogeneous according to the accessory pathway location (PS). The ECG analysis was qualitative and not quantitative and focused on the frontal plane (leads II, aVF, III). As shown in Study I, the frontal plane is
not sufficient to detect repolarization changes in all directions. In spite of this, our results were consistent within the group and with previous observations. Study V also confirmed that cardiac memory due to PS accessory pathways is mainly expressed in the vertical direction. Further, T-wave inversion solely in lead III is within normal limits and on its own has limited value for evaluating cardiac memory. Finally, there might be a bias in the later recordings, since patients with ECG changes might be more likely to have repeated ECGs performed.
In Study V, which is an interim report, the number of patients was limited, especially in the LL and concealed group. This affects the statistical power, but significant changes were still obtained, supporting our hypothesis. The different groups (PS or LL) were defined according to the pre-ablation ECG, which is dependent on both the AP location and the rotation of the heart around its long axis.
Cardiac memory – future speculation Even though a great deal of research has been performed in the last decade on the mechanisms of cardiac memory, there are still many more questions to explore.
• What is the first thing that happens after the activation sequence has changed? We are now investigating the cardiac release of different hormones after rapid pacing for 30 minutes in humans.
• What is the importance of angiotensin II in relation to cardiac memory? Is it just a signal molecule or is cardiac memory the beginning of impaired diastolic function?
• Is the change in the expression and distribution of gap junctions crucial for the development of cardiac memory or is it just a parallel phenomenon? There is no question that gap junctions are involved in the spread of the depolarization among myocytes.
• Is there a coupling between electrical and mechanical remodeling in the human heart? Although the influx of Ca2+ into the cardiac myocyte is dependent on the AP, it still remains to be investigated whether
Cardiac memory 53
electrical remodeling (cardiac memory) results in mechanical remodeling or whether it is just a parallel phenomenon. We are now investigating WPW patients before and after ablation, not only with ECG and VCG but also with echocardiography, including tissue Doppler imaging.
• Should ventricular pacing be performed in a location other than the right ventricular apex? For mechanical reasons, it is probably better with an activation pattern that is more like the normal activation sequence. For electrical reasons, we still do not know. Hypothetically, it might be that different pacing sites, including endocardial or epicardial sites, have pro-arrhythmic or anti-arrhythmic qualities, especially in the structurally and functionally abnormal heart.
• What about cardiac resynchronization therapy? As yet, there are no reports on cardiac memory when ventricular pacing is performed from two sites at the same time, besides one endocardial and one epicardial site.
• Are there interactions in both directions between cardiac memory and anti-arrhythmic drugs? There is no question that there are interactions, at least in dogs. Theoretically, cardiac memory induced by ventricular pacing, LBBB, ventricular extra-systoles or tachycardia may interact with drugs in both a positive or negative manner. It could well be that the currently fairly unpredictable behavior of some anti-arrhythmic drugs is the result of interaction with cardiac memory. With more knowledge in this field, the interactions might be turned into an advantage.
• What is the difference between short- and long-term cardiac memory? To date, all the studies have investigated either short- or long-term cardiac memory, although the time frames are not clear. How short-term cardiac memory is turned into long-term cardiac memory still needs exploration. The result might affect the point at which a possible intervention with cardiac memory should be performed.
• Is cardiac memory present in the atrium? Although there are differences between atrial and ventricular myocytes and their APs, their function is principally the same. So, there is presumably an atrial cardiac memory and some groups are also doing research in this field. Whether or not this this will lead to greater understanding and new therapies for atrial fibrillation, the most common arrhythmia, is still a dream of the future.
54 Liliane Wecke
CONCLUSIONS
• Cardiac memory is a form of electrical remodeling induced by altered ventricular activation where the T vector during normal activation follows the previously altered QRS vector in both human models studied in this thesis.
• After the initiation of right ventricular endocardial pacing in humans, repolarization changes appeared within 24 hours and cardiac memory was fully developed within 1 week. Cardiac memory was then retained in proportion to the percentage of ventricular pacing but disappeared within 4 weeks after the complete cessation of pacing.
• The repolarization changes related to pacing-induced cardiac memory were different in patients with hypertrophic obstructive cardiomyopathy compared with control patients.
• Cardiac memory was present in all patients after accessory pathway ablation in patients with overt WPW syndrome. The repolarization changes were mainly expressed in the transverse plane after the ablation of a left lateral accessory pathway and mainly in the vertical direction after the ablation of a posteroseptal accessory pathway. The dissipation of cardiac memory after WPW ablation usually occurred within 3 months.
• Cardiac memory is probably part of a response mechanism of the heart, where repolarization adapts to an altered depolarization, presumably in a stabilizing “anti-arrhythmic” direction. It is worth noting that abrupt switches between different activation sequences might lead to unfavorable repolarization changes.
• The analysis of the spatial VCG in 3 dimensions, including T-vector loop morphology, is a useful method for detecting repolarization changes.

Cardiac memory 55
ACKNOWLEDGEMENTS
I wish to express my sincere gratitude to all those who have supported and helped me and thus made this thesis possible. In particular I wish to thank:
Professor Lennart Bergfeldt, my supervisor, for excellent scientific guidance and great support. You have a profound knowledge of cardiac arrhythmias, which you are always willing to share and explain with great enthusiasm and in an outstanding pedagogic manner. Thank you also for taking me to New York visiting professor Rosen and his laboratory and the Guggenheim museum.
Professor Lars Rydén, former Chairman of the Cardiology Department, for giving me the opportu-nity to come to Karolinska University Hospital and be part of the excellent research environment you have created, and for great support during my PhD work.
Associate Professor Cecilia Linde, Chairman of the Cardiology Department and co-author, for providing me with the time to do scientific work and also for valuable input on manuscripts.
Fredrik Gadler, Head of the Pacemaker Section and co-author, for support and valuable input on manuscripts.
Professor Michael R. Rosen at Columbia University in New York, co-author, for sharing your tre-mendous knowledge on cardiac memory and valuable input on manuscripts. Thank you also for your generous guidance through your laboratory. You really are “Mr. Cardiac Memory”.
Associate Professor John Pernow, for your support in planning of the dissertation and for clinical guidance on the CCU.
Gunilla Lundahl, co-author and former employee at Ortivus AB, for help with understanding and calculating T-vector loop parameters and valuable input on manuscripts.
Karolina Nowinski colleague and co-author, for input on posters and general advice on being a PhD-student mixed with friendly chats.
My co-authors, Associate Professor Nils Edvardsson, Maria Aunes-Jansson, late Leon Lurje, Dri-tan Poçi and Birgitta Johansson at Sahlgrenska University Hospital in Gothenburg and Associate Professor Jonas Schwieler at Karolinska University Hospital.
Eva Wallgren, the master of the MIDA system, for recording of a tremendous number of VCGs and ECGs and for taking care of the study patients. You are always friendly and in a good mood. And not the least, I’d like to thank you for putting this thesis with all its pictures together and calmly trying to convince me that it will be finished in time.
Birgitta Nordlöf, for recording hundreds of ECGs and VCGs and arranging my patient data in per-fect records. Your patience in measuring all ECGs on the digitizing table was amazing.
Aigars Rubulis for interesting discussions about the T-vector loop and its morphology.
Anna Norhammar, Christina Jarnert, Inga Thrainsdottir and all other colleagues at the Cardiology Department at Karolinska University Hospital.

56 Liliane Wecke
David Ersgård for ECG/VCG recordings and help with several posters, Kerstin Höglund for help-ing me with my first poster, and Marian Lettosunti, Helena Karlsson and Pia Oblack for help with study patients.
Mats Andersson for mastering the digitizing table and its old computer, including writing pro-grams for it.
Elisabeth Berg for statistical advice and for making statistics comprehensible.
Britta Nyström and Lotta Backman at Sahlgrenska University Hospital for taking care of the study patients in Gothenburg.
Frieder Braunschweig, Hamid Bastani and the staff of the EP lab for help with study patients and clinical guidance.
Magnus Mossfeldt for solving all my computer problems.
Jeanette Kliger for linguistic help.
Kirsti Wallin, Helena Kagger and Berith Haavik for help with practical matters.
Elisabeth Nordeman for practical help and nice chats.
My close friends Karin Fors, Karin Mattson, Erika Bergner, Gunbritt Skog, Lisbeth Pettersson, my sewing mates Anna Eelde and Anna Fergin and many more, for support, encouragement, and a lot of fun.
My mother Berit, my brother Urban, my sister-in-law Karin and my wonderful nephew Nils, for love, support and encouragement.
Per for all support, care, encouragement and a tremendous number of long distance calls.
And last but not least, all patients who willingly took part in the studies and made this thesis pos-sible.
This work has been supported by grants from the Swedish Heart-Lung Foundation, the Stockholm County Council, the Karolinska Institute, Sahlgrenska University Hospital and the Gothenburg Society of Medicine.
The MIDA 1000 system was a loan from Ortivus AB, Täby, Sweden.
Cardiac memory 57
REFERENCES
1. Rosen MR. The electrocardiogram 100 years later: electrical insights into mo-lecular messages. Circulation. Oct 22 2002;106(17):2173-2179.
2. Chatterjee K, Harris AM, Davies JG, et al. T-wave changes after artificial pacing. Lan-cet. Apr 12 1969;1(7598):759-760.
3. Chatterjee K, Harris A, Davies G, et al. Electrocardiographic changes subsequent to artificial ventricular depolarization. Br Heart J. Nov 1969;31(6):770-779.
4. Kernohan RJ. Post-paroxysmal tachycardia syndrome. Br Heart J. Nov 1969;31(6):803-806.
5. Engel TR, Shah R, DePodesta LA, et al. T-wave abnormalities of intermittent left bun-dle-branch block. Ann Intern Med. Aug 1978;89(2):204-206.
6. Denes P, Pick A, Miller RH, et al. A charac-teristic precordial repolarization abnormality with intermittent left bundle-branch block. Ann Intern Med. Jul 1978;89(1):55-57.
7. Nicolai P, Medvedowsky JL, Delaage M, et al. Wolff-Parkinson-White syndrome: T wave abnormalities during normal path-way conduction. J Electrocardiol. Jul 1981;14(3):295-300.
8. Kalbfleisch SJ, Sousa J, el-Atassi R, et al. Repolarization abnormalities after catheter ablation of accessory atrioventricular con-nections with radiofrequency current. J Am Coll Cardiol. Dec 1991;18(7):1761-1766.
9. Wood MA, DiMarco JP, Haines DE. Electrocardiographic abnormalities after radiofrequency catheter ablation of ac-cessory bypass tracts in the Wolff-Parkin-son-White syndrome. Am J Cardiol. Jul 15 1992;70(2):200-204.
10. Poole JE, Bardy GH. Further evidence sup-porting the concept of T-wave memory: observation in patients having undergone high-energy direct current catheter ablation
of the Wolff-Parkinson-White syndrome. Eur Heart J. Jun 1992;13(6):801-807.
11. Helguera ME, Pinski SL, Sterba R, et al. Memory T waves after radiofrequency catheter ablation of accessory atrioven-tricular connections in Wolff-Parkinson-White syndrome. J Electrocardiol. Jul 1994;27(3):243-249.
12. Tomita Y, Hirai M, Yanagawa T, et al. Body surface distribution of significant changes in QRST time-integral values after radiof-requency catheter ablation in patients with Wolff-Parkinson-White syndrome. Am J Cardiol. Jan 1 1996;77(1):59-63.
13. Geller JC, Carlson MD, Goette A, et al. Per-sistent T-wave changes after radiofrequency catheter ablation of an accessory connec-tion (Wolff-parkinson-white syndrome) are caused by “cardiac memory”. Am Heart J. Nov 1999;138(5 Pt 1):987-993.
14. Rosenbaum MB, Blanco HH, Elizari MV, et al. Electrotonic modulation of the T wave and cardiac memory. Am J Cardiol. Aug 1982;50(2):213-222.
15. Rosen MR, Cohen IS, Danilo P, Jr., et al. The heart remembers. Cardiovasc Res. Dec 1998;40(3):469-482.
16. Kandel ER. Genes, nerve cells, and the re-membrance of things past. J Neuropsychiatry Clin Neurosci. Spring 1989;1(2):103-125.
17. Alessandrini RS, McPherson DD, Kadish AH, et al. Cardiac memory: a mechanical and electrical phenomenon. Am J Physiol. Apr 1997;272(4 Pt 2):H1952-1959.
18. Shvilkin A, Danilo P, Jr., Wang J, et al. Evolution and resolution of long-term cardiac memory. Circulation. May 12 1998;97(18):1810-1817.
19. Katz AM. T Wave “Memory”: Possible Caus-al Relationship to Stress-Induced Changes in Cardiac Ion Channels? J Cardiovasc Elec-trophysiol. Apr 1992;3(2):150-159.
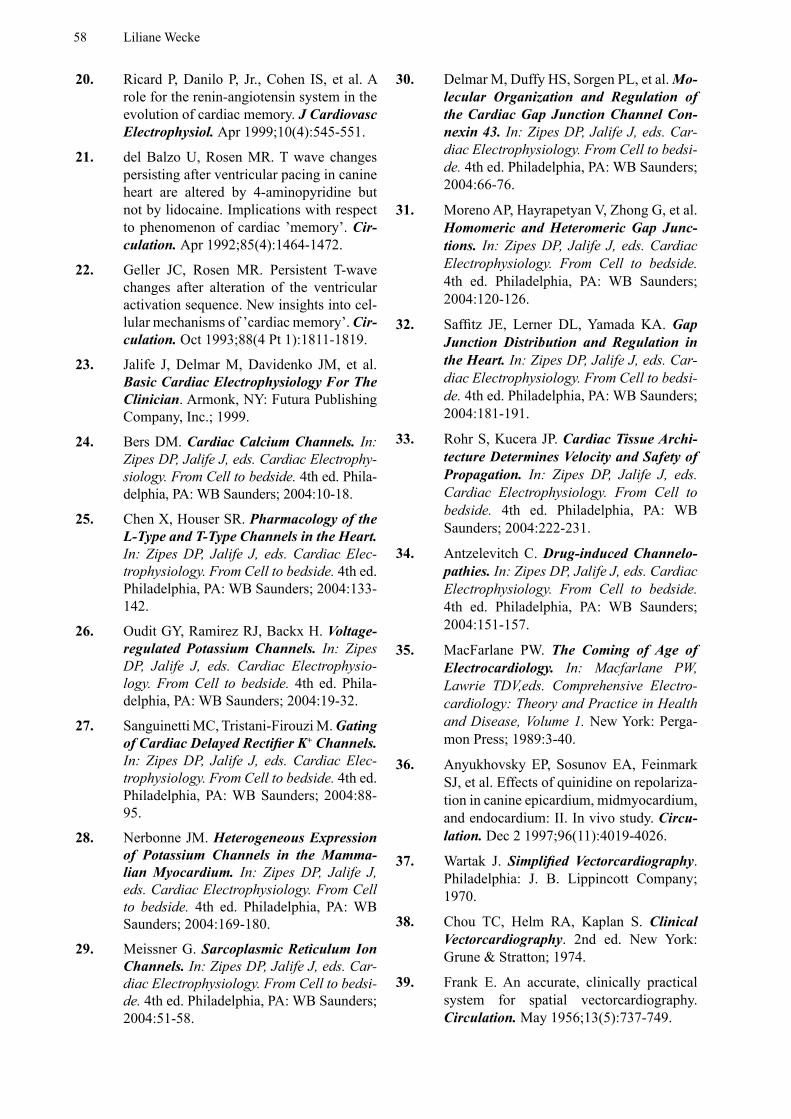
58 Liliane Wecke
20. Ricard P, Danilo P, Jr., Cohen IS, et al. A role for the renin-angiotensin system in the evolution of cardiac memory. J Cardiovasc Electrophysiol. Apr 1999;10(4):545-551.
21. del Balzo U, Rosen MR. T wave changes persisting after ventricular pacing in canine heart are altered by 4-aminopyridine but not by lidocaine. Implications with respect to phenomenon of cardiac ’memory’. Cir-culation. Apr 1992;85(4):1464-1472.
22. Geller JC, Rosen MR. Persistent T-wave changes after alteration of the ventricular activation sequence. New insights into cel-lular mechanisms of ’cardiac memory’. Cir-culation. Oct 1993;88(4 Pt 1):1811-1819.
23. Jalife J, Delmar M, Davidenko JM, et al. Basic Cardiac Electrophysiology For The Clinician. Armonk, NY: Futura Publishing Company, Inc.; 1999.
24. Bers DM. Cardiac Calcium Channels. In: Zipes DP, Jalife J, eds. Cardiac Electrophy-siology. From Cell to bedside. 4th ed. Phila-delphia, PA: WB Saunders; 2004:10-18.
25. Chen X, Houser SR. Pharmacology of the L-Type and T-Type Channels in the Heart. In: Zipes DP, Jalife J, eds. Cardiac Elec-trophysiology. From Cell to bedside. 4th ed. Philadelphia, PA: WB Saunders; 2004:133-142.
26. Oudit GY, Ramirez RJ, Backx H. Voltage-regulated Potassium Channels. In: Zipes DP, Jalife J, eds. Cardiac Electrophysio-logy. From Cell to bedside. 4th ed. Phila-delphia, PA: WB Saunders; 2004:19-32.
27. Sanguinetti MC, Tristani-Firouzi M. Gating of Cardiac Delayed Rectifier K+ Channels. In: Zipes DP, Jalife J, eds. Cardiac Elec-trophysiology. From Cell to bedside. 4th ed. Philadelphia, PA: WB Saunders; 2004:88-95.
28. Nerbonne JM. Heterogeneous Expression of Potassium Channels in the Mamma-lian Myocardium. In: Zipes DP, Jalife J, eds. Cardiac Electrophysiology. From Cell to bedside. 4th ed. Philadelphia, PA: WB Saunders; 2004:169-180.
29. Meissner G. Sarcoplasmic Reticulum Ion Channels. In: Zipes DP, Jalife J, eds. Car-diac Electrophysiology. From Cell to bedsi-de. 4th ed. Philadelphia, PA: WB Saunders; 2004:51-58.
30. Delmar M, Duffy HS, Sorgen PL, et al. Mo-lecular Organization and Regulation of the Cardiac Gap Junction Channel Con-nexin 43. In: Zipes DP, Jalife J, eds. Car-diac Electrophysiology. From Cell to bedsi-de. 4th ed. Philadelphia, PA: WB Saunders; 2004:66-76.
31. Moreno AP, Hayrapetyan V, Zhong G, et al. Homomeric and Heteromeric Gap Junc-tions. In: Zipes DP, Jalife J, eds. Cardiac Electrophysiology. From Cell to bedside. 4th ed. Philadelphia, PA: WB Saunders; 2004:120-126.
32. Saffitz JE, Lerner DL, Yamada KA. Gap Junction Distribution and Regulation in the Heart. In: Zipes DP, Jalife J, eds. Car-diac Electrophysiology. From Cell to bedsi-de. 4th ed. Philadelphia, PA: WB Saunders; 2004:181-191.
33. Rohr S, Kucera JP. Cardiac Tissue Archi-tecture Determines Velocity and Safety of Propagation. In: Zipes DP, Jalife J, eds. Cardiac Electrophysiology. From Cell to bedside. 4th ed. Philadelphia, PA: WB Saunders; 2004:222-231.
34. Antzelevitch C. Drug-induced Channelo-pathies. In: Zipes DP, Jalife J, eds. Cardiac Electrophysiology. From Cell to bedside. 4th ed. Philadelphia, PA: WB Saunders; 2004:151-157.
35. MacFarlane PW. The Coming of Age of Electrocardiology. In: Macfarlane PW, Lawrie TDV,eds. Comprehensive Electro-cardiology: Theory and Practice in Health and Disease, Volume 1. New York: Perga-mon Press; 1989:3-40.
36. Anyukhovsky EP, Sosunov EA, Feinmark SJ, et al. Effects of quinidine on repolariza-tion in canine epicardium, midmyocardium, and endocardium: II. In vivo study. Circu-lation. Dec 2 1997;96(11):4019-4026.
37. Wartak J. Simplified Vectorcardiography. Philadelphia: J. B. Lippincott Company; 1970.
38. Chou TC, Helm RA, Kaplan S. Clinical Vectorcardiography. 2nd ed. New York: Grune & Stratton; 1974.
39. Frank E. An accurate, clinically practical system for spatial vectorcardiography. Circulation. May 1956;13(5):737-749.
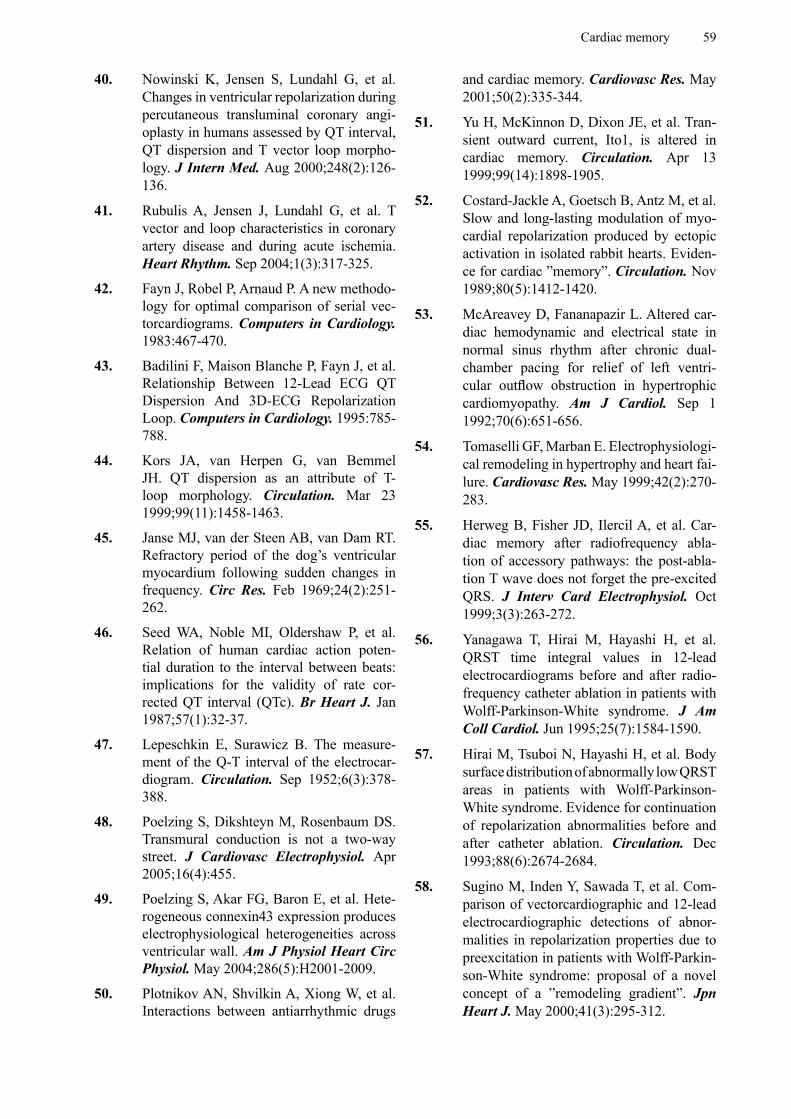
Cardiac memory 59
40. Nowinski K, Jensen S, Lundahl G, et al. Changes in ventricular repolarization during percutaneous transluminal coronary angi-oplasty in humans assessed by QT interval, QT dispersion and T vector loop morpho-logy. J Intern Med. Aug 2000;248(2):126-136.
41. Rubulis A, Jensen J, Lundahl G, et al. T vector and loop characteristics in coronary artery disease and during acute ischemia. Heart Rhythm. Sep 2004;1(3):317-325.
42. Fayn J, Robel P, Arnaud P. A new methodo-logy for optimal comparison of serial vec-torcardiograms. Computers in Cardiology. 1983:467-470.
43. Badilini F, Maison Blanche P, Fayn J, et al. Relationship Between 12-Lead ECG QT Dispersion And 3D-ECG Repolarization Loop. Computers in Cardiology. 1995:785-788.
44. Kors JA, van Herpen G, van Bemmel JH. QT dispersion as an attribute of T-loop morphology. Circulation. Mar 23 1999;99(11):1458-1463.
45. Janse MJ, van der Steen AB, van Dam RT. Refractory period of the dog’s ventricular myocardium following sudden changes in frequency. Circ Res. Feb 1969;24(2):251-262.
46. Seed WA, Noble MI, Oldershaw P, et al. Relation of human cardiac action poten-tial duration to the interval between beats: implications for the validity of rate cor-rected QT interval (QTc). Br Heart J. Jan 1987;57(1):32-37.
47. Lepeschkin E, Surawicz B. The measure-ment of the Q-T interval of the electrocar-diogram. Circulation. Sep 1952;6(3):378-388.
48. Poelzing S, Dikshteyn M, Rosenbaum DS. Transmural conduction is not a two-way street. J Cardiovasc Electrophysiol. Apr 2005;16(4):455.
49. Poelzing S, Akar FG, Baron E, et al. Hete-rogeneous connexin43 expression produces electrophysiological heterogeneities across ventricular wall. Am J Physiol Heart Circ Physiol. May 2004;286(5):H2001-2009.
50. Plotnikov AN, Shvilkin A, Xiong W, et al. Interactions between antiarrhythmic drugs
and cardiac memory. Cardiovasc Res. May 2001;50(2):335-344.
51. Yu H, McKinnon D, Dixon JE, et al. Tran-sient outward current, Ito1, is altered in cardiac memory. Circulation. Apr 13 1999;99(14):1898-1905.
52. Costard-Jackle A, Goetsch B, Antz M, et al. Slow and long-lasting modulation of myo-cardial repolarization produced by ectopic activation in isolated rabbit hearts. Eviden-ce for cardiac ”memory”. Circulation. Nov 1989;80(5):1412-1420.
53. McAreavey D, Fananapazir L. Altered car-diac hemodynamic and electrical state in normal sinus rhythm after chronic dual-chamber pacing for relief of left ventri-cular outflow obstruction in hypertrophic cardiomyopathy. Am J Cardiol. Sep 1 1992;70(6):651-656.
54. Tomaselli GF, Marban E. Electrophysiologi-cal remodeling in hypertrophy and heart fai-lure. Cardiovasc Res. May 1999;42(2):270-283.
55. Herweg B, Fisher JD, Ilercil A, et al. Car-diac memory after radiofrequency abla-tion of accessory pathways: the post-abla-tion T wave does not forget the pre-excited QRS. J Interv Card Electrophysiol. Oct 1999;3(3):263-272.
56. Yanagawa T, Hirai M, Hayashi H, et al. QRST time integral values in 12-lead electrocardiograms before and after radio-frequency catheter ablation in patients with Wolff-Parkinson-White syndrome. J Am Coll Cardiol. Jun 1995;25(7):1584-1590.
57. Hirai M, Tsuboi N, Hayashi H, et al. Body surface distribution of abnormally low QRST areas in patients with Wolff-Parkinson-White syndrome. Evidence for continuation of repolarization abnormalities before and after catheter ablation. Circulation. Dec 1993;88(6):2674-2684.
58. Sugino M, Inden Y, Sawada T, et al. Com-parison of vectorcardiographic and 12-lead electrocardiographic detections of abnor-malities in repolarization properties due to preexcitation in patients with Wolff-Parkin-son-White syndrome: proposal of a novel concept of a ”remodeling gradient”. Jpn Heart J. May 2000;41(3):295-312.
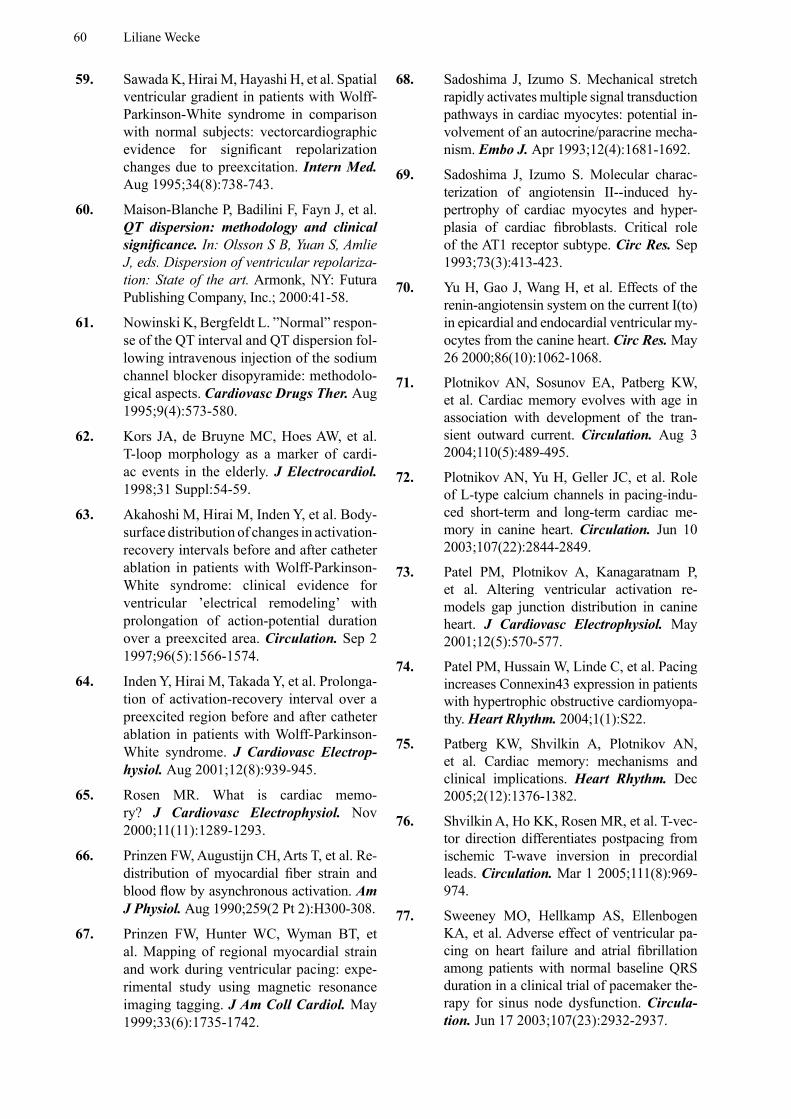
60 Liliane Wecke
59. Sawada K, Hirai M, Hayashi H, et al. Spatial ventricular gradient in patients with Wolff-Parkinson-White syndrome in comparison with normal subjects: vectorcardiographic evidence for significant repolarization changes due to preexcitation. Intern Med. Aug 1995;34(8):738-743.
60. Maison-Blanche P, Badilini F, Fayn J, et al. QT dispersion: methodology and clinical significance. In: Olsson S B, Yuan S, Amlie J, eds. Dispersion of ventricular repolariza-tion: State of the art. Armonk, NY: Futura Publishing Company, Inc.; 2000:41-58.
61. Nowinski K, Bergfeldt L. ”Normal” respon-se of the QT interval and QT dispersion fol-lowing intravenous injection of the sodium channel blocker disopyramide: methodolo-gical aspects. Cardiovasc Drugs Ther. Aug 1995;9(4):573-580.
62. Kors JA, de Bruyne MC, Hoes AW, et al. T-loop morphology as a marker of cardi-ac events in the elderly. J Electrocardiol. 1998;31 Suppl:54-59.
63. Akahoshi M, Hirai M, Inden Y, et al. Body-surface distribution of changes in activation-recovery intervals before and after catheter ablation in patients with Wolff-Parkinson-White syndrome: clinical evidence for ventricular ’electrical remodeling’ with prolongation of action-potential duration over a preexcited area. Circulation. Sep 2 1997;96(5):1566-1574.
64. Inden Y, Hirai M, Takada Y, et al. Prolonga-tion of activation-recovery interval over a preexcited region before and after catheter ablation in patients with Wolff-Parkinson-White syndrome. J Cardiovasc Electrop-hysiol. Aug 2001;12(8):939-945.
65. Rosen MR. What is cardiac memo-ry? J Cardiovasc Electrophysiol. Nov 2000;11(11):1289-1293.
66. Prinzen FW, Augustijn CH, Arts T, et al. Re-distribution of myocardial fiber strain and blood flow by asynchronous activation. Am J Physiol. Aug 1990;259(2 Pt 2):H300-308.
67. Prinzen FW, Hunter WC, Wyman BT, et al. Mapping of regional myocardial strain and work during ventricular pacing: expe-rimental study using magnetic resonance imaging tagging. J Am Coll Cardiol. May 1999;33(6):1735-1742.
68. Sadoshima J, Izumo S. Mechanical stretch rapidly activates multiple signal transduction pathways in cardiac myocytes: potential in-volvement of an autocrine/paracrine mecha-nism. Embo J. Apr 1993;12(4):1681-1692.
69. Sadoshima J, Izumo S. Molecular charac-terization of angiotensin II--induced hy-pertrophy of cardiac myocytes and hyper-plasia of cardiac fibroblasts. Critical role of the AT1 receptor subtype. Circ Res. Sep 1993;73(3):413-423.
70. Yu H, Gao J, Wang H, et al. Effects of the renin-angiotensin system on the current I(to) in epicardial and endocardial ventricular my-ocytes from the canine heart. Circ Res. May 26 2000;86(10):1062-1068.
71. Plotnikov AN, Sosunov EA, Patberg KW, et al. Cardiac memory evolves with age in association with development of the tran-sient outward current. Circulation. Aug 3 2004;110(5):489-495.
72. Plotnikov AN, Yu H, Geller JC, et al. Role of L-type calcium channels in pacing-indu-ced short-term and long-term cardiac me-mory in canine heart. Circulation. Jun 10 2003;107(22):2844-2849.
73. Patel PM, Plotnikov A, Kanagaratnam P, et al. Altering ventricular activation re-models gap junction distribution in canine heart. J Cardiovasc Electrophysiol. May 2001;12(5):570-577.
74. Patel PM, Hussain W, Linde C, et al. Pacing increases Connexin43 expression in patients with hypertrophic obstructive cardiomyopa-thy. Heart Rhythm. 2004;1(1):S22.
75. Patberg KW, Shvilkin A, Plotnikov AN, et al. Cardiac memory: mechanisms and clinical implications. Heart Rhythm. Dec 2005;2(12):1376-1382.
76. Shvilkin A, Ho KK, Rosen MR, et al. T-vec-tor direction differentiates postpacing from ischemic T-wave inversion in precordial leads. Circulation. Mar 1 2005;111(8):969-974.
77. Sweeney MO, Hellkamp AS, Ellenbogen KA, et al. Adverse effect of ventricular pa-cing on heart failure and atrial fibrillation among patients with normal baseline QRS duration in a clinical trial of pacemaker the-rapy for sinus node dysfunction. Circula-tion. Jun 17 2003;107(23):2932-2937.
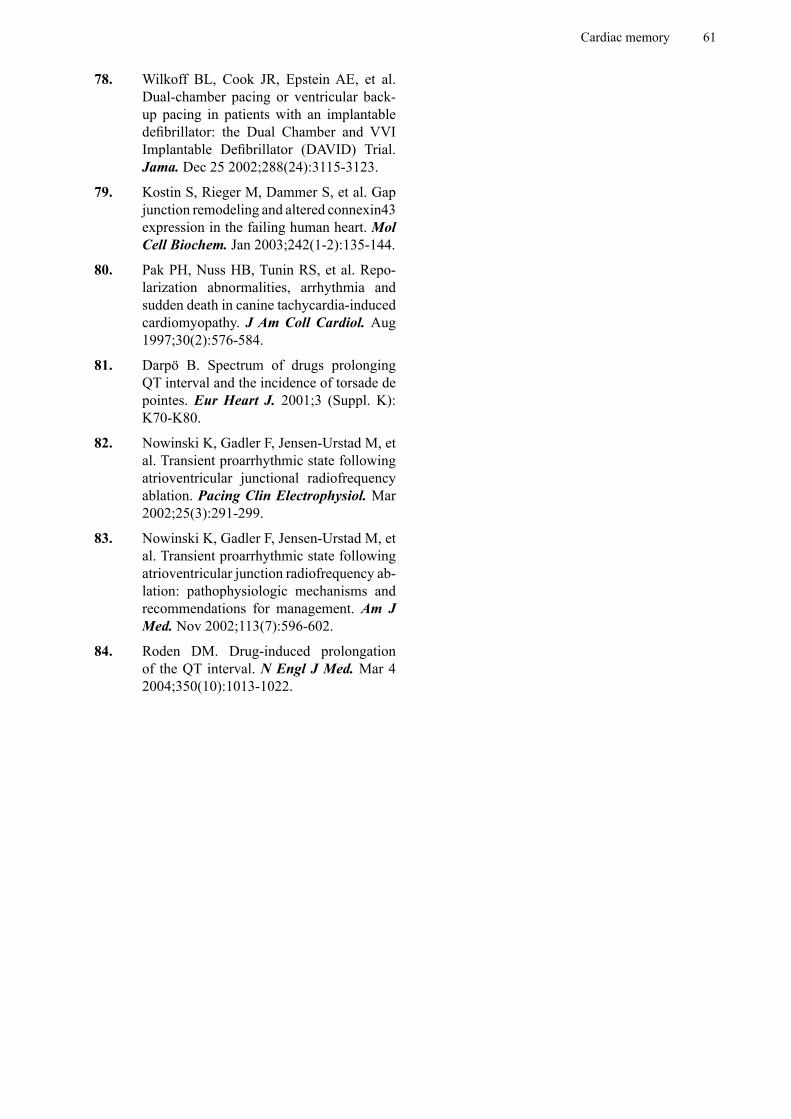
Cardiac memory 61
78. Wilkoff BL, Cook JR, Epstein AE, et al. Dual-chamber pacing or ventricular back-up pacing in patients with an implantable defibrillator: the Dual Chamber and VVI Implantable Defibrillator (DAVID) Trial. Jama. Dec 25 2002;288(24):3115-3123.
79. Kostin S, Rieger M, Dammer S, et al. Gap junction remodeling and altered connexin43 expression in the failing human heart. Mol Cell Biochem. Jan 2003;242(1-2):135-144.
80. Pak PH, Nuss HB, Tunin RS, et al. Repo-larization abnormalities, arrhythmia and sudden death in canine tachycardia-induced cardiomyopathy. J Am Coll Cardiol. Aug 1997;30(2):576-584.
81. Darpö B. Spectrum of drugs prolonging QT interval and the incidence of torsade de pointes. Eur Heart J. 2001;3 (Suppl. K):K70-K80.
82. Nowinski K, Gadler F, Jensen-Urstad M, et al. Transient proarrhythmic state following atrioventricular junctional radiofrequency ablation. Pacing Clin Electrophysiol. Mar 2002;25(3):291-299.
83. Nowinski K, Gadler F, Jensen-Urstad M, et al. Transient proarrhythmic state following atrioventricular junction radiofrequency ab-lation: pathophysiologic mechanisms and recommendations for management. Am J Med. Nov 2002;113(7):596-602.
84. Roden DM. Drug-induced prolongation of the QT interval. N Engl J Med. Mar 4 2004;350(10):1013-1022.
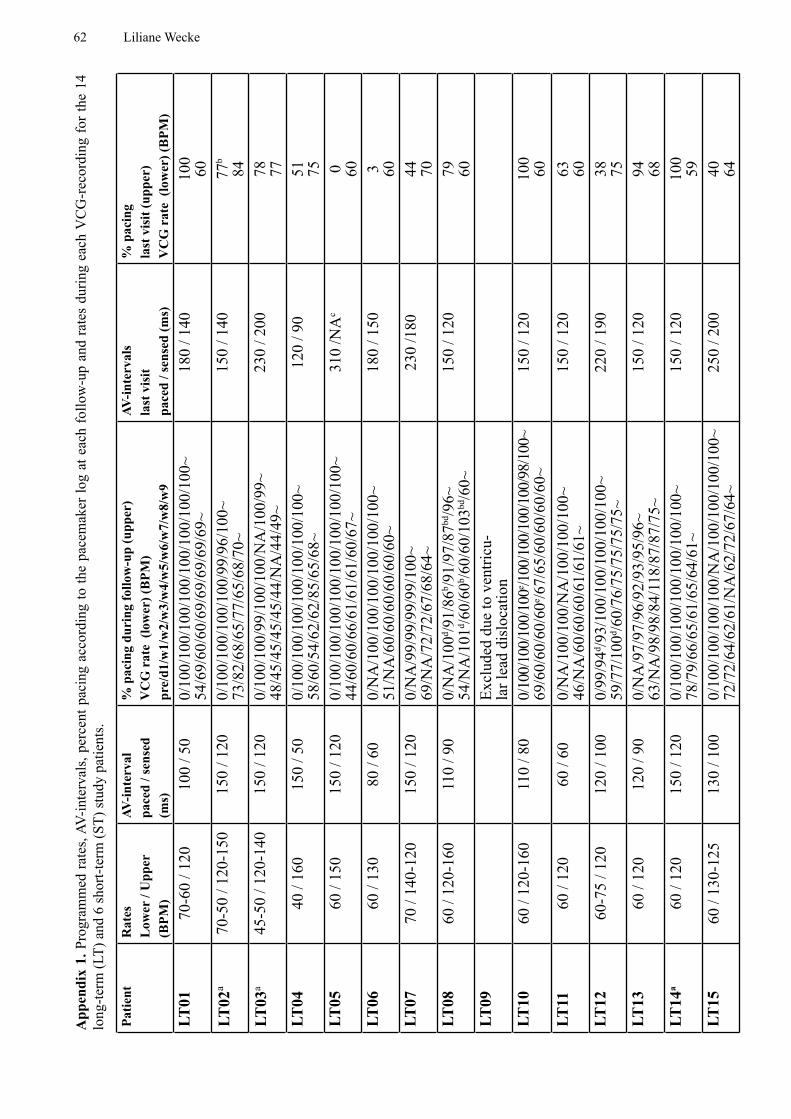
62 Liliane Wecke
Patie
ntR
ates
Low
er /
Upp
er(B
PM)
AV-in
terv
alpa
ced
/ sen
sed
(ms)
% p
acin
g du
ring
follo
w-u
p (u
pper
)V
CG
rat
e (l
ower
) (B
PM)
pre/
d1/w
1/w
2/w
3/w
4/w
5/w
6/w
7/w
8/w
9
AV-in
terv
als
last
vis
it pa
ced
/ sen
sed
(ms)
% p
acin
g la
st v
isit
(upp
er)
VC
G r
ate
(low
er) (
BPM
)LT
0170
-60
/ 120
100
/ 50
0/10
0/10
0/10
0/10
0/10
0/10
0/10
0/10
0~54
/69/
60/6
0/69
/69/
69/6
9/69
~18
0 / 1
4010
060
LT02
a70
-50
/ 120
-150
150
/ 120
0/10
0/10
0/10
0/10
0/99
/96/
100~
73
/82/
68/6
5/77
/65/
68/7
0~15
0 / 1
4077
b
84LT
03a
45-5
0 / 1
20-1
4015
0 / 1
200/
100/
100/
99/1
00/1
00/N
A/1
00/9
9~48
/45/
45/4
5/45
/44/
NA
/44/
49~
230
/ 200
78 77LT
0440
/ 16
015
0 / 5
00/
100/
100/
100/
100/
100/
100/
100~
58/6
0/54
/62/
62/8
5/65
/68~
120
/ 90
51 75LT
0560
/ 15
015
0 / 1
200/
100/
100/
100/
100/
100/
100/
100/
100~
44
/60/
60/6
6/61
/61/
61/6
0/67
~31
0 /N
Ac
0 60LT
0660
/ 13
080
/ 60
0/N
A/1
00/1
00/1
00/1
00/1
00/1
00~
51/N
A/6
0/60
/60/
60/6
0/60
~18
0 / 1
503 60
LT07
70 /
140-
120
150
/ 120
0/N
A/9
9/99
/99/
99/1
00~
69/N
A/7
2/72
/67/
68/6
4~23
0 /1
8044 70
LT08
60 /
120-
160
110
/ 90
0/N
A/1
00d /9
1/86
b /91/
97/8
7bd/9
6~54
/NA
/101
d /60/
60b /6
0/60
/103
bd/6
0~15
0 / 1
2079 60
LT09
Excl
uded
due
to v
entri
cu-
lar l
ead
disl
ocat
ion
LT10
60 /
120-
160
110
/ 80
0/10
0/10
0/10
0/10
0e /100
/100
/100
/100
/98/
100~
69
/60/
60/6
0/60
e /67/
65/6
0/60
/60/
60~
150
/ 120
100
60LT
1160
/ 12
060
/ 60
0/N
A/1
00/1
00/N
A/1
00/1
00/1
00~
46/N
A/6
0/60
/60/
61/6
1/61
~15
0 / 1
2063 60
LT12
60-7
5 / 1
2012
0 / 1
000/
99/9
4d /93/
100/
100/
100/
100/
100~
59
/77/
100d /6
0/76
/75/
75/7
5/75
~22
0 / 1
9038 75
LT13
60 /
120
120
/ 90
0/N
A/9
7/97
/96/
92/9
3/95
/96~
63
/NA
/98/
98/8
4/11
8/87
/87/
75~
150
/ 120
94 68LT
14a
60 /
120
150
/ 120
0/10
0/10
0/10
0/10
0/10
0/10
0/10
0~
78/7
9/66
/65/
61/6
5/64
/61~
150
/ 120
100
59LT
1560
/ 13
0-12
513
0 / 1
000/
100/
100/
100/
100/
NA
/100
/100
/100
/100
~ 72
/72/
64/6
2/61
/NA
/62/
72/6
7/64
~25
0 / 2
0040 64
App
endi
x 1.
Pro
gram
med
rate
s, AV
-inte
rval
s, pe
rcen
t pac
ing
acco
rdin
g to
the
pace
mak
er lo
g at
eac
h fo
llow
-up
and
rate
s du
ring
each
VC
G-r
ecor
ding
for t
he 1
4 lo
ng-te
rm (L
T) a
nd 6
shor
t-ter
m (S
T) st
udy
patie
nts.
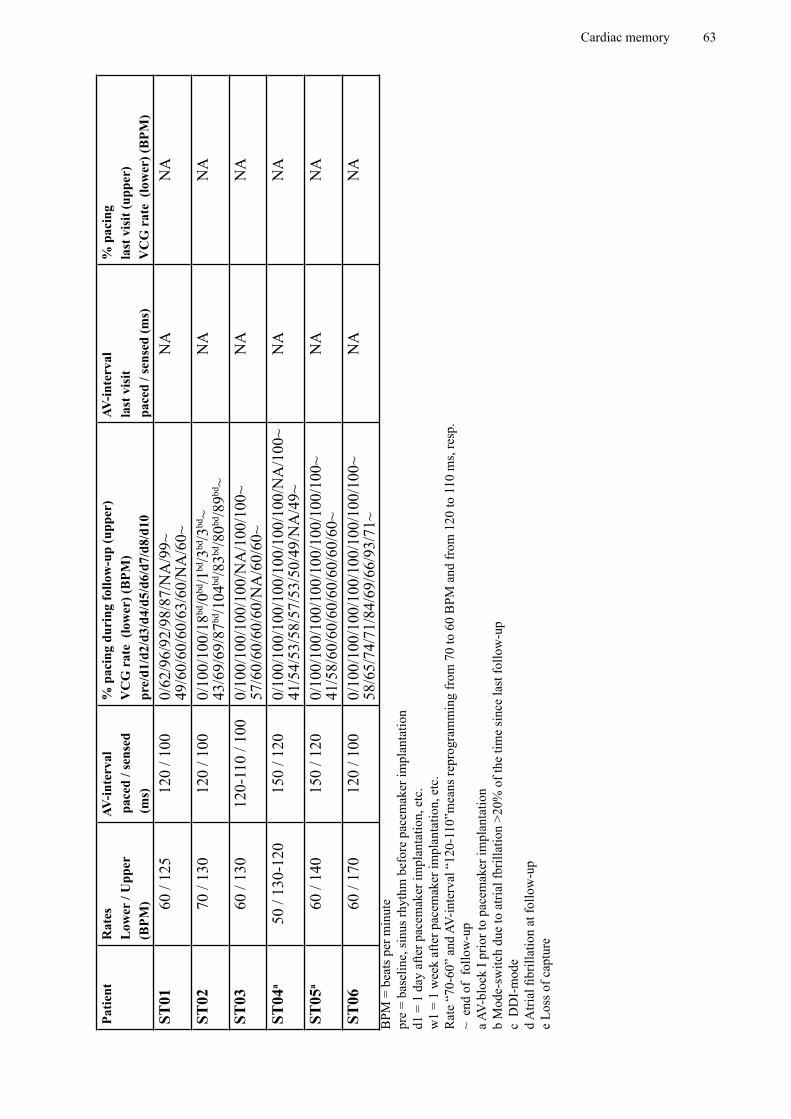
Cardiac memory 63
Patie
ntR
ates
Low
er /
Upp
er(B
PM)
AV-in
terv
al p
aced
/ se
nsed
(ms)
% p
acin
g du
ring
follo
w-u
p (u
pper
)V
CG
rat
e (l
ower
) (B
PM)
pre/
d1/d
2/d3
/d4/
d5/d
6/d7
/d8/
d10
AV-in
terv
alla
st v
isit
pace
d / s
ense
d (m
s)
% p
acin
g la
st v
isit
(upp
er)
VC
G r
ate
(low
er) (
BPM
)ST
0160
/ 12
512
0 / 1
000/
62/9
6/92
/98/
87/N
A/9
9~
49/6
0/60
/60/
63/6
0/N
A/6
0~N
AN
A
ST02
70 /
130
120
/ 100
0/10
0/10
0/18
bd/0
bd/1
bd/3
bd/3
bd~
43/6
9/69
/87bd
/104
bd/8
3bd/8
0bd/8
9bd~
NA
NA
ST03
60 /
130
120-
110
/ 100
0/10
0/10
0/10
0/10
0/N
A/1
00/1
00~
57/6
0/60
/60/
60/N
A/6
0/60
~N
AN
A
ST04
a50
/ 13
0-12
015
0 / 1
200/
100/
100/
100/
100/
100/
100/
100/
NA
/100
~ 41
/54/
53/5
8/57
/53/
50/4
9/N
A/4
9~N
AN
A
ST05
a60
/ 14
015
0 / 1
200/
100/
100/
100/
100/
100/
100/
100/
100~
41
/58/
60/6
0/60
/60/
60/6
0/60
~N
AN
A
ST06
60 /
170
120
/ 100
0/10
0/10
0/10
0/10
0/10
0/10
0/10
0/10
0~
58/6
5/74
/71/
84/6
9/66
/93/
71~
NA
NA
BPM
= b
eats
per
min
ute
pre
= ba
selin
e, si
nus r
hyth
m b
efor
e pa
cem
aker
impl
anta
tion
d1 =
1 d
ay a
fter p
acem
aker
impl
anta
tion,
etc
.w
1 =
1 w
eek
afte
r pac
emak
er im
plan
tatio
n, e
tc.
Rat
e “7
0-60
” an
d AV
-inte
rval
“12
0-11
0”m
eans
repr
ogra
mm
ing
from
70
to 6
0 B
PM a
nd fr
om 1
20 to
110
ms,
resp
.~
end
of
follo
w-u
p a A
V-bl
ock
I prio
r to
pace
mak
er im
plan
tatio
nb
Mod
e-sw
itch
due
to a
trial
fbril
latio
n >2
0% o
f the
tim
e si
nce
last
follo
w-u
pc
DD
I-m
ode
d A
trial
fibr
illat
ion
at fo
llow
-up
e Lo
ss o
f cap
ture