Embed Size (px)
Citation preview
1
The Heart Centre
Cardiac Monitoring: ECG
Interpretation and Analysis
2
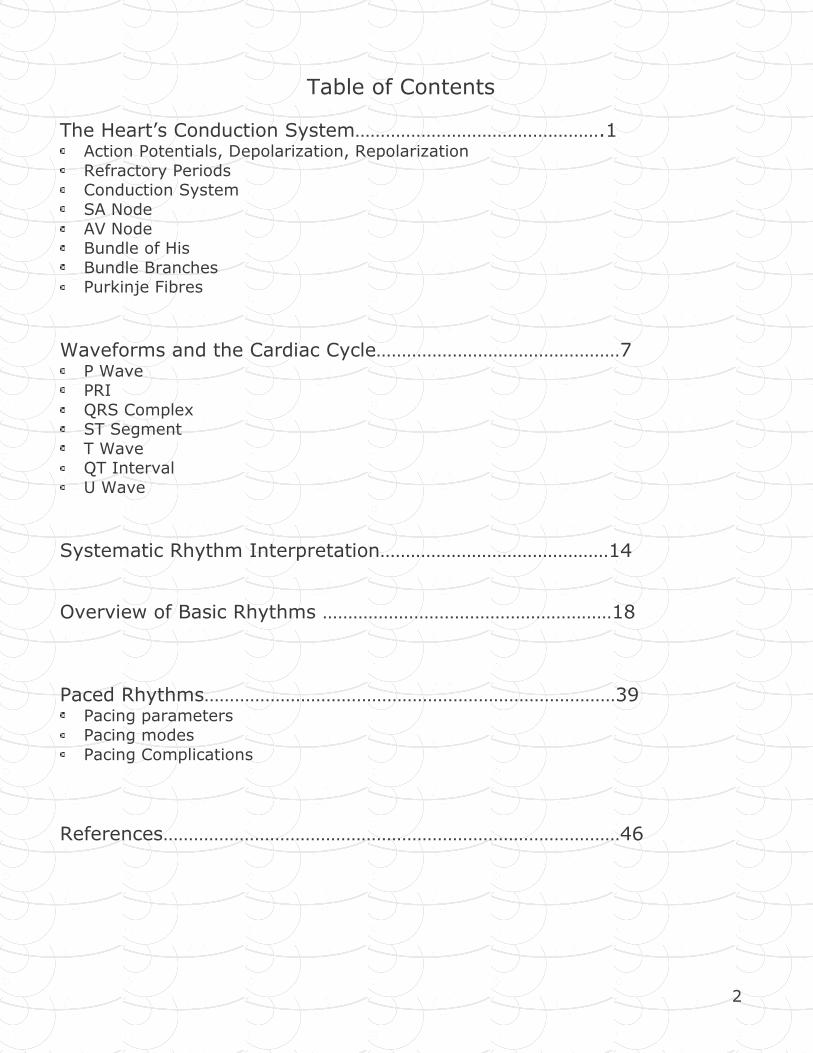
Table of Contents
The Heart’s Conduction System………………………………………….1 Action Potentials, Depolarization, Repolarization
Refractory Periods Conduction System
SA Node
AV Node Bundle of His
Bundle Branches Purkinje Fibres
Waveforms and the Cardiac Cycle…………………………………………7 P Wave PRI
QRS Complex ST Segment
T Wave QT Interval
U Wave
Systematic Rhythm Interpretation………………………………………14
Overview of Basic Rhythms …………………………………………………18
Paced Rhythms………………………………………………………………………39 Pacing parameters
Pacing modes
Pacing Complications
References………………………………………………………………………………46
3
Read pages 1-20 in ECGs Made Easy, Anatomy and Physiology, for a review of basic cardiac structure and function prior to beginning this course as a solid
understanding is needed to be successful.
The Heart’s Conduction System
Cardiac cells have four primary characteristics:
automaticity –the ability of the pacemaker cells to generate their own electrical
impulses spontaneously
excitability - the ability of the cells to respond to an electrical impulse
conductivity – the ability of cells to conduct an electrical impulse
contractility – the ability of cells to cause muscle contraction
There are two kinds of cardiac cells – myocardial cells and pacemaker cells. Myocardial cells, or “worker” cells, are found in the muscular layer of the walls of
the atria and ventricles. These cells are permeated by contractile filaments which when stimulated electrically produce muscle contraction. The primary job of
myocardial cells is muscle contraction and relaxation.
The heart is a pump driven by electrical signals generated by all the cardiac muscle cells but certain groups of cells are given the responsibility of “running the show”.
These are called the pacemaker cells and they can set the pace of the heart
rhythm. The pacemaker cells generate the electrical signal that gets sent in turn to every other cell in the heart and ultimately leads to cardiac muscle contraction.
They are able to generate this signal without any external force or stimulation; a unique ability of cardiac cells that is called automaticity.
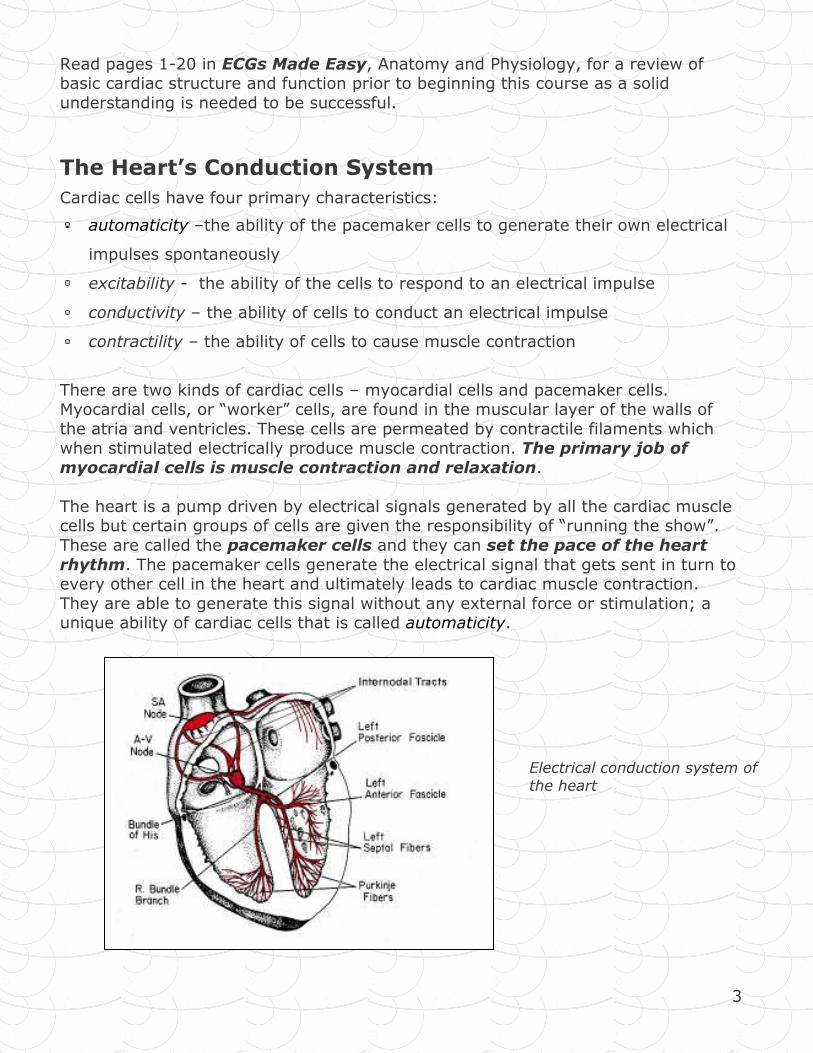
Electrical conduction system of
the heart
4
Action Potential, Depolarization and Repolarization
An Action potential is a five phase cycle that reflects the difference in the
concentration of ions across the cell membrane at any given time. Cardiac cells are filled with ions (electrically charged molecules). Potassium (K+) is the main ion
inside cells and sodium (Na+) is the main ion outside cells. Calcium, bicarbonate, and chloride are also present but we will focus on K+ and Na+.
A membrane separates the inside of the cells from the outside of the cell. Ions are constantly moving across this membrane through membrane channels. The
difference in the concentration of the ions will determine the cell’s electrical charge.
In the resting cell there are more negative ions inside the cell than outside. This resting state is called polarized. During this time no electrical activity is occurring
and a straight line (isoelectric line) is recorded on the ECG.
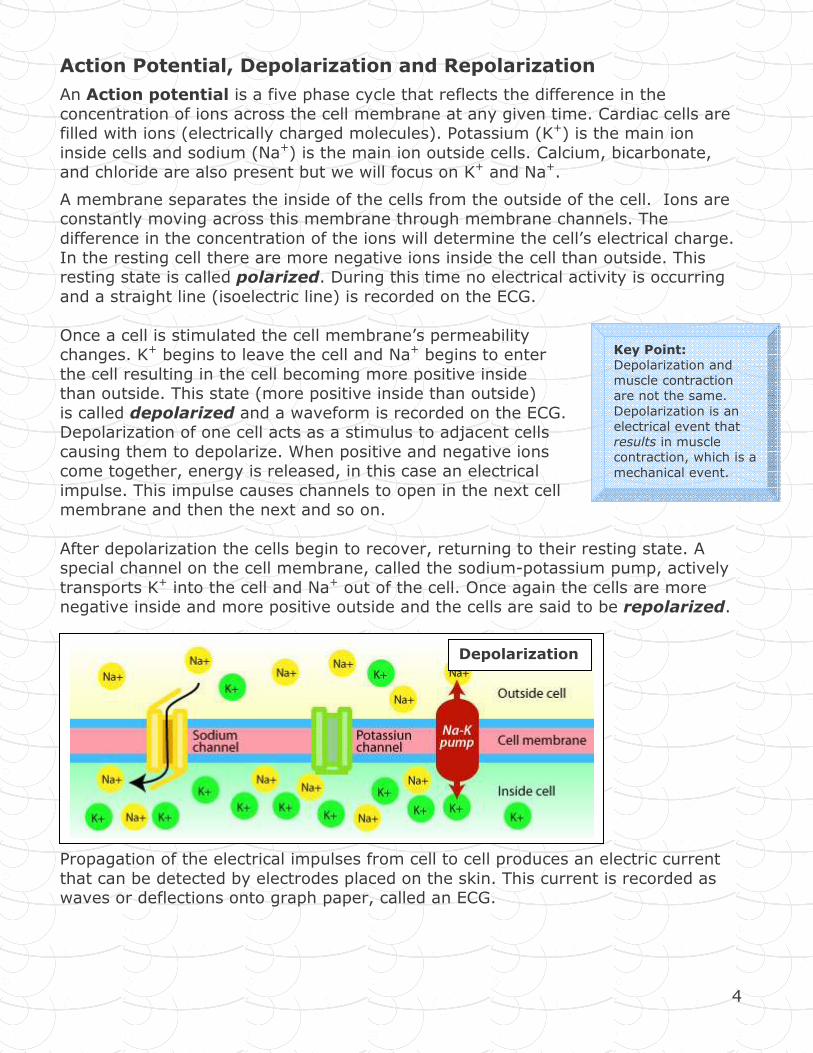
Once a cell is stimulated the cell membrane’s permeability changes. K+ begins to leave the cell and Na+ begins to enter
the cell resulting in the cell becoming more positive inside than outside. This state (more positive inside than outside)
is called depolarized and a waveform is recorded on the ECG. Depolarization of one cell acts as a stimulus to adjacent cells
causing them to depolarize. When positive and negative ions come together, energy is released, in this case an electrical
impulse. This impulse causes channels to open in the next cell membrane and then the next and so on.
After depolarization the cells begin to recover, returning to their resting state. A special channel on the cell membrane, called the sodium-potassium pump, actively
transports K+ into the cell and Na+ out of the cell. Once again the cells are more negative inside and more positive outside and the cells are said to be repolarized.
Propagation of the electrical impulses from cell to cell produces an electric current
that can be detected by electrodes placed on the skin. This current is recorded as waves or deflections onto graph paper, called an ECG.
Depolarization
Key Point:
Depolarization and
muscle contraction
are not the same.
Depolarization is an
electrical event that
results in muscle
contraction, which is a
mechanical event.
5
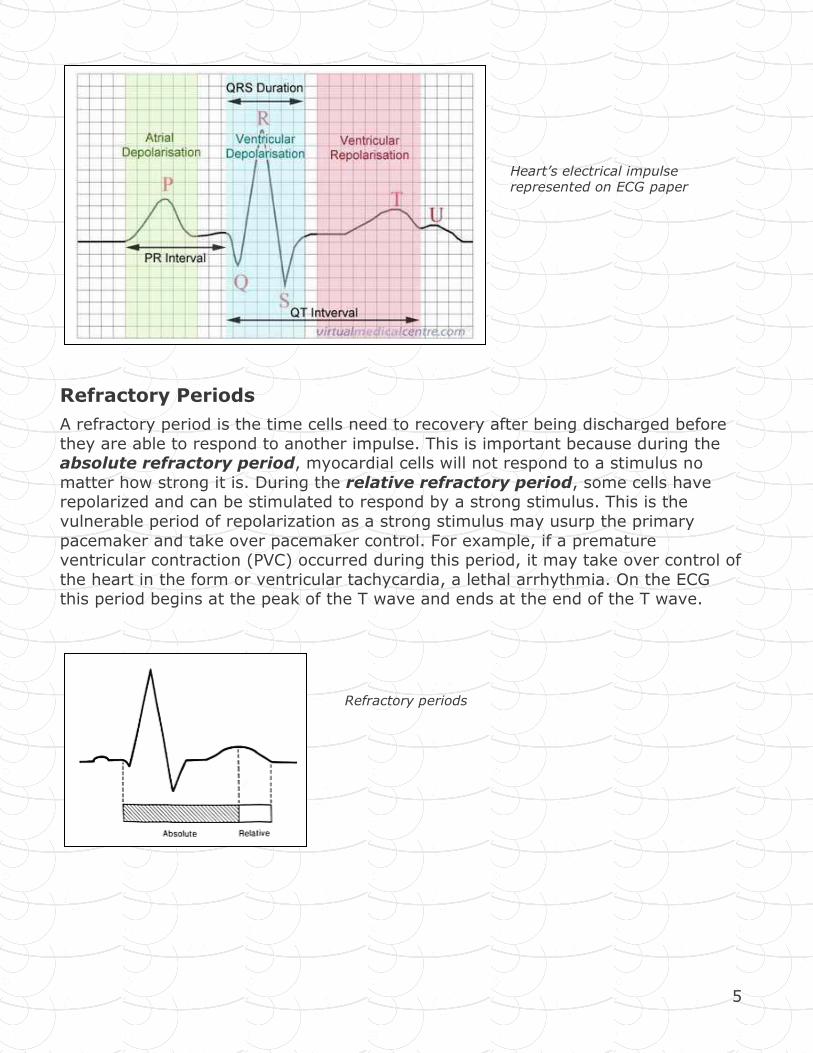
Refractory Periods
A refractory period is the time cells need to recovery after being discharged before
they are able to respond to another impulse. This is important because during the absolute refractory period, myocardial cells will not respond to a stimulus no
matter how strong it is. During the relative refractory period, some cells have repolarized and can be stimulated to respond by a strong stimulus. This is the
vulnerable period of repolarization as a strong stimulus may usurp the primary
pacemaker and take over pacemaker control. For example, if a premature ventricular contraction (PVC) occurred during this period, it may take over control of
the heart in the form or ventricular tachycardia, a lethal arrhythmia. On the ECG this period begins at the peak of the T wave and ends at the end of the T wave.
Heart’s electrical impulse represented on ECG paper
Refractory periods
6
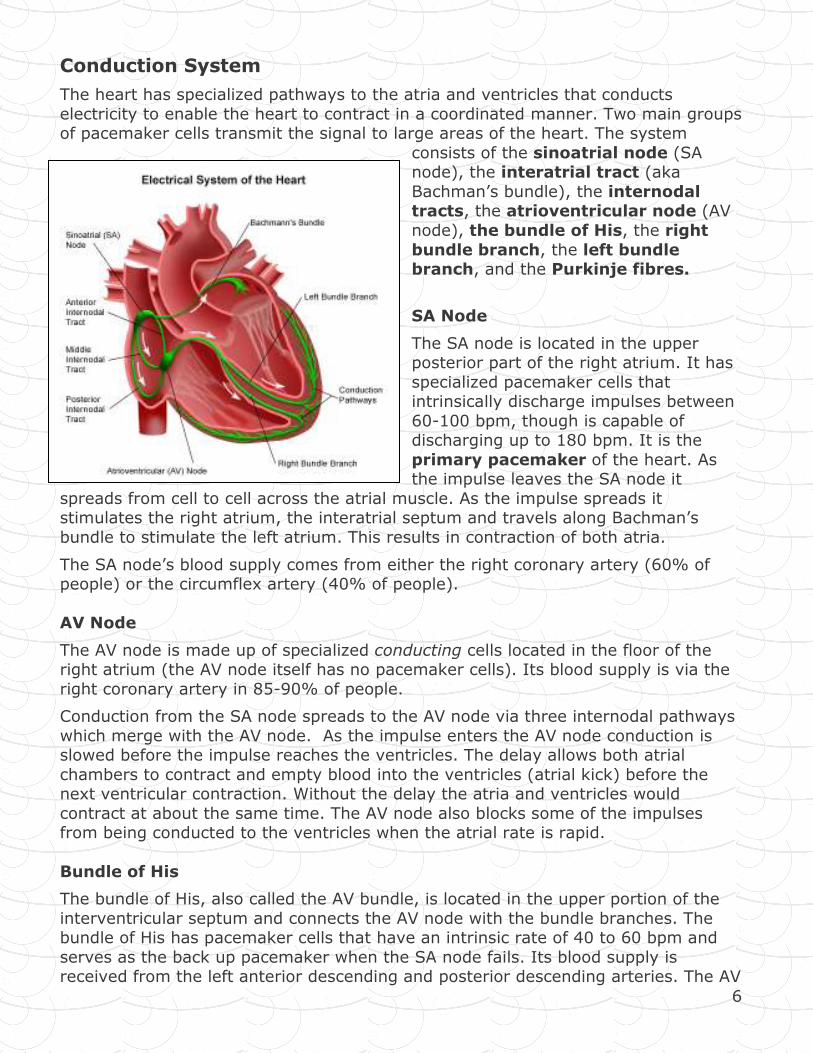
Conduction System
The heart has specialized pathways to the atria and ventricles that conducts
electricity to enable the heart to contract in a coordinated manner. Two main groups of pacemaker cells transmit the signal to large areas of the heart. The system
consists of the sinoatrial node (SA node), the interatrial tract (aka
Bachman’s bundle), the internodal tracts, the atrioventricular node (AV
node), the bundle of His, the right
bundle branch, the left bundle branch, and the Purkinje fibres.
SA Node
The SA node is located in the upper posterior part of the right atrium. It has
specialized pacemaker cells that intrinsically discharge impulses between
60-100 bpm, though is capable of discharging up to 180 bpm. It is the
primary pacemaker of the heart. As the impulse leaves the SA node it
spreads from cell to cell across the atrial muscle. As the impulse spreads it stimulates the right atrium, the interatrial septum and travels along Bachman’s
bundle to stimulate the left atrium. This results in contraction of both atria.
The SA node’s blood supply comes from either the right coronary artery (60% of people) or the circumflex artery (40% of people).
AV Node
The AV node is made up of specialized conducting cells located in the floor of the right atrium (the AV node itself has no pacemaker cells). Its blood supply is via the
right coronary artery in 85-90% of people.
Conduction from the SA node spreads to the AV node via three internodal pathways
which merge with the AV node. As the impulse enters the AV node conduction is slowed before the impulse reaches the ventricles. The delay allows both atrial
chambers to contract and empty blood into the ventricles (atrial kick) before the next ventricular contraction. Without the delay the atria and ventricles would
contract at about the same time. The AV node also blocks some of the impulses from being conducted to the ventricles when the atrial rate is rapid.
Bundle of His
The bundle of His, also called the AV bundle, is located in the upper portion of the
interventricular septum and connects the AV node with the bundle branches. The bundle of His has pacemaker cells that have an intrinsic rate of 40 to 60 bpm and
serves as the back up pacemaker when the SA node fails. Its blood supply is received from the left anterior descending and posterior descending arteries. The AV
7
node and the bundle of His are called the AV junction. The His-Purkinje system refers to the bundle of His, bundle branches, and the Purkinje fibres.
Bundle Branches
After the impulse moves through the bundle of His it proceeds through to the bundle branches. The right bundle branch conducts the electrical impulse to the
right ventricle and the left bundle branch conducts to the left ventricle. The left bundle is made up of two smaller branches called fascicles that conduct the
electrical signal to the anterior and posterior walls of the ventricle.
Purkinje Fibres
Both the right and left branches divide into a network of conduction fibres called the
Purkinje fibres that spread through the interventricular septum into the papillary muscle and down to the apex of the heart. The fibres then become part of the
muscle cells of the ventricles. The intrinsic rate of the Purkinje fibres pacemaker cells is 20 to 40 bpm. The electrical impulse moves from the endocardium to the
myocardium to the epicardium and the ventricles contract in a twisting motion that
wrings blood out of the ventricles and into arteries.
8
Waveforms and the Cardiac Cycle
ECG Paper
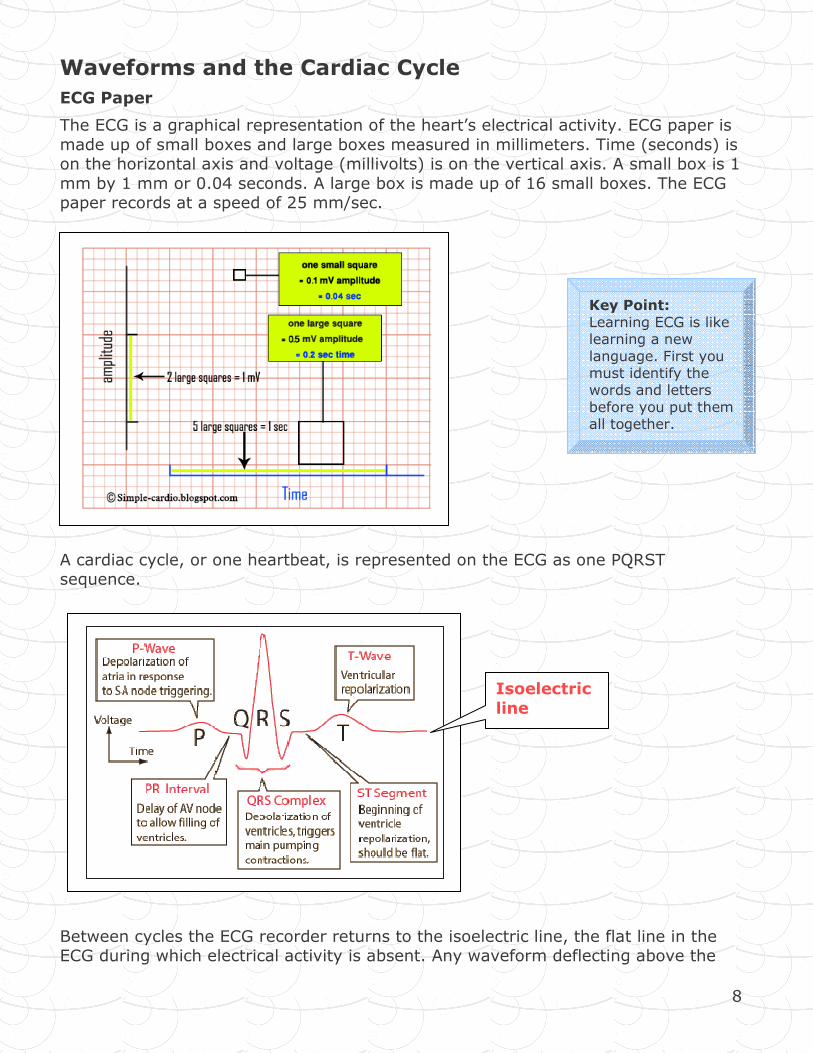
The ECG is a graphical representation of the heart’s electrical activity. ECG paper is
made up of small boxes and large boxes measured in millimeters. Time (seconds) is on the horizontal axis and voltage (millivolts) is on the vertical axis. A small box is 1
mm by 1 mm or 0.04 seconds. A large box is made up of 16 small boxes. The ECG paper records at a speed of 25 mm/sec.
A cardiac cycle, or one heartbeat, is represented on the ECG as one PQRST sequence.
Between cycles the ECG recorder returns to the isoelectric line, the flat line in the ECG during which electrical activity is absent. Any waveform deflecting above the
Isoelectric
line
Key Point:
Learning ECG is like learning a new
language. First you must identify the words and letters
before you put them all together.
9
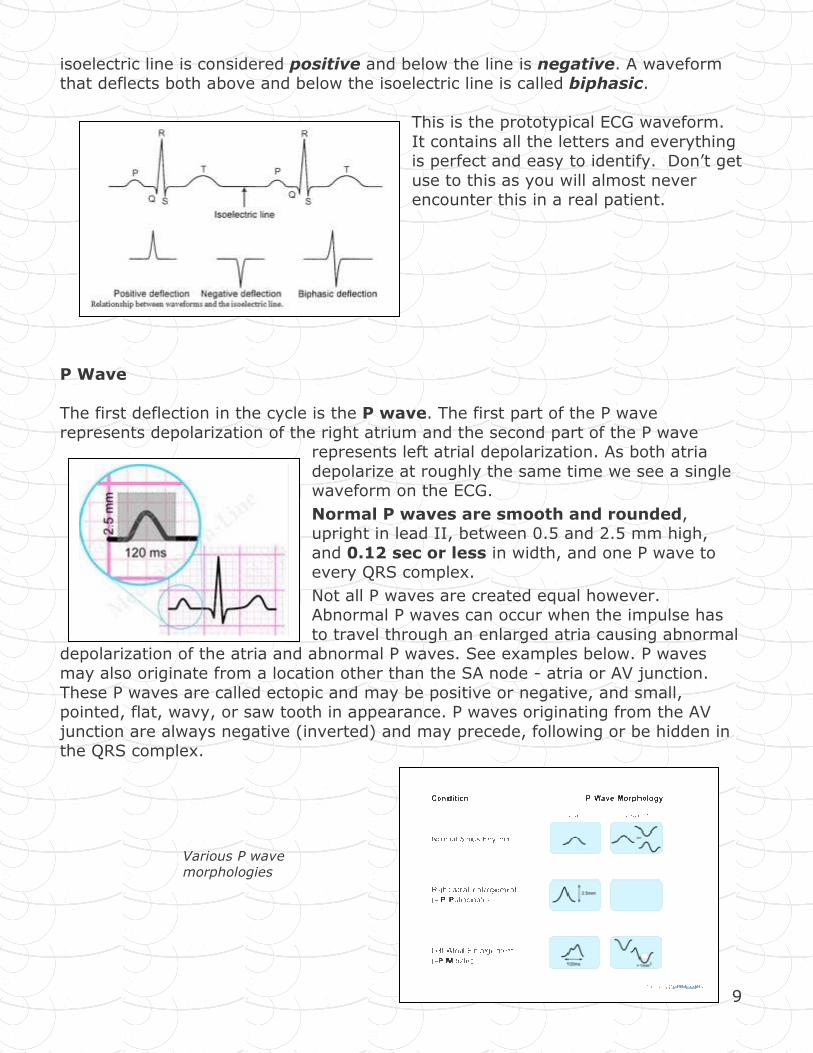
isoelectric line is considered positive and below the line is negative. A waveform that deflects both above and below the isoelectric line is called biphasic.
This is the prototypical ECG waveform.
It contains all the letters and everything is perfect and easy to identify. Don’t get
use to this as you will almost never encounter this in a real patient.
P Wave
The first deflection in the cycle is the P wave. The first part of the P wave
represents depolarization of the right atrium and the second part of the P wave represents left atrial depolarization. As both atria
depolarize at roughly the same time we see a single waveform on the ECG.
Normal P waves are smooth and rounded, upright in lead II, between 0.5 and 2.5 mm high,
and 0.12 sec or less in width, and one P wave to every QRS complex.
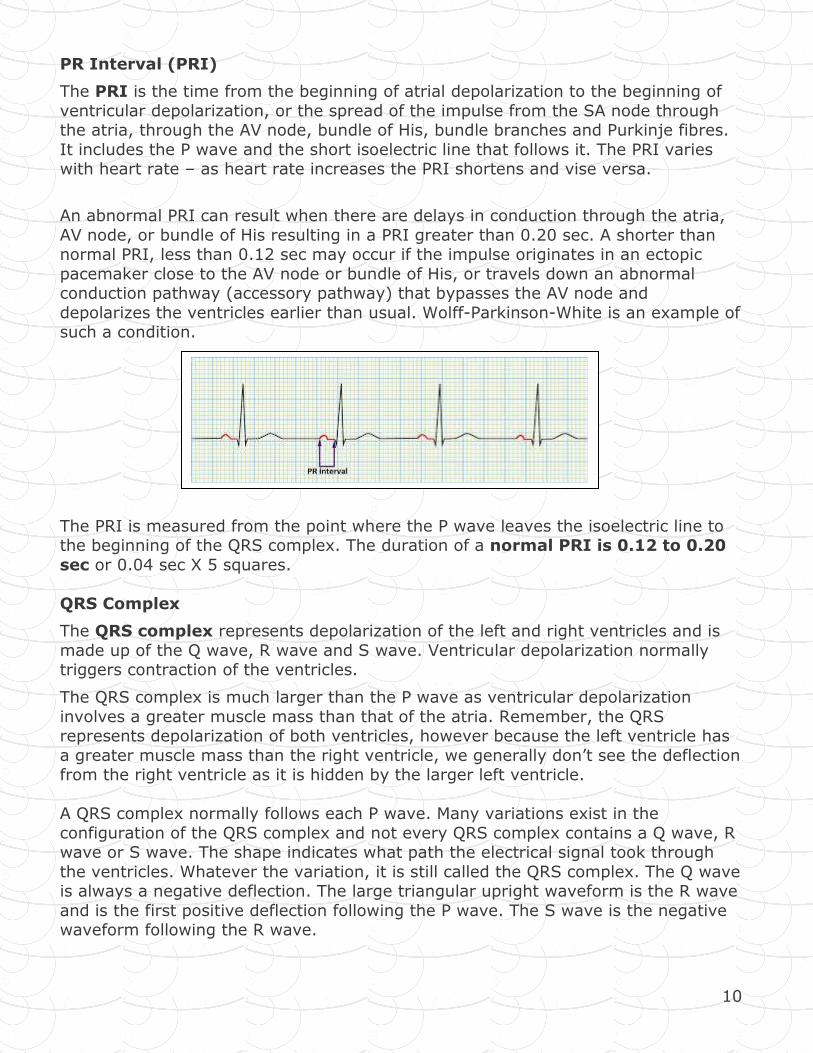
Not all P waves are created equal however. Abnormal P waves can occur when the impulse has
to travel through an enlarged atria causing abnormal depolarization of the atria and abnormal P waves. See examples below. P waves
may also originate from a location other than the SA node - atria or AV junction.
These P waves are called ectopic and may be positive or negative, and small, pointed, flat, wavy, or saw tooth in appearance. P waves originating from the AV
junction are always negative (inverted) and may precede, following or be hidden in the QRS complex.
Various P wave morphologies
10
PR Interval (PRI)
The PRI is the time from the beginning of atrial depolarization to the beginning of
ventricular depolarization, or the spread of the impulse from the SA node through the atria, through the AV node, bundle of His, bundle branches and Purkinje fibres.
It includes the P wave and the short isoelectric line that follows it. The PRI varies with heart rate – as heart rate increases the PRI shortens and vise versa.
An abnormal PRI can result when there are delays in conduction through the atria,
AV node, or bundle of His resulting in a PRI greater than 0.20 sec. A shorter than normal PRI, less than 0.12 sec may occur if the impulse originates in an ectopic
pacemaker close to the AV node or bundle of His, or travels down an abnormal conduction pathway (accessory pathway) that bypasses the AV node and
depolarizes the ventricles earlier than usual. Wolff-Parkinson-White is an example of such a condition.
The PRI is measured from the point where the P wave leaves the isoelectric line to the beginning of the QRS complex. The duration of a normal PRI is 0.12 to 0.20
sec or 0.04 sec X 5 squares.
QRS Complex
The QRS complex represents depolarization of the left and right ventricles and is
made up of the Q wave, R wave and S wave. Ventricular depolarization normally triggers contraction of the ventricles.
The QRS complex is much larger than the P wave as ventricular depolarization
involves a greater muscle mass than that of the atria. Remember, the QRS represents depolarization of both ventricles, however because the left ventricle has
a greater muscle mass than the right ventricle, we generally don’t see the deflection from the right ventricle as it is hidden by the larger left ventricle.
A QRS complex normally follows each P wave. Many variations exist in the
configuration of the QRS complex and not every QRS complex contains a Q wave, R wave or S wave. The shape indicates what path the electrical signal took through
the ventricles. Whatever the variation, it is still called the QRS complex. The Q wave is always a negative deflection. The large triangular upright waveform is the R wave
and is the first positive deflection following the P wave. The S wave is the negative waveform following the R wave.
11
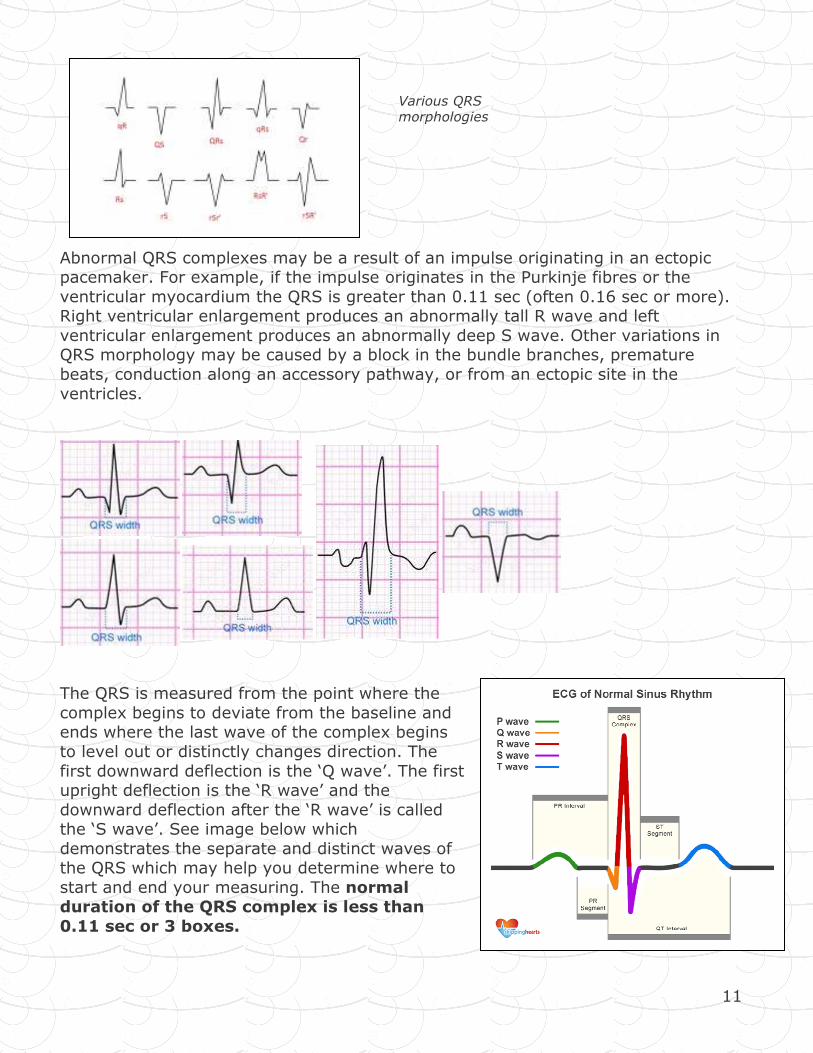
Abnormal QRS complexes may be a result of an impulse originating in an ectopic pacemaker. For example, if the impulse originates in the Purkinje fibres or the
ventricular myocardium the QRS is greater than 0.11 sec (often 0.16 sec or more). Right ventricular enlargement produces an abnormally tall R wave and left
ventricular enlargement produces an abnormally deep S wave. Other variations in QRS morphology may be caused by a block in the bundle branches, premature
beats, conduction along an accessory pathway, or from an ectopic site in the
ventricles.
The QRS is measured from the point where the
complex begins to deviate from the baseline and ends where the last wave of the complex begins
to level out or distinctly changes direction. The
first downward deflection is the ‘Q wave’. The first upright deflection is the ‘R wave’ and the
downward deflection after the ‘R wave’ is called the ‘S wave’. See image below which
demonstrates the separate and distinct waves of the QRS which may help you determine where to
start and end your measuring. The normal duration of the QRS complex is less than
0.11 sec or 3 boxes.
Various QRS morphologies
12
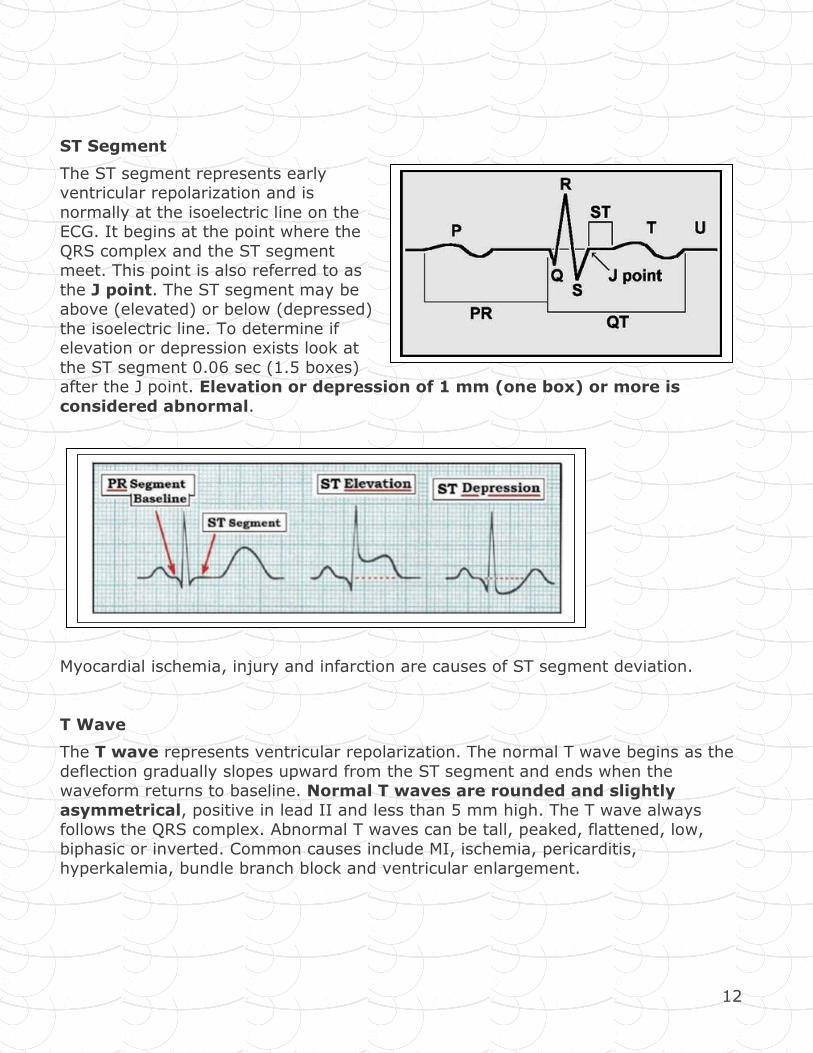
ST Segment
The ST segment represents early ventricular repolarization and is
normally at the isoelectric line on the ECG. It begins at the point where the
QRS complex and the ST segment meet. This point is also referred to as
the J point. The ST segment may be above (elevated) or below (depressed)
the isoelectric line. To determine if elevation or depression exists look at
the ST segment 0.06 sec (1.5 boxes) after the J point. Elevation or depression of 1 mm (one box) or more is
considered abnormal.
Myocardial ischemia, injury and infarction are causes of ST segment deviation.
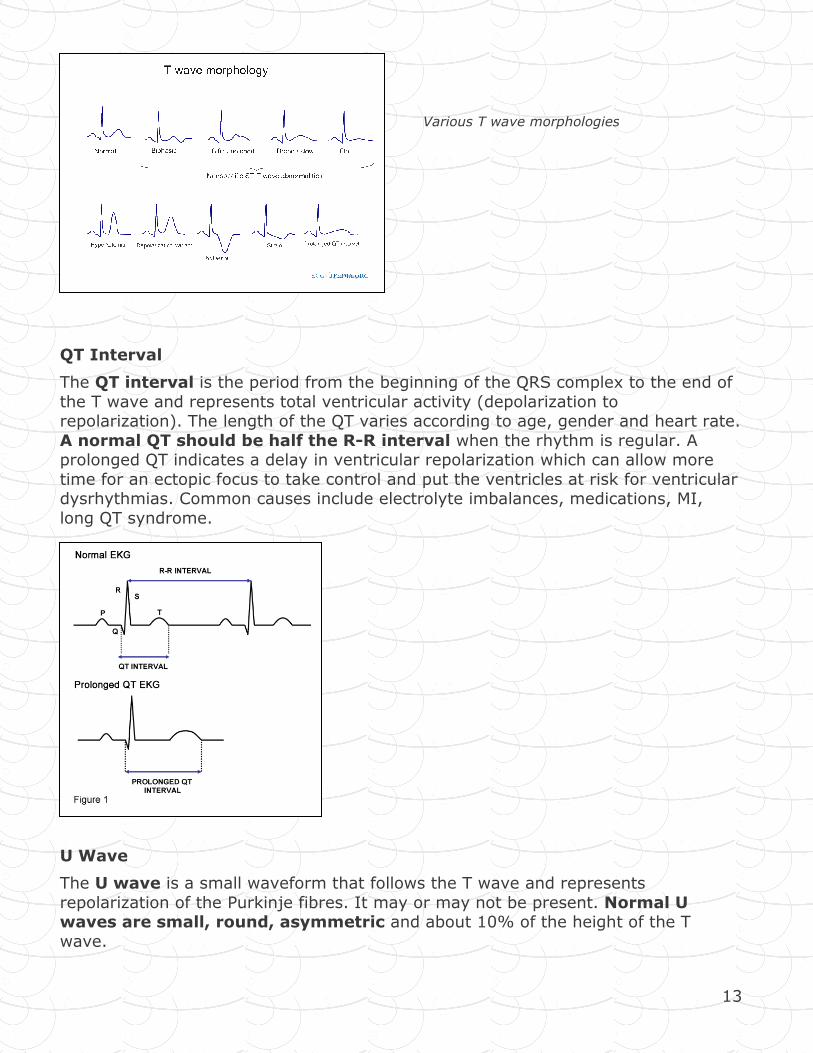
T Wave
The T wave represents ventricular repolarization. The normal T wave begins as the
deflection gradually slopes upward from the ST segment and ends when the waveform returns to baseline. Normal T waves are rounded and slightly
asymmetrical, positive in lead II and less than 5 mm high. The T wave always follows the QRS complex. Abnormal T waves can be tall, peaked, flattened, low,
biphasic or inverted. Common causes include MI, ischemia, pericarditis, hyperkalemia, bundle branch block and ventricular enlargement.
13
QT Interval
The QT interval is the period from the beginning of the QRS complex to the end of
the T wave and represents total ventricular activity (depolarization to repolarization). The length of the QT varies according to age, gender and heart rate.
A normal QT should be half the R-R interval when the rhythm is regular. A prolonged QT indicates a delay in ventricular repolarization which can allow more
time for an ectopic focus to take control and put the ventricles at risk for ventricular dysrhythmias. Common causes include electrolyte imbalances, medications, MI,
long QT syndrome.
U Wave
The U wave is a small waveform that follows the T wave and represents
repolarization of the Purkinje fibres. It may or may not be present. Normal U waves are small, round, asymmetric and about 10% of the height of the T
wave.
Various T wave morphologies
14
R-R and P-P Intervals
The distance from one R wave to the next R wave (and P wave to P wave) is used to determine rhythm rate and regularity. To determine ventricular regularity,
measure the distance from one R wave to the next consecutive R wave and compare this to the other R-R intervals. Regular rhythms will have R-R intervals
that measure the same. To determine atrial regularity, do the same thing with the P-P interval.
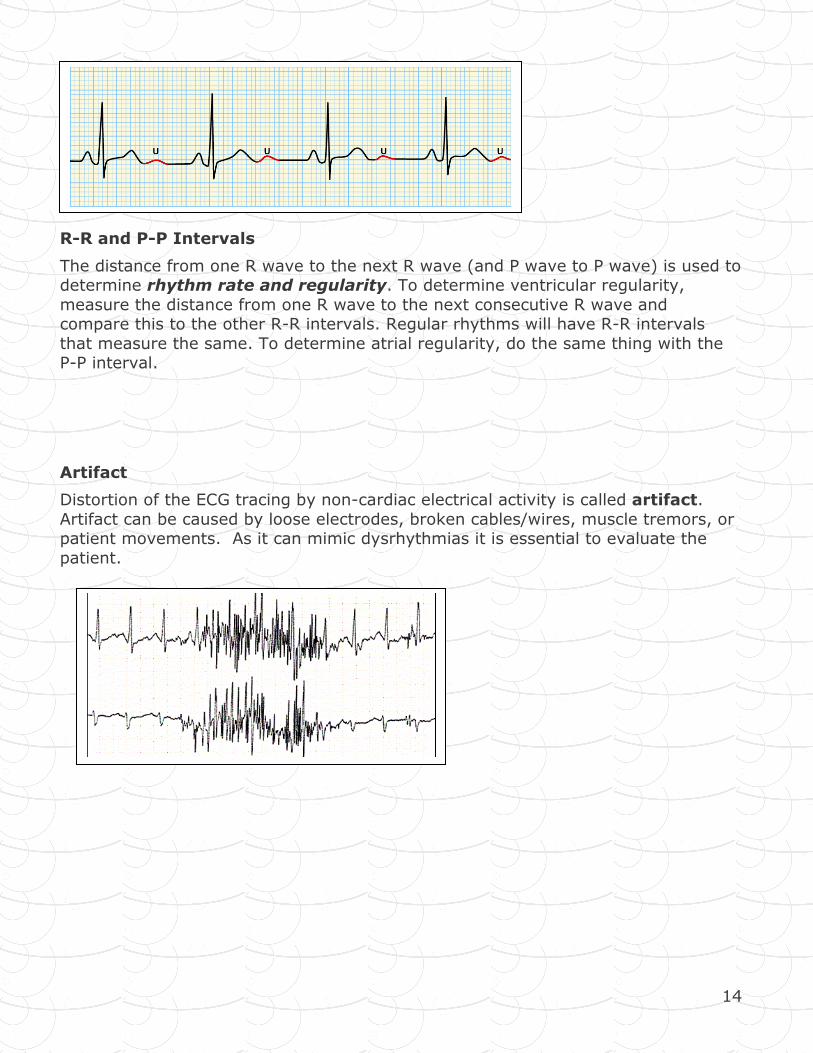
Artifact
Distortion of the ECG tracing by non-cardiac electrical activity is called artifact.
Artifact can be caused by loose electrodes, broken cables/wires, muscle tremors, or patient movements. As it can mimic dysrhythmias it is essential to evaluate the
patient.
15
Systematic Rhythm Interpretation
A consistent systematic approach to rhythm analysis is important in order not to miss something important. Use the following steps:
1. Calculate the rate. Although the atrial and ventricular rates are normally the
same, they can differ in some dysrhythmias and it is important to calculate each individually. A rate of 100 bpm or more is called a tachycardia and a rate
of 60 bpm or less is called a bradycardia.
There are several methods to calculate the rate. The small box method is time
consuming but is the most accurate.
Method 1: Large Box
For regular rhythms, the rate can be determined by counting the number of large boxes between two R waves and then dividing that number into 300.
Method 2: Small Box
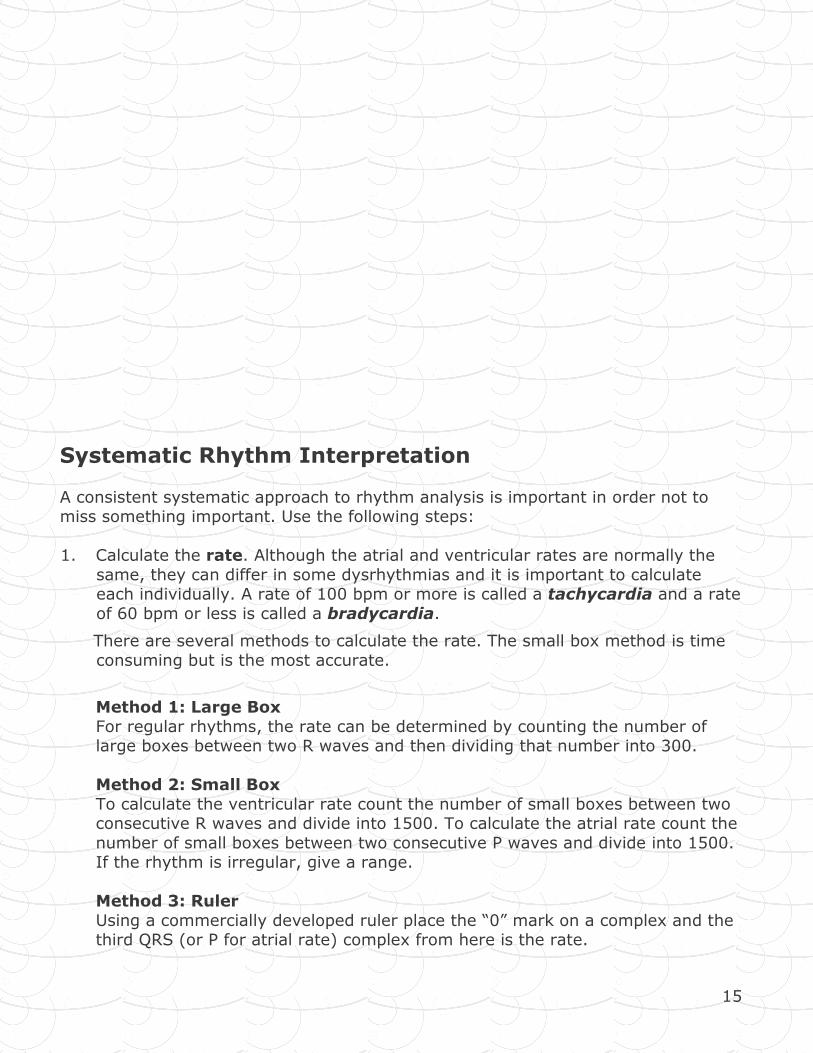
To calculate the ventricular rate count the number of small boxes between two consecutive R waves and divide into 1500. To calculate the atrial rate count the
number of small boxes between two consecutive P waves and divide into 1500. If the rhythm is irregular, give a range.
Method 3: Ruler
Using a commercially developed ruler place the “0” mark on a complex and the third QRS (or P for atrial rate) complex from here is the rate.
16
R R
Using the small box method, the rate for the above strip would be 20 small boxes divided into 1500 for a ventricular/atrial rate of 75 bpm.
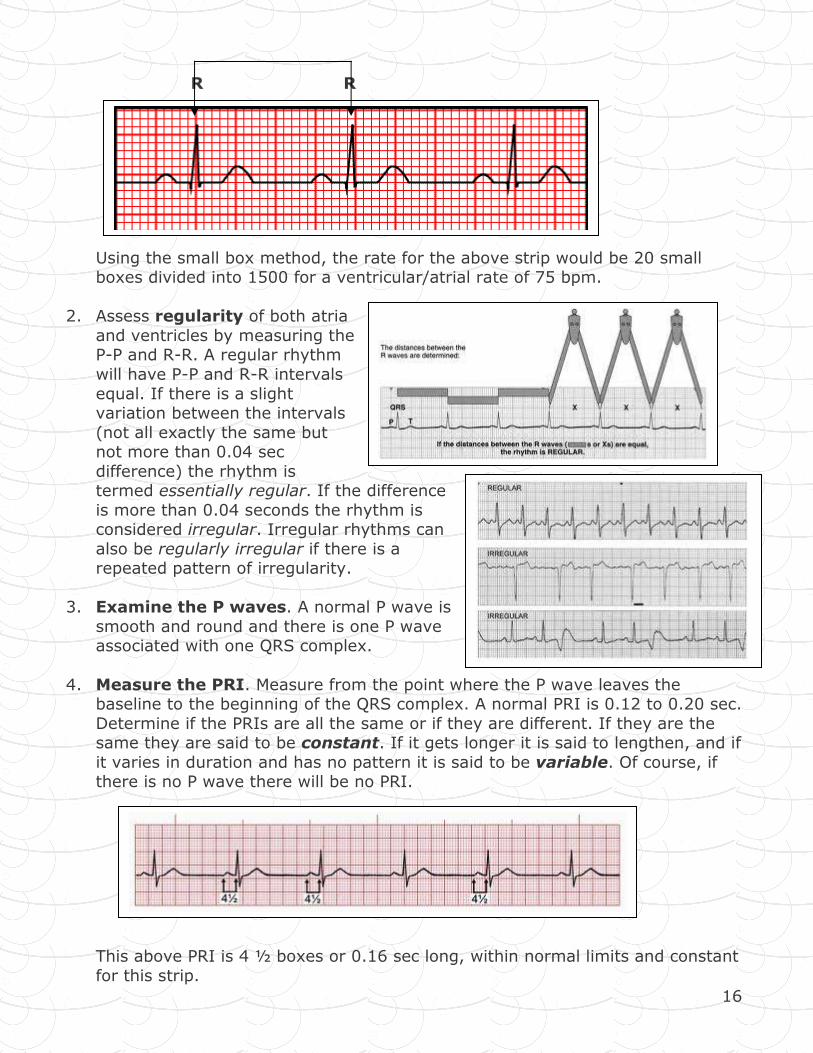
2. Assess regularity of both atria
and ventricles by measuring the P-P and R-R. A regular rhythm
will have P-P and R-R intervals
equal. If there is a slight variation between the intervals
(not all exactly the same but not more than 0.04 sec
difference) the rhythm is termed essentially regular. If the difference
is more than 0.04 seconds the rhythm is considered irregular. Irregular rhythms can
also be regularly irregular if there is a repeated pattern of irregularity.
3. Examine the P waves. A normal P wave is
smooth and round and there is one P wave associated with one QRS complex.
4. Measure the PRI. Measure from the point where the P wave leaves the baseline to the beginning of the QRS complex. A normal PRI is 0.12 to 0.20 sec.
Determine if the PRIs are all the same or if they are different. If they are the same they are said to be constant. If it gets longer it is said to lengthen, and if
it varies in duration and has no pattern it is said to be variable. Of course, if there is no P wave there will be no PRI.
This above PRI is 4 ½ boxes or 0.16 sec long, within normal limits and constant
for this strip.
17
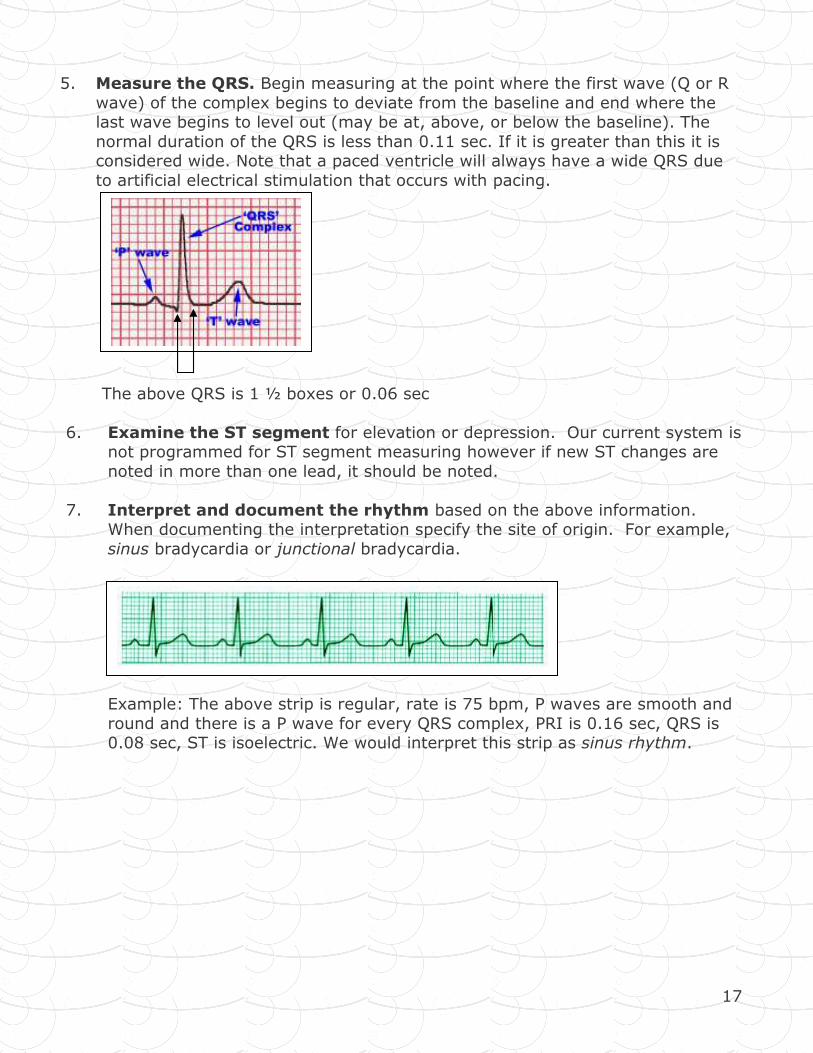
5. Measure the QRS. Begin measuring at the point where the first wave (Q or R
wave) of the complex begins to deviate from the baseline and end where the last wave begins to level out (may be at, above, or below the baseline). The
normal duration of the QRS is less than 0.11 sec. If it is greater than this it is considered wide. Note that a paced ventricle will always have a wide QRS due
to artificial electrical stimulation that occurs with pacing.
The above QRS is 1 ½ boxes or 0.06 sec
6. Examine the ST segment for elevation or depression. Our current system is not programmed for ST segment measuring however if new ST changes are
noted in more than one lead, it should be noted.
7. Interpret and document the rhythm based on the above information. When documenting the interpretation specify the site of origin. For example,
sinus bradycardia or junctional bradycardia.
Example: The above strip is regular, rate is 75 bpm, P waves are smooth and
round and there is a P wave for every QRS complex, PRI is 0.16 sec, QRS is 0.08 sec, ST is isoelectric. We would interpret this strip as sinus rhythm.
18
Overview of the Basic Rhythms
Sinus Rhythms Normal Sinus Rhythm (RSR)
� The name given to a normal heart rhythm.
� Sinus node is the pacemaker � Each beat is conducted normally through to the ventricles.
Regularity: R-R intervals are constant - rhythm is regular.
Rate: atrial and ventricular rates are equal; heart rate is between 60-100 bpm. P Wave: are uniform; one P wave in front of every QRS complex.
PRI: measures between 0.12 and 0 .20 sec; constant from beat to beat QRS: measures less than 0.11 sec.
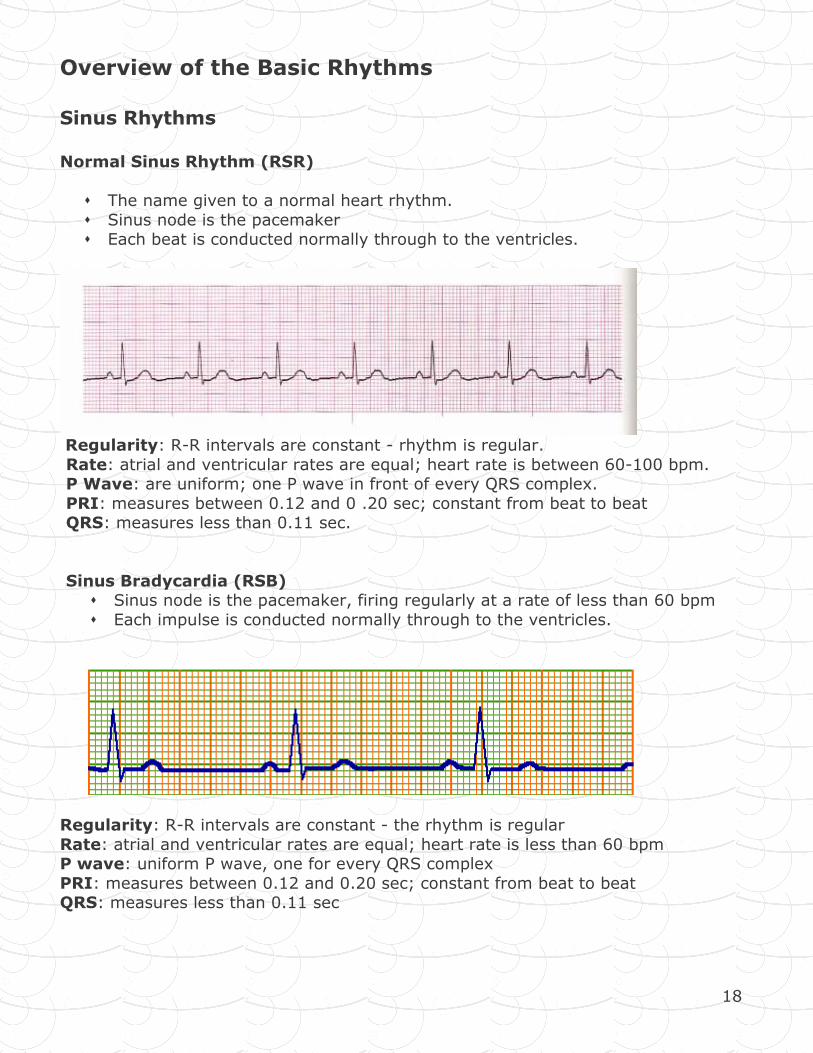
Sinus Bradycardia (RSB) � Sinus node is the pacemaker, firing regularly at a rate of less than 60 bpm
� Each impulse is conducted normally through to the ventricles.
Regularity: R-R intervals are constant - the rhythm is regular
Rate: atrial and ventricular rates are equal; heart rate is less than 60 bpm P wave: uniform P wave, one for every QRS complex
PRI: measures between 0.12 and 0.20 sec; constant from beat to beat QRS: measures less than 0.11 sec
19
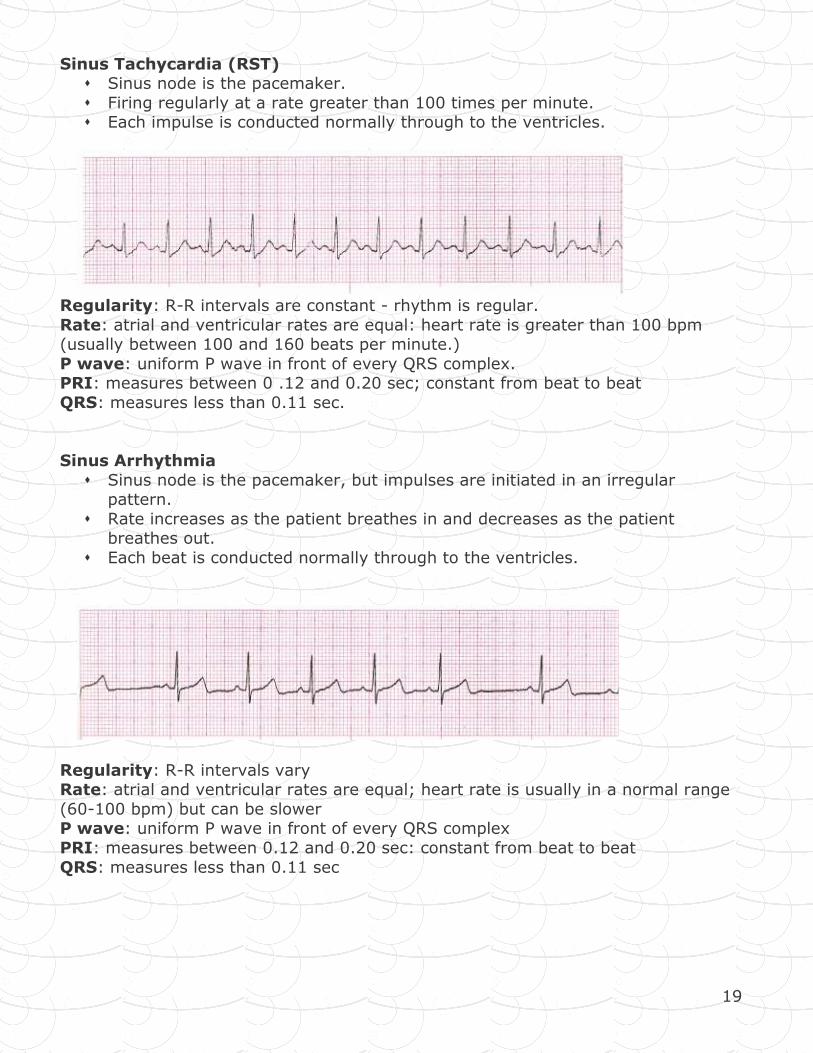
Sinus Tachycardia (RST) � Sinus node is the pacemaker.
� Firing regularly at a rate greater than 100 times per minute. � Each impulse is conducted normally through to the ventricles.
Regularity: R-R intervals are constant - rhythm is regular.
Rate: atrial and ventricular rates are equal: heart rate is greater than 100 bpm (usually between 100 and 160 beats per minute.)
P wave: uniform P wave in front of every QRS complex. PRI: measures between 0 .12 and 0.20 sec; constant from beat to beat
QRS: measures less than 0.11 sec.
Sinus Arrhythmia
� Sinus node is the pacemaker, but impulses are initiated in an irregular pattern.
� Rate increases as the patient breathes in and decreases as the patient breathes out.
� Each beat is conducted normally through to the ventricles.
Regularity: R-R intervals vary Rate: atrial and ventricular rates are equal; heart rate is usually in a normal range
(60-100 bpm) but can be slower P wave: uniform P wave in front of every QRS complex
PRI: measures between 0.12 and 0.20 sec: constant from beat to beat
QRS: measures less than 0.11 sec
20
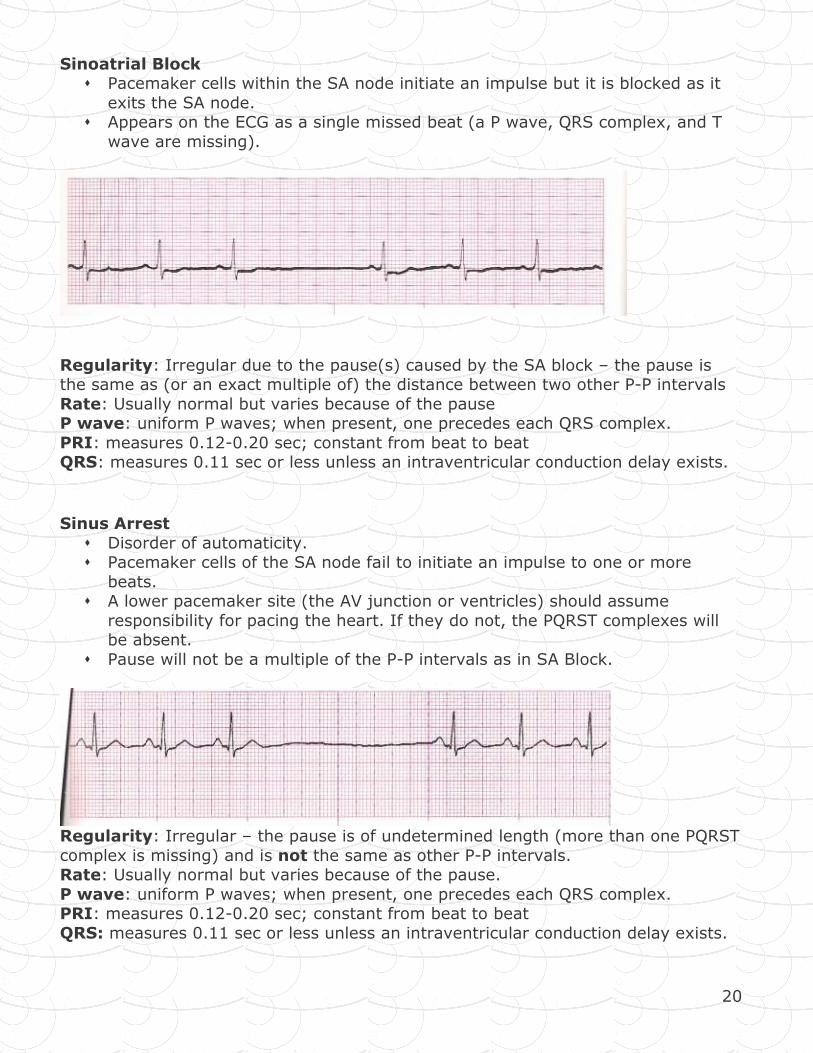
Sinoatrial Block � Pacemaker cells within the SA node initiate an impulse but it is blocked as it
exits the SA node. � Appears on the ECG as a single missed beat (a P wave, QRS complex, and T
wave are missing).
Regularity: Irregular due to the pause(s) caused by the SA block – the pause is the same as (or an exact multiple of) the distance between two other P-P intervals
Rate: Usually normal but varies because of the pause P wave: uniform P waves; when present, one precedes each QRS complex.
PRI: measures 0.12-0.20 sec; constant from beat to beat QRS: measures 0.11 sec or less unless an intraventricular conduction delay exists.
Sinus Arrest
� Disorder of automaticity. � Pacemaker cells of the SA node fail to initiate an impulse to one or more
beats. � A lower pacemaker site (the AV junction or ventricles) should assume
responsibility for pacing the heart. If they do not, the PQRST complexes will be absent.
� Pause will not be a multiple of the P-P intervals as in SA Block.
Regularity: Irregular – the pause is of undetermined length (more than one PQRST
complex is missing) and is not the same as other P-P intervals. Rate: Usually normal but varies because of the pause.
P wave: uniform P waves; when present, one precedes each QRS complex. PRI: measures 0.12-0.20 sec; constant from beat to beat
QRS: measures 0.11 sec or less unless an intraventricular conduction delay exists.
21
Atrial Rhythms An atrial rhythm originates somewhere in the atrial tissue. The pacemaker in this rhythm can be a single irritable focus in the atria or it can be multiple irritable foci.
You may see a P wave if the atria depolarize in an organized fashion. If the P wave
does not originate in the SA Node it will look different - may be inverted, peaked or jagged.
If the atria are fibrillating, you will not see a P wave but will see a wavy baseline
between irregular QRS complexes.
Once the impulse reaches the AV node, conduction will follow the normal pathway and you will see a normal looking QRS and T wave.
It is important to remember that when atrial conduction does not occur normally,
15-30% of cardiac output (atrial kick) is lost. This may have clinical implications in
patients who have myocardial dysfunction and are already compromised.
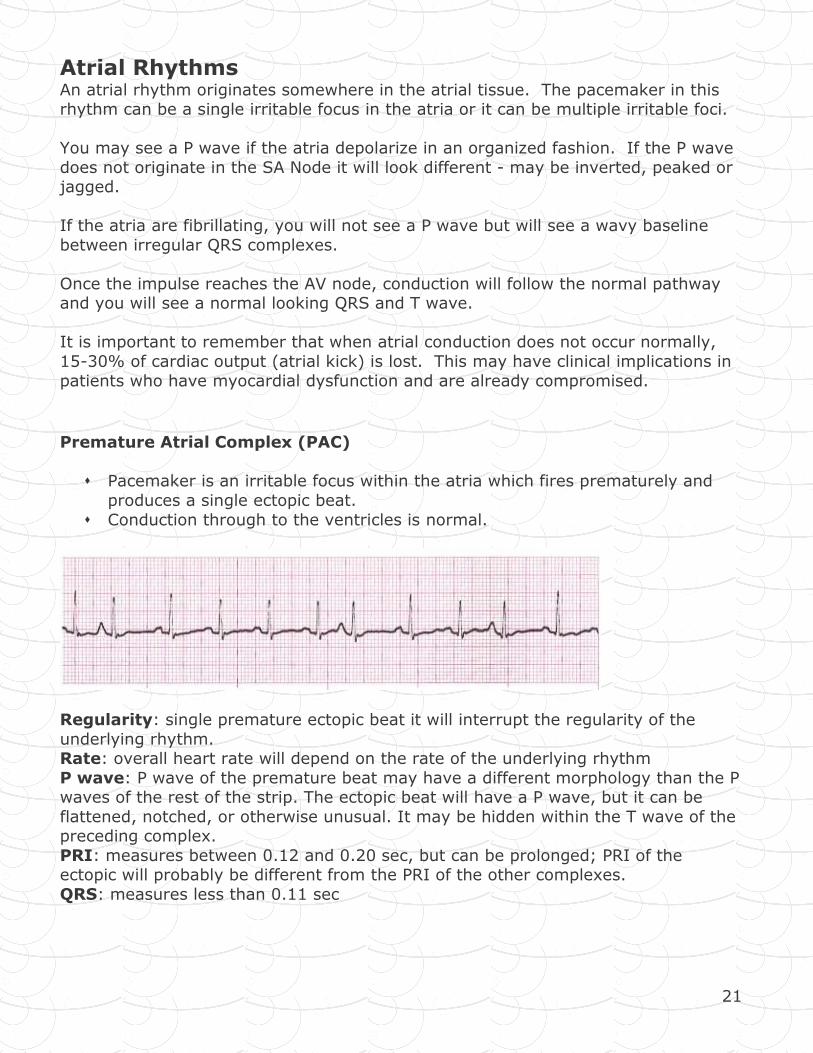
Premature Atrial Complex (PAC)
� Pacemaker is an irritable focus within the atria which fires prematurely and
produces a single ectopic beat.
� Conduction through to the ventricles is normal.
Regularity: single premature ectopic beat it will interrupt the regularity of the
underlying rhythm. Rate: overall heart rate will depend on the rate of the underlying rhythm
P wave: P wave of the premature beat may have a different morphology than the P waves of the rest of the strip. The ectopic beat will have a P wave, but it can be
flattened, notched, or otherwise unusual. It may be hidden within the T wave of the preceding complex.
PRI: measures between 0.12 and 0.20 sec, but can be prolonged; PRI of the ectopic will probably be different from the PRI of the other complexes.
QRS: measures less than 0.11 sec
22
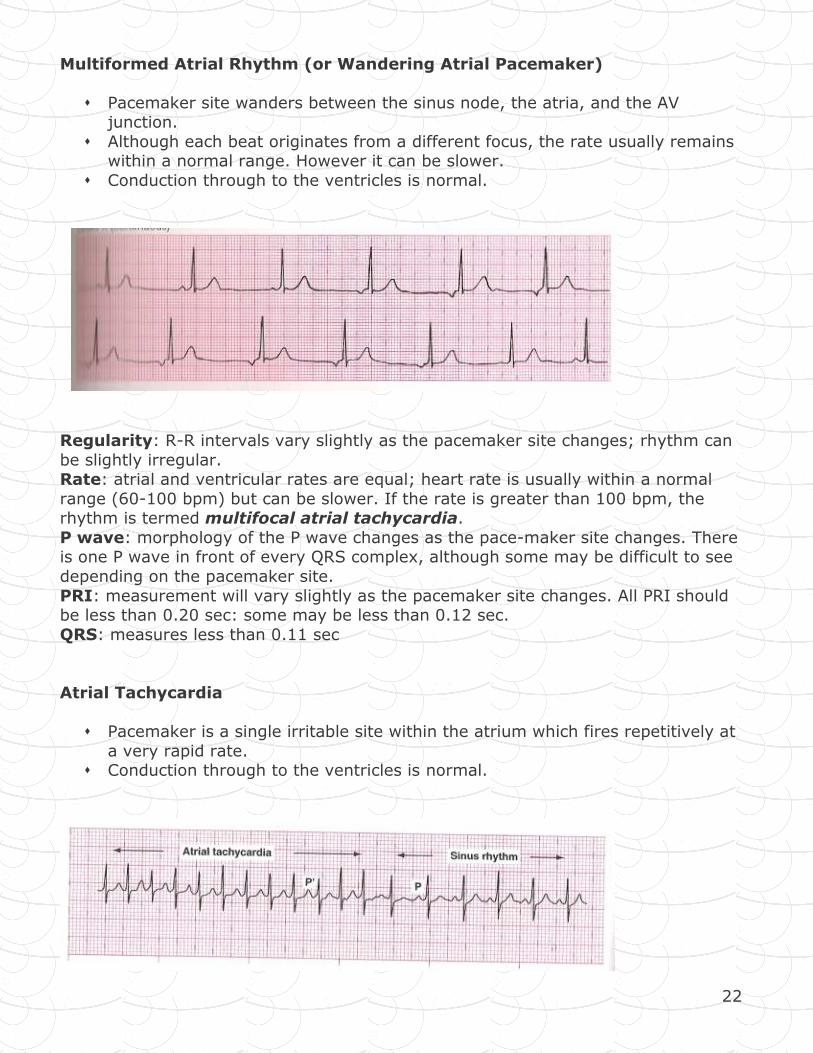
Multiformed Atrial Rhythm (or Wandering Atrial Pacemaker)
� Pacemaker site wanders between the sinus node, the atria, and the AV junction.
� Although each beat originates from a different focus, the rate usually remains within a normal range. However it can be slower.
� Conduction through to the ventricles is normal.
Regularity: R-R intervals vary slightly as the pacemaker site changes; rhythm can
be slightly irregular. Rate: atrial and ventricular rates are equal; heart rate is usually within a normal
range (60-100 bpm) but can be slower. If the rate is greater than 100 bpm, the rhythm is termed multifocal atrial tachycardia.
P wave: morphology of the P wave changes as the pace-maker site changes. There is one P wave in front of every QRS complex, although some may be difficult to see
depending on the pacemaker site.
PRI: measurement will vary slightly as the pacemaker site changes. All PRI should be less than 0.20 sec: some may be less than 0.12 sec.
QRS: measures less than 0.11 sec
Atrial Tachycardia
� Pacemaker is a single irritable site within the atrium which fires repetitively at
a very rapid rate. � Conduction through to the ventricles is normal.
23
Regularity: R-R intervals are constant - rhythm is regular Rate: atrial and ventricular rates are equal; heart rate is usually 150-250 bpm
P wave: one P wave in front of every QRS complex. The configuration of the P wave will be different than that of sinus P waves - may be flattened, notched or
hidden in the T waves of the preceding beats. PRI: measures between 0.12 and 0.20 sec; constant across the strip. The PRI may
be difficult to measure if the P wave is obscured by the T wave. QRS: measures less than 0.11 sec
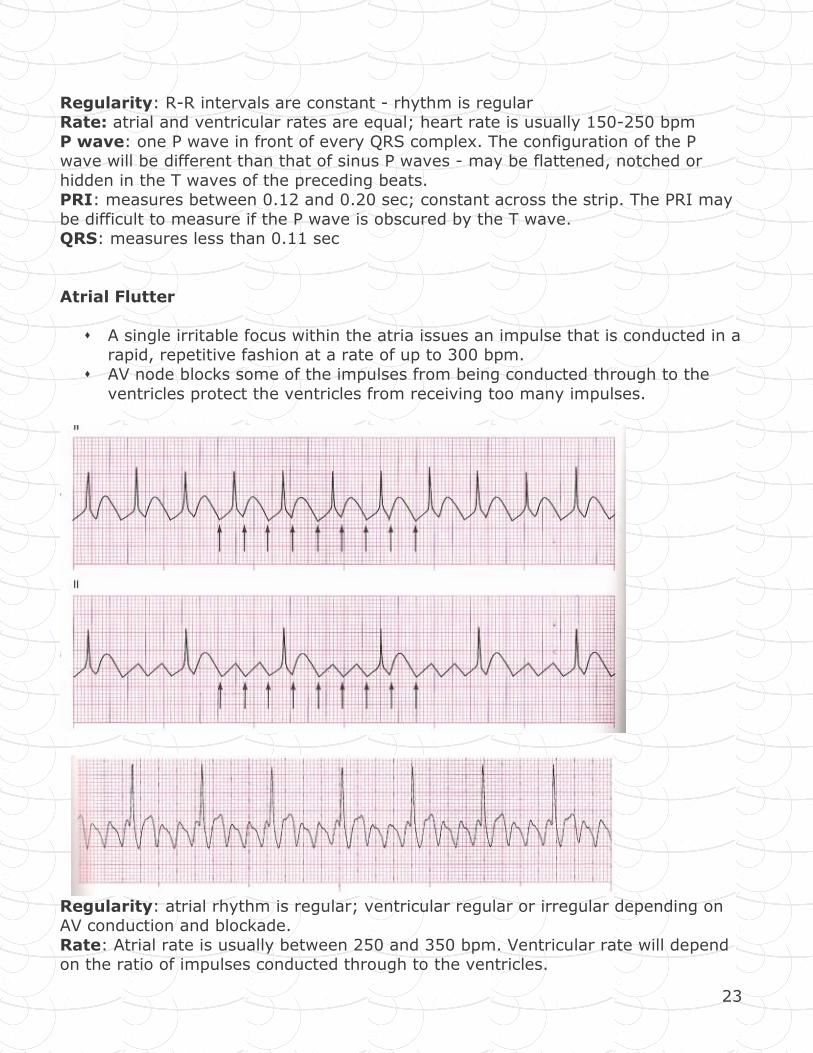
Atrial Flutter
� A single irritable focus within the atria issues an impulse that is conducted in a rapid, repetitive fashion at a rate of up to 300 bpm.
� AV node blocks some of the impulses from being conducted through to the
ventricles protect the ventricles from receiving too many impulses.
Regularity: atrial rhythm is regular; ventricular regular or irregular depending on AV conduction and blockade.
Rate: Atrial rate is usually between 250 and 350 bpm. Ventricular rate will depend on the ratio of impulses conducted through to the ventricles.
24
P wave: No identifiable P waves; saw tooth flutter waves are present. PRI: not measured.
QRS: measures less than 0.11 sec; may be wide if flutter waves are buried in the QRS complex.
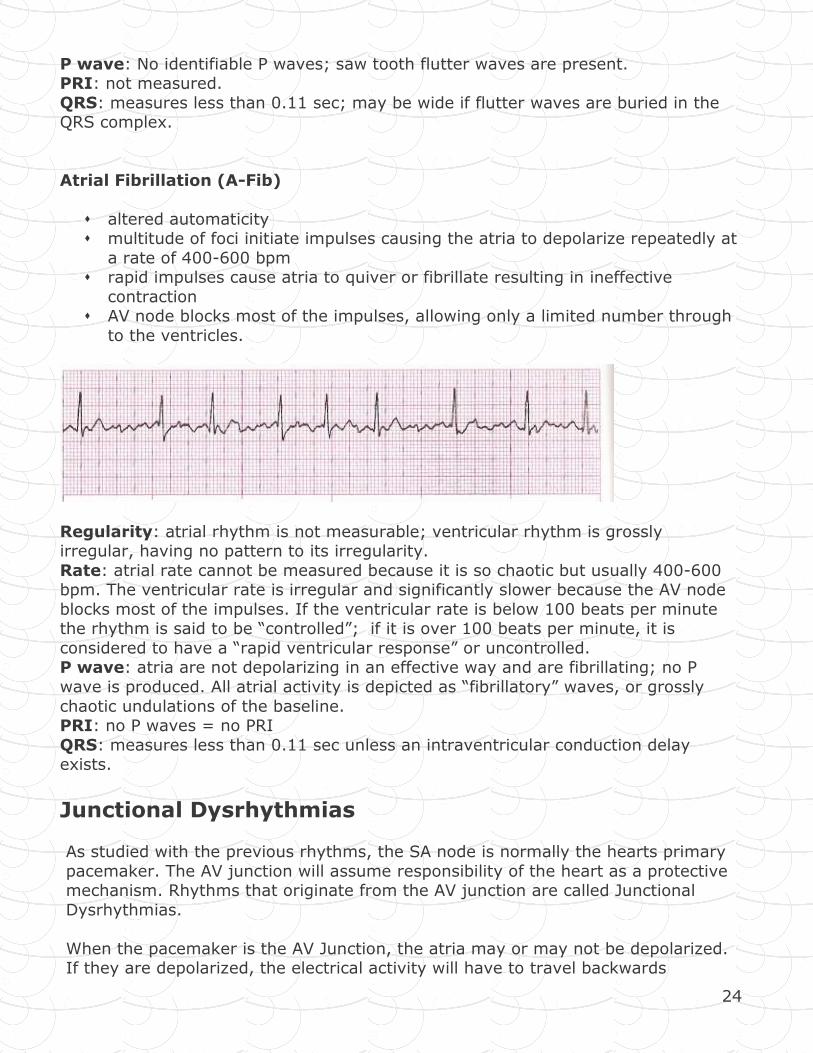
Atrial Fibrillation (A-Fib)
� altered automaticity � multitude of foci initiate impulses causing the atria to depolarize repeatedly at
a rate of 400-600 bpm � rapid impulses cause atria to quiver or fibrillate resulting in ineffective
contraction � AV node blocks most of the impulses, allowing only a limited number through
to the ventricles.
Regularity: atrial rhythm is not measurable; ventricular rhythm is grossly irregular, having no pattern to its irregularity.
Rate: atrial rate cannot be measured because it is so chaotic but usually 400-600 bpm. The ventricular rate is irregular and significantly slower because the AV node
blocks most of the impulses. If the ventricular rate is below 100 beats per minute the rhythm is said to be “controlled”; if it is over 100 beats per minute, it is
considered to have a “rapid ventricular response” or uncontrolled. P wave: atria are not depolarizing in an effective way and are fibrillating; no P
wave is produced. All atrial activity is depicted as “fibrillatory” waves, or grossly
chaotic undulations of the baseline. PRI: no P waves = no PRI
QRS: measures less than 0.11 sec unless an intraventricular conduction delay exists.
Junctional Dysrhythmias
As studied with the previous rhythms, the SA node is normally the hearts primary
pacemaker. The AV junction will assume responsibility of the heart as a protective mechanism. Rhythms that originate from the AV junction are called Junctional
Dysrhythmias.
When the pacemaker is the AV Junction, the atria may or may not be depolarized. If they are depolarized, the electrical activity will have to travel backwards
25
(retrograde) to activate the atria. This will result in an inverted P wave that may be seen after the QRS. You may not see a p wave at all if the atria are not
activated.
Once conduction leaves the AV Junction and travels toward the ventricle, conduction follows the normal path. For this reason, you will see a normal looking
QRS and T wave. Because of the loss of atrial synchrony in these rhythms atrial kick is lost (remember 15 - 30% of cardiac output). This can have significant
clinical effect.
The AV junction may pace the heart if: -the SA node fails to discharge (sinus arrest)
-an impulse from the SA node is blocked (SA block) -SA node rate is slower than that of the AV Junction (e.g. Sinus bradycardia)
-SA node impulse is conducted through the atria, but not conducted to the ventricles (such as AV block)
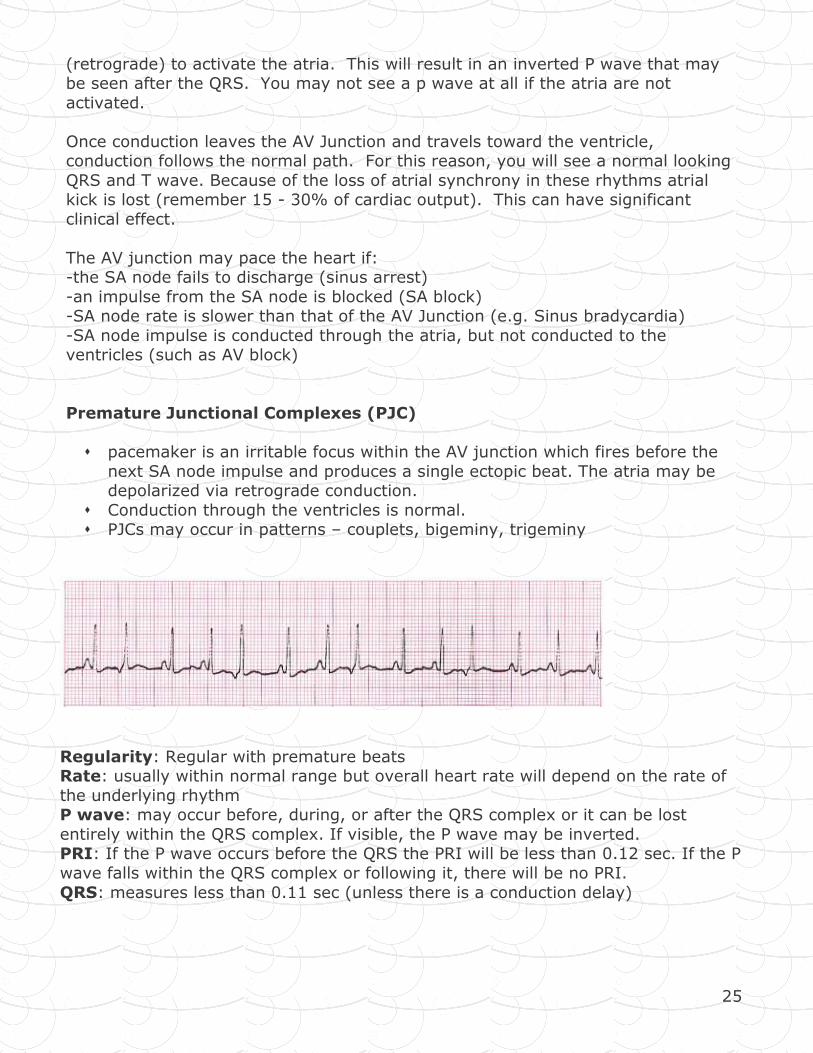
Premature Junctional Complexes (PJC)
� pacemaker is an irritable focus within the AV junction which fires before the
next SA node impulse and produces a single ectopic beat. The atria may be depolarized via retrograde conduction.
� Conduction through the ventricles is normal. � PJCs may occur in patterns – couplets, bigeminy, trigeminy
Regularity: Regular with premature beats Rate: usually within normal range but overall heart rate will depend on the rate of
the underlying rhythm P wave: may occur before, during, or after the QRS complex or it can be lost
entirely within the QRS complex. If visible, the P wave may be inverted. PRI: If the P wave occurs before the QRS the PRI will be less than 0.12 sec. If the P
wave falls within the QRS complex or following it, there will be no PRI.
QRS: measures less than 0.11 sec (unless there is a conduction delay)
26
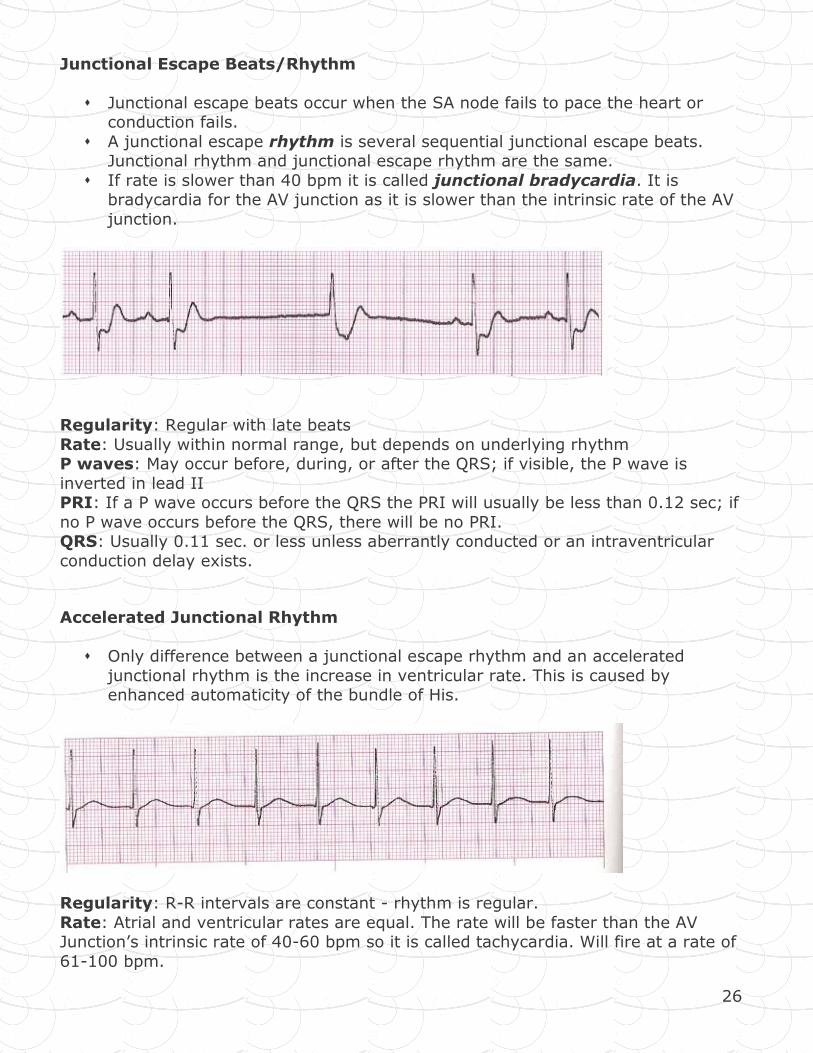
Junctional Escape Beats/Rhythm
� Junctional escape beats occur when the SA node fails to pace the heart or conduction fails.
� A junctional escape rhythm is several sequential junctional escape beats. Junctional rhythm and junctional escape rhythm are the same.
� If rate is slower than 40 bpm it is called junctional bradycardia. It is bradycardia for the AV junction as it is slower than the intrinsic rate of the AV
junction.
Regularity: Regular with late beats
Rate: Usually within normal range, but depends on underlying rhythm P waves: May occur before, during, or after the QRS; if visible, the P wave is
inverted in lead II PRI: If a P wave occurs before the QRS the PRI will usually be less than 0.12 sec; if
no P wave occurs before the QRS, there will be no PRI. QRS: Usually 0.11 sec. or less unless aberrantly conducted or an intraventricular
conduction delay exists.
Accelerated Junctional Rhythm
� Only difference between a junctional escape rhythm and an accelerated
junctional rhythm is the increase in ventricular rate. This is caused by enhanced automaticity of the bundle of His.
Regularity: R-R intervals are constant - rhythm is regular.
Rate: Atrial and ventricular rates are equal. The rate will be faster than the AV Junction’s intrinsic rate of 40-60 bpm so it is called tachycardia. Will fire at a rate of
61-100 bpm.
27
P waves: may occur before, during, or after the QRS complex, or it can be lost entirely within the QRS complex. If visible, the P wave will be inverted.
PRI: If the P wave precedes the QRS complex, the PRI will be less than 0.12 sec. If the P wave falls within the QRS complex or following it, there will be no PRI.
QRS: measures less than 0.11 sec, unless it is aberrantly conducted or an intraventricular conduction delay exists.
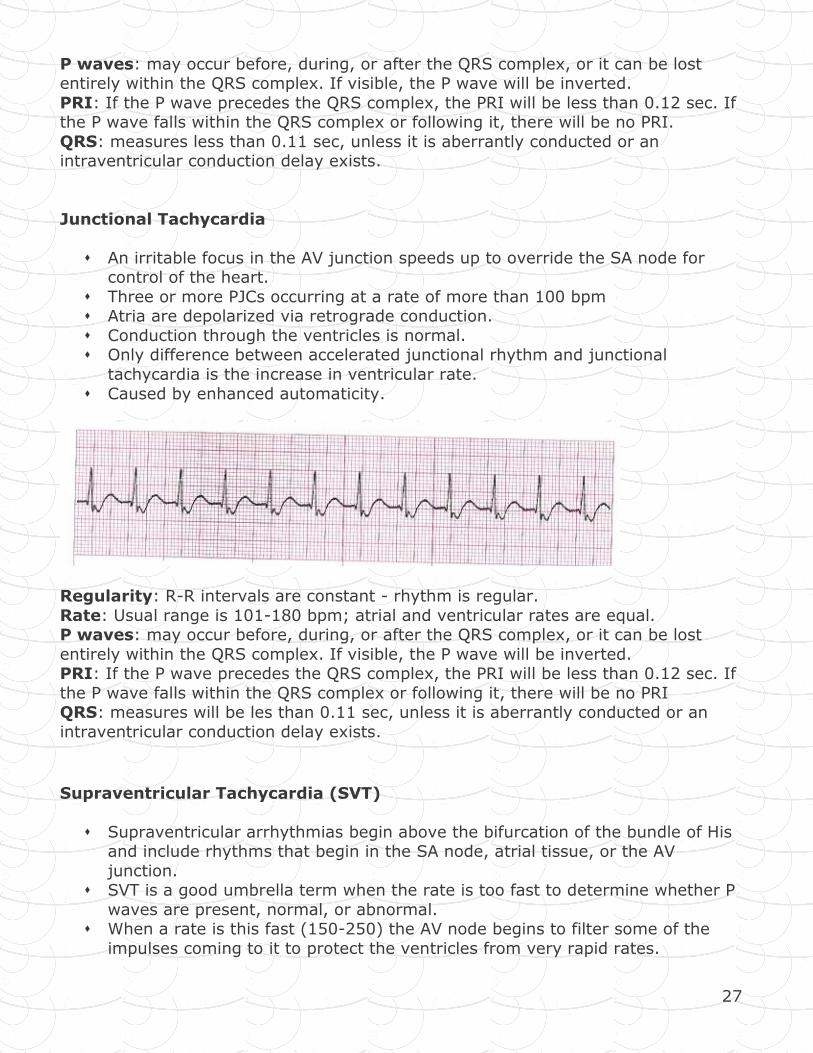
Junctional Tachycardia
� An irritable focus in the AV junction speeds up to override the SA node for control of the heart.
� Three or more PJCs occurring at a rate of more than 100 bpm � Atria are depolarized via retrograde conduction.
� Conduction through the ventricles is normal. � Only difference between accelerated junctional rhythm and junctional
tachycardia is the increase in ventricular rate.
� Caused by enhanced automaticity.
Regularity: R-R intervals are constant - rhythm is regular.
Rate: Usual range is 101-180 bpm; atrial and ventricular rates are equal. P waves: may occur before, during, or after the QRS complex, or it can be lost
entirely within the QRS complex. If visible, the P wave will be inverted. PRI: If the P wave precedes the QRS complex, the PRI will be less than 0.12 sec. If
the P wave falls within the QRS complex or following it, there will be no PRI QRS: measures will be les than 0.11 sec, unless it is aberrantly conducted or an
intraventricular conduction delay exists.
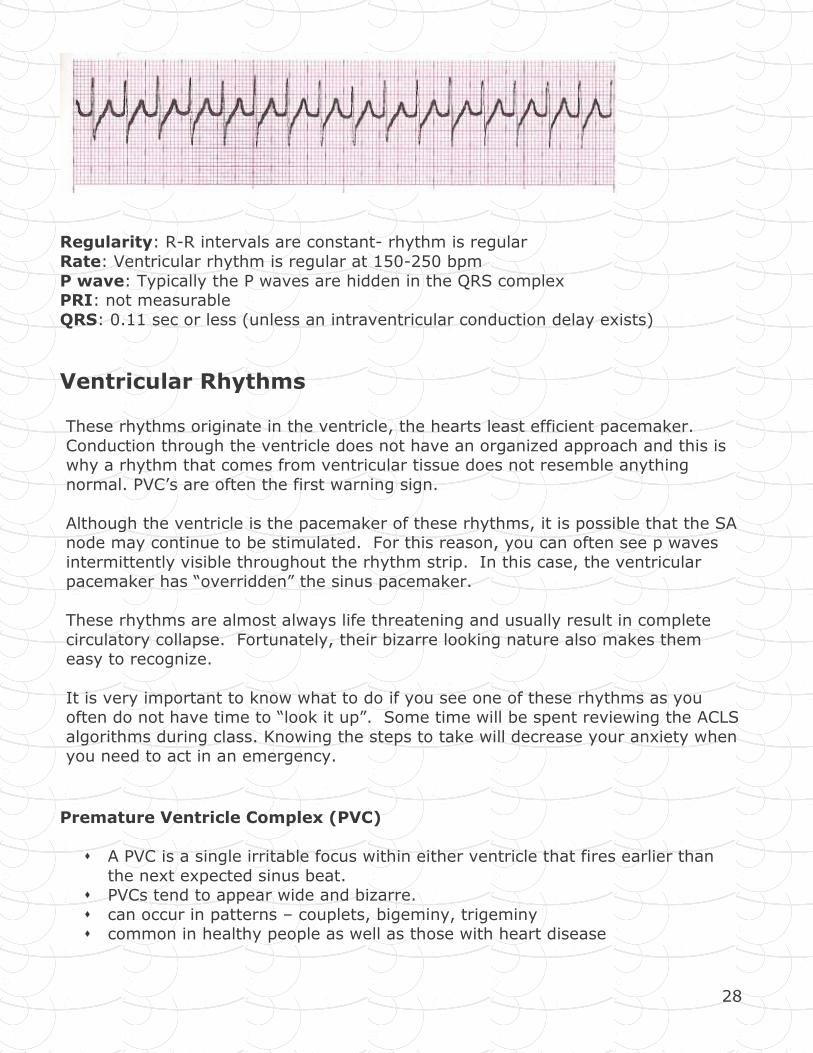
Supraventricular Tachycardia (SVT)
� Supraventricular arrhythmias begin above the bifurcation of the bundle of His and include rhythms that begin in the SA node, atrial tissue, or the AV
junction. � SVT is a good umbrella term when the rate is too fast to determine whether P
waves are present, normal, or abnormal. � When a rate is this fast (150-250) the AV node begins to filter some of the
impulses coming to it to protect the ventricles from very rapid rates.
28
Regularity: R-R intervals are constant- rhythm is regular
Rate: Ventricular rhythm is regular at 150-250 bpm
P wave: Typically the P waves are hidden in the QRS complex PRI: not measurable
QRS: 0.11 sec or less (unless an intraventricular conduction delay exists)
Ventricular Rhythms These rhythms originate in the ventricle, the hearts least efficient pacemaker.
Conduction through the ventricle does not have an organized approach and this is why a rhythm that comes from ventricular tissue does not resemble anything
normal. PVC’s are often the first warning sign.
Although the ventricle is the pacemaker of these rhythms, it is possible that the SA node may continue to be stimulated. For this reason, you can often see p waves
intermittently visible throughout the rhythm strip. In this case, the ventricular pacemaker has “overridden” the sinus pacemaker.
These rhythms are almost always life threatening and usually result in complete
circulatory collapse. Fortunately, their bizarre looking nature also makes them easy to recognize.
It is very important to know what to do if you see one of these rhythms as you often do not have time to “look it up”. Some time will be spent reviewing the ACLS
algorithms during class. Knowing the steps to take will decrease your anxiety when you need to act in an emergency.
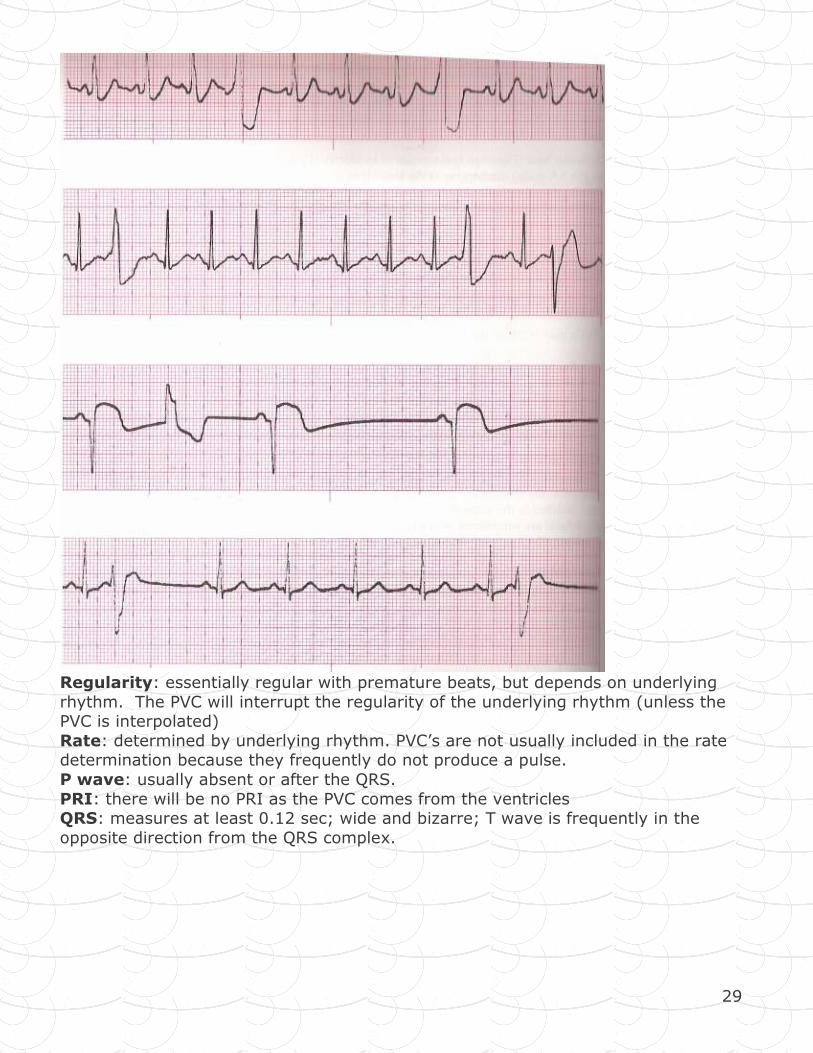
Premature Ventricle Complex (PVC)
� A PVC is a single irritable focus within either ventricle that fires earlier than
the next expected sinus beat. � PVCs tend to appear wide and bizarre.
� can occur in patterns – couplets, bigeminy, trigeminy � common in healthy people as well as those with heart disease
29
Regularity: essentially regular with premature beats, but depends on underlying
rhythm. The PVC will interrupt the regularity of the underlying rhythm (unless the PVC is interpolated)
Rate: determined by underlying rhythm. PVC’s are not usually included in the rate determination because they frequently do not produce a pulse.
P wave: usually absent or after the QRS.
PRI: there will be no PRI as the PVC comes from the ventricles QRS: measures at least 0.12 sec; wide and bizarre; T wave is frequently in the
opposite direction from the QRS complex.
30
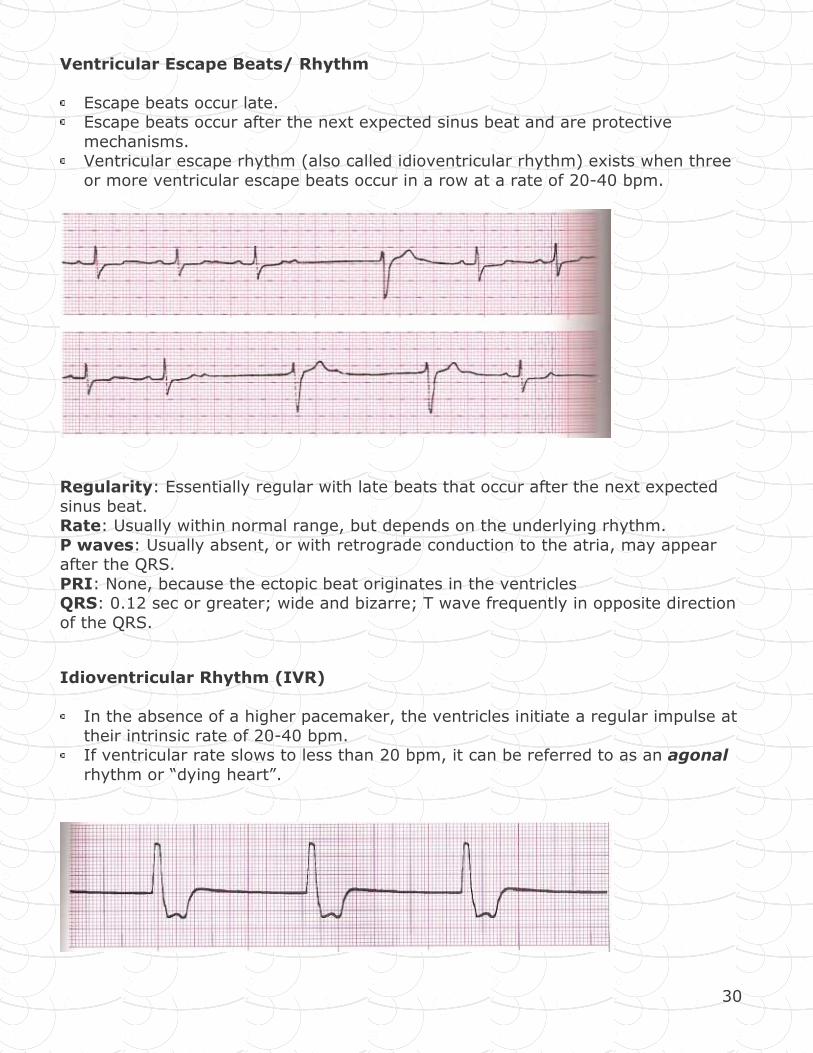
Ventricular Escape Beats/ Rhythm
Escape beats occur late. Escape beats occur after the next expected sinus beat and are protective
mechanisms. Ventricular escape rhythm (also called idioventricular rhythm) exists when three
or more ventricular escape beats occur in a row at a rate of 20-40 bpm.
Regularity: Essentially regular with late beats that occur after the next expected
sinus beat. Rate: Usually within normal range, but depends on the underlying rhythm.
P waves: Usually absent, or with retrograde conduction to the atria, may appear after the QRS.
PRI: None, because the ectopic beat originates in the ventricles QRS: 0.12 sec or greater; wide and bizarre; T wave frequently in opposite direction
of the QRS.
Idioventricular Rhythm (IVR)
In the absence of a higher pacemaker, the ventricles initiate a regular impulse at
their intrinsic rate of 20-40 bpm. If ventricular rate slows to less than 20 bpm, it can be referred to as an agonal
rhythm or “dying heart”.
31
Regularity: ventricular rhythm is essentially regular
Rate: ventricular rate 20-40 bpm, P waves: Usually absent
PRI: None QRS: 0.12 sec or greater; T wave frequently in opposite direction of the QRS
complex.
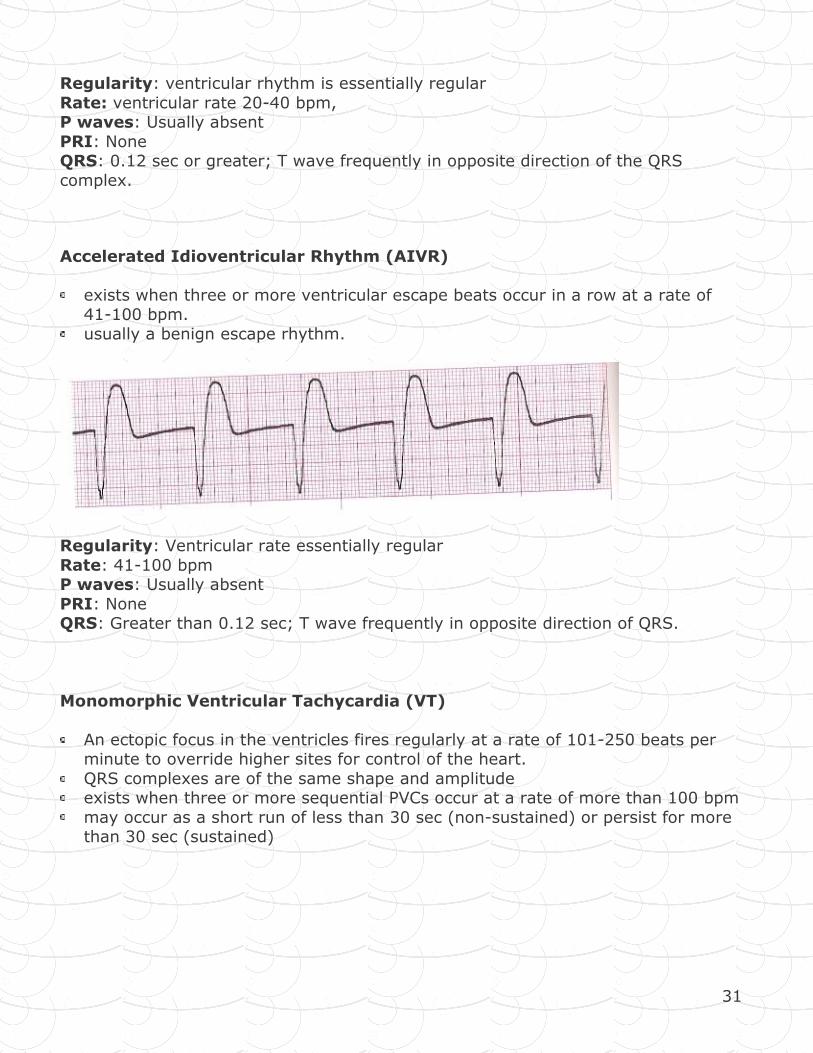
Accelerated Idioventricular Rhythm (AIVR)
exists when three or more ventricular escape beats occur in a row at a rate of 41-100 bpm.
usually a benign escape rhythm.
Regularity: Ventricular rate essentially regular
Rate: 41-100 bpm P waves: Usually absent
PRI: None QRS: Greater than 0.12 sec; T wave frequently in opposite direction of QRS.
Monomorphic Ventricular Tachycardia (VT)
An ectopic focus in the ventricles fires regularly at a rate of 101-250 beats per minute to override higher sites for control of the heart.
QRS complexes are of the same shape and amplitude exists when three or more sequential PVCs occur at a rate of more than 100 bpm
may occur as a short run of less than 30 sec (non-sustained) or persist for more than 30 sec (sustained)
32
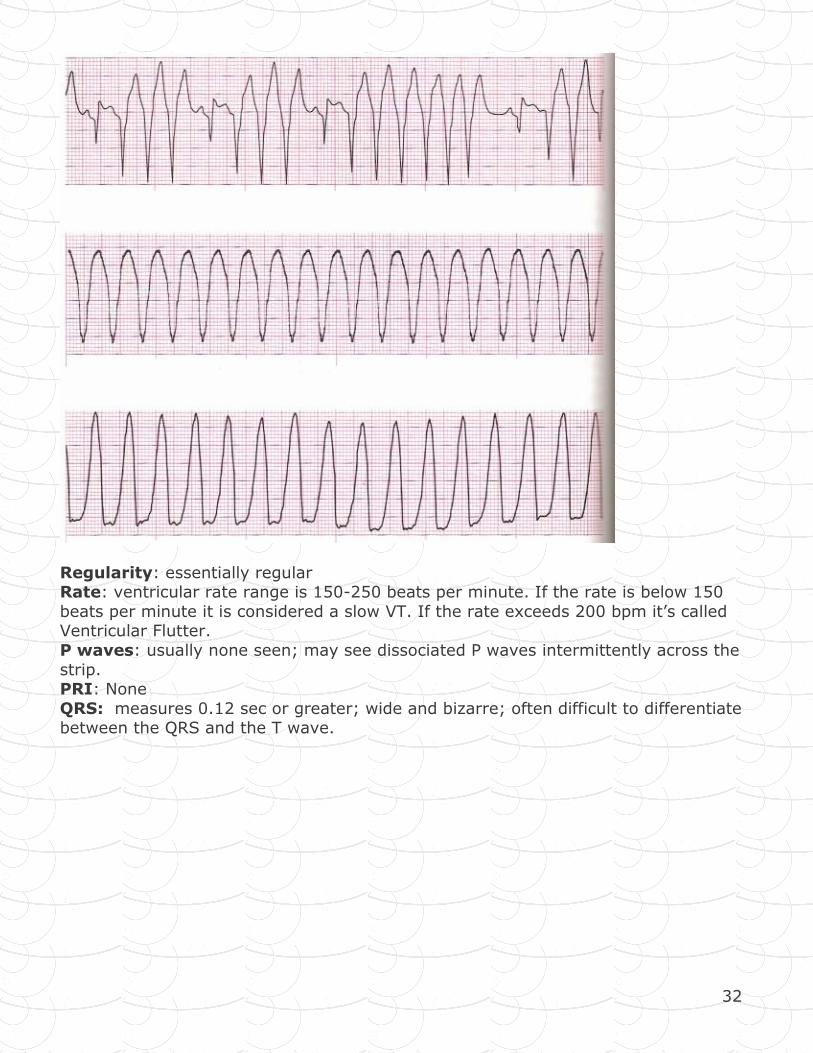
Regularity: essentially regular Rate: ventricular rate range is 150-250 beats per minute. If the rate is below 150
beats per minute it is considered a slow VT. If the rate exceeds 200 bpm it’s called Ventricular Flutter.
P waves: usually none seen; may see dissociated P waves intermittently across the
strip. PRI: None
QRS: measures 0.12 sec or greater; wide and bizarre; often difficult to differentiate between the QRS and the T wave.
33
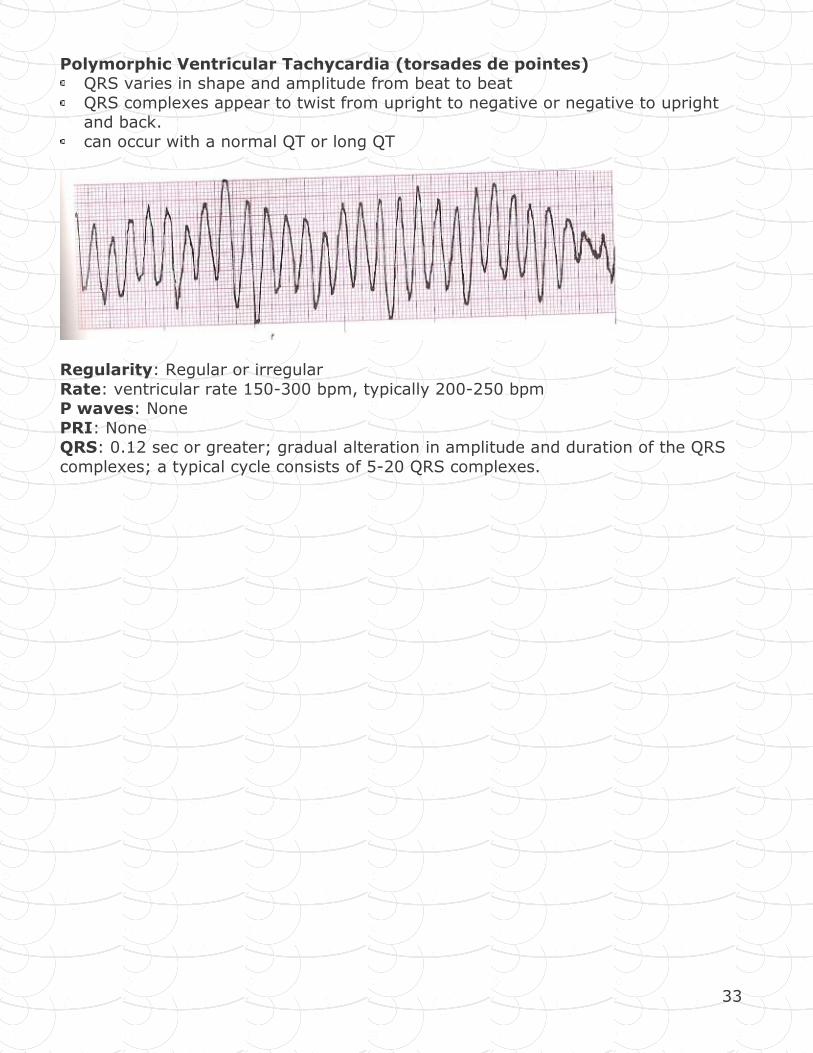
Polymorphic Ventricular Tachycardia (torsades de pointes) QRS varies in shape and amplitude from beat to beat
QRS complexes appear to twist from upright to negative or negative to upright and back.
can occur with a normal QT or long QT
Regularity: Regular or irregular
Rate: ventricular rate 150-300 bpm, typically 200-250 bpm P waves: None
PRI: None QRS: 0.12 sec or greater; gradual alteration in amplitude and duration of the QRS
complexes; a typical cycle consists of 5-20 QRS complexes.
34
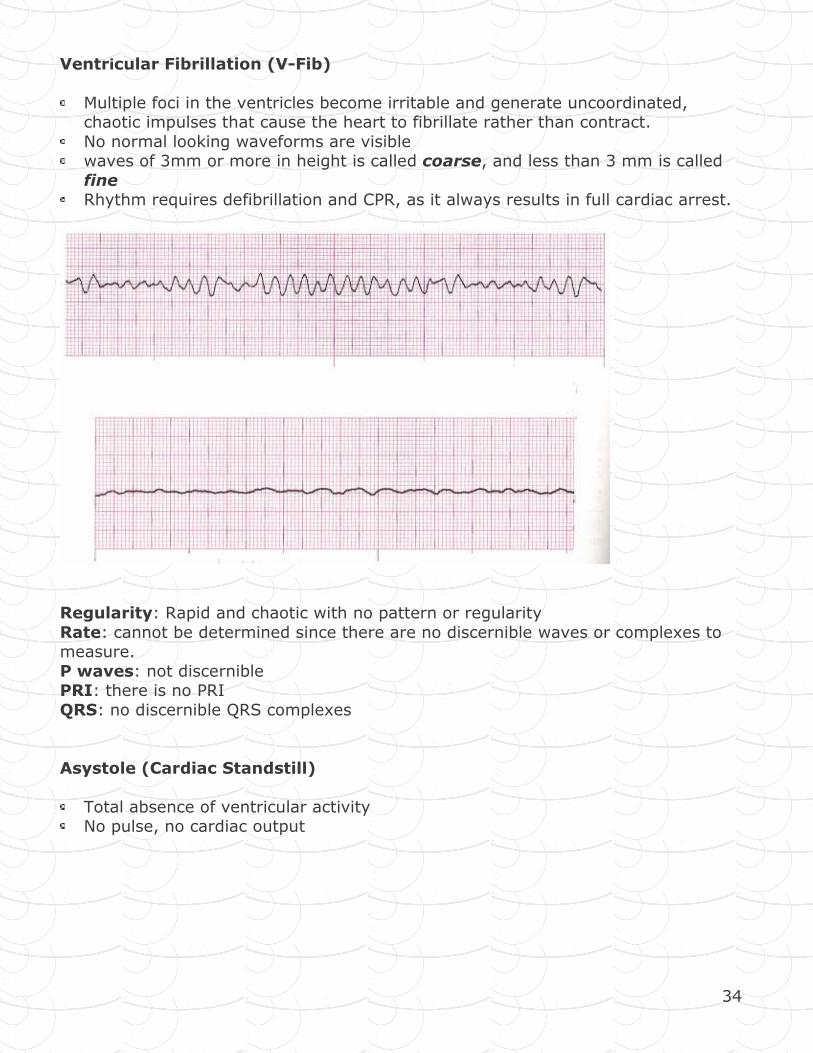
Ventricular Fibrillation (V-Fib)
Multiple foci in the ventricles become irritable and generate uncoordinated, chaotic impulses that cause the heart to fibrillate rather than contract.
No normal looking waveforms are visible waves of 3mm or more in height is called coarse, and less than 3 mm is called
fine Rhythm requires defibrillation and CPR, as it always results in full cardiac arrest.
Regularity: Rapid and chaotic with no pattern or regularity
Rate: cannot be determined since there are no discernible waves or complexes to measure.
P waves: not discernible PRI: there is no PRI
QRS: no discernible QRS complexes
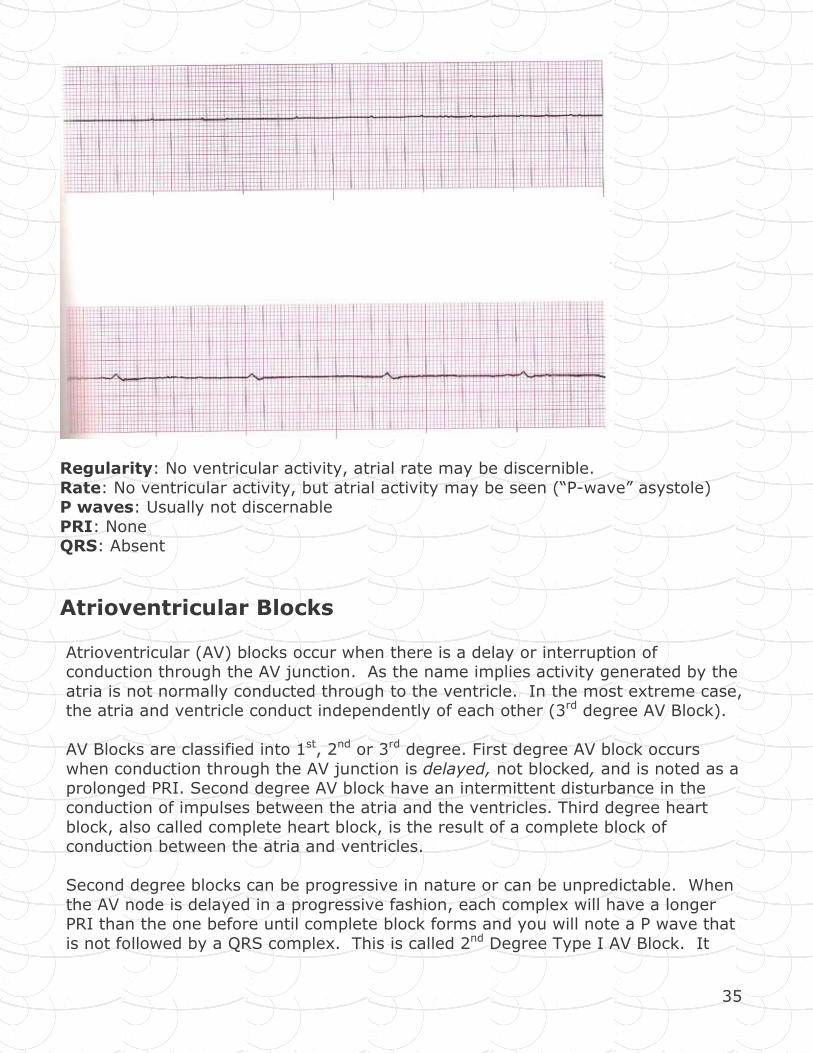
Asystole (Cardiac Standstill)
Total absence of ventricular activity No pulse, no cardiac output
35
Regularity: No ventricular activity, atrial rate may be discernible.
Rate: No ventricular activity, but atrial activity may be seen (“P-wave” asystole) P waves: Usually not discernable
PRI: None QRS: Absent
Atrioventricular Blocks
Atrioventricular (AV) blocks occur when there is a delay or interruption of conduction through the AV junction. As the name implies activity generated by the
atria is not normally conducted through to the ventricle. In the most extreme case, the atria and ventricle conduct independently of each other (3rd degree AV Block).
AV Blocks are classified into 1st, 2nd or 3rd degree. First degree AV block occurs
when conduction through the AV junction is delayed, not blocked, and is noted as a prolonged PRI. Second degree AV block have an intermittent disturbance in the
conduction of impulses between the atria and the ventricles. Third degree heart
block, also called complete heart block, is the result of a complete block of conduction between the atria and ventricles.
Second degree blocks can be progressive in nature or can be unpredictable. When
the AV node is delayed in a progressive fashion, each complex will have a longer PRI than the one before until complete block forms and you will note a P wave that
is not followed by a QRS complex. This is called 2nd Degree Type I AV Block. It
36
tends to be more predictable in nature and does not usually deteriorate to a more life threatening block.
When the AV node is unpredictably blocked, some impulses will be conducted
normally and some will not be conducted at all. This is seen on the ECG strip as P waves not followed by QRS complexes. The PRI will be constant in the beats that
are conducted through the AV node. This is called 2nd Degree Type II AV Block. Because it is not predictable, it can deteriorate into a 3rd degree block and for this
reason usually requires a temporary pacemaker as back up.
In a third degree block you will see P waves and QRS complexes but there will be no relationship between them. When you interpret this rhythm you will note an
atrial rate and a ventricular rate. It is important to determine whether the pacemaker is the AV junction or the ventricle (can determine this from the rate and
the formation of the QRS complexes) as it will indicate how sever the block is.
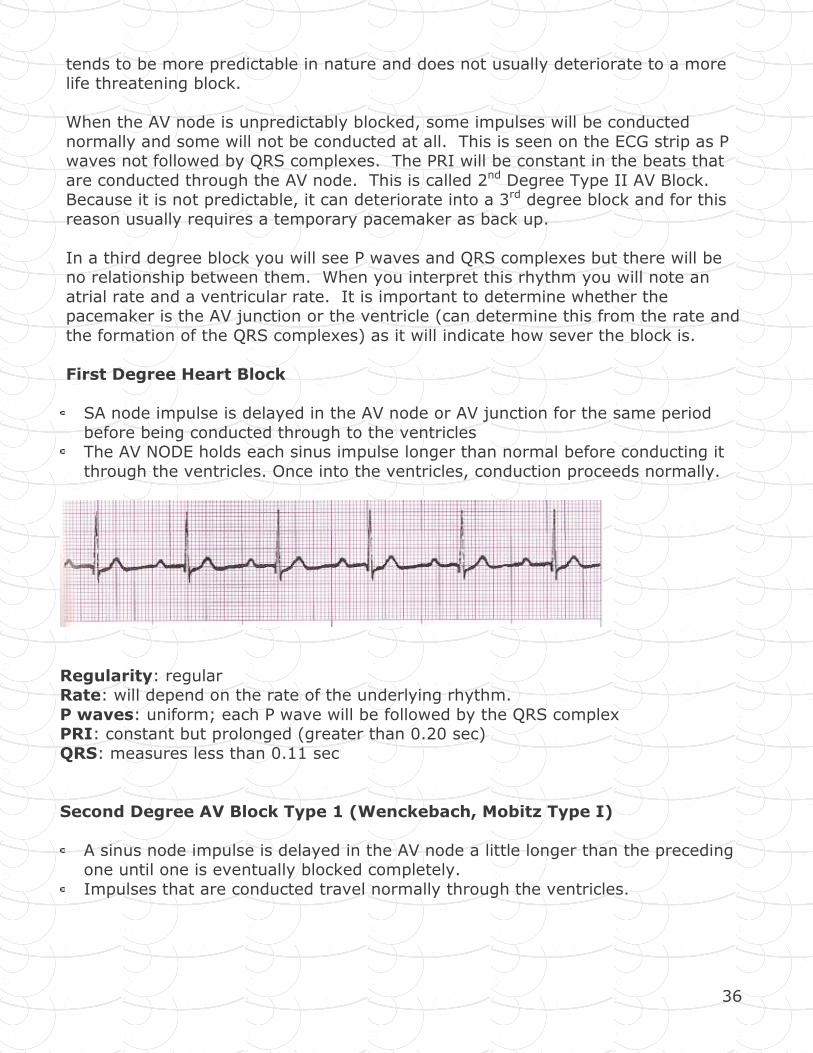
First Degree Heart Block
SA node impulse is delayed in the AV node or AV junction for the same period
before being conducted through to the ventricles The AV NODE holds each sinus impulse longer than normal before conducting it
through the ventricles. Once into the ventricles, conduction proceeds normally.
Regularity: regular Rate: will depend on the rate of the underlying rhythm.
P waves: uniform; each P wave will be followed by the QRS complex PRI: constant but prolonged (greater than 0.20 sec)
QRS: measures less than 0.11 sec
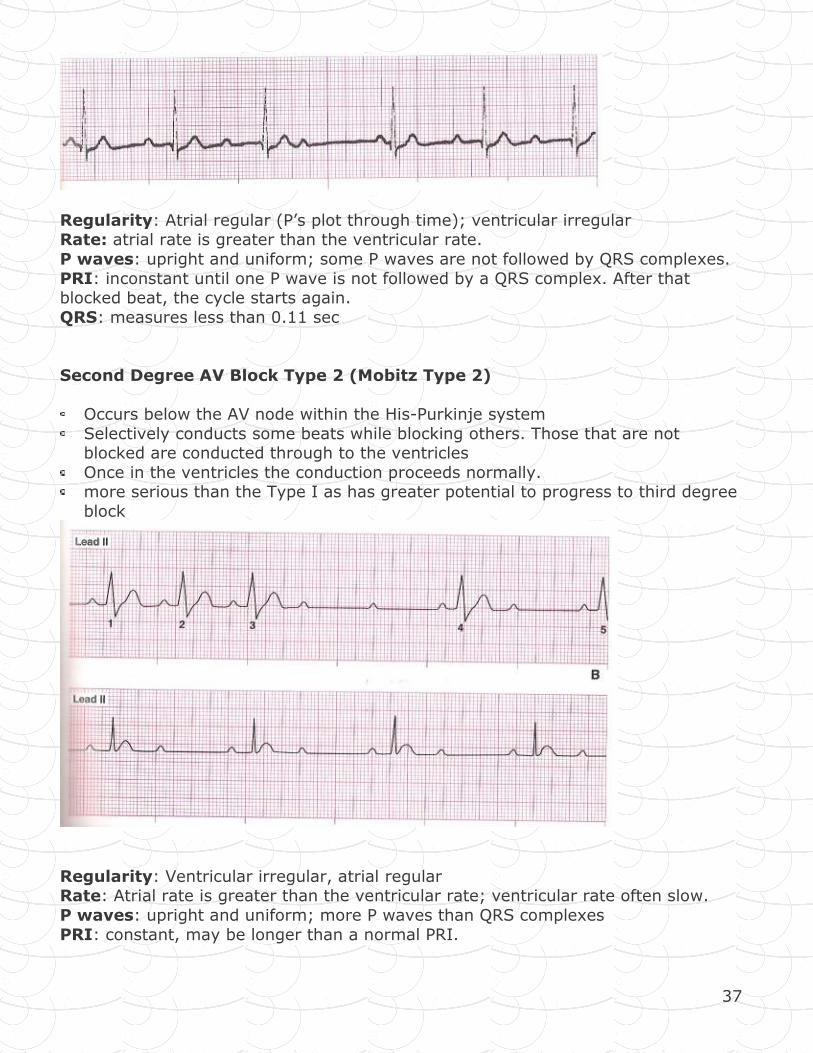
Second Degree AV Block Type 1 (Wenckebach, Mobitz Type I)
A sinus node impulse is delayed in the AV node a little longer than the preceding one until one is eventually blocked completely.
Impulses that are conducted travel normally through the ventricles.
37
Regularity: Atrial regular (P’s plot through time); ventricular irregular Rate: atrial rate is greater than the ventricular rate.
P waves: upright and uniform; some P waves are not followed by QRS complexes.
PRI: inconstant until one P wave is not followed by a QRS complex. After that blocked beat, the cycle starts again.
QRS: measures less than 0.11 sec
Second Degree AV Block Type 2 (Mobitz Type 2)
Occurs below the AV node within the His-Purkinje system
Selectively conducts some beats while blocking others. Those that are not blocked are conducted through to the ventricles
Once in the ventricles the conduction proceeds normally. more serious than the Type I as has greater potential to progress to third degree
block
Regularity: Ventricular irregular, atrial regular Rate: Atrial rate is greater than the ventricular rate; ventricular rate often slow.
P waves: upright and uniform; more P waves than QRS complexes
PRI: constant, may be longer than a normal PRI.