Embed Size (px)
Citation preview

Department of Engineering Physics and Mathematics
Laboratory of Biomedical Engineering
Helsinki University of Technology
Espoo, Finland
Cardiac exercise studies with bioelectromagnetic mapping
Panu Takala
Dissertation for the degree of Doctor of Science in Technology to bepresented with due permission for public examination and debate in Au-ditorium F1 at Helsinki University of Technology (Espoo, Finland) onthe 17th of November, 2001, at 12 o’clock noon.
Espoo 2001

ISBN 951-22-5719-X
Abstract
Bioelectric currents in the heart give rise to differences in electric potential in the body
and on its surface. The currents also induce a magnetic field within and outside the thorax.
Recording of the electric potential on the surface of the body, electrocardiography (ECG), is a
well established clinical tool for detecting insufficient perfusion of blood, i.e., ischemia during
exercise testing. In a more recent technique, magnetocardiography (MCG), the cardiac
magnetic field is recorded in the vicinity of the chest. Despite the clinical significance of the
exercise ECG recordings in patients with suspected coronary artery disease (CAD), little is
known about the effect of stress in the MCG of healthy subjects and patients with CAD.
Methods for analysing multichannel MCG signals, recorded during physical exercise test-
ing, were developed in this thesis. They were applied to data recorded in healthy subjects
to clarify the normal response to exercise in the MCG, and to data of patients with CAD to
detect exercise-induced myocardial ischemia. Together with the MCG, spatially extensive
ECG, i.e., body surface potential mapping (BSPM) was studied and the exercise-induced
alterations in the two mappings were compared.
In healthy volunteers, exercise was found to induce more extensive alterations in the
MCG than in the BSPM during the ventricular repolarisation. In patients with CAD, when
optimal recording locations were found and evaluated, alterations of the ST segment in the
MCG could be used as indicators of ischemia. Also, ischemia was found to induce a rotation
of magnetic field maps (MFMs) which illustrate the spatial MCG signal distribution. The
MFM orientation could successfully be used as a parameter for ischemia detection. In the
BSPM, regions sensitive to ischemia-induced ST segment depression, ST segment elevation,
and ST segment slope decrease were identified.
An analysis method was also developed for monitoring the development of the MCG
and the BSPM distributions. It enables examination of different features of the MCG and
the BSPM signals as a function of time or the heart rate. In this thesis, the method was
used for quantifying exercise-induced change in the orientation of MFMs. Adjustment of the
orientation change with the corresponding alteration of the heart rate was found to improve
ischemia detection by the exercise MCG. When data recorded during the recovery period
of exercise testing were evaluated with similar type of analysis methods, the MCG showed
better performance in ischemia detection than the simultanously recorded 12-lead ECG.


i
Contents
List of Publications iii
List of abbreviations iv
1 Introduction 1
2 Electrophysiological effects of myocardial ischemia 3
2.1 Genesis of normal ventricular action potential . . . . . . . . . . . . . . . . . 3
2.2 Effects of myocardial ischemia . . . . . . . . . . . . . . . . . . . . . . . . . . 4
2.2.1 Changes in ventricular action potential and electrocardiogram . . . . 4
2.2.2 Changes in magnetocardiogram . . . . . . . . . . . . . . . . . . . . . 5
3 Magnetocardiographic stress studies 6
3.1 Review of the literature . . . . . . . . . . . . . . . . . . . . . . . . . . . . . 6
3.2 Magnetocardiographic exercise measurements . . . . . . . . . . . . . . . . . 8
3.2.1 Measurement setup . . . . . . . . . . . . . . . . . . . . . . . . . . . . 8
3.2.2 Measurement protocol . . . . . . . . . . . . . . . . . . . . . . . . . . 10
4 Signal processing and analysis 11
4.1 Signal averaging . . . . . . . . . . . . . . . . . . . . . . . . . . . . . . . . . . 11
4.2 Analysed intervals within cardiac cycle . . . . . . . . . . . . . . . . . . . . . 12
4.3 Visualisation of bioelectromagnetic mapping data . . . . . . . . . . . . . . . 13
4.4 Parametrisation . . . . . . . . . . . . . . . . . . . . . . . . . . . . . . . . . . 14
4.4.1 Signal amplitude . . . . . . . . . . . . . . . . . . . . . . . . . . . . . 14
4.4.2 Magnetic field map orientation . . . . . . . . . . . . . . . . . . . . . 15
4.4.3 Correlation between maps . . . . . . . . . . . . . . . . . . . . . . . . 16
4.4.4 QT interval dispersion . . . . . . . . . . . . . . . . . . . . . . . . . . 17
4.4.5 Source current distributions . . . . . . . . . . . . . . . . . . . . . . . 17
4.5 Finding the optimal recording locations . . . . . . . . . . . . . . . . . . . . . 17
4.6 Beat-to-beat analysis . . . . . . . . . . . . . . . . . . . . . . . . . . . . . . . 18
4.6.1 QRS complex detection . . . . . . . . . . . . . . . . . . . . . . . . . . 18
4.6.2 Baseline estimation . . . . . . . . . . . . . . . . . . . . . . . . . . . . 18
4.6.3 Determination of the T wave apex . . . . . . . . . . . . . . . . . . . . 19
4.6.4 Extraction and filtering of the magnetic field maps . . . . . . . . . . 19
4.7 Heart rate adjustment of ischemia-induced change . . . . . . . . . . . . . . . 21
4.7.1 Electrocardiography . . . . . . . . . . . . . . . . . . . . . . . . . . . 21
4.7.2 Magnetocardiography . . . . . . . . . . . . . . . . . . . . . . . . . . . 21

ii
5 Studies on healthy subjects and patients with CAD 23
5.1 Magnetic and electric mapping in healthy subjects . . . . . . . . . . . . . . . 23
5.1.1 Signal range . . . . . . . . . . . . . . . . . . . . . . . . . . . . . . . . 23
5.1.2 Amplitudes of signal extrema . . . . . . . . . . . . . . . . . . . . . . 23
5.1.3 Spatial patterns . . . . . . . . . . . . . . . . . . . . . . . . . . . . . . 24
5.1.4 Correlation of maps at rest with maps at exercise . . . . . . . . . . . 25
5.1.5 Variation between the subjects . . . . . . . . . . . . . . . . . . . . . 25
5.2 Magnetic field maps in patients with coronary artery disease . . . . . . . . . 25
5.2.1 Orientation . . . . . . . . . . . . . . . . . . . . . . . . . . . . . . . . 26
5.2.2 Rotation . . . . . . . . . . . . . . . . . . . . . . . . . . . . . . . . . . 27
5.2.3 Amplitude . . . . . . . . . . . . . . . . . . . . . . . . . . . . . . . . . 27
5.3 Magnetic and electric mapping in patients with coronary artery disease . . . 28
5.4 Heart rate adjustment in exercise magnetocardiography . . . . . . . . . . . . 30
5.4.1 Receiver operator characteristic curves . . . . . . . . . . . . . . . . . 32
5.5 Ischemia detection by body surface potential mapping . . . . . . . . . . . . . 32
6 Discussion 36
6.1 Magnetic and electric mapping in healthy subjects . . . . . . . . . . . . . . . 36
6.2 Detection of ischemia by magnetocardiography . . . . . . . . . . . . . . . . . 36
6.3 Detection of ischemia by body surface potential mapping . . . . . . . . . . . 38
6.4 Clinical feasibility of stress magnetocardiography . . . . . . . . . . . . . . . 39
6.4.1 Costs and performance . . . . . . . . . . . . . . . . . . . . . . . . . . 39
6.4.2 Detection of CAD by magnetocardiography at rest . . . . . . . . . . 40
6.4.3 Pharmacological stress . . . . . . . . . . . . . . . . . . . . . . . . . . 40
6.4.4 On-line analysis of magnetic field map orientation . . . . . . . . . . . 40
6.5 Main limitations of this thesis . . . . . . . . . . . . . . . . . . . . . . . . . . 40
6.6 Main findings of this thesis . . . . . . . . . . . . . . . . . . . . . . . . . . . . 41
Summary of Publications 42
Acknowledgments 46
References 47

iii
List of Publications
This thesis consists of an overview and of the following six publications:
I Takala P, Hanninen H, Montonen J, Makijarvi M, Nenonen J, Oikarinen L, Simelius K,
Toivonen L and Katila T “Magnetocardiographic and electrocardiographic exercise
mapping in healthy subjects” Ann. Biomed. Eng. 29 501–9 (2001).
II Hanninen H, Takala P, Makijarvi M, Montonen J, Korhonen P, Oikarinen L, Nenonen J,
Katila T and Toivonen L ”Detection of exercise induced myocardial ischemia by mul-
tichannel magnetocardiography in single vessel coronary artery disease” Ann. Noninv.
Electrocardiology 5 147–57 (2000).
III Hanninen H, Takala P, Makijarvi M, Montonen J, Korhonen P, Oikarinen L, Simelius K,
Nenonen J, Katila T and Toivonen L ”Recording locations in multichannel magnetocar-
diography and body surface potential mapping sensitive for regional exercise-induced
myocardial ischemia” Basic Res. Cardiol. 96 405–14 (2001).
IV Takala P, Hanninen H, Montonen J, Makijarvi M, Nenonen J, Toivonen L and Katila T
”Beat-to-beat analysis method for magnetocardiographic recordings during interven-
tions” Phys. Med. Biol. 46 975–82 (2001).
V Takala P, Hanninen H, Montonen J, Korhonen P, Makijarvi M, Nenonen J, Oikarinen L,
Toivonen L and Katila T ”Heart rate adjustment of magnetic field map rotation in
detection of myocardial ischemia in exercise magnetocardiography” Basic Res. Cardiol.
Accepted for publication (2001).
VI Hanninen H, Takala P, Makijarvi M, Korhonen P, Oikarinen L, Simelius K, Nenonen J,
Katila T and Toivonen L ”ST segment level and slope in exercise-induced myocardial
ischemia evaluated with body surface potential mapping” Am. J. Cardiol. Accepted
for publication (2001).

iv
List of abbreviations
The most important abbreviations used in the overview are listed and shortly explained
below.
AUC area under curvebpm beats per minuteBSPM body surface potential mapping / mapCAD coronary artery diseaseCDE current density estimatedc direct currentDI discriminant indexECD equivalent current dipoleECG electrocardiography / -graphicHR heart rateHUCH Helsinki University Central HospitalHUT Helsinki University of TechnologyLAD left anterior descending coronary arteryLCX left circumflex coronary arteryMCG magnetocardiography / -graphicMFM magnetic field mapMI myocardial infarctMRI magnetic resonance imagingRCA right coronary arteryROC receiver operator characteristicSD standard deviationSI smoothness indexSQUID superconducting quantum interference device

1
1 Introduction
Bioelectric currents in the heart give rise to differences in electric potential in the body
and on its surface. The same currents induce also a magnetic field within and outside
the thorax. The recording of electric potential differences on the body surface is called
electrocardiography (ECG). In magnetocardiography (MCG), the magnetic field is measured
in the vicinity of the chest. The ECG and the MCG provide non-invasive means for studying
the cardiac function and diseases of the heart.
In coronary artery disease (CAD), the blood flow and oxygen delivery to the heart are
hampered by a stenosis in one or several coronary arteries. If the stenosis results in insuffi-
cient perfusion, i.e. ischemia, it may depress the function of the myocardial area nourished
by the culprit vessel. Ischemia may also alter the electric activation of the heart, which
forms the basis for diagnosis of CAD by the ECG and the MCG. In many cases ischemia
occurs only when the demand for blood in the heart is increased by physical or mental stress.
Electrophysiological effects of ischemia are discussed in section 2 of this thesis.
The most widely used diagnostic and prognostic test for CAD is 12-lead exercise ECG,
in which physical exercise is used to provoke ischemia. It is inexpensive, fast and well-
standardized test but its sensitivity to CAD is less than 75% (Gianrossi et al. 1989). In
women, the accuracy of standard exercise ECG is impaired by increased rate of false posi-
tive findings (Alexander et al. 1998). Other non-invasive methods for detecting ischemia are
therefore demanded. The MCG has been suggested to provide information complementary
to the ECG on the cardiac function (Brockmeier et al. 1994 and 1997, Lant et al. 1990).
Compared to the ECG, the MCG is a recent technique. The first commercial multichannel
MCG devices became available in the beginning of the 1990’s (Nowak 1998). The recording
of multichannel MCG during exercise testing provides an extensive spatial scope and good
temporal resolution for studying the heart in changing physiological conditions. However,
lack of commercially available non-magnetic exercise equipment and low number of multi-
channel MCG recording devices have stalled the research on the exercise MCG. The methods
and main results of previous stress MCG studies are described in section 3 of this thesis.
In this thesis, new methods for recording and analysing multichannel exercise MCG
data were developed. The aims were to clarify the response of healthy subjects to exercise
in the MCG, and to develop methods for detecting ischemia by exercise MCG in patients
with CAD. Together with the MCG, the spatially extensive electric body surface potential
mapping (BSPM) was studied, and these two noninvasive mapping methods were compared.
A laboratory-made non-magnetic ergometer (Takala 1997) that enabled the exercise MCG
recordings, was used in this study. The ergometer and the exercise MCG measurement
protocol used in this thesis are described in the latter part of section 3.
A multichannel exercise MCG recording provides a multitude of spatial and temporal

2 1 INTRODUCTION
information. Effective signal processing is therefore essential for rejecting artefacts, improv-
ing the signal to noise ratio, and extracting and quantifying the desired features in the
signal. Signal analysis methods used in previous studies and those developed in this thesis
are presented in section 4.
Main results of the studies on patients and healthy controls, obtained in this thesis, are
described in section 5. The effect of exercise on the MCG and the BSPM signals of healthy
subjects was evaluated and the two mappings were compared in Publication I. In Publica-
tion II, ischemia-induced changes in the MCG were quantified and a method for detecting
ischemia in CAD patients by the MCG was developed. The optimal recording locations
for detecting CAD by the MCG and the ECG were studied in Publication III. Utilising
a beat-to-beat analysis method developed in Publication IV, ischemia detection by heart
rate adjustment of alteration in the MCG was studied in Publication V. In Publication VI,
optimal recording locations for detecting exercise-induced ischemia by signal amplitude and
morphology in the BSPM were studied in a heterogeneous CAD patient population. The
methods and results of this thesis are discussed in section 6.

3
2 Electrophysiological effects of myocardial ischemia
2.1 Genesis of normal ventricular action potential
The ECG and MCG signals are caused by electric activation of cardiac cells. This activity
is to a large extent determined by the active and passive properties of the cell membrane
which regulates the flux of ions in and out of the cell. Normally, the electrically active
cells of ventricular myocardium have a resting membrane potential of approximately -78 mV
(Surawicz 1995). This potential is mainly generated by the concentration gradients of sodium
(Na+) and potassium (K+) ions over the cell membrane. The ratio of intracellular to
extracellular K+ concentration is approximately 30:1 and the corresponding ratio of Na+ is
1:15. The equilibrium potential, determined by the Nernst equation, is -94 mV for K+ and
+41 mV for Na+. At rest the cell membrane is nearly freely permeable to K+ but not very
permeable to Na+. Thereby, the membrane potential is close to the equilibrium potential
of K+.
The depolarisation of a cardiac cell consists of a fast change of the membrane poten-
tial from a steady state close to the equilibrium potential of Na+. It is determined almost
exclusively by an increase in Na+ conductance as a function of membrane potential. The
depolarisation is initiated by a propagating electric impulse, causing an increase of the mem-
brane potential to the threshold of about -55 to -50 mV. Consequently, the permeability of
Na+ ions increases allowing influx of Na+ ions. This increases the intracellular concentration
of cations and further depolarisation takes place. Depolarisation continues until the mem-
brane potential becomes close to the resting membrane potential of Na+. In ventricular cells
the depolarisation is followed by a plateau of membrane potential during which a balance
between inward and outward currents through the membrane is maintained. Repolarisation
back to the resting membrane potential is nearly 100 times slower than the depolarisation.
It is primarily due to passive influx of K+ ions to the cell, bringing the membrane potential
close to the equilibrium potential of K+. The concentration gradients of Na+ and K+ ions
and the resting membrane potential are maintained by active, energy-consuming Na+/K+
pumps.
The electrical activation induces mechanical contraction of the cardiac cell. The con-
traction is initiated by an influx of Ca2+ ions to the cell during the plateau of the action
potential. During the activation the cell is refractory and does not respond to additional elec-
tric stimulus. In the ECG and MCG signal morphology, the QRS complex originates from
the depolarisation of ventricular myocardium, the ST segment corresponds to the plateau of
the action potential, and the T wave corresponds to the repolarisation phase of ventricular
myocardium (Fig. 1).

4 2 ELECTROPHYSIOLOGICAL EFFECTS OF MYOCARDIAL ISCHEMIA
2.2 Effects of myocardial ischemia
2.2.1 Changes in ventricular action potential and electrocardiogram
Myocardial ischemia depolarises of the resting membrane potential toward the zero potential
and decreases the upstroke velocity of the action potential. It also results in shorter duration
and lower amplitude of action potential (Fig. 1). The processes behind these alterations are
diverse, the major contributors being cellular potassium loss, accumulation of extracellular
K+, and acidosis (Surawicz 1995). In exercise-induced ischemia in general, the alterations
of action potential take place first at the subendocardium.
During the plateau of the ventricular action potential, corresponding to the ST segment
of the ECG, the intracellular potential of the healthy myocardial cells is higher than the
potential of the ischemic cells. This induces the systolic injury current form the healthy to
the ischemic myocardium and larger positive charge densities on the membrane surfaces of
the ischemic cells (Savard 1983). Correspondingly, the negative charge density is higher on
the membrane surfaces on the healthy cells and a depression of the ST segment is seen in
the precordial ECG leads. The alterations in the action potential and the systolic injury
current are illustrated in Fig. 1.
Different resting membrane potentials of the healthy and the ischemic myocardium induce
a diastolic injury current. During the TP interval in the ECG, the intracellular potential
is higher in the ischemic cells than in the normal cells. The injury current flows from the
ischemic toward the normal tissue and the positive charge density is higher on the membrane
surfaces of the normal cells (Savard 1983). This diastolic current flows during the TP interval
of the ECG and is interrupted during the ST segment. The more positive charge density on
the membrane surfaces of the normal cells compared to ischemic cells induces an elevation of
the baseline in the precordial ECG leads (Surawicz 1995). The conventional ECG, recorded
with alternating current coupled amplifiers, does not reveal displacement of the baseline, and
therefore does not differentiate between the ST segment displacement caused by the systolic
and the diastolic injury current.
In the simplest model of the ischemia-induced current, the currents over the boundary of
ischemic and normal myocardium are lumped into a single current dipole p. In an infinite
homogeneous and isotropic volume conductor, a current dipole induces an electric potential
V (r) =1
4πσ
p ·RR3
, (1)
where r is the observation point, R is the vector pointing from the location of the current
dipole to r, and σ is the conductivity of the medium. The dipole strength is proportional to
the difference in membrane potentials of the normal and ischemic cells.
5
Fig. 1: A schematic illustration of ischemia-induced changes of the myocardial action poten-tial and the electrocardiogram (ECG). Left: the action potential of a normal (black curve)and an ischemic (grey curve) cell. Center: illustration of the left ventricle. Subendocardialischemic myocardium is denoted by grey colour. Systolic injury current (black arrow) duringthe plateau of the action potential is directed from the healthy to the ischemic myocardium.Right: the subendocardial ischemia induces ST segment depression in the ECG leads at theleft lateral thorax.
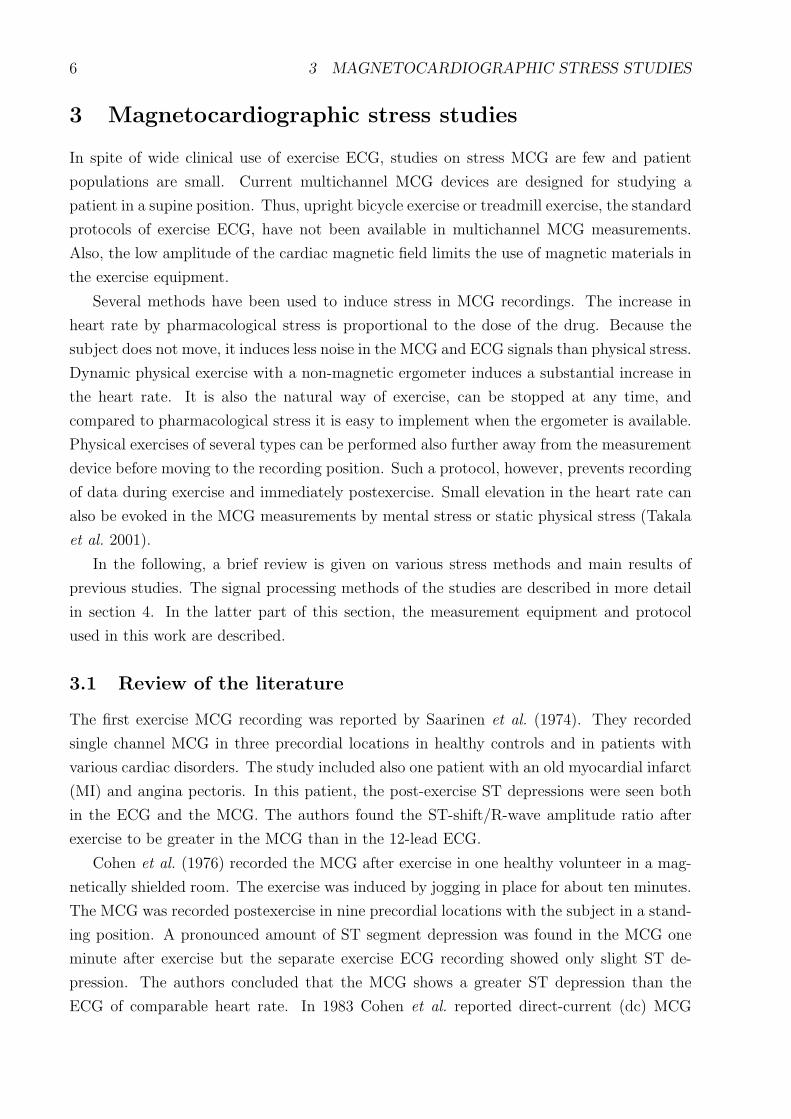
2.2.2 Changes in magnetocardiogram
With the single current dipole source model and an infinite homogeneous and isotropic
conductor, the ischemia-induced magnetic field can be expressed as
B(r) =µ
4π
p×R
R3, (2)
where µ is the magnetic permeability of the medium. Thereby, an injury current in the heart
oriented from the lower left chest toward the right shoulder would induce a magnetic field
toward the upper left thorax and out of the central inferior chest during the ST segment.
The first-order approximations presented here are very rough. Both the ischemia-induced
electric potential and magnetic field are affected by inhomogeneities and boundaries of the
thorax, for example. Also, the ischemic current source is distributed and the dipole approx-
imation is not optimal. Still, the simple current dipole model provides a means for making
qualitative hypothesis for the ischemia-induced changes and their spatial distribution in the
ECG and the MCG.
6 3 MAGNETOCARDIOGRAPHIC STRESS STUDIES
3 Magnetocardiographic stress studies
In spite of wide clinical use of exercise ECG, studies on stress MCG are few and patient
populations are small. Current multichannel MCG devices are designed for studying a
patient in a supine position. Thus, upright bicycle exercise or treadmill exercise, the standard
protocols of exercise ECG, have not been available in multichannel MCG measurements.
Also, the low amplitude of the cardiac magnetic field limits the use of magnetic materials in
the exercise equipment.
Several methods have been used to induce stress in MCG recordings. The increase in
heart rate by pharmacological stress is proportional to the dose of the drug. Because the
subject does not move, it induces less noise in the MCG and ECG signals than physical stress.
Dynamic physical exercise with a non-magnetic ergometer induces a substantial increase in
the heart rate. It is also the natural way of exercise, can be stopped at any time, and
compared to pharmacological stress it is easy to implement when the ergometer is available.
Physical exercises of several types can be performed also further away from the measurement
device before moving to the recording position. Such a protocol, however, prevents recording
of data during exercise and immediately postexercise. Small elevation in the heart rate can
also be evoked in the MCG measurements by mental stress or static physical stress (Takala
et al. 2001).
In the following, a brief review is given on various stress methods and main results of
previous studies. The signal processing methods of the studies are described in more detail
in section 4. In the latter part of this section, the measurement equipment and protocol
used in this work are described.
3.1 Review of the literature
The first exercise MCG recording was reported by Saarinen et al. (1974). They recorded
single channel MCG in three precordial locations in healthy controls and in patients with
various cardiac disorders. The study included also one patient with an old myocardial infarct
(MI) and angina pectoris. In this patient, the post-exercise ST depressions were seen both
in the ECG and the MCG. The authors found the ST-shift/R-wave amplitude ratio after
exercise to be greater in the MCG than in the 12-lead ECG.
Cohen et al. (1976) recorded the MCG after exercise in one healthy volunteer in a mag-
netically shielded room. The exercise was induced by jogging in place for about ten minutes.
The MCG was recorded postexercise in nine precordial locations with the subject in a stand-
ing position. A pronounced amount of ST segment depression was found in the MCG one
minute after exercise but the separate exercise ECG recording showed only slight ST de-
pression. The authors concluded that the MCG shows a greater ST depression than the
ECG of comparable heart rate. In 1983 Cohen et al. reported direct-current (dc) MCG
7
measurements in a CAD patient undergoing two-step exercise test. Their aim was to study
the mechanism underlying the ischemia-induced ST segment depression in the ECG. The
recording was the first non-invasive measurement of injury current in the human heart. By
recording the dcMCG they could separate the apparent (diastolic) and true (systolic) ST
shifts and indicated the presence of the apparent type of ST shift. This shift is caused by
injury current and is interrupted during the ST interval (see section 2). In recordings made
at rest (Savard et al. 1983) in three patients with early repolarisation and in one patient
with left bundle branch block they also studied the electrophysiological basis of the ST shift.
They found that the ST shifts were not caused by a dc injury current. Instead, they were
caused by a current flowing only during systole and the authors suggest that the ST shifts
were due to altered repolarisation of the ventricles.
Brockmeier et al. (1994) studied 20 healthy young male subjects during exercise with
single channel MCG. The MCG and unipolar ECG were recorded over a rectangular array of
16 precordial locations. The stress was induced with a wooden lever which the subject lifted
with his legs. Using signal averaged data from all recording locations, the authors formed
magnetic isofield maps (MFMs) illustrating the distribution of magnetic field component
normal to the measurement plane. This work was the first MCG mapping study during
exercise. Significant ST segment displacements were seen in the MCG but not in the ECG
and the authors concluded that the MCG shows the junctional ST-T segment changes earlier
than the ECG.
In the beginning of the 1990’s the first multichannel MCG devices were constructed. For
exercise studies this was a significant improvement, removing the need of continuous exercise
at constant heart rate for acquiring data for one map. This promoted the clinical feasibility
of exercise MCG mapping.
Kawaoka et al. (1996) used a non-magnetic stepper ergometer to induce mild stress dur-
ing supine 37-channel MCG measurements in four normal subjects. They found a broad
strong spatial correlation of adjacent channel measurements of atrial activity and changing
correlation of more localised conduction system activity. Utilising these features they sepa-
rated the atrial activity from conduction system activity and estimated conduction system
changes during rest and exercise.
The first pharmacological stress MCG study was reported by Brockmeier et al. (1997).
They induced pharmacological stress with atropine and orciprenaline during 37-channel
MCG recordings in three healthy volunteers. In one subject also two reinvestigations were
made. The ECG was recorded with 32 leads, simultaneously with the MCG. In concordance
with their earlier work (Brockmeier et al. 1994) they found ST segment and T wave changes
in the MCG, but not in the ECG. On some MCG channels, also T wave inversions took
place during stress. The results are an important indication of difference between the ECG
and the MCG. The authors suggest that the biophysical basis of this difference is the change

8 3 MAGNETOCARDIOGRAPHIC STRESS STUDIES
in the intensity and/or orientation of circular vortex currents.
Hailer et al. (1999) studied 15 patients with chest pain but no history of cardiovascular
disease. Seven of the patients had a significant coronary stenosis, documented in coronary
angiography. Pharmacological stress was induced by arbutamine during the 37-channel
MCG measurements. The authors evaluated parameters based on spatial distribution of
QT interval duration and found a significant difference between patients with and without
significant coronary stenosis, both at rest and during stress. They concluded that evaluation
of spatial distribution of QT interval duration increases the sensitivity of QT interval analysis
in detection of CAD. They also suggested that complex repolarisation changes are not as
apparent in 12-lead ECG as in MCG which has a better spatial scope.
Studies on stress MCG, published as long articles in referred journals before the year
2000, include a total of 22 subjects studied with a multichannel device. Twenty three
subjects were studied with a single channel device. In addition, several conference abstracts
and short papers on the topic have been published (Seese et al. 1995, Moshage et al. 1997,
Gessner et al. 1999, Hanninen et al. 1999, Makijarvi et al. 1999, Pesola et al. 1999, Takala
et al. 1999, Van Leeuwen et al. 1999 and 2001, Winklmaier et al. 1999, Fischer et al. 2001,
for example). For this thesis, bicycle exercise MCG and BSPM were recorded in altogether
44 subjects, including 27 patients with single vessel CAD and 17 healthy volunteers.
3.2 Magnetocardiographic exercise measurements
3.2.1 Measurement setup
The exercise MCG measurements were performed at the BioMag Laboratory at Helsinki
University Central Hospital (HUCH) in a magnetically shielded room (MSR) (Paavola et al.
2000). Fig. 2 illustrates the coil arrangement and positioning of the 67–channel cardiomag-
netometer over the chest (Montonen et al. 2000). The center of the cardiomagnetometer was
placed 15 cm below the jugulum and 5 cm left of the midsternal line. Distance from the
chest was set to enable maximal inhale without a contact between the skin and the bottom
of the magnetometer.
The laboratory-made non-magnetic ergometer (Takala 1997) used in the measurements is
shown in Fig. 3. Fixing the ergometer on the measurement bed takes less than one minute.
The bed can be moved freely in and out of the MSR with the ergometer attached. The
subject pedals the ergometer in a supine position, feet fastened on the pedals with foot
straps which can be opened quickly when necessary. A padded belt around the subject’s
shoulders (Fig. 3) supports the subject and prevents movement backwards during pedaling.
The ergometer frame and wheel were made of plywood and other materials used in the
construction include aluminum, brass and rubber. The bearings of the wheel and pedals
were made of polyester. Copper brushes wipe the wheel, leading electric charge to earth and
9
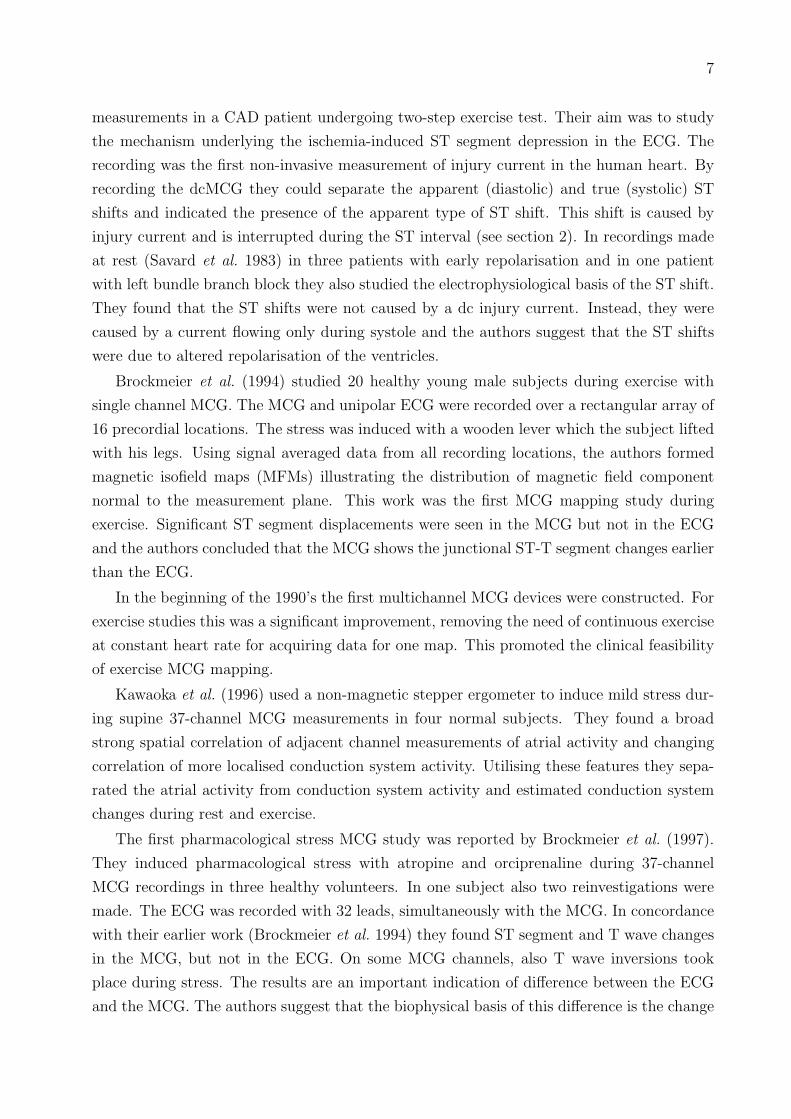
Fig. 2: A magnetocardiographic (MCG) recording in the BioMag Laboratory. Left: the car-diomagnetometer and the measurement bed. Right: a) Positioning of the MCG sensor arrayover the chest. The circles show the locations of axial gradiometers detecting ∂Bz/∂z, whilethe squares refer to planar gradiometer units detecting ∂Bz/∂x and ∂Bz/∂y. b) An exampleof signal morphology of one MCG channel, indicated in a). c) An example of an isofield MCGmap illustrating the distribution of Bz over the mapped area at the time instant indicated inb). Positive values (solid lines) in the map denote magnetic flux toward the chest.
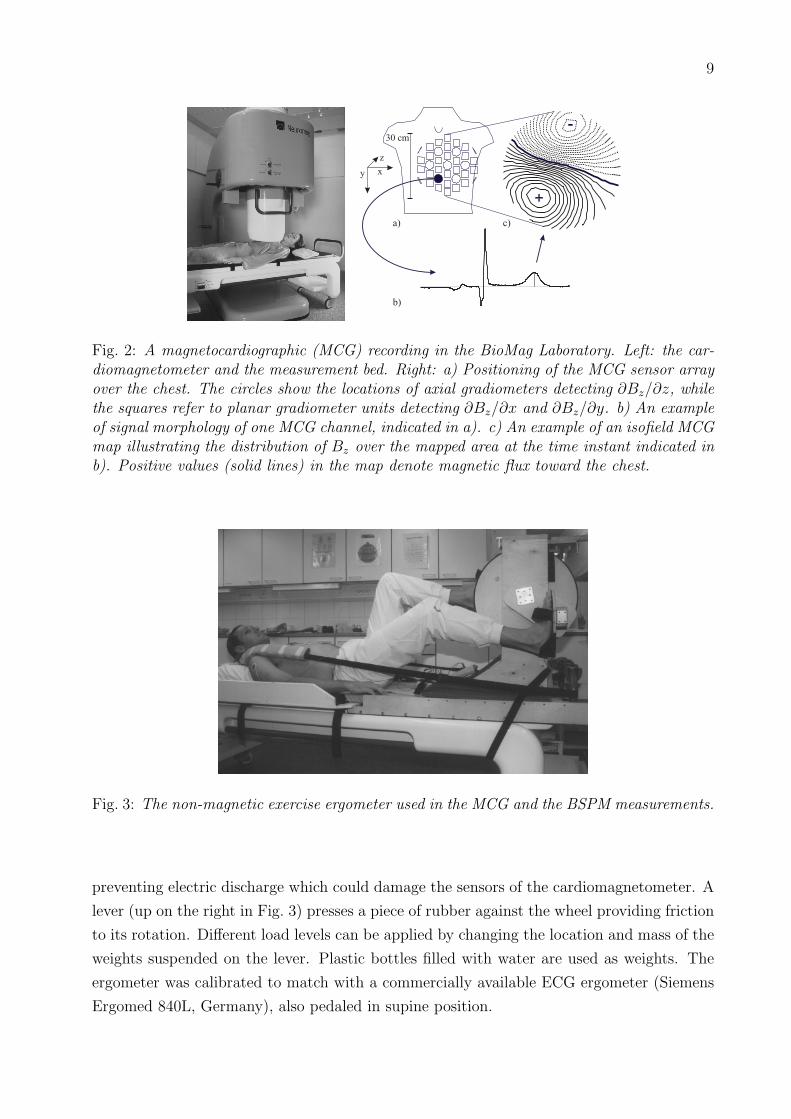
Fig. 3: The non-magnetic exercise ergometer used in the MCG and the BSPM measurements.
preventing electric discharge which could damage the sensors of the cardiomagnetometer. A
lever (up on the right in Fig. 3) presses a piece of rubber against the wheel providing friction
to its rotation. Different load levels can be applied by changing the location and mass of the
weights suspended on the lever. Plastic bottles filled with water are used as weights. The
ergometer was calibrated to match with a commercially available ECG ergometer (Siemens
Ergomed 840L, Germany), also pedaled in supine position.

10 3 MAGNETOCARDIOGRAPHIC STRESS STUDIES
3.2.2 Measurement protocol
Magnetocardiography A baseline recording of 5 minutes with the subject at rest was
made for a reference. In the exercise test, one minute of data were first recorded at rest
with the subject’s feet attached on pedals. Thereafter, the exercise was started and load
on the subject was increased every two minutes. Cessation criteria for the exercise were
as recommended by the American Heart Association for the exercise ECG (Fletcher et al.
1995). Typical reasons for cessation were severe fatigue or dyspnoea, or chest pain. After
exercise, 10 minutes of data were recorded during recovery. The signals were band–pass
filtered to 0.03 Hz – 300 Hz, digitised at a sampling frequency of 1 kHz, and stored on
a computer hard disk. During the measurements, one physician was inside the MSR while
another monitored the recorded signals outside. Audio connection and video monitoring were
used for communication between interior and exterior of the MSR during the measurements.
A 12-lead ECG was recorded simultaneously with the MCG using the same data acqui-
sition system and non-magnetic electrodes and connectors. Blood pressure and heart rate
were monitored with a Datex–Engstrom AS/3 Compact Monitor, placed outside the MSR.
Body surface potential mapping The same exercise protocol as in the MCG recordings
was used in the separate BSPM measurements. Unipolar potentials were recorded with
120 Ag/AgCl electrodes placed on the thorax (Simelius et al. 1996, Fig. 4) and three limb
potentials with electrodes on the right and left shoulder and the left hip. Average of the
limb potentials was used as a reference for the unipolar leads. The thorax electrodes were
mounted on 18 strips with an inter-electrode distance of 5 cm. The strips were placed on the
subject’s thorax vertically and their horizontal spacing was determined using the individual
dimensions of the upper body. Forty-five of the electrodes were on the posterior thorax.
The front-end electronics of the mapping system was placed inside the MSR. The data were
transferred optically to a personal computer controlling the data acquisition outside the
MSR. After band-pass filtering from 0.16 Hz to 300 Hz, the signals were digitized with the
sampling rate of 1 kHz.

11
Fig. 4: The electrode layout of the 123 channel body surface potential mapping system. Thevertical line indicates the level of the fourth intercostal space. The three limb leads (channels1 - 3) are not shown.
4 Signal processing and analysis
4.1 Signal averaging
Signal averaging is a commonly used method for increasing the signal to noise ratio of the
ECG and the MCG recordings. The main objective is to find a representative complex of
data with low noise. In most stress MCG studies (Brockmeier et al. 1994 and 1997, Hailer
et al. 1999, and Seese et al. 1995, for example) signal averaging has been the first phase of
the analysis.
In the exercise MCG and BSPM measurements of this thesis, the low frequency noise
caused by heavy breathing was more extensive after exercise than at rest. By signal averag-
ing, effect of baseline drift was reduced, signal baseline was defined and beats with artefacts
were excluded. In addition, high frequency noise observed in the signal was reduced. At each
time interval of the exercise testing to be analysed, representative complexes of the MCG
and the ECG data were obtained by the signal averaging. In Publication I, signals recorded
at rest and immediately after cessation of exercise were averaged. In Publications II, III, and
VI, also data at 2 and 4 minutes postexercise were evaluated. Due to magnetic noise in some
recordings, the MCG data recorded during exercise were not analysed. In Publication VI,
only BSPM were recorded and signals just before and immediately after cessation of exercise
were averaged.
A software developed in collaboration between the Laboratory of Biomedical Engineering
at Helsinki University of Technology (HUT), and the Neuromag Ltd. was employed for
signal averaging. The averaging parameters and exclusion criteria for beats with artefacts
were adjusted for exercise data. Before averaging, channels with excessive noise in visual
inspection were excluded from the analysis. As the first phase of the averaging process, a
12 4 SIGNAL PROCESSING AND ANALYSIS
template beat with good signal quality in visual observation was selected. The PQ and TP
intervals of the template were manually determined on one ECG channel. On each channel,
a regression line was fitted on a set of data points at these intervals. In case of high heart
rate with a non-detectable TP interval, two consecutive PQ intervals were used. The line
was then subtracted from the signals of the template beat on all channels, to establish the
baseline level and to reduce low frequency noise.
A range of acceptable data values, called a tube, was formed around the ST segment
and the first part of the T wave of the template. The tube was obtained by shifting the
template both in time and amplitude coordinates to form envelope curves above and below
the template (Paavola et al. 1995, Vaananen et al. 2000). The shift in time was ±5 ms while
the amplitude shift was dependent on the noise level of the signal (see below).
Data on one manually selected ECG channel with high signal amplitude was used in
detecting the QRS complexes in each cardiac cycle. The highest signal correlation over the
QRS complex was used in determining the time alignment between the template and the
first cardiac cycle of data to be processed. On each channel, the baseline-corrected candidate
beat was compared with the template and if it did not fit inside the tube, that channel was
considered corrupted. Different sensor types (co-axial gradiometers, planar gradiometers,
and ECG leads) were evaluated separately and if over 10 % of channels were corrupted in
any of the sensor groups, the candidate beat was excluded from the average. Otherwise, the
average of the two beats (the template and the candidate) was calculated. The cumulative
average was then used in evaluation of acceptance of the next candidate beat. At each
interval of the exercise testing to be evaluated, 40 cardiac cycles of data were processed and
the result of the signal averaging was the average of the accepted beats. When calculating
the tube, the amplitude shift of the template was defined for each sensor type separately
and adjusted in such a manner that approximately one half of the beats were included in
the average. For example, if less than 20 beats were included, the tubes were broadened and
the averaging was repeated.
4.2 Analysed intervals within cardiac cycle
The ischemic injury current alters the bioelectromagnetic signals during the ventricular re-
polarisation (see section 2). In clinical exercise ECG analysis, the signal amplitude at a time
instant of 60 ms or 80 ms after the QRS complex offset (J point) is evaluated (Chaitman
1997). The QT interval duration, however, alters with changing heart rate during exercise
testing. Thus, when the observation point is fixed at a given time offset from the QRS
complex, different time points in the signal morphology are evaluated. For example, at rest
the J point + 80 ms falls in the ST segment whereas in many subjects at peak exercise this
time point falls in the up-sloping section of the T wave.
13
McPherson et al. (1985) studied healthy controls with the BSPM during upright exer-
cise testing. They evaluated the potential distributions at different time instants within
the cardiac cycle and found that temporally-indexed points on the ST-T waveform during
exercise may be misleading. In contrast, the midpoint between the QRS offset and the T
wave apex showed little change during exercise in normal subjects. The principle of fixing
the observation point at the ST segment to signal morphology was adopted in this thesis.
In Publication I, the mid point between QRS offset and the T wave apex was selected for
evaluation and in Publications II–VI, the ST segment was defined as the second quarter of
the time from the QRS offset to the T wave apex. This allowed time integration of the data
and reduced the effect of noise. In addition to the ST segment, the analysis of the MCG
and the BSPM data was extended to the T wave. The time from the QRS offset to the T
wave apex depends on the spatial location of the ECG lead or the MCG channel evaluated.
In Publication I the time instant of T wave apex was determined form the ECG lead II.
In Publications II, III, and VI, signals of the seven co-axial gradiometers in the MCG and
the precordial ECG leads V1–V6 in the BSPM were used. In Publications IV and V, the
multichannel MCG data were utilised and the T wave apex was defined as the median over
all channels (see section 4.6.3).
4.3 Visualisation of bioelectromagnetic mapping data
MFMs, illustrating the spatial distribution of the magnetic field component normal to the
measurement plane, are standard means for illustrating the MCG data at a fixed time
instant within the cardiac cycle. For evaluation of a time interval, signals on all channels
are integrated over the interval to form an integral map. In this thesis, the integral maps
were scaled by the length of the integration time, i.e., they illustrate the spatial distribution
of the signal mean over the given interval.
In Publications I–III and VI, group-mean maps of different patient groups were calcu-
lated. They present the average signal value over all subjects at each recording location
at a given time instant or interval. Difference maps and group-mean difference maps were
used for illustrating the change in signal distribution due to exercise. They were formed by
subtracting the signal value at rest from the signal value after exercise at each recording
location.
A software developed in collaboration between the Laboratory of Biomedical Engineering
at HUT, and the Neuromag Ltd. was used for producing the isocontour maps. The method
is described in the Appendix of Publication I. Briefly, in both mappings a minimum-norm
estimate of a source current distribution was first calculated from the measured data. In
the MCG, the source currents were calculated on a slab with the size and form of the
measurement plane, 10 cm below it. In the BSPM, sensor surface (= the torso surface) was
14 4 SIGNAL PROCESSING AND ANALYSIS
scaled to one half of the size, and placed concentrically with the true torso, providing 6–8 cm
radial distance from the calculation surface to the electrode surface. The signal values over
the triangulated sensor plane in the MCG and over the standard torso model in the BSPM
were then calculated from these source current distributions, to obtain the isocontour maps.
4.4 Parametrisation
In stress studies, different physiological conditions augment the spatial and temporal in-
formation obtained by the MCG recording. Several parameters have been suggested for
detection of ischemia-induced changes in patients, and for describing the essential alter-
ations of the signals recorded in healthy subjects in stress testing. A brief summary of these
parameters is presented below.
4.4.1 Signal amplitude
In exercise ECG, detection of CAD is based on the change of the signal amplitude at the ST
segment. Also in the first exercise MCG recording, Saarinen et al. (1974) determined the
ST-shift/R-wave amplitude ratio to quantify the change in the MCG after exercise in a CAD
patient. Calculation of the ratio provided a unitless quantity which enabled the comparison
between the MCG and the ECG.
In MCG and BSPM recordings made at rest in patients with MI, Lant et al. (1990)
evaluated the individual map variability V as a root mean square difference between the
signal distribution of each subject and mean map of a control group. The parameter was used
for quantifying the differences in the amplitude and morphology in a map of each individual,
compared to the reference map of the control group. Group mean map variability V was
used to test the ability of the MCG and the BSPM to distinguish between patients and
healthy volunteers at several intervals of the QRST complex. The authors also calculated
the group mean normalised variability by dividing V by the difference between magnitudes
of extrema in the group mean map of the control group.
Brockmeier et al. (1994) calculated the range of magnetic field strength (difference of
positive and negative signal extrema over the mapped area) at the ST segment at rest and
after exercise, to quantify the effect of exercise. Van Leeuwen et al. (1999) used the same
parameter and evaluated its values over the time-normalised QT interval.
In Publication I, the exercise-induced alteration in the MCG and the BSPM of healthy
volunteers was quantified at several time instants of the cardiac cycle by calculating the
change in the values of the signal maximum and the minimum over the mapped area. The
statistical significance of alteration was used to determine if the extent of response to exercise
was different in the MCG, compared to the BSPM. The amplitude ranges of the QRS complex
and the ST segment were also evaluated to quantify the exercise-induced alteration in the
15
MCG and the BSPM.
4.4.2 Magnetic field map orientation
Orientation of an MFM can be used as a rough approximation of the direction of the electric
activation of the heart, although it is affected by the inhomogeneities of the body (Tripp
1982). Contrary to the signal amplitude, the orientation is not sensitive to the distance
between heart and the MCG sensors (Kandori et al. 2001). Given the variability of body
size in patients with suspected CAD, this is an important feature. Various methods have
been used to measure the orientation of the MFM.
Van Leeuwen et al. (1999) defined the MFM orientation as the angle formed by the line
joining the centers of gravity of the positive and negative magnetic field values and the
right-left line across the torso. They calculated the angle values over the time-normalised
cardiac cycle in CAD patients at rest. The angle vs. time traces of healthy controls were
used for defining the normal range of angle values and deviations from it were considered
abnormal. They also evaluated the width of the magnetic field distribution as the distance
between the centers of gravity. In the same study, a two dimensional direction and strength
of an equivalent current dipole (ECD) was used to quantify the orientation and strength of
the field distribution.
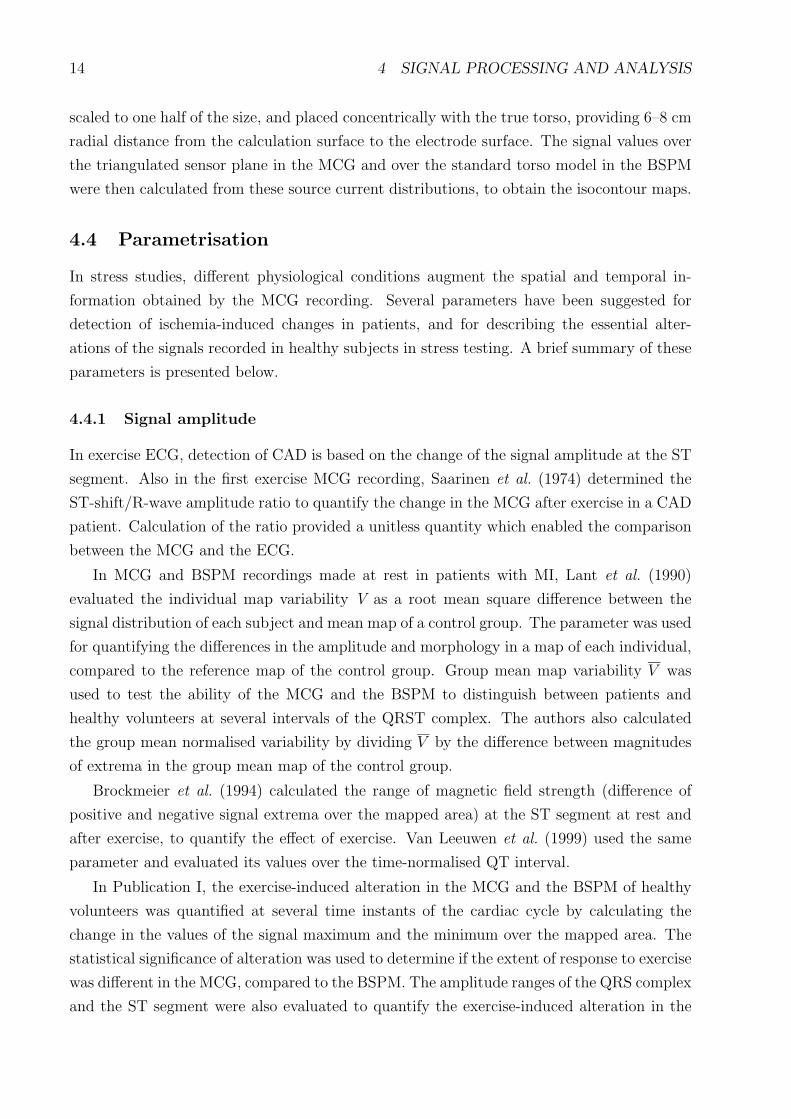
In Publication II, the orientation of MFMs was calculated in two different ways. In the
manual analysis, the MFMs of the intervals selected for evaluation were first formed. The
signal extrema of each MFM were then connected with a line and the angle between this line
and the patient’s right-left direction was defined as the MFM orientation. The drawback of
this manual method was that both the positive and the negative signal extrema were not
always over the mapped area. For example, if only a small proportion of the MFM had a
positive signal value, the orientation of the line was hard to define. Likewise, if the magnetic
field distribution over the mapped area was totally monopolar its orientation could not be
determined.
The other method for quantifying the MFM orientation was based on arrow maps, intro-
duced by Cohen et al. (1976b). First, the spatial gradient (∂Bz/∂x, ∂Bz/∂y) of the magnetic
field component Bz normal to the measurement plane was calculated over the mapping area.
The MFM orientation was then defined as the direction of the largest gradient, and the
MFM angle was the angle between this gradient and the patient’s right-left line (Fig. 5).
The direction of the gradient was defined so that MFM angle values between 0 and 90 degrees
were obtained during the T wave in a normal heart.
Recently, Kandori et al. (2001) suggested calculation of a total current vector to detect
myocardial abnormality. They first calculated current arrow maps, i.e., the spatial derivatives
of the component of the magnetic field normal to the measurement plane (Tsukada et al.
2000). The total current vector was then obtained as the sum of all current arrows. The

16 4 SIGNAL PROCESSING AND ANALYSIS
Fig. 5: Calculation of the orientation of magnetic field maps (MFMs). (a) An example ofa MFM. (b) Spatial gradients of the data in (a). The largest gradient and its orientationare indicated with a large arrow. (c) The MFM angle α was measured in respect to subject’sright-left line. (From Publication IV)
orientation of the vector was used as a parameter to separate patients with CAD and patients
with hypertrophic cardiomyopathy from healthy controls. The authors calculated the total
current vector at two time instants of the ST segment and formed another parameter as the
difference of the two vectors.
4.4.3 Correlation between maps
Correlation between two signal distributions provides a measure for the similarity of their
spatial form. For example, in stress studies correlation between MFMs recorded at rest and
after stress quantifies the exercise-induced alteration. Correlation coefficients calculated for
two MFMs and for two BSPMs can be compared directly because they are unitless quantities.
Different measurement geometries and mapping areas for the MFM and the BSPM, however,
make comparisons between these maps complicated.
Brockmeier et al. (1997) calculated the correlation coefficient between MCG maps at
rest and after exercise to evaluate the change induced by pharmacologic stress in healthy
subjects. Similar analysis was performed with the simultaneously recorded BSPM data. The
comparison of correlation coefficients indicated more extensive alteration due to stress in the
MCG than in the BSPM during repolarisation. Van Leeuwen et al. (1999b) calculated the
correlation of MFMs at rest to MFMs during stress in patients with CAD and compared
them with correlations in patients without a significant stenosis. In addition, they evaluated
the change in spatial form of the QRST integral maps by calculation of Karhunen-Loeve
transform. The non-dipolar content of the maps was evaluated by subtracting first three
eigenvectors from a map generated by 12 first eigenvectors.
In Publication I, correlation coefficient between the MFMs and between the BSPMs was
calculated for signal distributions recorded at rest and the corresponding distributions at

17
cessation of exercise. The calculation was performed in each subject separately and the
mean correlations in the MCG and the BSPM were compared. Group mean maps showing
the average distributions at rest and after exercise were also formed and their correlation
was evaluated.
4.4.4 QT interval dispersion
Spatial dispersion of the QT interval duration (from the QRS complex onset to the T wave
offset) describes the heterogeneity of ventricular repolarisation on the basis of the temporal
range of the QT intervals. The distribution of the QT interval duration has been used as an
index for identifying patients with CAD by the MCG both at rest (Van Leeuwen et al. 1999)
and in stress studies (Hailer et al. 1999, Van Leeuwen et al. 1999b). In these studies, the QT
interval duration was determined on all channels and the QT time dispersion was evaluated
over the mapped area. The spatial distribution of the QT duration was also evaluated
using a Smoothness Index (SI) which quantifies the differences of the QT time values in the
neighborhood of the individual channels. The value of the SI increases with greater spatial
heterogeneity of the repolarisation process. The intra-individual effect of stress was assessed
by the change in the QT interval duration on all channels.
4.4.5 Source current distributions
Several source model parameters have been used to analyse the measured field distribution
in stress MCG studies. Seese et al. (1995) calculated a two dimensional current density es-
timate (CDE) to visualise and localise exercise-induced injury current by the MCG. Brock-
meier et al. (1997) used components of electric and magnetic dipole to obtain first-order
approximations of the flow and vortex part of the source current during stress in healthy
subjects. Pesola et al. (1999) calculated the CDE on the left ventricular epicardium to
localise exercise-induced ischemia.
4.5 Finding the optimal recording locations
In the 12-lead ECG, where spatial information is limited, the ischemia parameters are de-
termined from signals on each channel separately. The performance of such parameters is
dependent on the recording location. When a spatially extensive mapping is available it can
be utilised in finding the optimal recording locations over the thorax.
Discriminant index (DI), suggested by Kornreich et al. (1991), was used in Publications
III and VI to study the optimal sensor locations for ischemia detection by the BSPM and
the MCG. For each sensor location, DIs were evaluated for parameters detecting ischemia-
induced changes in signal amplitude at the ST segment and the T wave. To calculate the
DI at a given sensor location, average value of a parameter in the control group was first

18 4 SIGNAL PROCESSING AND ANALYSIS
subtracted from the average of the patient group. The difference was then divided by the
corresponding standard deviation (SD) over all subjects to get the DI. Thereby, the DI
quantifies the mean difference in the parameter value between patients and controls, divided
by the inter-individual variation of the parameter. A large difference between patients and
controls in the average value of a parameter does not indicate good performance in separating
the groups if inter-individual variation is extensive. The positive DI values indicate ischemia-
induced increase in the parameter and a negative DIs indicate its decrease due to ischemia.
Sensor locations with the highest absolute values of DI were considered as the best ones for
ischemia detection by the parameter under study.
4.6 Beat-to-beat analysis
A method for beat-to-beat analysis of multichannel exercise MCG data was developed in
Publication IV. The aim was to extract and utilise information on the recovery dynamics,
and to avoid some of the drawbacks encountered in the analysis of the signal averaged MCG
data. In signal averaging, the analysis was focused on few stages of the exercise testing
only, and the continuous development of the MFMs could not be monitored. The alignment
of the complexes in the averaging was made on the basis of the QRS complex which may
hamper the analysis of the ST-T segment. In the beat-to-beat analysis, better focusing
on the repolarisation period of the cardiac cycle was obtained. In addition, the baseline
estimation was improved by a non-linear method implemented for the beat-to-beat analysis.
4.6.1 QRS complex detection
One ECG channel with high QRS complex amplitude was used for determining the trigger
points within each QRS complex. First, the time instant of the steepest slope was found in
one template beat. The highest correlation with the template was then used to define the
corresponding time instant in all cardiac cycles.
4.6.2 Baseline estimation
Signal mean over an interval of 20 ms at the PQ segment was defined as the signal baseline.
A constant offset from the trigger time to the beginning of the baseline interval was first
determined in a template complex. The same offset was then used in all beats to define the
baseline nodes through which the baseline estimate was calculated. A method developed
by Meyer and Kaiser (1977) was used for calculating the non-linear baseline estimate for
signals on each channel. The estimate was subtracted from the signals to reduce the low
frequency baseline drift. In the template, also time-offsets from the trigger time to QRS
complex onset and QRS complex offset were determined and they were used in determining
the corresponding time instants in all beats.

19
The baseline estimator uses only data at the PR intervals. Since the low-frequency heart
activity is not admitted into the baseline estimate, it can not be subtracted from the data.
Thereby, in principle, the ST segment and T wave will not be distorted. The performance
of the baseline estimator is, however, strongly dependent on the ratio of heart rate and
frequency of the baseline noise. As the heart rate determines the sampling frequency of
the baseline, the higher the heart rate, the better estimator is obtained. Meyer and Kaiser
(1977) demonstrated empirically that when the baseline sampling rate is four times higher
than that of a baseline noise component of the signal, more than 88 % of that noise component
is removed.
4.6.3 Determination of the T wave apex
The time instant of T wave apex is not the same in every recording location. Bi-phasic T
waves may also hamper the detection of the T wave on some channels. In Publications IV
and V, data on all channels were utilised in determining one T wave apex time to be used
in processing of the data on each channel. A rough estimate was first found for the T
wave offset. Here, the simple formula originally introduced by Fridericia (1920) was used to
determine the T offset (in ms):
T offset = QRS onset + 450× (RR interval)1/3, (3)
where RR interval, is the duration of the time interval between two consecutive R deflec-
tions in ms.
On each channel, the T apex was defined as the highest signal deviation from the baseline
at the ST-T interval. The time instant of T apex for the whole mapping was then defined
as the median of T apex times over all channels. In this manner the bi-phasic T waves,
typically found on channels close to the spatial region of zero amplitude T waves, had only
a small effect on the time selection. The method is also less sensitive to artefacts and noise
than, for example, the determination of the time instant of the highest T wave amplitude
over all channels, or the instant of T wave apex on a single channel. In visual evaluation,
the T apex times determined in this way coincided well with the T apexes of the highest T
waves over the mapped area.
4.6.4 Extraction and filtering of the magnetic field maps
The ST segment was defined as the second quarter of the time interval from the QRS offset
to the T apex. MFMs were extracted from each complex by calculating the signal mean on
each channel over the ST segment and over the T apex ± 10 ms. To increase the signal to
noise ratio of the MFMs both at the ST segment and the T wave, they were mean filtered
with a window length of 11 MFMs. This was done by replacing each MFM by the mean

20 4 SIGNAL PROCESSING AND ANALYSIS
Fig. 6: Schematic illustration on the difference between signal averaging (left) and meanfiltering of magnetic field maps (MFMs, right). The complexes on the top of the figureillustrate data of consecutive cardiac cycles with increasing QT interval duration on onechannel. Vertical bars indicate the data which affect the amplitude of the T wave apex inthe result of the processing. On the bottom of the figure, the result of the processing isillustrated. Signal averaging results in an averaged complex and mean filtering results in themean amplitude of the T wave. The vertical bars illustrate the T wave amplitude, obtainedby both methods. In signal averaging, the changing QT time causes a damped and prolongedT wave. The result of the MFM filtering is the average of the T wave apex amplitudes overall complexes, as desired.
of 11 maps, extracted from consecutive beats of data. Here, the map under processing, 5
MFMs from cardiac cycles preceding it, and 5 MFMs from beats following it were used.
Mean filtering of maps vs. signal averaging.
Duration of the QT interval is affected for example by breathing and heart rate. In signal
averaging, if complexes to be averaged are aligned according to the QRS complex, the T
wave apex in one complex does not coincide with the T wave apexes of the other complexes
with different QT times. Fig. 6 shows a schematic illustration on the differences between
conventional signal averaging and mean filtering of MFMs, used in the beat-to-beat anal-
ysis in Publications IV and V. In the figure, data of three consecutive cardiac cycles with
increasing QT time are presented. Vertical bars indicate the data affecting the amplitude of
the T wave apex obtained as the result of processing. Due to changing QT duration, the T
wave in the averaged data (left side of the figure) is longer than in the individual beats. It

21
also has a lower peak amplitude since data from both up-sloping and down-sloping section
of the T wave are included in the average. In the beat-to-beat analysis, the data at T wave
apex are first extracted from each complex. Thereafter, the mean of these data is calculated
and the result is independent of the QT duration. The ST segment in the signal averaged
data is blurred through a similar process as that described above for the T wave.
As the MFMs are extracted from individual cardiac cycles, the temporal signal properties
within the beat are lost in the MFM averaging. Therefore, it can not be used for example
for analysis of QT duration. Also, contrary to selective signal averaging, selective MFM
averaging was not performed in this thesis. Instead, MFMs from all cardiac cycles were used
in the analysis, independent of signal quality.
4.7 Heart rate adjustment of ischemia-induced change
4.7.1 Electrocardiography
ST segment depression in the ECG depends not only on the extent of underlying coronary
artery stenosis, but also on the metabolic activity of the heart. That is, the severity of
ischemia increases with ongoing cardiac work during exercise testing. Basic principle in
heart rate (HR) adjustment is to relate the ST segment depression to this additional fac-
tor. Myocardial oxygen consumption is directly related to higher HR during exercise (Okin
and Kligfield, 1995). From a physiological point of view, HR adjustment of ST depres-
sion normalises the increasing magnitude of apparent ischemia during exercise (as measured
by changes in the ST segment) for the corresponding increase in myocardial workload (as
measured by changes in HR) that leads to ischemia in the presence of coronary disease.
Two methods of HR adjustment of ST segment depression have evolved in the 12-lead
ECG (Kligfield 1989, Okin and Kligfield 1995). The simpler ST-segment/HR index is derived
by dividing the maximal change in ST depression during exercise by the change in HR
from rest to peak exercise. In the other method, ST-segment/HR slope calculation, linear
regression analysis is performed from the end of exercise to data at earlier stage during
exercise in each lead. The highest ST-segment/HR slope with a statistically significant
correlation coefficient among all leads, including bipolar ECG lead CM5 but excluding aVR,
aVL, and V1, is taken as the test finding.
4.7.2 Magnetocardiography
The data at the end of each stage of exercise are used in the calculation of the ST-segment/HR
index and the ST-segment/HR slope in the ECG (Kligfield 1989, Okin and Kligfield 1995).
In contrast, in Publications IV and V the MCG beat-to-beat analysis focused on the data
recorded during the recovery, due to excessive magnetic noise during exercise in some of the
recordings. Also, each cardiac cycle recorded postexercise yielded one data point for the

22 4 SIGNAL PROCESSING AND ANALYSIS
regression analysis.
The orientations of the MFMs at the ST segment during the recovery period, and the
orientations of the MFMs at the T wave apex from one to ten minutes postexercise were the
source data for quantifying the HR adjusted change in the MCG. The mean and the SD of
the angle values were first calculated in each subject. To reject artefacts, angles deviating
more than 2×SD from the mean were discarded from further analysis. Thereafter, the values
of MFM angles were plotted against the corresponding instantaneous HR values, calculated
from the RR interval duration, and a regression line was fitted to the data. The absolute
value of the line slope was calculated both for the ST segment data (MFM ST/HR slope)
and the T wave data (MFM T/HR slope) of each subject.
The HR adjustment method, applied to the MFM rotation in Publications IV and V,
resembles the previously reported ST-segment/HR slope calculation in the ECG as it incor-
porates in the regression analysis all data points during the recovery. It does not, however,
focus on the most rapid change in the MFM orientation and in that respect it is similar to
the ST-segment/HR index.

23
5 Studies on healthy subjects and patients with CAD
The objectives and main results of the studies on healthy controls and CAD patients, re-
ported in Publications I–III, V, and VI, are summarised in this chapter. The results are
discussed in section 6.
5.1 Magnetic and electric mapping in healthy subjects
The aims of the study presented in Publication I were twofold; 1) to clarify the normal
response to exercise in the MCG and 2) to study the possible differences between the MCG
and the BSPM. Knowledge of the exercise-induced alterations in the MCG of healthy subjects
is essential when clinical applications of exercise MCG are developed. On the other hand,
since the first recording of the MCG by Baule and McFee (1963), there has been discussion
on whether the MCG contains information complementary to the ECG. The changes found
in the MCG of healthy subjects, but not in the simultaneous ECG, during physical and
pharmacological stress (Brockmeier et al. 1994 and 1997) motivated a further study on
exercise MCG in healthy volunteers.
The study group in Publication I was formed by 12 middle-aged healthy volunteers (1 fe-
male) with normal exercise ECG, echocardiogram and no history of cardiovascular disease.
The exercise MCG and BSPM were recorded as described in section 3.2. The signal averaged
data (see section 4.1) at rest and immediately after exercise were analysed.
5.1.1 Signal range
Signal range of the QRS complex (from the onset to the offset of the QRS complex) and
the ST segment (from QRS offset to the midpoint between QRS offset and T apex) was
measured as the difference of the highest and the lowest signal value over the mapped area
during the corresponding interval. The QRS complex signal range was found to diminish
and the ST segment range to increase in the MCG, due to exercise. In the BSPM, however,
no significant alteration was observed.
5.1.2 Amplitudes of signal extrema
In the MCG, an amplification of the signal minimum over the mapped area took place both
at the ST segment and at the T wave apex as a response to exercise. At the ST segment, the
amplification was found both at an instant fixed in time (60 ms after QRS offset; J60) and at
an instant fixed in signal morphology (midpoint between QRS offset and T wave apex). At
J60, also the value of signal maximum amplified in the MCG and at the T wave the signal
maximum became smaller as a response to exercise. Contrary to the MCG, no significant
change was found in any of these parameters in the BSPM.

24 5 STUDIES ON HEALTHY SUBJECTS AND PATIENTS WITH CAD
Fig. 7: Group-mean isocontour maps of the healthy volunteers at J60: MFM (above) andBSPM (below) a) at rest and b) after exercise. c) the difference maps. The step betweentwo consecutive isocontours is 0.5 pT in the MFMs, and 50 µV in the BSPMs. Solid linesindicate positive and dotted lines negative field or potential. Broken curve indicates the zerosignal. In the MFMs, positive values indicate magnetic flux toward the chest. In the potentialmaps, torso silhouettes represent the potential over the anterior chest (left), and over theback (right). (From Publication I)
5.1.3 Spatial patterns
The spatial distribution of the MCG and ECG signals was evaluated qualitatively using
group-mean maps at rest and at cessation of exercise (see section 4.3). Difference maps were
formed for illustrating the exercise-induced change in the signal distribution (Fig. 7).
QRS complex. The difference map in the MCG indicated a decrease in the QRS integral
value due to exercise over most of the mapped area. In the BSPM, the change due to exercise
in the spatial pattern of the QRS complex integral maps was small. However, the integral
value decreased and the group-mean difference map had a negative area over the precordium.
ST segment. Fig. 7 illustrates the group-mean MFMs and BSPMs of the ST segment at
J60 at rest and at cessation of exercise. The difference maps indicate a decrease in the MCG
signal value due to stress but in the BSPM only a relatively small change is observed. In
qualitative evaluation, the group-mean maps at the mid point between the QRS offset and
the T wave apex were found similar to maps at J60.
T wave. The group-mean and difference maps of the MCG and the BSPM at the T wave
apex are shown in Fig. 8. In the MCG, exercise resulted in a shift of the zero field line
downward and to the patient’s right. In accordance with the ST segment, the difference
map (Fig. 8) indicated a decrease in the signal value at the T wave apex. In the BSPM,
the difference map showed some alteration in signal values due to stress but the amplitude
change was not significant.

25
Fig. 8: Group-mean isocontour maps at the T wave apex: MFM (above) and BSPM (below)a) at rest and b) at the cessation of exercise. c) the difference maps. In the MFMs thestep between two consecutive isocontour lines is 0.5 pT, and in the BSPMs it is 50 µV. Theformat is the same as in Figure 7. (From Publication I)
5.1.4 Correlation of maps at rest with maps at exercise
The correlation of maps at rest with those recorded postexercise was calculated in all indi-
viduals. The correlation was, on the average, higher in the BSPM than in the MCG at the
ST segment and the T wave but the difference was not significant.
5.1.5 Variation between the subjects
In Publication I, the variation of the MCG and BSPM signal distributions within the study
group was evaluated by calculating the mean correlation between each individual map and
the group-mean map. The usefulness of a group-mean map and a group-mean difference map
depends to a great extent on the variation of the individual maps within the study group. In
case of high variation, they do not provide an optimal charcterisation of the features of the
maps in the study group. The inter-individual variation is of interest also when evaluating
the value of the results as reference data for future studies.
In general, the variation in the maps was more extensive in the MCG than in the BSPM.
In both mappings the highest correlation was found at the T wave, which had a higher signal
amplitude and better signal to noise ratio than the ST segment. The highest variation
between different subjects was found in the QRS complex integral maps which are to a
great extent affected by the signal morphology, since both negative and positive deflections
contribute to the integral value.
5.2 Magnetic field maps in patients with coronary artery disease
Detection of exercise-induced ischemia in patients with single vessel CAD was studied in
Publication II. The aim was to find features of the MCG signal, altered by ischemia, and
to develop a parameter which could be used in ischemia detection. Forty-four subjects were
26 5 STUDIES ON HEALTHY SUBJECTS AND PATIENTS WITH CAD
studied with exercise MCG and simultaneous 12-lead ECG. The patient population consisted
of 27 CAD patients with a significant (>50 % luminal diameter) stenosis in one of the major
coronary branches. Twelve patients had a stenosis in the left anterior descending (LAD),
seven in the left circumflex (LCX), and eight in the right coronary artery (RCA). In addition,
a control group of 17 healthy volunteers was studied.
The measurement equipment and protocol used in the recordings are described in sec-
tion 3.2. The signals recorded at rest, immediately after exercise as well as 4 minutes
postexercise were averaged as described in section 4.1. From each averaged complex, MFMs
were formed using data at the ST segment (signal mean over the second quarter of the time
interval from the QRS offset to the T wave apex) and at the T wave apex. Orientations of
the MFMs were measured both manually and by using the gradient method, as described in
section 4.4.2. Both methods yielded approximately similar results and in the following those
obtained with the gradient method are presented. Group-mean MFMs were calculated to
describe the signal distributions in the study groups.
5.2.1 Orientation
The principal finding in Publication II was that exercise-induced ischemia caused a rotation
of the MFMs at the ST segment and at the T wave apex. Orientations of the MFMs at
these time instants were compared in patients and controls.
Rest. Because of low signal amplitude, noise hampered determination of MFM orientation
at the ST segment at rest. Variation between subjects in the MFMs at the ST segment
was extensive and a wide distribution of angle values was obtained even within the control
group. Only the subgroup of patients with stenosis in RCA had a significantly different
MFM orientation compared to the control group. Other patient subgroups and the pooled
CAD group did not differ from controls in respect of the MFM angle at the ST segment.
At the T wave apex, the MFM orientations were more consistent. Still, none of the patient
groups differed significantly from the control group in respect of the MFM orientation.
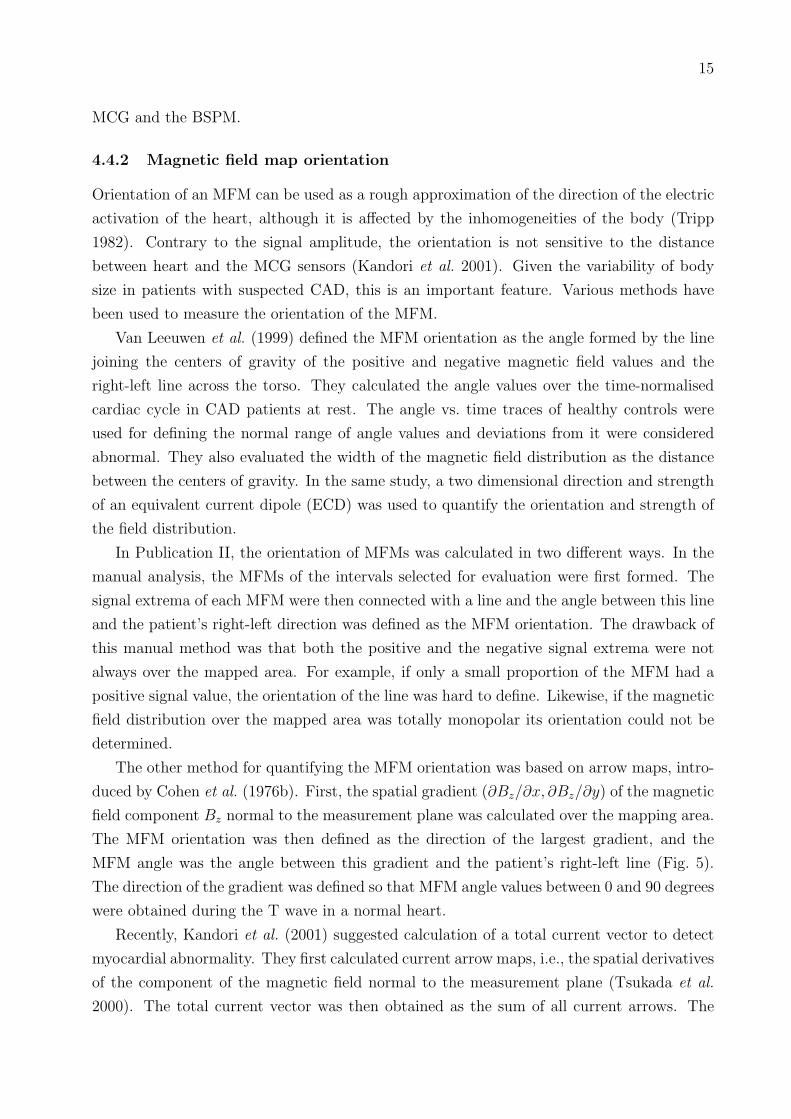
Immediately after exercise. At cessation of exercise, the MFM orientation at the ST
segment was different in the pooled CAD patient group and in the subgroups of patients
with stenosis in LAD or RCA, when compared to the control group. Fig. 9 shows the ST
segment group-mean maps of the controls and CAD patients at rest and at the cessation of
exercise. The arrows illustrate the manual and the gradient-based measurement of the MFM
orientation. The group-mean map of the CAD patients is rotated after exercise compared to
rest, while in the controls the rotation is smaller. The MFM orientation at the T wave apex
was not significantly different in any of the patient groups compared to the control group.
27
Fig. 9: Group-mean MFMs of the ST segment (A, C) and the corresponding spatial fieldgradients (B, D) of healthy controls and coronary artery disease patients (CAD) at rest andat cessation of exercise. In A and C, the step between two consecutive isofield lines is 0.1 pTand the arrow indicates the manually determined map orientation. In B and D, the maximumspatial gradient is indicated by the circled arrow. (From Publication II)
Four minutes after exercise. In contrast to what was observed at the cessation of ex-
ercise, the orientation of the T wave MFM at 4 minutes postexercise was different in the
CAD patient group than in the control group. Also the in the subgroup of patients with
stenosis in RCA, the MFM orientation at the T wave differed from the orientation of the
control group. At the ST segment, the MFMs angles in the pooled CAD patient group and
in subgroups of patients with stenosis in LAD or LCX were higher compared to the control
group.
5.2.2 Rotation
Rotation of the T wave apex MFM from rest to 4 minutes postexercise was more extensive
in the pooled CAD patient group than in the control group. This was the case also with the
subgroup of patients with stenosis in RCA. That subgroup had also a more extensive MFM
rotation compared to the subgroups of patients with a stenosis in LAD or LCX. Compared
to controls, the MFM rotation at the T wave apex from rest to cessation of exercise was
more extensive only in the subgroup of patients with stenosis in RCA. Rotation of the MFM
at the ST segment was not evaluated due to low signal amplitude at rest.
5.2.3 Amplitude
At rest the ST segment MFMs had a low amplitude, i.e., the values of signal extrema were
often below 0.1 pT. Exercise amplified the values of signal extrema over the mapped area
at the ST segment both in the patients and in the controls. Thereby, the maximum ST

28 5 STUDIES ON HEALTHY SUBJECTS AND PATIENTS WITH CAD
segment depression over the mapped area did not differ between patients and controls.
5.3 Magnetic and electric mapping in patients with coronary arterydisease
Publication III aimed at identifying the optimal recording locations in the MCG and the
BSPM for detection of exercise-induced ischemia. The study population was the same as in
Publication II, except for three patients (one in each subgroup of different stenosed vessel)
whose BSPM data were corrupted. Signals recorded at rest, immediately after exercise, and
4 minutes after exercise were averaged. The MCG and BSPM data of the ST segment (signal
mean over the second quarter of the time interval from the QRS offset to the T wave apex)
and of the T wave apex were extracted from each averaged complex.
To identify the optimal recording locations for detecting ischemia-induced alteration in
the amplitude of the ST segment and the T wave, DI maps were calculated for both the ST
segment and the T wave data in the MCG and the BSPM (see section 4.5). The extrema of
the DI maps were selected as the optimal recording locations for detecting ischemia-induced
increase (positive extremum) or decrease (negative extremum) in the parameter evaluated.
The ST segment group-mean maps of the CAD patients and controls at rest and at
cessation of exercise are shown in Fig. 10. The corresponding DI maps are illustrated in
Fig. 11. In the left panel of Fig. 11, negative DI extremum suggested that the optimal
recording location for separating CAD patients from controls by ST segment depression in
the ECG was at the lower left side, below the lead V5. The distribution of positive DI values
shows that, compared to controls, the ST segment in the CAD patients was elevated over
Fig. 10: Group-mean BSPMs (left) and MFMs (right) of the ST segment at rest and atcessation of exercise. Top: healthy controls; bottom: CAD patients. The step between twoisocontour lines is 0.025 mV in the BSPM and 0.1 pT in the MCG. Solid lines denote positivesignal values and dotted lines indicate negative values. Zero signal is indicated by a dashedline. (From Publication III)

29
Fig. 11: DI maps of the pooled CAD patient group at the ST segment at cessation of exercise.The step between two isocontour lines is 0.2 in the BSPM and 0.1 in the MCG. Positivevalues are denoted by a solid line and dotted lines indicate negative values. (Modified fromPublication III)
the upper right anterior and right posterior thorax at cessation of exercise. The analysis
suggested that this area is optimal for detecting ischemia by the ST segment elevation.
The right panel of Fig. 11 shows the CAD patient group’s DI map of the ST segment
in the MCG at cessation of exercise. The extrema of the DI map suggested that optimal
sites for ischemia detection by ST elevation and ST segment depression located over the
upper left part of the thorax and over the central inferior part of the chest, respectively.
The locations of the highest and lowest index values for pooled CAD patient group and for
patient subgroups are indicated in Fig. 12 for the MCG and in Fig. 13 for the BSPM. The
Fig. 12: Recording locations in the MCG with the highest and the lowest DI value in allpatient subgroups with a different stenosed vessel, and in the pooled CAD patient group.Left: ST segment at cessation of exercise. Right: T wave apex 4 minutes postexercise. Theplus (+) character indicates that the highest DI value of the specified patient group was foundon that location. Abbreviation next to the sign denotes the patient group. Correspondingly,the minus (−) character indicates the most negative DI value.

30 5 STUDIES ON HEALTHY SUBJECTS AND PATIENTS WITH CAD
Fig. 13: Recording locations in the BSPM with the highest and the lowest DI value in allpatient subgroups with a different stenosed vessel, and in the pooled CAD patient group. Left:ST segment at cessation of exercise. Right: T wave apex 4 minutes postexercise. The plus(+) character indicates that the highest DI value of the specified patient group was found onthat location. Abbreviation next to the sign denotes the patient group. Correspondingly, theminus (−) character indicates the most negative DI value. The recording locations of theECG leads V1–V6 are indicated with black dots.
results are presented for the ST segment immediately after exercise and for the T wave 4
minutes postexercise.
By comparing the CAD patients’ group-mean MCG maps (Fig. 10) and the DI map
in Fig. 11 it can be noted that the optimal recording location for detecting ST segment
depression deviated from the location of the maximum depression in the group-mean map.
In addition to the ischemia-induced changes in the patients, the value of DI was affected
by the exercise-induced change in controls and the inter-individual variance over the study
population (see section 4.5).
After finding the optimal recording locations, their performance was tested by evaluating
the statistical significance of difference in signal amplitude between patients and controls.
At the optimal MCG and BSPM recording sites, all parameters (ST segment depression and
elevation, T wave amplitude increase and decrease) were different in the CAD patient group
than in the control group. For details concerning the results of the patient subgroups see
Publication III.
5.4 Heart rate adjustment in exercise magnetocardiography
In Publication V, the beat-to-beat analysis method developed in Publication IV (section 4.6)
was applied in a study population of 17 healthy controls and 24 patiets with single vessel
disease. The aim was to evaluate the performance of HR adjusted change in MFM orientation
in detection of exercise-induced ischemia. The results were compared with the results of un-
adjusted MFM orientation as well as with the results obtained by the 12-lead ECG both with
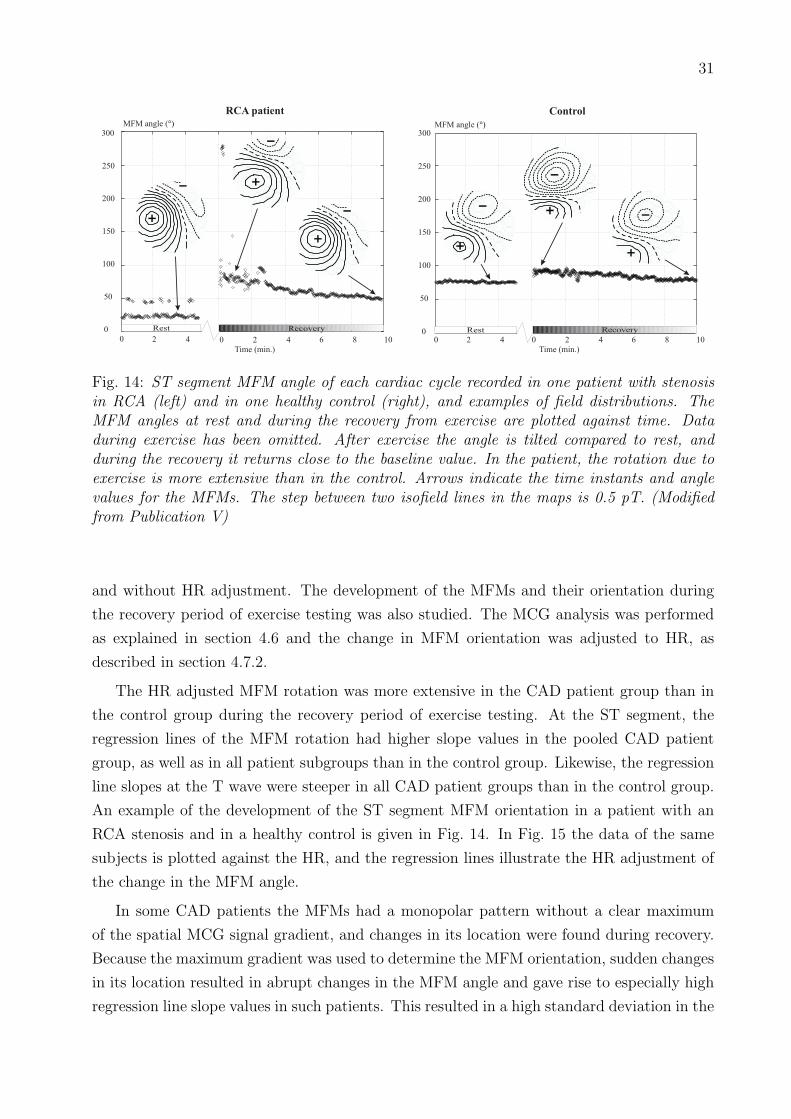
31
Fig. 14: ST segment MFM angle of each cardiac cycle recorded in one patient with stenosisin RCA (left) and in one healthy control (right), and examples of field distributions. TheMFM angles at rest and during the recovery from exercise are plotted against time. Dataduring exercise has been omitted. After exercise the angle is tilted compared to rest, andduring the recovery it returns close to the baseline value. In the patient, the rotation due toexercise is more extensive than in the control. Arrows indicate the time instants and anglevalues for the MFMs. The step between two isofield lines in the maps is 0.5 pT. (Modifiedfrom Publication V)
and without HR adjustment. The development of the MFMs and their orientation during
the recovery period of exercise testing was also studied. The MCG analysis was performed
as explained in section 4.6 and the change in MFM orientation was adjusted to HR, as
described in section 4.7.2.
The HR adjusted MFM rotation was more extensive in the CAD patient group than in
the control group during the recovery period of exercise testing. At the ST segment, the
regression lines of the MFM rotation had higher slope values in the pooled CAD patient
group, as well as in all patient subgroups than in the control group. Likewise, the regression
line slopes at the T wave were steeper in all CAD patient groups than in the control group.
An example of the development of the ST segment MFM orientation in a patient with an
RCA stenosis and in a healthy control is given in Fig. 14. In Fig. 15 the data of the same
subjects is plotted against the HR, and the regression lines illustrate the HR adjustment of
the change in the MFM angle.
In some CAD patients the MFMs had a monopolar pattern without a clear maximum
of the spatial MCG signal gradient, and changes in its location were found during recovery.
Because the maximum gradient was used to determine the MFM orientation, sudden changes
in its location resulted in abrupt changes in the MFM angle and gave rise to especially high
regression line slope values in such patients. This resulted in a high standard deviation in the

32 5 STUDIES ON HEALTHY SUBJECTS AND PATIENTS WITH CAD
Fig. 15: The MFM angle data of Fig. 14, plotted against the HR. Data values consideredoutliers have been excluded, as explained in section 4.7.2. Lines through the data indicatethe regression lines used for the quantification of the change in the MFM angles. For thepatient the line slope is 0.81 ◦/bpm (beats per minute) and for the control it is 0.34 ◦/bpm.(Modified from Publication V)
patients’ MFM angle parameters. In the control group, however, the average slope values and
their standard deviations were small. The variation between the subjects in the dependence
between MFM orientation and HR was extensive during the 10 minutes of recovery. In
general, it was not linear in the patients. The linear regression analysis was used merely to
quantify the change of the MFM orientation and to adjust it with the corresponding change
of the HR.
5.4.1 Receiver operator characteristic curves
Fig. 16 shows the receiver operator characteristic (ROC) curves of the parameters evaluated
in Publication V. The HR adjusted MFM rotation at the ST segment had a higher sensitivity
to CAD than the MFM orientation at the ST segment immediately after exercise at almost
all values of specificity. It also had a higher or equal sensitivity compared to the HR adjusted
ST segment depression in the 12-lead ECG at all values of specificity. At the T wave, the
HR adjusted MFM rotation had an equal or higher sensitivity than the MFM orientation at
the T wave 4 minutes postexercise, independent of the required specificity. The areas under
the ROC curves (AUCs) of all these parameters are indicated in Fig. 16.
5.5 Ischemia detection by body surface potential mapping
Seventy subjects were studied with BSPM during exercise in Publication VI. The study
population consisted of 18 patients with triple vessel CAD and a history of one or more MIs,

33
Fig. 16: Left: ROC curves for HR adjusted MFM rotation at the ST segment (ST/HR slope),HR adjusted ST segment depression in the ECG (ECG ST/HR slope), and MFM orientationat the ST segment in signal averaged data immediately after exercise (ST orientation). Areasunder ROC curve (AUCs) are indicated as percentages. Right: ROC curves and AUCs forthe HR adjusted MFM rotation at the T-wave (T/HR slope) and for the MFM orientationat the T-wave 4 minutes postexercise (T orientation). (From Publication V)
27 patients with single vessel CAD, and 25 healthy controls. The aims were to evaluate the
performance of ST segment slope (µV/s) as an independent indicator of exercise-induced
ischemia and to find its optimal recording locations. In addition, the optimal locations for
ischemia-induced ST segment depression were studied.
The patients with triple vessel CAD were classified into three subgroups according to the
main ischemia region (LAD, LCX, RCA). The classification was based on findings in thallium
perfusion single photon emission computed tomography stress imaging with redistribution
imaging at 4 hours, and on coronary angiography. The subgroups with anterior (LAD),
posterior (LCX), and inferior (RCA) ischemia were appended with the patients with the
corresponding single vessel disease.
Signals at rest, during the final exercise period, and immediately after cessation of exercise
were averaged. The data recorded immediately after exercise performed better in ischemia
detection than the data during exercise. Therefore, the results are presented for these data.
The ST segment amplitude at 60 ms after the J-point (J60) and the ST segment slope
(µV/s) from J-point to J60 were calculated in each lead. The slope was determined by
fitting a regression line on the data at the ST segment. DI was used for finding the optimal
locations for detecting ischemia-induced alteration in the ST segment level and slope.
Fig. 17 shows the group-mean maps of the ST segment level and slope immediately after
exercise in healthy controls and in the subgroups of patients with different ischemic regions.
Compared to the controls, the patients with CAD showed ST segment depression and more
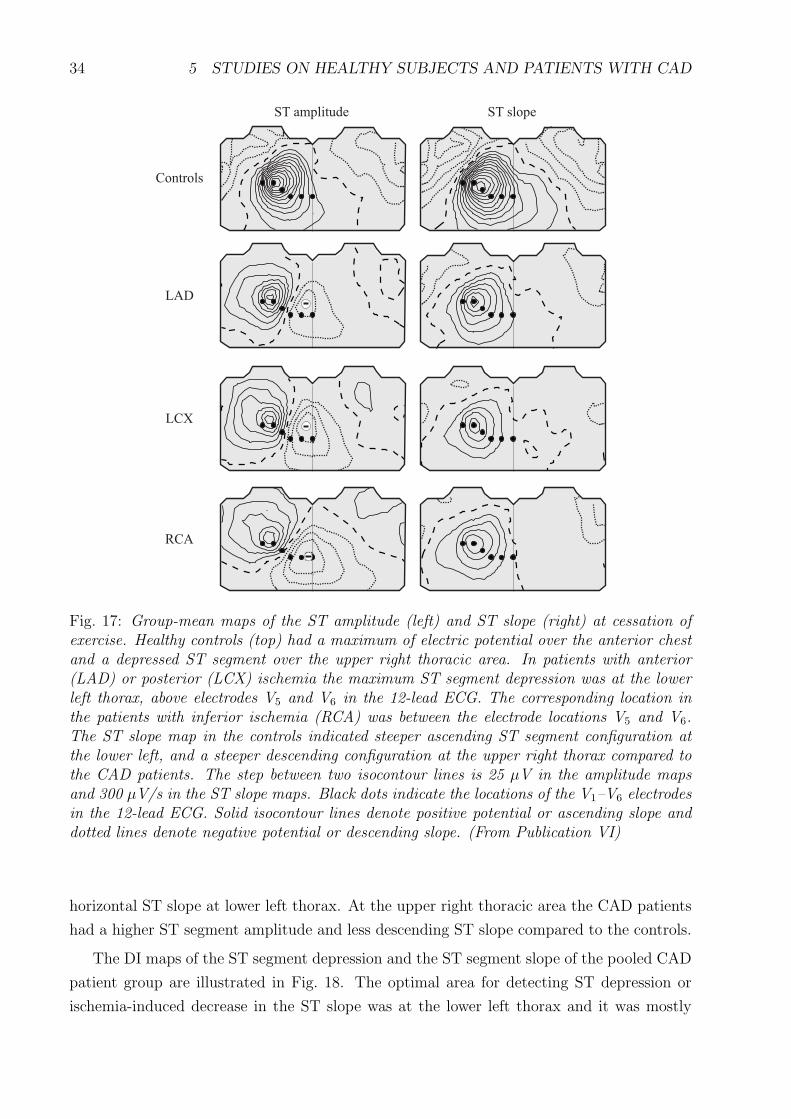
34 5 STUDIES ON HEALTHY SUBJECTS AND PATIENTS WITH CAD
Fig. 17: Group-mean maps of the ST amplitude (left) and ST slope (right) at cessation ofexercise. Healthy controls (top) had a maximum of electric potential over the anterior chestand a depressed ST segment over the upper right thoracic area. In patients with anterior(LAD) or posterior (LCX) ischemia the maximum ST segment depression was at the lowerleft thorax, above electrodes V5 and V6 in the 12-lead ECG. The corresponding location inthe patients with inferior ischemia (RCA) was between the electrode locations V5 and V6.The ST slope map in the controls indicated steeper ascending ST segment configuration atthe lower left, and a steeper descending configuration at the upper right thorax compared tothe CAD patients. The step between two isocontour lines is 25 µV in the amplitude mapsand 300 µV/s in the ST slope maps. Black dots indicate the locations of the V1–V6 electrodesin the 12-lead ECG. Solid isocontour lines denote positive potential or ascending slope anddotted lines denote negative potential or descending slope. (From Publication VI)
horizontal ST slope at lower left thorax. At the upper right thoracic area the CAD patients
had a higher ST segment amplitude and less descending ST slope compared to the controls.
The DI maps of the ST segment depression and the ST segment slope of the pooled CAD
patient group are illustrated in Fig. 18. The optimal area for detecting ST depression or
ischemia-induced decrease in the ST slope was at the lower left thorax and it was mostly

35
Fig. 18: The DI maps of the ST segment amplitude and slope at cessation of exercise in thepooled CAD patient group. The step between two isocontour lines is 0.25. Solid isocontourlines denote positive, and dotted lines negative value of DI. Black dots indicate the locationsof the V1–V6 electrodes in the 12-lead ECG. The extrema of the DI maps suggest that optimallocations for detecting ischemia-induced ST depression or ST slope decrease is at the lowerleft thorax. The corresponding locations for ST slope increase and ST elevation are over theupper right thoracic area. (From Publication VI)
covered by precordial ECG leads V4–V6. The highest DI values, indicating ischemia-induced
ST elevation and slope increase, were over the right shoulder and the upper right back. In the
patient subgroups with different ischemic regions, the extrema of the DI were approximately
at the same areas as in the pooled CAD group.
When the optimal leads were evaluated, the ST segment depression was more extensive in
the pooled CAD group and in all patient subgroups than in the control group. The ST slope
decrease due to exercise was more extensive in the CAD groups, compared to the control
group. The ST slope at the lower left thorax had a higher AUC than the ST depression at
the same area in the pooled CAD group (97 % vs. 93 %), and in all patient subgroups.

36 6 DISCUSSION
6 Discussion
6.1 Magnetic and electric mapping in healthy subjects
In Publication I, the exercise-induced changes of the MCG in healthy subjects during the ST
segment and the T wave were quantified by calculating the alterations in the amplitude of
the MFMs. An amplification of the MCG signal minimum over the mapped area took pace as
a response to exercise and the monopolar difference map pattern indicated exercise-induced
magnetic flux component outward the chest over the mapped area. The changes were larger
in the MCG than in the BSPM. These results support the earlier findings by Brockmeier
et al. (1994 and 1997). They found alterations of the ST segment and the T wave due to
physical (Brockmeier et al. 1994) and pharmacological (Brockmeier et al. 1997) stress in the
MCG, but not in the simultaneously obtained ECG. These alterations included ST segment
depression, T wave inversion, and monopolar MFMs during the repolarisation period of the
cardiac cycle. The authors suggested that the changes could be induced by a vortex current
(Brockmeier et al. 1997). The results obtained in this thesis support this view.
Contrary to earlier results (Brockmeier et al. 1997), a significant difference was not found
between the MCG and the BSPM in the correlation of maps at rest with those postexercise.
This discrepancy could originate from the different MCG and BSPM measurement setups.
Here, both the MCG and the BSPM covered a more extensive area compared to the previous
work.
In Publication I, the lower inter-individual variation in the BSPM compared to the MCG
may also have been due to differences in the mapped area, because the BSPM extended
over the whole upper thorax whereas the MCG covered the frontal chest only. The variation
between subjects both in the MCG maps and the BSPM maps was lowest at the T wave
apex. The data of the T wave provide therefore a more reliable reference of the normal
findings in the exercise MCG than the ST segment data.
Because of the changes of the ST segment amplitude in healthy volunteers in the MCG,
the maximum ST segment depression over the mapped area could not be used as an indicator
of ischemia. Therefore, other MCG parameters for detection of ischemia were developed in
the studies on CAD patients.
6.2 Detection of ischemia by magnetocardiography
Exercise-induced ischemia occurs typically at subendocardium and causes ST segment de-
pression in left precordial ECG leads V4–V6 and in inferior leads II, III, and aVF (Chaitman
1997). These changes suggest that the ischemia-induced current during the ST segment is
directed roughly from the lower left to the upper right thorax, although location of the is-
chemic area affects the orientation. The BSPM results of this thesis indicated ST depression

37
at lower left thorax and ST elevation at upper right, and supported this view about the
orientation of the ischemic current. The simple model, presented in section 2, suggests that
such a current would result in a magnetic flux toward the upper left chest and outward the
central inferior thoracic area. This flux pattern is in a reasonable concordance with the ex-
perimental results obtained in this thesis, despite the extreme simplicity of the source current
and the volume conductor in the model. The most sensitive MCG recording locations for
detecting exercise-induced ST segment depression and elevation, studied in Publication III
and presented also in Fig. 12, suggested that the injury current generated a magnetic flux
toward the upper left chest (ST elevation) and outward the central inferior thoracic area (ST
depression). Similar type of alterations were found in the signal distributions at the T wave
apex (Fig. 12).
An MFM observed at the ST segment during ischemia has components originating both
from the normal electrical activation and from ischemic current. Superposition of the sig-
nal distribution originating from the normal activation and the distribution induced by
ischemia could have caused the rotation of the MFMs during the ventricular repolarisation
in CAD patients. The group mean MFMs observed in healthy volunteers during repolar-
isation (Figs. 7 and 8) differed considerably from the ischemia-induced alteration in CAD
patient group (Fig. 12). The magnetic field originating from the ischemic current may have
partially canceled the field from the normal activation and affected the orientation of the
observed MFM.
In CAD patients, contribution of the ischemic injury current to the observed MFM
changes upon recovery from exercise. In Publication V, the time development of the MFM
orientation had a high variation between the subjects during the reversal of ischemia. Differ-
ences in the development of the extent of ischemia during the recovery, even in patients with
the same stenosed vessel, are likely to have contributed to the extensive differences between
the patients. In general, the intra-individual development of MFMs during the recovery
was smoother in healthy controls than in the CAD patients and also the inter-individual
variation was lower.
In addition to rotation of MFMs, exercise caused a tendency toward a more monopolar
magnetic field pattern over the mapped area in the CAD patients, when compared to the
controls. A separate parameter was not used for quantifying the degree of monopolarity
of the MFMs. Monopolarity was, however, found to contribute to the MFM orientation
because it resulted in abrupt changes in the orientations of MFMs in some patients during
the recovery.
In Publications IV and V, a regression line was fitted in the MFM orientation vs. HR
data to quantify the change in MFM orientation related to the change of the HR. In general,
the dependence was not linear in the CAD patients. Nevertheless, linear regression was
used but merely to quantify the change of the MFM orientation and to adjust it with the

38 6 DISCUSSION
corresponding change in the HR. Although the linear model was not wholly appropriate it
was a simple way to reflect the change in the orientation of MFMs.
In Publication V, the MFM angle/HR slope was negative in three patients at the ST
segment (one in each subgroup of different stenosed vessel) and in six patients at the T wave
(5 LAD patients, one RCA patient). Considering the large variation between subjects in
the time development of the MFM orientation at the presence of ischemia, it is difficult to
assess the meaning of the direction of the MFM rotation. Therefore, only the absolute value
(magnitude) of the slope was used when quantifying the change in the MFM orientation.
The beta-blockers were continued through the measurements of the CAD patients due
to patient safety. The beta-blockade, lowering the HR and the degree of ischemic changes,
might have been disadvantageous for the MCG ST/HR analysis. In ECG studies, evaluating
the factors affecting the performance of ST/HR slope and ST/HR index in patients taking or
not taking beta-blockers (Okin 1985, Kligfield 1993), the mean and peak exercise HRs were
both lower in patients taking beta-blockers. However, the difference between these patient
groups in overall HR change during exercise was not significant. Thus, it seems unlikely
that the beta-blockade would have induced false positive ischemic responses during exercise
testing.
6.3 Detection of ischemia by body surface potential mapping
One region sensitive to ischemia-induced ST segment depression and ST segment slope de-
crease was identified in Publication VI. Despite variation in the culprit coronary artery and
presence or absence of a history of MI, the region was common for all CAD patient groups.
The optimal area was relatively well covered by leads V4–V6 of the 12-lead ECG. The results
of Publication VI also suggested that another area, at the upper right thorax, was sensitive
to ischemia-induced ST segment elevation and ST segment slope increase. In the 12-lead
exercise ECG setup this area is best sampled by the aVR lead. Thus, the optimal lead
combination in the 12-lead ECG could be the difference of V5, for example, and aVR. Such
a derived lead could show a more depressed and a steeper down-sloping ST segment during
ischemia than the standard leads.
In the MCG, the spatial signal gradient used in determining the MFM orientation had
typically a distinct maximum over the mapped area in the healthy volunteers at the ST
segment, and especially at the T wave apex. This resulted in relatively low inter-individual
variation in the values of the MFM angle. In the BSPM, the distribution of the electric
potential at the ST segment in healthy subjects had typically a strong global maximum over
the chest both at rest and postexercise (Fig. 7). The spatial gradient of the potential in such
a BSPM distribution has a wide circular area of almost identical values of the gradient around
the location of the maximum potential. The directions of the gradient over this circle cover

39
all values of angle. Therefore, healthy controls might have a large inter-individual variation
in the gradient angles. This, in turn, would be a disadvantage in the separation of CAD
patients and healthy controls by the gradient method in the BSPM.
6.4 Clinical feasibility of stress magnetocardiography
6.4.1 Costs and performance
The recording and analysis methods developed in this thesis aimed at detection of exercise-
induced ischemia. Since no additional imaging techniques were required, costs and clinical
performance compared to the ECG determine the feasibility of the exercise MCG. At present,
the MCG recording equipment and magnetic shielding are expensive and the exercise record-
ings made for research purposes are time-consuming. For clinical purposes the measurement
protocol could be optimised, which would expedite the recordings. Also, the signal anal-
ysis methods presented in this thesis are not computationally demanding and the analysis
could be performed on-line. In principle, the duration of an exercise MCG recording and
analysis could be of the same order or lower than that of the exercise ECG recording. The
analysis methods presented in this thesis are not very sensitive to noise. Therefore, with
further development in the recording technology, they might be feasible also in the analysis
of recordings with high temperature SQUID sensors in an unshielded environment. This
would reduce costs of the recordings.
The small size of the study population of this thesis did not allow suggestion of optimal
cut-off values for separating CAD patients and healthy controls by the MCG parameters. A
study with a larger patient population is required to determine the normal limits for the MCG
parameters. Thereafter, assessment of the performance of the exercise MCG is possible. It
should be evaluated, for example, if the rate of false positive findings in female subjects is
as high in the MCG as in the standard exercise ECG. In this thesis, the inclusion required
the CAD patients to have a significant ST segment depression in the 12-lead exercise ECG
at screening. For comparison of the performance of the MCG with the 12-lead exercise ECG
used in clinical practice, also CAD patients without ST depression in the ECG would have
to be studied. The standard ECG analysis utilises the data recorded during exercise and
the corresponding MCG was not analysed in this thesis. However, some knowledge of the
performance of the MCG compared to the 12-lead ECG was obtained in Publication V, where
the MCG and the ECG recorded simultaneously during the recovery period of exercise testing
were studied. The MCG showed better performance than the 12-lead ECG in detection of
ischemia when both data were analysed with similar type of methods.

40 6 DISCUSSION
6.4.2 Detection of CAD by magnetocardiography at rest
In MCG recordings at rest, temporal aspects of the signal during repolarisation have been
reported to differ between patients with CAD but no history of MI, and patients with chest
pain but without CAD (Hailer et al. 1999, Van Leeuwen et al. 1999). The MCG analysis
in this thesis was limited to MFMs, and the QT interval dispersion, for example, was not
evaluated. The only indication of difference between CAD patients and controls at rest was
the different ST segment MFM orientation between the RCA patient subgroup and controls
in Publication II. However, the focus of this thesis was on the data recorded postexercise and
differences between patients and controls at rest can not be excluded. Detection of ischemic
heart disease at rest would considerably increase the clinical significance of the MCG.
6.4.3 Pharmacological stress
Clinical practice indicates preference of physical over pharmacological stress in the ECG. In
general, pharmacological stress is used only when physical exercise is not possible. In the
MCG, lower noise obtained with pharmacological stress is of benefit, especially if high signal
to noise ratio is required. Considering the screening of ischemia and development of stress
MCG as a first-line diagnostic test, physical exercise has the benefit of being non-invasive
and more natural test compared to pharmacological stress.
6.4.4 On-line analysis of magnetic field map orientation
Signal processing in this thesis was performed off-line. However, the analysis method pre-
sented in Publication IV could, in principle, be applied also to an on-line analysis. Planar
gradiometer units record directly the spatial derivatives of Bz and the calculation of the
MFM orientation is therefore simple. In the present analysis, the calculation of the non-
linear baseline estimate was the computationally most demanding operation. With a higher
corner frequency of the high-pass filtering, some of the baseline drifting could be canceled
without distorting the signal too extensively. Therefore, it might be possible to perform the
analysis also with linear baseline estimation. Because pharmacological stress induces less
noise than physical exercise, the non-linear baseline estimation might not be necessary if
drugs are used to provoke ischemia.
6.5 Main limitations of this thesis
The study population of this thesis was relatively small and especially the findings on the
performance of the exercise MCG in the ischemia detection should be considered preliminary.
Due to technical limitations, the MCG and the BSPM were not recorded simultaneously,
which would be the optimal setup for comparing the two mappings. However, the difference
in the maximum HR in the two exercise mappings was not significant. The MCG analysis

41
was limited to data recorded postexercise in this thesis. With further experience in the
exercise MCG, data suitable for analysis can also be recorded during exercise.
The supine stress may have hampered ischemia detection, partly due to lower rate-
pressure product compared to upright exercise testing. In principle, also MCG devices for
upright measurements could be constructed. In Publications I–V, only patients with single
vessel CAD without MI were studied and ischemia detection in the presence of an old MI
or multivessel CAD was not assessed. On the other hand, changes of the ST segment and
the T wave due to myocardial scar did not confound the specificity to ischemia. Evaluation
of ischemic regions was based on the location of a stenosis in coronary angiography. Isotope
ventriculography would have further improved the evaluation of ischemic myocardial regions.
Because the MCG and the BSPM recordings were performed during the same day, ischemic
preconditioning may have had an effect on the second exercise test in the patients. However,
the recordings were made in random order to reduce this bias.
6.6 Main findings of this thesis
In healthy volunteers, exercise was found to induce more extensive alterations in the MCG
than in the BSPM during the ventricular repolarisation. Although the ST segment level
is routinely evaluated in the 12-lead exercise ECG, the maximum ST segment depression
over the mapped area in the MCG was not a feasible parameter for detection of ischemia.
However, the physical exercise induced a rotation of the MFMs at the ST segment and the T
wave in CAD patients. The MFM orientation could successfully be used as a parameter for
ischemia detection. Optimal recording locations for detecting ischemia by exercise-induced
amplitude change in the MCG and the BSPM were also studied. At the optimal MCG
locations, also the ST segment depression was sensitive to ischemia. In the BSPM, a region
sensitive to ischemia-induced ST segment depression and ST segment slope decrease was
identified. The region was common for all CAD patient groups, in spite of variation in the
location of ischemia and presence or absence of a history of MI.
A method for analysing beat-to-beat alterations in the MCG and the BSPM distributions
at a given time interval of the cardiac cycle was developed. It enables monitoring of the
MFMs, for example during recovery from physical exercise. It also makes possible studying
of different parameters, calculated from the MFMs or the BSPMs, as a function of time
or HR. In this thesis the method was used for quantifying exercise-induced change in the
orientation of MFMs in CAD patients and healthy controls. Adjustment of the change in the
orientation of MFMs with the corresponding HR change improved ischemia detection by the
exercise MCG. When simultaneously recorded data at the recovery period of exercise testing
were evaluated with similar type of analysis methods, the MCG showed better performance
than the 12-lead ECG in ischemia detection.

42 SUMMARY OF PUBLICATIONS
Summary of Publications
I Magnetocardiographic and electrocardiographic exercise mapping in healthy
subjects (Ann. Biomed. Eng. 29 501–9, 2001).
The normal response to physical exercise in magnetocardiography (MCG) and body
surface potential mapping (BSPM) was studied. The MCG and the BSPM were
recorded in 12 healthy middle-aged subjects during supine bicycle exercise testing.
The exercise-induced changes in the signals were quantified with parameters based on
signal amplitude and spatial signal distribution. The main focus was on the ventricu-
lar repolarisation. At this time period, exercise was found to induce a magnetic field
component outward the precordium. Also, the minimum value of the MCG signal over
the mapped area at the ST segment and the T wave apex was amplified due to stress.
The response to exercise was weaker in the BSPM than in the MCG. The negative
component in the MCG signal over the mapped area during the repolarisation was
found to be a normal physiological response to exercise. It was concluded that unlike
in clinical exercise electrocardiography (ECG), the maximum ST segment depression
over the mapped area in the MCG might not be an eligible parameter when evaluating
the presence of ischemia by the exercise MCG.
II Detection of exercise induced myocardial ischemia by multichannel magne-
tocardiography in single vessel coronary artery disease (Ann. Noninv. Elec-
trocardiology 5 147–57, 2000).
The aim in this publication was to find the features of the MCG signal which are altered
by exercise-induced ischemia, and to develop a parameter for quantifying them. Forty-
four subjects, including 27 patients with single vessel coronary artery disease (CAD)
and a control group of 17 healthy volunteers, were studied with exercise MCG and
simultaneous 12-lead ECG. The principal finding was that ischemia induced a rotation
of the magnetic field maps (MFMs) at the ST segment and at the T wave apex. The
MFM orientations were quantified both by manual measurement, based on locations
of the signal extrema, and by a new surface gradient method. Orientations of the
MFMs at the ST segment in the CAD patient group differed from orientations of the
control group both immediately and 4 minutes after exercise, but not at rest. The
MFM orientation at the T wave apex 4 minutes postexercse was different in the CAD
patient group compared to the control group. The T wave analysis performed better
4 minutes postexercise than at cessation of exercise. Orientation of the MFM at the
ST segment and at the T wave was concluded to be sensitive to transient ischemia.

43
III Recording locations in multichannel magnetocardiography and body sur-
face potential mapping sensitive for regional exercise-induced myocardial
ischemia (Basic Res. Cardiol. 96 405–14, 2001).
This study aimed at identifying the optimal recording locations in the MCG and the
BSPM for detection of exercise-induced ischemia. Study group comprised 24 CAD
patients with single vessel disease and 17 healthy volunteers. The optimal locations for
detecting ischemia-induced alteration in the amplitude of the ST segment and T wave
were identified by calculating discriminant index (DI) maps for both time intervals in
the MCG and the BSPM. In the BSPM, the optimal recording location for separating
CAD patients from controls by the ST segment depression at cessation of exercise
was at the lower left side, below the lead V5 of the 12-lead ECG. The optimal area for
detecting ischemia-induced ST segment elevation was over the upper right anterior and
posterior thorax. In the MCG, the optimal locations for detecting ischemia by the ST
segment depression were over the central inferior part of the chest. The corresponding
locations for the ST elevation were over the upper left part of the thorax. In the
optimal MCG and BSPM measurement locations, the parameters studied (ST segment
depression and elevation, T wave amplitude increase and decrease) were significantly
different in the CAD patient group, compared to the control group.
IV Beat-to-beat analysis method for magnetocardiographic recordings during
interventions (Phys. Med. Biol. 46 975–82, 2001).
A method for beat-to-beat analysis of MCG data was developed in this study. The
method enabled extraction of MFMs at a given time instant from each cardiac cycle
during recovery from exercise, and monitoring of their development. Signal to noise
ratio of the MFMs was improved by mean filtering. In this manner, blurring of the
signals during ventricular repolarisation, observed in conventional signal averaging, was
avoided. A method for quantifying the exercise-induced change in the MFM orientation
and adjusting it with the corresponding alteration in the heart rate (HR) was also
developed. The analysis methods were tested with exercise MCG data, recorded in
three CAD patients and two healthy volunteers. The HR adjusted MFM rotation
during recovery period of exercise testing was more extensive in the patients compared
to the controls. The analysis method presented in this study can be applied also to an
on-line processing of MCG data. In addition, the method for extracting spatial signal
distributions can be applied to analysis of other bioelectromagnetic signals, such as
BSPM.

44 SUMMARY OF PUBLICATIONS
V Heart rate adjustment of magnetic field map rotation in detection of my-
ocardial ischemia in exercise magnetocardiography (Basic Res. Cardiol. Ac-
cepted for publication, 2001).
The analysis method developed in Publication IV was applied to exercise MCG data
recorded in 24 patients with single vessel CAD and 17 healthy volunteers. The aim
was to evaluate the performance of HR adjusted change in the MFM orientation in
detection of exercise-induced ischemia. The results were compared to the un-adjusted
MFM orientation, and to the 12-lead ECG both with and without HR adjustment.
During the recovery period of exercise testing, the HR adjusted MFM rotation was more
extensive in the CAD patient group than in the control group. The HR adjusted MFM
rotation at the ST segment performed better than the un-adjusted MFM orientation
at the ST segment immediately after exercise. It also had a higher or equal sensitivity
to CAD, when compared to the HR adjusted ST segment depression in the ECG,
at all values of specificity. At the T wave, the HR adjusted MFM rotation had an
equal or higher sensitivity compared to the MFM orientation 4 minutes postexercise,
independent of the required specificity. The MCG was found to be superior to the 12-
lead ECG in detection of ischemia, when data recorded postexercise were evaluated.
VI ST segment level and slope in exercise-induced myocardial ischemia eval-
uated with body surface potential mapping (Am. J. Cardiol. Accepted for
publication, 2001).
BSPM was recorded during exercise testing in 25 healthy controls, 27 single vessel
CAD patients, and in 18 patients with triple vessel CAD and a history of one or
more myocardial infarcts (MIs). The aim was to study the performance and optimal
recording locations of the ST segment slope in detection of exercise-induced ischemia.
The patients were classified into three subgroups, according to the main ischemia
region. DI maps of ischemia-induced alteration in ST segment amplitude and slope
were calculated for all patient groups. The leads with the highest absolute DI value
were considered optimal. The optimal area for detecting ST depression or ischemia-
induced decrease of ST slope were at the lower left thorax in the pooled CAD patient
group. In the patient subgroups with a different ischemic region, the extrema of the
DIs were approximately at the same areas as in the pooled CAD group. In the optimal
leads, the ST slope decrease as well as the ST depression due to exercise were more
extensive in all patient groups, when compared to the control group. One region,
sensitive for ischemia-induced ST segment depression and ST segment slope decrease,
was identified. The region was common for all CAD patient groups, despite variation
in the location of ischemia and presence or absence of a history of MI.

45
Statement of involvement
All publications included in this thesis are results of a group effort. The author of this
thesis designed and constructed the non-magnetic exercise ergometer which was used in the
measurements in all publications. The author was also responsible for the technical develop-
ment needed for implementing the protocol for the exercise MCG measurements. The signal
analysis in Publication I was performed by the author. The author played a significant
role in finding the signal averaging method for exercise MCG and BSPM signals used in
Publications I–III and VI. The extraction of the data of interest in these publications, and
calculation the ST segment slopes in Publication VI were performed by the author. The au-
thor had a significant contribution to the innovation and development of parameters used for
quantifying the ischemia-induced alterations in the MCG and the BSPM in Publications II–
VI. The author developed the beat-to-beat analysis method described in Publication IV and
utilised in Publication V. The author also performed the signal analysis in both of these
publications. The author wrote publications I, IV, and V, and participated in writing of the
other publications.

46 ACKNOWLEDGMENTS
Acknowledgments
The work for this thesis was accomplished at the Laboratory of Biomedical Engineering
at Helsinki University of Technology and at the BioMag Laboratory of Helsinki University
Central Hospital. I thank the supervisor of this thesis, Professor Toivo Katila, Dr.Tech., for
his contribution in drawing together excellent research facilities and an inspiring research
group. My instructor, Juha Montonen, Dr.Tech., I wish to thank for his invaluable guidance
which started long before the work presented in this thesis.
I thank Helena Hanninen, M.D., for her contribution to the patient measurements, the
data analysis, and the reporting of the results during the work for this thesis. I am grateful
for her decisiveness and commitment to research work, and for the fruitful and intensive
co-operation, which made possible completion of this thesis.
I owe warmest thanks to all colleagues working at the Laboratory of Biomedical Engi-
neering for an enjoyable and stimulating working environment. Especially, I wish to thank
Jukka Nenonen, Dr.Tech., for his ideas and work on the data analysis programs. The contri-
bution of Kim Simelius, Lic.Sc., to the development of the body surface potential mapping
system was of vital importance for accomplishing this thesis, and I wish to express my grat-
itude to him. I thank Katja Pesola, Dr.Tech., for the enjoyable years of working together
in the laboratory. I am very grateful to the Head of the BioMag Laboratory, Docent Risto
Ilmoniemi, Dr.Tech., for the excellent measurement facilities.
I am deeply indebted to Docent Lauri Toivonen, M.D., for his research ideas, and thor-
ough and innovative review of manuscripts. I wish to express my thanks to Docent Markku
Makijarvi, M.D., for his contribution to bringing together the interdisciplinary research group
and establishing international collaboration. I am grateful to Petri Korhonen, M.D., and
Lasse Oikarinen, M.D., Ph.D., for their effort in making the patient measurements.
I give my warmest thanks to my beloved wife Tiina for her love, and for being such as she
is. My parents, Pekka and Tuulikki I wish to thank for their continuous support throughout
my life.
I express my gratitude to Docent Pekka Raatikainen, M.D., and Professor Gerhard
Stroink, Ph.D., for reviewing the manuscript of this thesis. The financial support of the
Academy of Finland, the Jenny and Antti Wihuri Foundation, and the Foundation of tech-
nology in Finland is gratefully acknowledged.
Espoo, October 23, 2001
Panu Takala

47
References
Alexander K P, Shaw L J, Delong E R, Mark D B, Peterson E D Value of exercise treadmill testingin women JACC 32(6) 1657–64 (1998).
Baule G and McFee Detection of the magnetic field of the heart Am Heart J 55 95–8 (1963).
Brockmeier K, Comani S, Erne S N, Di Luzio A, Pasquarelli A, Romani G L Magnetocardiographyand exercise testing J Electrocardiol 27 137–42 (1994).
Brockmeier K, Schmitz L, Chavez J, Burghoff M, Koch H, Zimmerman R, Trahms L Magnetocar-diography and 32-lead potential mapping: Repolarization in normal subjects during pharma-cologically induced stress J Cardiovasc Electrophysiol 8 615–26 (1997).
Brockmeier K, Van Leeuwen P Magnetocardiographic stress test investigations analyzing ventric-ular repolarization changes Biomag2000, Proc. 12th Int. Conf. on Biomagnetism Nenonen J,Ilmoniemi R J, Katila T, (eds). Helsinki Univ. of Technology, Espoo, Finland pp. 546–48 (2001).
Chaitman B Exercise testing. Heart disease A textbook of cardiovascular medicine Braunwald E(ed) W.B. Saunders Company, Philadelphia pp. 153–76 (1997).
Cohen D, Lepeschkin E, Hosaka H, Massell B F, Myers G Abnormal patterns and physiologicalvariations in magnetocardiograms J Electrocardiol 9 398–409 (1976).
Cohen D and Hosaka H Magnetic field produced by a current dipole J Electrocardiol 9 409–17(1976b).
Cohen D, Savard P, Rifkin R, Lepeschkin E, Strauss W E Magnetic measurement of S-T and T-Q segment shifts in Humans. Part II: Exercise-induced S-T segment depression. Circ Res 53274–279 (1983).
Fischer G, Haueisen J, Tilg B Modre R, Wach P, Nowak H, Schwarz G, Leder U On T-wave inversionobserved in magnetocardiographic stress recordings – Analysis of simulated and measured dataBiomag2000, Proc. 12th Int. Conf. on Biomagnetism Nenonen J, Ilmoniemi RJ, Katila T, (eds).Helsinki Univ. of Technology, Espoo, Finland pp. 549–52 (2001).
Fletcher G F, Balady G, Froelicher V F, Hartley L H, Haskell W L, Pollock ML Exercise standards.A statement for healthcare professionals from the American Heart Association Circulation 91580–615 (1995).
Fridericia L Systolendauer im electrocardiogramm bei normalen menschen und bei herzkrankenActa Med Scand 53 469–86 (1920).
Gianrossi R, Detrano R, Mulvihill D, Lehman K, Dubach P, Colombo A, McArthur D, FroelicherV Exercise-induced ST depression in the diagnosis of coronary artery disease: A meata-analysisCirculation 80 87–98 (1989).
Gessner C, Endt P, Burghoff M, Trahms L Vortex currents detected by stress MCG and frag-mentation of ECG/MCG in VT patients Biogybernetics and Biomedical Engineering 19 39–51(1999).
Hailer B, Van Leeuwen P, Lange S, Wehr M Spatial distribution of QT dispersion measured bymagnetocardiography under stress in coronary artery disease J Electrocardiol 32 207–16 (1999).
Hanninen H, Takala P, Makijarvi M, Montonen J, Nenonen J, Katila T, Toivonen L Detection ofExercise Induced Myocardial Ischemia by Multichannel Magnetocardiography in Patients withSingle Vessel Coronary Artery Disease Recent Advances in Biomagnetism: Proceedings of the11th International Conference on Biomagnetism Yoshimoto T, Kotani M, Kuriki S, Karibe H,and Nakasato N (eds). Tohoku University Press, Sendai pp. 1037–1040 (1999).
Kandori A, Kanzaki H, Miyatake K, Hashimoto S, Itoh S, Tanaka N, Miyashita T, Tsukada K A

48 REFERENCES
method for detecting myocardial abnormality by using a total current-vector calculated fromST-segment deviation of a magnetocardiogram signal Med Biol Eng Comput 39 21–8 (2001).
Kandori A, Kanzaki H, Miyatake K, Hashimoto S, Itoh S, Tanaka N, Miyashita T, Tsukada K Amethod for detecting myocardial abnormality by using a current-ratio map calculated from anexercise-induced magnetocardiogram Med Biol Eng Comput 39 29–34 (2001b).
Kawaoka P Y and Yamashiro S M Separation of cardiac conduction system and atrial activities byspatial regression Med Eng Phys 18 45–50 (1996).
Kligfield P, Ameisen O, Okin P Heart rate adjustment of ST segment depression for improveddetection of coronary artery disease. Circulation 79 245–55 (1989).
Kligfield P, Okin P M, Goldberg H L Value and limitations of heart rate-adjusted ST segmentdepression criteria for the identification of anatomically severe coronary obstruction: Test per-formance in relation to method of rate correction, definition of extent of disease, and β-blocade.Am Heart J 125 1262–1268 (1993).
Kornreich F, Montague T J, Rautaharju P M Identification of first acute Q wave and non-Q wavemyocardial infarction by multivariate analysis of body surface potential maps. Circulation 842442–53 (1991).
Lant J, Stroink G, ten Voorde B, Horacek B M, Montague T J Complementary nature of elec-trocardiographic and magnetocardiographic data in patients with ischemic heart disease. JElectrocardiol 23 315–22 (1990).
McPherson D D, Horacek B M, Sutherland D J, Armstrong C S, Spencer C A, Montague T JExercise electrocardiographic mapping in normal subjects. J Electrocardiol 18 351–60 (1985).
Meyer C and Keiser H Electrocardiogram baseline noise estimation and removal using cubic splinesand state-space computation techniques. Computers and Biomedical Research 10 459–470(1977).
Montonen J, Ahonen A, Hamalainen M, Ilmoniemi R J, Laine P, Nenonen J, Paavola M, Simelius K,Simola J, Katila T Magnetocardiographic functional imaging studies in the BioMag laboratoryBiomag 96, Proceedings of the tenth international conference on biomagnetism Aine C J, OkadaY, Stroink G, Swithenby S J, Woods C C (eds). Springer-Verlag, New York pp. 494–7 (2000).
Moshage W and Achenbach S Clinically significant differences between ECG and MCG. Biomedi-zinische Technik 42(S1) 25–7 (1997).
Makijarvi M, Hanninen H, Takala P, Pesola K, Nenonen J, Lauerma K, Montonen J, Korho-nen P, Oikarinen L, Toivonen L, Katila T Detection and Localization of Myocardial Ischemiaand Viability by Magnetocardiography Recent Advances in Biomagnetism: Proceedings of the11th International Conference on Biomagnetism Yoshimoto T, Kotani M, Kuriki S, Karibe H,Nakasato N (eds). Tohoku University Press, Sendai pp. 998–1001 (1999).
Nowak H Biomagnetic instrumentation Magnetism in medicine W Andra and H Nowak (eds).Wiley-VCH, Berlin pp. 88–135 (1998).
Okin P M, Kligfield P, Ameisen O, Goldberg H L, Borer J S Improved accuracy of the exerciseelectrocardiogram: identification of three-vessel coronary disease in stable angina pectoris byanalysis of peak rate-related changes in ST segments. Am J Cardiol 55 271–276 (1985)
Okin P and Kligfield P Heart rate adjustment of ST segment depression and performance of theexercise electrocardiogram: a critical evaluation. J Am Coll Cardiol 25 1726–1735 (1995).
Pesola K, Hanninen H, Lauerma K, Lotjonen J, Makijarvi M, Nenonen J, Takala P, Voipio-PulkkiL-M, Toivonen L, Katila T Current density estimation on the left ventricular epicardium:A potential method for ischemia localization Biomedizinische Technik 44 (suppl. 2) 143–146

49
(1999).
Paavola M, Ilmoniemi R, Sohlstrom L, Meinander T, Penttinen A, Katila T High performancemagnetically shielded room for clinical measurements Biomag 96, Proceedings of the tenthinternational conference on biomagnetism Aine CJ, Okada Y, Stroink G, Swithenby SJ, WoodsCC (eds). Springer-Verlag, New York pp. 87–90 (2000).
Paavola M, Simelius K, Montonen J, Nenonen J, Katila T Averaging in Cardiographic Signal Pro-cessing Finnish signal processing symposium, Finsig’95, symposium proceedings, Espoo: TKKOffset, pp. 138–141 (1995).
Saarinen M, Karp P, Katila T, Siltanen P The magnetocardiogram in cardiac disorders. CardiovascRes 8 820–34 (1974).
Savard P, Cohen D, Lepeschkin E, Cuffin B N, Madias J E Magnetic measurement of S-T and T-Qsegment shifts in Humans Part I: Early repolarization and left bundle branch block. Circ Res53 264–73 (1983).
Seese B, Moshage W, Achenbach S, Killmann R, Bachmann KMagnetocardiographic (MCG) analy-sis of myocardial injury currents Biomagnetism: Fundamental research and clinical applications,Amsterdam:Elsevier/IOS-Press, pp. 628–632 (1995).
Surawicz B Electrophysiologic basis of ECG and cardiac arrhythmias. Williams &Wilkins, Malvern,PA, USA (1995).
Takala P Exercise ergometer in cardiomagnetic measurements. Master’s thesis, Helsinki Universityof Technology. In Finnish (1997).
Takala P, Hanninen H, Montonen J, Makijarvi M, Nenonen J, Oikarinen L, Simelius K, ToivonenL, Katila T Comparison of Magnetocardiographic and Electrocardiographic Exercise Mappingin Healthy Volunteers Recent Advances in Biomagnetism: Proceedings of the 11th InternationalConference on Biomagnetism Yoshimoto T, Kotani M, Kuriki S, Karibe H, Nakasato N (eds).Tohoku University Press, Sendai pp. 306–309 (1999).
Takala P, Haapalahti P, Montonen J, Makijarvi M, Salorinne Y, Toivonen L, Katila T Beat-to-beatvariability of T-wave in multichannel magnetocardiogram and 12-lead electrocardiogram duringphysiological interventions Biomag2000, Proc. 12th Int. Conf. on Biomagnetism Nenonen J,Ilmoniemi R J, Katila T, (eds). Helsinki Univ. of Technology, Espoo, Finland pp. 538–41 (2001).
Tripp J H Physical consepts and mathematical models Biomagnetism, an interdisciplinary approachWilliamson SJ, Romani G-L, Kaufman L, Modena I (eds). Plenum press, New York pp. 101–39(1982).
Tsukada K, Miyashita T, Kandori A, Mitsui T, Terada Y, Sato M, Shiono J, Horigome H, YamadaS, Yamaguchi I An iso-integral mapping tehcnique using magnetocardiogram, and its possibleuse for diagnosis of ischemic heart disease. Int J Card Imaging 16 55–66 (2000).
Van Leeuwen P, Hailer B, Lange S, Donker D, Gronemeyer D Spatial and temporal changes duringthe QT-interval in the magnetic field of patients with coronary artery disease BiomedizinischeTechnik 44 (suppl. 2) 139–42 (1999).
Van Leeuwen P, Stroink G, Hailer B, Adams A, Lange S, Gronemeyer D. Rest and stress magne-tocardiography in coronary artery disease. Med Biol Eng Comput 37 1482–3 (1999b).
Van Leeuwen P, Hailer B, Klein A, Lukat M, Enke R, Lux R, Gronemeyer D Electric and magneticQT iso-integral maps in patients with and without coronary artery disease under pharmacologi-cally induced stress Biomag2000, Proc. 12th Int. Conf. on Biomagnetism Nenonen J, IlmoniemiRJ, Katila T, (eds). Helsinki Univ. of Technology, Espoo, Finland pp. 557–60 (2001).
Vaananen H, Korhonen P, Montonen J, Makijarvi M, Nenonen J, Oikarinen L, Simelius K, Toivo-

50 REFERENCES
nen L, Katila T Non-invasive arrhythmia risk evaluation in clinical environment. Herzschr.Elektrophys. 11 229–34, (2000).
Winklmaier M, Achenbach S, Trahms L, Pohle C, Daniel W C, Moshage W Bicycle stress in healthysubjects: differences between ECG and biplane MCG Med Biol Eng Comput 37 1478–9 (1999).