Embed Size (px)
Citation preview

SLEEP, Vol. 32, No. 7, 2009 927
ALTHOUGH OBSTRUCTIVE SLEEP APNEA SYNDROME (OSAS) OCCURS QUITE FREQUENTLY IN THE PEDIAT-RIC POPULATION, WITH A PREVALENCE RATE OF 1 TO 3% in preschool-aged children,1 the cardiovascular consequenc-es of OSAS in children have been less extensively studied, com-pared with the adult form of sleep-disordered breathing. Most studies have suggested a causal link between OSAS and cardio-vascular disease in adults,2-4 primarily in the form of systemic hypertension, myocardial infarction, and stroke. Cardiovascular disease has also been reported to occur in children with severe OSAS, but the more common manifestations are pulmonary hy-pertension; compromised right ventricular function, including cor pulmonale; and congestive heart failure.5,6 The cumulative evidence in adults suggests that autonomic dysfunction, in the form of reduced parasympathetic activity and elevated sympa-thetic tone, plays an important role in mediating the link between OSAS and cardiovascular disease.2-4 In contrast, the chronic effects of OSAS on autonomic function in children have been little studied.6 In this study, we hypothesize that the autonomic nervous system is also adversely affected in pediatric OSAS but that the relative impact on the parasympathetic and sympathetic branches differs from what occurs in adults.
In recent years, it has become increasingly popular to em-ploy spectral analysis of heart rate variability (HRV) as a simple and cost-effective tool for noninvasive assessment of autonomic function.7 The power of the HRV spectrum in the frequency range of 0.15 to 0.4 Hz, referred to as high-frequency power (HFP), is frequently taken to quantify vagal tone. On the other hand, HRV power from 0.04 to 0.15 Hz, referred to as low-frequency power (LFP), has been shown to reflect both sympathetic and parasympathetic activity.8 The ratio (LHR) between LFP and HFP is therefore known as representing an index of sympathovagal balance,8 with a higher LHR imply-ing a shift toward sympathetic dominance, a decrease in vagal tone, or both.9 The underpinnings of HRV spectral analysis are derived largely from the 1975 study of Katona and Jih,10 which demonstrated, in an animal preparation, a linear relationship between respiratory-related fluctuations in R-R intervals (RRI) and vagal firing rates. Studies using HRV for autonomic-func-tion assessment often overlook the fact that this key observation and the other validation findings that followed11 were obtained under conditions in which respiration was relatively well con-trolled. However, it has been shown that changes or differences in breathing frequency, tidal volume, or ventilatory pattern can significantly confound the interpretation of autonomic activity that one derives from HRV spectral analysis.12,13 Some inter-ventions that increase sympathetic drive also lead to increases in LFP of blood-pressure variability (BPV).8 Thus, the power of low-frequency BPV oscillations has been proposed by some to represent a quantitative index of sympathetic modulation of the peripheral vasculature. At the same time, however, there are other observations that do not support this view.9
CardiovasCular autonomiC Control in Children with osa
Model-Based Assessment of Cardiovascular Autonomic Control in Children with Obstructive Sleep ApneaJarree Chaicharn, PhD1; Zheng Lin, PhD1; Maida L. Chen, MD2; Sally L.D. Ward, MD3; Thomas Keens, MD3; Michael C. K. Khoo, PhD1
Departments of 1Biomedical Engineering and 2Medicine, University of Southern California, Los Angeles, CA; 3Department of Pediatric Pulmonology, Children’s Hospital Los Angeles, Los Angeles, CA
study objectives: To quantitatively assess daytime autonomic cardio-vascular control in pediatric subjects with and without obstructive sleep apnea syndrome (OSAS).design: Respiration, R-R intervals, and noninvasive continuous blood pressure were monitored in awake subjects in the supine and standing postures, as well as during cold face stimulation.setting: Sleep disorders laboratory in a hospital setting.Participants: Ten pediatric patients (age 11.4 ± 3.6 years) with moder-ate to severe OSAS (obstructive apnea-hypopnea index = 21.0 ± 6.6/ h) before treatment and 10 age-matched normal control subjects (age 11.5 ± 3.7 years).measurements and results: Spectral analysis of heart rate variability revealed that high-frequency power was similar and the ratio of low- to high-frequency power was lower in subjects with OSAS vs control sub-jects. The closed-loop minimal model allowed heart rate variability to be partitioned into a component mediated by respiratory-cardiac coupling and a baroreflex component, whereas blood pressure variability was
assumed to result from the direct effects of respiration and fluctuations in cardiac output. Baroreflex gain was lower in subjects with OSAS vs control subjects. Under orthostatic stress, respiratory-cardiac coupling gain decreased in both subject groups, but baroreflex gain decreased only in controls. The model was extended to incorporate time-varying parameter changes for analysis of the data collected during cold face stimulation: cardiac output gain increased in controls but remained un-changed in OSAS.Conclusions: Our findings suggest that vagal modulation of the heart remains relatively normal in pediatric subjects with OSAS. However, baseline cardiovascular sympathetic activity is elevated, and reactivity to autonomic challenges is impaired.Keywords: pediatric sleep disordered breathing, autonomic nervous system, mathematical model, respiratory sinus arrhythmia, baroreflexCitation: Chaicharn J; Lin Z; Chen ML; Ward SLD; Keens T; Khoo MCK. Model-based assessment of cardiovascular autonomic control in children with obstructive sleep apnea. SLEEP 2009;32(7):927-938.
submitted for publication september, 2008Submitted in final revised form March, 2009accepted for publication april, 2009Address correspondence to: Michael C.K. Khoo, PhD, Biomedical En-gineering Department, University of Southern California, DRB-140, Uni-versity Park, Los Angeles, CA 90089-1111; Tel: (213) 740-0347; E-mail: [email protected]
Daytime Autonomic Function in Pediatric OSA—Chaicharn et al

SLEEP, Vol. 32, No. 7, 2009 928
To circumvent the limitations associated with spectral analy-sis of HRV or BPV, we have developed an alternative approach for noninvasive assessment of autonomic function. This ap-proach employs a closed-loop model that relates HRV to res-piration and BPV and relates BPV to changes in heart rate and respiration. The model has been validated in a number of studies on adult subjects with OSAS and normal control subjects under a variety of conditions.14-17 For instance, our group has shown that continuous positive airway pressure therapy in subjects with OSAS leads to improved autonomic function, as reflected in cardiovascular variability.14 In another study, we showed that autonomic control is impaired in subjects with OSAS during both wakefulness and sleep.15,16 We recently extended the mod-el so that temporal changes in the parameters can be estimated when data are collected under time-varying conditions, such as during arousals from sleep.17,18
In this study, we applied both the original and time-varying versions of the closed-loop model to assess cardiovascular au-tonomic control in pediatric OSAS under conditions of altered orthostatic stress and cold face stimulation (CFS). Changing posture from supine to standing is known to increase sympa-thetic drive and decrease vagal tone. The CFS test activates the diving reflex, which produces an increase in systemic vascular resistance via an elevation of peripheral sympathetic activity, along with a concomitant bradycardia as a consequence of in-creased vagal drive.19,20 The combination of the 2 autonomic tests thus allowed us to determine how the model parameters would be affected by conditions in which vagal and sympathet-ic activity are altered in opposite directions (orthostatic stress), as well as in the same direction (CFS).
methods
Participants
Ten pediatric patients with moderate to severe OSAS (ob-structive apnea-hypopnea index = 21 ± 5.3/h) before treatment and 10 normal control subjects were recruited. The normal con-trol subjects were selected only if the subject’s parents affirmed that their child did not snore at all; subjects who snored oc-
casionally were excluded and so were those who had a cold or upper respiratory infection. Subjects in the OSAS group were selected if their apnea-hypopnea index (AHI) was greater than or equal to 5, based on the outcome of a prior polysomnograph-ic study. Subjects with OSAS that was believed to be related to craniofacial abnormality or genetic syndromes were excluded. None of the subjects had a history of lung disease, cardiac ar-rhythmia, congestive heart failure, or diabetes. They all were screened with a pulmonary function test for abnormal lung me-chanics; the result was negative in all subjects. The study was approved by the Committee on Clinical Investigations (institu-tional review board) of Childrens Hospital Los Angeles. Writ-ten informed consent was obtained from the parents of each subject before participation in the study. Assent was obtained from the subjects themselves.
The average age of the OSAS group was 11.4 ± 0.5 years, and the subjects had a mean BMI of 25.7 ± 2 kg/m2; the average age of the control group was 11.5 ± 0.9 years, and the subjects had a mean BMI of 18.3 ± 0.8 kg/m2 (Table 1). Thus, average BMI was larger in the OSAS group versus the control group (P = 0.007). All of the subjects with OSAS had overt tonsillar hypertrophy. Table 2 summarizes the results of the polysomno-graphic studies performed on the subjects with OSAS prior to the start of this research study.
experimental Procedures and data Preprocessing
The experimental protocol consisted of 3 parts: (1) spontane-ous breathing in the supine posture for 15 to 20 minutes (base-line condition); (2) spontaneous breathing during standing for 15 to 20 minutes (orthostatic stress); and (3) (CFS, after the participant rested for 3 minutes in supine wakefulness, a gel pack (cooled to 0°C) was placed on the participant’s forehead for 1 minute and was subsequently removed while recording continued for another 5 minutes. During the experiments, non-invasive continuous blood pressure (using a Model 7000 arte-rial wrist tonometer, Colin Medical Instruments, San Antonio, TX), electrocardiogram (by 3-lead electrocardiogram, BMA-831 bio-amplifier, CWE, Ardmore, PA), and respiratory air flow (by pneumotachometer, model 3700, Hans Rudolph, Kansas
Table 1—Participant Characteristics
Control subjects Subjects with OSASParticipant Age, y BMI, kg/m2 Sex Participant Age, y BMI, kg/m2 AHI Sex N1 12.3 22.7 M O1 10.2 23.0 11 FN2 9.9 16.8 M O2 11.1 21.8 14 FN3 8.2 17.7 F O3 10.2 24.6 8.3 FN4 10.2 18.4 F O4 10.5 30.8 52 MN5 15.6 22.3 M O5 11.4 15.7 16 MN6 16.7 20.2 F O6 10.1 17.9 15 FN7 11.5 17.8 M O7 14.0 26.4 30 FN8 8.3 16.8 M O8 12.0 33.3 49 FN9 11.5 15.5 F O9 10.7 31.0 10 MN10 11.4 14.9 M O10 14.1 33.1 5 FMean 11.5 18.3 Mean 11.4 25.8 21.0 SEM 3.7 5.8 SEM 3.6 8.1 6.6
Note: BMI refers to body mass index; AHI, apnea-hypopnea index, the number of apneas and hypopneas per hour of sleep.
Daytime Autonomic Function in Pediatric OSA—Chaicharn et al
SLEEP, Vol. 32, No. 7, 2009 929
City, MO) were recorded. Blood pressure and electrocardio-gram were sampled at 200 Hz, and airflow was sampled at 20 Hz. RRIs were extracted from the electrocardiogram. Systolic (SBP) and diastolic (DBP) blood pressure were extracted on a beat-by-beat basis. Instantaneous lung volume (ILV) was de-rived by integrating the respiratory airflow signal. Finally, each signal was linearly detrended and uniformly resampled at 2 Hz using an algorithm similar to that of Berger et al.21
modeling and Parameters estimation
To determine how changes in ILV (∆V) and fluctuations in SBP (∆SBP) dynamically produce fluctuations in RRI (∆RRI), we employed a closed-loop model structure similar to that pub-lished by Belozeroff et al.14 This model was used to analyze the data collected from the subjects under relatively stable and sta-tionary conditions in the supine and standing postures. To cap-ture the dynamics of the transient changes that occurred during and immediately following CFS, the assumption of stationarity was relaxed to allow the model parameters to be time varying.
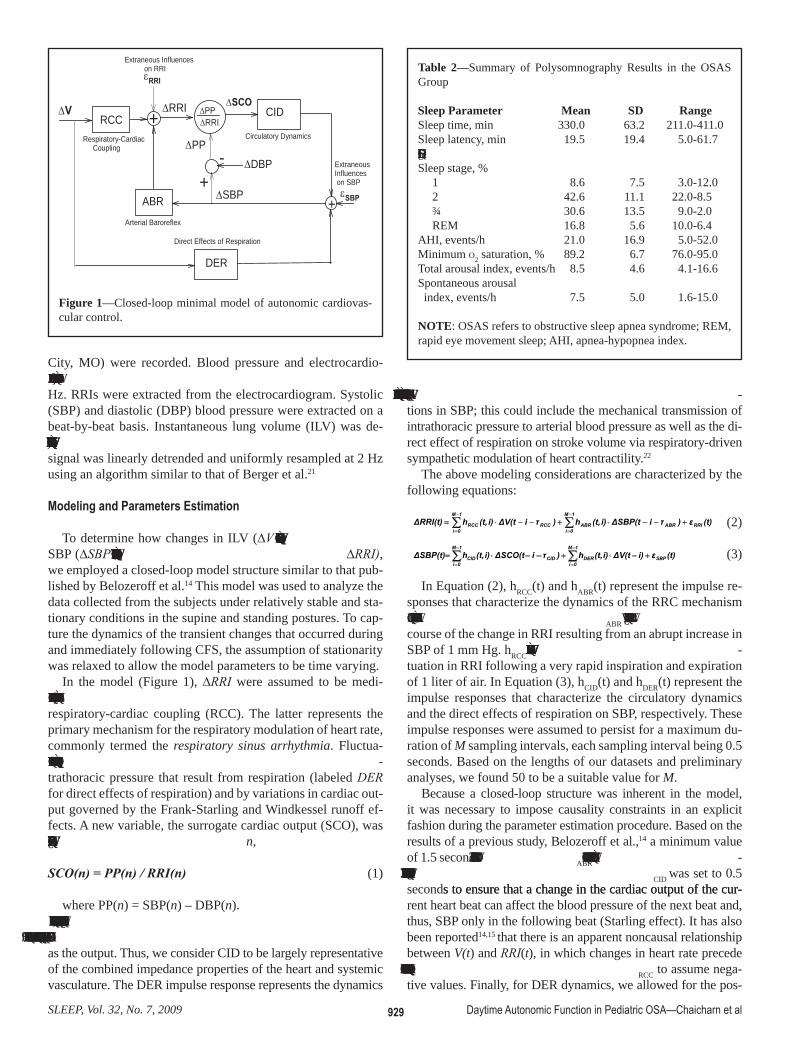
In the model (Figure 1), ∆RRI were assumed to be medi-ated autonomically by the arterial baroreflex (ABR) and from respiratory-cardiac coupling (RCC). The latter represents the primary mechanism for the respiratory modulation of heart rate, commonly termed the respiratory sinus arrhythmia. Fluctua-tions of SBP were assumed to be influenced by changes in in-trathoracic pressure that result from respiration (labeled DER for direct effects of respiration) and by variations in cardiac out-put governed by the Frank-Starling and Windkessel runoff ef-fects. A new variable, the surrogate cardiac output (SCO), was defined in the following way: at beat n,
SCO(n) = PP(n) / RRI(n) (1)
where PP(n) = SBP(n) – DBP(n).We defined the circulatory dynamics (CID) component of the
model as the transfer function relating ∆SCO as the input to ∆SBP as the output. Thus, we consider CID to be largely representative of the combined impedance properties of the heart and systemic vasculature. The DER impulse response represents the dynamics
of the transmission between respiratory fluctuations and fluctua-tions in SBP; this could include the mechanical transmission of intrathoracic pressure to arterial blood pressure as well as the di-rect effect of respiration on stroke volume via respiratory-driven sympathetic modulation of heart contractility.22
The above modeling considerations are characterized by the following equations:
(t)ε)τiΔSBP(ti)(t,h)τiΔV(ti)(t,hΔRRI(t) RRI
1M
0iABRABR
1M
0iRCCRCC +−−⋅+−−⋅= ∑∑
−
=
−
= (2)
(t)εi)ΔV(ti)(t,h)τiΔSCO(ti)(t,hΔSBP(t) SBP
1M
0iDER
1M
0iCIDCID +−⋅+−−⋅= ∑∑
−
=
−
=
(3)
In Equation (2), hRCC(t) and hABR(t) represent the impulse re-sponses that characterize the dynamics of the RRC mechanism and the baroreflexes, respectively. hABR(t) quantifies the time course of the change in RRI resulting from an abrupt increase in SBP of 1 mm Hg. hRCC(t) represents the time course of the fluc-tuation in RRI following a very rapid inspiration and expiration of 1 liter of air. In Equation (3), hCID(t) and hDER(t) represent the impulse responses that characterize the circulatory dynamics and the direct effects of respiration on SBP, respectively. These impulse responses were assumed to persist for a maximum du-ration of M sampling intervals, each sampling interval being 0.5 seconds. Based on the lengths of our datasets and preliminary analyses, we found 50 to be a suitable value for M.
Because a closed-loop structure was inherent in the model, it was necessary to impose causality constraints in an explicit fashion during the parameter estimation procedure. Based on the results of a previous study, Belozeroff et al.,14 a minimum value of 1.5 seconds was assumed for τABR, reflecting the fact that laten-cies are present in the baroreception process. τCID was set to 0.5 seconds to ensure that a change in the cardiac output of the cur-s to ensure that a change in the cardiac output of the cur-rent heart beat can affect the blood pressure of the next beat and, thus, SBP only in the following beat (Starling effect). It has also been reported14,15 that there is an apparent noncausal relationship between V(t) and RRI(t), in which changes in heart rate precede changes in lung volume. Thus we allowed τRCC to assume nega-tive values. Finally, for DER dynamics, we allowed for the pos-
∆PP∆RRI
∆SCO
∆SBP εSBP
DER
+
CID
-+
∆DBP
∆RRIRCC
ABR
∆V
εRRI
∆PPRespiratory-Cardiac Coupling
Arterial Baroreflex
Direct Effects of Respiration
Circulatory Dynamics
Extraneous Influences on RRI
Extraneous Influences on SBP
+
Figure 1—Closed-loop minimal model of autonomic cardiovas-cular control.
Table 2—Summary of Polysomnography Results in the OSAS Group
Sleep Parameter Mean SD RangeSleep time, min 330.0 63.2 211.0-411.0Sleep latency, min 19.5 19.4 5.0-61.7Sleep efficiency, % 86.1 11.0 63.0-96.0Sleep stage, % 1 8.6 7.5 3.0-12.0 2 42.6 11.1 22.0-8.5 ¾ 30.6 13.5 9.0-2.0 REM 16.8 5.6 10.0-6.4AHI, events/h 21.0 16.9 5.0-52.0Minimum o2 saturation, % 89.2 6.7 76.0-95.0Total arousal index, events/h 8.5 4.6 4.1-16.6Spontaneous arousal index, events/h 7.5 5.0 1.6-15.0
NOTE: OSAS refers to obstructive sleep apnea syndrome; REM, rapid eye movement sleep; AHI, apnea-hypopnea index.
Daytime Autonomic Function in Pediatric OSA—Chaicharn et al

SLEEP, Vol. 32, No. 7, 2009 930
domain. Subsequently, the following descriptors were extracted from each transfer function: (1) the overall dynamic gain (DG) or the average transfer function magnitude between 0.04 and 0.4 Hz; 2) the high-frequency gain (HFG), the average transfer function magnitude between 0.15 and 0.4 Hz; and 3) the low-frequency gain (LFG), the average transfer function magnitude between 0.04 and 0.15 Hz.
Other Calculations
For each dataset, the following descriptors were also calcu-lated: (1) the mean values of RRI and SBP for the data segment in question, (2) the spectral indices of HRV: HFPRRI and LHR, (3) and the FLP (LFPSBP) of the SBP time course. The spectral indices were computed using the Blackman-Tukey method of spectral analysis.13
statistical tests
For the orthostatic stress results, 2-way repeated measures analysis of variance (ANOVA) was applied to each of the es-timated model descriptors. The first (unrepeated) factor was Participant Group (control vs OSAS), whereas the other (re-peated) factor was Condition (supine vs standing). If the 2-way repeated measures ANOVA indicated significant differences in the factors or their interaction, posthoc pairwise comparisons were performed using the Holm-Sidak method. In CFS, the per-centage change of each feature from pre-CFS (an average of 1 minute of feature before the test) was calculated. Subsequently, 2 minutes of the percentage change of each feature were aver-aged every 5 seconds. Subsequently, 2-way repeated measures ANOVA was performed in which 1 factor (unrepeated) was Participant Group (control vs OSAS) and the other (repeated) factor was Time from Start of CFS. These analyses were re-
sibility that the mechanical effect of respiration on blood pressure could be virtually instantaneous; hence, no delay was assumed in this case. εRRI(t) and εSBP(t) represent the discrepancy (error) between the model predictions and the corresponding RRI and SBP measurements, respectively, reflecting those aspects of the data that are not explained by the model.
The Meixner expansion of kernels technique23 was used to estimate the unknown impulse responses hRCC, hABR, hCID, and hDER. The least-squares minimization procedure was repeated for a range of values for the delays (τABR and τ RCC), the order of generalization (n from 0 to 5), and Meixner function orders (qABR and qRCC from 4 to 8). For each combination of delays, the order of generalization and Meixner function orders—a metric of the quality of fit, known as the “minimum description length” (MDL)—was computed.24 Selection of the optimal candidate model was based on a global search for the minimum MDL; in addition, this optimal solution had to satisfy the condition that the cross-correlations between the residual errors and past values of the 2 inputs (∆V(t) and ∆SBP(t)) were statistically indistinguishable from 0. Details of the time-varying version of this model are given in Appendix 1.
The estimation of the above impulse responses was improved by increasing the orthogonality between the 2 inputs. This was achieved by using an autoregressive model with exogenous in-put (ARX model) to filter out the RCC from ∆SBP. Respiration and the respiration-uncorrelated ∆SBP were used as dual in-puts to the model, as represented in Equation (2). Subsequently, the calculated hABR(t) was kept unchanged while estimation of hRCC(t) was repeated using the respiration and original (un-orthogonalized) blood pressure inputs. This technique was also applied to estimate hCID(t) and hDER(t).
Once each model-component impulse response was estimat-ed, the corresponding transfer function was computed by apply-ing the fast Fourier transform for conversion to the frequency
Log 10
(HFP
RR
I)
2.0
2.5
3.0
3.5
4.0
LFP
RR
I/HFP
RR
I
0
2
4
6
8
Sup Std Sup Std Sup Std Sup StdCONTROL OSAS CONTROL OSAS
Figure 2—Effects of orthostatic stress on the spectral indices of heart rate variability (HFPRRI and LHR) in control subjects (CONTROL) and subjects with obstructive sleep apnea syndrome (OSAS). Lines depict how HFPRRI (left panel) and LHR (right panel) change in individual subjects. The circles and error bars represent group means and SEM. See Appendix 2 for definition of abbreviations.
Daytime Autonomic Function in Pediatric OSA—Chaicharn et al
SLEEP, Vol. 32, No. 7, 2009 931
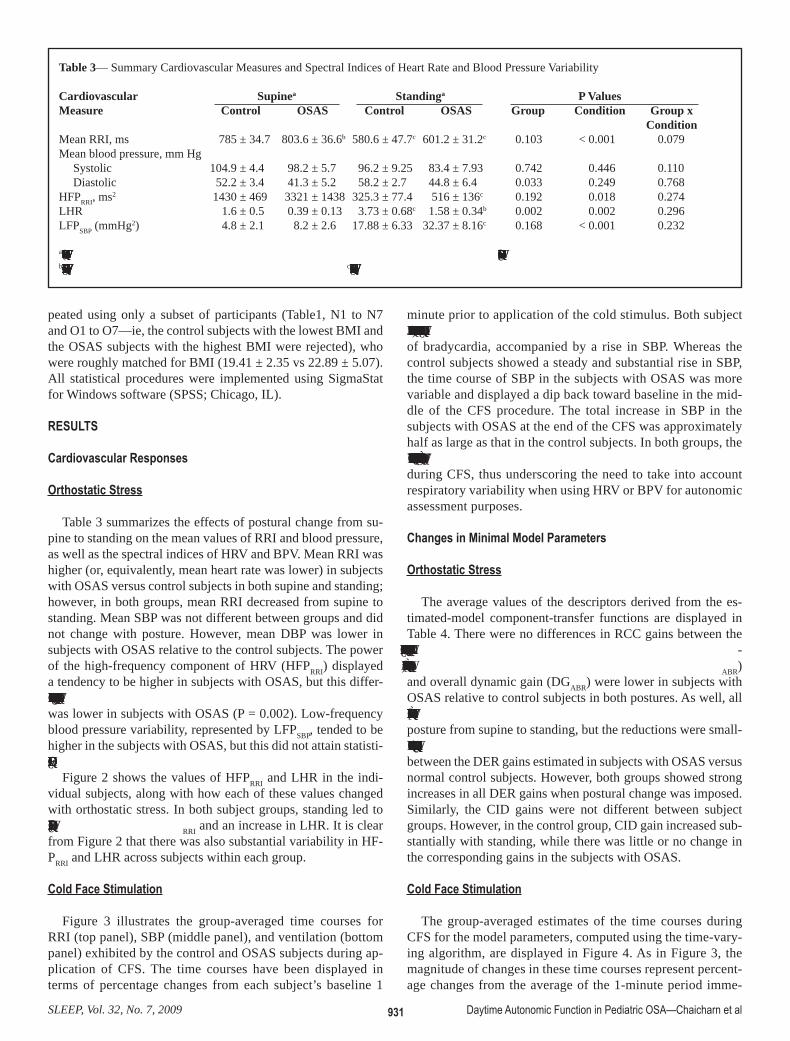
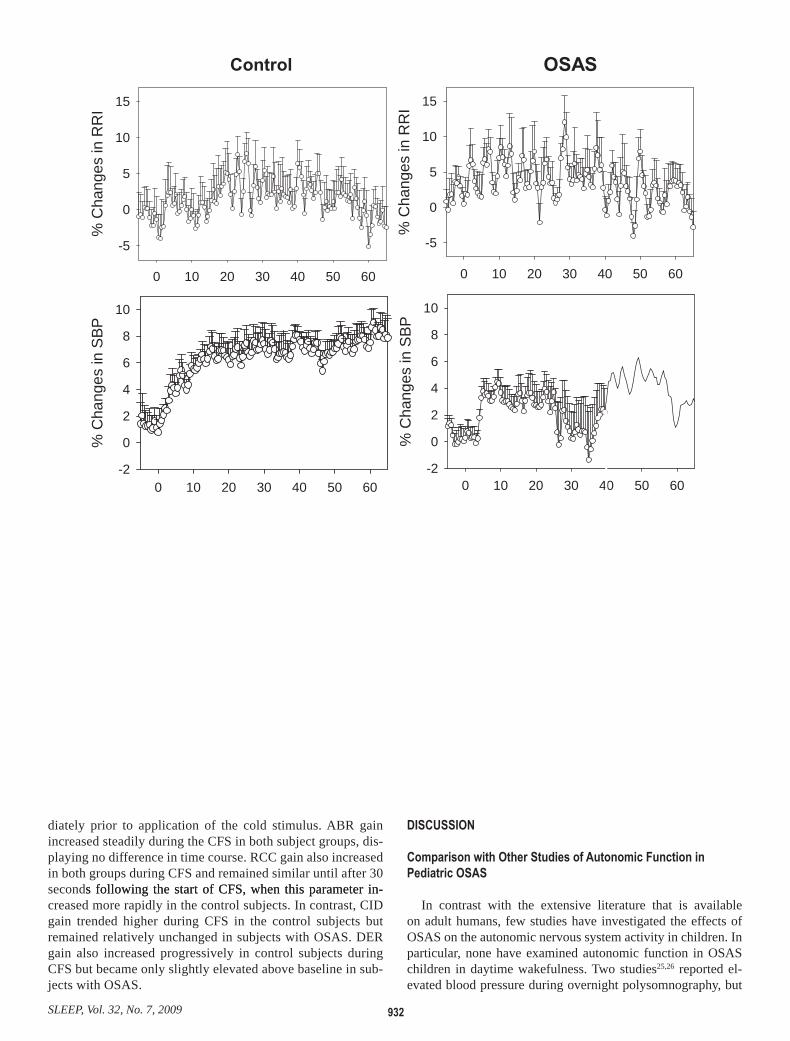
minute prior to application of the cold stimulus. Both subject groups responded to CFS with a small but significant degree of bradycardia, accompanied by a rise in SBP. Whereas the control subjects showed a steady and substantial rise in SBP, the time course of SBP in the subjects with OSAS was more variable and displayed a dip back toward baseline in the mid-dle of the CFS procedure. The total increase in SBP in the subjects with OSAS at the end of the CFS was approximately half as large as that in the control subjects. In both groups, the ventilation time courses also displayed significant fluctuations during CFS, thus underscoring the need to take into account respiratory variability when using HRV or BPV for autonomic assessment purposes.
Changes in Minimal Model Parameters
Orthostatic Stress
The average values of the descriptors derived from the es-timated-model component-transfer functions are displayed in Table 4. There were no differences in RCC gains between the subject groups; in both groups, standing led to significant reduc-tions in all RCC gains. Baroreflex low-frequency gain (LFGABR) and overall dynamic gain (DGABR) were lower in subjects with OSAS relative to control subjects in both postures. As well, all parameters related to baroreflex gain decreased with change of posture from supine to standing, but the reductions were small-er in subjects with OSAS. There was no significant difference between the DER gains estimated in subjects with OSAS versus normal control subjects. However, both groups showed strong increases in all DER gains when postural change was imposed. Similarly, the CID gains were not different between subject groups. However, in the control group, CID gain increased sub-stantially with standing, while there was little or no change in the corresponding gains in the subjects with OSAS.
Cold Face stimulation
The group-averaged estimates of the time courses during CFS for the model parameters, computed using the time-vary-ing algorithm, are displayed in Figure 4. As in Figure 3, the magnitude of changes in these time courses represent percent-age changes from the average of the 1-minute period imme-
peated using only a subset of participants (Table1, N1 to N7 and O1 to O7—ie, the control subjects with the lowest BMI and the OSAS subjects with the highest BMI were rejected), who were roughly matched for BMI (19.41 ± 2.35 vs 22.89 ± 5.07). All statistical procedures were implemented using SigmaStat for Windows software (SPSS; Chicago, IL).
results
Cardiovascular responses
Orthostatic Stress
Table 3 summarizes the effects of postural change from su-pine to standing on the mean values of RRI and blood pressure, as well as the spectral indices of HRV and BPV. Mean RRI was higher (or, equivalently, mean heart rate was lower) in subjects with OSAS versus control subjects in both supine and standing; however, in both groups, mean RRI decreased from supine to standing. Mean SBP was not different between groups and did not change with posture. However, mean DBP was lower in subjects with OSAS relative to the control subjects. The power of the high-frequency component of HRV (HFPRRI) displayed a tendency to be higher in subjects with OSAS, but this differ-ence was not statistically significant. On the other hand, LHR was lower in subjects with OSAS (P = 0.002). Low-frequency blood pressure variability, represented by LFPSBP, tended to be higher in the subjects with OSAS, but this did not attain statisti-cal significance.
Figure 2 shows the values of HFPRRI and LHR in the indi-vidual subjects, along with how each of these values changed with orthostatic stress. In both subject groups, standing led to a significant drop in HFPRRI and an increase in LHR. It is clear from Figure 2 that there was also substantial variability in HF-PRRI and LHR across subjects within each group.
Cold Face stimulation
Figure 3 illustrates the group-averaged time courses for RRI (top panel), SBP (middle panel), and ventilation (bottom panel) exhibited by the control and OSAS subjects during ap-plication of CFS. The time courses have been displayed in terms of percentage changes from each subject’s baseline 1
Table 3— Summary Cardiovascular Measures and Spectral Indices of Heart Rate and Blood Pressure Variability
Cardiovascular Supinea Standinga P ValuesMeasure Control OSAS Control OSAS Group Condition Group x ConditionMean RRI, ms 785 ± 34.7 803.6 ± 36.6b 580.6 ± 47.7c 601.2 ± 31.2c 0.103 < 0.001 0.079Mean blood pressure, mm Hg Systolic 104.9 ± 4.4 98.2 ± 5.7 96.2 ± 9.25 83.4 ± 7.93 0.742 0.446 0.110 Diastolic 52.2 ± 3.4 41.3 ± 5.2 58.2 ± 2.7 44.8 ± 6.4 0.033 0.249 0.768HFPRRI, ms2 1430 ± 469 3321 ± 1438 325.3 ± 77.4 516 ± 136c 0.192 0.018 0.274LHR 1.6 ± 0.5 0.39 ± 0.13 3.73 ± 0.68c 1.58 ± 0.34b 0.002 0.002 0.296LFPSBP (mmHg2) 4.8 ± 2.1 8.2 ± 2.6 17.88 ± 6.33 32.37 ± 8.16c 0.168 < 0.001 0.232
aData are presented as mean ± SEM. OSAS refers to obstructive sleep apnea syndrome; see Appendx 2 for definition of abbreviations.bSignificantly different from controls in the same condition. cSignificantly different from the same group in supine condition.
Daytime Autonomic Function in Pediatric OSA—Chaicharn et al
SLEEP, Vol. 32, No. 7, 2009 932
disCussion
Comparison with Other Studies of Autonomic Function in Pediatric osas
In contrast with the extensive literature that is available on adult humans, few studies have investigated the effects of OSAS on the autonomic nervous system activity in children. In particular, none have examined autonomic function in OSAS children in daytime wakefulness. Two studies25,26 reported el-evated blood pressure during overnight polysomnography, but
diately prior to application of the cold stimulus. ABR gain increased steadily during the CFS in both subject groups, dis-playing no difference in time course. RCC gain also increased in both groups during CFS and remained similar until after 30 seconds following the start of CFS, when this parameter in-s following the start of CFS, when this parameter in-creased more rapidly in the control subjects. In contrast, CID gain trended higher during CFS in the control subjects but remained relatively unchanged in subjects with OSAS. DER gain also increased progressively in control subjects during CFS but became only slightly elevated above baseline in sub-jects with OSAS.
Control
0 10 20 30 40 50 60
% C
hang
es in
RR
I
-5
0
5
10
15
OSAS
0 10 20 30 40 50 60
% C
hang
es in
RR
I
-5
0
5
10
15
0 10 20 30 40 50 60
% C
hang
es in
SBP
-2
0
2
4
6
8
10
0 10 20 30 40 50 60
% C
hang
es in
SBP
-2
0
2
4
6
8
10

SLEEP, Vol. 32, No. 7, 2009 933
frequency blood-pressure oscillations, LFPSBP, that appeared in both subject groups as a consequence of orthostatic stress is also consistent with the shift toward sympathetic predominance that accompanies standing. There are some possible explanations for our unexpected finding of a lower LHR and no significant differ-ences in HFPRRI in the OSAS group versus control subjects. The first and most straightforward interpretation is that the subjects with OSAS have normal levels of vagal activity but decreased sympathetic activity. This possibility seems quite unlikely and would be totally inconsistent with what has been learned about the chronic effects of intermittent hypoxia on the sympathetic nervous system. As well, decreased sympathetic modulation does not always imply reduced sympathetic tone. Indeed, it has been shown that low-frequency modulation of heart rate (and thus, LHR) can become virtually undetectable in patients with severe heart failure31 or under conditions of severe exercise in normal subjects,32 even though sympathetic drive is known to be elevat-ed. Indeed, employing HRV alone to assess autonomic tone has been likened to using the height of waves to predict the depth of the ocean at a given location.33 A second potential explanation for our finding is that the ventilatory patterns of some of the subjects during the short ( < 20-min duration) periods of measurement may have been affected by the highly controlled conditions of the experiments, and these may have confounded the HRV spectral indices of the subjects. For instance, we have shown that LHR can be altered dramatically in a given subject depending on the subject’s breathing rate and pattern.34 The third possibility, which we consider to be the most likely explanation, is given below.
Changes in Minimal Model Parameters
The preceding section underscores some of the potential pit-falls of relying solely on HRV spectral indices to draw con-clusions regarding autonomic function. These issues are not
another27 found no difference in SBP between subjects with OSAS and primary snorers, although DBP was significantly higher in subjects with OSAS. Amin et al.28 found no differ-ence in SBP or mean arterial pressure among primary snorers or those with mild OSAS and moderate to severe OSAS, but they did find a significantly lower DBP in subjects with moderate to severe OSAS. These apparent contradictions across studies have arisen in part because of the small differences in blood pressure between subjects with OSAS and control subjects, un-derscoring the need for more sensitive (noninvasive) indicators of autonomic function.
Aljadeff et al.29 compared HRV during overnight sleep be-tween pediatric subjects with OSAS and normal control subjects, but the study focused on the acute effects of episodic apnea or hypopnea on the beat-to-beat patterning of heart rate. Baharav et al.30 employed HRV spectral analysis to assess autonomic car-diac control in children with OSAS and normal control subjects in overnight sleep studies. They found normalized HFPRRI to be lower in the subjects with OSAS during rapid eye movement sleep and during wakefulness just prior to sleep onset. LHR in the subjects with OSAS was found to be higher relative to control subjects during the period of wakefulness immediately before the onset of sleep, slow-wave sleep, and rapid eye movement sleep. In contrast, our study, conducted only in daytime wakefulness, showed, in subjects with OSAS, that baseline (supine) LHR was lower versus that of control subjects, whereas HFPRRI was not sig-nificantly different. These results fall in contradistinction to what has been reported in adults with OSAS14,15 during wakefulness, not to mention Baharav’s study, although the latter was carried out during sleep. On the other hand, our findings of a reduction in HFPRRI and increase in LHR with orthostatic stress within sub-jects in both groups are consistent with the well-known decrease in vagal drive and increase in sympathetic tone that accompany postural changes from supine to upright.8,9 The increase in low-
Table 4—Comparison of Estimated Model Parameters and Spectral Indices for All Participants (Control vs OSAS in the Supine & Standing Positions)
Model Supinea Standinga P ValuesDescriptors Control OSAS Control OSAS Group Condition Group x ConditionRCC LF 1.07 ± 0.2 1.2 ± 0.3 0.62 ± 0.16 0.64 ± 0.11c 0.739 0.012 0.769 HF 1.48 ± 0.2 1.6 ± 0.4 0.63 ± 0.16c 0.74 ± 0.18c 0.631 0.003 0.970 OA 1.35 ± 0.2 1.5 ± 0.3 0.62 ± 0.15c 0.71 ± 0.15c 0.644 0.002 0.917ABR LF 0.033 ± 0.006 0.014 ± 0.002b 0.023 ± 0.004c 0.009 ± 0.002b 0.002 0.029 0.431 HF 0.028 ± 0.008 0.017 ± 0.006 0.012 ± 0.003 0.006 ± 0.003 0.128 0.032 0.649 OA 0.029 ± 0.007 0.016 ± 0.004 0.015 ± 0.003c 0.007 ± 0.003 0.031 0.026 0.590DER LF 0.039 ± 0.008 0.053 ± 0.011 0.10 ± 0.016c 0.10 ± 0.017c 0.702 < 0.001 0.537 HF 0.032 ± 0.007 0.036 ± 0.009 0.094 ± 0.013c 0.12 ± 0.025c 0.389 < 0.001 0.402 OA 0.034 ± 0.007 0.041 ± 0.009 0.097 ± 0.012c 0.12 ± 0.021c 0.430 < 0.001 0.590CID LF 2.08 ± 0.3 3.2 ± 0.3 3.19 ± 0.73 2.69 ± 0.35 0.537 0.479 0.044 HF 1.4 ± 0.2 2.0 ± 0.3 2.80 ± 0.45c 2.24 ± 0.17 0.999 0.005 0.034 OA 1.6 ± 0.2 2.4 ± 0.3 2.92 ± 0.53c 2.38 ± 0.17 0.792 0.027 0.026
aData are shown as mean ± SEM. OSAS refers to obstructive sleep apnea syndrome; see Appendix 2 for definition of abbreviations. bSignifi-cantly different from control subjects in the same condition. cSignificantly different from the same group in supine condition.
Daytime Autonomic Function in Pediatric OSA—Chaicharn et al

SLEEP, Vol. 32, No. 7, 2009 934
Figure 4—Percentage change in ABR, RCC, CID, and DER gains during cold face stimulation (CFS). Circles and error bars represent group mean ± SEM. CFS started at time 0. See Appendix 2 for definition of abbreviations.
Daytime Autonomic Function in Pediatric OSA—Chaicharn et al

SLEEP, Vol. 32, No. 7, 2009 935
ed model parameters for the subsets of the 2 groups, following adjustment for BMI, are shown in Table 4. As in the larger sample set, RCC gains were not different between the groups but decreased in both groups with postural change from supine to standing. ABR gain remained significantly lower in subjects with OSAS versus control subjects. DER gains increased with standing in both groups. As was found in the larger sample, CID gains increased with standing only in the control subjects but not in the subjects with OSAS. These findings suggest that the differences predicted by our model are relatively robust and not likely to be a consequence of the confounding influence of obesity.
Cold Face stimulation
Cold face stimulation led to a similar degree of transient bra-dycardia in both subjects with OSAS and control subjects, but the responses were much more variable in those with OSAS. Although CFS produced a robust increase in SBP in the control subjects, the corresponding blood pressure response in the sub-jects with OSAS was weaker and more variable. The ventilatory responses also appeared to be different between subject groups but varied considerably across subjects within each group.
By analyzing these responses within the framework of the time-varying minimal model, we found that RCC and ABR gains increased with CFS along time courses that were simi-lar between the subjects with OSAS and control subjects. In the model, BPV (∆SBP) is assumed to be related to respiration through the DER component, as well as to the fluctuations in the ratio between pulse pressure and heart period (∆SCO, see Figure 2). Thus, total peripheral resistance and arterial compli-ance are implicitly factored into the CID impulse response. We found the assumption of time invariance for the CID kernel to be a limiting factor, allowing the minimal model to account for less than 60% of the total variance in ∆SBP. We reasoned that, since total peripheral resistance is modulated by sympathetic drive, which is time varying, allowing the CID gain to be time varying would be 1 way of allowing the model to incorporate this feature. By allowing the CID gain to vary with time, we were able to substantially reduce the variance of the discrep-ancies between the measured blood pressure measurements and the model predictions to less than 25%. Low-frequency fluctuations were apparent in the estimated time-varying CID gains (Figure 4), consistent with observations of low-frequency fluctuations in sympathetic modulation of the peripheral vascu-lature. Autonomic reactivity, as represented by the changes in CID gain in response to CFS, is different between the groups. In control subjects, CID gain increased with CFS, whereas, in OSAS, CID gain remained unchanged or decreased slightly.
Our model-based analyses of the CFS responses suggest that, although vagal reactivity remains relatively intact in pe-diatric subjects with OSAS, cardiovascular sympathetic re-activity is impaired. O’Brien and Gozal36 concluded that the sympathetic branch of the autonomic nervous system is ab-normal in OSAS, but their results suggest that cardiovascular sympathetic reactivity is overexpressed in OSAS, whereas our findings suggest a blunting of sympathetic reactivity. A po-tential explanation for this discrepancy is that the autonomic challenges that were employed in our studies and O’Brien’s
unique to the present study but have been raised in other studies involving adult subjects.35 A key problem with spectral anal-ysis of HRV or BPV is that it only yields information about the output (ie, fluctuations in heart rate or blood pressure) of the underlying system and provides little insight into the re-flex mechanisms that may have contributed to the output. To circumvent this limitation, we analyzed our measurements us-ing a closed-loop minimal model of autonomic cardiovascular control. The model enabled the characterization of the dynamic interrelationships between various pairings of the key variables (respiration, RRI, SBP) in play, hence providing invaluable information about the underlying system that could not other-wise have been obtained through univariate analyses of HRV or BPV. The model-based approach also allowed us to dissociate the confounding effects of respiration from other sources that contribute to HRV and BPV.
Under baseline conditions, we found that baroreflex (ABR) gain was approximately half as large in subjects with OSAS versus control subjects but that there were no differences in the other minimal model parameters (Table 3). The RCC com-ponent of the model represents the transfer function between respiration and HRV. The similarity of RCC gain between the control subjects and those with OSAS is therefore compatible with our finding of the lack of any difference in baseline HFPRRI between the 2 subject groups. This may be due to the fact that there is a large reserve of parasympathetic tone in children that decrease with aging.36
Since the baroreflexes are known to be responsible for medi-ating a significant fraction of the low-frequency oscillations in HRV,8,9 the substantially reduced ABR gain that we have found in the subjects with OSAS is consistent with our earlier finding of decreased LFPRRI (and, thus, LHR) in these subjects. Blunted baroreflex sensitivity is found in patients with heart failure37 and in normal subjects during severe exercise,32 coincident with substantial reductions in LFPRRI.. Impaired baroreflex sensitiv-ity is also known to be associated with elevated sympathetic drive.37 Thus, the reduced ABR gain found in our subjects with OSAS is compatible with a high sympathetic tone in these in-dividuals.
Orthostatic stress led to a significant reduction in RCC gain in both groups, reflecting a decrease in vagal tone due to pos-tural change. ABR gain also decreased with orthostatic stress, but the change was not as pronounced in the OSAS group, since this gain was already low in the supine condition. DER gain in-creased from supine to standing in both subject groups, whereas CID gain increased with orthostatic stress in only the control subjects. These findings are consistent with a reduced sym-pathetic reactivity to postural change, along with an elevated baseline level of sympathetic tone in subjects with OSAS.
adjustment for Potential Bmi effects
We considered the possibility that the larger average BMI of the subjects with OSAS may exert a confounding influence on the results displayed in Table 3. To counter this potential prob-lem, we eliminated 3 subjects with OSAS who had the largest BMI, as well as 3 control subjects with the lowest BMI. This reduction of the outliers in each group helped to make the re-maining groups roughly matched in BMI. Values of the estimat-
Daytime Autonomic Function in Pediatric OSA—Chaicharn et al

SLEEP, Vol. 32, No. 7, 2009 936
disClosure statement
This was not an industry supported study. The authors have indicated no financial conflicts of interest.
reFerenCes
1. American Thoracic Society. Cardiorespiratory sleep studies in children: establishment of normative data and polysomno-graphic predictors of morbidity. Am J Respir Crit Care Med 1999;160:1381-1387.
2. Somers VK, Dyken ME, Clary MP, Abboud FM. Sympathetic neural mechanisms in obstructive sleep apnea. J Clin Invest 1995;96:1897-904.
3. Leung RST, Bradley TD. Sleep apnea and cardiovascular Dis-ease. Am J Respir Crit Care Med 2001;164:2147-65.
4. Caples SM, Gami AS, Somers VK. Obstructive sleep apnea. Ann Intern Med 2005;142:187-97.
5. Carroll JL, Loughlin GM. Obstructive sleep apnea syndrome in infants and children: clinical features and pathphysiology. In: Fer-ber R, Kryger M, eds. Principles and Practice of Sleep Medicine. Philadelphia, PA: Saunders; 1995:163-191.
6. Marcus CL. Sleep-disordered breathing in children. Am J Respir Crit Care Med 2001;164:16-30.
7. Task Force of the European Society of Cardiology and the North American Society of Pacing and Electrophysiology. Heart rate variability: standards of measurement, physiological interpreta-tion and clinical use. Circulation 1996;93:1043-65.
8. Malliani A, Pagani M, Federico L, Cerutti S. Cardiovascular neural regulation explored in the frequency domain. Circulation 1991;84:482-92.
9. Malpas SC. Neural influences on cardiovascular variability: pos-sibilities and pitfalls. Am J Physiol 2002;282:H6-20.
10. Katona PG, Jih F. Respiratory sinus arrhythmia: noninvasive measure of parasympathetic cardiac control. J Appl Physiol 1975;39:801-6.
11. Berntson GG, Bigger JT, Jr, Eckberg DL, et al. Heart rate vari-ability: origins, methods, and interpretive caveats Psychophysiol-ogy 1997;34:623-48.
12. Brown TE, Beightol LA, Koh J, Eckberg DL. Important influence of respiration on human RR interval power spectra is largely ig-nored. J Appl Physiol 1993;75:2310-17.
13. Khoo M C, Kim T S, Berry R B. Spectral indices of cardiac auto-nomic function in obstructive sleep apnea. Sleep 1999;22:443-51.
14. Belozeroff V, Berry RB, Sassoon CSH and Khoo MCK. Effects of CPAP therapy on cardiovascular variability in obstructive sleep apnea: a closed loop analysis. Am J Physiol Heart Circ Physiol 2002;282:H110-21.
15. Belozeroff V, Berry RB, Khoo MCK. Model-based assessment of autonomic control in obstructive sleep apnea syndrome. Sleep 2003;1:65-73.
16. Jo JA, Blasi A, Valladares E, Juarez R, Baydur A and Khoo MCK. A nonlinear model of cardiac autonomic control in obstructive sleep apnea syndrome. Ann Biomed Eng 2007;35:1425-43.
17. Blasi A, Jo JA, Valladares E, Juarez R, Baydur A and Khoo MCK. Autonomic cardiovascular control following transient arousal from sleep:A time-varying closed-loop model. IEEE Trans Biomed Eng 2006;53:74-82.
18. Chaicharn J, Carrington M, Trinder J and Khoo MCK. The effects on cardiovascular autonomic control of repetitive arousal from sleep. Sleep 2008;31:93-103.
19. Finley JP, Bonet JF, Waxman MB. Autonomic pathways re-sponsible for bradycardia on facial immersion. J Appl Physiol 1979;47:1218-22.
were quite different: the latter group used a vital capacity sigh or the cold pressor test to elicit peripheral vasoconstriction, whereas, in our study, we used the CFS test, which elicits an increase in vagal activity along with an increase in sympa-thetic activity. However, our results on the effects of ortho-static stress on CID gain are consistent with our findings on the effects of CFS, in that both indicate a blunted sympathetic reactivity in the OSAS subjects.
Limitations of the Study
There are a number of limitations in this study. First, the sub-jects in our control group were not studied by polysomnogra-phy, and, thus, it is not possible to definitively rule out occult mild OSA in some individuals. However, we believe that the presence of OSA in the control subjects is unlikely, since they were selected only if the subject’s parents affirmed that their child did not snore at all; we screened out subjects who snored occasionally, as well as nonsnorers who had a cold or upper respiratory infection. In a study involving more than 900 chil-dren aged 8 to 11 years, Rosen at al39 found that snorers were 6.4 times more likely to have obstructive apnea of at least mild severity (AHI ≥ 1) as compared with nonsnorers. Moreover, if we were to assume that some of the control subjects did have mild OSAS, the fact that we found significant differences in autonomic control between the 2 groups implies that these dif-ferences would have remained in the same direction and would have been even larger had the subjects with hypothetical mild OSAS been properly screened out of the control group.
A second potential limitation is that subjects with different etiologies of OSAS may exhibit different levels of autonomic abnormalities. To minimize this possibility, we excluded from our subject pool individuals who had OSAS related to cranio-facial abnormality or a genetic syndrome. By including only those subjects with OSAS who had overt tonsillar hypertrophy and were otherwise healthy, a subset of whom were overweight, we believe we limited the potential etiologies to the 2 most common ones in childhood, which is representative of the clini-cal population.
Conclusion
In summary, we employed spectral analysis of HRV and BPV along with model-based analysis to compare baseline autonomic function and autonomic reactivity in subjects with OSAS with the corresponding results in normal control sub-jects. The model-based analysis produced results that are com-patible with the findings deduced from spectral analysis, and the former has proven to be useful in enabling us to better in-terpret our measurements of HRV and BPV. Our present find-ings suggest that parasympathetic activity remains relatively normal in pediatric OSAS, but both baseline cardiovascular sympathetic activity and reactivity to autonomic challenges are impaired.
aCKnowledgments
This work was supported by NIH Grants EB-001978, HL076375, and HL-090451.
Daytime Autonomic Function in Pediatric OSA—Chaicharn et al

SLEEP, Vol. 32, No. 7, 2009 937
31. van de Borne P, Montana N, Pagani M, Oren R, Somers VK. Ab-sence of low-frequency variability of sympathetic nerve activity in severe heart failure. Circulation 1997;95:1449-54.
32. Casadei B, Cochrane S, Johnston J, Conway J, Sleight P. Pitfalls in the interpretation of spectral analysis of the heart rate variability during exercise in humans. Acta Physiol Scand 1995;153:125-31.
33. Malik M, Camm AJ. Components of heart rate variability—what they really mean and what we really measure. Am J Cardiol 1993;72:821-2.
34. Khoo MCK, Belozeroff V, Berry RB, Sassoon CSH. Cardiac au-tonomic control in obstructive sleep apnea: effects of long-term CPAP therapy. Am J Respir Crit Care Med 2001;164:807-12.
35. Sleight P, La Rovere MT, Mortara A, et al. Physiology and pathophysiology of heart rate and blood pressure variability in humans: is power spectral analysis largely an index of baroreflex gain? Clin Sci 1995;88:103-9.
36. Ingall TJ, McLeod JG, O’Brien PC. The effect of ageing on auto-nomic nervous system function. Aust N Z J Med 1990;20:570-7.
37. Francis DP, Coats AJS, Ponikowski P. Chemoreflex-baroreflex interactions in cardiovascular disease. In: Bradley TD, Floras JS, eds. Sleep Apnea: Implications in Cardiovascular and Cerebro-vascular Disease. New York, NY: Marcel Dekker; 2000:33-60.
38. O’Brien LM, Gozal D. Autonomic dysfunction in children with sleep-disordered breathing. Sleep 2005;28:747-52.
39. Rosen CL, Larkin EK, Kirchner HL, et al. Prevalence and risk fac-tors for sleep-disordered breathing in 8- to 11-year old children: association with race and prematurity. J Pediatr 2003;142:383-9.
20. Heistad DD, Abboud FM, Eckatein JW. Vasoconstrictor response to simulated diving in man. J Appl Physiol 1968;25:542-9.
21. Berger RD, Akselrod S, Gordon D, Cohen RJ. An efficient algo-rithm for spectrum analysis of heart rate variability. IEEE Trans Biomed Eng 1986;33:900-4.
22. Yang CCH, Kuo TBJ. Assessment of cardiac sympathetic regula-tion by respiratory-related arterial pressure variability in the rat. J Physiol (Lond) 1999;515.3:887-96.
23. Asyali MH, Juusola M. Use of Meixner functions in estimation of Volterra Kernels of nonlinear systems with delay. IEEE Trans Biomed Eng 2005;52:229-37.
24. Rissanen J. Estimation of structure by minimum description length. Circ Sys Sig Proc 1982;1:395-406.
25. Enright PL, Goodwin JL, Sherrill DL, Quan JR, Quan SF. Blood pressure elevation associated with sleep-related breathing disor-der in a community sample of white and Hispanic children: the Tucson Children’s Assessment of Sleep Apnea Study. Arch Pe-diatr Adolesc Med 2003;157:901-4.
26. Kohyama J, Ohinata JS, Hasegawa T. Blood pressure in sleep dis-ordered breathing. Arch Dis Child 2003;88:139142.
27. Marcus CL, Greene MG, Carroll JL. Blood pressure in chil-dren with obstructive sleep apnea. Am J Respir Crit Care Med 1998;157:1098-103.
28. Amin RS, Carroll JL, Jeffries JL, et al. Twenty-four-hour ambula-tory blood pressure in children with sleep-disordered breathing. Am J Respir Crit Care Med 2004;169:950-6.
29. Aljadeff G, Gozal D, Schechtman VL, et al. Heart rate variability in children with obstructive sleep apnea. Sleep 1997;20:151-7.
30. Baharav A, Kotagal S, Rubin BK, Pratt J, Akselrod S. Autonomic cardiovascular control in children with obstructive sleep apnea. Clin Auton Res 1999;9:345-51.
)1()(0 αα −= ttL (A3a)
and
)1()()1()( 11 −−+−= −− tLtLtLtL jjjj αα , 0 ≤ j ≤ qABR , qRSA (A3b)
qABR and qRSA represent the total number of Laguerre func-tions used in the expansion of the ABR and RCC impulse responses, respectively. In Equations (A3a) and (A3b), the pa-rameter α (0 < α < 1) determines the rate of exponential decline of the Laguerre functions, and is selected such that, for given M, qABR and qRSA, the values of the constructed impulse response become insignificant as t approaches M. The orthogonal matrix that transforms the LBF to the MBF can be expressed as
A(n) =X(n)Y(n) (A4)
where n=0,1,2,…, and Y is an upper band matrix given as follows:
Y=
QQ×⎥⎥⎥⎥⎥⎥
⎦
⎤
⎢⎢⎢⎢⎢⎢
⎣
⎡
1...000
0...1000...100...01
MOMMM
αα
(A5)
and X(n) is an inversion of the Cholesky factorization of Y(n)
{Y(n)}T.
aPPendiX 1
Estimation of the Model Impulse Responses
The stationary version of the model was used to analyze the data collected from the supine and standing conditions. To cap-ture the dynamics of the changes occurring during the cold face stress test, this model was modified to allow the model param-eter to be time varying.
To reduce the number of parameters to be estimated, each of the unknown impulse responses in Equation (2) was expanded as the sum of several weighted Meixner basis functions (MBF):23
∑−
==
1
0
)( )()(ABRq
j
nj
ABRjABR tBcth (A1)
∑-
==
1
0
)( )()(RSAq
j
nj
RCCjRCC tBcth (A2)
where the Bj(n)(t) represents the j-th order discrete-time or-
thonormal Meixner function with n-th order of generalization, which determines how late the MBF will start to fluctuate, and cj
ABR and cjRCC are the corresponding unknown weights that are
assigned to Bj(n)(t) in the ABR and RCC impulse responses, re-
spectively. MBF are a generalization of the discrete Laguerre basis functions (LBF). First, the LBF were generated. Then, the LBF were transformed to MBF.23 The j-th order LBF is defined as follows over the interval 0 ≤ t ≤ M-1:
Daytime Autonomic Function in Pediatric OSA—Chaicharn et al

SLEEP, Vol. 32, No. 7, 2009 938
aPPendiX 2
table of abbreviations
Symbol/Abbreviation ExplanationABR Baroreflex component of the modelAHI Apnea-hypopnea index BMI Body mass indexBP Blood pressure (arterial)CFS Cold face testCID Circulatory dynamics component
of the modelDBP Diastolic blood pressureDER Direct effects of respiration
component of the model∆RRI(t) Fluctuation in RRI about the mean
level at time t ∆SBP(t) Fluctuation in SBP about the mean
level at time t∆SCO(t) Surrogate cardiac output (ratio of
SBP(t)- DBP(t) to RRI(t))∆V(t) Change in incremental lung volume
about the mean at time thABR(t) Impulse response function of the
ABR componenthRCC(t) Impulse response function of the
RSA componenthCID(t) Impulse response function of the
CID componenthDER(t) Impulse response function of the
DER componentHFPRRI High-frequency power of RRI
variabilityLFPRRI Low-frequency power of RRI
variabilityLFPSBP Low-frequency power of systolic
blood pressure variabilityLHR Ratio of low-frequency power
to high-frequency power of RRI variability
MDL Minimum description lengthRLS Recursive least squaresRRI R-R intervalRCC Respiratory-cardac coupling
component of modelSBP Systolic blood pressureτABR Latency associated with the
baroreflex component of the modelτRCC Latency associated with the RCC
component of the modelτCID Latency associated with the CID
component of the model
Substituting Equations (A1) and (A2) into Equation (2), we obtain, after some algebraic manipulation:
� � � � � �� �−
=
−
=
++=1
0
1
0)(
RSA ABRq
j
q
jRRIj
ABRjj
RCCj ttvctuctRRI εΔ (A6)
where uj(t) and vj(t) are new derived variables, defined as fol-lows:
∑−
=
−−=1
0
)( )()()(M
iRCC
njj itViBtu τΔ (A7)
∑−
=
−−=1
0
)( )()()(M
iABR
njj itSBPiBtv τΔ (A8)
Equation(A6) becomes the new linear relation with unknown parameters cj
RCC (0 ≤ j ≤ qRCC) and cjABR (0 ≤ j ≤ qABR) that can be
estimated using least-squares minimization. However, note that Equation (A6) contains far fewer unknown parameters ( qRCC + qABR < < 2M) than Equation (2).
First, the least-squares minimization procedure described above was repeated for a range of values for the delays (τABR and τRCC), the order of generalization (n from 0 to 5), and Meixner function orders (qABR and qRCC from 4 to 8). For each combina-tion of delays, the order of generalization, and Meixner function orders, a metric of the quality of fit, known as the “minimum description length” (MDL), was computed (22). MDL was com-puted as follows:
( )M
MparametersofnumbertotalJMDL R)log(
log×
+= (A9)
where JR is the variance of the residual errors between the measured data and the predicted output. Note that MDL de-creases as JR decreases but increases with increasing model or-der. Selection of the “optimal” candidate model was based on a global search for the minimum MDL; in addition, this “opti-mal” solution had to satisfy the condition that the cross-correla-tions between the residual errors and past values of the 2 inputs (∆V(t) and ∆SBP(t)) were statistically indistinguishable from zero. Once the optimal parameter values were determined, the ABR and RSA impulse responses were computed using Equa-tions (A1) and (A2).
Finally, the recursive least squares (RLS) algorithm was used to estimate the autoregressive model coefficients at each time step. Basically, by using the RLS algorithm, the model coefficients were estimated by minimizing the residual, sum of squared error between the model prediction and the data. To make the results less sensitive to the remote past, the squared error between the model prediction and the data (e) was weight-ed as follows
( )iteJt
i
iW −= ∑
−
=
1
0
2λ (A10)
where λ is a forgetting factor and 0 < λ < 1. The optimum λ allows an RLS algorithm that has the fastest convergence and the most robustness.
The RLS algorithm was applied to each data set multiples time for λ from 0.88 to 0.98. The λ that minimized the mean square error between the model prediction and the data was se-lected.
Daytime Autonomic Function in Pediatric OSA—Chaicharn et al