Embed Size (px)
Citation preview

Rockefeller Center at Dartmouth College Policy Research Shop A Center for Public Policy and the Social Sciences
Career and Technical Education Participation in Vermont
A Policy Analysis of the Factors Affecting CTE Participation Rates
PRS Policy Brief 0506-03 February 23, 2006
Prepared for Testimony by: Adam Goldfarb, Oyebola Olabisi, and Stephanie Lawrence
Contact: Nelson A. Rockefeller Center, 6082 Rockefeller Hall, Dartmouth College, Hanover, NH 03755
http://policyresearch.dartmouth.edu • Email: [email protected]

1
Introduction1 Vermont’s Career and Technical Education (CTE) program works with high schools to provide students with technical education programs for at least one of their last two secondary years, with the goal of satisfying Vermont’s job placement and business demands. CTE offers 64 career and technical education programs in 15 regional technical centers and six comprehensive high schools2 in subjects like automotive technology, construction, video production, and cosmetology. Technical education centers accept applications from students in their junior and senior years; once accepted into a program, students spend an average of four hours a day per semester in classes for their career cluster of choice. Each technical center serves a specific set of high schools in a defined geographical area called a “service region.” Within each service region, sending schools pay for the students’ transportation costs and tuition to the technical center. Students also have the option of attending a technical center outside of their home service region, but they must provide their own transportation. According to our 2003-2004 data, participation in the regional technical education programs totaled 1,877 students, or 12.6 percent of the total eligible student population.3 Technical education is an aid to the economic development of Vermont: information from the Vermont Department of Education reveals that a wide range of public and private employers hires graduates of the CTE programs. Some of these organizations are the State Highway Department, Cody Chevrolet, J.C. Penney, Vermont Nurses Association Adult Daycare Centers, IBM, and Dubois & King Engineers.4 Therefore, CTE programs are viewed as a valuable resource for both employers and job seekers who want to learn skills applicable to immediate job placements. Our research addresses Vermont’s legal obligation “to oversee technical education, to ensure that it is coordinated with academic education, to make it accessible to adult and high school students, and to coordinate it with workforce development efforts”5 under the federally mandated Carl D. Perkins Vocational and Technical Education Act (Public Law 105-332). Specifically, our research addresses the extent to which Vermont’s regional technical centers are accessible to high school students across the state. We define accessibility in terms of a sending school’s distance from a technical center and the number of programs offered by the technical center to the schools in its service region. We then measure the effects on student participation of the potential barriers to 1 This report was written by undergraduate students at Dartmouth College under the direction of professors in the Rockefeller Center. In addition to the students listed on the title page, Tracey Fung and Moira Sullivan contributed to the report. We are also thankful for the services received from the Student Center for Research, Writing, and Information Technology (RWiT) at Dartmouth College. 2 State of Vermont, Department of Education. October 14, 2004. Available: http://www.state.vt.us/educ/new/html/pgm_teched/programs/location.html. Last accessed: February 3, 2006 3 Calculated from data provided by the 2004-2005 Vermont School Report. 4 Center for Technology, Essex. 2004. Available: http://www.go-cte.org/educational/engineering.php. Last accessed: February 3, 2006; Center for Technology, Essex. 2004. Available: http://www.go-cte.org/educational/human_services.php. Last accessed: February 3, 2006; The Barre Technical Center. Available: http://www.vita-learn.org/brvc/programs/programframe_a.html. Last accessed: February 3, 2006. 5 State of Vermont, Department of Education. January 30, 2006. Available: http://www.state.vt.us/educ/new/html/pgm_teched.html. Last accessed: February 9, 2006

2
accessibility created by distance and program offerings. Finally, we offer policy options that may improve statewide access to technical education based on our findings. Data and Results6 We analyze technical education participation rates for 11th and 12th grade populations from four consecutive academic years, beginning in 2001-2002 and ending in 2004-2005, in 62 schools across Vermont to determine the impact of distance and the variety of career programs offered on participation patterns in technical education programs. Student enrollment statistics for each sending high school were obtained from the Common Core of Data provided by the National Center for Education Statistics.7 Vermont has 18 service regions with at least one technical education center or one comprehensive high school (or both) located in each region. The total number of eligible students assigned to each service region varies widely. In 2004, the smallest region (Canaan) had only 60 eligible students, while the largest region (Essex) had 2,716 eligible students. The mean number of eligible students per region was 842 students. We obtained technical education participation rates and information on the career clusters and programs offered at each regional technical center from the Vermont Board of Education website.8 The average technical center offers eight career clusters and 15 programs. Career clusters serve as a measure of the variety of occupational fields to which students are exposed; whereas the program offerings reflect the comprehensiveness of the curriculum within a career field. To control for various characteristics of schools, we collected data on standardized test performance and town income levels from the 2005 Center for Rural Studies School Report, published by the Vermont Department of Education. In addition, we gathered data on the tuition paid to each regional technical center via personal correspondence with officials at the Vermont Board of Education.9 Lastly, we calculated commute time using the driving distance between each sending school’s zip code and that of its Service Region's Regional Technical Center on the website—www.Mapquest.com. The results from our empirical analysis indicate that three factors—commute time, available curriculum options, and student academic performance (a reflection of socio-economic status)—are all significantly correlated with the rate at which students participate in technical education programs. The percentage of eligible students in a school who participate in technical education programs increases with the number of career clusters; whereas it decreases with the distance of the sending school and the percentage of students that passed standardized English tests. The tuition charged by regional technical centers does not appear to have a significant effect on participation rates.
6 A detailed explanation of our statistical analysis can be found in the statistical appendix at the end of this report. 7 Common Core of Data's National Center for Education Statistics, <http://nces.ed.gov/ccd/bat/> 8<http://www.state.vt.us/educ/new/html/pgm_teched/programs/location.html> 9 James, Brad. “RE: Technical Education Tuition.” E-mail to Adam Goldfarb. January 3, 2006.
3
Distance Our results indicate that longer commute times have a significant negative effect on technical education participation rates. For a typical school,10 every additional two and a half minutes of commute time is associated with one fewer student participating in technical education. Put differently, our results suggest that if the mean school’s driving time were reduced to zero (i.e., if the school were converted into a technical education center), participation would increase by seven students, or 25.7 percent. This finding is consistent with the notion that the prospect of a long commute may discourage students from pursuing technical education. Although sending schools are obligated to provide transportation to the assigned technical center,11 it appears that the added time inconvenience of commuting plays an important role in student participation in a technical education program. Career Clusters The breadth and depth of the curriculum at technical centers may also affect participation rates. For the average service region,12 an additional cluster is associated with an increase in participation of eight to nine students. If every technical center in Vermont offered the 16 nationally approved career clusters, assuming that all clusters were equally desired, our analysis estimates a 58 percent increase in technical education participation across the state. This finding is consistent with a hypothesis that students will be more likely to participate in a technical education program if the program offerings match their specific interests. In terms of accessibility, such a relationship should give rise to the concern that students served by centers with fewer program offerings are less able to access their program of choice. Currently, students have the option to attend a different technical center if the program they desire is not offered in their assigned center. While the sending schools are obliged to pay tuition for these students, they are not required to provide transportation. The added burden of independently commuting to a center that is typically further away than their assigned center may also limit students’ access to the technical education program of their choice. Academic Performance There is an inverse relationship between the percentage of students in a school who pass the standardized 10th grade English tests and participation rates in technical programs--technical education participation rates increase as scores on standardized tests decrease. The typical sending school will have two fewer students participate in a technical education program for every five percentage point increase in the number of students
10 The mean school in our sample has 230 eligible students, a mean participation rate of 12.4 percent, and is 17.6 minutes away from the closest technical center. 11 Vermont State Board of Education, State Board of Education Manual of Rules and Practices. Section 2370: Vocational-Technical Education, p. 14 12 The average service region has 842 eligible students and offers eight career clusters.

4
who pass the 10th grade English tests.13 This finding suggests that students from schools with lower academic performance are more likely to be interested in technical education programs, and that policymakers may want to take their interests into account when making decisions concerning these programs.14 Tuition Our analysis indicates that technical education tuition is not significantly correlated with participation rates. This result suggests that the direct costs that schools bear for each student participating in technical education do not affect participation rates. Policy Implications As outlined above, our study finds three primary factors to be significantly correlated with CTE participation rates throughout Vermont. These include: • Distance to the Regional Career and Technical Education Center, • Career Cluster offerings at the CTE centers, and • Academic performance. As our results are based on school-level data, they reflect trends across all public high schools in the technical education system and have significant implications for Vermont technical education policy. Outlined below are five policy options for the technical education in Vermont. We discuss each policy option in the context of our findings, examining the ways in which each option might affect CTE participation rates and accessibility to students.
1. Consolidating regional technical education centers across the state: Our analysis indicates that consolidating the CTE centers within the state would likely have two countervailing effects on participation. First, consolidation would have a negative effect on participation by increasing the average distance from sending schools to technical education centers. On the other hand, consolidation would likely have a positive effect on CTE participation if the number of programs offered in each center were to be increased from the levels found in area technical centers prior to consolidation. Thus consolidation, resulting in fewer CTE centers within the state, would serve to decrease student participation through increased commute times. Therefore, consolidation alone, without increased program offerings, would have a negative effect on participation, but this would be offset by additional program offerings.
The effects of consolidation on participation may also be further influenced by the location of the consolidated centers and their proximity to communities of low socio-economic status. If the consolidated centers were to be located in more urban areas with higher socio-economic status, for example, then such
13 The average pass rate for the English tests over the sample period was 52.9 with a standard deviation of 9.7. 14 We also found that participation rate is negatively correlated with the average incomes of towns in the sample. This result indicates that students from lower socioeconomic schools are more likely to participate in technical education programs. However, this effect is not significant when controlling for English and math test scores.

5
consolidation could have the effect of decreasing participation rates, as participation and socioeconomic status are inversely correlated.15
2. Increasing program offerings within currently functioning CTE centers:
Increasing the number of programs offered within currently functioning technical education centers would likely increase CTE participation, as program offering and participation are positively correlated. Assuming that the selection of additional programs is based on student interests, increased program offerings would mean that more students would be able to access the program of their choice. However, the addition of new programs at current CTE centers would incur a cost to the state. While the basic infrastructure necessary for the implementation of these additional programs would likely be in place as would be the curricular elements available from existing technical centers with broader program offerings, new teachers would have to be hired to staff each additional program. Moreover, the demand for more CTE program clusters may simply not exist in some of the larger technical centers. To ensure maximum benefits from adding new clusters, the prospective new clusters would ideally correspond to an area’s economic and job placement needs, and to the interests of its students.
3. Increasing the number of regional technical education centers throughout the
state: Beyond increasing the program offerings in existing technical centers, increasing the number of technical education centers in the state would likely increase student participation. This increased participation would be due to decreased distance from sending schools to each regional technical center, as our study finds distance and participation are negatively correlated. However, the costs and potential benefits incurred by the state in increasing the number of regional technical centers must be considered in evaluating such a proposal.
As with consolidation, the effect on participation of increasing the number of technical education centers would be influenced by the location of the centers. Expanding the number of centers in more rural, lower-income areas would likely increase CTE participation by making the programs more accessible to low-income students. As our findings demonstrate, students from low-income areas are more likely to participate in CTE programs. However, rural areas have a smaller pool of potential technical education participants and are, by definition, farther from more densely populated areas, potentially magnifying the negative effect of distance on a rural technical center’s accessibility.
4. Increasing program offerings through innovative use of web-based teaching tools:
One possible lower-cost alternative would be to implement the use of web-based teaching tools within existing schools. When possible, the use of digital technologies could be used to expand program offerings as well as to limit distance traveled without requiring a significant investment in infrastructure. Web-based tools could provide students with a wider variety of curricular options
15 Further analysis would be required to test the effects of such proposals.

6
and could also make technical education available to those without the means of transportation to technical centers outside of their regions. For example, the engineering and architectural applications of computer-aided design (CAD) and website design are two possible programs for consideration. Although web-based programs may not replace the expertise of a well-trained instructor, they may reduce the cost and time associated with transportation to and from the technical centers by allowing students to remain in their home high schools to receive this training.
Suggestions for Further Research The Intersection of Distance and Cluster Offerings Students have the option of attending a different technical center if the program they desire is not offered in their service region. Although the sending schools are obliged to pay tuition for these students, they are not required to provide transportation. The technical education participation data do not specify whether these students attend their own technical center or that of another service region; therefore, our findings cannot take this option into consideration. The possibility exists, for example, that students opt to forego free transportation to their technical center if the commute time to a different regional center is less daunting, especially as our research shows that the distance from a technical center plays a significant role in participation.16 Further research is necessary to determine whether career clusters or distance more significantly affect participation rates for those students faced with the two options. The Implications of Socioeconomic Status Our results indicate that the socioeconomic status of a sending school has an effect on the technical education participation rates—less wealthy schools with lower standardized test scores tend to have higher technical education participation rates on average than their wealthier, higher-scoring counterparts. Therefore, a barrier to accessibility may exist for those students of higher socioeconomic status, taking the form of a social stigma that may be associated with technical education. This problem is difficult to address with legislation and, indeed, may be beyond the scope of public policy; nonetheless, it does merit closer study. Further research is necessary to determine the effects of socialization on technical education participation, as well as to assess whether policy, such as the placement of regional technical centers, should be designed to help the state serve the primary users of its technical education programs. Conclusion Our research indicates that distance to the CTE center, the availability of program offerings, and academic performance are all correlated with student participation in technical education programs. Distance and school performance are both negatively
16 Vermont Department of Education, Career & Technical Education. "Programs & Services: Career & Technical Education: 2003-2004 Career & Technical Education Programs by Technical Center Location." Vermont Department of Education. October 14, 2004. Available: http://www.state.vt.us/educ/new/html/pgm_teched/programs/location.html Last accessed: February 20, 2006.

7
correlated with student participation, while program offerings are positively correlated with participation. The issue of accessibility is important, not only because it is mandated at the state and national level, but also because technical education programs provide a service to Vermont’s students and employers. Through an improved understanding of the variables affecting CTE participation in the state we hope to provide insight as to what policy options might be effective in improving accessibility for students throughout Vermont. Disclaimer: All material presented in this report represents the work of the individuals in the Policy Research Shop and does not represent the official views or policies of Dartmouth College.

8
STATISTICAL APPENDIX Appendix A Data and Methods We analyze technical education participation rates for 11th and 12th grade populations from four consecutive academic years, beginning in 2001-2002 and ending in 2004-2005, in 62 schools across Vermont to determine the impact of distance and the variety of career programs offered on participation patterns in technical education programs. Student enrollment statistics for each sending high school were obtained from the Common Core of Data provided by the National Center for Education Statistics.17 Vermont has 18 service regions with at least one technical education center or one comprehensive high school (or both) located in each region. The total number of eligible students assigned to each service region varies widely. In 2004, the smallest region (Canaan) had only 60 eligible students, while the largest region (Essex) had 2,716 eligible students. The mean number of eligible students per region was 842 students. We obtained technical education participation rates and information on the career clusters and programs offered at each regional technical center from the Vermont Board of Education website.18 The average technical center offers eight career clusters and 15 programs. Career clusters serve as a measure of the variety of occupational fields to which students are exposed; whereas the program offerings reflect the comprehensiveness of the curriculum within a career field. To control for various characteristics of schools, we collected data on standardized test performance and town income levels from the 2005 Center for Rural Studies School Report, published by the Vermont Department of Education. We created the variables Avm10 and Ave10 to report the average pass rate of 10th grade students in the three Math and four English standardized tests, respectively.19 Given a consistent level of performance within schools over the years in our sample, we replaced missing values on test performance for 2001 with values from 2002. Similarly, we replaced missing town income values for 2004 with values from 2003. In addition, we gathered statistics on the tuition paid to each regional technical center via personal correspondence with officials at the Vermont Board of Education.20 The test performance results are highly collinear with each other as well as with the measure of income.21 Due to this collinearity, we use test performance as a proxy for the average socioeconomic status and aptitude of students in a school.
17 Common Core of Data's National Center for Education Statistics, <http://nces.ed.gov/ccd/bat/> 18<http://www.state.vt.us/educ/new/html/pgm_teched/programs/location.html> 19 Math tests are New Standards Mathematical Concepts, New Standards Mathematical Skills, New Standards Mathematical Problem Solving; English tests are New Standards Reading: Basic Understanding, New Standards Reading: Analysis & Interpretation, New Standards Writing Effectiveness, New Standards Writing Conventions. 20 James, Brad. “RE: Technical Education Tuition.” E-mail to Adam Goldfarb. 3 Jan 2006. 21 Correlation between English and Math performance = 0.6456; between English performance and Income = 0.7113.

9
Finally, we calculated commute time using the driving distance between each sending school’s zip code and that of its Service Region's Regional Technical Center on the website—www.Mapquest.com; in cases where two technical centers comprise a sending school's service region (as in the Chittenden County and St. Johnsbury Service Regions), the farther of two service centers was used to calculate driving time and distance. Tables 1 and 2 provide summary statistics for the variables used in this analysis. For the primary portion of the analysis, we estimate the following linear regression model: teched = βo + β1drvtime + β2clustoff +β3progoff +β4techtui+ β5avgagi + β6avm10+ β7ave10 + α + ε where teched is the percentage of eligible students in a school who participate in a technical program in given school year. Drvtime is the driving time in minutes from each school to its designated technical education center. Clustoff and progoff are the number of career clusters and programs offered at each regional technical center. Techtui is the tuition each center is allowed to charge sending schools.22 Avgagi is the adjusted gross income per exemption for the town in which the sending school is located.23 Avm10 and Ave10 report the average pass rate of 10th grade students in the three Math and four English standardized tests respectively. Year fixed effects, α, are taken into account by including year dummy variables to absorb unobserved year specific characteristics that may be correlated with the error term, ε. To account for serial correlation and heteroskedasticity, the standard errors are clustered around each school. Finally, the results are weighted by the number of eligible students in each school to ensure a proportional influence of the average statistics obtained from each school. As a secondary analysis in this paper, we examine the variation in technical education participation rates in schools using a linear spline regression model with the following format: teched = β1time1 + β2time2 +β3clustoff +β4progoff +β5techtui+ β6avgagi + β7avm10 + β8ave10 + α + ε The primary difference between this model and the previous one is that drvtime is split into time1 and time2, which are defined as follows: time1= drvtime for drvtime≤drvtime* = drvtime* otherwise time2= (drvtime – drvtime*) for drvtime ≥drvtime* = 0 otherwise 22 We created a dummy variable miss_techtui for the 13 observations with missing tuition values to avoid any systematic bias in ther results. 23 Similarly, we created another dummy variable miss_avgagi for the 25 observations with missing income data.

10
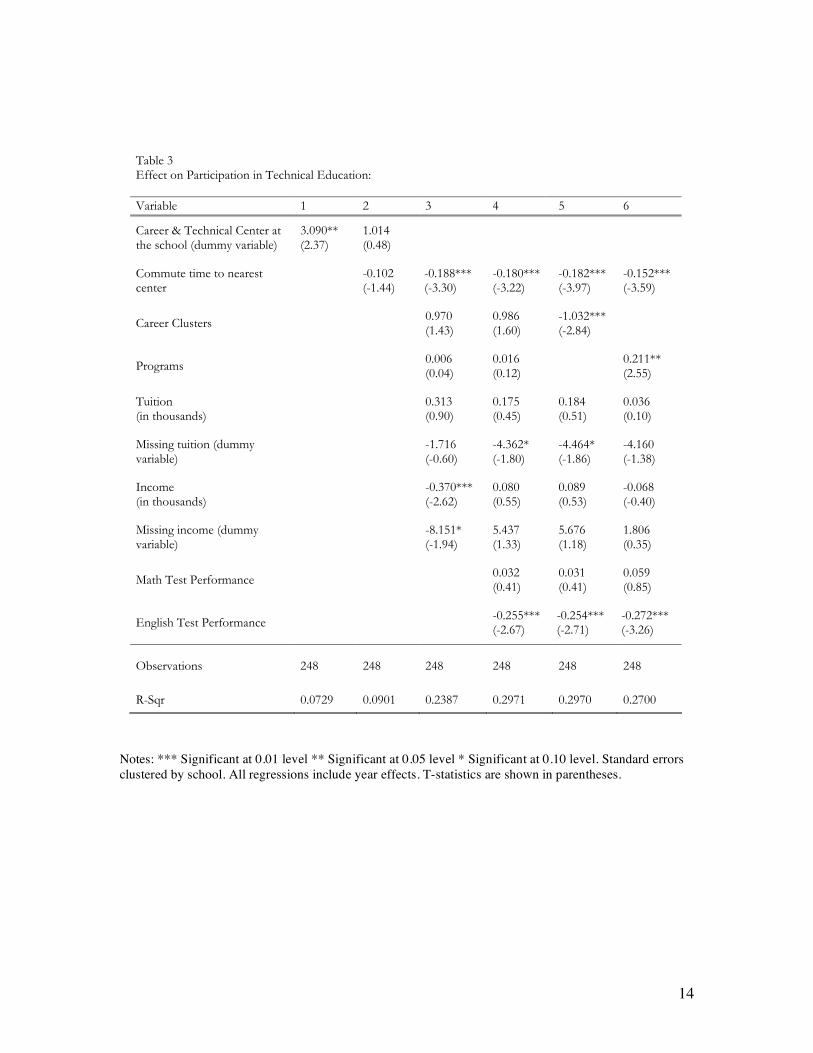
This model is based on the assumption that beyond a certain length of driving time the additional amount of time it takes a student to commute to the technical center will cease to have any significant marginal influence on a student’s likelihood to participate in technical education programs. For this analysis, the driving time (drvtime*) at which this drop-off occurs is 18 minutes. This value was derived by estimating the model with the best fit to the data. All other variables remain the same as in the initial model. Results Tables 3 and 4, respectively, show the results for our primary and secondary models, analyzing the effects of different school-specific and regional technical center-specific variables on the technical education participation rates. The results from the empirical analysis indicate that three factors—commute time, available curriculum options, and student academic performance (a reflection of socio-economic status)—all affect the rate at which students participate in technical education programs. The percentage of eligible students in a school participating in technical education programs increases with the number of career clusters; whereas it decreases with the distance of the sending school and the percentage of students that passed standardized English tests. The tuition charged by regional technical centers does not appear to have any significant effect on participation rates. Distance Specification 1 indicates that being a host school has a positive and significant effect on technical education participation rates compared to sending schools. However, this coefficient rapidly loses its significance as we start to control for other variables in Specification 2. The coefficient on driving time is empirically and statistically significant in Specifications 3-6. The result in Specification 4, our most comprehensive model with the best fit, indicates that one additional minute of commute time reduces participation rate by 0.18 percentage points. For a school with mean characteristics,24 every additional two and a half minutes of commute time is correlated with one less student involved in technical education. Put differently, our results suggest that if the mean school’s driving time were reduced to zero (i.e. if the school were converted into a technical education center), there would be an increase in participation of 7 students or 25.7 percent. In Specification 9, our alternate model, the spline regression, has a statistically significant coefficient of -0.30 on the time1 variable and a positive but statistically insignificant result for the time2 variable. These results indicate that beyond the first 18 minutes, additional driving time is not a significant factor considered by students. Comparing Specifications 4 and 9, the spline regression has a slightly better fit for the model and while it yields similar estimates on most variables of interest, it almost doubles the empirical significance of driving time for the first 18 minutes (when drvtime≤18) while remaining significant at the ninety-five percent confidence level. The spline results predict the loss of one student for an additional one and a half minutes of driving time. 24 The mean school in our sample has 230 eligible students, a mean participation rate of 12.4 percent, and is 17.6 minutes away from the closest technical center.

11
Additionally, the spline regression indicates a greater increase—of 43 percent participation rate—from converting the mean school into a technical center. This observed significant negative relationship between commute time and technical education participation rates is consistent with the assumption that students may be discouraged from pursuing technical education by the prospect of longer commutes. Although sending schools are charged with providing transportation for students enrolled in technical education at the center assigned to the school,25 it appears that the inconveniences incurred and the time potentially spent by students in commuting significantly affect the decision to participate in a technical education program. Alternatively, it could be that the further students are from a regional technical center, the less information they have regarding the opportunities for technical education that are available to them. Career Clusters The breadth and depth of the curriculum at technical centers also appears to affect participation rates. Neither Specification 4 nor 9 gives empirically significant results on career clusters or programs offered. Specifications 5 and 6, as well as 10 and 11, test for collinearity between cluster and program offerings that may be resulting in inefficient estimates. Including only one of these two measures of the variety of offerings at the technical center produces statistically significant results with each additional cluster in a center increasing the participation rate by 1.03 percentage points in Specification 5. As such, the models estimate that for the average service region of 842 eligible students, adding an extra career cluster would result in eight to nine additional technical education students. If every technical center in Vermont offered the 16 nationally approved career clusters, assuming that all clusters were equally desired, the model estimates an increase of 58 percent in technical education participation. This finding is consistent with a hypothesis that students will be more likely to enroll in a technical education program if the program offerings match their specific interests. Currently, students have the option of attending a different technical center if the program they desire is not offered in their assigned center. Although the sending schools are obliged to pay tuition for these students, they are not required to provide transportation. Although our data do not allow for us to test this notion, the added burden of independently commuting to a center that is typically further away than their assigned center may continue to limit their access to the technical education program of their choice. Academic Performance In Specification 3, the income level of the town in which the sending school is located is negative and statistically significant (-0.37), indicating that a $1,000 increase in a town’s average income, decreases participation by 0.37 percentage points. However, the inclusion of students’ performance on English and Math standardized tests in Specification 4 completely eliminates the statistical significance of income. The English 25 Vermont State Board of Education, State Board of Education Manual of Rules and Practices. Section 2370: Vocational-Technical Education, p. 14.

12
performance is significant and indicates a 0.25 percentage point decrease in the participation rate for every 1 percentage point increase in students passing the 10th grade English test. This result translates to a loss of two students for every five percent increase in the percentage of students who pass the 10th grade tests. Since academic performance is strongly correlated with income in this sample, these results suggest that students who come from lower socioeconomic schools are more likely to participate in technical education programs. This is likely due to the fact that more of these students are attracted to this opportunity to prepare themselves for employment immediately after high school. Tuition The consistent insignificance of technical education tuition in all specifications suggests that the direct costs that schools bear for each student enrolled in technical education are not likely an important factor in determining participation rates. In other words, there is no evidence that schools encourage or discourage students from participating in technical education programs based on tuition costs incurred by the school.

13
Appendix B Table 1 Summary Statistics
Variable Obs Mean Std. Dev. Min Max
teched 251 12.13147 6.391163 0.8 36.9
drvtime 273 17.68864 12.46385 0 45
time0 273 0.205128 0.404537 0 1
time1 273 12.59341 7.269969 0 18
time2 273 5.095238 6.869991 0 27
clustoff 273 8.765568 1.832104 2 12
progoff 273 16.80952 6.229111 2 30
techtui 260 2580.665 1933.698 -117.17 7201.03
ave10 256 52.89551 9.705621 25.75 77.75
avm10 256 48.00781 12.04993 11.33333 81
avgagi 248 19235.24 3211.403 13162 27971
eligible 264 229.6212 178.8558 0 789
Table 2 Split Summary Statistics with drvtime=0 and drvtime≠0 teched Avgagi eligible ave10 avm10 Obs 251 248 264 256 256 Total 12.13147 19235.24 229.6212 52.89551 48.00781 time0 = 0 11.29745 19298.38 185.0481 53.03856 48.90713 time0 = 1 15.10364 18997.25 395.1786 52.37273 44.72121 Difference in means t-stats
4.02*** -0.60 8.89*** -0.45 -2.30**
Note: *** Significant at 0.01 level ** Significant at 0.05 level * Significant at 0.10 level.
14
Table 3 Effect on Participation in Technical Education:
Variable 1 2 3 4 5 6
Career & Technical Center at the school (dummy variable)
3.090** (2.37)
1.014 (0.48)
Commute time to nearest center
-0.102 (-1.44)
-0.188*** (-3.30)
-0.180*** (-3.22)
-0.182*** (-3.97)
-0.152*** (-3.59)
Career Clusters 0.970 (1.43)
0.986 (1.60)
-1.032*** (-2.84)
Programs 0.006 (0.04)
0.016 (0.12)
0.211** (2.55)
Tuition (in thousands)
0.313 (0.90)
0.175 (0.45)
0.184 (0.51)
0.036 (0.10)
Missing tuition (dummy variable)
-1.716 (-0.60)
-4.362* (-1.80)
-4.464* (-1.86)
-4.160 (-1.38)
Income (in thousands)
-0.370*** (-2.62)
0.080 (0.55)
0.089 (0.53)
-0.068 (-0.40)
Missing income (dummy variable)
-8.151* (-1.94)
5.437 (1.33)
5.676 (1.18)
1.806 (0.35)
Math Test Performance 0.032 (0.41)
0.031 (0.41)
0.059 (0.85)
English Test Performance -0.255*** (-2.67)
-0.254*** (-2.71)
-0.272*** (-3.26)
Observations 248 248 248 248 248 248
R-Sqr 0.0729 0.0901 0.2387 0.2971 0.2970 0.2700 Notes: *** Significant at 0.01 level ** Significant at 0.05 level * Significant at 0.10 level. Standard errors clustered by school. All regressions include year effects. T-statistics are shown in parentheses.

15
Table 4 Effect on Participation in Technical Education (Spline Regressions):
Variable 7 8 9 10 11
Career & Technical Center at the school (dummy variable)
-1.724 (-0.61)
Commute time to nearest center ? 18
-0.325** (-2.02)
-0.351*** (-2.90)
-0.301** (-2.52)
-0.293*** (-2.94)
-0.247** (-2.20)
Commute time to nearest center >18
0.030 (0.26)
-0.021 (-0.19)
-0.057 (-0.55)
-0.060 (-0.57)
-0.052 (-0.46)
Career Clusters 1.072 (1.53)
1.056 (1.61)
0.981** (-2.49)
Programs -0.051 (-0.34)
0.016 (0.12)
0.188** (2.07)
Tuition (in thousands)
0.640* (1.71)
0.420 (1.07)
0.395 (1.17)
0.224 (0.70)
Missing tuition (dummy variable)
-0.797 (-0.30)
-3.533* (-1.61)
-3.410 (-1.48)
-3.486 (-1.23)
Income (in thousands)
-0.328** (-2.51)
0.079 (0.58)
0.066 (0.42)
-0.078 (-0.48)
Missing income (dummy variable)
-8.758** (-2.27)
4.039 (1.10)
3.726 (0.86)
0.478 (0.10)
Math Test Performance 0.034 (0.44)
0.034 (0.45)
0.062 (0.89)
English Test Performance -0.240** (-2.59)
-0.242*** (-2.74)
-0.261*** (-3.31)
Observations 248 248 248 248 248
R-Sqr 0.1054 0.2578 0.3073 0.3071 0.2767
Notes: *** Significant at 0.01 level ** Significant at 0.05 level * Significant at 0.10 level. Standard errors clustered by school. All regressions include year effects. T-statistics are shown in parentheses.