Embed Size (px)
Citation preview
8/7/2019 Carmel Homes Market Action Report Real Estate Sales for April 2011
http://slidepdf.com/reader/full/carmel-homes-market-action-report-real-estate-sales-for-april-2011 1/3
April 2011
Price Range: All | Properties: Single Family - Condo - TwnHm
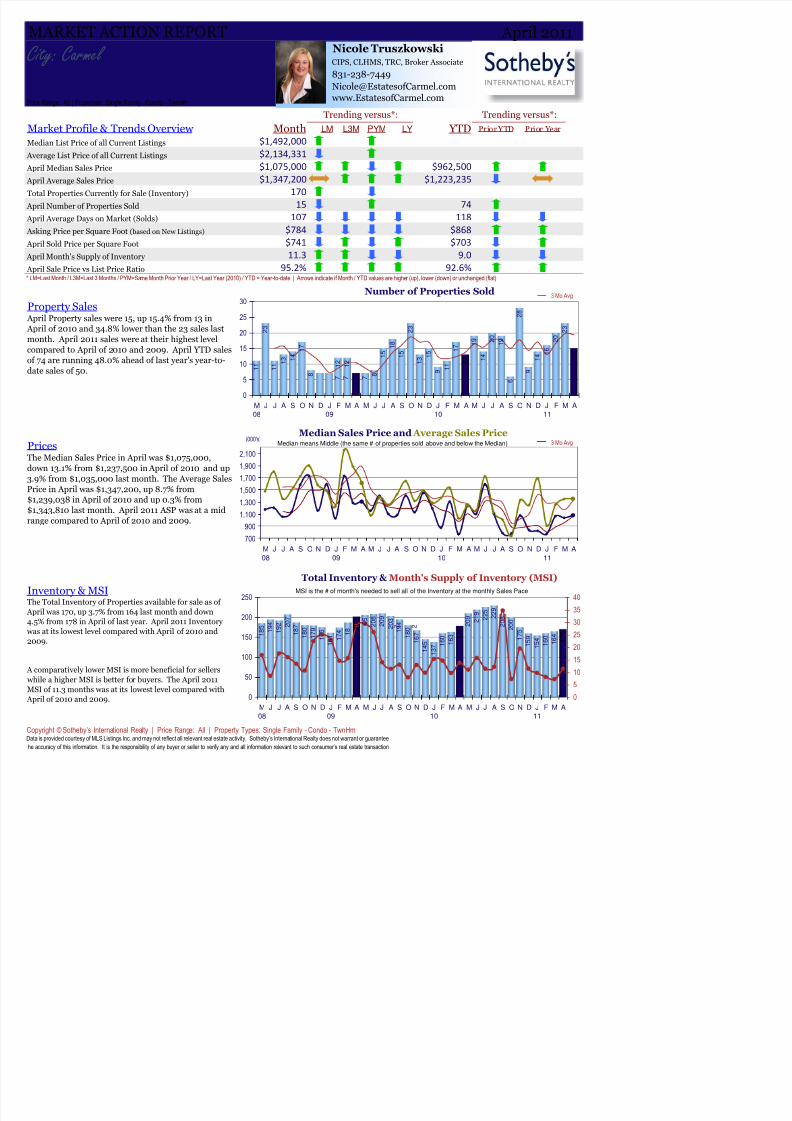
Market Profile & Trends Overview LM L3M PYM LY Prior YTD Prior Year
Median List Price of all Current Listings
Average List Price of all Current Listings
April Median Sales Price
April Average Sales Price
Total Properties Currently for Sale (Inventory)
April Number of Properties Sold
April Average Days on Market (Solds)
Asking Price per Square Foot (based on New Listings)
April Sold Price per Square Foot
April Month's Supply of Inventory
April Sale Price vs List Price Ratio
Property Sales
Prices
Inventory & MSIThe Total Inventory of Properties available for sale as of
il f l h d d
Trending versus*:
* LM=Last Month / L3M=Last 3 Months / PYM=Same Month Prior Year / LY=Last Year (2010) / YTD = Year-to-date | Arrows indicate if Month / YTD values are higher (up), lower (down) or unchanged (flat)
Number of Properties Sold
April Property sales were 15, up 15.4% from 13 in April of 2010 and 34.8% lower than the 23 sales last
month. April 2011 sales were at their highest level
compared to April of 2010 and 2009. April YTD sales
of 74 are running 48.0% ahead of last year's year-to-
date sales of 50.
$784
92.6%
$868
$703
9.0
$741
118
Total Inventory & Month's Supply of Inventory (MSI)
The Median Sales Price in April was $1,075,000,
down 13.1% from $1,237,500 in April of 2010 and up
3.9% from $1,035,000 last month. The Average Sales
Price in April was $1,347,200, up 8.7% from$1,239,038 in April of 2010 and up 0.3% from
$1,343,810 last month. April 2011 ASP was at a mid
range compared to April of 2010 and 2009.
$1,223,235
15
MARKET ACTION REPORT
107
95.2%
$1,492,000
$2,134,331
$1,075,000
$1,347,200
170
Trending versus*:
$962,500
City: Carmel
Median Sales Price and Average Sales Price
74
11.3
Month YTD
1 1
2 3
1 1
1 3 1
4
1 7
8 7 7
1 2
1 2
78
1 5
1 8
1 5
2 3
1 3
1 5
91
1
1 7
1 9
1 4
2 0
1 9
6
2 8
9
1 4
1 6
2 0
2 3
7
1 3
1 5
0
5
10
15
2025
30
M
08
J J A S O N D J
09
F M A M J J A S O N D J
10
F M A M J J A S O N D J
11
F M A
700
900
1,100
1,300
1,500
1,700
1,900
2,100
M
08
J J A S O N D J
09
F M A M J J A S O N D J
10
F M A M J J A S O N D J
11
F M A
Median means Middle (the same # of properties sold above and below the Median)
MSI is the # of month's needed to sell all of the Inventory at the monthly Sales Pace
9
250
35
40
(000's)
3 Mo Avg
3 Mo Avg
Nicole TruszkowskiCIPS, CLHMS, TRC, Broker Associate
831-238-7449
www.EstatesofCarmel.com

8/7/2019 Carmel Homes Market Action Report Real Estate Sales for April 2011
http://slidepdf.com/reader/full/carmel-homes-market-action-report-real-estate-sales-for-april-2011 2/3
April 2011
Price Range: All | Properties: Single Family - Condo - TwnHm
Market Time
Selling Price per Square Foot
Selling Price vs Original Listing Price
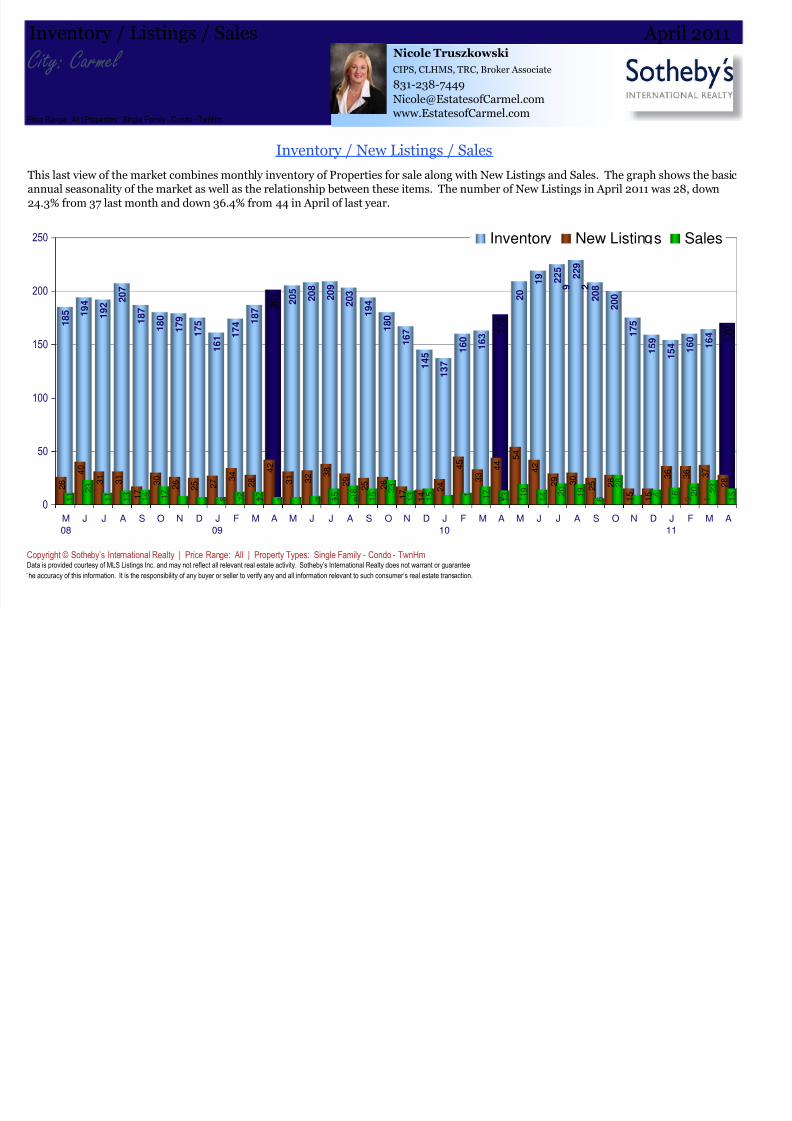
Inventory / New Listings / Sales
MARKET ACTION REPORT
Days On Market for Sold Properties
The Selling Price per Square Foot is a great indicator for
the direction of Property values. Since Median Sales
Price and Average Sales price can be impacted by the
'mix' of high or low end Properties in the market, the
selling price per square foot is a more normalized
indicator on the direction of Property values. The April
2011 Selling Price per Square Foot of $741 was down
5.8% from $786 last month and down 8.3% from 808 in
April of last year.
Selling Price per Square Foot
City: Carmel
Selling Price versus Listing Price Ratio
The average Days On Market (DOM) shows how many
days the average Property is on the market before it
sells. An upward trend in DOM tends to indicate a move
towards more of a Buyer's market, a downward trend a
move towards more of a Seller's market. The DOM for
April was 107, down 15.1% from 126 days last month and
down 27.7% from 148 days in April of last year. The
April 2011 DOM was at its lowest level compared with April of 2010 and 2009.
The Selling Price vs Original Listing Price reveals the
average amount that Sellers are agreeing to come down
from their original list price. The lower the ratio is
below 100% the more of a Buyer's market exists, a ratio
at or above 100% indicates more of a Seller's market.
The April 2011 Selling Price vs Original List Price of
95.2% was up from 95.0% last month and up from
92.9% in April of last year.
Inventory / New Listings / Sales
157148
107
50
70
90
110
130
150
170
190
M
08
J J A S O N D J
09
F M A M J J A S O N D J
10
F M A M J J A S O N D J
11
F M A
Average Days on Market (Listing to Contract) for properties sold during the month
843 808
741
500
600
700
800
900
1,000
1,100
M
08
J J A S O N D J
09
F M A M J J A S O N D J
10
F M A M J J A S O N D J
11
F M A
Average Selling Price per Square Foot for properties that sold during the month
94.6%
92.9%
95.2%
80%
82%84%
86%
88%
90%
92%
94%
96%
98%
100%
M
08
J J A S O N D J
09
F M A M J J A S O N D J
10
F M A M J J A S O N D J
11
F M A
Avg Selling Price divided by Avg Listing Price for sold properties during the month
250 Inventory New Listings Sales
3 Mo Avg
3 Mo Avg
3 Mo Avg
Nicole TruszkowskiCIPS, CLHMS, TRC, Broker Associate
831-238-7449
www.EstatesofCarmel.com
8/7/2019 Carmel Homes Market Action Report Real Estate Sales for April 2011
http://slidepdf.com/reader/full/carmel-homes-market-action-report-real-estate-sales-for-april-2011 3/3
April 2011
Price Range: All | Properties: Single Family - Condo - TwnHm
Inventory / Listings / Sales
Inventory / New Listings / Sales
This last view of the market combines monthly inventory of Properties for sale along with New Listings and Sales. The graph shows the basicannual seasonality of the market as well as the relationship between these items. The number of New Listings in April 2011 was 28, down
24.3% from 37 last month and down 36.4% from 44 in April of last year.
City: Carmel
he accuracy of this information. It is the responsibility of any buyer or seller to verify any and all information relevant to such consumer’s real estate transaction.
Copyright © Sotheby’s International Realty | Price Range: All | Property Types: Single Family - Condo - TwnHmData is provided courtesy of MLS Listings Inc. and may not reflect all relevant real estate activity. Sotheby’s International Realty does not warrant or guarantee
1 8
5 1 9 4
1 9 2
2 0 7
1
8 7
1 8 0
1 7 9
1 7 5
1 6 1
1 7 4 1
8 7
2 0 5
2 0 8
2 0 9
2 0 3
1 9 4
1 8 0
1 6 7
1 4 5
1 3 7
1 6 0
1 6 3
2 0 9 2
1 9
2 2 5
2 2 9
2 0 8
2 0 0
1 7 5
1 5 9
1 5 4
1 6 0
1 6 4
2 0 1
1 7 8
1 7 0
2 6
4 0
3 1
3 1
1 7
3 0
2 6
2 5
2 7
3 4
2 8
4 2
3 1
3 2 3
8
2 9
2 5
2 6
1 7
1 4
2 4
4 5
3 3
4 4
5 4
4 2
2 9
3 0
2 5 2
8
1 5
1 5
3 6
3 6
3 7
2 8
1 1
2 3
1 1
1 3
1 4
1 7
8 7 7 1 2
1 2
7 7 81 5 1
8
1 5
2 3
1 3
1 5
9 1 1
1 7
1 3 1
9
1 4 2
0
1 9
6
2 8
9 1 4
1 6 2
0 2 3
1 5
0
50
100
150
200
250
M
08
J J A S O N D J
09
F M A M J J A S O N D J
10
F M A M J J A S O N D J
11
F M A
Inventor New Listin s Sales
Nicole Truszkowski
CIPS, CLHMS, TRC, Broker Associate
831-238-7449
www.EstatesofCarmel.com