Embed Size (px)
DESCRIPTION
Annual Report of Carrefour 2013 The Carrefour g roup is the leading retailer in Europe andthe second-largest retailer in the world, employing nearly 365,000 people.With more than 10,100 stores in 34 countries, it generated revenuesof €100.2 billion under banners in 2013. As a multi-local, multi-format,and multi-channel retailer, Carrefour is a partner for daily life. Every day,it welcomes more than 10 million customers around the world, offeringthem a wide range of products and services at fair prices.
Citation preview

REGISTRATION DOCUMENT 2013 ANNUAL FINANCIAL REPORT

CONTENTS
1PRESENTATION OF THE GROUP 31.1 Consolidated key fi gures 4
1.2. Results and highlights of 2013 5
1.3 Activities and strategy 6
1.4 Tangible assets 12
1.5. Intellectual property 13
1.6. History 13
1.7 Organisational chart 15
2SOCIAL RESPONSIBILITY 172.1 Governance of CSR 18
2.2 Review of CSR approach in 2013 23
2.3 Assessment of performance and indicators 64
3CORPORATE GOVERNANCE 753.1 Corporate Governance Code 76
3.2 Composition and operation of the Board of Directors 76
3.3 Executive Management 90
3.4 Remuneration and benefi ts granted to corporate offi cers 91
3.5 Risk management 98
3.6 Internal control 106
3.7 Statutory Auditors’ report prepared in accordance with
Article L. 225-235 of the French Commercial Code
on the report of the Chairman of the Board of Directors 113
4MANAGEMENT’S DISCUSSION AND ANALYSIS YEAR ENDED DECEMBER 31, 2013 1154.1 Sales and earnings performance 116
4.2. Financial position 121
4.3 Outlook for 2014 124
4.4 Other information 125
4.5 Parent Company fi nancial review 128
5CONSOLIDATED FINANCIAL STATEMENTS YEAR ENDED DECEMBER 31, 2013 1335.1 Consolidated income statement 134
5.2 Consolidated statement of comprehensive income 135
5.3 Consolidated statement of fi nancial position 136
5.4 Consolidated statement of cash fl ows 138
5.5 Consolidated statement of changes in shareholders’
equity 139
5.6 Notes to the Consolidated Financial Statements 140
5.7 Statutory Auditors’ report on the Consolidated
Financial Statements 222
6COMPANY FINANCIAL STATEMENT YEAR ENDED DECEMBER 31, 2013 2256.1 Balance Sheet at December 31, 2013 226
6.2 Income Statement for the year ended December 31,
2013 227
6.3 Statement of cash fl ows for the year ended
December 31, 2013 228
6.4 Notes to the fi nancial statements 229
6.5 Statutory Auditors’ report on the annual fi nancial
statements 244
7INFORMATION ABOUT THE COMPANY AND THE CAPITAL 2477.1 Information about the Company 248
7.2 Information on the capital 251
7.3 Shareholders 255
7.4 Stock market information 258
8ANNUAL SHAREHOLDERS’ MEETING 2618.1 Agenda 262
8.2 Board of Directors’ report to the Ordinary and
Extraordinary Shareholders’ Meeting of April 15, 2014 262
8.3 Resolutions 265
8.4 Auditors’ special reports 269
9ADDITIONAL INFORMATION 2739.1 Publicly available documents 274
9.2 Person responsible for the Registration Document
and Annual Financial Report 274
9.3 Certifi cation by the person responsible for the
Registration Document and Annual Financial Report 274
9.4 Persons responsible for auditing the fi nancial
statements and fees 275
9.5 Information included by reference 277
9.6 CSR cross-reference tables 278
9.7 Registration Document concordance table 282
9.8 Annual Financial Report concordance table 285
9.9 Management report concordance table 286
2013 REGISTRATION DOCUMENT 1
This registration document has been filed with the Autorité des
Marchés Financiers (AMF) on 24 M arch 2014, in accordance with
article 212-13 of the General Regulations of the AMF. It may be used
to endorse a financial operation in conjunction with a prospectus
certified by the AMF. This document has been established by the
Issuer, and is binding on its signatories.
This is a free translation into English of the Registration Document
issued in French and it is provided solely for the convenience of
English speaking users.
ANNUAL FINANCIAL REPORT
REGISTRATION DOCUMENT
Being a retailer is about working for you every day.
The Carrefour g roup is the leading retailer in Europe and
the second-largest retailer in the world, employing nearly 365,000 people.
With more than 10,100 stores in 34 countries, it generated revenues
of €100.2 billion under banners in 2013. As a multi-local, multi-format,
and multi-channel retailer, Carrefour is a partner for daily life. Every day,
it welcomes more than 10 million customers around the world, offering
them a wide range of products and services at fair prices.
2013

2013 REGISTRATION DOCUMENT 2
€100.2 billionin revenue under banners
€2.2 billionin recurring operating income
364,795employees worldwide
KEY FIGURESAS OF DECEMBER 31, 2013
MAP OF LOCATIONS
34countries
10,105stores worldwide
STORES AS OF DECEMBER 31, 2013
BRAZIL
241stores
Integrated countries
Franchised countries
OTHER COUNTRIESEurope, Asia, Maghreb,
Middle East and
Dominican Republic
1,147stores
10,105stores
34countries
ARGENTINA
521stores
FRANCE
4,779stores
POLAND
635stores
SPAIN
456stores
INDIA
5stores
TAIWAN
69stores
CHINA
236stores
BELGIUM
729stores
ROMANIA
162stores
ITALY
1,125stores

2013 REGISTRATION DOCUMENT 3
PRESENTATION OF THE GROUP
1.1 Consolidated key fi gures 4
1.2. Results and highlights of 2013 5
1.3 Activities and strategy 61.3.1 A multi-format and multi-channel retailer 6
1.3.2 A multi-local retailer 7
1.3.3 A broad selection of quality products
at the best possible prices 9
1.3.4 Carrefour’s growth in France and throughout the world 9
1.4 Tangible assets 12
1.5. Intellectual property 13
1.6. History 13
1.7 Organisational chart 15
1

2013 REGISTRATION DOCUMENT 4
1 PRESENTATION OF THE GROUPConsolidated key fi gures
Company profile
The Group operates hypermarkets, supermarkets, convenience, cash
& carry and hypercash stores, as well as both food and non-food
e-commerce websites.
In 2013, the Group’s gross revenue under banners totalled €100.2 billion,
up 1.5% at constant exchange rates ( -1.1% at current rates). The
Group’s consolidated gross sales stood at €84.3 billion – an increase
of 1.9% at constant exchange rates. Net sales totalled €74.9 billion. At
the end of 2013, the Group had 10,105 stores under banners, including
1,421 hypermarkets, 2,917 supermarkets, 5,593 convenience stores
and 174 cash & carry stores.
In France – where it generates 47% of its sales – Carrefour operates
through all retail formats, with 234 hypermarkets, 949 supermarkets,
3,458 convenience stores, and 138 cash & carry stores, as well as an
online shopping portal at www.carrefour.fr.
Elsewhere i n Europe , Carrefour is present in 5 countries (Belgium,
Spain, Italy, Poland, and Romania). These countries account for
26% of its turnover and include all retail formats: 388 hypermarkets,
1,170 supermarkets, 1,530 convenience stores and 19 cash & carry
stores under Group banners, excluding international franchises.
In Latin America, Carrefour operates in Argentina and Brazil where it
generates 18% of its turnover through 762 stores – 277 hypermarkets,
169 supermarkets and 316 convenience stores.
Carrefour generates 9% of its turnover in China and Taiwan. In Asia,
it has 298 hypermarkets, 7 supermarkets and 5 cash & carry stores.
Carrefour also has 1,147 stores operated by franchisee partners
throughout the world.
In 2013, Carrefour opened or acquired 810 stores under banners - some
579,000 sq.m of additional gross sales area.
2013 consolidated key figures
The key fi gures for 2013 that are given below have been audited by the
Group’s Statutory Auditors.
The 2011 comparative information given below (“2011 restated”)
has been restated in 2012 to refl ect the classifi cation of discontinued
operations in accordance with IFRS 5. These restatements relate to
activities in Greece, Singapore, Malaysia, Colombia and Indonesia.
The 2012 comparative information given below (“2012 restated”) has
been restated to refl ect the classifi cation of discontinued operations
in accordance with IFRS 5 (reorganisation of the Group’s activities in
Turkey and India), as well as retrospective application of the revised IAS
19 standard on Employee Benefi ts. These restatements are described
in Note 4 of the consolidated fi nancial statements .
(in millions of euros) 2013 2012 restated 2012 published 2011 restated
Selected fi nancial information from the consolidated income statement
Net sales 74,888 75,673 76,789 76,067
Recurring operating income before depreciation and amortisation 3,669 3,642 3,688 3,748
Recurring operating income 2,238 2,124 2,140 2,197
EBIT 2,382 1,465 1,434 (140)
Net income from continuing operations 1,058 273 235 (1,713)
Net income from continuing operations – Group share 949 150 113 (1,865)
Net income 1,364 1,342 1,316 404
Net income – Group share 1,263 1,259 1,233 371
Selected fi nancial information from the consolidated cash fl ow statement
Cash fl ow from operations* 2,039 2,708 2,228 2,577
Net cash from operating activities 1,675 2,459 1,973 2,118
Net cash from (used in) investing activities (855) 337 337 (398)
Net cash from (used in) fi nancing activities* (2,489) 60 546 (1,170)
Net change in cash and cash equivalents (1,816) 2,724 2,724 578
Selected fi nancial information from the consolidated statement of fi nancial position
Net debt 4,117 4,320 4,320 6,911
Shareholders’ equity 8,597 8,047 8,361 7,627
Shareholders’ equity - Group share 7,844 7,181 7,487 6,618
* T he cost of net fi nancial debt that was previously included in the cash fl ow was reclassifi ed as a fi nancing activity in 2013, and in the comparative information for 2012 as described in note 4 of the consolidated fi nancial statements.
1.1 Consolidated key fi gures
2013 REGISTRATION DOCUMENT 5
PRESENTATION OF THE GROUP
1
Results and highlights of 2013
Carrefour’s results in 2013
The 2013 results demonstrated growth momentum. Refocused on the
markets where it holds a leading position and with a strengthened fi nancial
structure, the Group has shown accelerating growth in sales and in
profi ts while investments have picked up.
W Strong growth in Group earnings
Growth in sales has accelerated, both in France and internationally.
Organic sales excluding gasoline grew by 2.3%. Recurring o perating
i ncome improved by 9.8% at constant exchange rates to €2.24 billion.
Net income from continuing operations has signifi cantly increased to
reach €949 million.
W France: action plans produce significant improvements in all
formats
France saw a return to growth, with organic sales excluding gasoline
climbing +1.0% across all formats (+0.7% for hypermarkets, +0.6%
for supermarkets, and +4.0% for other formats). Like-for-like sales also
grew at all formats.
Attractiveness improved across the various formats, with steady
improvement in terms of price perception, increased footfall and number
of transactions, as well as an improvement in overall customer satisfaction
at both hypermarkets and supermarkets.
Recurring operating income, which totalled €1.2 billion, soared by +30%,
an increase of 80 basis points in operating margin to 3.4% of sales. Each
of the formats contributed to this overall performance, which marks the
third consecutive half of year-on-year growth.
W International: successful multi-local model
In Europe, organic growth in sales showed a clear improvement in
the 2nd half, particularly in Spain, where the recovery continued in an
consumption environment that remained challenging in Southern Europe.
In Latin America, organic sales were up sharply at +12.3%, over an
already-high comparable base in 2012 (+12.5%). In 2013, operating
profi tability improved in the region, picking up even further in the 2nd half.
Brazil’s performance was excellent in all formats, and Argentina managed
a complex situation remarkably well in a context of a regulatory price
freeze and infl ation. Carrefour is consolidating its position in the region
as a grocery leader.
In Asia, organic sales growth gained momentum in 2013 (+2.2%, after
+0.2% in 2012). China continued the build-up of its long-term position,
opening 20 new hypermarkets to reach a total of 236 stores at the end
of 2013.
W A strengthened financial structure
Net debt totalled €4.1 billion at the end of 2013, down €203 million.
As a result, the net debt to EBITDA ratio improved to 1.1x.
Highlights
Creation of a company gathering 172 shopping malls adjacent to hypermarkets in France, Spain, and Italy
W Continuing its back to basics strategy, Carrefour aims, through the
creation of this company, to recreate an ecosystem that integrates all
the components of each commercial site for the benefi t of its customers.
Its success rests on the coordinated renovation, modernisation and
extension of its sites.
W With over 800,000 s q. m of retail space, assets of €2.7 billion and a
value-creating renovation and extension plan, this c ompany will rank
among the leading European shopping mall companies.
W The project is subject to approval by the relevant regulatory authorities.
It should close in the fi rst half of 2014.
Constitution of a joint company with CFAO to develop stores in West and Central Africa
W This joint venture is 45% controlled by Carrefour and 55% by CFAO.
It enjoys exclusive retail rights to develop different store formats in
eight countries in West and Central Africa: Cameroon, the Republic
of the Congo, Ivory Coast, Gabon, the Republic of Ghana, Nigeria,
the Democratic Republic of the Congo, and Senegal.
W Carrefour contributes its expertise as a multi-format retailer, along with
the strength of its banners. The CFAO group, which has had a strong
local presence in Africa for many years, brings its in-depth knowledge
of these markets and a solid understanding of local consumer habits.
Reorganisation of the partnership with Sabanci Holding in Turkey
W After 17 years of partnership, the Carrefour g roup and Sabanci
Holding decided to reorganise the governance of their joint company,
Carrefour SA.
W Sabanci Holding became the majority shareholder by purchasing 12%
of Carrefour SA’s capital stock from the Carrefour g roup for a total of
€60 million. Carrefour retains 46.2% of the capital stock.
W With a 50.8% stake in Carrefour SA, Sabanci Holding oversees a
new phase of development, in which its knowledge of the country and
market is used to support its joint subsidiary with Carrefour.
Reorganisation and strengthening of the partnership with Majid Al Futtaim Holding in the Middle East
W Carrefour sold its 25% stake in Majid Al Futtaim Hypermarkets for
€530 million to its regional partner Majid Al Futtaim Holding, which
became the sole shareholder.
W The exclusive franchise partnership with the Carrefour g roup is renewed
through 2025 and expanded to include new formats and new countries.
1.2. Results and highlights of 2013

2013 REGISTRATION DOCUMENT 6
1 PRESENTATION OF THE GROUPActivities and strategy
1.3.1 A MULTI-FORMAT AND MULTI-CHANNEL RETAILER
1.3 Activities and strategy
Carrefour has all the resources to cater to the different needs of its
customers – whether they live in an urban or rural environment, whether
they be private or professional clients, in France or abroad . Always focused
on meeting their expectations, 2013 saw Carrefour continuing with its
drive to expand and renovate its stores.
Worldwide, the Group’s stores come in a variety of formats and channels:
hypermarkets - with a general product offer at the best possible prices;
supermarkets - the leading grocery format; convenience stores - for
service and practical solutions; cash & carry stores for professionals;
hypercash stores, drive and e-commerce - all designed to meet evolving
customer needs .
Hypermarkets
With sales areas of between 2,400 and 23,000 sq.m., Carrefour’s
hypermarkets are perfect for all major shopping trips. Customers can fi nd
an assortment of 20,000 to 80,000 products, both food (fresh produce,
consumer goods, local products, etc.) and non-food (clothing, electronic
goods, decorative products, leisure, etc). Around the world, Carrefour’s
hypermarkets strive to provide high quality and protect their customers’
purchasing power by offering low prices year-round. Hypermarkets in
France and Argentina, for example, maintained in 2013 their “lowest
price guarantee” on the most commonly purchased everyday products.
Customers also benefi t from innovative new services, like single check-
out lines in Belgium, Poland, and France. Customer satisfaction is also
bolstered by frequent promotions and events introducing new products,
slashed prices, or the diverse range of services offered.
At the end of 2013, Carrefour had 1,421 hypermarkets under banners,
with 234 in France, 475 in the rest of Europe, 277 in Latin America,
371 in Asia, and 64 in other countries.
Supermarkets
The Group’s supermarkets offer a wide and varied selection, displays
bursting with fresh produce and local products, an appropriate
assortment of non-food products, attractive prices in every aisle, and
regular promotions. These selling points have made them a standard for
grocery shopping in cities and more rural areas alike. In stores ranging
from 1,000 to 3,500 sq.m., customers can enjoy welcoming, market-
inspired store concepts for their everyday shopping under the Market
and Bairro banners. In addition to sales offers focusing on fresh produce
and low prices, a series of events and innovations also contributed to
greater customer loyalty and satisfaction in 2013: an easier- to- understand
offering and customer pathway, faster check-out and innovative payment
systems, tastings of local products, and digital information screens.
At the end of 2013, Carrefour had 2,917 supermarkets under banners
throughout the world, with 949 in France, 1,656 in the rest of Europe,
169 in Latin America, 17 in Asia, and 126 in other countries.
Convenience stores
C onvenience stores offer a selection of essential products that refl ect
their customers’ habits and needs, at fair prices, and extensive store
hours. Customers can do their daily shopping at these convenient,
nearby stores while enjoying a pleasant, modern ambiance. They also
fi nd products and solutions that meet their needs, from budget meals to
everyday essentials, express check-out lines to get out the door faster,
and home delivery services. The Group’s various banners (Express, City,
Contact, Montagne, 8 à Huit, etc.) range in size from 200 to 900 sq.m.
as befi ts their purpose, driving the ambition of becoming the standard
for local convenience stores.
In total, at the end of 2013, Carrefour had 5,593 convenience stores,
with 3,458 in France, 1,795 in the rest of Europe, 316 in Latin America,
and 24 in other countries.
Cash & carry and hypercash stores
Cash & carry stores offer restaurant and store owners a broad selection of
food and non-food products at wholesale prices, along with a package of
customized services: opening hours tailored to the food industry, delivery
options, loyalty programmes, etc. In France, for example, Promocash
is the leading franchised cash & carry network with 138 sales outlets.
In total, at the end of 2013, Carrefour had 174 cash & carry stores, with
138 in France, 19 in the rest of Europe, 5 in Asia, and 12 in other countries.
In some markets, the Group is also developing hypercash stores open
both to professionals and individual customers. Products are presented
on pallets in large quantities and sold at wholesale prices. The Atacadão
banner, for example, is continuing to expand in Brazil, with 98 stores at
the end of 2013, as are Carrefour Maxi in Argentina and GrossIper in Italy.

2013 REGISTRATION DOCUMENT 7
PRESENTATION OF THE GROUP
1
Activities and strategy
Multi-channel retail
In 2013, Carrefour continued to expand its food and non-food e-commerce
business, adopting a multi-channel approach with its websites working
together with its stores to meet the needs of customers on the lookout
for bargains and practical solutions.
In some Group countries, e-commerce sites offer food and/or non-food
products. These easily accessible “cyber-markets” also have the benefi t
of quick delivery times and very competitive prices, promotions, and useful
tips. In 2013, Carrefour launched an online store in Romania offering
13,000 everyday food products at comparable prices to those found in
hypermarkets. Every day in France, the carrefour.fr and ooshop.fr websites
win over more customers seeking bargains and convenience. In addition,
consumers can now enjoy easy shopping right from their mobile phone
using the applications Carrefour is developing.
Carrefour is accelerating the expansion of its drive solution, which allows
customers to shop online and then go pick up their purchases at the
nearest store. In France, the Group opened 143 new pick-up locations
in 2013, bringing the total to 348, most of them integrated into stores.
Customers can also pick up their shopping in under 5 minutes at 4 Belgian
hypermarkets and the fi rst Market supermarket to be open 24 hours a
day, located in Milan, Italy.
1.3.2 A MULTI-LOCAL RETAILER
With 10,105 stores in 34 countries, the Carrefour g roup is a major player
in global retail with strong roots in its local communities. It currently
operates in mainland France and its overseas territories (47% of its
network), as well as elsewhere in Europe (39%), Latin America (8%),
Asia (4%), and in other countries like North Africa and the Middle East
(2%) through a network of consolidated and franchised stores, and
stores that it runs with local partners.
For Carrefour, being multi-local also means developing a selection of
products and services specifi c to the region in which each store operates,
tailored to fi t the needs and profi le of its customers. The teams form
partnerships with local producers, hold sales events, recruit staff, and
contribute to economic, environmental and social projects at the local
level. In the eyes of Carrefour, this is the entire purpose and benefi t of a
multi-local approach: stores that are close to their customers, engaged
with local stakeholders, with the support, logistics and power of an
international retail Group.
STORE NETWORK
(I ncluding franchisees and partners)
Number of stores as of December 31 Sales area (in thousands of sq.m)
2012 2013 2012 2013
France 4,741 4,779 5,075 5,071
France 4,635 4,670
Hypermarkets 220 221
Supermarkets 934 920
Convenience stores 3,342 3,392
Cash & carry stores 139 137
French partnerships (overseas territories) 106 109
Hypermarkets 12 13
Supermarkets 30 29
Convenience stores 63 66
Cash & carry stores 1 1
Other European countries 4,018 3,945 5,630 5,539
Spain 392 456 1,713 1,733
Hypermarkets 173 172
Supermarkets 114 118
Convenience stores 105 166
Italy 1,218 1,125 1,072 1,018
Hypermarkets 45 58
Supermarkets 439 394
Convenience stores 720 654
Cash & carry stores 14 19

2013 REGISTRATION DOCUMENT 8
1 PRESENTATION OF THE GROUPActivities and strategy
Number of stores as of December 31 Sales area (in thousands of sq.m)
2012 2013 2012 2013
Belgium 714 729 915 925
Hypermarkets 46 45
Supermarkets 436 438
Convenience stores 232 246
Poland 542 635 643 619
Hypermarkets 84 88
Supermarkets 161 139
Convenience stores 297 408
Romania 108 162 227 246
Hypermarkets 24 25
Supermarkets 68 81
Convenience stores 16 56
Partnerships in other European countries 1,044 838 1,059 998
Hypermarkets 85 87
Supermarkets 510 486
Convenience stores 449 265
Latin America 675 762 2,045 2,088
Brazil 237 241 1,407 1,434
Hypermarkets and hypercash stores 196 200
Supermarkets 41 41
Argentina 438 521 638 655
Hypermarkets and hypercash stores 76 77
Supermarkets 127 128
Convenience stores 235 316
Asia 370 393 2,592 2,765
China 218 236 1 698 1 848
Hypermarkets 218 236
Taiwan 64 69 425 431
Hypermarkets 61 62
Supermarkets 3 7
India 4 5 20 26
Cash & carry stores 4 5
Partnerships in other Asian countries 83 83 449 459
Hypermarkets 71 73
Supermarkets 13 10
Partnerships in other regions 191 226 608 712
Hypermarkets and hypercash stores 55 64
Supermarkets 110 126
Convenience stores 20 24
Cash & carry stores 6 12
TOTAL 9,995 10,105 15,949 16,176
Total hypermarkets and hypercash stores 1,366 1,421 10,225 10,519
Total supermarkets 2,986 2,917 4,145 3,918
Total convenience stores 5,479 5,593 1,205 1,306
Total cash & carry stores 164 174 374 432
The number of stores as of December 31, 2012 includes a reclassifi cation of 469 franchised stores from the supermarket to the convenience format.

2013 REGISTRATION DOCUMENT 9
PRESENTATION OF THE GROUP
1
Activities and strategy
Products are at the heart of what we do. Our product offer is based on
three unchanging principles: a wide selection, the lowest prices and
the highest possible quality. To cater to the needs of our customers
throughout the world, we refi ne our offer so that we can provide a variety
of fresh produce, products from local suppliers, major-brand products,
essential non-food items, the best innovations and daily retail services.
Fresh produce
A major source of appeal for our stores, fresh produce involve all the
efforts and expertise of our employees. Carrefour offers a wide range of
high-quality fresh produce in a carefully designed environment to support
local economic development and give customers a more enjoyable
shopping experience: generous “market” stalls, products within easy
reach, and regional products.
Local products
Carrefour has always given priority to products sourced locally, i.e.
products from the region in which they are sold. As a result, nearly 75%
of all Carrefour food products come from local suppliers. Carrefour is
strengthening this approach and giving its store directors – particularly
in hypermarkets – more room for manoeuvre so that they can select and
offer their customers a very local selection of products sourced from
producers located close to stores.
Everyday products
In its grocery, liquids and hygiene/beauty departments, Carrefour offers
both major-brand products that are highly valued by consumers plus a
selection of Carrefour’s own-brand products. In all of the countries in
which the Group operates, it aims to offer the lowest possible prices
every day, together with special offers on popular products.
Non-food products
N on-food items are organised into categories meeting customers’ basic
needs: household goods and general merchandise , apparel and home
appliances (photo equipment, DVDs, sound and multimedia equipment).
Together, Carrefour own-brand and other major-brand products make
up a selection of products that are suited to everyone’s tastes and all
budgets. Consumer habits are changing, so Carrefour is tailoring its
product offer by maximising value for money for non-food products,
expanding the general product offer of its hypermarkets, providing its
supermarket customers with the convenience service that they expect and
developing a range of innovative and competitive Internet-based services.
Commercial services
From fi nancing solutions and entertainment to pharmacy products
and petrol, Carrefour services are available in shopping centres and
parking lots and meet customer needs with the same commitment:
quality products at the best price.
Reserving theatre tickets, buying fl owers, printing photos or renting a truck
for a move: Carrefour services, different depending on the country and
consumer habits, make it easy for customers to optimise their shopping
time and budget and win their loyalty to Carrefour.
Carrefour can also offer its customers fi nance, savings and insurance
services in 930 of its branches and fi nance service stands throughout
the world. Located right next to hypermarkets, the Group’s agencies and
fi nance stands support Carrefour’s core business. One of the ways in
which it does this is by distributing PASS cards (payment cards that
can be used both in France and abroad), as well as by offering fi nance
solutions and extended warranties for goods purchased.
1.3.3 A BROAD SELECTION OF QUALITY PRODUCTS AT THE BEST POSSIBLE PRICES
1.3.4 CARREFOUR’S GROWTH IN FRANCE AND THROUGHOUT THE WORLD
For more than 50 years, Carrefour has been opening stores in France
and abroad. It currently operates in mainland France and its overseas
territories, as well as in Europe, Asia, Latin America, North Africa and the
Middle East through a network of consolidated and franchised stores,
and stores that it runs with partner companies.
In 2013, Carrefour opened or acquired 810 stores under banners -
some 579,000 sq.m of gross additional sales area. As of the end of
2013, the Carrefour g roup had 10,105 stores under banners in more
than 30 countries.
In 2013, Carrefour posted net sales of €74.9 billion – up 2.0% on the
previous year at constant exchange rates. This growth was supported by
emerging markets (Latin America and Asia) – which accounted for 27.0%
of the Group’s sales (26.8% in 2012). This rise can be attributed to:
W organic growth in sales (excluding gasoline), which totalled 2.3%,
an increase over 2012;
W a negative effect of 0.4% from gasoline;
W a negligible impact from acquisitions/disposals during the year.

2013 REGISTRATION DOCUMENT 10
1 PRESENTATION OF THE GROUPActivities and strategy
Changes in exchange rates (mainly the depreciation of the Brazilian real
and the Argentinian peso) had a 3.0% unfavourable effect, refl ected in a
1.0% decrease in sales in 2013 at current exchange rates.
Recurring operating income rose by 9.8% at constant exchange rates
(+5.3% at current exchange rates) to €2.24 billion. This increase is due
to a sharp rise in recurring operating income in France (+30%) and in
emerging countries (+8.5% at constant exchange rates, with growth
of 18.6% in Latin America). In Europe, recurring operating income fell
over the year, but with a notable recovery in the second half. In total,
recurring operating income accounted for 3.0% of sales, an increase
of 20 basis points over 2012.
In 2013, operational inve stments signifi cantly picked up. As anticipated,
they stood at €2.2 billion, up 44% compared to 2012.
Carrefour in France
In France, Carrefour is the leading food retailer across all formats. In
2013, the Group had 4,779 stores under banners in 4 different formats:
234 Carrefour hypermarkets, 949 supermarkets, 3,458 convenience
stores operating under the City, Contact, Montagne, Express, 8 à
Huit, Shopi, Marché Plus and Proxi banners and 138 cash & carry
stores operating under the Promocash banner. The Group had a total
of 736 consolidated stores - 213 hypermarkets, 519 supermarkets,
1 convenience store and 3 cash & carry stores.
In 2013, Carrefour in France either opened or acquired 204 stores under
banners - including 2 hypermarkets, 3 supermarkets, 199 convenience
and 2 cash & carry stores, representing a total of some 51,000 sq.m.
gross sales area.
In 2013, France saw a return to growth, with organic sales excluding
gasoline climbing (+1.0%) across all formats. Hypermarkets saw a
+0.7% increase in organic sales excluding gasoline (+0.2% like-for-like),
supermarkets grew by +0.6% (+0.9% like-for-like), and the other formats,
mainly convenience stores, by +4.0% (+3.7% like-for-like). Attractiveness
improved across the various formats, with steady improvement in terms of
price perception, increased footfall and number of transactions, as well
as an improvement in overall customer satisfaction at both hypermarkets
and supermarkets.
The multi-year store renovation programme was launched with
49 hypermarkets and 83 supermarkets renovated in 2013. France also
launched the overhaul of its supply chain and IT rationalization is underway.
In addition, it is continuing to implement the action plans initiated in 2012.
Recurring operating income, which totalled €1.2 billion, soared by +30%,
an increase of 80 basis points in operating margin to 3.4% of sales. Each
of the formats contributed to this overall performance, which marks the
third consecutive half of year-on-year growth. The increase was due to:
W growth in gross margin as a result of an improved balance between
everyday low prices, promotions and loyalty programs, and lower
shrinkage;
W good control of operating costs.
In France, operational investments totalled €1.03 billion (including
€35 million related to global functions). This fi gure was up 62% over
2012, largely because of a pick-up in remodeling and maintenance.
Investments represented 2.9% of sales, versus 1.7% in 2012.
Carrefour in other European countries
Carrefour operated 3,945 stores under banners as of the end of 2013. Its
stores under banners included 475 hypermarkets, 1,656 supermarkets,
1,795 convenience stores and 19 cash & carry stores. Carrefour operated
stores in 5 countries for which the store network totalled 1,164 units
(380 hypermarkets, 579 supermarkets, 186 convenience stores, and
19 cash & carry stores).
In 2013, Carrefour opened 444 stores under banners in Europe – an
additional 169,000 sq.m of gross sales area with 5 new hypermarkets,
93 supermarkets, 340 convenience stores, and 6 cash & carry stores.
Net sales in Europe totalled €19.2 billion in 2013, down 2.9% at constant
and current exchange rates. Organic growth in sales showed a clear
improvement in the 2nd half, particularly in Spain. Spain thus continued
its recovery and posted quarterly like-for-like growth for the fi rst time
since 2008, while in Italy the environment remained diffi cult.
Over the year, gross margin improved with constant attention to price
positioning. Growth in operating costs was contained. Recurring operating
income totalled €388 million.
Profi tability improved during the second half, with operating margin up
by 10 basis points to 3.5% of sales, demonstrating the effectiveness
of the operating model.
W Carrefour has been present in Spain since 1973 and is the country’s
second-largest multi-format grocery operator, and the leading operator
of hypermarkets. As of the end of 2013, its stores under banners
included 172 hypermarkets, 118 supermarkets and 166 convenience
stores. Net sales totalled €7.8 billion – a 2.2% fall in total.
W Carrefour has been present in Italy since 1993 and ranks 6th in a
fragmented grocery market; it holds strong regional positions, such as
in Val d’Aosta, Piedmont, Lazio, and Lombardy. The Group manages
58 hypermarkets, 394 supermarkets, 654 convenience stores and
19 cash & carry stores in Italy. Net sales totalled €4.8 billion, declining
by 6.5% in total.
W In Belgium, Carrefour is one of the 3 largest grocery retailers thanks
to its multi-format presence: 45 hypermarkets, 438 supermarkets, and
246 convenience stores. Net sales stood at €4.0 billion, increasing
1.4%.
W Carrefour directly operates in 2 other countries: Poland and Romania,
with combined net sales of €2.7 billion, down 4.0%. Carrefour has
been operating in Poland since 1997, with a network of stores under
G roup banners which includes 88 hypermarkets, 139 supermarkets
and 408 convenience stores. Carrefour has been operating in Romania
since 2001, managing 25 hypermarkets, 81 supermarkets, and
56 convenience stores.

2013 REGISTRATION DOCUMENT 11
PRESENTATION OF THE GROUP
1
Activities and strategy
W The Group is also present in other European countries through
various partnerships, including Greece, Cyprus, and the Balkans
since 2012 and Turkey since 2013. In these countries, the Group has
87 hypermarkets, 486 supermarkets, and 265 convenience stores
under banners.
Operational investments in Europe totalled €409 million – up 33%
compared with 2012 – representing 2.1% of sales.
Carrefour in Latin America
Carrefour has been operating in Latin America since it opened its fi rst store
in Brazil in 1975 and has become one of the region’s major players in retail.
Carrefour is expanding its banners on two growth markets: Argentina and
Brazil. The Group has 762 stores in total, including 277 hypermarkets,
169 supermarkets and 316 convenience stores. The network grew to
include 5 new Atacadão stores in Brazil, along with 2 hypermarkets,
1 supermarket, and 85 convenience stores in Argentina. These new
stores have added 51,000 sq.m of sales area.
In Latin America, organic sales were up sharply at +12.3%, on an already
high comparable base of 12.5% in 2012. An unfavourable currency effect
over the year resulted in a sales decrease of 2.7% at current exchange
rates. With recurring operating income of €627 million in 2013, profi tability
improved in the region, picking up even further in the 2nd half.
Argentina showed solid performance in a context of price regulation.
W Carrefour has been present in Brazil since 1975 and is the co-leader in
food retail. The Group operate d 102 hypermarkets, 98 hypercash stores
and 41 supermarkets there as of the end of 2013. Net sales in Brazil
totalled €10.9 billion, an increase of 9.6% at constant exchange rates.
Performance was excellent across all formats: hypermarkets continued
to improve their results, and the Atacadão banner consolidated its
leadership as it continued to expand.
W Carrefour has been present in Argentina since 1982 and is the
leader in food retail thanks to its multi-format presence. The Group
manages 74 hypermarkets, 3 hypercash stores , 128 supermarkets,
and 316 convenience stores. Net sales totalled €2.9 billion, up 26.1%
at constant exchange rates and up 1.0% at current exchange rates
on the previous year.
Operational investments in Latin America totalled €457 million,
representing 3.3% of sales, versus 2.2% in 2012.
Carrefour in Asia
Carrefour has been established in Asia since 1989. It opened its fi rst
store in Taiwan and now has a presence in China, as well as in Indonesia
(through franchises). As of the end of 2013, the Group was also operating
5 cash & carry stores in India.
The Group has a total of 393 stores under banners, including 371
hypermarkets, 17 supermarkets and 5 cash & carry stores. Over the
year, the Group added 29 stores to its network – 24 hypermarkets, 4
supermarkets, and 1 cash & carry store. These new stores have added
an additional 194,000 sq.m of sales area.
Net sales in Asia grew by 2.6% at constant exchange rates (+1.1% at
current exchange rates), to stand at €6.4 billion. Gross margin held up
well over the year amid a slowdown in consumption in the 4th quarter.
Recurring operating income totalled €131 million for a margin of 2.0%,
a decrease of 80 basis points compared with 2012.
W Carrefour has been present in China since 1995 and is one of the
leading players in food retail. The Group is continuing to build a long-
term position, opening 20 new hypermarkets to reach a total of 236
stores at the end of 2013. Another highlight this year was the signature
of a commercial contract with China CITIC Bank to develop credit
cards. Net sales in China totalled €5.0 billion – up 4.0% at constant
exchange rates and up 3.2% at current exchange rates.
W Carrefour has been present in Taiwan since 1989 and is currently the
leading hypermarket operator in the country. The network includes
62≈hypermarkets and 7 supermarkets. Sales have dipped slightly in
the country at constant exchange rates.
W Carrefour has been present in India since 2010, when it opened its
fi rst cash & carry store under the Carrefour Wholesale Cash&Carry
banner in New Delhi. As of the end of 2013, the Group was operating
5 cash & carry stores in India.
W The Carrefour banner is also present in Indonesia as franchises, with
our partner operating 73 hypermarkets and 10 supermarkets.
Operational investments in Asia totalled €261 million, representing 4%
of sales, broadly in line with 2012.
Other regions
Carrefour also has 226 stores that it operates with local franchisee
partners throughout the world (in North Africa, the Middle East,
and the Dominican Republic) in different formats: 64 hypermarkets,
126 supermarkets, 24 convenience stores, and 12 cash & carry stores.
2013 REGISTRATION DOCUMENT 12
1 PRESENTATION OF THE GROUPTangible assets
For Carrefour, tangible fi xed assets mainly include sales areas operated
by the Group. At the end of December 2013, the Group was operating
16.2 million sq.m of sales area through its stores under banners.
The Group’s ownership strategy for its stores varies from country to
country, and from format to format. In total, the Group owns most of the
real estate associated with its retail outlets. Since June 2012, Carrefour
Property’s activities in France, Spain and Italy - and its real estate activities
at international level - have been grouped together under the responsibility
of a Group Executive D irector for Development and Real Estate.
Details of its asset ownership are given in Notes 18 and 19 of the
Consolidated Financial Statement for December 31, 2013, on
pages 170 - 173 of this document.
On December 16, 2013, Carrefour announced plans to create a company
for shopping centres adjoining some of its hypermarkets in Europe.
The project will result in the creation of a company that will include
172 shopping malls originating from:
W fi rst, the acquisition from Klepierre for €2.0 billion of 127 sites in
France, Spain and Italy, with gross annual rental income of around
€135 million;
W second, the contribution by Carrefour of 45 shopping malls in France
with a value of €0.7 billion and gross annual rental income of around
€45 million.
With more than 800,000 sq.m of sales area, property worth €2.7 billion,
and a value-creating renovation and extension plan, this c ompany will rank
among the leading European shopping mall companies. The transaction,
which remains subject to the approval of the relevant regulatory authorities,
is slated to close in the fi rst half of 2014.
1.4 Tangible assets

2013 REGISTRATION DOCUMENT 13
PRESENTATION OF THE GROUP
1
History
Carrefour owns a number of international brands (banners and products). The national product brands are the property of the subsidiary which
uses them.
Carrefour Legal department has an intellectual property specialist who - with the help of outside consultancy fi rms - registers and renews brands,
monitors them and defends Carrefour’s rights against any third parties.
1.5. Intellectual property
1.6. History
1959The Carrefour supermarket company is set up by the Fournier, Badin and Defforey families who run a discount supermarket in Annecy.
1963 The fi rst French hypermarket is opened in Sainte-Geneviève-des-Bois (Essonne).
1970 Carrefour is listed on the French Stock Exchange.
1973 The Group begins operating in Spain.
1975 The Group begins operating in Brazil.
1982 The Group begins operating in Argentina.
1989 Carrefour establishes a foothold in the United States and in Taiwan.
1993 The Group begins operating in Italy and Turkey.
1994
Carrefour acquires a majority stake in Picard Surgelés.A joint company is set up with a Chinese partner in order to develop supermarket/hypermarket business activities in Shanghai and Beijing.
1996 Carrefour acquires a 42% stake in GMB, which controls the Cora group.
1997
Guyenne & Gascogne, Coop Atlantique and the Chareton group enter into an agreement with Carrefour: their 16 hypermarkets are converted to the Carrefour banner in 1998, and these groups retain management of their own stores.The Group begins operating in Poland.
1998 Carrefour issues a non-hostile takeover bid/tender offer for Comptoirs Modernes in October.
1999 Carrefour launches a non-hostile public exchange offer for Promodès.
2000
The European Commission approves the merger of Carrefour and Promodès, creating the world's 2nd largest retailer.Following the merger between Carrefour and Promodès, 7 hypermarkets and 14 supermarkets are disposed of in France at the end of 2000.The 1st Carrefour hypermarket opens in Japan.
2001
Carrefour disposes of its 73.89% stake in Picard Surgelés.Carrefour takes over management of its Norte subsidiary (139 supermarkets) in Argentina.Carrefour disposes of its 42% stake in Cora.The Group begins operating in Romania.
2002 The Group speeds up roll-out of the Carrefour banner at international level.
2003 Paul-Louis Halley, one of the founders of Promodès, is killed in a plane crash.
2004 Strong organic growth: 914 new stores created, including 793 abroad.
2005
Disposal of hypermarkets in Mexico and Japan.Carrefour increases its stake in Hyparlo.Carrefour acquires Penny Market from German group Rewe and sells Prodirest to it, its collective catering subsidiary.
2006
It disposes of its assets in Korea, the Czech Republic and Slovakia.Incorporation of Hyparlo in France.Acquisition of Ahold Polska in Poland.

2013 REGISTRATION DOCUMENT 14
1 PRESENTATION OF THE GROUPHistory
2007
Acquisition of Atacadão in Brazil.Sale of operations in Slovakia.Acquisition of Plus stores in Spain.Sale of Portuguese hypermarkets.Sale of operations in Switzerland.Acquisition of Artima in Roumania.
2008
Acquisition of Alfa Retail Indo in Indonesia.Roll-out of the Carrefour market banner in France.Acquisition of Cross System Company (renamed Carrefour Property Development), the Group’s real estate holding company.Renewal of the partnership with Guyenne & Gascogne.
2010
The fi rst cash & carry store opens in India.Withdrawal from Thailand (with effect from 2011).Acquisition of a 51% stake in Baolongcang, China.Acquisition of the Ipek supermarket chain in Turkey.Creation of a partnership with CT Corp in Indonesia.
2011 Spin-off of Dia SA.
2012
Full consolidation of Guyenne & Gascogne from June onwards after the successful non-hostile takeover bid/tender offer.Acquisition of Eki stores in Argentina.Finalisation of the partnership with Itaú Unibanco in Brazil.Restructuring of the partnership in Greece with Marinopoulos, which becomes Carrefour's exclusive franchisee for Greece, Cyprus and the Balkans.Closure of 2 stores in Singapore.Withdrawal from Colombia.Withdrawal from Malaysia.Sale of the stake in the Indonesian subsidiary to the partner CT Corp, which becomes Carrefour's exclusive franchisee in the country.
2013
Reorganisation of the partnership with Sabanci Holding in Turkey.Reorganisation and strengthening of the partnership with Majid Al Futtaim Holding in the Middle East.Formation of a joint company with CFAO to develop stores in West and Central Africa.Announcement of the creation of a company that will include 172 shopping arcades adjoining hypermarkets in France, Spain, and Italy.Carrefour celebrated the 50th anniversary of its fi rst hypermarket in France with its customers.

2013 REGISTRATION DOCUMENT 15
PRESENTATION OF THE GROUP
1
Organisational chart
1.7 Organisational chart
Simplified organisational chart %
of direct and indirect ownership as 12/31/2013
EUROPE
France
100 %
100 %
50 %
100 %
100 %
99,16 %
60,83 %
100 %
100 %100 %
25 %
60,8 %
100 %
100 %
100 %
100 %
100 %
100 %
100 %
Belgium
Carrefour Monaco
Carrefour Régie Publicitaire
Centros Comerciales Carrefour
CSIF Carrefour Systèmes
d’information France
Carrefour Hypermarkets
CAF Carrefour Administratif
France
Mestdagh
Fimaser
Carrefour BelgiumCarrefour China
Holdings
Presicarre
INC SA
Carrefour Comercio E Industria
Atacadão
Carrefour ProximitéFrance
Genedis
Ooshop
Carfuel
Soval
Carrefour Banque
On Line Carrefour
Carrefour Drive
Carcoop
50 %Vézère Distribution
LATIN AMERICA
Carrefour Polska
Carrefour Romania
Carrefour Sabanci Ticaret
Carrefour Nederland
Carrefour Finance
GMR
99,8 %GS
ASIA
Netherlands
Turkey
Romania
Poland
Argentina
Brazil
China
Taïwan
100 %
100 %
100 %100 %
100 %
100 %
100 %
60 %
100 %
100 %
100 %
46,2 %
Italy
Spain
50 %Provencia
Carrefour Property Development
Carrefour Property France
Carrefour Station Service
Csf FranceStations Service
100 %
100 %
Guyenne et Gascogne
100 %
100 %Logidis
100 %CASCH France
100 %Interdis
100 %
Maison Johanès Boubée
100 %
Carrefour France
100 %
100 %
Amidis
C.S.F France
100 %
100 %
100 %
Profidis
Sélima SCR
CARREFOUR
Carrefour Italia

2013 REGISTRATION DOCUMENT 16
1

2013 REGISTRATION DOCUMENT 17
SOCIAL RESPONSIBILITY
2
2.1 Governance of CSR 182.1.1 Methodology for prioritisation of issues 18
2.1.2 Organisation of CSR 20
2.1.3 Business ethics and work against corruption 21
2.2 Review of CSR approach in 2013 232.2.1 2013 CSR Scorecard 23
2.2.2 2013 key projects 24
2.2.3 Social responsibility 31
2.2.4 A range of responsible products for everyone 43
2.2.5 Optimising our business operations’
environmental performance 51
2.2.6 Carrefour economic partner and local player 57
2.2.7 Serving communities 61
2.3 Assessment of performance and indicators 642.3.1 Performance indicators 64
2.3.2 Reporting methodology for Sustainable
Development indicators 66
2.3.3 Report by an independent third party on
the consolidated company, environmental
and societal information set forth in the
management report 71

2013 REGISTRATION DOCUMENT 18
2 SOCIAL RESPONSIBILITYGovernance of CSR
“Being a responsible retailer is about working to ensure that every
shopping transaction benefi ts as many people as possible.”
Mr Georges Plassat, Chairman and CEO
Social Responsibility is an integral part of Carrefour’s strategy because the
Group believes that its performance is also assessed by its contribution
to society. This performance, measured using both fi nancial and non-
fi nancial indicators, is the result of a continuous improvement approach
involving the Group’s business functions in all countries.
Carrefour undertakes practical actions in the countries in which it operates.
The actions fall within the framework of the Group’s CSR approach, which
ensures they contribute to a common long-term objective.
The aim of Carrefour’s actions in relation to CSR can be summed up as
“doing a good job” which declines in three main areas:
W The Antigaspi waste reduction Plan : limiting the use of resources;
W Biodiversity: purchasing in ways that respect the planet;
W Contribution to society: supporting the business’ partners.
The following chapters detail the method used to establish the priorities
(Methodology), incorporating CSR into the business functions
(Governance) and the main results of the CSR approach (Scorecard).
2.1 Governance of CSR
2.1.1 METHODOLOGY FOR PRIORITISATION OF ISSUES
In 2012, Carrefour embarked on a methodical approach based on
the ISO 26000 standard to identify the social responsibility issues it
faces and continued in 2013 with an initial prioritisation of the issues
identifi ed. In practice, this consists of defi ning the Group’s priorities
based on its capacity to act on a particular issue and on its benefi ts for
society and the business.
The Group uses two complementary methods:
W an analytical method based on prioritising issues in accordance with
performance and importance criteria;
W a stakeholder method, which is used to identify priorities through
organising stakeholder consultations.
2.1.1.1 Analytical methodIn 2012, Carrefour carried out an assessment of social responsibility
issues by analysing the seven central questions in the ISO 26000 standard
and their 36 associated action areas. The assessment highlighted the
issues the Group needs to address in its business functions. It compared
these issues with its capacity for intervention in its area of responsibility,
resulting in a list of almost 300 issues in 2012 and over 450 in 2013.
The methodology used consisted of assessing the importance and the
performance of the central ISO 26000 questions to refl ect associated
subjects specifi c to Carrefour.
The issues identifi ed as a result were then placed in a matrix according
to the type of action Carrefour should take: react, act, consolidate or
monitor. Two priorities emerged for 2013 from this analysis:
W The Antigaspi waste reduction Plan: limiting the use of food and
fossil resources;
W Contribution to society: the working conditions under which products
are manufactured.
In 2014, Carrefour will take its analysis a step further by updating its
materiality approach.
2.1.1.2 Stakeholder methodConsultation with stakeholders is a method recommended in the ISO
26000 standard to identify priority issues in CSR. Consultation has been
a part of Carrefour’s CSR approach from the outset and takes different
forms depending on the stakeholders concerned, including interviews or
working groups, partnerships, participation and support for research by
the scientifi c community. In 2013, Carrefour organised its dialogue with
stakeholders by testing a model for consultation meetings based on a
particular issue. The same approach is being used in 2014.
Responding to requests from the non-fi nancial community
Working with the Group’s Financial Communications department,
Carrefour responds to requests for interviews as well as occasional
requests for information concerning policies and initiatives launched by the
Group’s various businesses. The teams responsible for CSR also respond
to the questionnaires from the main non-fi nancial rating agencies and to
investors, who examine environmental, social and governance information
in addition to purely fi nancial information in their investment decisions.

2013 REGISTRATION DOCUMENT 19
SOCIAL RESPONSIBILITY
2
Governance of CSR
Dialogue of this kind has contributed to an improvement in the evaluations
conducted by the rating agencies, such as the assessment made by the
CDP (Carbon Disclosure Project).
KEY FIGURES15 investor meetings took place in 2013.
14 questionnaires from non-fi nancial rating agencies or investors were completed.
Discussing and debating with partner organisations
Carrefour has built partnerships with organisations that enable it to
combine its own specialists’ skills with those of outside experts. This
type of cooperation is essentially operational in nature: experts from
NGOs debate with Carrefour’s business experts to fi nd a common
long-term vision.
The partnership between Carrefour and WWF France established in
1998 addresses two issues: developing responsible supply chains for
products such as wood, paper, soya, palm oil , seafood and promoting
responsible consumption amongst consumers (see page 46 ).
The partnership of almost 20 years between Carrefour and the international
trade union federation Union Network International (UNI) resulted in
the May 2001 signing of an international agreement on respect for
fundamental rights and the recommendations laid down in the guidelines
produced by the International Labour Organisation (ILO). The agreement
was renewed in 2011 and is applied in all countries in which the Group
operates. In 2013, this partnership contributed, amongst other things, to
the signature of the Fire and Building Safety agreement in Bangladesh
(see page 30) .
Since 1997, Carrefour has also worked in partnership with the
International Federation of Human Rights (FIDH). The cooperation
has been formalised through the creation of a joint association: INFANS.
The association runs practical projects in partnership with local NGOs to
prevent Human Rights abuses (for more information on INFANS see page
29 ). In 2013, the partnership with the FIDH contributed signifi cantly to
the understanding of international issues raised by accidents in factories
and also resulted in the production of social compliance rules for
purchasing (see page 29 ).
Dialoguing with staff representatives
The agreement between Carrefour and the UNI forms the basis of
social dialogue within the Group. In particular, it commits the Carrefour
Group to promoting union rights and the right to collective bargaining
in each of the countries in which it operates. This has resulted in the
creation of a European body dedicated to social dialogue, the Carrefour
European Information and Consultation Committee (EICC), and in a
regular social dialogue at both a Group and local level. As a forum
for discussion and consultation, the ECIC provides an opportunity for
Carrefour’s social partners to talk transparently to General Management
and Human Resources on an extremely wide range of topics, including
CSR. The annual EICC Plenary meeting is dedicated to subjects affecting
the Group’s activities, including HR and CSR.
Three meetings of the CSR Committee were held in 2013 (in March,
June and December), bringing together the volunteer members of the
EICC’s Executive Committee. The following topics were addressed at
these meetings: progress of the “Antigaspi Waste Reduction Plan”, issues
and programmes related to biodiversity, social diversity and Carrefour’s
actions to support improvements in working conditions in manufacturing.
At the annual meeting of the EICC in September 2013, whose main theme
was new technologies, the UNI outlined the Fire and Building Safety
agreement for Bangladesh, and Carrefour presented its conclusions on
the 2012 and 2013 industrial accidents in the textiles sector.
Exchanging views with local partners
Three regional “Carrefour Local” events were organised in France in 2013
(in Aquitaine, Provence-Alpes-Côte d’Azur and Languedoc-Roussillon).
The events provide an opportunity for meetings between the Company’s
managers and Carrefour’s numerous local partners: local SMEs, suppliers,
elected representatives, customers, institutions and federations. The
goal is to exchange views with institutional and economic players in the
region and discuss their day-to-day relationship with the banner and
the prospects for cooperation, with the aim of taking better account of
the needs of local partners.
Consulting our stakeholders on specifi c issues
Following the 2012 update to its stakeholder mapping, based on a method
inspired by the ISO 26000 standard, Carrefour reinstated a forum for
discussing CSR in 2013. As a result, the Group runs a consultation body
bringing together representatives of its stakeholders including NGOs,
customers, representatives of the French Ministry for the Environment
and Ministry for Agriculture, agricultural suppliers (Carrefour Quality
Line producers), food industry suppliers and rating agencies. The aim
of these meetings is to listen more effectively and improve the quality
of information exchange, and to identify pragmatic, effective actions.
RESULTS OF CONSULTATION MEETINGS WITH STAKEHOLDERS IN 2013The consultation on the theme of biodiversity on January 25, 2013 led the Group, in particular, to identify the following areas of work: defi ning a Group strategy for biodiversity (see page 47 ), developing a core market off ering with a focus on biodiversity and consumer information, and maintaining biodiversity around Group stores and sites.
At the second meeting, held in July 2013 on the theme of nutrition, the areas of work identifi ed, in addition to increasing awareness and providing consumer information on products, were: using stores as sources of information and advice on nutrition (observing purchasing behaviours to measure the long-term impact of the messages conveyed, creating areas for physical activity, etc.).

2013 REGISTRATION DOCUMENT 20
2 SOCIAL RESPONSIBILITYGovernance of CSR
Financial assessment of social contribution
The data below provide a fi nancial summary of the benefi ts of Carrefour’s fi nancial results for stakeholders in 2013.
INCOME
Customers Partners Financial income
Carrefour’s sales excluding VAT reached €74,888 million (excluding customer loyalty programmes – €588 million).
€2,375 millionOther miscellaneous income for Carrefour: franchising fees, income from fi nancial companies and leasing.
Carrefour earned €72 million from its fi nancial and strategic investments in the form of interest and dividends.
EXPENSES
Suppliers EmployeesGovernment and local communities Financial institutions Shareholders
Carrefour spent €64,782 million on goods and services from suppliers.
The Carrefour Group paid almost €7,679 million to its 364,795 employees in 11 countries. This amount includes gross salaries, social security charges and benefi ts.
Carrefour paid a total of €1,584 million in taxes, including €1,039 million in corporate income tax.
Charges – mainly linked to fi nancial transactions – were €794 million.
The Carrefour Group paid:
W €108 million in dividends to parent company shareholders;
W €101 million to minority shareholders in other Group companies.
2.1.2 ORGANISATION OF CSR
2.1.2.1 Incorporating CSR into the business functions
Carrefour’s CSR approach is led by the Group’s General Secretary,
who in turn relies on the Sustainable Development department. The
department’s role is to:
W defi ne the framework within which all business functions must operate
responsibly;
W instigate and maintain dialogue with the Group’s stakeholders on
subjects relating to CSR;
W drive projects that enable continuous improvement of Carrefour’s
performance;
W consolidate and use results to improve performance.
Carrefour’s CSR approach is implemented across all business functions,
countries and banners based on a principle of subsidiarity: responsibilities
and projects are devolved to local teams.
As a result, the Group’s Sustainable Development department works in
close collaboration with the Group’s country-level operational and cross-
functional departments: European Public Affairs, Quality, Merchandise,
Purchasing, Human Resources, Communications, Assets and Logistics,
and so on. The department also calls on the support of scientists and
outside experts to carry out its mission and ensures dissemination of
best practices both internally and externally. Finally, the Sustainable
Development department works with in-country representatives to ensure
operational deployment of the approach based on the local situation
on the ground.
With the aim of “doing a good job”, the Group uses a range of information,
awareness and training tools on CSR issues, including business-specifi c
training modules, eco-friendly initiatives in head offi ces in particular,
the Sustainable Development Awards, and so on. CSR is also a way
of securing employees’ loyalty and encouraging their commitment to
their business function on a day-to-day basis. A good example is the
Sumando Voluntades programme in Argentina, which has been rallying
Carrefour employees around three priority areas of activity since 2009:
environmental protection, nutrition and social integration. As a result,
250 employees act as ambassadors for the CSR approach with both
their colleagues and customers.

2013 REGISTRATION DOCUMENT 21
SOCIAL RESPONSIBILITY
2
Governance of CSR
The Carrefour Group is committed to conducting its activities ethically
and has therefore developed a control framework and structures adapted
to its business and corporate culture.
In 2013, Carrefour disseminated the Group’s updated internal rules to
country directors. The rules serve as the basis for the internal inspection
carried out by Carrefour’s auditors as part of their control function.
The priority in this area is on business ethics and compliance with the law.
This means working with both Carrefour’s teams and suppliers. It is why
the Carrefour Group’s actions are implemented within a formal framework
of fundamental universal principles and tools specifi c to Carrefour.
2.1.3.1 Practices guided by major fundamental principles
The Carrefour Group operates within a framework that respects Human
Rights and adopts and promotes fundamental international principles,
including particularly:
W The Universal Declaration of Human Rights;
W The main Conventions of the International Labour Organisation (ILO)
with regard to fundamental rights;
W The OECD’s guiding principles;
W The principles of the Global Compact, of which the Group has been
a member since 2001.
2.1.3.2 The Code of Professional Conduct: a frame of reference for employees
The Carrefour Code of Professional Conduct is a common frame
of reference setting out the Group’s values and commitments in ten
principles, applicable to all employees.
A 20-minute e-learning course has been developed and is available in
nine languages (French, English, Brazilian Portuguese, Traditional Chinese,
Spanish, Flemish, Italian, Polish and Romanian) to help employees
understand and assimilate the ten principles.
Ten countries embarked on the roll-out of the e-learning course in 2013,
starting with their directors. As a result, 100% of directors have completed
the training in Poland, Spain, China and Taiwan. Some countries have
already implemented the training more widely, including Spain (100% of
management), Romania (100% of employees) and Brazil, where almost
30,000 employees have been trained.
2.1.3.3 The Ethics Committees: oversight and assessment bodies
Since 2010, Carrefour has had a Group Ethics Committee and Country
Ethics Committees in each country where it operates, whose role is
to oversee and assess the application of the principles set out in the
Carrefour Code of Professional Conduct.
The Country Ethics Committees rely on professional misconduct/
malpractice alert systems set up in most Group countries, in accordance
with local regulations.
These systems operate both internally and externally to inform the country
Ethics Committee of any behaviour or situation that runs counter to
Carrefour’s ethical principles. If such a non-compliance does arise,
the Country Ethics Committee launches a detailed investigation and
a remedial action plan.
2.1.3.4 The Social and Ethical Charter: a frame of reference for Carrefour’s suppliers
The Group’s Social and Ethical Charter is an integral part of Carrefour’s
business contracts with suppliers of its own-brand products to ensure
that ethics are taken into account in day-to-day business practice. The
Group has developed a strict policy of social audits to ensure it is applied
in practice (pages 30 and 31 ).
2.1.2.2 The Quality and Sustainable Development Committee
The Quality and Sustainable Development Committee was created in
2012 at the instigation of the Chairman and Chief Executive Offi cer. Its
purpose is to develop and communicate beliefs about Carrefour’s role in
society and to ensure that everyone respects its fundamental principles.
The Quality and Sustainable Development Committee is chaired by
Carrefour’s Chairman and Chief Executive Offi cer and comprises the
General Secretary, Group Communications director, Group Human
Resources director, Group Merchandise director, Group Quality and
Sustainable Development director, and country and zone Executive
directors. The Committee met three times in 2013 to address the following
issues: working conditions in manufacturing, product quality, GMOs and
controversial substances.
2.1.3 BUSINESS ETHICS AND WORK AGAINST CORRUPTION

2013 REGISTRATION DOCUMENT 22
2 SOCIAL RESPONSIBILITYGovernance of CSR
2.1.3.5 Working against corruptionThe rejection of corruption in any form is one of the ten principles set
out in Carrefour’s Code of Professional Conduct.
Carrefour joined the United Nations Global Compact in 2001 and is
committed to compliance with the guiding principles of the OECD.
The texts cover corporate ethics, including the work against corruption
in particular.
As part of its efforts to strengthen its commitments in this area and to
share best practices, the Carrefour Group is also involved in the work
of the Business in Society Commission in the French section of the
International Chamber of Commerce (ICC France). Carrefour has also
belonged to Transparency International (France) since 2009.
Furthermore, rejecting any form of corruption is one of the commitments
signed by the Group’s suppliers through the Social and Ethical Charter
which is aimed at suppliers of Carrefour brand products, and the Ethical
Charter, which is aimed at all other suppliers.
In a further step, in 2012 the Group Ethics Committee launched the
introduction of statements of independence for those involved in the
purchasing process. By the end of 2013, statements of independence had
been very widely deployed in the majority of Group countries, in particular
for buyers of food products and the non-retail Purchasing department.
2013 REGISTRATION DOCUMENT 23
SOCIAL RESPONSIBILITY
2
Review of CSR approach in 2013
2.2 Review of CSR approach in 2013
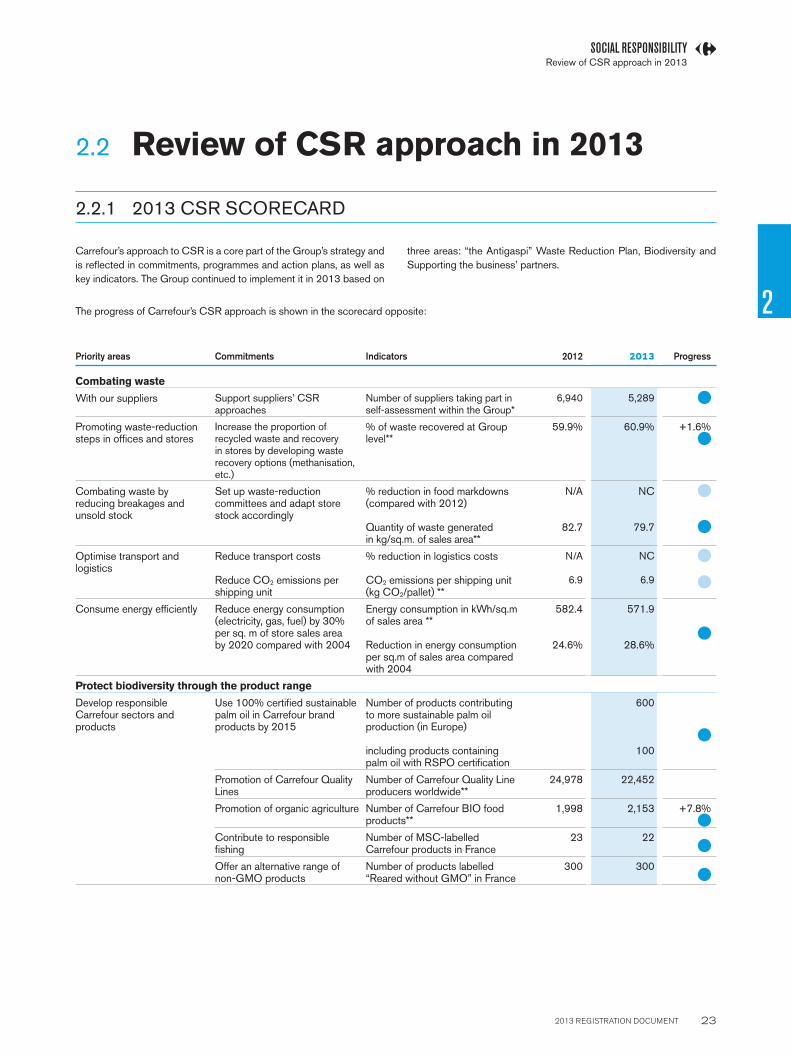
2.2.1 2013 CSR SCORECARD
Carrefour’s approach to CSR is a core part of the Group’s strategy and
is refl ected in commitments, programmes and action plans, as well as
key indicators. The Group continued to implement it in 2013 based on
three areas: “the Antigaspi” Waste Reduction Plan, Biodiversity and
Supporting the business’ partners.
The progress of Carrefour’s CSR approach is shown in the scorecard opposite:
Priority areas Commitments Indicators 2012 2013 Progress
Combating waste
With our suppliers Support suppliers’ CSR approaches
Number of suppliers taking part in self-assessment within the Group*
6,940 5,289
Promoting waste-reduction steps in offi ces and stores
Increase the proportion of recycled waste and recovery in stores by developing waste recovery options (methanisation, etc.)
% of waste recovered at Group level**
59.9% 60.9% +1.6%
Combating waste by reducing breakages and unsold stock
Set up waste-reduction committees and adapt store stock accordingly
% reduction in food markdowns (compared with 2012)
Quantity of waste generated in kg/sq.m. of sales area**
N/A
82.7
NC
79.7
Optimise transport and logistics
Reduce transport costs
Reduce CO2 emissions per shipping unit
% reduction in logistics costs
CO2 emissions per shipping unit (kg CO2/pallet) **
N/A
6.9
NC
6.9
Consume energy efficiently Reduce energy consumption (electricity, gas, fuel) by 30% per sq. m of store sales area by 2020 compared with 2004
Energy consumption in kWh/sq.m of sales area **
Reduction in energy consumption per sq.m of sales area compared with 2004
582.4
24.6%
571.9
28.6%
Protect biodiversity through the product range
Develop responsible Carrefour sectors and products
Use 100% certifi ed sustainable palm oil in Carrefour brand products by 2015
Number of products contributing to more sustainable palm oil production (in Europe)
including products containing palm oil with RSPO certifi cation
600
100
Promotion of Carrefour Quality Lines
Number of Carrefour Quality Line producers worldwide**
24,978 22,452
Promotion of organic agriculture Number of Carrefour BIO food products**
1,998 2,153 +7.8%
Contribute to responsible fi shing
Number of MSC-labelled Carrefour products in France
23 22
Offer an alternative range of non-GMO products
Number of products labelled “Reared without GMO” in France
300 300

2013 REGISTRATION DOCUMENT 24
2 SOCIAL RESPONSIBILITYReview of CSR approach in 2013
Priority areas Commitments Indicators 2012 2013 Progress
Support the business’ partners
Act as a responsible employer
Employee development Average number of training hours per employee within the Group**
17.2 16.5 (-3.9)%
Ensure our suppliers comply with human rights
Encourage diversity and equality of opportunity
% of women in management** 36.1
36.8
+2.1%
Ensure the social compliance of 100% of controlled products
Number of audits carried out in the Group in 2013
Number of supplier audits with an alert in the Group
1,044
N/A
1,333
428
Meet the expectations of all customers and consumers
Listening to customers Number of customer complaints and requests processed in a timely manner in France
69,700 67,805
Be a dynamic player in employment and the local economic fabric
Promotion of local suppliers % of sales of controlled products from national suppliers**
74.7% 73.1% (-2.1)%
Serving communities (Carrefour Foundation)
Combating food-related exclusion
Number of projects supported
Number of meal equivalents donated to food aid associations
36
N/A
48
+ €77 million
Objective achieved
Objective in progress
Objective behind schedule
* Six countries sold compared with 2012.
** The scope of indicators is detailed in the dedicated chapter for each topic.
2.2.2 2013 KEY PROJECTS
In addition to the major CSR commitments undertaken in 2013 (see
pages 31 to 63 ), this year Carrefour has particularly focused on two
projects, considered as major issues: the launch of its “Antigaspi Waste
Reduction Plan and respect for Human Rights. (see pages 24 to 31 ).
2.2.2.1 Carrefour’s Waste Reduction Plan and outlook for 2014
For Carrefour, “doing a good job” is primarily about reducing resource
consumption and seeking effi ciency in all its actions to ensure the
continuity of the business. Furthermore, Carrefour is convinced that
measures must be taken now to break the trend of wastefulness in
production and consumption models to ensure food safety and protect
the planet. Carrefour’s efforts to combat waste are focused primarily on
its stores but also upstream, at the agricultural and industrial production
stage and downstream, with customers and consumers.
The 7 projects of the “Antigaspi Waste Reduction Plan”
Carrefour developed in 2012 an extensive plan called “the Antigaspi
Waste Reduction Plan” and began to implement it in 2013. The aim of
this wide-ranging plan is to encourage all departments and entities to be
more effi cient and create more value. It incorporates not only economic
profi tability but also environmental issues by seeking to increase effi ciency
in the use of raw materials and energy.

2013 REGISTRATION DOCUMENT 25
SOCIAL RESPONSIBILITY
2
Review of CSR approach in 2013
All the Group’s countries and business functions were involved in the
design and were asked to identify possible areas of action for reducing
waste. The action plans were grouped into seven projects, which together
make up the Carrefour Waste Reduction Plan:
W p roject 1: Combating waste with our suppliers;
W p roject 2: Promoting waste-reduction steps in offi ces and stores;
W p roject 3: Combating waste by reducing breakages and unsold stock;
W p roject 4: Offering solutions to consumers;
W p roject 5: Reducing packaging waste;
W p roject 6: Optimising transport and logistics;
W p roject 7: Consuming energy effi ciently.
This strategic plan, deployed throughout the Group, is supported by the
Chairman and Chief Executive Offi cer and implemented directly by the
Country Executive directors. Each country has been tasked with setting
up the necessary governance structure for local deployment of the Plan
by identifying synergies and mobilising the departments concerned.
A working group at Group level, instigated by the General Secretary,
ensures the involvement of the departments concerned: Strategy, Human
Ressources , Finance, Communication, Transport & Logistics, Sustainable
Development and Risks & Compliance. A scorecard produced by the
Financial Consolidation department consolidates the results from all
countries on a monthly basis. The scorecard is monitored by the working
group and shared with both Country directors and Finance directors.
The “Antigaspi Waste Reduction Plan” is also an opportunity to create
value with various stakeholders. Internally, it shows Carrefour employees
on a daily basis how dedicated the Group is to its social commitments. It
is a unifying project, which also helps them to serve customers better by
offering solutions to help reduce waste and by creating opportunities for
dialogue or setting up awareness and solidarity projects together. This
“Plan is also an opportunity to cooperate with suppliers, as explained
below.
Deployment of the “Antigaspi Waste Reduction Plan” in 2013
The deployment of the waste reduction Plan began in most Group
countries in 2013. Some projects began in 2013 (projects 1 and 5),
others are well underway and currently being deployed (projects 2 and
4) and others are already achieving qualitative or quantitative results
(projects 3, 6 and 7).
RALLYING TO COMBAT FOOD WASTEAccording to estimates, a third of the food produced worldwide for human consumption is wasted. Everyone must take responsibility for reducing this ecological and economic debt by combating excess resource consumption. In concrete terms, awareness has resulted in the introduction of national, European or global programmes. Carrefour is contributing to these programmes by playing an active role in them and sharing its expertise in combating waste. As a result, in 2013 the Group signed the Pacte National de lutte contre le gaspillage alimentaire (National Pact to Combat Food Waste) with the French government, the target of which is to halve food waste by 2025. Carrefour has also signed the European Retail Agreement on Waste and is taking part in the Think. Eat. Save initiative set up by the UN Environment Programme.
In 2013, the Group has expressed its commitments by launching numerous initiatives with consumers, employees and suppliers, in stores and in conjunction with its partners. Examples include raising awareness in catalogues, on the Internet and on social networks, working with suppliers to eliminate BBD (Best-Before Dates), entering into contracts with associations that receive food donations, adapting promotional schemes, and changing packaging to extend the life span of freshly cut products and so on.
Project 1: Combating waste with our suppliers
In 2013, Carrefour began work on identifying waste-reduction
opportunities with its suppliers. In France, for example, it has worked
with suppliers to extend use-by dates and best-before dates: some
best-before dates have been eliminated on certain products where
they were irrelevant.
Furthermore, the 2013 Sustainable Development Awards for Carrefour
suppliers included a newly-created category dedicated to waste
reduction. The new category rewards the steps taken by suppliers to
reduce waste at every stage of the production process.

2013 REGISTRATION DOCUMENT 26
2 SOCIAL RESPONSIBILITYReview of CSR approach in 2013
Project 2: Promoting waste-reduction steps in offi ces and stores
An internal awareness and commitment campaign has been launched
across the Group. The campaign’s symbol is a bee, which embodies
the responsibility of an entire community and a balanced ecosystem.
The aim of the campaign is to encourage all employees to take steps to
combat waste in their day-to-day work. It is an opportunity to rally and
unite all employees, embody Carrefour’s CSR approach and identify
opportunities (such as a “hive of ideas”). It was implemented locally
in different ways in Group countries in 2013. In Brazil, the campaign
Gente Intelligente – Desperdicio Zero rallied employees in four areas:
saving energy, saving water, organising and planning business travel
and using the phone appropriately. In India, an awareness campaign
was launched on June 5 to coincide with Environment Day; reducing
waste from plastic cups, saving paper and energy and promoting car-
sharing. Romania organised a waste-reduction week with a competition
for the best waste-reduction ideas, including a car-free day and a “Much
More Green” challenge day, during which all employees came to work
dressed in green. In France, an event called Pain Perdu helped to raise
awareness amongst General Management during waste reduction week.
In Poland, 75% of head offi ce staff followed the Jestem Eko training and
information programme on saving energy and food both at home and
at work. In the stores, employees at all levels were made aware of how
to prevent and reduce waste to protect the environment and learned
about the waste-sorting regulations in place. The in-store programme
“Responsibly Every Day!” is aimed directly at customers.
In addition to raising awareness on how to reduce waste, the main aim
of which is to avoid producing waste, Carrefour has implemented waste
recovery wherever it operates. Cardboard, the primary source of waste
in stores, is sorted and recycled in all countries. Other types of waste
(plastic, scrap metal, glass, organic waste etc.) are sorted according to
the available local waste-recovery systems, which are becoming more
common year-by-year. In all countries, Group stores have been increasing
their efforts to fi nd networks able to recycle their waste.
Carrefour in France has set itself an ambitious target: 0% unrecycled
waste in stores within three years. Launched in 2013, the strategy has
been shared with waste recycling service providers.
As with packaging waste, stores are constantly seeking solutions to
recover organic waste. Recovery through methanisation has been
underway for many years, particularly in Belgium, France and Spain.
It was stepped up in France in 2013 in hypermarkets and around 100
supermarkets, primarily as a result of distributing an awareness pack
to optimise the collection of biowaste. Greater vigilance when sorting
waste not only allows more material to be recovered but also leads to
better-quality donations. In most of its countries, Carrefour stores work
in partnership with charities, to which they donate food products and
textiles (see page 61 ).
In 2013, Carrefour Brazil implemented a waste-management plan in
12 stores. The plan includes a comprehensive assessment of waste
produced by each store, specifi es the destination of the waste produced
and sets out a road map for achieving its objectives. A pilot waste-sorting
scheme was also set up at the Osasco hypermarket in the city of São
Paulo. This initiative has made it possible to reduce the quantity of waste
sent to landfi ll by 40%: waste paper, plastics, metal and glass are now
sent for recycling. Some organic waste is also recovered through the
animal feed sector. The plan is to roll out the scheme to all stores in Brazil
during 2014 and 2015. Similar programmes have been implemented in
the Group’s various countries: in Argentina, Basura cero (zero waste)
was deployed in seven stores in 2013 and will be extended to a further
two in 2014; in Spain, the Ecoinnovation project aims to increase the
recovery rate of plastic waste.
2013 2012 2011 % vs. 11
Proportion of waste recycled – including donations
(% of waste) 60.9 59.9 60.7 +0.4%
Like-for-like BUs (scope: 92% of 2013 consolidated sales, excl. VAT) - excluding: HM: AR/SM: IT, AR.
RECYCLED WASTE BY TYPE, INCLUDING DONATIONS TO CHARITIES
2013 2012 2011 % vs. 11
Recycled waste (in thousands of tonnes) 378 390 424 ( 10.8)%
Cardboard/paper waste 74% 73% 77%
Donations 9% 10% 8%
Organic waste 9% 8% 6%
Other waste (including plastic) 8% 9% 9%
Like-for-like BUs (scope: 92% of 2013 consolidated sales, excl. VAT) - excluding: HM: AR/SM: IT, AR.

2013 REGISTRATION DOCUMENT 27
SOCIAL RESPONSIBILITY
2
Review of CSR approach in 2013
Project 3: Combating waste by reducing breakages and unsold stock
Organic waste from non-edible food products represents a signifi cant
proportion of waste from stores.
To improve store effi ciency and avoid unsold stock, some Group countries
(Argentina, Belgium, Brazil, Spain, France, Italy, Poland, Romania and
Taiwan) have set up cross-functional waste-reduction committees
involving all the key players concerned. These monitor and analyse the
causes of waste, product by product and store by store. Following the
assessment, internal processes are improved to ensure that orders, stocks
and ranges match the needs of stores and customers more closely. For
example, waste-reduction coaches have supported French stores and
promotions on products with short use-by dates have been tested. The
Spanish teams have also been heavily involved in combating markdowns
and reducing stocks older than 18 months. Specifi c promotions have
been run with Para consumir hoy (Consume today) to avoid wasting
products whose expiration date is approaching. Spanish stores have
also undertaken destocking operations through outlet stores.
Project 4: Offering solutions to consumers
Carrefour is also working to offer solutions to consumers for reducing
waste in stores and at home. For example, the Group is adapting its
offering with certain products sold loose. It is also creating promotional
schemes suited to all customer profi les and informing consumers on
how to cook with leftovers, manage the contents of their refrigerators
or shop in keeping with their actual consumption.
A Tous conso malins (clever consumers) website in France (http://www.
anti-gaspillage.carrefour.fr/) is dedicated to best practices in waste
reduction on a day-to-day basis and numerous commercial and awareness
schemes were run in 2013: Dépenser moins, protéger plus (Spend
Less, Protect More) and Économisons l’énergie (Let’s Save Energy).
In June 2013, Carrefour Argentina disseminated awareness messages
in stores, on the radio and on social networks about saving energy and
water, reducing consumption of paper, recycling and reducing the use
of plastic bags. Carrefour in Taiwan has developed a website and pages
on social networks dedicated to waste reduction whilst promotional
offers have highlighted energy-saving products. The “Responsibly Every
Day!” programme regularly informs customers about reducing food and
non-food waste.
Throughout the Group, stores offer bins to collect waste brought in by
customers. Depending on local regulations, waste fl ows are different
and becoming more numerous each year, including batteries, electric
and electronic waste, printer cartridges, light bulbs and other lighting
consumables. Carrefour has also launched many awareness campaigns
targeting customers to encourage them to sort their waste.
Project 5: Reducing packaging waste
Store activities generate packaging waste of various kinds: mainly
secondary packaging (such as packing boxes for shipment) but also
paper, check-out bags and, to a lesser extent, plastic and scrap metal. The
Group has long been implementing a policy of reducing waste at source.
To reduce its waste in France and Spain, for example, the Group is
replacing the boxes and crates used for goods transport with reusable
plastic trays and is rolling out shelf-ready packaging, which consists of
designing secondary packaging so that it can be used to display products.
Shelf-ready packaging is lighter and lower in volume.
Taiwan has been using biodegradable plastic for some packaging
since 2007. As a result, in 2013, packaging was made from 81.5%
biodegradable plastic.
Warehouses also participate actively in reducing packaging-related
waste at source (page 57 ).
Project 6: Optimise transport and logistics
Carrefour is optimising its logistics to reduce its environmental impact
and carbon footprint (see page 56 ).
The Group is also continuing with its historic programmes to optimise
the number of kilometres travelled. Wherever improvement in effi ciency
is possible, Carrefour redesigns or adapts its logistics network. The
Group has rolled out consolidation centres for its European suppliers.
By pooling inventories, these centres make it possible to save an average
of 15-20% in distance travelled.
In 2013, Carrefour conducted assessments of the fi ll-rate of its vehicles
by measuring pallet heights in order to implement plans for increasing
this fi ll-rate. Cooperation between the logistics and store teams has
helped to adapt order and delivery processes, for example by pooling
deliveries to different store formats, training teams on optimising pallets
and improving the fi ll rate, as well as by changing the frequency of lorry
journeys to ensure fewer but more effi ciently-fi lled lorries are on the
road. The results for the countries that have implemented these projects
(Argentina, Belgium, Brazil, Spain, Italy, France, Poland and Taiwan) are
encouraging. In France, for example, the Opti’Transport project developed
by hypermarkets helped to remove 25,000 lorries from the roads in
2013, which equates to 10,300 tCO2 avoided (October 2012 to end
of September 2013; scope: total supply chain). The fi ll-rate in Spain has
increased from 60% to 75%.
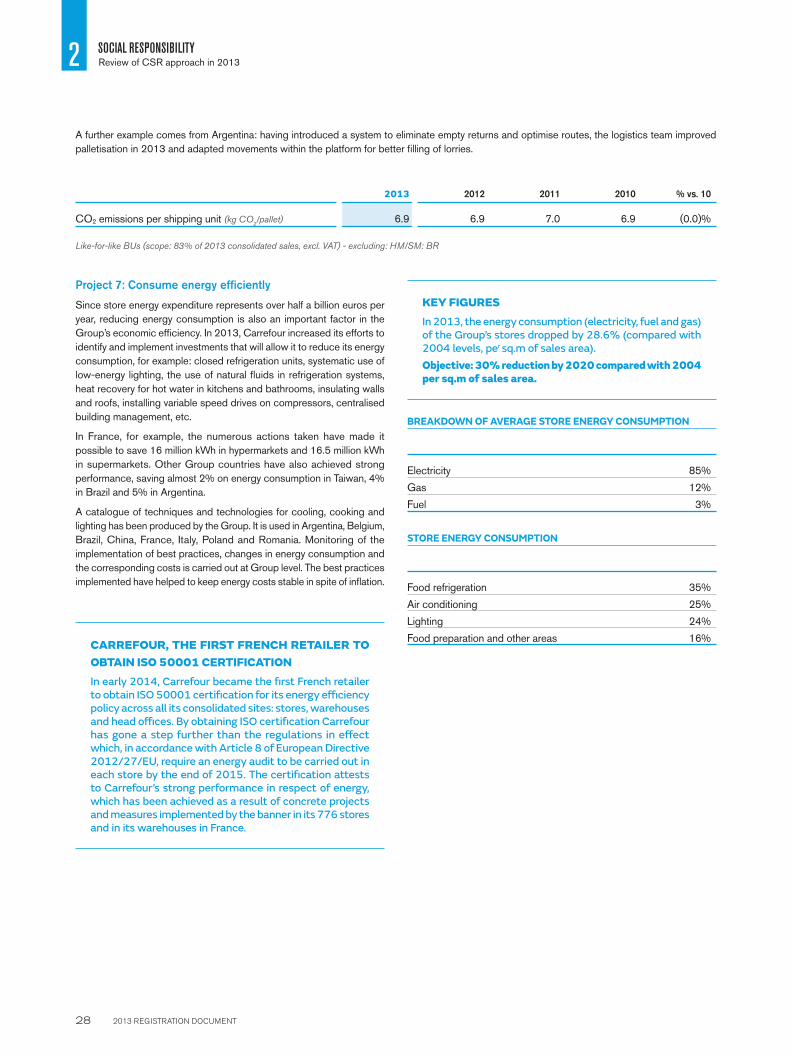
2013 REGISTRATION DOCUMENT 28
2 SOCIAL RESPONSIBILITYReview of CSR approach in 2013
A further example comes from Argentina: having introduced a system to eliminate empty returns and optimise routes, the logistics team improved
palletisation in 2013 and adapted movements within the platform for better fi lling of lorries.
2013 2012 2011 2010 % vs. 10
CO2 emissions per shipping unit (kg CO2/pallet) 6.9 6.9 7.0 6.9 ( 0.0)%
Like-for-like BUs (scope: 83% of 2013 consolidated sales, excl. VAT) - excluding: HM/SM: BR
Project 7: Consume energy effi ciently
Since store energy expenditure represents over half a billion euros per
year, reducing energy consumption is also an important factor in the
Group’s economic effi ciency. In 2013, Carrefour increased its efforts to
identify and implement investments that will allow it to reduce its energy
consumption, for example: closed refrigeration units, systematic use of
low-energy lighting, the use of natural fl uids in refrigeration systems,
heat recovery for hot water in kitchens and bathrooms, insulating walls
and roofs, installing variable speed drives on compressors, centralised
building management, etc.
In France, for example, the numerous actions taken have made it
possible to save 16 million kWh in hypermarkets and 16.5 million kWh
in supermarkets. Other Group countries have also achieved strong
performance, saving almost 2% on energy consumption in Taiwan, 4%
in Brazil and 5% in Argentina.
A catalogue of techniques and technologies for cooling, cooking and
lighting has been produced by the Group. It is used in Argentina, Belgium,
Brazil, China, France, Italy, Poland and Romania. Monitoring of the
implementation of best practices, changes in energy consumption and
the corresponding costs is carried out at Group level. The best practices
implemented have helped to keep energy costs stable in spite of infl ation.
CARREFOUR, THE FIRST FRENCH RETAILER TO OBTAIN ISO 50001 CERTIFICATIONIn early 2014, Carrefour became the fi rst French retailer to obtain ISO 50001 certifi cation for its energy effi ciency policy across all its consolidated sites: stores, warehouses and head offi ces. By obtaining ISO certifi cation Carrefour has gone a step further than the regulations in eff ect which, in accordance with Article 8 of European Directive 2012/27/EU, require an energy audit to be carried out in each store by the end of 2015. The certifi cation attests to Carrefour’s strong performance in respect of energy, which has been achieved as a result of concrete projects and measures implemented by the banner in its 776 stores and in its warehouses in France.
KEY FIGURESIn 2013, the energy consumption (electricity, fuel and gas) of the Group’s stores dropped by 28.6% (compared with 2004 levels, per sq.m of sales area).
Objective: 30% reduction by 2020 compared with 2004 per sq.m of sales area.
BREAKDOWN OF AVERAGE STORE ENERGY CONSUMPTION
Electricity 85%
Gas 12%
Fuel 3%
STORE ENERGY CONSUMPTION
Food refrigeration 35%
Air conditioning 25%
Lighting 24%
Food preparation and other areas 16%

2013 REGISTRATION DOCUMENT 29
SOCIAL RESPONSIBILITY
2
Review of CSR approach in 2013
CHANGE IN STORE ENERGY CONSUMPTION
2013 2012 2011 2010 % vs. 10
Energy consumption – electricity, gas and fuel (kWh/sq.m of sales area) 569 579 601 626 ( 9.0)%
Like-for-like BUs (scope: 83% of 2013 consolidated sales, excl. VAT) - excluding: HM: BR/SM: BR.
R 2013 fi gures verifi ed with a result of reasonable assurance.
Outlook for 2014
The second phase of the “Antigaspi Waste Reduction Plan” in 2014 will
focus on strengthening the projects underway and stepping up other
projects, notably: reducing packaging on Carrefour products and offering
solutions to help customers reduce waste at home.
2.2.2.2 Ensuring and supporting respect for Human Rights in the supply chain
2013 was marked by a number of industrial accidents, particularly in
Bangladesh. These disasters had a profound impact on the approach
to social responsibility in the supply chain, prompting all stakeholders –
NGOs, trade unions, suppliers, government, administrative bodies and
buyers – to work together to improve safety in factories.
The on-going effort to reduce occupational risks at suppliers led Carrefour
to focus, in 2013, on tightening the process of improving working
conditions in the supply chain.
Preventing Human Rights abuses in partnership with the FIDH
Human rights abuses vary by country. International organisations, such
as the UN and the World Bank, publish indicators that are used to
quantify problems in particular countries or regions of the world. Carrefour
has worked with the FIDH to produce a country map based on their
capacity to implement effective governance and combat the Human
Rights abuses observed. The tool helps the Group to target preventive
actions to improve the working conditions of its suppliers’ employees
and to adapt the overall approach to suppliers by country.
Carrefour’s teams use international information platforms (MAPLECROFT,
UBI, etc.) to keep indicators up to date and monitor the situation of
the countries in which its suppliers are based.
Within INFANS, the association created to run Carrefour’s partnership
with the FIDH, NGOs are identifi ed to implement local projects directly
with local people in contact with suppliers or their employees.
In 2013, for example, the INFANS association worked in conjunction
with the local NGO “SAVE” to instigate an awareness programme for
people living near factories in the Tirupur region of southern India to
inform them about workers’ rights.
Inspecting working conditions
The inspection of working conditions at manufacturing sites was
established in 2000. The process begins before an order is placed and
is a stipulation. The process was made more rigorous in 2013 and a
written reminder of Carrefour’s purchasing rules was sent to all Group
countries by the Chairman in September 2013. Training was provided
to all purchasing teams.
Carrefour’s requirements in terms of working conditions in manufacturing
are defi ned in its supplier charter, which is an integral part of the purchase
contract signed by every supplier prior to listing. As part of the ongoing
monitoring efforts, all potential suppliers identifi ed are subject to a social
audit, the result of which is included in the selection process on the same
footing as quality or commercial terms.
The process implemented by Carrefour consists of several levels of
inspection:
W inspection by Carrefour teams: the teams responsible for identifying
future suppliers carry out preliminary visual inspections of working
conditions. 171 employees from the teams in Asia were trained in fi re
safety in industrial environments in 2013 in order to identify high-risk
situations more effectively. A safety guide has also been published in
English and Chinese as a reminder of legislation and best practices;
W audit based on the ICS methodology prior to listing: before an order
can be placed, an outside company specialising in social audits carries
out a full verifi cation of the factory’s compliance with the ICS (Initiative
clause sociale) framework (see below). The framework is common
to several French retailers and incorporates the requirements of the
Carrefour supplier charter. The section on safety was strengthened in
2013, with numerous control points added. Only suppliers who have
achieved an adequate level of compliance following the audit are listed
and authorised to produce Carrefour products;
W ICS audit during manufacturing: unannounced audits are carried
out throughout the commercial relationship to check that working
conditions remain in line with the requirements of the supplier charter.
In the event of non-compliance, a corrective action plan is established
in conjunction with the supplier and a new audit is carried out to check
that it has been implemented; and

2013 REGISTRATION DOCUMENT 30
2 SOCIAL RESPONSIBILITYReview of CSR approach in 2013
W specific and second-opinion audits: in addition to the audits and
inspections described above, Carrefour appoints specialist external
companies to carry out checks on specifi c points. In 2013, Carrefour
carried out 146 fi re-safety audits in Asia to check for alarms, equipment,
etc. and 10 controls on the quality of social audits. These second-
opinion audits have resulted in discussions with the audit providers
to improve processes.
Mobilising all players
During his speech to the OECD, Carrefour’s General Secretary reaffi rmed
the fact that “the respect of working conditions in manufacturing should
not be a matter of competition”. This position guides our action on respect
for human rights and has prompted Carrefour to promote multiparty
agreements on these subjects.
Agreement on fi re and building safety in Bangladesh
In May 2013, Carrefour was one of the fi rst retailers in France to sign
the “Fire and Building Safety Bangladesh” agreement. The agreement
now has more than 130 signatories and provides for inspections of the
structure of buildings, fi re safety and dissemination of the list of over
1,700 factories concerned. Progress towards implementation of the
agreement can be followed on the website www.accordbangladesh.com.
GSCP and ICS
Carrefour was involved in the creation of the Initiative clause sociale
(ICS – Social Clause Initiative) which brings together 19 retail banners.
The ICS enables members to share a common Code, methodology and
audit database. Each member enters data by incorporating results from
social audits carried out at their suppliers’ sites. Carrefour has contributed
about 50% of the audit volume since the initiative was launched.
In 2006, the Group worked alongside three other international banners
to launch the Global Social Compliance Programme (GSCP). Bringing
together 34 major players in the retail and industrial sectors, the
programme promotes the continuous improvement of workers’ conditions
based on the worldwide harmonisation of standards and tools. The
GSCP has developed a standard Code based on best practices, and
also an audit methodology, criteria for selecting auditors, an environmental
benchmark and an equivalence process, which help to avoid duplication
of social audits at production sites.
In September 2013, Carrefour fi nalised the equivalence process for
its own tools (supplier charter and audit methodology) against GSCP
standards and shared the results with some of its competitors. This
involved the Group in carrying out a self-assessment of the methodology
it uses to audit working conditions in factories compared with the best
practices developed by the GSCP and then submitting it to a panel of
experts for validation. The process provides a means of carrying out an
analysis of the strengths and weaknesses of the existing control system
with a view to continuing improvement.
The strengths of the social compliance monitoring system for Carrefour
suppliers are as follows:
W the system covers all the sections identifi ed by the GSCP;
W audits are conducted in accordance with the GSCP’s general
methodology (76% of total compliance).
One area for improvement has been identifi ed, namely the need to
strengthen the documentation of procedures for checking compliance
with the supplier charter, in particular in terms of combating certain forms
of discrimination or applying minimum salary levels.
Monitoring compliance by our suppliers
Supplier monitoring relies mainly on the social audits carried out by
specialist audit companies. Audits take place prior to a supplier being
listed (initial audit) and during Carrefour’s relationship with them (follow-
up audits). Suppliers must achieve a minimum level of compliance with
the supplier charter at the initial audit as a condition of being listed. The
follow-up audit ensures that the working conditions initially checked are
being maintained and that the supplier has implemented the improvements
based on the action plan recommended during the previous audit.
KEY FIGURESIn 2013, 44% of the 1,333 social audits carried out were follow-up audits.
146 safety audits in Asia.
All Carrefour product suppliers located in sensitive (source: Mapplecroft ) countries are audited prior to listing.

2013 REGISTRATION DOCUMENT 31
SOCIAL RESPONSIBILITY
2
Review of CSR approach in 2013
Number of social audits (including initial audits*) 2013 2012
Bangladesh 59 (33) 58 (43)
China 944 (489) 785 (384)
India 100 (50) 55 (45)
Other countries 231 (173) 146 (104)
TOTAL 1,333 (745) 1,044 (576)
* Initial audits: audits to check compliance with the social charter prior to listing.
Number of audits with alerts* Initial Follow-up
Bangladesh 28 22
China 156 105
India 25 19
Other countries 49 24
TOTAL 258 170
* An alert is a critical point of non-compliance identifi ed during the audit and requiring immediate action by the supplier.
2.2.3 SOCIAL RESPONSIBILITY
Carrefour’s human resources policies are intended to ensure good working
conditions for all its employees: the possibility of career progression, a
motivating package of remuneration and welfare benefi ts, communication
and social dialogue, and protection of their health, safety and well-being
at work.
2.2.3.1 Carrefour’s human resources policies
For over 50 years, the Carrefour Group has been regularly improving its
human resources policies in accordance with local regulations and its
international commitments. Its main objectives are to:
W attract and retain the loyalty of talented employees to ensure it has
the resources to cover its present and future needs;
W monitor employees’ career development;
W defi ne equitable and motivating remuneration and employee benefi ts
policies;
W contribute to creating a culture of collective development and
performance;
W promote principles of diversity and non-discrimination;
W ensure the quality of social dialogue.
Carrefour has developed a set of documents and tools to deploy its
policies, designed to support high-quality management of human
resources at all levels and across the Group’s various entities.
One illustration from 2013 is the Group Human Resources (HR)
department’s production of a document setting out the Group’s operating
rules: “Group Rationale, Missions, Policies and Rules”. This ensures that
the Human Resources community shares the same rules on organisation,
career management, training, industrial relations, remuneration and
employee benefi ts, and management of senior managers. The document
has been sent out to all of Carrefour’s Executive directors and Human
Resources directors in all countries. Eleven of these rules form part of the
Group’s internal control framework; audits will be carried out to ensure
they are being implemented in the countries.
As a second illustration, the “Eight Human Resources Fundamentals”
were introduced in 2012 and implemented in all Group stores in 2013
(excluding China), giving store directors and their managers tools
to make even greater progress in recruitment, induction, objective-
setting, remuneration and employee benefi ts, employee recognition,
communications, training and career management. These contribute
to improving performance by strengthening employees’ commitment.
An intranet site, available in all Group languages, makes it easier for
managers to access tools and encourages them to share best practices.

2013 REGISTRATION DOCUMENT 32
2 SOCIAL RESPONSIBILITYReview of CSR approach in 2013
Two initiatives were instigated by the Group HR department in 2013 to
speed up the inclusion of the HR Fundamentals in managerial practices:
W sharing best practices between stores, regions and countries in relation
to setting individual objectives, recognition, communications, training
and career management;
W the HR Fundamentals catalyst, which consists of speeding up their
implementation in a number of pilot stores in Argentina and Poland,
with the aim of demonstrating improvements in economic and social
performance.
2.2.3.2 Carrefour’s men and women – Workforce presentationAt year-end 2013, Carrefour had 364,795 employees in 11 countries. This section sets out details of the Carrefour Group’s workforce at year-end
2013 and like-for-like changes.
Breakdown of workforce by geographic region
Workforce by geographic region 2013 2012 % vs. 12
Europe region 199,325 199,591 ( 0.1)%
Latin America region 88,814 86,672 +2.5%
Asia region 76,656 71,717 +6.9%
TOTAL GROUP 364,795 357,980 +1.9%
Breakdown of employee numbers by format
Employees by format 2013 2012
Hypermarkets 72. 7% 72.0%
Supermarkets 16.3% 17.7%
Others 11.0% 10.3%
TOTAL 100% 100%
Workforce by age group
Workforce by age group 2013
> Age 65 0.1%
Age 65 ≥ age > 60 0.6%
Age 60 ≥ age > 55 3.4%
Age 55 ≥ age > 50 6.4%
Age 50 ≥ age > 45 9.7%
A ge 45 ≥ age > 40 13.3%
Age 40 ≥ age > 35 14.2%
Age 35 ≥ age > 30 15.7%
Age 30 ≥ age > 25 15.6%
Age 25 ≥ age ≥18 19.6%
< Age 18 1.4%

2013 REGISTRATION DOCUMENT 33
SOCIAL RESPONSIBILITY
2
Review of CSR approach in 2013
Breakdown by gender (proportion male-female)
The Carrefour Group had 57.7% women in the workforce at the end of 2013. The Group’s active policy of promoting equality between men and
women is described on page 34 .
Proportion of women by category 2013 2012
Senior Managers 11.4% 11.3%
Directors 21.7% 21.1%
Managers 37.9% 37.1%
Employees 60.3% 60.1%
TOTAL GROUP 57.7% 57.5%
Breakdown of workforce by category and type of contract
Workforce by category 2013 2012
Senior Managers 0.1% 0.1%
Directors 0.5% 0.5%
Managers 10.6% 10.5%
Employees 88.8% 88.9%
Workforce by type of contract 2013 2012
Permanent contract 93.4% 93.5%
Fixed-term contract 6.6% 6.5%
New hires and departures
Number of new hires 2013 2012
Permanent contract 98,858 95,027
Fixed-term contract 77,232 69,347
Departures by reason 2013 2012
Dismissal 19,021 22,022
Resignation 53,668 53,577
End of probation period 25,271 23,640

2013 REGISTRATION DOCUMENT 34
2 SOCIAL RESPONSIBILITYReview of CSR approach in 2013
2.2.3.3 A proactive policy of supporting diversity
As a multi-local, neighbourhood Group, Carrefour has always been
committed to refl ecting and incorporating diversity and the social mix of
the areas where it operates. With some 100 nationalities represented,
diversity has long been a reality within the Group: its teams are made up
of men and women of all ages, all backgrounds and varied career paths.
Carrefour is proud of its diversity, which it views as a valuable asset.
Very early on, Carrefour made a commitment to promote diversity and
use its benefi ts. Every year, it enters into new commitments to confi rm its
global and local approach. In 2013, for example, the Group focused on:
1. the deployment of the Women Leaders programme to support equality
between men and women;
2. raising awareness amongst managers of combating discrimination
and managing diversity; and
3. actions in support of employment for disadvantaged groups.
The deployment of the Women Leaders programme to support equality between men and women
Women represent over 57% of Carrefour’s total workforce, but are not as well represented at the highest management levels. In 2013, for example,
36.8% of the Group’s managers were women.
2013 2012 2011 2010 % vs. 10
Percentage of women in management 36.8% 36.1% 35.2% 34.5% +6.7%
Like-for-like BUs (scope: 100% of 2013 consolidated sales, excl. VAT).
The Women Leaders programme, launched in 2011, affi rms the Carrefour
Group’s ambition in respect of gender equality. The programme is based
on four areas of work:
W each country’s defi nition of its own objectives;
W making women more visible by promoting their achievements;
W making gender equality a core element in career development
decisions; and
W promoting work/life balance.
In 2013, the Group HR department decided to speed up the process
of supporting gender equality and promoting women at all levels of
management and responsibility. This has resulted in a number of initiatives,
described below, following which concrete actions will be implemented
in all countries.
A day dedicated to gender equality with the Group’s senior managers
On November 28, 90 of the Group’s senior managers met at a Women
Leaders convention and worked on identifying concrete steps to improve
gender equality at a country level. The aim of the convention was to
strengthen the action plans already implemented by the Women Leaders
programme and defi ne concrete steps designed to remove any obstacles
identifi ed.
A survey sent to all Carrefour’s female directors and Senior directors
The survey was conducted with 427 women in director and Senior director
posts in order to identify the obstacles to women’s career development
at Carrefour by country and gather their suggestions on what actions
should be taken.
Signature of the UN Women’s Empowerment Principles
The UN Women’s Empowerment Principles are seven principles supported
by UN Women and the Global Compact. Carrefour’s signature of the
principles makes it the fi rst business in the retail and mass merchandising
sector to join the 600 businesses that have already signed around the
world. The seven principles are based on a commitment to and progress
towards equality between men and women. Based on the agreement, the
Group will report annually on the practical actions taken at a country level.
Since the launch of the Women Leaders programme, multiple initiatives
have also been decided on in various countries. Argentina, for example,
has implemented an exclusive recruitment programme for young women
with high potential. The female employees recruited through the scheme
take part in a month-long induction course followed by eight months
of support from a mentor and trainer. They have direct access to the
Executive directors at monthly breakfast meetings. In France, a mentoring
programme to support the development of 30 high-potential women
has been implemented to work on their leadership skills with the help
of volunteer mentors drawn from Carrefour France managers. The
programme aims to encourage them to take up positions of responsibility.
In addition to its various career-development initiatives for women, the
Group has developed ways of organising work that enable employees
to reconcile their working and family lives (including work-schedule
pooling, job versatility, the Meeting Charter in Spain and remote working
in Belgium, see page 40 ).

2013 REGISTRATION DOCUMENT 35
SOCIAL RESPONSIBILITY
2
Review of CSR approach in 2013
Raising managers’ awareness of combating discrimination and managing diversity
Diversity lies at the heart of the Group’s social model. Carrefour combats
discrimination primarily by running dedicated training courses and raising
awareness amongst managers. Every year, Carrefour’s various entities
develop initiatives that refl ect their local context.
Carrefour Brazil, for example, has created a Diversity Committee, whose
role is to ensure the implementation of the Diversity Programme, the Code
of Professional Conduct and compliance with regulations. It puts forward
and supports action plans, tracks indicators of the Group’s employees
in Brazil and monitors competition. In 2013, following the decisions of
the Diversity Committee, the Diversity policy was disseminated to all
managers in Brazil. They received an awareness manual about the policy
to help its immediate implementation. All Store Managers and directors
(349 people) have taken part in awareness sessions along with 80
employees of service providers in charge of store security.
In France, the theme of diversity has been added to the HR Fundamentals
for supermarkets and will be communicated in an awareness campaign
for store directors in 2014. Hypermarkets have continued to run training
courses in non-discrimination during recruitment; these are aimed at
store directors, section managers and managers. 973 employees were
trained in 2013.
Actions in support of employment for disadvantaged groups
Promoting youth employment
See section: Stores driving growth
Concrete actions to integrate disabled workers and keep them in employment
At the end of 2011, Carrefour was the fi rst large business entering into
a partnership agreement with the Disability Network of the International
Labour Organisation (ILO) in order to work on promoting, alongside
community organisations and other institutions, the employment of the
disabled around the world. Through this partnership, Carrefour undertakes
to promote actions in support of employment for people with disabilities.
Various countries have continued numerous programmes to help recruit,
integrate and support disabled employees.
Carrefour Poland has long been committed to employing disabled
people and was rewarded in 2013 by the regional “Ice Breaker” prize, a
competition organised at a national and regional level under the patronage
of the wife of the Polish President. Carrefour was awarded fi rst prize in
the “Open Labour Market” category. In 2006, Carrefour Poland was the
fi rst business to employ people with a hearing impairment and employed
over 202 disabled people by year-end 2013.
In France, the logistics division has renewed an agreement to develop
employment for people with disabilities for the period 2013-2016. The
division intends to use the agreement to pursue its commitment by
capitalising on the experience it has gained to continue progress in
recruiting disabled people, keeping them in employment and supporting
their training, integration and career development.
2013 2012 2011 2010 % vs. 10
Percentage of employees recognised as having a disability 2.8% 2.8% 2.6% 2.4% + 15.9%
Like-for-like BUs (scope: 100% of 2013 consolidated sales, excl. VAT).
2013 2012 2011 2010 % vs. 10
Number of employees with a disability 9,709 9,887 9,248 8,813 + 10.2%
Like-for-like BUs (scope: 100% of 2013 consolidated sales, excl. VAT).
Older workers’ employment and working conditions
Carrefour pays particular attention to employing older employees and
ensuring they enjoy good working conditions in the later stages of their
careers.
In 2013, the French entities signed inter-generational agreements
designed to defi ne concrete actions to support young people’s integration
into the workplace through access to a permanent employment contract.
The agreements also aim to support the recruitment of older people and
help keep them in employment, as well as ensuring knowledge and skills
are passed onto younger generations.
Carrefour Belgium developed an action plan following a detailed
analysis of the employment of staff over the age of 45. It includes the
establishment of two working groups, whose aim is to do more to keep
employees over the age of 45 in work. Numerous proposals made by
the Works Council are being considered, ranging from well-being to
career development, support for internal transfers, skills and training for
this category of employees.

2013 REGISTRATION DOCUMENT 36
2 SOCIAL RESPONSIBILITYReview of CSR approach in 2013
2.2.3.4 Dialogue as a tool for social progress
The Carrefour Group has long been committed to consultation and
high-quality internal and external social dialogue in support of individual
and collective development.
The culture of social dialogue at Group level
The agreement signed in 2001 by Carrefour with the UNI (Union Network
International) was a refl ection of the historic practice of social dialogue
carried out by the Group and its various activities. It ensures permanent,
constructive dialogue with Carrefour, the UNI and its affi liates. The
agreement guarantees respect for fundamental rights at work. Carrefour
has thus affi rmed its respect for union rights and the right to collective
bargaining for the benefi t of its employees all over the world.
In Europe, Carrefour has been participating for over 10 years in sector-
specifi c European social dialogue, by playing an active role at meetings
of the Social Dialogue Commission within the Fédération Européenne
du Commerce (Eurocommerce).
Carrefour created one of the fi rst European Works Councils, the
European Information and Consultation Committee (EICC), whose
constitutional agreement was initially signed in 1996 with the former
FIET (now part of the UNI). A supplementary agreement signed in 2011
has helped to strengthen social dialogue as well as the operation of the
Committee. Since 2012, an additional training/information meeting has
been organised on a theme defi ned in advance, for example, equality
between men and women. In 2013, the meeting focused primarily
on new communications techniques and employing young people. In
addition, a meeting of the EICC’s’ Executive Committee was this year
again devoted to new technologies, in accordance with the supplement
to the European Committee’s constitution signed in 2011. Finally, a
newsletter and website launched in 2012 provide continuous and detailed
information on various subjects related to the operation of the Committee,
including meeting minutes, disseminating best practices and offi cial
Group communications. These tools ensure that Committee members
are kept informed throughout the year.
ECIC meetings are a true forum for information and idea sharing.
Numerous speakers are invited to talk on a wide range of subjects
related not only to Carrefour’s activities but also its economic and
competitive environment. The CSR approach and best practices are
also communicated and promoted. Organisational changes are outlined by
the Human Resources directors of the countries concerned. The Group’s
General Management and Executive Management in France or Europe
intervene regularly in discussions that are always highly appreciated.
Advancing social dialogue in the countries
The quality of social dialogue at Carrefour goes beyond simple regulatory
requirements and is implemented in Group countries. Discussions and
consultation with staff or trade union representatives can take place
at a national or transnational level, depending on the needs identifi ed
locally. Organised by Carrefour and the UNI, they support the gradual
improvement of social dialogue in certain regions in which the Group
operates. A meeting to exchange and share views with representatives
of Brazilian and Argentinean trade unions was organised in October
2013 as part of this culture of promoting social dialogue.
Since 2010, Carrefour Romania has been engaging in constructive,
effective social dialogue with its staff representatives. Following support
from the UNI for the creation of a trade union in the hypermarkets, the
same development has been implemented in the supermarkets this year.
Social dialogue in Poland was particularly active in 2013: three meetings
with the Staff Council, working groups with the trade union (Solidarnosc)
to identify practical solutions, and over 50 open days organised in stores to
give trade union representatives the opportunity to meet with employees.
Respect for union rights and strong, constructive social dialogue have
ensured the presence of staff representatives in all Group activities.
Support for business reorganisations
The agreements signed by Carrefour in France on Gestion Prévisionnelle
des Emplois et des Carrières - GPEC (job and career planning) not only
satisfy legal obligations but also create a context and a useful discussion
forum for topics related to organisational changes in the business. They
are a means of supporting the implementation of new technologies by
identifying their consequences and prioritising anticipation and ensuring
the quality of support provided to the employees concerned.
This was the case in 2013, for example, during the implementation of the
voluntary redundancy plan supported by provisions of the GPEC and
Method agreement signed at the end of 2011. The voluntary redundancy
plan aimed to eliminate 533 posts in central departments. The objective
was to make these leaner and improve effi ciency whilst freeing up
resources for making stores more welcoming and more competitive.
All employees affected by the plan have been supported in their job
search by specialist fi rms and no employee has left without their plan
being validated by the fi rm concerned. By the end of 2013, 93% of
employees had found alternative employment, set up their own business
or embarked on long-term training.
Similarly, the French General Management team is planning for the
consequences of its new site in Massy and its creation through a joint
committee of management and staff representatives set up for this
purpose (the Massy 2014 project).
Overview of collective bargaining agreements
The following table shows the main agreements signed in 2013. This
list is not exhaustive. Clauses added to previously-signed agreements
in 2013 are not listed.
2013 REGISTRATION DOCUMENT 37
SOCIAL RESPONSIBILITY
2
Review of CSR approach in 2013
Country/format New for 2013
Romania Collective bargaining agreement 2013-2014
Italy Collective bargaining agreement 2013-2016
France/Hypermarkets
Inter-company agreement on the exercise of trade union rights and the operation of staff representation bodies at a national level
Implementation of a Social Pact as part of the Mandatory Annual Negotiations
Agreement on the inter-generational contract
France/Supermarkets
Agreement on training and career development
Agreement on the inter-generational contract
France/CAF Agreement on gender equality in the workplace
France/SDNH
Company-wide agreements on: W gender equality in the workplace
W integration of disabled workers and keeping them in employment
W the inter-generational contract
An overview of the health and safety agreements signed is shown on page 39 .
Employee consultation and engagement
Listening to employees and securing their commitment are key elements
in labour relations; each entity implements mechanisms for listening to
employees’ expectations, which contribute to developing the Group’s
culture and fostering commitment.
In 2013, for example, Carrefour Belgium ran a satisfaction survey based
on the Group survey carried out in 2011, designed to measure the impact
of the programmes introduced following the fi rst survey and strengthen
actions in priority areas. Working sessions were led by an independent
partner, with the aim of listening anonymously to the expectations and
diffi culties expressed by employees. A summary was sent to each store
and action plans implemented.
Carrefour Spain ran a survey in 2013 called “We’re improving thanks to
your opinion” as a way of analysing the working environment in stores.
Six working groups with about 15 people each were set up.
The Carrefour Group also conducted a study on “Generation Y” as part of
the Carrefour Master programme in 2013, with the aim of examining the
commitment of the younger generations (see page 42 ). Generation Y (Gen
Y) refers to people aged 18 to 34, who in 2030 will represent the main
category of Carrefour customers and who already represent a signifi cant
share of Group employees, since 21 % of staff were under the age of 26
in 2013. The survey, called “How do our organisation and managers need
to change to stimulate commitment from the younger generations?” was
carried out in conjunction with country Human Resources departments
and involved 12,000 employees. Each country received detailed results
of the survey to produce an action plan appropriate to its context.
2.2.3.5 Increased vigilance on health and safety at work
The Group made a commitment at a very early stage to a proactive policy
of improving its employees’ working conditions in terms of both safety
and physical and psychological health. From the outset, this approach
has been characterised by respect for the operational teams and listening
to their needs, introducing fl exible working practices and a commitment
to a better work/life balance. In each of its countries, Carrefour respects
the legislation in place regarding the prevention of occupational illnesses.
Prevention of workplace accidents
In addition to regulatory requirements, the Group ensures that all its
employees understand health and safety rules, runs preventive training
(on in-store safety, including health, movements and working posture)
and awareness campaigns, establishes procedures in the countries
where it operates and performs regular audits. To reduce the number
and seriousness of workplace accidents, the Carrefour Group also
puts risk assessment and prevention at the heart of its health and safety
management system. Many countries have set up dedicated organisational
structures in the past few years.
Carrefour France created a dedicated body for workplace health and
safety in 2012. Several major projects were launched, such as the
prevention of psychosocial risks, the appointment of a company doctor
for France and the prevention of workplace risks associated with the
drive-in format. The latter resulted in the signing of two partnership
agreements with the Île-de-France health insurance fund (Cramif – Caisse
Régionale d’Assurance Maladie d’Ile-de-France) on January 25, 2013,
the fi rst on drive-in collection points and the second on workplace risk
prevention offi cers’ training for Carrefour France.

2013 REGISTRATION DOCUMENT 38
2 SOCIAL RESPONSIBILITYReview of CSR approach in 2013
RATE OF WORK ABSENCES AND ACCIDENT FREQUENCY AND SERIOUSNESS
2013 2012 2011 2010 % vs. 10
Rate of absence due to workplace and travel-related accidents 0.61% 0.60% 0.61% 0.62% ( 1.0)%
Like-for-like BU fi gures (76% of 2013 consolidated sales excluding VAT) - excluding: HM: BR, IT and SM: BR, IT.
2013 2012 2011 % vs. 11
Workplace accident frequency rate (number of accidents/millions of theoretical work hours) 27.5 27.0 29.7 ( 7.4)%
Workplace accidents’ seriousness level (number of days absent due to workplace accident/1,000 work hours). 0.70 0.69 0.70 + 0.0 %
Like-for-like BU fi gures (76% of 2013 consolidated sales excluding VAT) - excluding: HM: BR, IT and SM: BR, IT.
In order to assess in-store employee health and safety risks, since October
2013 specifi c training has been made available to store directors which
will run until April 2014. The training enables them to ensure compliance
with regulations in their stores, and to sustain their actions over time.
In 2013, Carrefour Italy implemented a wide-reaching plan aimed at the
prevention of accidents and psychosocial risks and strengthened the
employees’ medical follow-up with 17 new doctors across the country
and medical consultations whose regularity depends on the employee’s
position. Health and safety training sessions were provided for over 6,000
employees. New personal safety equipment has been issued, after having
been tested by the employees themselves. Lastly, defi brillators have been
installed in 38 stores where the employees have been trained on their use.
Carrefour Spain carried out in-store psychosocial risk assessments in
2013, and launched appropriate action plans as a result.
Prevention of occupational illnesses
Workplace ergonomics and combating musculoskeletal problems
The main occupational illnesses identifi ed by the Carrefour Group are
musculoskeletal problems. Numerous preventive actions are taken to
avoid them.
Carrefour stores have been given ergonomic equipment designed to
reduce handling operations. French supermarkets and hypermarkets,
for example, are equipped with high-lift pallet trucks or manual trucks in
smaller stores. Platforms have been specially created in supermarkets
to allow employees to reach the top shelves easily when placing goods
on display. To eliminate restrictive movements and postures and avoid
the risk of falling, French supermarkets installed tables and platforms
for restocking shelves in all stores in 2013. Pilot schemes are underway
in the hypermarkets.
Carrefour Brazil equipped 54 new stores with ergonomic cash tills in
2013.
In 2013, Carrefour became one of the fi rst brands in the trade and mass
retailing sector to remove phenol from its till receipts and loyalty tickets.
As a precautionary measure, Carrefour had already removed bisphenol
A from its till receipts in 2011 and substituted it with bisphenol S, then
considered to be the best solution available on the market.
Preventing stress and psychosocial risks
Over the past 15 years, stress has emerged as a major psychosocial risk
faced by companies. The Carrefour Group’s preventive approach here
aims to assess the main risk factors and support the development of
appropriate action plans. Numerous actions have been taken at local level
at the instigation of countries and entities, such as: stress management
training, a free remote listening and psychological support system, in-
store risk assessments followed by corrective action plans.
In 2013, Carrefour France continued its mission to prevent psychosocial
risks in all of its entities:
W the hypermarkets piloted a psychosocial risk analysis method in three
stores with a view to expanding this to all other sites, which will then
independently defi ne and implement their own action plans;
W the supermarkets initiated an action plan with three priority areas:
prevention of psychological or sexual harassment, support for risks
of antisocial behaviour and for victims of aggression, and prevention
of workplace stress;
W the Logistics action plan also comprises three areas: workplace
and management relations, work’s organisation and requirements,
consideration of employee expectations;

2013 REGISTRATION DOCUMENT 39
SOCIAL RESPONSIBILITY
2
Review of CSR approach in 2013
W the head offi ces raised manager awareness of psychosocial risks over
the course of 20 sessions attended by 226 people; and
W the three-year action plan on preventing strenuous working conditions
and psychosocial risks, initiated in 2012 by the Logistics entity,
continued in 2013.
In Carrefour stores in France, training courses on stress management
and “SOS Confl ict” courses to help employees manage sometimes
diffi cult situations with customers (from basic dissatisfaction to verbal
and physical aggression or hold-ups) continued in 2013:
W some 139 executive managers and 605 employees and store managers
were given training in hypermarkets and supermarkets on the subject
of stress management, with the aim of identifying stress linked to
workplace activities, and managing and adapting working methods to
optimise performance and improve the quality of working life;
W 1,925 employees took part in the “SOS Confl ict” course in
supermarkets and hypermarkets. A total of 27,330 have followed
the course since 2004.
As part of a general programme for the improvement of organisation and
working conditions, Romania offered training for its check-out assistants:
“Small gestures for great business” provides reminders of the right
attitudes to adopt, the keys to successful communication and how to
manage confl ict situations with certain clients.
Promoting employee well-being
To ensure that all employees fl ourish in their professional activities,
Carrefour focuses its actions on promoting work/life balance and supports
the introduction of programmes to improve well-being in the workplace.
Work/life balance
In 2008, Carrefour was one of the fi rst 30 groups in France to sign the
Parenthood Charter and to commit to implementing concrete initiatives
in this area. Since then, Carrefour has also been a member of the
Observatoire de la parentalité en entreprise (corporate parenthood
monitoring group).
In France and Spain, agreements on the equal treatment of men and
women ensure that employees have more opportunity to reconcile their
working and family life. Among the measures taken are: adjustments to
working hours, inter-company daycare centres, adjustments to paternity
leave, assistance in fi nancing childcare, etc.
Work-schedule pooling (see page 40 ) also helps ensure a better work/
life balance.
Programmes to promote well-being
Since the issue of an improved working life is at the heart of current
social thinking, Carrefour has implemented management and social skills
programmes intended to improve working conditions.
In Spain, the Carrefour Life programme, a social project aimed at
employees and their families, offers a range of benefi ts, training courses
and group activities designed to help people combine their private and
working lives. Over 9,000 people took part in these activities in 2013:
Padel tennis tournament, company sports, Christmas party, and lip dub
competition for staff, golf tournament, and Christmas party for retired
staff, etc. Thanks to Carrefour Life, 850 of the staff’s children attended
summer camps at the country’s biggest sports clubs.
Audits targeted the improvement of working conditions in Italy in 2013,
and more comfortable protective equipment was made available as part
of a preventive health and safety plan.
Overview of agreements signed regarding health and safety at work
The table below shows some of the agreements and supplementary
agreements signed in 2013 with trade unions or staff representatives on
workplace health and safety. This list is not exhaustive. Clauses added
to previously-signed agreements are not included.
Country/format New for 2013
France/SDNH Agreement on workplace health
ChinaCollective bargaining agreement
for the Mencheng region
2.2.3.6 Effective work organisation that respects employees
Carrefour is committed to implementing effective organisational models
that respond to the constraints inherent to the business and the changes
it faces, while continuing to listen to employee expectations and to comply
with local regulations.
There are several ways of improving work organisation in stores while
ensuring the effi ciency levels required for growth, including reducing
part-time work through job versatility, developing work-schedule pooling
and experimenting with remote working.

2013 REGISTRATION DOCUMENT 40
2 SOCIAL RESPONSIBILITYReview of CSR approach in 2013
Work schedules
Part-time employment
Part-time work is an option that enables the Group to adapt its store-based activities to suit customer fl ows. However, the employees affected have
not always favoured this alternative. Wherever possible, Carrefour seeks to increase the hourly basis of part-time employees who wish to do so.
2013 2012 2011
Proportion of part-time employees 23.2% 23.8% 23.6%
Carrefour has developed a job versatility option, initially in France within its
hypermarkets, which offers employees who are interested the opportunity
to do some of their work in a different department within the store or
to do a different job. This enables them to increase their number of
working hours and therefore their remuneration, diversify their workplace
experience and explore new business functions.
In Belgium in 2013, the job versatility option was piloted in eight stores
and could be extended in 2014.
In Romania, the “Team 10” concept was inaugurated in 2013: store
management members are trained on the tills so that they may help
check-out assistants when the store is at its busiest.
Work-schedule pooling and remote working
Introduced in France in 1999 and managed via a computerised tool,
work-schedule pooling - currently in place at the hypermarkets - allows
check-out assistants to plan their working time in accordance with their
wishes and the level of store activity.
In Belgium, a pilot scheme named “free time management” was fi rst
implemented in 2012 and continued in 2013.
Remote working is designed to enable employees to work fl exibly while
helping them to be more effi cient. Working from home for some of the
time can be especially useful in certain functions, in particular because
it avoids employees having to commute to their usual workplace.
The remote working pilot scheme launched in Belgium in 2012 was
extended in 2013 to all central services staff. It meets staff needs
regarding schedule fl exibility and reduces the stress of commuting.
ABSENTEEISM RATE BY REASON
Absenteeism rate (1 ) 2013 2012 2011
Illness (2 ) 4.70% 4.40% 3.60%
Workplace accidents 0.56% 0.55% 0.56%
Accident while travelling 0.05% 0.05% 0.05%
(1) The absenteeism rate for illness is calculated solely for employees with permanent work contracts.
(2) Like-for-like BU fi gures (76% of 2013 consolidated sales excluding VAT) - excluding: HM: BR, IT and SM: BR, IT.
2.2.3.7 Progressive careersCarrefour believes that career management is a key element of its human
resources policies: promotion gives the Company impetus and is within
everyone’s reach.
Furthermore, at Carrefour, the notion of talent is not the sole reserve
of managers or high potential staff. It more broadly covers middle
management positions and experts in all those areas necessary for the
Group to serve its customers. A talented employee at Carrefour is one
who has completely mastered a business function and who maintains
a strong customer focus.
Staff development through varied career paths
With over 120 different business functions and a presence in 11
countries, Carrefour offers some highly varied career paths and real
mobility opportunities. Developing a career entails a series of different
professional experiences.
The Group is aiming to build professional experiences which allow
all employees to show their initiative and fl ourish on a personal level
while contributing to the Company’s performance. The different paths
offered within the Company increase levels of know-how and facilitate
communication.
In France, an average of 5,000 employees change position every year
and 56% of managers have been promoted to their positions from within
the Company. The enviedebouger (Want to move) intranet site makes
internal mobility easier. The average length of service among French staff
is 11.1 years; this fi gure stands at 7.9 years for the Group.
The Group also offers international career paths and now has 170
expatriates, managers, experts or employees in a career shift (40% in
Europe, 10% in Latin America and 50% in Asia).
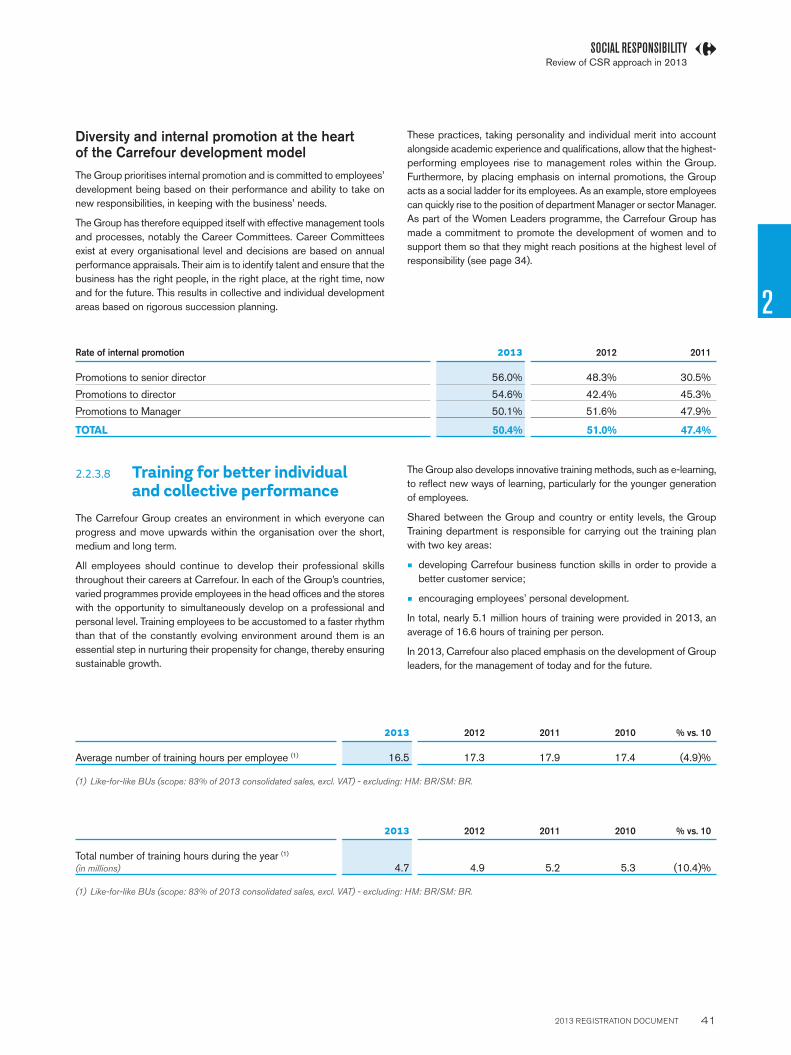
2013 REGISTRATION DOCUMENT 41
SOCIAL RESPONSIBILITY
2
Review of CSR approach in 2013
Diversity and internal promotion at the heart of the Carrefour development model
The Group prioritises internal promotion and is committed to employees’
development being based on their performance and ability to take on
new responsibilities, in keeping with the business’ needs.
The Group has therefore equipped itself with effective management tools
and processes, notably the Career Committees. Career Committees
exist at every organisational level and decisions are based on annual
performance appraisals. Their aim is to identify talent and ensure that the
business has the right people, in the right place, at the right time, now
and for the future. This results in collective and individual development
areas based on rigorous succession planning.
These practices, taking personality and individual merit into account
alongside academic experience and qualifi cations, allow that the highest-
performing employees rise to management roles within the Group.
Furthermore, by placing emphasis on internal promotions, the Group
acts as a social ladder for its employees. As an example, store employees
can quickly rise to the position of department Manager or sector Manager.
As part of the Women Leaders programme, the Carrefour Group has
made a commitment to promote the development of women and to
support them so that they might reach positions at the highest level of
responsibility (see page 34 ).
Rate of internal promotion 2013 2012 2011
Promotions to senior director 56.0% 48.3% 30.5%
Promotions to director 54.6% 42.4% 45.3%
Promotions to Manager 50.1% 51.6% 47.9%
TOTAL 50.4% 51.0% 47.4%
2.2.3.8 Training for better individual and collective performance
The Carrefour Group creates an environment in which everyone can
progress and move upwards within the organisation over the short,
medium and long term.
All employees should continue to develop their professional skills
throughout their careers at Carrefour. In each of the Group’s countries,
varied programmes provide employees in the head offi ces and the stores
with the opportunity to simultaneously develop on a professional and
personal level. Training employees to be accustomed to a faster rhythm
than that of the constantly evolving environment around them is an
essential step in nurturing their propensity for change, thereby ensuring
sustainable growth.
The Group also develops innovative training methods, such as e-learning,
to refl ect new ways of learning, particularly for the younger generation
of employees.
Shared between the Group and country or entity levels, the Group
Training department is responsible for carrying out the training plan
with two key areas:
W developing Carrefour business function skills in order to provide a
better customer service;
W encouraging employees’ personal development.
In total, nearly 5.1 million hours of training were provided in 2013, an
average of 16.6 hours of training per person.
In 2013, Carrefour also placed emphasis on the development of Group
leaders, for the management of today and for the future.
2013 2012 2011 2010 % vs. 10
Average number of training hours per employee (1) 16.5 17.3 17.9 17.4 ( 4.9)%
(1) Like-for-like BUs (scope: 83% of 2013 consolidated sales, excl. VAT) - excluding: HM: BR/SM: BR.
2013 2012 2011 2010 % vs. 10
Total number of training hours during the year (1) (in millions) 4.7 4.9 5.2 5.3 ( 10.4)%
(1) Like-for-like BUs (scope: 83% of 2013 consolidated sales, excl. VAT) - excluding: HM: BR/SM: BR.

2013 REGISTRATION DOCUMENT 42
2 SOCIAL RESPONSIBILITYReview of CSR approach in 2013
Developing business function skills to provide a better customer service
Targeted training is offered for each of the 120 business functions
represented at Carrefour in order to ensure excellence in the basics,
with a permanent goal of 100% of the target groups receiving compulsory
training.
Each country and entity is also responsible for implementing its own
training plan to meet its particular needs, especially specifi c training in
business functions.
Customer-focused
Many training courses are therefore provided throughout the Group’s
various countries to develop an in-store focus on the customer, following
the example of the “Customer Path” module in France or the customer
service training for check-out assistants in China.
In Argentina, trainings have been implemented to train store teams to
better listen to customers’ needs with the aim of signifi cantly improving
their satisfaction levels.
In Romania, the “Carrefour delights You” programme is aiming to instill
a profound change in the attitudes and behaviour of all managers and
employees towards customers. In every hypermarket, role models are
identifi ed and selected to become ambassadors and internal trainers
on subjects linked to customer satisfaction.
Fresh produce business functions
Throughout the Group, specifi c training is provided for business functions,
particularly the Meat, Fruit & Vegetables, Fish, and Bakery & Pastry
sections.
Carrefour China, aware of the importance that these sections represent
in its hypermarkets, has decided to establish schools dedicated to fresh
produce training in each of its regions. Levels of employee professionalism
in the meat, fruit & vegetables and fi sh sections are enhanced thanks to
schools dedicated to these three business functions.
Carrefour Poland has set up an initiative to become a reference in this
regard. Internal trainers are identifi ed from among store employees.
The training courses are very operational, largely taking place in sales
areas. Specifi c action plans are drawn up in collaboration with the store
directors, so that they may immediately be implemented.
Promoting employees’ personal development
The Group has introduced training courses for employees with reading
and writing diffi culties based on the EvoluPro programme; courses are
run by Carrefour hypermarkets in France and provide store employees
with an opportunity to learn or improve their French on a voluntary basis.
Since 2008, 905 people have followed the programme, including 156
in 2013. At the end of 2012, the EvoluPro module had been piloted at
a site of the logistics entity (Carpiquet) and was being set up at two
other sites at the end of 2013.
One of Carrefour’s priorities is to develop managerial skills that promote
accountability and independence.
By way of example, Carrefour Brazil runs the Tropa de Elite programme
to develop the leadership skills of the country’s Regional directors. After
the success of this initiative, Carrefour Brazil is launching the Tropa de
Elite 2 programme for the development of store directors to establish
collectively new expectations for this key role in the organisation.
Similarly, the “Mandarin” programme has been designed in China to speed
up store director training and to oversee the numerous store openings
in the country; 20 hypermarkets were opened in China in 2013. Lasting
eight months, the programme combines classroom training, practical
in-store workshops and online sessions.
Elsewhere, the Group supports the development of its senior directors
by offering them places on its Master Carrefour programme: three weeks
of training that aims to give a global understanding of the new challenges
facing the sector, to reinforce managerial skills and, as a team, to refl ect
on the Company’s major issues and future challenges. This fl agship
programme provides a special opportunity to share and exchange ideas
with the General Management. Since its creation, nearly 300 managers
have been on this programme, including the majority of Executive directors.
The creation and launch of the Carrefour University
In 2013, the Carrefour Group decided to create its own company
university, the Carrefour University, with a view to training its future
managers. Specially designed for all Group senior directors and directors
undergoing a career shift, the Carrefour University offers varied and
innovative training on subjects such as customer focus, business function
innovation and leadership. It was developed in collaboration with front-line
employees to guarantee the relevance of all of its programmes.
2.2.3.9 Appealing and motivating global benefits to involve employees in the Group’s success
Carrefour has set up a global benefi ts scheme which combines fi nancial
remuneration with attractive and competitive social assistance, meeting
the needs of the employees and their families. The aims of the Group’s
global benefi ts scheme are as follows: fi nancial remuneration, employee
benefi ts (medical cover, pension, insurance), employee savings and other
advantages such as discounts on purchases.
Furthermore, the employees’ individual benefi ts are linked to their
contribution to company’s current performance and future growth.
Offering all employees a basic remuneration and social protection to meet their needs
Fair and competitive remuneration
Carrefour is committed to offering its employees fair and competitive
remuneration.
The annual remuneration review is designed to ensure the consistency
and fairness of internal remuneration levels: proposals for remuneration
changes are analysed by each entity to ensure that they are consistent
with responsibilities and the performance of each employee, and that
they are based on a principle of fairness.
In every country, the level of employee remuneration is analysed in
comparison with both the general market and the retail market, through
remuneration surveys carried out by specialist fi rms.
2013 REGISTRATION DOCUMENT 43
SOCIAL RESPONSIBILITY
2
Review of CSR approach in 2013
Benefi ts for employees and their families
The Carrefour Group is a responsible employer that strives to offer
benefi t schemes to its employees in the countries in which it operates.
The schemes are adapted to respect local practices and obligations and
to meet the needs of employees and their families.
As part of a continuous improvement approach, Carrefour carried out
an inventory of employee benefi t schemes worldwide. The inventory
was principally designed to check that schemes complied with local
obligations, to assess Carrefour’s position in relation to market practices,
and to identify short- and medium-term adjustments to be made in
accordance with legal restrictions and local trends.
The approach is part of Carrefour’s desire to meet its employees’
changing social protection needs. It also translates into initiatives in
communications on the various Group benefi t schemes, in order to
highlight the components that make up employees’ remuneration.
In France, Carrefour promotes employee share ownership by offering
a Carrefour shares fund as one of the six on offer. As at December 31,
2013, Group employees held 1.09% of the Group’s capital through the
Group savings plan. In 2013, Carrefour France also renewed its Group
profi t-sharing agreement for a period of three years.
Engaging employees and involving them in the Group’s success
Year upon year, Carrefour develops varied and complementary ways to
involve its employees in the Group’s success and ensure they receive
an attractive and competitive remuneration.
Engaging employees
Carrefour believes that, for its employees to be truly committed,
responsibilities must be clear and specifi c and targets must be perfectly
understood. Targets must be clear, communicated early in the year,
and must be set in relation to employees’ scope of responsibilities and
priorities.
All employees are assessed by their managers, who are encouraged
by the Group to make regular feedback to their teams throughout the
year. The main assessment tool is the annual performance appraisal.
The appraisal is an opportunity for employees and their manager to
discuss the performance over the year, how they would like their career
to develop, and their training needs.
Involving employees in the Group’s success
Carrefour believes that its success is down to the sum total of the actions
of its 364,795 employees. To more closely connect its employees to this
success, simple and motivating variable remuneration plans are regularly
updated within each entity. These aim to link each employee in the best
way possible to the Company’s results and in particular to recognise
employees who have made a decisive contribution to the results achieved.
All the Group’s managers are eligible for variable individual remuneration,
the amount of which varies in line with the economic results of their
entity and their individual performance, assessed by their line manager
and based on the targets set at the start of the year. In order to assess
individual performance, each manager is asked to take into account
the way in which the targets have been reached, beyond a simple
consideration of the result obtained.
Over 60% of the Group’s employees are today eligible for results-based
incentive schemes in addition to their basic salary and, if applicable, their
individual variable remuneration. In this way:
W all employees in China are eligible for an incentive scheme: they receive
a direct share in the profi ts of their entity. For example, an employee
whose store has good results will receive a bonus calculated as a
percentage of his or her basic salary;
W employees in France are eligible for a profi t-sharing and incentive
scheme that is more generous than the legal requirement. Carrefour
supplements payments with a top-up contribution.
Finally, in 2013, several of the Group’s countries set up dedicated results-
based incentive schemes for store directors and their management teams
(Belgium, Brazil, China, Italy, Romania).
2.2.4 A RANGE OF RESPONSIBLE PRODUCTS FOR EVERYONE
For Carrefour, “doing a good job” means offering its customers quality
products at affordable prices. It also means that every shopping
transaction should benefi t as many people as possible. Each day, the
Group strives to improve its wide, varied product mix, which includes
products from major national brands, regional products and its own-
brand products. Through its range of Carrefour products, the Group
promotes responsible production models that respect the environment,
biodiversity, animals and people.

2013 REGISTRATION DOCUMENT 44
2 SOCIAL RESPONSIBILITYReview of CSR approach in 2013
2.2.4.1 Carrefour products quality and safety
A rigorous approach to quality
Carrefour demands quality in each phase of a product’s life and in the
operation of its stores worldwide. These high standards are supported
by quality control processes which cover all issues of health, safety,
hygiene and quality, and which guarantee optimal food health and safety.
These processes exist at all Group levels and are constantly updated
and improved:
W the entity or country self-monitors its own processes, checking routines,
registrations, and reporting on Quality/Safety indicators. For example,
specifi cations which bind suppliers are monitored at country level.
Factory audits and management of non-conformance are also handled
at country level;
W The Group Quality department provides effective support for
international quality management to adapt to local markets and ensure
consistency worldwide. To achieve this, experts act on a variety of
issues; and
W Internal Control then confi rms the relevance, compliance with
procedures and declarations through a programme of regular audits.
Harmonising quality standards: fundamentals shared by all stores
In 2013, Group Quality teams focused their efforts on harmonising
quality standards applicable to stores. The harmonisation targets several
coinciding objectives: to optimise processes, to align quality at country
level with the Group’s requirements, and to facilitate follow-ups during
deployment of the standards. In the future, harmonisation will promote
the development of a stronger, customer-focused quality process.
Built on the basis of an HACCP study (Hazard Analysis Critical Control
Point), Carrefour’s standards specify rules and basic expectations with
respect to fi ve key points, the “cornerstones of safety”:
W teams’ expertise: organisation of country-level quality teams, expertise
required from quality managers and in-store employee training policy:
food health and safety, compliance with rules;
W audits: audit policy for stores, warehouses and suppliers on mastery
of food health and safety rules, defi nition of specifi cations for auditor
selection, identifi cation and signature of contracts with auditors, store/
warehouse action plans implementation;
W specifications: procedures to manage food health and safety in each
department;
W control plan: in-stores products control, selection and sorting of
fresh produce delivered to the warehouse, microbiological analysis
of products handled in store and food contact surfaces, defi nition of
laboratory specifi cations, identifi cation and signatureso of contracts
with laboratories, action plans in the event that non-compliance is
detected; and
W database: archive of supplier and product controls, compilation of
quality/safety indicators.
By the end of 2013, with the support of the Group Quality department,
these had been implemented in every country where Carrefour is present.
IN PRACTICEIn Europe, France, Belgium, Italy and Spain have developed a cross-inspection system for stores and warehouses, based on these fi ve cornerstones of safety. Conducted by Quality Directors or quality experts from another Group country, they are intended to develop a diagnostic analysis to control food health risks, and to promote the sharing of best practices between sites and countries.
In China, a network of four central laboratories and 45 in-store laboratories perform daily analyses of fresh produce. They test for the presence of pesticides, preservatives, dyes, heavy metals and microorganisms. These laboratories, which are present in Carrefour stores, ensure product safety and carry out a constant follow-up of suppliers. In 2013, Quality and Food Safety teams along with laboratory technicians (approximately 170 people) took part in a three-day training module (“Dragon” training) on in-store hygiene. It has two objectives: to promote skills development and internal promotion within the China Quality team. A training programme for 21 farming cooperatives on food safety improvements and integrated farming practices was also launched in 2013, for a three-year period.
Demanding specifi cations for safe, quality products
To ensure that a product complies with Carrefour’s Quality policy from
its initial stages of development, merchandise teams are organised into
Purchasing/Quality teams working together.
In order to offer safe, quality Carrefour products, the Group has developed
specifi cations for its own-brand ranges with demanding and intangible
quality standards. Carrefour’s suppliers are committed to compliance with
these strict specifi cations which defi ne the product’s basic characteristics:
customer expectations, particularly in terms of taste, the recipe used,
price positioning, compliance with regulations and Carrefour standards,
the origin of raw materials and production methods for foodstuffs.

2013 REGISTRATION DOCUMENT 45
SOCIAL RESPONSIBILITY
2
Review of CSR approach in 2013
Carrefour asks the supplier for certifi cation of safety/food quality standards
at its production site, or has it audited by an expert or an independent
third-party organisation to ensure that it has skills and tools which are
compatible with the Group’s quality and safety requirements. Next,
an annual monitoring plan is developed for the product. To guarantee
maximum safety for consumers and to anticipate risks, Carrefour has
introduced procedures and tools designed to manage any non-compliance
that may be detected: periodic analyses by independent laboratories, a
monitoring network, exchanges with consumers, the administration, the
stores and suppliers, and product traceability.
Finally, in the event of a non-conformity requiring the withdrawal of a
product, the Group uses an international alert known as “Alertnet” to
inform all of its stores as soon as possible. Accessible via the Internet, it
provides maximum responsiveness. This tool is currently used by France,
Poland, Argentina and Brazil.
IN PRACTICEIn China, for the third consecutive year, Carrefour received the National Food Safety 7-Star award in September 2013.
Taiwan has demonstrated transparency during its self-monitoring: test results from fresh produce (pork and beef) were published on the website and the information was posted for customers in the store.
In Vivo tests in France
In Vivo tests were developed in France during 2013 by teams responsible
for consumer panels and testing. This method for gathering opinions on
the quality of Carrefour producers is based on direct exchanges with
customers. During in-store meetings, groups of four loyal customers are
invited to take part in an informal discussion with two quality managers.
These direct, open discussions provide a better understanding of their
expectations. For example, during a test at the Athis-Mons (France)
store in June 2013, 13 volunteer customers, chosen from among 2,000
customer loyalty card holders, openly discussed the quality of Carrefour
food products for 90 minutes. They emphasised that Carrefour food
products must have the same quality (taste for a food, or effectiveness for
an HPC product) as national brand products at a lower price. Generally
speaking, value for money remains the most important criterion. Five In
Vivo tests were conducted in 2013 by Carrefour, which will repeat the
experiment in 2014.
On-going improvement of quality standards
Continuous monitoring of substances
The teams responsible for quality continuously monitor data provided
by exact science, humanities and social science, health agencies and
scientifi c publications. They rely on a network of scientists who help
them anticipate risks and take the appropriate decisions.
In response to questions and the continued strengthening of regulations
covering substances which are present in certain Carrefour products,
the Group has developed a formal risk mapping and management
methodology based on classifi cation by category of risk. Objective:
better anticipation of risks, on-going surveillance and action plans to
improve product composition. The approach enables Carrefour to be
proactive, and at times keep ahead of future regulations.
In 2013, Carrefour restricted the use of ingredients that were not yet
regulated but which had become the focus of much attention in the
scientifi c community. For example, in the cosmetics sector, Carrefour
developed a range of approximately twenty nanoparticle-free sun-care
products for the French, Spanish and Belgian markets.
In the food sector during 2013, offi cial publications on the potentially
harmful effects of acrylamide led Carrefour’s merchandise teams to
prepare and implement an action plan, to draft an exhaustive inventory
of the presence of this newly-formed molecule in foodstuffs, quantify
it for each affected product and verify whether the contents exceed
the thresholds established by the European Food Safety Authority
(AESA/EFSA). In 2014, any excess will result in a careful study of the
manufacturing process in order to limit its presence as far as possible.
Traceability of fresh produce and frozen products containing meat
Following the fraud which emerged in February 2013 concerning beef
labelling (which had been substituted with horse meat), Carrefour in
France decided to enhance its controls over sourcing, and undertook,
during the Paris International Agricultural Show, to use 100% French-
origin beef and pork in its own-brand fresh and frozen ready meals.
Since 2013, the products in question have been made exclusively from
French beef and pork from animals born, raised and slaughtered in
France. For Carrefour, restricting its sourcing to a French market, using
shorter routes, and having the ability to meet its control requirements
are the most effective ways to protect itself against fraud. Controls and
tests, including DNA testing, were also stepped up.
Consumers have access to detailed information on the origin of the meat
used with labels updated as and when packaging is replaced.
Specifi c audits were performed to check the traceability system, from
the supplier to the slaughterhouse, their new methods for guaranteeing
the species and the origin of the meat.
In Belgium, Carrefour also enhanced its system for monitoring and
sharing legislative developments. DNA testing on sourced meats was
also expanded: more than 13 control panels and 485 products were
tested by an outside panel, an increase of 10% compared with 2012. As
in all countries where the Group is present, a tool to gather and manage
supplier information was deployed in Belgium.
2013 REGISTRATION DOCUMENT 46
2 SOCIAL RESPONSIBILITYReview of CSR approach in 2013
A balanced diet for everyone
Given the public health challenges represented by excessive weight
and obesity, Carrefour is developing, in addition to basic quality and
safety criteria, a proactive policy designed to promote a balanced
diet for everyone. Through its specifi cations, Carrefour insists that its
suppliers guarantee nutritional value that meets market standards. During
2013, work was carried out in particular on Carrefour products such as
compotes, sandwich bread and breakfast cereals. Nutrition was the focus
of a discussion forum with Group stakeholders in July 2013 (see page 19 ).
Various initiatives were carried out within countries, depending on local
issues. In Belgium, efforts focused on reducing salt and trans fats, and
on communication so that consumers gain a better understanding of
nutritional labelling.
IN PRACTICEIn Brazil, during 2013, Carrefour became the fi rst retailer to sell rice fortifi ed with vitamins and minerals to meet the needs of part of the local population. Its distribution is the focus of a product-sharing operation, since a portion of sales is donated to the ABRINQ Association (Associação Brasileira dos Fabricantes de Brinquedos), which defends the rights of Brazilian children and adolescents and promotes their social responsibility.
For several years, the Group has also been developing targeted ranges
to respond to the nutritional needs of certain consumer groups, such as
newborns, children, the gluten-intolerant, and those who must reduce
their salt consumption, etc.
Carrefour Baby
In 2013, in response to the latest expectations of parents seeking high-
quality and affordable products for their infants, Carrefour launched
its new range of foods for children aged 0 to 3, in cooperation with a
paediatrician and a dietician who are experts in child nutrition. It aims to
ensure that the texture and ingredients are ideally suited to an infant’s
nutritional profi le, according to their age. These quality products are made
from simple recipes that meet the needs of young children.
In France, in 2013, the Carrefour Baby range had 76 infant nutrition
products, 21 of them organic.
Carrefour Kids
In 2013, Carrefour revamped its Kids range, designed for children aged
3 to 10, to better address parents’ concerns and children’s taste.
The range offers more than 100 products, developed for children to enjoy
and which provides them the best without compromising on quality: new
products, new recipes and repackaged products for easy use at school.
Carrefour No Gluten
This range, available in Europe, was specifi cally developed for people
who are gluten-intolerant. These products can easily be recognised by
the wheat-head symbol with a cross through it, the logo of the French
Gluten Intolerance Association and of the Spanish Celiac Association
(FACE). In September 2013, two new gluten-free products were launched
in France: Viennese mini-baguettes and hamburger buns. The range
currently includes 17 products sold in France specifi cally for people
with celiac disease. France has implemented specifi c procedures to
develop and monitor gluten-free products, including panels of customers
with celiac disease (or who typically consume gluten-free products) to
taste-test the products.
In 2013, Carrefour Spain launched a campaign to make shopping more
affordable for people with celiac disease. All hypermarkets offer discounts
of up to 70% on 40 gluten-free items, including several basic products
such as bread, pasta, a variety of fl ours, different pastries and desserts,
creamed vegetable soups, tomato concentrate and aperitif snacks such
as popcorn and nibbles. In Spain, Carrefour offers one of the widest
ranges of gluten-free items, with more than 500 products including 211
own-brand products. These include delicatessen meats, cheeses, pâtés,
ice cream and desserts, a wide range of canned foods, sauces, jams,
grilled and fried dried fruits, along with a large range of fresh produce.
Promoting responsible consumption
Raising customer awareness of responsible consumption
Since mass-market retailers can play a major role in modifying consumption
patterns and changing behaviours, Carrefour is taking steps to guide its
customers toward responsible consumption. Products with environmental
and social added value (see below) are representative of these efforts.
They are promoted in stores and through various national and local events.

2013 REGISTRATION DOCUMENT 47
SOCIAL RESPONSIBILITY
2
Review of CSR approach in 2013
IN PRACTICEIn France, for example, the approach to responsible sourcing of wood and responsible fi shing is presented in catalogues and at www.carrefour.fr. Many other initiatives are used to mobilise customers: at the start of school, for example, school supplies manufactured in France using recycled paper or made with materials from sustainably managed forests are available, along with information to teach customers to identify logos.
In Argentina, China, France and Brazil, Carrefour used the WWF’s Earth Hour campaign to rally stores and customers around the issue of climate change. The Group also highlights energy-effi cient products in its stores during occasional campaigns, as in France.
In Spain, guides to responsible consumption and recycling have been published for customer and consumer use. At www.carrefour.es, Internet users are informed about sustainable development and the importance of responsible consumption.
Informing consumers about the importance of a varied and balanced diet
In all countries in which it operates, the Carrefour Group makes every
effort to promote a balanced diet and healthier lifestyle, especially among
young people. To reach as many people as possible, Carrefour spreads the
message in a variety of ways, including websites, magazines, participation
in awareness campaigns, sponsorships and promotional efforts aimed
at assembling affordable, balanced meals.
Since 2005, Carrefour has also been labelling its products with nutritional
information developed in collaboration with the CLCV (Confederation for
consumption, housing and lifestyle) association. To provide customers
with clear information so that they can compare products more easily, in
2009 Carrefour decided to adopt the Guideline Daily Amounts (GDA)
system for its own-brand products in Europe. Grids on products’ front
labels indicate the amounts of calories, sugar, fat (including saturated
fat) and salt, expressed as a percentage of daily recommended amounts.
On products for children, the GDAs are adapted for each product’s
targeted age range.
The packaging always includes the phrase, “Eat a varied, balanced
diet and get regular exercise!” – a recommendation in line with the
basic principles of the PNNS (Plan National Nutrition Santé – National
Nutrition and Health Plan), launched in 2001 by the French authorities.
Depending on the packaging’s available space, this phrase may be
followed by nutritional advice to help consumers put together balanced,
varied meals. For example, a pizza’s packaging is labelled with the following
suggestion: “For a complete meal, enjoy this pizza with raw or cooked
vegetables and have yogurt or a piece of fruit for dessert. And don’t
forget to drink plenty of water.”
2.2.4.2 Protecting biodiversityMany supply networks – involving agricultural products, seafood, wood
products, soya, beef and palm oil – now have a major impact on the
environment and biodiversity.
Carrefour aims to reduce its environmental footprint, including through
its sourcing. Protected ecosystems provide raw materials and services
which support the Company’s activities and economic performance, while
benefi tting society as a whole. Carrefour infl uences its supply chains
and plays an active role in initiatives aimed at developing responsible
product lines.
Protecting biodiversity through the Carrefour Quality Lines
Through the Carrefour Quality Lines, several thousand producers
worldwide, along with the Group, are committed to offering a range of
fl avourful core market fresh produce which comply with environmental,
social, quality and traceability requirements. Thanks to its direct
relationships with producers, which are often created for the long term,
Carrefour has built mutual trust with its partners, providing the guarantee of
quality products manufactured according to best practices, and ensuring
multiple, regular commercial outlets for the products.
With each producer, Carrefour establishes strict specifi cations for each
product within the Quality Lines. These rules include production methods,
fl avour criteria, as well as environmental and biodiversity protection
obligations. An independent inspection body is authorised by Carrefour
to check compliance with the specifi cations for each line.
In 2013, these lines have expanded throughout the Group, in cooperation
with the local farming community.
IN PRACTICEDuring 2013, China made a commitment to develop Carrefour Quality Lines to meet consumer expectations for fresh produce: freshness, quality, price and food safety. Likewise, Argentina - an important agricultural nation - is committed to developing these lines.
KEY FIGURES - CARREFOUR QUALITY LINES414 lines around the world.
In France:
19,044 producers;
110,000 tonnes of fresh produce per year.

2013 REGISTRATION DOCUMENT 48
2 SOCIAL RESPONSIBILITYReview of CSR approach in 2013
Carrefour Quality Lines: agroecology laboratory
A pioneer in agroecology, specifi cally through its Quality Lines, Carrefour
has long been developing initiatives which support this approach.
These lines are the “tool” deployed by the Group to put into practice
its commitment to create responsible product lines. By building close
relationships with producers linked to their expertise, it is able to implement
demanding specifi cations and strive for superior quality.
Those involved in the Carrefour Quality Lines (CQL) demonstrate respect
for ecosystems through several key, mandatory principles: crop rotation,
a ban on spreading sludge from water treatment plants, prohibition of
soil-free plant production and the absence of post-harvest chemical
treatment of fruits and vegetables. Carrefour Quality Line product lines
favour alternative methods such as integrated pest control and the use
of plant protection products only when strictly necessary.
Carrefour is mindful of living and slaughtering conditions, as well as the
veterinary care provided to animals. Cows are put to pasture as soon
as weather permits, and remain there for at least six months. Lambs are
nursed by their mothers for at least two months. Egg-laying hens and
chickens are free-range and treated without antibiotics. Natural cycles
are respected, the conditions and time of transport are regulated, and
stunning prior to slaughter is mandatory. All of these animal protection
practices undergo constant improvement.
The development of antibiotic-free animal product lines, along with
consultations and work to promote responsible plant proteins in its supply
chain, is also part of this agroecology “laboratory” approach. Through
its agroecology programme, Carrefour is involved in and supports the
“Agroecology Programme for France”, launched by the French Minister
for Agriculture, Agri-food and Forestry, and will continue to expand its
involvement in this area in the future.
Offering a credible alternative to GMOs
In light of the controversy surrounding genetically-modifi ed organisms
(GMOs) and the lack of long-term data on their impact on biodiversity,
Carrefour has implemented a proactive policy in this area for over 15
years. In 1996, the Group was the fi rst retailer in France to adopt the
precautionary principle and offer its customers a credible alternative
to GMOs. In the European Union, no own-brand products in any of
Carrefour products’ ranges have contained GMOs for over a decade.
Outside the European Union, the Group has taken steps to offer an
alternative to GMOs whenever possible, while adapting to local regulatory
requirements.
In 1998, Carrefour France extended its commitments to the feeding of
animals to be used in Carrefour fresh produce, and developed a traceable,
GMO-free soya-meal network. In 2010, the Group launched more than
300 Carrefour Quality Line products in France, labelled “Reared without
GMOs” to meet customer and consumer demand for transparency. The
approach anticipated the French government’s decree on the labelling
of foodstuffs, published in January 2012.
Chickens raised without antibiotics
In partnership with 150 breeders, Carrefour has created a Carrefour
Quality Line with chickens raised without antibiotics. The chickens from
Auvergne (France), fed without GMOs (<0.9%), are free-range and
treated without the use of antibiotics. The principle of phytotherapy helps
to strengthen the birds’ immune system, amongst other things, thereby
avoiding illnesses. It also implies to ensure the animals’ well-being, and
provides top quality results. As part of the close relationship that Carrefour
has developed with farmers who are committed to rediscovering quality
production methods, the Group was able to develop this product with
demanding specifi cations. The antibiotic-free Carrefour Quality Line
chicken is Red Label-certifi ed, synonymous with superior quality and,
as with all Red Label chickens, was awarded top prize in the Concours
Général Agricole.
A responsible beekeeping line
In response to the Beekeeping Sustainable Development Plan launched
by the French government, the Group decided, in early 2013, to sell
Carrefour Quality Line honey in France. The honey has the notable
feature of being produced with beekeepers themselves, and was carefully
controlled at every stage, from the beekeepers to the consumers. In this
way, Carrefour promotes best beekeeping practices and takes part in a
different marketing method, with the goal of supporting the development
of the French beekeeping sector. Thanks to Corsican beekeepers, on
December 20 of last year, Carrefour signed a pre-commitment for a
Carrefour Quality Line dedicated to honey.
Protecting biodiversity by promoting organic agriculture: the Carrefour BIO range
The Group has developed an especially broad selection of organic
products. The Carrefour BIO range offers a wide range of textiles (under
the TEX brand), cosmetics and food products, and the number of listings
expands year after year. In 2013, Carrefour hypermarkets sold more than
2,150 Carrefour BIO product listings worldwide.
Group 2013 2012 2011 2010 % vs. 10
Sales (incl. VAT) of Carrefour Quality Line products (in millions of euros) 1,036 898 924 902 + 14.9%
Number of Carrefour Quality Lines (number of partnerships) 414 418 417 404 +2.5%
Like-for-like BUs (scope: 100% of 2013 consolidated sales, excl. VAT).

2013 REGISTRATION DOCUMENT 49
SOCIAL RESPONSIBILITY
2
Review of CSR approach in 2013
In 2012, Carrefour celebrated the 20th anniversary of its BIO organic
range in France. This was the occasion for a number of events at its
stores and launching a wide-reaching campaign to promote Carrefour
BIO products in-store, via catalogues and online (http://www.c-laterre.
fr/carrefour_et_le_bio/produit-bio-magasins). The website showcases
products of French origin. 100% of Carrefour BIO fruits and vegetables
are of French origin, and 70% of Carrefour BIO organic processed
products come from French production sites. Practical, educational and
interactive, the website provides a space devoted to organic enthusiasts
and promotes the brand’s commitments.
KEY FIGURES962 Carrefour BIO food listings and 774 Carrefour Bio Textile listings in France.
235 Carrefour Bio products in France (Traditional Fresh Produce)
All formats 2013 2012 2011 2010 % vs. 10
Number of controlled organic-food product listings (in units) 2,153 1,998 1,985 1,677 +28.4
Sales (incl. VAT) of organic food products (in millions of euros) 581 545 602 549 +6.0
Like-for-like BUs (scope: 100% of 2013 consolidated sales, excl. VAT).
Protecting biodiversity through responsible sourcing of raw materials
To take into account the need to protect fi sh stocks through its seafood
supply chain, Carrefour has long incorporated sustainability criteria into
its products’ specifi cations, reduced or eliminated the sale of threatened
species and promoted sourcing that uses certifi ed best practices. The
Group is also committed to its partners, who support it in building its
approach to sustainable fi shing:
W Carrefour has been working with WWF France since 2007 to identify
the fi shing areas and species that need priority attention;
W the Group also uses the guide published by Seafood Choice Alliance,
an NGO working with the entire sector, helping it to take species’
endangerment in its procurement choices;
W lastly, in France, Carrefour represents the Fédération du commerce
et de la distribution - FCD (Federation of Retail and Distribution
Companies) before the Sustainable Fishing Ecolabel Commission.
Carrefour has gradually developed a comprehensive strategy to reduce
the forest footprint of its supply chain, comprising initiatives in all
sectors directly or indirectly connected to forestry use and in association
with NGOs and dedicated working groups:
W as part of its membership in the Consumer Goods Forum, the
Carrefour Group supported the adoption of a far-reaching objective:
zero deforestation by 2020;
W Carrefour has been a member of the Roundtable on Sustainable
Palm Oil (RSPO) since 2009. The roundtable is a platform for 1,450
palm oil producers, agri-food manufacturers, retailers and NGOs,
whose aim is to transform the palm oil market into a sustainable
sector. by developing a production certifi cation system and ensuring
traceability in the supply chain;
W since 2009, Carrefour Brazil has been participating in the Sustainable
Cattle Working Group (Grupo de Trabalho da Pecuaria Sustentavel
– GTPS), which aims to create a responsible cattle supply sector;
W the Group is a member of the Round Table on Responsible Soya
(RTRS). Launched in 2006, this international organisation brings
together soya producers, industry representatives, mass-retailing
representatives and NGOs. In 2010, it published a certifi cation
standard for responsible soya networks; and
W since 2006, Carrefour has been supporting the Soya Moratorium
in the Amazon. This initiative, engaged in by sector professionals
in coordination with the Brazilian authorities and civil society, allows
fi ghting the Amazon’s deforestation for soya crops.
Carrefour affi rms and strengthens its commitment to sustainable fi shing
In 2013, Carrefour in France strengthened its commitment to sustainable
fi shing in three areas:
Stopping the sale of deep-sea fish: Carrefour is gradually stopping
the sale of scabbard fi sh, grenadier and cusk. Between 2007 and 2013,
Carrefour had already stopped the sale of blue ling cod and deep-sea
perch, and had decreased fourfold the sales volume of scabbard fi sh,
grenadier and cusk. Carrefour is enhancing its commitment to sustainable
fi shing by halting their sale by June 2014, upon expiry of its commitments
to suppliers.
Carrefour is doubling its MSC-certified listings, gradually increasing
them from 22 to 50 by the end of 2014. Since 2008, the Carrefour Group
has developed a wide range of own-brand products certifi ed by the
Marine Stewardship Council (MSC), a globally recognised programme
for certifying products obtained via responsible fi shing practices. In
2013, Carrefour sold 22 MSC-labelled products, one of the largest
ranges in France (all brands combined) and will continue to actively
promote this label.

2013 REGISTRATION DOCUMENT 50
2 SOCIAL RESPONSIBILITYReview of CSR approach in 2013
Carrefour Quality Line farmed salmon: 100% of fresh Norwegian
salmon now comes from the Carrefour Quality Line. This Norwegian
line, created in 1995 and now expanded to cover all of Carrefour’s fresh
salmon, ensures full traceability of salmon to the stores. All sites and every
stage of the production process is audited by an independent company,
and the products meet highly demanding specifi cations.
Promoting responsible sourcing of palm oil
In 2013, Carrefour took part in revising the principles and criteria for
responsible production of palm oil developed by the RSPO. Carrefour
hopes that in the future, palm oil production will exceed the set of best
practices currently certifi ed by the RSPO, to permit in particular:
W preservation of peat bogs and natural forests (identifi ed as high carbon
density areas) and a corresponding reduction in CO2 emissions; and
W halting the use of certain pesticides in agricultural operations on palm
oil plantations;
Along with its involvement in the RSPO’s work, Carrefour has continued to
implement its action plan with the goal of using 100% sustainable palm
oil by 2015 in Carrefour products in which palm oil is not substituted.
The following results were achieved in 2013:
W more than 100 products containing RSPO traced and certifi ed palm
oil are available in Carrefour stores in Europe, and over 600 products
contribute to more sustainable production;
p alm oil has been replaced in more than 400 Carrefour products in
France, with no negative impact on quality, taste or product storage.
The Group substitutes another oil for palm oil when this improves the
nutritional profi le of its products, based on local circumstances and
technical feasibility;
W Carrefour’s action was recognised by the WWF, which ranked it as
the top French retailer on the 2013 Palm Oil Scorecard;
W with the support of the Carrefour Foundation, 349 Indonesian palm oil
producers obtained the fi rst RSPO certifi cation issued to independent
producers in Indonesia. Small producers produce approximately 40%
of the world’s palm oil. Thus, it is essential that the Group’s approach
includes support for such producers.
Reducing the footprint on the forester ecosystems of the paper and wood supply chain
Carrefour made a commitment to sustainable forest management so
as to control its supplies of timber and associated products at a very
early stage. The Wood Charter commits European purchasing offi ce
suppliers that use wood, pulp, paper and products derived from these
materials to ensuring:
W the legality of their supplies;
W respect for local populations;
W no sourcing from High Conservation Value (HCV) forests; and
W no sourcing of species included on the IUCN (International Union
for Conservation of Nature) red list of threatened species or species
protected under the CITES (Convention on International Trade in
Endangered Species of Wild Fauna and Flora) agreement.
To strengthen its initiative, Carrefour appended the Wood Charter to
all contracts signed by suppliers of Carrefour products which contain
wood fi bres. All suppliers that manufacture products made of wood and
wood derivatives have received the Wood Charter.
For the non-food sector, the Wood Charter is supported by a questionnaire
that helps to work with suppliers in examining how to improve their
sourcing to comply with the Charter (species, production regions etc.).
In compliance with current regulations, Carrefour has also strengthened
its decision-making and control system by broadening its risk analysis
by species and by supply area, and by specifying criteria to apply when
evaluating suppliers.
In an effort to constantly improve, Carrefour continuously enhances
the expertise of its teams, training them in local regulatory issues, risk
analysis, standards and supplier evaluation. To achieve this, Carrefour
has enlisted the aid of the only fi rm recognised by the European Union
to audit the traceability of wood. The Group has also collaborated with
the WWF France and its GFTN (1) (Global Forest Trade Network) to
develop a supplier training programme.
The Group continues to promote stationery and personal hygiene products
(paper tissues, wipes etc.) and packaging based on FSC, PEFC and
recycled materials, mainly under its ECOplanet brand. In 2013, Carrefour’s
French catalogues highlighted Carrefour products and national brand
products which have been awarded eco-labels, and whose manufacture
is designed to limit environmental impact.
KEY FIGURECarrefour France was the number one retailer on the WWF France 2012 Timber Barometer .
First beef products certifi ed by the Rainforest Alliance
In 2013, Carrefour Brazil was the fi rst banner to launch beef products
certifi ed by the NGO Rainforest Alliance. The certifi cation covers the entire
beef production chain, including farms, slaughterhouses and retailers.
Criteria include sustainable agriculture, methane gas emission set-offs,
respect for workers’ rights and well-being, protection of ecosystems
and water conservation. It also involves complete traceability of products
through the Internet, and systematic food safety controls throughout
the chain.
Promoting “responsible” plant proteins
Plant proteins (legumes including soya, cereals, oilseeds, etc.) are used
in animal feed in animal-rearing operations. With little production currently
in Europe, soya is frequently imported from Brazil, where it is a cause
of deforestation in the country. Most of the production also comes from
GMO crops.
(1) “The GFTN France network is a discussion forum and networking facility for tree farmers on the ground and buyers of sustainability farmed timber
throughout the world”.

2013 REGISTRATION DOCUMENT 51
SOCIAL RESPONSIBILITY
2
Review of CSR approach in 2013
Carrefour supports the cultivation of GMO-free soya and takes part in
developing lower impact product lines, using a multiphase approach:
W develop GMO-free and responsible soya production : the Group is a
member of the Round Table on Responsible Soy (RTRS), supporting
the Soya Moratorium (see page 49 ); and
W in France, Carrefour promotes the local sourcing of plant proteins. This
guarantees production without deforestation, the absence of GMOs
and a shorter route for the entire supply chain.
Using this approach, in 2013 Carrefour launched 100% French eggs
from hens reared on GMO-free feed during the entire egg-laying process,
with feed grown exclusively in France.
2.2.4.3 Fair tradeIn 2013, the Group had nearly 1,700 fair trade listings (own-brand
and national brands) worldwide. In 1998, Carrefour became the fi rst
French banner to market a fair trade product: Malongo coffee under
the Max Havelaar label.
Carrefour fair trade products come from some 50 small-producer
cooperatives, located mainly in South America, but also in Asia and
Africa. The Fairtrade label guarantees such producers a higher income and
a lasting partnership, and certifi es that their production incorporates eco-
friendly practices (GMO-free products, optimised natural-resource
management etc.). In Spain, a range of textile products made in India
by women in precarious situation is sold in partnership with the Creative
Handicraft association.
In France, the new line of Carrefour BIO coffees launched in 2013 is
100% fair trade.
KEY FIGUREIn France, Carrefour is amongst the leading players in this market with 470 items, including 26 Carrefour products with the Fairtrade label.
Group 2013 2012 2011 2010 % vs. 10
Sales (incl. VAT) of fair trade products (in millions of euros) 110 99 105 94 17.3
Number of Carrefour-brand fair trade products (number of listings) 93 115 100 77 20.8
Like-for-like BUs (scope: 100% of 2013 consolidated sales, excl. VAT).
2.2.5 OPTIMISING OUR BUSINESS OPERATIONS’ ENVIRONMENTAL PERFORMANCE
In addition to its “Antigaspi Waste Reduction Plan”, Carrefour is continuing
programmes implemented as part of its commitment to fi ght climate
change and protect the environment. Using resources effectively and
protecting the environment in which Carrefour operates contributes to
the Group’s economic performance and sustainability over the long term.
2.2.5.1 Managing environmental risksEnvironmental risks are covered on page 100 . Like other risks, they are
incorporated into the risk analysis carried out by the Group Sustainable
Development department (see page 18 ).
Accidental risks are managed by monitoring regulatory compliance.
Carrefour’s exposure to natural risks and procedures to compensate for
the impact of confi rmed risk are described on page 99 .
2.2.5.2 Carrefour’s organisation for addressing environmental issues
In keeping with the principle of subsidiarity, which prevails in the Carrefour
Group’s management methods, each country creates the organisation
best suited to its situation in terms of environmental goals and achieving
the objectives set forth by the Group. Analysis, regulatory monitoring,
development of action plans and investment therefore take place
locally at the initiative of country management or store directors, with
the cooperation of maintenance employees and all other employees.
A tool to measure and report environmental performance of stores (energy
and water consumption, waste production, etc.) has been deployed
at Group and country level to monitor and manage the facilities. All
countries have defi ned environmental performance goals in such key
areas as energy, greenhouse gas emissions and reducing waste and
water consumption, and they have a scorecard for monitoring purposes.

2013 REGISTRATION DOCUMENT 52
2 SOCIAL RESPONSIBILITYReview of CSR approach in 2013
2.2.5.3 Environmental evaluation and certification approaches
Approaches for environmental certifi cation of products is described on
pages 47 to 51 .
In all countries, Carrefour has established a continuous improvement
system using the “Plan Do Check Act” (PDCA) system to manage its
environmental performance. To measure performance, a non-fi nancial
reporting system has been established, and the Group relies on verifi cation
by an independent third party of the prepared and published information
(see page 71 ).
Locally, and on certain issues, countries may choose certifi cation when the
context, specifi cally regulatory, means that the certifi cation will create value
for the Group. For example, this is the case for the ISO 50001 certifi cation
issued to Carrefour for committing the banner and its employees to an
energy policy in French stores and head offi ces (see page 28 ).
2.2.5.4 Designing more eco-friendly stores and ensuring clean sites
Each country has a Property entity whose responsibilities include
identifying and implementing the principles of sustainable construction,
including when building, expanding, and renovating sales areas. The
approach contributes to the Group’s commitment to preventing waste.
Carrefour Property, the real estate company that manages the commercial
real estate assets of the Carrefour Group in France, Italy and Spain, has
adopted three documents that guide its practices to help better protect
the environment:
W the Eco-Construction Charter, under which the Group strives to
implement innovative solutions that preserve the environment;
W the Landscaping Charter, under which the Group is committed to
managing green spaces with respect for local biodiversity; and
W the Biodiversity Charter, whose goal is to expand best practices that
foster biodiversity. It is a prerequisite for any land-use project.
Guided by these framework documents, Carrefour Property strives to
integrate environmental best practices into each stage of a building’s
life cycle.
During the design phase:
W a store’s architecture is chosen to optimise its energy consumption,
with access to natural lighting, materials with high thermal inertia,
optimised orientation of façades, and green roofs or roofi ng with high
solar refl ectivity to limit the need for air conditioning; Carrefour also
works to facilitate universal accessibility in its stores;
W preference is given to natural materials that are eco-friendly: wood
from sustainably managed forests, glues, paints, stains and varnishes
bearing the NF Environment label, European Ecolabel or any other
equivalent environmental certifi cation, and materials that require low
levels of energy for their production or are made using abundant
natural materials;
W renewable energies (solar water heaters, heat pumps, wind turbines,
etc.) are considered whenever possible; and
W each project is designed to integrate seamlessly into the natural or
urban landscape and to minimise environmental impact.
During the construction phase, Carrefour also works to limit its impact.
In France, the companies that worked on construction sites for Carrefour
stores in 2012 signed the Green Site Charter, whose recommendations
include sorting waste, cleaning earth-moving machinery’s wheels, and
limiting noise disturbances.
For the operations phase, environmental criteria are included in the
rental agreements and specifi cations for outfi tting stores, calling for
energy-effi cient equipment, eco-friendly materials, and waste sorting.
One practical example is the S’Estada shopping centre. Carrefour
Property Spain obtained planning permission in June 2013 for the project,
which will be the largest shopping centre on Majorca; its architecture
is inspired by the Mediterranean environment and the cultural and
architectural heritage of the Balearic Islands. The centre will feature the
latest technological innovations to limit energy use while focusing on
integrating the construction into the landscape and choosing natural
materials.
The Mondevillage shopping centre, which opened in 2013, is integrated
into its environment and leaves plenty of space for biodiversity, with
1.5 hectares of green spaces, 300 apple and pear trees, nest boxes and
beehives. With its high-performance equipment and energy management,
Mondevillage should also be the fi rst shopping centre to receive BBC
certifi cation (Bâtiment Basse Consommation - low energy consumption
building).
The L’Escapade shopping centre in La Chappelle-Saint-Luc, which
opened in 2012, was recognised in 2013 by the French National Council
of Shopping Centres (CNCC), which awarded it an honourable mention
for its sustainable development-based approach and environmental
qualities. The 100% LED car park lighting and the Carrefour hypermarket,
with its particularly innovative technologies for limiting energy consumption,
drew the attention of sector professionals.
In India, the property company has partnered with the Indian Green
Building Council to develop an approach to store design and development
that combines high levels of customer satisfaction (location, accessibility,
internal paths, equipment design and ergonomics, and safety) and
environmental protection (materials, energy effi ciency, local supplies,
an emphasis on natural lighting, north-facing windows, etc.). This
approach, long driven by an interest in environment certifi cations, earned
the Meerut Cash & Carry store a gold LEED certifi cation in 2013. The
Bangalore store, which opened in late 2013, also earned a platinum
LEED certifi cation in February 2014; the platinum certifi cation is the
highest available for sustainable construction. The buildings offer improved
environmental performance over a standard store and generate signifi cant
resource savings. In Bangalore, for example, the savings are 57% for
energy, 61% for LED lighting, and 39% for refrigeration systems.

2013 REGISTRATION DOCUMENT 53
SOCIAL RESPONSIBILITY
2
Review of CSR approach in 2013
2.2.5.5 Reducing stores’ carbon footprint
The Group has set itself an ambitious goal: reducing its CO2
emissions by 40% compared to 2009 levels in four European
countries – France, Spain, Italy and Belgium – by 2020. More generally,
the Group is committed to reducing its emissions everywhere it operates.
Through this commitment, the Group intends to reduce its impact on
climate change.
Greenhouse gases linked to store operations are mainly attributable to
the energy the stores use and the refrigerant fl uids that are necessary to
keep food cold. Carrefour acts to reduce energy consumption through
its “Antigaspi Waste Reduction Plan” (see page 24 ); the programmes
for refrigerant fl uids are presented below.
The Carrefour Group’s carbon footprint
To assess its carbon footprint, in 2007 the Group implemented a
greenhouse gas (GHG) emissions reporting system based on the
guidelines of the GHG Protocol, an international GHG accounting
standard. In 2013, total greenhouse gas emissions (direct and indirect)
were 3.7 million t. CO2 eq.
GHG EMISSIONS BY SOURCE (IN T. CO2 EQ.) IN 2013
Scope 1 Refrigerants, Gas and Fuel 1,775 48%
Scope 2 Electricity 1,600 43%
Scope 3 Logistics 311 9%
Like-for-like BUs (scope: 100% of 2013 consolidated sales, excl. VAT).
2013 fi gures verifi ed with a result of reasonable assurance.
GHG EMISSIONS BY ZONE (IN T.CO2 EQ.)
France 20%
Europe (excluding France) 37%
Asia 18%
Latin America 25%
Like-for-like BUs (scope: 100% of 2013 consolidated sales, excl. VAT).
2013 fi gures verifi ed with a result of reasonable assurance.
KEY FIGURESA 26.7% reduction in CO2 emissions linked to refrigerant and energy consumption by stores in France, Spain, Belgium and Italy compared to 2009 levels (goal: 40% less by 2020).
Reducing emissions from cooling
Refrigerants used to run the refrigeration systems represent the second
largest source of greenhouse gas emissions generated by the stores’
activity. To reduce these emissions, the Carrefour Group launched a
strategy composed of three phases:
W reduce consumption of refrigerant fl uids in particular by identifying
and reducing leaks, with the goal of limiting them to 10% of the gas
used in its facilities;
W substitute alternative or natural fl uids with a lower environmental impact
for hydrofl uorocarbons (HFCs); and
W gradually equip the Group with closed refrigeration units that can
run on natural fl uids.
Carrefour has also pledged to stop using HFC fl uids in its new
cooling facilities as of 2015.
In some countries, the Group has launched a diagnostic analysis aimed
at measuring fl uid leak rates and identifying their causes, with a view to
introducing corrective measures. Between 2009 and 2013, the quantity
of refrigerant gas refi lled in cooling facilities following leaks dropped by
18% per sq.m of sales area.
Several types of gas may be used in refrigerator and freezer units. Their
use is subject to increasing regulatory constraints. At Carrefour stores
in Europe, all food-chilling facilities that use hydrochlorofl uorocarbons
(HCFCs) will soon be phased out. The use of HFCs (hydrofl uorocarbons)
will also be reduced due to their impact on the greenhouse effect.

2013 REGISTRATION DOCUMENT 54
2 SOCIAL RESPONSIBILITYReview of CSR approach in 2013
Carrefour is thus testing various alternative systems that can use natural
fl uids like carbon dioxide (CO2), which have a lower impact on climate
change and ozone layer destruction. Moreover, CO2 requires very tightly-
sealed refrigeration facilities, which signifi cantly reduce leak risks. The
new-generation equipment also consumes less fl uid and 10%-20%
less electricity.
After the fi rst conclusive tests, the Group began taking advantage of
replacements to gradually convert its facilities that run on fl uorinated fl uids
to instead use scalable mixed CO2 solutions or 100% CO2. Now, in some
new stores, completely renovated stores or stores whose cooling facilities
are reaching their end-of-life, the Group is using CO2 for both freezing
and refrigeration. This makes Carrefour a leader in the European countries
where it is present, having rolled out natural solutions to 133 stores as
of the end of 2013, including 36 with 100% CO2 solutions. By investing
in natural cold-production solutions, Carrefour has become a major
player in developing the sector, helping to improve operator expertise,
and promoting innovative solutions to the market while demonstrating
their effectiveness and competitiveness.
Some countries, like Italy, are developing remote c entralised m anagement
systems to control the temperature in refrigeration units and cold-storage
areas. This remote management optimises energy consumption while
reducing leaks and maintenance costs. As of the end of 2013, 83 stores
were equipped with remote management systems in Italy.
2013 2012 2011 2010 % vs. 10
Quantity of refrigerants refi lled due to leakage (in kg/1,000 sq.m of sales area) 39.1 38.8 40.0 47.7 ( 18.0)%
Like-for-like BUs (scope: 76% of 2013 consolidated sales, excl. VAT) - excluding: HM: BR, AR, TW/SM: BR, AR.
Reducing vehicle fl eet emissions
In France, Carrefour signed the “CO2 Objective Charter” (covering its
own fl eet) with the ADEME in 2012, and encourages its carriers to make
the same commitments. 214 carrier groups, who handle 70% of the
Group’s shipping, have already signed it. Through this charter, carriers
make a three-year commitment to an action plan that involves improving
vehicles’ aerodynamics, choosing a highly energy-effi cient system for
refrigerated vehicles, improving consumption monitoring, setting up eco-
friendly driving courses for drivers, and raising awareness among carriers.
The Group also tests and promotes innovative solutions, particularly
regarding vehicles:
W six hybrid delivery lorries in different French cities;
W a bioethanol vehicle that runs on recycled French grape pomace;
W a 100% electric 16-tonne shipping lorry being tested in metropolitan
Lyon, France. This quiet, non-polluting lorry has reduced CO2 emissions
by nearly 90%; and
W three lorries fuelled by biomethane, which is generated by recycling
organic waste from stores. As of the end of September 2013, these
efforts had prevented 100 tCO2 of emissions.
Promoting renewable energy sources
For several years, Carrefour has been testing renewable energy sources
for its activities: geothermal (Italy), wind turbines (France), photovoltaic
solar power (Spain, Poland), solar water heaters (Turkey), etc. Especially
when new sites are opened, and depending on local contexts, the
Carrefour Group takes every opportunity to increase its use of renewable
energy sources.
2.2.5.6 Reducing water pollution and consumption
In 2013, Carrefour conducted an analysis of its water-related issues:
direct and indirect depletion, direct and indirect discharge of organic
materials, pesticides, industrial discharge, waterproofi ng and changed
soil use, deforestation, etc. Carrefour is committed to measuring and
reducing its stores’ water consumption as well as addressing the issue
of water in its procurement chain and during product use.
Reducing stores’ water consumption
Sources of water consumption vary with the size and operations of the
different stores. The operations that use the most water are the food-
preparation areas (meat, fi sh, bread, pastries and deli), the cleaning of
equipment and fl oors, the production of ice for the fi sh displays, hand-
washing and staff restrooms, and the watering of interior plants and
outdoor green spaces.
From 2010 to 2013, water consumption dropped by 9.1% at Group
level. This progress is the result of a long consumption-monitoring and
awareness process.
Stores around the world are gradually adopting solutions designed to
limit their consumption, such as water-saving taps, motion-detection taps
and water-free urinals, systems for collecting and recycling rainwater
for usages not requiring drinking water – a solution that could reduce a
hypermarket’s consumption by 10%.

2013 REGISTRATION DOCUMENT 55
SOCIAL RESPONSIBILITY
2
Review of CSR approach in 2013
2013 2012 2011 2010 % vs. 10
Quantity of water consumed (cu.m/sq.m of sales area) 1.68 1.74 1.79 1.85 ( 9.1)%
Like-for-like BUs (scope: 92% of 2013 consolidated sales, excl. VAT) - excluding: HM: BE, AR/SM: BE, AR.
KEY FIGURES3.3% water saved in one year per sq.m of sales area Group-wide.
14.6 million cu.m consumed at Group stores in 2013 (excluding Argentina).
Promoting water-friendly procurement
Carrefour helps its suppliers with their water management through
initiatives including specifi cations for Carrefour Quality Line products
and the sustainable development self-diagnostic tool provided to suppliers
of Carrefour products. Some Carrefour Quality Line farmers, for example,
use the innovative technique of drip irrigation to prevent water loss via
evaporation. The Company Fruits et Compagnie, for example, winner
of the 2012 Sustainable Development Awards, was recognised for its
underground “ferti-irrigation” technique for orchards. The technique
prevents the evaporation caused by traditional watering and allows
the farm to accurately measure how much water is necessary using
underground moisture probes. As a result, the Company has generated
a 30% water savings over three years in its young orchards.
Offering products with a small footprint and raising customer awareness
Carrefour has improved the environmental characteristics of its own-brand
plant care products for the garden. In 2009, the Group discontinued sales
under its brand of pesticides containing glyphosate, a substance classifi ed
as toxic and dangerous for aquatic organisms. In 2011, Carrefour began
offering its customers an alternative to these products: 86% of the active
substance in Carrefour’s Finalsan herbicide, for example, is an exact
reproduction of a natural ingredient derived from geraniums.
The Group offers a product range to limit water pollution and consumption:
water-saving fi xtures (mixer taps), rainwater collectors, eco-certifi ed
cleaning products, etc. These products have been regularly highlighted
in dedicated catalogue pages in honour of World Water Day over recent
years.
Finally, Carrefour regularly holds consumer awareness activities during
World Water Day and World Wetlands Day.
2.2.5.7 Limiting the environmental impact of commercial publications and office paper consumption
Since 2005, the Carrefour Group has been implementing a comprehensive
approach involving all its commercial publications, in line with its
responsible procurement approach (see pages 47 to 51 ). In particular,
the Group committed to using only FSC- or PEFC-certified paper or
recycled paper for its European commercial consumer publications
by the end of 2012.
Since 2012, nearly 100% of the paper used Group-wide for its commercial
publications has been recycled or certifi ed. At the same time, Carrefour
has been limiting the quantity of paper used for its publications by reducing
paper weights, going digital, and optimising distribution. Carrefour is also
working with printers to reduce the impact of its commercial publications.
All of Carrefour’s printers are committed to an eco-friendly approach
(Imprim’Vert, FSC, PEFC, ISO 14001 etc.).
2013 2012 2011 2010 % vs. 10
Quantity of paper purchased for commercial publications (in kg/sq.m of sales area) 15.9 18.3 20.1 20.4 ( 22.0)%
Like-for-like BUs (scope: 100% of 2013 consolidated sales, excl. VAT).

2013 REGISTRATION DOCUMENT 56
2 SOCIAL RESPONSIBILITYReview of CSR approach in 2013
In future years, Carrefour hopes to further improve the environmental
quality of its offi ce paper. In 2013, efforts began in France, beginning
with improved procurement. As of January 1, 2014, 100% of the offi ce
paper purchased in France is now FSC-certifi ed. Carrefour was ranked
No. 1 general retailer by the WWF in its study: “PAP 50 C ompanies
for 2013”, which ranks companies according to their commitment to
a responsible paper policy and performance in terms of consumption,
recycling, and responsible purchasing.
KEY FIGURE99.4% of paper in Carrefour catalogues is certifi ed and/or recycled.
2.2.5.8 Air, water and soil pollutionThe Carrefour Group’s commercial and retail operations release low
levels of emissions into the air, water and soil, apart from greenhouse gas
emissions. The initiatives aimed at reducing greenhouse gas emissions
are described on the previous pages.
Sites
Equipment operating on fossil fuels that generate emissions into the air
(dust or smoke) such as generators, compressors and condensers are
equipped with recovery systems or fi lters. Thanks to the nature of stores’
activities, the wastewater leaving sites is not laden with major pollutants.
In certain countries, wastewater treatment and recycling systems have
been introduced.
Carrefour-managed service stations in France and Spain, for example,
are equipped with facilities designed to prevent environmental risks and
unpleasant odours, including:
W double-bottom tanks and concrete storage tanks;
W systems designed to recover vapour from petrol storage tanks and
deposits when tanks are fi lled;
W a braking system and fi ll valves to avoid overfi lling and leaks, which
contaminate soil;
W tight seals on the hose between tank and petrol pump to avoid ground
contamination;
W adaptors on petrol hoses and leak-detection equipment on tanks;
W hard pavement around the fi lling area to avoid fuel infi ltration into
the ground;
W decanting systems to avoid contamination of the sanitation network,
and a system designed to detect water contamination by hydrocarbons.
The Group constantly monitors the regulatory compliance of its facilities
and closely tracks fuel inputs and outputs to control the risk of leakage.
Shipping fl eet
Carrefour strives to improve its fl eet with cleaner, quieter lorries:
W in Belgium, since 2012, 100% of lorries have been Euro 5-compliant;
and
W in France, 96% of all distance is travelled by a dedicated fl eet that is
Euro 4 and 5 compliant (compared to 93% in 2012).
Compliant with the EEV (Enhanced Environmentally-Friendly Vehicles)
standard – the strictest to date – France’s fl eet has now increased to
94 vehicles.
2.2.5.9 Preventing noise pollutionCarrefour store operations generate little to no major noise disturbances.
Generators or compressors that cannot be installed underground are
covered with anti-noise equipment or placed behind insulating walls.
When noise is caused by obsolescent equipment, that equipment is
replaced. In all countries, maintenance teams ensure respect for noise
regulations.
However, operations linked to goods transport may generate noise
disturbances, particularly for local residents during delivery periods. In
2013, Carrefour continued its noise-reduction strategy, an approach for
which Supply Chain France won the Gold Decibels award in December
2011. This award recognises companies that have made signifi cant
progress in this area. In 2012, in the context of its membership in the
Demeter Club and together with the Certibruit organisation, Carrefour
also participated in the development of a new “Respect for local residents
during night deliveries” label, which recognises shippers and retailers
that signifi cantly reduce the noise disturbances they generate, opening
the way for an increase of night deliveries. In 2013, Supply Chain France
worked to promote and roll out this label.
In concrete terms, Carrefour France has also doubled its number of
silent lorries since 2010. At the end of 2013, 300 urban stores were
supplied by a fl eet of 160 vehicles that meet the PIEK standard, a label
guaranteeing sound levels of under 60 decibels.
Warehouse and store deliveries: continuing efforts toward multimodal solutions
In terms of alternative transport – waterway, rail and multimodal solutions
combining rail/road or barge/road – Carrefour continued its efforts in
the countries where the infrastructures made it possible.
In France, over 5.8 million kilometres were saved in 2013 by using
multimodal transport, or the equivalent of 8,300 fewer lorries for a savings
of 4,000 tonnes of CO2 emissions. Upstream (deliveries from suppliers
to warehouses), 42% of non-food imported products were routed using
a multimodal solution.
Downstream (deliveries from warehouses to stores), multimodal transport
represented 8% of all transnational fl ows, or 2.3 million kilometres of road
transport saved. Indeed, combined rail/road delivery is effective for some
hypermarket deliveries of non-food products, and this has taken 3,200
lorries off the roads. In Spain, Carrefour continues to favour rail transport.
In Belgium, Italy and Brazil, Carrefour favours waterway or rail transport
or cabotage (waterway/sea).
2013 REGISTRATION DOCUMENT 57
SOCIAL RESPONSIBILITY
2
Review of CSR approach in 2013
Several collaborative projects have been developed, including a very
innovative platform initiated in France in partnership with Danone Eaux
France and ID Logistics. This project has created a regional industrial
inventory for Danone Eaux France at Carrefour’s Grans Miramas site, which
has the advantage of being connected to a railway. This site supplies
over 120 Carrefour stores in the southeast, as well as the warehouses
of other retailers operating in this region. With the volumes pooled in this
way, the objective is to send trains fully loaded with goods from Danone
Eaux France’s plants. This pooling has already saved 415 tonnes of CO2
emissions per year (with 1,000 fewer lorries on the roads). To support its
optimisation efforts, Carrefour has invested in high-performance tools.
A Transport Management System (TMS) aimed at better management
of data and optimised delivery rounds has been implemented in France.
Other countries, such as Argentina, Italy and Poland, also rolled out the
TMS in 2012.
Improving the environmental effi ciency of warehouses
Warehouses’ environmental performance is steadily improving.
In France, in 2008, Carrefour introduced a set of sustainable development
indicators, initially for consolidated warehouses and then for warehouses
managed by service providers. Since 2005, an outside fi rm has been
carrying out sustainable development audits of French warehouses to
identify best practices and encourage improvements.
50 audits were performed in 2013 in France, with an average 95.5%
compliance with the reference system, compared to 94.7% in 2012.
In 2013, French warehouses continued to improve the energy effi ciency
of their heating facilities, refrigeration equipment and lighting systems
(such as low-consumption lights and motion detectors that activate
lights only when needed). The result: electricity consumption has been
reduced by 12% compared with 2010 levels. Carrefour Belgium has
reduced energy costs by 20% at its fresh produce warehouse in Nivelles
and 50% at its non-food warehouse in Cargoville.
In France, certain warehouses have begun using 100%-recyclable
cardboard pallets. Weighing only 3.3 kg compared to the 20 kg of
a wooden pallet, this recyclable cardboard version reduces waste
quantities while improving handling conditions and signifi cantly reducing
the tonnages transported. In 2013, 159,054 pallets were recycled.
Logistics organises the collection of cardboard and plastic packaging
waste for stores in France, in particular supermarkets and convenience
stores, which do not have high enough volumes for removal by a service
provider. Over the entire logistics network, the waste-recovery rate is 55%.
2.2.6 CARREFOUR ECONOMIC PARTNER AND LOCAL PLAYER
2.2.6.1 Carrefour, partner to local economies
Supporting local economies all over the world
Promoting local suppliers and their products
Since the very beginning, the Group has given priority to local procurement
of products, particularly food products, so they are produced in the
same country where they are sold. In Argentina and Brazil, the share of
Carrefour food products sourced from local suppliers is close to 100%.
Carrefour thus supports the growth of thousands of SMEs and small
producers in all the countries where it operates, while helping to lower
CO2 emissions created by the transport of imported goods. The Group
develops long-term relationships with local businesses that improve their
production quality and boost their growth.
In Belgium, Carrefour teams select regional products from artisans
located within 50 km of the stores, and promote them in a dedicated
store area and via special events. At the same time, in Taiwan, Carrefour
features local products by stamping them with “MIT: Made in Taiwan”.
Carrefour Romania has launched a campaign to “Choose Romanian
Products,” the result of an effort with 1,500 local fruit and vegetable
farmers who supply stores with local produce. This contributes to
developing the local economy. In addition, Carrefour Romania signed
an agreement in July 2013 with the “Bio Romania” association that
provides Carrefour hypermarkets with access to organic produce grown
in the country.
In China, the Direct Purchase programme launched in 2007 aims for
intermediary-free procurement at national and local levels. This makes
it possible to offer customers low prices for fruit and vegetables and
to guarantee optimum income for farmers. To support this approach,
Carrefour China launched an initiative that allowed customers to use
their mobile telephones to access information on the traceability of these
products, the origin of production and the date they were delivered to the
stores. Since 2007, the Direct Purchase programme has made it possible
to buy over 440,000 tonnes of fruit and vegetables from over 1,225,000
farmers, and nearly 60 training courses have been set up for farmers.

2013 REGISTRATION DOCUMENT 58
2 SOCIAL RESPONSIBILITYReview of CSR approach in 2013
Improving commercial relationships and cooperation with SMEs
On September 16, 2013, Carrefour signed the Supply Chain Initiative,
a European voluntary framework to ensure fairness in B-to-B relations
along the food supply chain. More than 450 companies in the retail and
industry sector have signed it to date. The Group is considering what
internal adaptations will be necessary (training, mediation system, single
point of contact, etc.) to improve collaboration with producers.
In addition, Carrefour has implemented specifi c tools to work more
effectively with the various players involved in the supply chain. In Belgium,
for example, Carrefour has adopted a simplifi ed agreement for small
local producers.
In September 2013 in France, the French Federation of Enterprises
and Entrepreneurs (Fédération des entreprises et entrepreneurs de
France - FEEF) and the Federation of Retail and Distribution Companies
(Fédération du commerce et de la distribution - FCD), of which Carrefour
is an active member, committed to a guide for best practices in commercial
relationships as part of a voluntary policy of cooperation with SMEs.
Both the FEEF and the FCD have decided to adapt the rules governing
business relationships to fi t SMEs. The “differentiated SME platform”
covers four major points: the negotiation period, the length of agreements
with national brands, rates and price volatility, and competition with
Carrefour’s own brands.
Several programmes were launched in China in 2013 with the aim of
supporting and promoting the activities of local SMEs, both producers and
suppliers of Carrefour stores, and helping create jobs both directly and
indirectly. For example, agreements were signed to formalise partnerships
between Carrefour and its suppliers and jointly defi ne investment and
marketing plans, enabling the parties to focus their common efforts on
selling and increasing market share. Nearly 500 suppliers of food and
non-food products have participated in the programme. On average,
they have seen their sales increase by 40%. Carrefour China has also
partnered with a bank to develop a programme to fund working capital for
its suppliers. Signing a supply agreement with Carrefour opens the door
for easy access to low-interest loans. This assistance allows suppliers to
consolidate their operations and is therefore particularly appreciated by
small businesses; more than 1,000 suppliers have currently signed up
to the programme, for a total loan value of approximately 1 million yuans.
With these programmes, Carrefour China has continuously improved its
ranking as preferred retailer among suppliers, earning second place in
2013 in the Suppliers Most Satisfi ed Retailers Awards.
The Carrefour Quality Line partnership
The 1992 launch of the fi rst Carrefour Quality Line (CQL) products
in France marked the beginning of Carrefour’s commitment to French
producers. In 2013, the initiative was renamed Origine et Qualité
Carrefour in France and the partnership with farmers was strengthened
this year when the Group established three-year agreements for all of
the relevant lines in France (meat, fi sh, seafood, fruit and vegetables,
cheese, eggs and honey). Each Carrefour Quality Line has given rise to
long-standing partnerships designed to develop, together with all supply
chain players, a quality approach from fi eld to plate, and to ensure outlets
for the products. These lines therefore help sustain and promote local
business and regional expertise. Carrefour works closely with all network
players (agricultural producers, animal breeders and processors), taking
into account their needs and helping them to stay abreast of regulatory
developments, implement eco-friendly practices, reduce their pesticide
use and improve animal well-being.
The new three-year agreements, signed with all partner producers, initiate
a long-term partnership that can serve as the foundation for lasting, trust-
based relationships, help develop responsible production methods, and
ensure continuity of operations.
KEY FIGURES74% of the food products sold to Carrefour brands in the various countries where it operates come from local suppliers.
11% of Group sales from traditional fresh produce are achieved through Carrefour Quality Lines.
414 lines around the world.
Over 19,000 producer partners in France and over 22,000 throughout the world.
Refl ets de France, Terre d’Italia, De Nuestra Terra brands
Among the regional product ranges that Carrefour develops, the Refl ets de
France brand involves more than 220 local French producers (excluding
fruit and vegetables), for whom it provides total sales of over €330 million.
In 2013, 80% SMEs working in partnership with Carrefour to develop
more than 480 Refl ets de France products were French. Created in
1996 with the aim of cooperating with SMEs in a common project, this
brand allows customers to experience the traditional food products of
various French regions. To take this support of French SMEs even further,
Refl ets de France has adopted an international outlook since October
2013 to help French SMEs export. Refl ets de France products are now
available to customers of Carrefour hypermarkets in China and Taiwan.
The related initiatives introduce local consumers to these “made in France”
products and the French lifestyle. For example, a hundred products were
featured during the Autumn Wine Fair in China, and in Taiwan more than
40 products were showcased for promotional events. These included
catalogue pages, a digital communications campaign, special staging
and in-store tastings. Encouraged by its success, Carrefour plans to
continue this development in Asia in 2014 and export the products of
French producer partners to other countries.

2013 REGISTRATION DOCUMENT 59
SOCIAL RESPONSIBILITY
2
Review of CSR approach in 2013
KEY FIGURESIn 2013, the Refl ets de France range off ered 486 products in France.
220 local producers, 60% of whom have been a part of the Refl ets de France brand since it was created.
In Italy, the Terre d’Italia range promotes traditional Italian food products
and the expertise of the local SMEs that produce them. Over 90% of
Terre d’Italia product suppliers have fewer than 50 employees. By working
closely with 120 producers, Carrefour Italy puts a national range of over
300 regional products within everyone’s reach. The range, fi rst launched
some ten years ago, is exported to several of the Group’s European
countries (for example, Belgium and Romania). In Spain, De Nuestra
Tierra is the equivalent of the Refl ets de France products for France.
Carrefour BIO: priority focus on French producers
In 1992, Carrefour launched its fi rst organic product: the Boule BIO.
21 years later, the Carrefour Group offered 2,150 organic food listings
under its BIO brand in 2013. In France, the banner offers 962 organic
food listings and 774 organic cotton textile products.
More than 70% of the Carrefour BIO organic food products in French
stores come from French production sites. Carrefour works with over
200 agricultural and industrial partners. The priority for organic produce is
clearly focused on French procurement, with some 40 different suppliers
involved in the sourcing. The share of imported products concerns mainly
exotic products and citrus fruits not grown in France, as well as organic
products from elsewhere in the European Union when French production
is insuffi cient.
KEY FIGURES€336 million in Carrefour BIO food product sales worldwide.
Over 2,150 Carrefour BIO organic product listings off ered in the countries.
Supporting the Sustainable Development approach of suppliers
By helping its suppliers to adopt a sustainable development approach and
by highlighting best practices, Carrefour boosts their social performance
as well as its own.
Launched in France in 2006, the sustainable development self-
assessment tool is a detailed self-evaluation framework designed in
conjunction with the WWF and ADEME, the French Environment and
Energy Management Agency. It is accessible to suppliers online and
includes 49 assessment criteria, based on four central pillars refl ecting
the principles of the ISO 26000 standard:
W sustainable development management and policy;
W environmental performance;
W corporate social performance; and
W economic performance.
Carrefour’s aim is to ensure that all of its suppliers answer all questions
and implement practical sustainable development initiatives. Carrefour
provides them with support to achieve this goal using the tool. The self-
assessment covers all the topics related to sustainable development
(responsible purchasing, local suppliers, eco-design, waste management,
energy consumption, biodiversity, employee health and safety, etc.). The
tool provides suppliers with some 20 advice sheets and best practice
examples, and allows them to compare their average with that of other
suppliers in their activity sector. Carrefour also arranges for consultants
to visit some businesses to identify their best practices, help them to
pinpoint improvement goals and draw up action plans.
In 2013, over 5,289 suppliers of Carrefour brand food products around
the world used the self-assessment tool. The tool enables Carrefour
to identify the suppliers who are most exemplary and “committed” to
sustainable development and to recognise that commitment with an
award. For the fi rst time, the fi fth Sustainable Development Awards for
suppliers, held in November 2013, included a waste reduction prize
(see page 25 ).
In Poland, a day of training on the CSR self-assessment was offered to
suppliers of Carrefour products, with an emphasis on measures to reduce
waste: energy effi ciency, food safety, packaging, and waste management.
128 people participated, representing 78 suppliers.
2.2.6.2 Carrefour as a dynamic player in employment and a partner in local life
Stores driving growth
With nearly 10,000 stores, Carrefour is a major player in the socioeconomic
development of the places in which it operates. Carrefour stores are
signifi cant centres of direct and indirect employment. In each Carrefour
country and each district/region where it has a store, the banner follows
a local recruitment policy. In France, with over 106,000 employees,
Carrefour represents one of the biggest private employers in the country.
A Carrefour hypermarket in France, for example, employs an average of
300 people. Every new store creates jobs, which mainly benefi t people
who live in its geographical area.
Its emphasis on local employment and recruitment has enabled Carrefour
to play a key role in the professional integration of those in its employment
pools, in particular with the 2004 signing of the Workplace Diversity
Charter and by taking very concrete action to promote employment for
young people and integration into the workforce for people experiencing
employment diffi culties.

2013 REGISTRATION DOCUMENT 60
2 SOCIAL RESPONSIBILITYReview of CSR approach in 2013
Promoting youth employment
The Carrefour Group is committed to contributing to the local development
of the communities in which it operates and has always focused on
recruiting local young people through work-based learning schemes
and/or by providing mentoring for new recruits.
In France, Carrefour strengthened its commitment to youth employment
even further in 2013 by signing:
W the Jeunes et Entreprises (Young people and companies) commitment,
along with many other corporate members of the AFEP;
W the employment pact by the hypermarkets, under which hypermarkets
agree to hire 10,000 young people in three years, including 3,000
in 2013;
W an Entreprises et Quartiers (Companies and neighbourhoods) charter
with the French Minister responsible for Urban Affairs, which sets
forth the general principles of Carrefour’s efforts to promote jobs in
diffi cult areas; and
W the future jobs convention, signed with the Ministry, which binds the
Group to hire 1,000 young people for unqualifi ed local assignments
under full-time, permanent contracts (300 hires in 2013, 700 in 2014).
In France, a work/study day was held for the fi rst time in 2013, with
5,200 CVs submitted.
Carrefour is also pursuing its partnership with an association called
“Talent in our neighbourhood”. More than 380 young people have been
sponsored since this partnership began.
Other countries have also taken part in important programmes to help
young people integrate society and the workplace. Brazil’s Conexão
programme, for example, is designed to improve employability for young
people experiencing economic and social exclusion by giving them access
to a fi rst job. The 2013 objective was to train 4,700 young people and
offer job contracts to more than 2,000 of them.
Given the diffi culties of fi nding professionals in the retail sector, Carrefour
Spain has created a “School for Fresh Produce”. The school trains
unemployed young people under the age of 30 and helps them join the
fresh produce business functions. In 2013, 420 young people were hired.
France’s École Carrefour was created to promote the recruitment and
qualifi cation of young people as well as training and skills development
for non-executive employees. Each year, it accepts candidates under
professionalisation and apprenticeship contracts. In 2013, 2,811 CQP
“retail employee” professionalisation contracts were hired at hypermarkets
and 270 at supermarkets, while 27 “order preparation” professionalisation
contracts were hired in Supply Chain positions.
Carrefour also encourages business start-ups and a spirit of
entrepreneurship by facilitating access to franchising. Since 2003,
Carrefour Convenience has been running a two-year training programme
for the assistant store directors with a view to helping them open a store
under a lease management scheme. 120 people were trained between
2010 and 2013. Since 2013, the training has been done in partnership
with the CNAM. It is certifi ed and recognised by the RNCP (Répertoire
National des Certifications Professionnelles - French national list of
professional certifi cations).
In China, Carrefour is forming partnerships with business schools and
universities to hold recruiting sessions and facilitate student access
to internships or teaching projects within the Company. A scholarship
programme funded by Carrefour also provides deserving students with
access to a higher level of education. Carrefour plans to recruit 1,000
young graduates in China over the next three years.
Promoting access to employment for those who have diffi culty fi nding work
In 2013, the Group continued its partnerships with key players in
employment and social integration. In France, the Group signed ten
regional agreements with Pôle Emploi (French employment agency)
to provide an appropriate local framework for the historical partnership
between Pôle Emploi and Carrefour. Carrefour has also recruited
employees through the Préparation Opérationnelle à l’Emploi (POE
– Getting Ready for Work) programme, again in partnership with Pôle
Emploi. Objective: To support new employees through training to get
them ready for starting work. This year, 20 stores have committed to a
special initiative for food-industry careers.
In addition, Carrefour France is pursuing its partnerships with Missions
Locales (local organisations for employment), PLIE - Plan Local pour
l’Insertion et l’Emploi (Local plan for integration and employment), Cap
Emploi and promoters of social integration such as Restos du Cœur,
Emmaüs Défi , ANDES, and Macadam.
Carrefour as a partner in local life
The result of constructive cooperation with elected offi cials and local
players, a Carrefour store is a centre of neighbourhood life, creating
social ties and responding effectively to residents’ everyday needs. The
Group’s stores and shopping centres are designed to contribute to local
life, create social ties, and energise local communities.
The example of Mondevillage, a shopping hub created by Carrefour
Property in 2013, clearly illustrates Carrefour’s commitment to meeting
specifi c local needs. In Mondeville, the property company proposed a
complementary complex designed to refl ect new consumer habits and
meet the needs for urban restructuring in the business district, while
focusing on the preservation of the environment and biodiversity. The
partnership formed with public and private stakeholders in the area set
an example for how to form a leading regional hub with lasting appeal.
Through this project, Carrefour Property also served as a driver in the
region by signing a Convention on Improved Access with the government,
the Conseil Général, Caen-la-Mer, the town of Mondeville, and private
stakeholders active in the region. The Convention helped improve traffi c
fl ow through the sector by redeveloping access points to local business
areas and the Mondeville 2 shopping centre, and by creating an exit
ramp. In addition, in an effort to encourage use of public transport, a
bus stop was erected in cooperation with VIVACITES on the line serving
Mondevillage and the Mondeville 2 shopping centre.
Carrefour Property is also contributing to the urban renewal process
initiated by the town of Mondeville by welcoming store brands into
Mondevillage that were previously located at Vallée Barrey, which will
be converted to a new mixed-use neighbourhood combining housing
and businesses.

2013 REGISTRATION DOCUMENT 61
SOCIAL RESPONSIBILITY
2
Review of CSR approach in 2013
Finally, with Mondevillage, Carrefour Property has created a dynamic
hub of job creation for the region: the construction phase employed as
many as 800 workers a day, and the site will generate 300 direct jobs
upon opening.
In terms of the environment, Carrefour Property is aiming at “very good”
level Breeam certifi cation (Building Research Establishment Environmental
Assessment Method) for Mondevillage, as well as BBC (bâtiment basse
consommation - low energy consumption building) certifi cation. The BBC
label is a fi rst for a shopping hub in France. The building’s design and
its high-performance equipment should generate a combined energy
savings of 50% in terms of heat regulation, through several concrete
initiatives: optimised insulation and waterproofi ng, natural lighting, low-
consumption lighting (including a 100%-LED car park and the lights in
the central island), and effi cient heating and air conditioning.
A group of Indonesian farmers earns certifi cation for its palm oil production
In 2013, 349 small palm oil producers from three villages in the Riau
on Sumatra Island province took part in a WWF Indonesia programme
designed to train them in sustainable agricultural practices (reducing
inputs, protecting natural forest plots in their yield, etc.) with the aim of
helping them improve their yields, and thus their income. The programme,
funded for one year by the Carrefour Foundation, enabled the farmers
to earn international RSPO certifi cation in 2013 for sustainable palm oil
production, but also cut their use of herbicides and pesticides in half,
and boost their yields by 20%. The 349 Indonesian farmers are the
second-largest group of certifi ed independent producers. Their farms
cover a total of 763 hectares of certifi ed land.
2.2.7 SERVING COMMUNITIES
Carrefour’s sponsorship initiatives include all the socially responsible
activities the Group carries out every day in its stores and the 11 countries
where it is located. This covers all of the social projects funded by the
Carrefour Foundation abroad as well as those initiated and implemented
by local Carrefour teams.
2.2.7.1 The Carrefour FoundationCarrefour’s corporate foundation, established in 2000, engages in
activities around the world to promote the general good and fi ght
exclusion. It conducts sponsorship programmes related to the retail
sector, drawing on Carrefour Group employees and their skills, in
countries where the Group and its suppliers are present. In 2013, it
had a budget of €6.5 million and funded 48 projects in nine countries.
Since it was founded, the Carrefour Foundation has supported nearly
400 programmes .
It is involved in two areas of action: food solidarity and emergency
humanitarian aid.
Food solidarity projects focus on fi ve areas: donations and collection
of consumer products, the development of cooperative grocery stores,
the development of agriculture , the promotion of food-industry careers
and the implementation of nutritional programmes.
As far as emergency humanitarian aid is concerned, the Foundation
calls on the Group’s teams and their logistical expertise to respond to
large-scale natural disasters in areas where Carrefour is present.
For more information about all projects the Foundation supports, visit:
www.fondation-carrefour.org.
Examples of projects supported by the Carrefour Foundation in 2013
are given in the paragraphs below.
Carrefour hypermarkets in France join forces in a call for socially responsible projects
From October 2-22, 2013, to celebrate the Carrefour Group’s 50th
anniversary, Carrefour’s hypermarket teams invited customers and Internet
users to visit www.carrefour.fr and vote in support of a local food-related
non-profi t project. The call for projects was a resounding success, with
nearly 800,000 votes cast. Grants ranging from €1,000 to €50,000
were awarded to 216 projects, allowing their sponsor associations to
make them a reality.
Thanks to a concerted effort by employees of the Carrefour hypermarket
in Draguignan and Internet users, the local branch of Secours p opulaire
there won 1st prize in the call for projects, receiving a grant of €50,000
to purchase a refrigerated lorry. The lorry will be used to transport and
store food for families in Draguignan and 28 neighbouring communities.
Secours p opulaire Français works every day to fi ght poverty and exclusion
through emergency support relying on food and clothing donations.
The grants awarded to other initiatives - nine received €10,000 each, 40
received €5,000, and 167 received €1,000 - went to projects to support
parents with young children (new Restos Bébés du Cœur kitchens, a
place for families to gather and be heard), students (cooperative grocery
stores), the destitute (assistance for the end-of-year festivities), and
hospitals (a community kitchen garden). View the full list of winners online
at: http://www.projetssolidaire.carrefour50ans.fr/classement-liste-projets.

2013 REGISTRATION DOCUMENT 62
2 SOCIAL RESPONSIBILITYReview of CSR approach in 2013
Food donations and combating waste in France
In France, 100% of all consolidated supermarkets and hypermarkets
donate food products to non-profi t associations every day, making
Carrefour the top private food bank donor in the retail sector.
In 2013, Carrefour donated the equivalent of 68 million meals to food
assistance organisations in France.
The 2013 roll-out of the “Antigaspi Waste Reduction Plan” in France
created opportunities for new projects, sponsored by Carrefour and its
partners and with support from the Foundation, including:
W support for collecting unsold fruit and vegetables from MIN - Marchés
d’Intérêt National (wholesale markets for agricultural products), for
food donations, and transforming damaged produce into soups and
smoothies, in partnership with ANDES - Association Nationale de
Développement des Épiceries Solidaires (French national association
to develop cooperative grocers). This activity employs 127 people
requiring assistance with professional integration and collects more
than 1,300 tonnes of products per year;
W support for collecting unsold stock from fi sh markets and processing
it for soups and fi lets, along with the FPLM - Fédération Nationale des
Paniers de la Mer (federation of associations set up to redistribute
unsold fi sh). 165 people received training under this programme in
2013, successfully reusing 335 tonnes of products;
W participation in creating SOLAAL (a socially responsible organisation
for farmers and the food industry) as a benefactor member, to combat
waste within the supply chain and encourage food donations.
Coordinating the fi rst international food drive for Food Banks in eight countries
In November 2013, riding the momentum of International Solidarity Week
and with support from the European Food Bank Federation and the
Global FoodBanking Network, the Carrefour Foundation coordinated a
massive international food drive in eight countries: Argentina, Belgium,
Brazil, Spain, France, Italy, Poland, and Romania.
Carrefour’s teams have partnered with the Food Bank Federations since
1994, working alongside volunteers in nearly 3,000 of the brand’s stores
around the world: 1,100 in France, 700 in Italy, 200 in Poland, etc.
Customers, volunteers, and employees of Carrefour were all invited to
participate in the project. The initiative will continue in 2014.
This international collection drive complements the daily food donations
given by the Carrefour Foundation year-round, drawing on the Group’s
professional retail expertise. In 2013, the Foundation stepped up its
support for food programmes by increasing its grant to nearly €2 million.
To the same end, the Foundation also increased its support to the Food
Bank Federations, donating a total of €632,097 around the world.
The Carrefour Foundation also provides logistical support, setting up
infrastructures for local organisations to help them transport and store
food, including fresh produce. Since it was founded, the Carrefour
Foundation has funded the purchase of 38 cold-storage areas and
141 refrigerated vehicles for National Food Banks around the world,
including 36 in 2013 alone.
Supporting Emmaüs Défi in France
Since 2011, the Carrefour Foundation has supported the social integration
project of the association Emmaüs Défi in France, helping set up and
develop a Socially Responsible Equipment Bank in Paris, France.
The system involves selling and delivering new home equipment to
underprivileged families at modest prices. Carrefour and its Foundation
provide fi nancial and material support through product donations and
regular deliveries by the Carrefour logistics teams, depending on the
unsold stock identifi ed in various warehouses.
The 450 families who have benefi ted from this programme, guided by
City of Paris social services, have scheduled an appointment to purchase
their new equipment and other items in the show-fl at on Rue Riquet in
Paris, a space specially designed and dedicated to the purpose. Thanks
to this initiative, families moving into permanent housing can furnish their
home at an affordable price by selecting from a diverse range of items,
including household linen, small and large appliances, furniture, bedding,
crockery, and more. The programme also receives technical support from
Carrefour’s Espace Emploi teams, who seek to create pathways into
employment for workers requiring professional support.
Finally, in December 2013, Carrefour and its Foundation fi nanced the sale
of 12,000 new toys at affordable prices for children from 0 to 8 , helping
5,000 families give their children a very merry Christmas.
Developing the Shanghai Young Bakers programme in China
The Carrefour Foundation supports organisations that train, prepare,
and support talented youths in fi nding jobs. T he Shanghai Young Bakers
programme is one example in China.
Launched in 2008 alongside the Chi Heng Foundation and Shanghai
Economic Chamber members, this programme offers vocational job
opportunities for young Chinese people aged 17-23 to learn French
baking techniques. The Shanghai Young Bakers programme promotes
the social integration of young people from disadvantaged backgrounds
by offering them employment opportunities in a food-industry sector that
is highly valued in China.
Nearly 100 young people have already been trained thanks to the support
of the Carrefour Foundation, the main sponsor of the programme since its
creation. Carrefour hypermarkets in China also support the programme’s
development by hosting young interns in their store departments each
year. It is an opportunity for young people to master a trade and facilitate
their integration into the working world.
In 2013, 21 of the 40 students recommended by six NGOs were
accepted for the training programme, which includes an internship in
one of ten partner hotels as well as an intensive internship at a Carrefour
store. The training is recognised as being equivalent to a CAP professional
qualifi cation in France for its French baking content, and students
ultimately receive a Chinese pastry diploma.

2013 REGISTRATION DOCUMENT 63
SOCIAL RESPONSIBILITY
2
Review of CSR approach in 2013
KEY FIGURES48 sponsorship programmes run by the Carrefour Foundation in 2013.
A budget of €6.5 million, with 92% of the budget allocated directly to project support.
Nearly 400 projects supported since the Foundation was established in 2000.
The equivalent of 77 million meals provided free of charge in 2013 to food assistance associations around the world.
2.2.7.2 Solidarity driven by the countries where Carrefour is present
In addition to the national programmes initiated by the Foundation and
rolled out to 11 countries, the local country management and stores also
develop their own socially-responsible projects to meet the needs of
their surrounding communities. The following pages give a few examples
of local initiatives carried out by the countries.
Carrefour Solidaridad in Spain
Created in March 2001, the Fundacion Solidaridad Carrefour in Spain
mainly supports initiatives for children affected by disabilities or exclusion.
The 23,000 employees of Carrefour Spain are regularly approached to
participate in local initiatives and calls for projects. 900 of them are now
permanent ambassadors of the volunteer network they run. Organised
into 131 committees, each under the supervision of the store director
and HR director, the ambassadors monitor projects in the fi eld.
In addition, the employees work alongside Carrefour to develop the
partnership with the Spanish Food Bank Federation (FESBAL), and they
participated in the food drive that rallied 264 Carrefour hypermarkets
and supermarkets in Spain in April and May 2013. The drive collected
853 tonnes of food. Another initiative, called “Kilo”, was carried out by
168 Carrefour hypermarkets in November; the donations were topped
up by the Group, which helped the drive collect a total of 1,626,112
kilos of food for donation to FESBAL.
The Boucles du Cœur in France
From May 13 to June 23, 2013, for the third Boucles du Cœur, Carrefour
held 300 events across France to benefi t local non-profi t associations
and the national heart surgery association, Mécénat Chirurgie Cardiaque.
More than 1,100 stores and 130,000 employees joined the effort,
ultimately collecting €1,200,000 and sharing it among 179 local non-
profi t associations and Mécénat Chirurgie Cardiaque to fi nance heart
operations.
The Boucles du Cœur offer an opportunity for everyone to get involved,
according to their skills and interests. Donations are taken at check-out
and online at www.lesbouclesducoeur.fr for all of the selected non-profi t
associations; in addition, a donation is made when certain products are
purchased at Carrefour and Carrefour market stores.
Sumando Voluntades, a social responsibility program in Argentina
Since 2011, the Carrefour Foundation has been working with Carrefour
employees in Argentina to support Alimentarse y Aprender, a programme
developed by the CONIN Foundation.
Over the past three years, Carrefour Argentina employees have been
running an education programme called Sumando Voluntades para
Alimentarse y Aprender (Learning to eat better together). During Nutrition
Month, a “Nutrimobile” travelled more than 20,000 km to meet 32,000
students, run 500 workshops, and promote a balanced diet in 136 schools
across 22 provinces of Argentina. This support was further reinforced
by sponsorship of schools located near stores.
Sumando Voluntades offers 20,000 employees an opportunity to
participate in local socially-responsible initiatives near their stores and
head offi ce. In 2013, the programme had 250 ambassadors. Together,
they put in 19,300 hours of work to complete 1,800 projects in 2013,
including support during natural disasters, and drives to collect food,
toys and supplies for the destitute.
Voluntario, skills-based sponsorship in Brazil
The Voluntario programme founded by Carrefour Brazil in 2001 has
already rallied 12,000 employees to share their knowledge and expertise
with more than 600 associations, to whom they have donated more than
620,000 hours of volunteer work.
Every month, nearly 1,000 employees of Carrefour Brazil volunteer four
hours of their time to benefi t a non-profi t association that Carrefour
puts them in touch with. In 2013, 8,000 people benefi tted from this
shared expertise.

2013 REGISTRATION DOCUMENT 64
2 SOCIAL RESPONSIBILITYAssessment of performance and indicators
2.3 Assessment of performance and indicators
2.3.1 PERFORMANCE INDICATORS
2.3.1.1 Global indicator2013 scope of coverage
Energy - 100%
Water - 95%
Waste - 92%
Refrigerants - 100%
Paper - 100%
Check out bags - 100%
Organic products - 100%
Quality lines - 100% Local suppliers - 100%
Fair-trade products - 100%
Logistics - 100%
Accidents - 94%
Womenmanagers - 100%
Disabled workers - 100%
Training - 99%
The average coverage of the 2013 reporting indicators is 98,8% of Group scope in terms of sales, excluding VAT.
The product, store and logistics indicators are calculated year-to-year, from October 2012 to September 2013.
The human resources indicators are calculated over the year 2013.
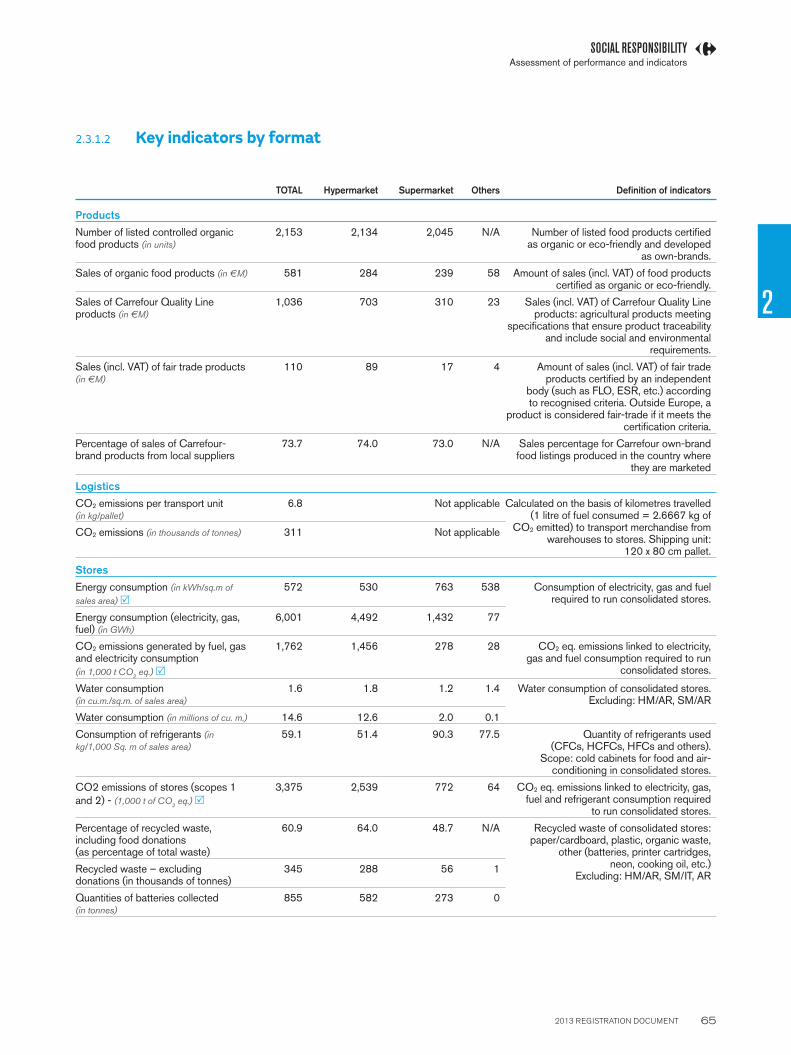
2013 REGISTRATION DOCUMENT 65
SOCIAL RESPONSIBILITY
2
Assessment of performance and indicators
2.3.1.2 Key indicators by format
TOTAL Hypermarket Supermarket Others Defi nition of indicators
Products
Number of listed controlled organic food products (in units)
2,153 2,134 2,045 N/A Number of listed food products certifi ed as organic or eco-friendly and developed
as own-brands.
Sales of organic food products (in €M) 581 284 239 58 Amount of sales (incl. VAT) of food products certifi ed as organic or eco-friendly.
Sales of Carrefour Quality Line products (in €M)
1,036 703 310 23 Sales (incl. VAT) of Carrefour Quality Line products: agricultural products meeting
specifi cations that ensure product traceability and include social and environmental
requirements.
Sales (incl. VAT) of fair trade products (in €M)
110 89 17 4 Amount of sales (incl. VAT) of fair trade products certifi ed by an independent
body (such as FLO, ESR, etc.) according to recognised criteria. Outside Europe, a
product is considered fair-trade if it meets the certifi cation criteria.
Percentage of sales of Carrefour-brand products from local suppliers
73.7 74.0 73.0 N/A Sales percentage for Carrefour own-brand food listings produced in the country where
they are marketed
Logistics
CO2 emissions per transport unit (in kg/pallet)
6.8 Not applicable Calculated on the basis of kilometres travelled (1 litre of fuel consumed = 2.6667 kg of
CO2 emitted) to transport merchandise from warehouses to stores. Shipping unit:
120 x 80 cm pallet.
CO2 emissions (in thousands of tonnes) 311 Not applicable
Stores
Energy consumption (in kWh/sq.m of
sales area) R572 530 763 538 Consumption of electricity, gas and fuel
required to run consolidated stores.
Energy consumption (electricity, gas, fuel) (in GWh)
6,001 4,492 1,432 77
CO2 emissions generated by fuel, gas and electricity consumption
(in 1,000 t CO2 eq.) R
1,762 1,456 278 28 CO2 eq. emissions linked to electricity, gas and fuel consumption required to run
consolidated stores.
Water consumption (in cu.m./sq.m. of sales area)
1.6 1.8 1.2 1.4 Water consumption of consolidated stores.Excluding: HM/AR, SM/AR
Water consumption (in millions of cu. m.) 14.6 12.6 2.0 0.1
Consumption of refrigerants (in
kg/1,000 Sq. m of sales area)
59.1 51.4 90.3 77.5 Quantity of refrigerants used (CFCs, HCFCs, HFCs and others).
Scope: cold cabinets for food and air-conditioning in consolidated stores.
CO2 emissions of stores (scopes 1
and 2) - (1,000 t of CO2 eq.) R
3,375 2,539 772 64 CO2 eq. emissions linked to electricity, gas, fuel and refrigerant consumption required
to run consolidated stores.
Percentage of recycled waste, including food donations (as percentage of total waste)
60.9 64.0 48.7 N/A Recycled waste of consolidated stores: paper/cardboard, plastic, organic waste,
other (batteries, printer cartridges, neon, cooking oil, etc.)
Excluding: HM/AR, SM/IT, ARRecycled waste – excluding donations (in thousands of tonnes)
345 288 56 1
Quantities of batteries collected (in tonnes)
855 582 273 0

2013 REGISTRATION DOCUMENT 66
2 SOCIAL RESPONSIBILITYAssessment of performance and indicators
TOTAL Hypermarket Supermarket Others Defi nition of indicators
Quantity of paper purchased for commercial publications (in kg/sq.m of sales area)
15.9 20.1 9.6 2.3 Consumption of paper for commercial publications expressed in kg per sq.m
of sales area.
Quantity of paper purchased for commercial publications
(thousands of tonnes)
207 173 31 3 Quantity of paper purchased for commercial publications
(fl yers, brochures, newspapers, etc.).
Percentage of paper certifi ed or recycled
99.4 99.5 99.1 N/A Percentage of paper purchased for commercial publications certifi ed
by a recognised body (FSC, PEFC, etc.) and/or recycled.
Number of free disposable plastic check-out bags (in millions of bags)
1,176 1,018 79 80 Number of disposable plastic bags purchased by stores and distributed free of
charge at check-out.
Human resources
Rate of absence due to workplace accidents (in %)
0.52 0.47 0.77 0.52 Number of hours of absence due to workplace and commuting accidents/number
of theoretical work hours during the period (excluding work-related illnesses).
Excluding: HM/IT, SM/IT
Women in management positions (in %)
36.8 31.9 37.0 44.0 Proportion of women in management positions (“manager” defi ned as an
independent employee with decision-making authority holding a supervisory position).
Percentage of employees declared as having disabilities
2.8 2.8 3.2 1.7 Status defi ned by the legislation in force in each country (by default, this is any
person with at least a 10% physical disability)/Average number of employees
during the period.
Number of training hours (thousands) 5,131 4,208 500 423 Number of training hours.Excluding: SM/BR
R 2013 fi gures verifi ed with a result of reasonable assurance
2.3.2 REPORTING METHODOLOGY FOR SUSTAINABLE DEVELOPMENT INDICATORS
2.3.2.1 Reporting methodology for Sustainable Development indicators
The Sustainable Development department relied on a multidisciplinary
steering committee for the preparation of the 2013 management report.
This committee brought together all the relevant Group departments
(Quality, Human Resources, Legal, Marketing, Assets, Sales and
Merchandise and Logistics) with representatives from the Sustainable
Development network in the key European countries.
Principles for drawing up the Sustainable Development report
Based on the GRI-G3 (Global Reporting Initiative) reporting principles, the
Carrefour Group’s management report adheres to the following principles:
CSR (Corporate Social Responsibility)
Carrefour places its own performance within the context of the social,
economic and environmental constraints that weigh upon the Group,
and puts the resulting data into perspective.
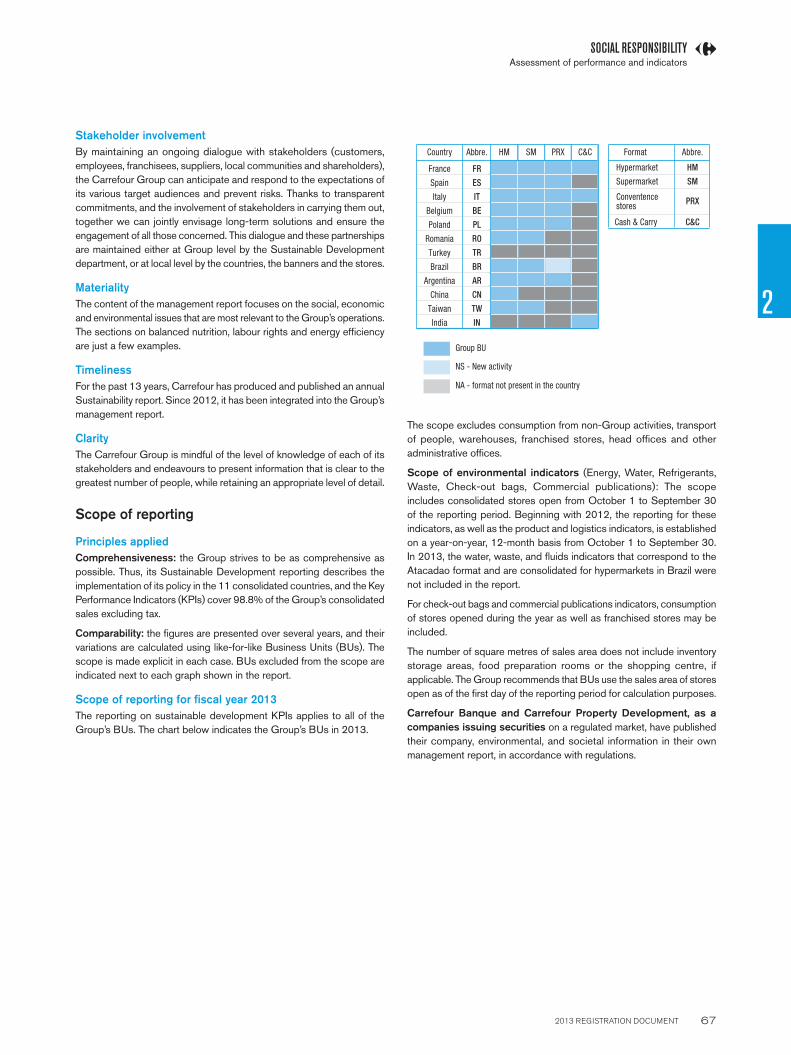
2013 REGISTRATION DOCUMENT 67
SOCIAL RESPONSIBILITY
2
Assessment of performance and indicators
Stakeholder involvement
By maintaining an ongoing dialogue with stakeholders (customers,
employees, franchisees, suppliers, local communities and shareholders),
the Carrefour Group can anticipate and respond to the expectations of
its various target audiences and prevent risks. Thanks to transparent
commitments, and the involvement of stakeholders in carrying them out,
together we can jointly envisage long-term solutions and ensure the
engagement of all those concerned. This dialogue and these partnerships
are maintained either at Group level by the Sustainable Development
department, or at local level by the countries, the banners and the stores.
Materiality
The content of the management report focuses on the social, economic
and environmental issues that are most relevant to the Group’s operations.
The sections on balanced nutrition, labour rights and energy effi ciency
are just a few examples.
Timeliness
For the past 13 years, Carrefour has produced and published an annual
Sustainability report. Since 2012, it has been integrated into the Group’s
management report.
Clarity
The Carrefour Group is mindful of the level of knowledge of each of its
stakeholders and endeavours to present information that is clear to the
greatest number of people, while retaining an appropriate level of detail.
Scope of reporting
Principles applied
Comprehensiveness: t he Group strives to be as comprehensive as
possible. Thus, its Sustainable Development reporting describes the
implementation of its policy in the 11 consolidated countries, and the Key
Performance Indicators (KPIs) cover 98.8% of the Group’s consolidated
sales excluding tax.
Comparability: t he fi gures are presented over several years, and their
variations are calculated using like-for-like Business Units (BUs). The
scope is made explicit in each case. BUs excluded from the scope are
indicated next to each graph shown in the report.
Scope of reporting for fi scal year 2013
The reporting on sustainable development KPIs applies to all of the
Group’s BUs. The chart below indicates the Group’s BUs in 2013.
Country Abbre. HM SM PRX C&C
France FR
ES
IT
BE
PL
RO
TR
BR
AR
CN
TW
IN
Spain
Italy
Belgium
Poland
Romania
Turkey
Brazil
Argentina
China
Taiwan
India
Group BU
NS - New activity
NA - format not present in the country
Format Abbre.
Hypermarket HM
SM
PRX
C&C
Supermarket
Conventencestores
Cash & Carry
The scope excludes consumption from non-Group activities, transport
of people, warehouses, franchised stores, head offi ces and other
administrative offi ces.
Scope of environmental indicators (Energy, Water, Refrigerants,
Waste, Check-out bags, Commercial publications): The scope
includes consolidated stores open from October 1 to September 30
of the reporting period. Beginning with 2012, the reporting for these
indicators, as well as the product and logistics indicators, is established
on a year-on-year, 12-month basis from October 1 to September 30.
In 2013, the water, waste, and fl uids indicators that correspond to the
Atacadao format and are consolidated for hypermarkets in Brazil were
not included in the report.
For check-out bags and commercial publications indicators, consumption
of stores opened during the year as well as franchised stores may be
included.
The number of square metres of sales area does not include inventory
storage areas, food preparation rooms or the shopping centre, if
applicable. The Group recommends that BUs use the sales area of stores
open as of the fi rst day of the reporting period for calculation purposes.
Carrefour Banque and Carrefour Property Development, as a
companies issuing securities on a regulated market, have published
their company, environmental, and societal information in their own
management report, in accordance with regulations.

2013 REGISTRATION DOCUMENT 68
2 SOCIAL RESPONSIBILITYAssessment of performance and indicators
Scope variation
The variations in scope are related to creations, acquisitions, sales and
closures of stores or BUs.
If a BU was created or acquired after January 1, 2013, it is not included
in our reporting.
If a BU was sold or closed in 2013, it is excluded from our reporting on
environmental data for the year in its entirety.
For 2013, all consolidated activities in Turkey are included under
franchising. They are therefore excluded from the reporting for the full
fi scal year.
Sustainable Development Indicators
Principles applied
Our Sustainable Development reporting adheres to the following
principles:
W a ccuracy: t he Carrefour Group strives to ensure the accuracy of its
published data by conducting a large number of manual and automatic
internal controls.
W c omparability: t he Group strives to maintain consistency throughout its
reports. Figures presented for several years apply the same defi nition.
Choice of indicators
Since 2003, the Carrefour Group has used 20 key performance
indicators (KPIs) associated with its strategic priorities for Sustainable
Development. These indicators, which are revised over the years, are
designed to monitor the commitments made by the Group and its progress
in environmental and social performance. Each KPI was chosen by the
Group for its relevance to the Group’s activities, but also with the intention
of responding to stakeholder expectations and regulatory obligations.
References used
The 2013 management report adheres to the Global Compact’s
recommendations for “communication on progress”, the guidelines of
the G3 Global Reporting Initiative (Level B) and the guiding principles
of the OECD (see the cross-reference tables on pages 278 to 281 ). As
an addition to the annual report, it also complies with the requirements
of Art. 225 of the French Commercial Code.
A Sustainable Development reporting protocol has been prepared by the
Group’s Sustainable Development department. It stipulates the Group’s
collection, calculation and consolidation rules.
Furthermore, through Enablon, a computerised reporting application,
each reporting liaison has access to a data collection procedure, a
user’s guide for the Enablon reporting application, defi nitions for each
KPI, and a check-list of control points, which are distributed internally
to the Sustainable Development reporting managers.
Since the 2009 fi scal year, the Group has compiled human resources
indicators using the Group Human Resources reporting application. These
indicators comply with the defi nitions drafted jointly by the Group Human
Resources department and the Sustainable Development department.
Methodological particularities
All of this information is indicated in the Group’s Sustainable Development
reporting protocol, and in the KPI defi nition sheets available within the
Group’s reporting application for environmental KPIs and from the Group
Human Resources department for social KPIs.
Methodological notes
CO2 emissions: To evaluate the CO2 emissions related to our stores’
energy consumption (electricity, gas and fuel) and refrigerants, we use
conversion factors (of kWh and kg, expressed as kg of CO2 equivalent).
The factors employed come from recognised international bodies, such
as the IPCC (Intergovernmental Panel on Climate Change) and the IEA
(International Energy Agency). When the BUs have specifi c national
factors, they may use them. The associated CO2 emissions are then
calculated by the tool based on those factors.
The emissions factor related to the electricity consumption of the France
BUs is updated annually based on changes made to the electricity supply
agreement (50% regulated market/50% open market).
Concerning CO2 emissions regarding our logistics activity, CO2 emissions
related to downstream transport (shipping of merchandise between
warehouses and stores) are taken into account. We use a conversion rate
equal to 2.6667 kg of emitted CO2 per litre of fuel consumed, established
with ADEME (the French Environment and Energy Management Agency).
This indicator counts CO2 emissions related to the transport of goods
between warehouses and stores. The following CO2 emissions are not
taken into account:
W emissions generated by spotters;
W emissions generated during inbound transport of goods to the
warehouse;
W emissions related to direct deliveries (direct “producer-to-store”
transport of goods without going through a warehouse);
W emissions related to customer and employee travel;
W emissions related to outbound rail transport (mainly in France) and
maritime transport (mainly in Indonesia).
Note that “store/warehouse” return trips are only taken into account for
fl eets hired for Carrefour’s exclusive use.
Check-out bags: the quantity of check-out bags published corresponds
to the number of bags purchased by the BU during the reporting period.
Grammage: The defi nition used by the Group is the quantity of paper
purchased for commercial publications compared to the surface of paper
purchased for commercial publications (in g/sq.m.).
Number of listed organic products: The number of listed organic or
ecological products reported pertains to the number of items, labelled by
outside third parties, identifi ed in the own brands, whose sales during the
year were not zero. The number of Group listed products corresponds
to the sum of the listed products sold in each country. With regard to
fabrics, colours are differentiated but not sizes.
2013 REGISTRATION DOCUMENT 69
SOCIAL RESPONSIBILITY
2
Assessment of performance and indicators
Employees at the end of the period: Those employed by the Company
under an employment contract (excluding interns and suspended
contracts) as of December 31.
Number of workplace accidents: Workplace accidents are defi ned with
reference to the laws in effect in each country. If no defi nition exists in the
country, the defi nition used by the Group is “an accident that occurred
during working time and gave rise to a work stoppage.”
Rate of absence: The calculation method used by the countries is
based on business days; however, different methods may still exist in
some countries.
Percentage of employees recognised as having disabilities:A “person
with a disability” is defi ned by local regulations in each country.
Fair-trade products: Since the fair trade product label does not exist
in all the countries where the Group operates, this indicator includes
unlabelled products for which the procedure used is similar to that required
for labelling. This applies in particular to products sold in China that are
considered fair-trade products.
Carrefour Quality Line contracts: Contracts that meet the Carrefour
Quality Line criteria defi ned by Carrefour with its suppliers.
In some cases, the KPIs may involve an estimation (as with the energy
and water consumption indicators, which are calculated on the amount
billed at an average price per kWh or cubic metre). In other cases, the
BUs must specify and justify the relevance of the assumptions used in
making estimates.
Methodological limitations of the indicators
The environmental and social indicators may have methodological
limitations arising from a lack of uniformity amongst national and
international laws and defi nitions (e.g. regarding workplace accidents)
and/or from the qualitative, and therefore subjective, nature of certain data
(such as indicators related to purchasing quality, the logistics process,
stakeholders and consumer awareness).
For the refrigerant KPI, any leaks that may have occurred prior to a
change of equipment are not quantifi ed in the reporting. They correspond
to emissions generated between the last maintenance operation and
replacement of the unit. The impact is insignifi cant at Group level thanks to
both regular monitoring of the units and the staggered timetable for their
replacement. Note that the mass balances are not systematically carried
out each time the fl uid is reloaded or at year-end. Therefore, some BUs’
reports on year-N consumption include fl uid still stored in containers.
For the logistics KPI (CO2 emissions per unit of transport), in the vast
majority of cases CO2 emissions related to the transport of goods are
calculated on the basis of distance travelled since there is no actual data
on service providers’ fuel consumption and average consumption by type
of vehicle. Countries where logistics are handled mainly by suppliers are
also excluded from the reporting scope.
Also, pallets (transport units) used for backhauls are not included in the
total number of pallets used in downstream transport.
For the Energy KPI, the quantity of energy published corresponds to the
quantity purchased and not the quantity actually consumed for fuel and
gas (15% of the energy consumed by the stores).
For the water KPI, the published quantity of water corresponds mainly
to the quantity of water purchased. Depending on the country, water
collected by some stores through drilling may not be counted when there
is no charge for its withdrawal. In addition, when water consumption
attributable to the shopping centre is not identifi ed separately from the
store’s water consumption, it is included in the published quantity of water.
When the billing amounts include costs other than those related to water
consumption, and such costs cannot be separated out, the quantity of
water reported, though not signifi cant, is overestimated.
For the waste KPI, the chosen reporting scope included BUs that use
waste collection companies, which provide information about the tonnage
of waste removed. Generally speaking, when waste is collected directly
by local communities, no information is available. When waste is collected
and grouped at the warehouses, the corresponding quantities are not
systematically included in the reporting.
With regard to the Carrefour Quality Line and organic product KPIs,
it is not always possible to separate the portion of sales related to the
hypermarket format from that related to the supermarket format. In this
case, Carrefour has chosen to report all the sales in the hypermarket
format.
With regard to the workplace accident KPI, for some BUs for which data
is obtained based on the payroll tool the number of workplace accidents
with stoppage is estimated according to the number of hours of absence
due to a workplace accident.
Considering the methodological limitations outlined above and the
diffi culties in gathering data, the reporting scope may vary depending
on the indicator. For each indicator that pertains to a limited scope, the
scope is specifi ed. For analysing any changes in the indicators, we factor
out all BUs for which we lack data for one of the comparison years.
Methods of data collection, consolidation and control
Reporting period
Reporting is performed twice annually: annual reporting is conducted
for the management report, published and submitted to the Board of
Directors for approval, and a half-year report is also published.
The period used for the annual reporting is the calendar year (January 1
to December 31) for human resources indicators.
To meet the requirements of the publication deadlines required under
Article 125 of the Grenelle II environment forum regulations, the indicators
on store performance, logistics and merchandise are now calculated on
a year-on-year basis from October to September.

2013 REGISTRATION DOCUMENT 70
2 SOCIAL RESPONSIBILITYAssessment of performance and indicators
Data collection methods
The system in place is based on dual information reporting that allows for
rigorous collection of qualitative and quantitative data from the various
countries and banners. For qualitative information, best practices applied
in the countries are submitted via e-mail. For quantitative information, the
Enablon application was deployed in 2005 for reporting key environmental
performance indicators. With regard to key social performance indicators,
they have been reported through the Group’s Human Resources
reporting tool since 2009. Reporting liaisons identifi ed in each country
are responsible for coordinating environmental and social reporting for
their respective countries.
Data consolidation methods
The Sustainable Development department consolidates all Sustainable
Development indicators at Group level using our Enablon application.
Environmental data control methods
Enablon, our computerised reporting application, features automatic
consistency checks to prevent data entry errors. It also provides the ability
to attach source fi les and insert explanatory comments, which makes
auditing and internal control easier. Each reporting manager verifi es the
data entered before it is consolidated at the Group level, with the help of
a check-list and control tips that are explained in the defi nition sheet for
each indicator. The Group’s Sustainable Development department carries
out a second level of data control. Inconsistencies and errors that are
found are reviewed together with the countries and corrected as needed.
Social data control methods
Social data are locally checked before being entered in the Group human
resources tool. The Group’s Human Resources department carries out
a second level of data control. Inconsistencies and errors that are found
are reviewed together with the countries and corrected as needed.
External audit
Principle applied
Reliability: q uantifi ed data are produced, consolidated, analysed and
published. Selected data are subject to verifi cation by an outside third
party.
External audit
The reporting procedures have been verifi ed by our external Statutory
Auditor, Mazars, an independent third body. For the information considered
most signifi cant, substantive tests have been conducted on the data.
Indicators identifi ed with the þ symbol have been reviewed for reasonable
assurance.
Continuous improvement
Starting in 2012, to meet the requirements of Article 225 of Grenelle II,
the indicators corresponding to the stores, merchandise and logistics
have been calculated over a 12-month, year-on-year period running from
October to September. In the analyses, these fi gures are considered
comparable with the data presented over a calendar year for previous
years.

2013 REGISTRATION DOCUMENT 71
SOCIAL RESPONSIBILITY
2
Assessment of performance and indicators
This is a free translation into English of the original report issued in French and is provided solely for the convenience of English speaking readers. This
report should be read in conjunction with, and is construed in accordance with French law and professional auditing standards applicable in France.
2.3.3 REPORT BY AN INDEPENDENT THIRD PARTY ON THE CONSOLIDATED COMPANY, ENVIRONMENTAL AND SOCIETAL INFORMATION SET FORTH IN THE MANAGEMENT REPORT
Year ended December 31, 2013
To the shareholders,
In our capacity as an independent third party, whose application for
accreditation was accepted by Cofrac, and as member of the Mazars
network, Statutory Auditors for Carrefour, we present our report on the
consolidated company, environmental and societal information for the
fi scal year ended December 31, 2013, presented in the management
report (referred to below as the “CSR Information”), in accordance with
Article L. 225-102-1 of the French Commercial Code.
The Company’s responsibility
It is the responsibility of the Board of Directors to draw up a management
report covering the CSR Information mentioned in Article R.225-105-1
of the French Commercial Code, established in accordance with the
reporting procedure used (the “Reporting Procedure”, a summary of
which appears in the management report, and which is available upon
request from the Group Human Resources department or the Group
Sustainability department.
Independence and quality control
Our independence is defi ned by regulatory texts, the Code of Ethics for
Statutory Auditors and the provisions of Article L.822-11 of the French
Commercial Code. We have introduced a quality control system that
covers the policies and procedures documented and aimed to ensure
respect for the Code of Conduct, professional standards and applicable
laws and regulations.
The independent third party’s responsibility
Our role, based on our audit, is to:
W attest that the required information is present in the management
report or, in the event of omission, is explained pursuant to the third
paragraph of Articl R.225-105 of the French Commercial Code
(Attestation of Presence of CSR Information);
W conclude with limited degree of assurance that the CSR Information,
taken as a whole, is fairly presented, in all signifi cant aspects, in
accordance with the Reporting Procedure (Reasoned opinion on
the fairness of the CSR Information);
W express, at the Company’s request, a reasonable degree of assurance
that the information selected by the Company and identifi ed by the
symbol þ in Chapter 2 of the management report were prepared, in
all signifi cant aspects, in accordance with the Reporting Procedure.
Our work was carried out by a fi ve-person team between late August
2013 and early March 2014, over a period of approximately 21 weeks.
We were assisted in our work by our CSR experts.
We performed the work described below in accordance with professional
standards applicable in France, and with the order dated May 13, 2013
which establishes methods to be used by an independent third party
entity in carrying out its mission and, concerning the reasoned opinion
on fairness and the reasonable assurance report, with ISAE 3000 (1).
1. Attestation of presence of CSR Information
Based on interviews with managers of the relevant departments, we
reviewed the report on sustainable development guidelines, based on
social and environmental consequences related to the Company’s activity
and its societal commitments and, where applicable, the actions and
programs arising from them.
We compared the CSR information presented in the management report
with the list mentioned in Article R.225-105-1 of the French Commercial
Code.
In the event that certain consolidated information was absent, we verifi ed
that explanations were supplied in compliance with the provisions of
Article R.225-105, paragraph 3 of the French Commercial Code.
We verifi ed that the CSR Information covered the consolidated scope,
which is to say the Company and its subsidiaries within the meaning
of Article L.233-1 and the companies it controls within the meaning of
Article L.233-3 of the French Commercial Code, within the limits specifi ed
in the paragraph entitled “Methodology for Reporting Sustainable
Development Indicators” in the management report.
Based on this work, and within the limits mentioned above, we attest to
the presence in the management report of the CSR Information required.
2. Reasoned opinion on the fairness of the CSR Information
Nature and scope of the work
We conducted approximately twenty interviews with sixty persons
responsible for preparing the CSR Information within the departments
responsible for the information gathering process and, where applicable,
responsible for internal control procedures and risk management, in
order to:
W assess the appropriateness of the Reporting Procedure in terms of
relevance, exhaustiveness, reliability, neutrality and intelligibility, taking
into consideration the best practices of the sector, where appropriate;
W verify the implementation of a collection, compilation, treatment and
control process, aimed at achieving exhaustiveness and consistency in
the CSR Information, and review internal control and risk management
procedures relating to the preparation of the CSR Information.
We have determined the nature and scope of tests and controls
based on the nature and importance of the CSR Information, given the
characteristics of the Company, the social and environmental issues
related to its activities, its guidelines related to sustainable development
and best practices in the sector.
(1) ISAE 3000 – Assurance engagements other than audits or reviews of historical information.

2013 REGISTRATION DOCUMENT 72
2 SOCIAL RESPONSIBILITYAssessment of performance and indicators
For CSR information that we considered to be the most signifi cant (set
forth in the appendix):
W for both the consolidating entity and the Group Human Resources
and Sustainable Development departments, we reviewed documents
and conducted interviews to corroborate qualitative information
(organisation, policies, actions), used analytic procedures on
quantitative information and performed tests to verify the calculations
and the consolidation of the data, and verifi ed their consistency and
agreement with the other information contained in the management
report;
W for a representative sampling of entities (2) that we selected based
on their activity, their contribution to consolidated indicators, their
location and a risk analysis, we conducted interviews to verify the
correct application of procedures and implementation of detailed tests
based on sampling, which involved verifying the calculations made
and reconciling the data with supporting documentation. The selected
sample represented 47% of the workforce and between 27% and
75% of the quantitative environmental information.
For other consolidated CSR information, we have assessed its consistency
with respect to our knowledge of the Company.
Finally, we weighed the relevance of the explanations concerning the
total or partial absence of certain information.
We believe that the sampling methods and the size of the samples
we have used in exercising our professional judgment enables us to
express a conclusion with a limited degree of assurance. A higher level of
assurance would have required more extensive verifi cations. Because of
our reliance on sampling techniques, as well as other limitations inherent
in operating any information or internal control system, the risk of failing
to detect a material misstatement in the CSR Information cannot be
completely eliminated.
Conclusion
Based on our review, we did not fi nd any material misstatements that
would call into question the fact that the CSR information, taken as a
whole, is fairly presented in accordance with the Reporting Procedure.
3. Reasonable assurance report on a selection of CSR Information
Nature and scope of the work
With regard to the information selected by the Company and identifi ed
with the symbol R, we have performed work of the same type as
described in paragraph 2 above for the CSR Information deemed the
most signifi cant, but in a more detailed manner, especially with regard
to the number of tests.
The selected sample represented on average between 62% and 75%
of the environmental information identifi ed with the symbol R.
We believe that this work enables us to express a reasonable degree of
assurance on the information selected by the Company and identifi ed
with the symbol R.
Conclusion
In our opinion, the information selected by the Group and identifi ed by
the symbol R was prepared, in all signifi cant aspects, in accordance
with the Reporting Procedure.
(2) Company information: France Hypermarkets and Supermarkets; Brazil Hypermarkets and Supermarkets (Carrefour Brazil and Atacadao);
Argentina Hypermarkets and Supermarkets.
Environmental and quality information: France Hypermarkets and Supermarkets; Brazil Hypermarkets and Supermarkets (Carrefour Brazil and
Atacadao); Argentina Hypermarkets and Supermarkets; China Hypermarkets (CO2 emissions related to energy consumption in stores and CO2
emissions related to consumption of gas refrigerants); Spain Hypermarkets and Supermarkets (CO2 emissions related to energy consumption
in stores).
Signed in Paris-La Défense, March 4, 2014
Independent third party entity
Mazars SAS
Emmanuelle Rigaudias
CSR and Sustainable Development Partner

2013 REGISTRATION DOCUMENT 73
SOCIAL RESPONSIBILITY
2
Assessment of performance and indicators
Appendix: l ist of the most significant information
Company information
W W orkforce by gender, employee category, age, geographic region;
W P ercentage of women in management;
W P art-time employees;
W T otal number of new hires (fi xed-term/permanent contracts);
W T urnover of employees under permanent contracts;
W N umber of workplace accidents with work stoppage;
W T otal number of training hours;
W N umber of employees recognised as having disabilities.
Environmental and quality information
W E nergy consumption in GWh and in kWh/sq.m;
W CO2 emissions linked to the energy consumption of stores by sq.m;
W CO2 emissions linked to refrigerant consumption;
W W ater consumption by sq.m;
W W aste recycled (including donations) by sq.m;
W CO2 emissions per shipping unit;
W Q uantity of paper purchased for commercial publications in kg/sq.m of area and in thousands of tonnes;
W N umber of listed controlled organic products;
W N umber of Carrefour Quality Line contracts signed;
W N umber of listed responsible and fair trade products;
W A mount of sales (incl. VAT) of food products purchased from local suppliers.

2013 REGISTRATION DOCUMENT 74

2013 REGISTRATION DOCUMENT 75
CORPORATE GOVERNANCE
3
3.1 Corporate Governance Code 76
3.2 Composition and operation of the Board of Directors 763.2.1 Composition of the Board of Directors 76
3.2.2 Operation of the Board of Directors 86
3.2.3 The Board of Directors’ Committees 87
3.3 Executive Management 90
3.4 Remuneration and benefi ts granted to corporate offi cers 913.4.1 Remuneration of the members of the Board
of Directors 91
3.4.2 Remuneration of the Chairman of the board
and Chief Executive Officer 92
3.4.3 AFEP-MEDEF recommendations: Table on
remuneration and benefits granted to corporate
officers 93
3.4.4 Transactions carried out by corporate officers
with regard to Company shares 97
3.5 Risk management 983.5.1 Risk factors 98
3.5.2 Risk prevention 103
3.5.3 Insurance 104
3.5.4 Crisis management 105
3.6 Internal control 1063.6.1 Risk management and internal control system 106
3.6.2 Data relating to internal accounting and
financial control 110
3.7 Statutory Auditors’ report prepared in accordance with Article L. 225-235 of the French Commercial Code on the report of the Chairman of the Board of Directors 113

2013 REGISTRATION DOCUMENT 76
3 CORPORATE GOVERNANCECorporate Governance Code
Since November 12, 2008, the Company has been committed to the AFEP-MEDEF Corporate Governance Code for listed companies. The
AFEP-MEDEF Code may be consulted at the Company’s head offi ce.
3.1 Corporate Governance Code
3.2 Composition and operation of the Board of Directors
3.2.1 COMPOSITION OF THE BOARD OF DIRECTORS
By decision of the Shareholders’ Meeting of April 20, 2005, the Company
adopted the form of a public limited company (société anonyme) with
a Management Board and Supervisory Board. By decision of the
Shareholders’ Meeting of July 28, 2008, the Company adopted the
form of a public limited company with a Board of Directors. The positions
of Chairman and Chief Executive Offi cer were separated.
By its decision of June 21, 2011, the Board of Directors consolidated the
duties of Chairman and Chief Executive Offi cer. The Board’s decision to
consolidate the duties of Chairman of the Board of Directors and Chief
Executive Offi cer is designed to simplify the decision-making process and
enhance the effi ciency and responsiveness of the Company’s governance.
The Board of Directors comprises 14 members: Georges Plassat
(Chairman and Chief Executive Offi cer), Amaury de Seze (senior
independent director), Mathilde Lemoine, Anne-Claire Taittinger, Diane
Labruyère, Bernard Arnault, Thomas J. Barrack Jr, Nicolas Bazire, Jean-
Laurent Bonnafé, Thierry Breton, René Brillet, Charles Edelstenne,
Bertrand de Montesquiou and Georges Ralli.
The Board of Directors benefi ts from the presence of highly committed
members with complementary experience (retail, fi nancial, industrial and
commercial expertise, amongst others), some of whom have in-depth
experience and knowledge of the business and its environment both in
France and abroad.
At its meeting on January 15, 2014, the Board of Directors decided
the cooptation of Thomas J. Barrack Jr as a member of the Board. He
replaces Sébastien Bazin for the remainder of his term of offi ce, namely
until the end of the Shareholders’ Meeting called to approve the fi nancial
statements for the fi scal year ended December 31, 2015.
Mr Barrack’s co optation will be subject to ratifi cation by the shareholders
at the Shareholders’ Meeting on April 15, 2014.
The members of the Board of Directors were appointed for a term of
three fi scal years. Pursuant to the provisions of the Nineteenth Resolution
adopted by the Shareholders’ Meeting of July 28, 2008, and so that
the terms of one-third of the members of the Board are renewed each
year, the Board of Directors drew lots to determine the names of those
directors whose terms would be subject to early expiration in the fi rst
and second years.
The directors whose terms expired at the end of the 2013 fi scal year are
Amaury de Seze, Bernard Arnault, Jean-Laurent Bonnafé and René Brillet.
The terms of offi ce of Anne-Claire Taittinger, Sébastien Bazin, Thierry
Breton and Charles Edelstenne were renewed for a period of three years
by the Shareholders’ Meeting of April 23, 2013. Sébastien Bazin’s term
of offi ce ended on January 15, 2014.
The terms of offi ce of Mathilde Lemoine, Georges Plassat and Nicolas
Bazire were renewed for a period of three years by the Shareholders’
Meeting of June 18, 2012. Diane Labruyère, Bertrand de Montesquiou
and Georges Ralli were appointed by the same Shareholders’ Meeting.
Three women sit on the Board of Directors. The Board is therefore
applying the law of January 27, 2011 regarding balanced representation
of women and men, which sets the proportion at 20%.
In accordance with the AFEP -MEDEF Corporate Governance Code
for listed companies and at the recommendation of the Appointments
Committee, on March 4, 2014 the Board of Directors decided, after
examining the situation, that nine of its members could be considered
independent directors. Thus, Mathilde Lemoine, Anne-Claire Taittinger,
Diane Labruyère, Georges Ralli, Thierry Breton, René Brillet, Charles
Edelstenne, Bertrand de Montesquiou and Amaury de Seze are
considered independent directors.
Directors are independent if they have no relationship of any kind to the
Company, its group or its management that might compromise their
freedom of judgement.

2013 REGISTRATION DOCUMENT 77
CORPORATE GOVERNANCE
3
Composition and operation of the Board of Directors
The criteria that guide the Board of Directors in considering a member
to be independent are those specifi ed in the AFEP-MEDEF Code, as
follows:
W not to be an employee or corporate offi cer of the Company nor an
employee or director of its parent company or consolidated company
and not to have been so over the previous fi ve years;
W not to be a corporate offi cer of a company of which the Company holds
offi ce as a director, either directly or indirectly, or in which an employee
designated as such or an executive offi cer of the Company (currently
or within the last fi ve years) holds or has held offi ce as a director;
W not to be a client, supplier, corporate banker or investment banker:
W that is signifi cant for the Company or its Group,
W or for which the Company or its Group represents a signifi cant
proportion of its business;
W not to have any close family ties with a corporate offi cer;
W not to have been a Statutory Auditor for the business over the previous
fi ve years;
W not to have been a director of the business for over 12 years.
Sébastien Bazin acted as Vice-Chairman from June 21, 2011 to
January 15, 2014.
At its meeting of June 21, 2011, the Board of Directors appointed Amaury
de Seze as senior independent director. His term of offi ce was renewed by
decision of the Shareholders’ Meeting on June 18, 2012. The role of the
senior independent director is to assist the Chairman in his responsibilities
in respect of the proper functioning of the Company’s governance bodies.
He has particular responsibility for examining situations where there is
a real or potential confl ict of interest, which could affect the directors or
the Chairman of the Board in respect of the interests of the business,
whether this relates to operational projects, strategic direction or specifi c
agreements.
Corporate o fficers’ s tatement
For purposes of their corporate positions, members of the Board of
Directors are domiciled at the Company’s head offi ce.
There are no family relationships between the Company’s corporate
offi cers.
To the Company’s knowledge and as of the date this Registration
Document was prepared, during the past fi ve years no corporate offi cers
(members of the Board of Directors and the Chief Executive Offi cers)
have:
W been convicted of fraud;
W been involved in a bankruptcy, receivership or liquidation;
W been subject to offi cial public sanction by statutory or regulatory
authorities;
W has been prevented by a court from acting as a member of an
administrative, management or supervisory body or from being involved
in an issuer’s management or business operations.
To the Company’s knowledge and as of the date this Registration
Document was prepared, no confl ict of interest has been identifi ed
between the duties of any corporate offi cers (members of the Board of
Directors and the Chief Executive Offi cer) with respect to the Company
and their private interests or other duties.
To the Company’s knowledge and as of the date this Registration
Document was prepared, there are no arrangements or agreements
concluded with the main shareholders, customers, suppliers or other
parties whereby one of the Company’s corporate offi cers (members of
the Board of Directors and the Chief Executive Offi cer) has been selected
as a member of one of their administrative, management or supervisory
bodies or as a member of their general management.
There are no contractual relations between the Company and the
members of the Board of Directors.
C orporate officers’ biographies
Georges Plassat
Chairman and Chief Executive Offi cer
Born on March 25, 1949. French.
Number of Company shares owned: 30,000
Date of appointment to the Board: May 23, 2012
Ratification and renewal date: June 18, 2012
Term of office expires: Shareholders’ Meeting convened to approve
the fi nancial statements for the fi scal year ending December 31, 2014.
Experience:
Casino Group (1983-1997): Marketing director then Chief Executive of
the Group’s catering division (1988-1990), Chief Executive of Casino
France (1990-1992), Managing director (1992-1994), Vice-Chairman of
the Management Board (1994-1996), then Chairman of the Management
Board of the Casino Group (1996-1997). Executive director, Spain, of the
Carrefour Group and Deputy director of Pryca (1997-1999). Chairman
of the Management Board of the Vivarte group (formerly the André group)
(2000) then its Chairman and Chief Executive Offi cer (2004-2012).
Amaury de Seze
Senior independent director
(independent member)
Born on May 7, 1946. French.
Number of Company shares owned: 12,500
Date of appointment to the Board: July 28, 2008
Renewal date: June 21, 2011
Term of office expires: Shareholders’ Meeting convened to approve
the fi nancial statements for the fi scal year ending December 31, 2013
Experience:
Amaury de Seze began his career in 1968 with Bull General Electric.
In 1978, he joined the Volvo Group, where he held the posts of Chief
Executive Offi cer, Chairman-CEO of Volvo France, Chairman of Volvo
Corporate Europe, member of the Executive Committee of the Volvo
Group and member of the Strategic Committee of Renault Volvo. He
joined the Paribas Group in 1993 as member of the Executive Board of
the Compagnie Financière de Paribas and Banque Paribas, in charge of
equity holdings and industrial affairs, and as head of the Equity Holdings
Division of BNP-Paribas. He served as Chairman of PAI Partners from
1998 to December 2007.
2013 REGISTRATION DOCUMENT 78
3 CORPORATE GOVERNANCEComposition and operation of the Board of Directors
Positions held outside the Group:
Vice-C hairman of Power Financial Corporation of Canada (Canada)
Director of BW Group (Singapore)
Director of Groupe Bruxelles Lambert (Belgium)
Director of Erbe SA (Belgium)
Director of Pargesa Holding SA (Switzerland)
Director of Suez Environnement
Chairman of the Supervisory Board of PAI Partners SA
Member of the Supervisory Board of Publicis Groupe
Director of Imerys SA
Director of Thales SA*
Bernard Arnault
Born on March 5, 1949. French.
Number of Company shares owned: 1,000
Date of appointment to the Board: July 28, 2008
Renewal date: June 21, 2011
Term of office expires: Shareholders’ Meeting convened to approve
the fi nancial statements for the fi scal year ending December 31, 2013
Experience:
Bernard Arnault began his career as an engineer at Ferret-Savinel.
In 1974, he became the company’s Head of Construction, and then
Chief Executive Offi cer in 1977 and fi nally Chairman-CEO in 1978.
He remained there until 1984, when he became Chairman-CEO of
Financière Agache SA and Christian Dior SA.
He embarked on the restructuring of the Financière Agache Group
as part of a development strategy based on prestige brands, making
Christian Dior the cornerstone of the organization. In 1989, he became
the majority shareholder of LVMH Moët Hennessy-Louis Vuitton, thus
creating the world’s fi rst luxury goods group. He became its Chairman
in January 1989.
Positions held outside the Group:
Chairman and Chief Executive Offi cer of LVMH Moët Hennessy-Louis
Vuitton SA
Chairman of the Board of Directors of Christian Dior SA
Chairman of the Board of Directors of Louis Vuitton (corporate foundation)
Chairman of Groupe Arnault SAS
Director of Christian Dior Couture SA
Chairman of the Board of Directors of Château Cheval Blanc
Director of LVMH Moët Hennessy-Louis Vuitton Inc. (United States)
Director of LVMH Moët Hennessy-Louis Vuitton Japan KK (Japan)
Member of the Supervisory Committee of Financière Jean Goujon SAS
Director of LVMH International SA (Belgium)
Director of LVMH Services Limited (Great Britain)
Thomas J. Barrack Jr
Born on April 28, 1947. American.
Date of cooptation to the Board: January 15, 2014
Submitted to approval of the Shareholders’ Meeting convened on
April 15, 2014
Term of office expires: Shareholders’ Meeting convened to approve
the fi nancial statements for the fi scal year ending December 31, 2015
Experience:
Prior to the formation of Colony Capital in 1990, Mr. Thomas J. Barrack
Jr, US citizen, was in particular a principal with the investment company
Robert M. Bass Group, based in the Fort Worth, Texas.
Mr. Barrack also served in the Reagan administration as Deputy
Undersecretary of the Department of the Interior.
Mr. Barrack holds a BA from the University of Southern California and
a JD from the University of San Diego.
Positions held outside the Group:
Director of Accor*
Director of Colony Financial Inc (United States)
Director of First Republic Bank (United States)
Nicolas Bazire
Born on July 13, 1957. French.
Number of Company shares owned: 1,000
Date of appointment to the Board: July 28, 2008
Renewal date: June 18, 2012
Term of office expires: Shareholders’ Meeting convened to approve
the fi nancial statements for the fi scal year ending December 31, 2014
Experience:
Nicolas Bazire was an auditor and then senior public auditor with the Court
of Auditors. In 1993 he became Chief of Staff to French Prime Minister
Edouard Balladur. He served as a Managing Partner at Rothschild & Cie
Banque from 1995 to 1999, when he was appointed to the Supervisory
Board. He has been CEO of Groupe Arnault SAS since 1999.
Positions held outside the Group:
Chief Executive Offi cer of Groupe Arnault SAS
Director of LVMH – Moët Hennessy Louis Vuitton SA
Director of Atos SE
Chairman of the Appointments and Remuneration Committee of Atos SE
Director of Suez Environnement Company SA
Member of the Supervisory Board of Rothschild & Cie Banque SCS
Director of Agache Développement SA
Director of Europatweb SA
Director of Financière Agache SA
Director of Financière Agache Private Equity SA
Director of Les Echos SA
Vice-Chairman of the Supervisory Board of Les Echos SAS
* Term of offi ce expired in 2013.* Term of offi ce expired in 2013.

2013 REGISTRATION DOCUMENT 79
CORPORATE GOVERNANCE
3
Composition and operation of the Board of Directors
Director of LVMH Fashion Group SA
Member of the Supervisory Committee of Montaigne Finance SAS
Member of the Supervisory Committee of Semyrhamis SAS
Director of Fondation Louis Vuitton (corporate foundation)
Manager of Les Chevaux de Malmain SARL
Jean-Laurent Bonnafé
Born on July 14, 1961. French.
Number of Company shares owned: 1,030
Date of appointment to the Board: July 28, 2008
Renewal date: June 21, 2011
Term of office expires: Shareholders’ Meeting convened to approve
the fi nancial statements for the fi scal year ending December 31, 2013
Experience:
An engineering graduate of the École Polytechnique and École des
Mines, Jean-Laurent Bonnafé joined the BNP Group in 1993 in the Major
Accounts Division. After serving as Head of Strategy and Development
from 1997, he oversaw the merger process between BNP and Paribas.
Since 2002, he has been Head of French Retail Banking, director of
Networks for French Retail Banking and a member of the BNP Paribas
Executive Committee. Mr. Bonnafé has been appointed Deputy Chief
Executive Offi cer and has been managing the Group’s retail banking
business.
Positions held outside the Group:
Director and Chief Executive Offi cer of BNP Paribas
Director of BNL – Banca Nazionale del Lavoro (Italy)
Director of BNP Paribas Fortis (Belgium)
Director of Erbe SA (Belgium)*
Thierry Breton
(independent member)
Born on January 15, 1955. French.
Number of Company shares owned: 1,000
Date of appointment to the Board: July 28, 2008
Renewal date: April 23, 2013
Term of office expires: Shareholders’ Meeting convened to approve
the fi nancial statements for the fi scal year ending December 31, 2015
Experience:
Thierry Breton graduated from the Paris École Supérieure d’Électricité
(Supelec) and the Institut des Hautes Études de Défense Nationale
(IHEDN, 46th class). In 1986, Mr. Breton became Project manager of
the Poitiers Futuroscope theme park, then headed its teleport operations.
He later served as an advisor to Education Minister René Monory in
the fi eld of new information technologies. Mr. Breton also sat on the
Poitou-Charentes Regional Council from 1986 to 1992, serving as
Vice-Chairman from 1988. He then joined Bull as Head of Strategy &
Development, before being appointed as Deputy Chief Executive Offi cer.
Appointed to the Group’s Board of Directors in February 1996, he was
later made Deputy Chairman of the Board of Directors and then Chief
Executive Offi cer of the Group.
Chairman-CEO of Thomson (1997-2002) and then Chairman-CEO of
France Telecom (2002-2005), he was France’s Minister of the Economy,
Finance, and Industry between February 25, 2005 and May 16, 2007,
before becoming a professor at Harvard University (USA) in “Leadership,
Corporate Accountability”, then Chairman of the Management Board of
Atos Origin in November 2008.
Positions held outside the Group:
Chairman of the Board of Directors and Chief Executive Offi cer of Atos SE
Chief Executive Offi cer of Atos International SAS
René Brillet
(independent member)
Born on August 1, 1941. French.
Number of Company shares owned: 270,250
Date of appointment to the Board: July 28, 2008
Renewal date: June 21, 2011
Term of office expires: Shareholders’ Meeting convened to approve
the fi nancial statements for the fi scal year ending December 31, 2013
Experience:
Carrefour’s former Chief Executive Offi cer Asia, René Brillet began his
career as a radio offi cer in the merchant navy in 1968. In 1972 he joined
Carrefour and held a series of posts, ranging from Senior Accountant
in Italy and Brazil, to Store manager and Head of Organization and
Procedures, also while he was in Brazil. In 1981, he moved to Argentina
as Executive Director, and then to Spain from 1982 to 1985, and fi nally
to France, which he managed from 1986 to 1995. In 1996, he was
appointed Chief Executive Offi cer for Europe and then Chief Executive
Offi cer for Asia in 1998, a position he held until February 28, 2004.
Positions held outside the Group:
Director of Électricité et Eaux de Madagascar
Charles Edelstenne
(independent member)
Born on January 9, 1938. French.
Number of Company shares owned: 1,000
Date of appointment to the Board: July 28, 2008
Renewal date: April 23, 2013
Term of office expires: Shareholders’ Meeting convened to approve
the fi nancial statements for the fi scal year ending December 31, 2015
Experience:
A qualifi ed chartered accountant (IFEC graduate), Charles Edelstenne
joined Dassault Aviation in 1960 as Head of the Financial Analysis Unit. He
went on to hold posts such as Deputy Secretary-General and Executive
Deputy Chairman, Economic and Financial Affairs, before being appointed
to the Board in 1989. He was elected as Chairman-CEO in 2000, a
role he has held ever since.
Positions held outside the Group:
Chairman and Chief Executive Offi cer of Dassault Aviation SA*
Honorary President of Dassault Aviation SA
Chief Executive Offi cer of GIMD (Groupe Industriel Marcel Dassault) SAS
Chairman of the Board of Directors of Dassault Systèmes SA
* Term of offi ce expired in 2013.

2013 REGISTRATION DOCUMENT 80
3 CORPORATE GOVERNANCEComposition and operation of the Board of Directors
Member of the Supervisory Board of GIMD (Groupe Industriel Marcel
Dassault) SAS
Director of Thales SA
Director of Sogitec Industries SA
Director of SABCA (Société Anonyme Belge de Constructions
Aéronautiques) (Belgium)
Chairman of Dassault Falcon Jet Corporation (United States)
Chairman of Dassault International Inc. (United States) *
Manager of ARIE civil partnership
Manager of ARIE 2 civil partnership
Manager of NILI civil partnership
Manager of NILI 2 civil partnership
Diane Labruyère-Cuilleret
(independent member)
Born on November 27, 1968. French.
Number of Company shares owned: 34,580
Date of appointment to the Board: June 18, 2012
Term of office expires: Shareholders’ Meeting convened to approve
the fi nancial statements for the fi scal year ending December 31, 2014
Experience:
A graduate of HEC Paris, UC Berkeley and the Fondaçao Getulio Vargas
in Sao Paulo, she began her career in the French Development Agency
managing agro-industrial projects in Portuguese-speaking Africa.
She was then recruited by the PARIDOC central buying offi ce, where
she set up the Research and Marketing department. In 1997 she joined
Carrefour as director of Purchasing and Product Marketing. In 2002, she
founded the Institut Robin des Bois (Robin Hood Institute) in Geneva,
a private foundation fi nancing projects, primarily in Africa, in the fi elds
of healthcare, education and microfi nance. In 2007, she joined the
family business - Labruyère & Eberlé - and continues to expand its food
distribution activities.
Positions held outside the Group:
Chairman of the Institut Robin des Bois (Switzerland)
Director of the Fondation Antenna Technologies (Geneva, Switzerland)
Member of the Executive Committee of Labruyère & Eberle
Mathilde Lemoine
(independent member)
Born on September 27, 1969. French.
Number of Company shares owned: 2,000
Date of appointment to the Board: May 20, 2011
Renewal date: June 18, 2012
Term of office expires: Shareholders’ Meeting convened to approve
the fi nancial statements for the fi scal year ending December 31, 2014
Experience:
After obtaining a PhD in Economics, Mathilde Lemoine began her
career as a post-graduate researcher and then teaching assistant for
the Healthcare Economics and Management Chair at the French Political
Science Foundation (between 1996 and 1999). In 2000, she was the
economist and general secretary for the French Economic Observatory
(OFCE) before serving as technical advisor for macroeconomic and
globalization issues for the Foreign Trade Minister from 2002 to 2005.
She was also the foreign trade and globalization advisor for the ministers
of the Economy, Finance, and Industry (2004-2005). She then served
as the advisor on macroeconomics and taxation for the Prime Minister
(2005-2006). Since 2006 she has been the Economist and director of
Economic Research and Market Strategy at HSBC France and Economist
for the HSBC Group. She is also a member of the French Council of
Economic Analysis (CAE) and the French National Economic Commission
(CEN) and Professor at the Institut d’Études Politiques in Paris.
Member of the second “Commission pour la libération de la croissance”
and rapporteur of the Climate and Energy Conference, Mathilde Lemoine
has published numerous articles on national and international economic
trends as well as on structural transformations.
Positions held outside the Group:
Member of HSBC France Executive Committee
Bertrand de Montesquiou
(independent member)
Born on July 1, 1947. French.
Number of Company shares owned: 198,261
Date of appointment to the Board: June 18, 2012
Term of office expires: Shareholders’ Meeting convened to approve
the fi nancial statements for the fi scal year ending December 31, 2014
Experience:
Bertrand de Montesquiou graduated from the École des Hautes Études
Commerciales (HEC) business school in 1969. He continued his training
at the Faculté des Lettres et Sciences Humaines in Nanterre and the
University of Paris-Dauphine. From 1972 to 1980, he worked at the Paris
Stock Exchange as portfolio manager for Roth le Gentil-Varangot, then
for Sellier (for which he became proxy holder in 1976) and was certifi ed
as a professional stockbroker in 1977.
In 1980, he joined the family-owned retail group Guyenne et Gascogne,
Carrefour’s partner in southwest France and Spain, as an attaché to
general management. He was appointed Chief Executive Offi cer in
1983, Chairman and Chief Executive Offi cer in 1986 and Chairman
of the Management Board in 1996. He is also Vice-Chairman and
Chief Executive Offi cer of Sogara SAS and Vice-Chairman of Centros
Comerciales Carrefour (Spain).
* Term of offi ce expired in 2013.

2013 REGISTRATION DOCUMENT 81
CORPORATE GOVERNANCE
3
Composition and operation of the Board of Directors
Georges Ralli
(independent member)
Born on July 23, 1948. French.
Number of Company shares owned: 5,000
Date of appointment to the Board: June 18, 2012
Term of office expires: Shareholders’ Meeting convened to approve
the fi nancial statements for the fi scal year ending December 31, 2014
Experience:
Georges Ralli holds a DESS (post graduate diploma) in banking and
fi nance from the University of Paris-V, and is a graduate of the Paris
Institut d’Études Politiques (economics and fi nance option) and the
Institut Commercial in Nancy.
He joined Crédit Lyonnais in 1970 where he served in a number of
management positions until 1981 (General Accounting Research
department responsible for monitoring statutory ratios and consolidation
procedures for the Group’s Alsace Regional department for corporate
customers - Financial Affairs department responsible for the primary equity
market business). In 1982, he became Secretary to the Commission for
Savings Development and Protection, then, from 1982 to 1985, managed
the Financial Negotiations department of Crédit du Nord (primary equity
and bond markets, mergers and acquisitions, proprietary investment).
He joined Lazard in 1986 to develop its primary equity market business.
In 1989 he moved to the mergers and acquisitions department. He
became managing partner in 1993 and was appointed as co-head of
the fi rm’s mergers and acquisitions from 1999. From 2000 to 2012,
Georges Ralli was Managing director and Deputy Chairman of the Lazard
LLC Executive Committee (USA). He was simultaneously headed up
its French branch (Maison Française) until 2009. Until 2012, he was
President of the European mergers and acquisitions activities (Maison
Lazard) and European asset management and private banking businesses
activities (Lazard Frères Gestion and Lazard Wealth Management Europe).
Currently, he manages IPF Partners, investment company specialized
in health activity.
Positions held outside the Group:
Director of Chargeurs SA
Director of SILIC SA*
Permanent representative of Groupama which is director of Veolia
Environnement
Manager of IPF Management 1 sarl (Luxembourg)
Manager of IPF Partners sarl (Switzerland)
Anne-Claire Taittinger
(independent member)
Born on November 3, 1949. French.
Number of Company shares owned: 3,901
Date of appointment to the Supervisory Board: April 20, 2005
Date of appointment to the Board: July 28, 2008
Renewal date: April 23, 2013
Term of office expires: Shareholders’ Meeting convened to approve
the fi nancial statements for the fi scal year ending December 31, 2015
Experience:
Anne-Claire Taittinger graduated from the Institut d’Études Politiques de
Paris, and holds a Master’s degree in urban sociology and an advanced
degree in urban development from the Centre de Perfectionnement aux
Affaires. She began her career in 1976 at the Caisse des Dépôts et
Consignations as head of urban development operations at the Société
Centrale d’Équipement du Territoire. She joined the Louvre Group in
1979 as Corporate Secretary and then became Chairman-CEO of
the Compagnie Financière Deville. She later became Chairman-CEO
of Compagnie Financière Leblanc and of ELM-LEBLANC, Deputy
Chairman-CEO of the industrial division of DEVILLE, Chairman-CEO
of Parfums Annick Goutal France USA, and then of Baccarat. She became
Chief Executive Offi cer and subsequently Chairman of the Executive
Committee of the Société du Louvre in 1997. In 2002 she became
Chairman of the Executive Board of the Taittinger Group and Chief
Executive Offi cer of its subsidiary Groupe du Louvre when the functions
of Chairman of the Board and Chief Executive Offi cer were separated.
She left these posts in July 2006 following a change in ownership at
the Taittinger Group.
Positions held outside the Group:
Director and Chairman of the Appointments, Remuneration and Corporate
Governance Committee of Club Méditerranée
Director of Financités*
Director of IFA (Institut Français des Administrateurs)*
Member of the Supervisory Board of Planet Finance*
Chairman of Le Riffray SAS
Director and Chairman of the Accounts and Internal Audit Committee
of Thales SA
Robert Halley
Honorary Chairman
* Term of offi ce expired in 2013.* Term of offi ce expired in 2013.

2013 REGISTRATION DOCUMENT 82
3 CORPORATE GOVERNANCEComposition and operation of the Board of Directors
DIRECTOR APPOINTMENTS FROM 2009 TO 2013
Members of the Board
Georges PlassatChairman and Chief Executive Offi cer
2013 Positions held within the Group W Chairman and Chief Executive Offi cer of Carrefour
Positions held outside the Group W N/A
Former positions held from 2009 to 2012 W Chairman and Chief Executive Offi cer of the Vivarte Group (formerly Groupe André) (Expiration date of
term: 2012)
Sébastien BazinVice-Presidentu ntil January 15, 2014
2013 Positions held within the Group W Member of the Board of Directors of Carrefour (Expiration date of term: January 15, 2014)
Positions held outside the Group W Executive Managing director of Colony Europe
W Chairman and CEO of SESE SA (Société d’Exploitation Sports et Événements) (Expiration date of term: April 22, 2013)
W Chairman and CEO of HSE SA (Holding Sports et Événements) (Expiration date of term: April 22, 2013)
W Director of Accor SA
W Director of Edenred SA (Expiration date of term: September 1, 2013)
W Managing director of Sisters Soparfi SA (Luxembourg)
W Member of the Supervisory Board of ANF Immobilier SA (Les Ateliers du Nord de la France)
W Chairman of Colillkirch France SAS (Expiration date of term: December 20, 2013)
W Chairman of Colfi lm SAS (Expiration date of term: December 20, 2013)
W Chairman of Bazeo Europe SAS
W Chairman of Colony Capital SAS
W Chief Executive Offi cer of Toulouse Canceropole SAS
W Chief Executive Offi cer of ColSpa SAS (Expiration date of term: September 30, 2013)
W Manager of CC Europe Invest SARL
W Managing Partner of Nina SC
W Legal representative of Colony Capital SAS, which chairs ColSpa SAS
W Chairman of Colyzeo Investment Ltd (United Kingdom)
W Chairman of Data 4 SAS (Expiration date of term: August 29, 2013)
W Manager of Société du Savoy à Méribel SARL
W Manager of Colmed SARL
W Managing Partner of Haute Roche civil partnership
W Managing Partner of Madeleine Michelis civil partnership
W Managing Partner of Ranelagh civil partnership
W Legal representative of Colony Capital SAS, which manages SC George V 302 (Expiration date of term: July 9, 2013)
Former positions held from 2009 to 2012 W Director (SAS) of Moonscoop SAS (Expiration date of term: 2009)
W Member of the Supervisory Board (SAS) of Group Lucien Barrière (Expiration date of term: 2009)
W Chairman of the Supervisory Board of PSG Football Club (Expiration date of term: 2010)
W Chairman (SAS) of Colwine (Expiration date of term: 2010)
W Director of Moonscoop IP (Expiration date of term: 2011)
W Director of La Tour Réseau de Soins SA (Switzerland) (Expiration date of term: 2012)
W Director of Permanence de la Clinique de Carouge (Switzerland) (Expiration date of term: 2012)
W Manager of La Tour SARL (Switzerland) (Expiration date of term: 2012)
Amaury de SezeSenior independant Director
2013 Positions held within the Group W Member of the Board of Directors of Carrefour
Positions held outside the Group W Vice-C hairman of Power Financial Corporation of Canada (Canada).
W Director of BW Group (Singapore)
W Director of Groupe Bruxelles Lambert (Belgium)
W Director of Erbe SA (Belgium)
W Director of Pargesa Holding SA (Switzerland)
W Director of Suez Environnement
W Chairman of the Supervisory Board of PAI Partners SA
W Member of the Supervisory Board of Publicis Groupe
W Director of Imerys SA
W Director of Thales SA (Expiration date of term: September 2013)
Former positions held from 2009 to 2012 W Director of Groupe Industriel Marcel-Dassault SAS (Expiration date of term: 2009)

2013 REGISTRATION DOCUMENT 83
CORPORATE GOVERNANCE
3
Composition and operation of the Board of Directors
Members of the Board
Bernard Arnault 2013 Positions held within the Group W Member of the Board of Directors of Carrefour
Positions held outside the Group W Chairman and Chief Executive Offi cer of LVMH Moët Hennessy-Louis Vuitton SA
W Chairman of the Board of Directors of Christian Dior SA
W Chairman of the Board of Directors of Louis Vuitton (corporate foundation)
W Chairman of Groupe Arnault SAS
W Director of Christian Dior Couture SA
W Chairman of the Board of Directors of Château Cheval Blanc (Expiration date of term: 2013)
W Director of Château Cheval Blanc
W Director of LVMH Moët Hennessy-Louis Vuitton Inc. (United States)
W Director of LVMH Moët Hennessy-Louis Vuitton Japan KK (Japan)
W Member of the Supervisory Committee of Financière Jean Goujon SAS
W Director of LVMH International SA (Belgium)
W Director of LVMH Services Limited (United Kingdom)
Former positions held from 2009 to 2012 W Director of Cheval Blanc civil partnership (Expiration date of term: 2011)
W Member of the Supervisory Board of Lagardère SCA (Expiration date of term: 2012)
Thomas J. Barrack Jr 2013 Positions held within the Group W Member of the Board of Directors of Carrefour since January 15, 2014
Positions held outside the Group W Director of Accor (Expiration date of term: April 25, 2013)
W Director of Colony Financial, Inc. (United States)
W Director of First Republic Bank (United States)
W Director of Challenger Financial Services Group Limited (Australia) (Expiration date of term: December 31, 2013)
Former positions held from 2009 to 2012 W N/A
Nicolas Bazire 2013 Positions held within the Group W Member of the Board of Directors of Carrefour
Positions held outside the Group W Chief Executive Offi cer of Groupe Arnault SAS
W Director of LVMH – Moët Hennessy Louis Vuitton SA
W Director of France Atos Origin
W Director of Suez Environnement Company SA
W Member of the Supervisory Board of Rothschild & Cie Banque SCS
W Director of Agache Développement SA
W Director of Europatweb SA
W Director of Financière Agache SA
W Director of Financière Agache Private Equity SA
W Director of Les Echos SA
W Vice-Chairman of the Supervisory Board of Les Echos SAS
W Director of LVMH Fashion Group SA
W Member of the Supervisory Committee of Montaigne Finance SAS
W Member of the Supervisory Committee of Semyrhamis SAS
W Director of Fondation Louis Vuitton (corporate foundation)
W Manager of Les Chevaux de Malmain SARL
Former positions held from 2009 to 2012 W Director of Atos SE (Expiration date of term: 2012)
W Chairman of the Appointments and Remuneration Committee of Atos SE (Expiration date of term: 2012)
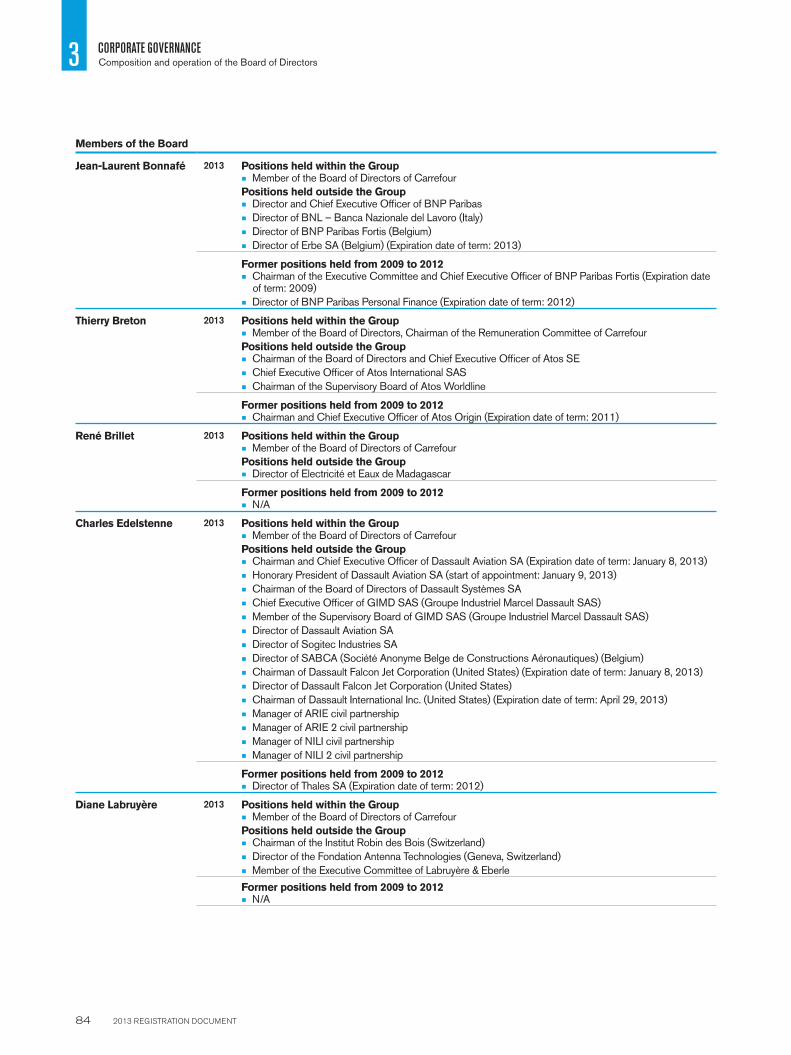
2013 REGISTRATION DOCUMENT 84
3 CORPORATE GOVERNANCEComposition and operation of the Board of Directors
Members of the Board
Jean-Laurent Bonnafé 2013 Positions held within the Group W Member of the Board of Directors of Carrefour
Positions held outside the Group W Director and Chief Executive Offi cer of BNP Paribas
W Director of BNL – Banca Nazionale del Lavoro (Italy)
W Director of BNP Paribas Fortis (Belgium)
W Director of Erbe SA (Belgium) (Expiration date of term: 2013)
Former positions held from 2009 to 2012 W Chairman of the Executive Committee and Chief Executive Offi cer of BNP Paribas Fortis (Expiration date
of term: 2009)
W Director of BNP Paribas Personal Finance (Expiration date of term: 2012)
Thierry Breton 2013 Positions held within the Group W Member of the Board of Directors, Chairman of the Remuneration Committee of Carrefour
Positions held outside the Group W Chairman of the Board of Directors and Chief Executive Offi cer of Atos SE
W Chief Executive Offi cer of Atos International SAS
W Chairman of the Supervisory Board of Atos Worldline
Former positions held from 2009 to 2012 W Chairman and Chief Executive Offi cer of Atos Origin (Expiration date of term: 2011)
René Brillet 2013 Positions held within the Group W Member of the Board of Directors of Carrefour
Positions held outside the Group W Director of Electricité et Eaux de Madagascar
Former positions held from 2009 to 2012 W N/A
Charles Edelstenne 2013 Positions held within the Group W Member of the Board of Directors of Carrefour
Positions held outside the Group W Chairman and Chief Executive Offi cer of Dassault Aviation SA (Expiration date of term: January 8, 2013)
W Honorary President of Dassault Aviation SA (start of appointment: January 9, 2013)
W Chairman of the Board of Directors of Dassault Systèmes SA
W Chief Executive Offi cer of GIMD SAS (Groupe Industriel Marcel Dassault SAS)
W Member of the Supervisory Board of GIMD SAS (Groupe Industriel Marcel Dassault SAS)
W Director of Dassault Aviation SA
W Director of Sogitec Industries SA
W Director of SABCA (Société Anonyme Belge de Constructions Aéronautiques) (Belgium)
W Chairman of Dassault Falcon Jet Corporation (United States) (Expiration date of term: January 8, 2013)
W Director of Dassault Falcon Jet Corporation (United States)
W Chairman of Dassault International Inc. (United States) (Expiration date of term: April 29, 2013)
W Manager of ARIE civil partnership
W Manager of ARIE 2 civil partnership
W Manager of NILI civil partnership
W Manager of NILI 2 civil partnership
Former positions held from 2009 to 2012 W Director of Thales SA (Expiration date of term: 2012)
Diane Labruyère 2013 Positions held within the Group W Member of the Board of Directors of Carrefour
Positions held outside the Group W Chairman of the Institut Robin des Bois (Switzerland)
W Director of the Fondation Antenna Technologies (Geneva, Switzerland)
W Member of the Executive Committee of Labruyère & Eberle
Former positions held from 2009 to 2012 W N/A
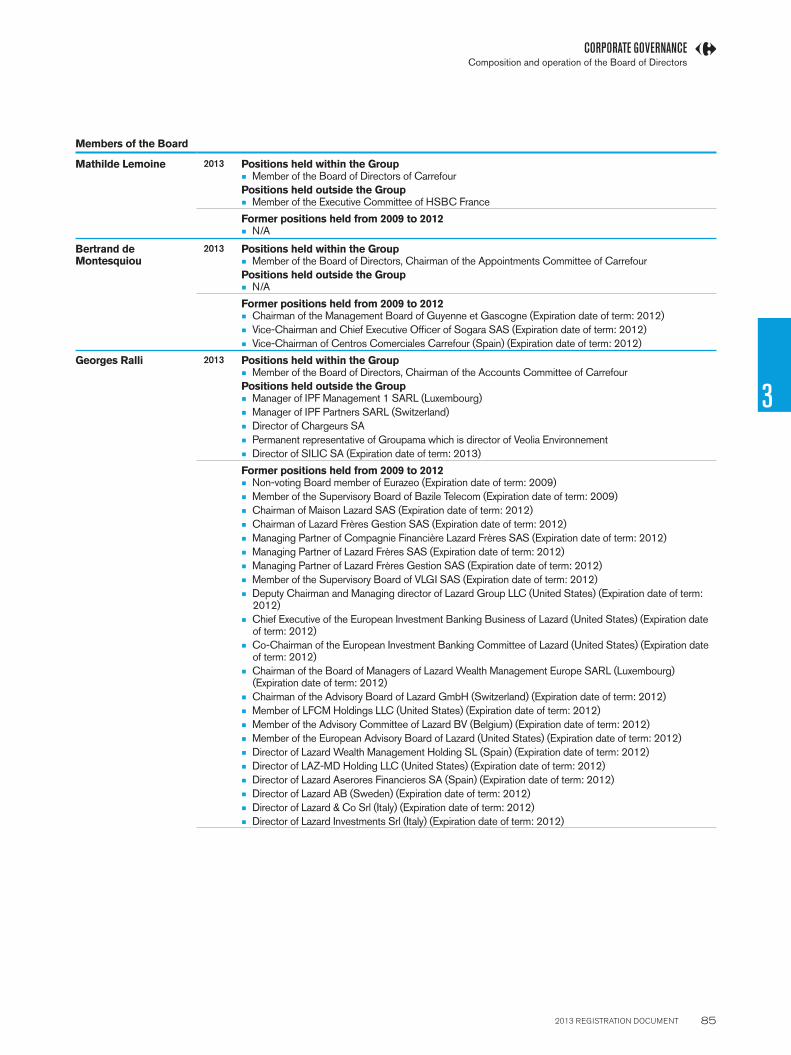
2013 REGISTRATION DOCUMENT 85
CORPORATE GOVERNANCE
3
Composition and operation of the Board of Directors
Members of the Board
Mathilde Lemoine 2013 Positions held within the Group W Member of the Board of Directors of Carrefour
Positions held outside the Group W Member of the Executive Committee of HSBC France
Former positions held from 2009 to 2012 W N/A
Bertrand de Montesquiou
2013 Positions held within the Group W Member of the Board of Directors, Chairman of the Appointments Committee of Carrefour
Positions held outside the Group W N/A
Former positions held from 2009 to 2012 W Chairman of the Management Board of Guyenne et Gascogne (Expiration date of term: 2012)
W Vice-Chairman and Chief Executive Offi cer of Sogara SAS (Expiration date of term: 2012)
W Vice-Chairman of Centros Comerciales Carrefour (Spain) (Expiration date of term: 2012)
Georges Ralli 2013 Positions held within the Group W Member of the Board of Directors, Chairman of the Accounts Committee of Carrefour
Positions held outside the Group W Manager of IPF Management 1 SARL (Luxembourg)
W Manager of IPF Partners SARL (Switzerland)
W Director of Chargeurs SA
W Permanent representative of Groupama which is director of Veolia Environnement
W Director of SILIC SA (Expiration date of term: 2013)
Former positions held from 2009 to 2012 W Non-voting Board member of Eurazeo (Expiration date of term: 2009)
W Member of the Supervisory Board of Bazile Telecom (Expiration date of term: 2009)
W Chairman of Maison Lazard SAS (Expiration date of term: 2012)
W Chairman of Lazard Frères Gestion SAS (Expiration date of term: 2012)
W Managing Partner of Compagnie Financière Lazard Frères SAS (Expiration date of term: 2012)
W Managing Partner of Lazard Frères SAS (Expiration date of term: 2012)
W Managing Partner of Lazard Frères Gestion SAS (Expiration date of term: 2012)
W Member of the Supervisory Board of VLGI SAS (Expiration date of term: 2012)
W Deputy Chairman and Managing director of Lazard Group LLC (United States) (Expiration date of term: 2012)
W Chief Executive of the European Investment Banking Business of Lazard (United States) (Expiration date of term: 2012)
W Co-Chairman of the European Investment Banking Committee of Lazard (United States) (Expiration date of term: 2012)
W Chairman of the Board of Managers of Lazard Wealth Management Europe SARL (Luxembourg) (Expiration date of term: 2012)
W Chairman of the Advisory Board of Lazard GmbH (Switzerland) (Expiration date of term: 2012)
W Member of LFCM Holdings LLC (United States) (Expiration date of term: 2012)
W Member of the Advisory Committee of Lazard BV (Belgium) (Expiration date of term: 2012)
W Member of the European Advisory Board of Lazard (United States) (Expiration date of term: 2012)
W Director of Lazard Wealth Management Holding SL (Spain) (Expiration date of term: 2012)
W Director of LAZ-MD Holding LLC (United States) (Expiration date of term: 2012)
W Director of Lazard Aserores Financieros SA (Spain) (Expiration date of term: 2012)
W Director of Lazard AB (Sweden) (Expiration date of term: 2012)
W Director of Lazard & Co Srl (Italy) (Expiration date of term: 2012)
W Director of Lazard Investments Srl (Italy) (Expiration date of term: 2012)

2013 REGISTRATION DOCUMENT 86
3 CORPORATE GOVERNANCEComposition and operation of the Board of Directors
3.2.2 OPERATION OF THE BOARD OF DIRECTORS
During the course of the 2013 fi scal year, the Board of Directors met
eight times, with an average attendance rate of 89%.
The main topics covered during these eight meetings were as follows:
W the examination of the quarterly and annual sales fi gures;
W the Company and Consolidated Financial Statements for the fi scal
year ending December 31, 2012 and the notice to attend the Ordinary
and Extraordinary Shareholders’ Meeting convened to approve the
fi nancial statements for this fi scal year;
W the implementation of a new share-buyback programme;
W the half-yearly fi nancial statements to June 30, 2013;
W the e xamination of certain investments/disposals for the Group.
In accordance with the Board’s by-laws, as part of its duties and without
this list being exhaustive, the Board:
W approves the Company’s strategy and monitors its implementation;
W sets any necessary limits on the powers of the Chairman and Chief
Executive Offi cer;
W in particular, it:
W conducts any controls and audits it deems appropriate,
W conducts audits of Company management and the fairness of
the fi nancial statements,
W examines and approves the fi nancial statements, establishes the
agenda for the meeting, records its activities in the annual report
and approves the various statutory and regulatory reports,
W examines regulated agreements and rules on their prior
authoriz ation.
W ensures that high-quality fi nancial information is provided to
shareholders and markets;
W each year, on the proposal of the Appointments Committee, it draws up
the list of directors considered independent, based on the Company’s
governance criteria;
W once a year, it examines the budget.
During its meeting of July 17, 2013, the Board of Directors amended its
by-laws, divided into three chapters, structured as follows:
W the fi rst chapter covers the Board of Directors, its role, operation,
compensation for directors and its assessment;
W the second chapter covers the specialist committees, their common
rules, composition and missions;
W the third chapter covers the rights and responsibilities of directors.
As a result, the Board of Directors now has a new set of by-laws, dealing
with both the formal aspects of its role and the rights and responsibilities
of directors in the context of the good corporate governance practices
it imposes on itself. The balance of power within the Board is ensured
through a precise defi nition and division of roles.
Members of the Board
Anne-Claire Taittinger 2013 Positions held within the Group W Member of the Board of Directors of Carrefour
Positions held outside the Group W Director and Chairman of the Appointments, Remuneration and Corporate Governance Committee of
Club Méditerranée
W Chairman of Le Riffray SAS
W Director and Chairman of the Accounts Committee of Thales SA
W Director of Financités (Expiration date of term: 2013)
W Director of IFA (Institut Français des Administrateurs) (Expiration date of term: 2013)
W Member of the Supervisory Board of Planet Finance (Expiration date of term: 2013)
Former positions held from 2009 et 2012 W Manager of Eurl Le Riffray I (Expiration date of term: 2009)
W Director of Tocqueville Finance Holding and Tocqueville Finances SA (Expiration date of term: 2009)
W Director and member of the Audit Committee of Club Méditerranée (Expiration date of term: 2010)
W Director and member of the Appointments, Remuneration and Corporate Governance Committee of Club Méditerranée (Expiration date of term: 2011)
W Chief Executive Offi cer of DFT Immobilier SAS (Expiration date of term: 2012)

2013 REGISTRATION DOCUMENT 87
CORPORATE GOVERNANCE
3
Composition and operation of the Board of Directors
Conflict of interests
Directors must strive to avoid any confl ict of interest between their
personal and material interests and those of the Company.
A confl ict of interests arises in particular where a director or a member
of their family could benefi t on a personal basis from the conduct of the
Company’s business or could have a relationship or link of any kind with
the Company, its subsidiaries or its management that could compromise
the free exercise of the director’s judgement.
Directors must inform the Board of Directors of any situation involving
a real or potential confl ict of interest with the Company or the Group’s
companies as soon as they become aware of such a situation and
must refrain from participating in discussions and voting relating to the
respective proceedings. The Chairman may ask the director not to attend
such proceedings.
Directors must therefore inform the Chairman without delay of any
agreement reached between themselves, or a company of which they
are a director, or in which they hold a signifi cant stake either directly or
indirectly, or in which they have a direct interest, and the Company or one
of its subsidiaries, or which has been reached through an intermediary.
The Chairman of the Board may ask the directors at any time to sign a
statement certifying that they do not have a confl ict of interest.
Assessment
The Board of Directors conducts regular assessments of its operations
and ability to carry out its missions. Accordingly, it reviews its operating
procedures and the quality of the information published and of its decision-
making and discussions, as well as each person’s actual contribution to
the work of the Board of Directors and the committees.
As a result, the Board of Directors is obliged to include a discussion on
its operation as an agenda item once a year.
A formal assessment of the Board of Directors was carried out during
the fi scal year with the help of the Appointments Committee and an
external consultant. The aim of this assessment was to ensure observance
of the Board of Directors’ operating principles and compliance with
the governance rules, and to identify proposals aimed at improving its
operations and effectiveness
3.2.3 THE BOARD OF DIRECTORS’ COMMITTEES
The Board of Directors has decided on the creation of specialist
committees responsible for examining questions submitted to them for
their opinion by the Board or the Chairman.
To take into account the nature and specifi c characteristics of the
Company’s activities, the Board of Directors’ Committees are as follows:
W the Accounts Committee;
W the Remuneration Committee;
W the Appointments Committee.
The specialist committees are made up of directors appointed by the
Board of Directors for the period of their term of offi ce.
These committees report on their work to the Board of Directors on a
regular basis and share with it their observations, opinions, proposals
and recommendations.
The committee Chairmen (or, if they are unavailable, another member of
the same committee) present oral summaries of their work to the Board
of Directors at its next meeting.
The terms of reference of these committees may not delegate powers
to them that are assigned to the Board of Directors in law or under the
articles of association. The committees have consultative power and
conduct their activities under the responsibility of the Board of Directors,
which alone has statutory decision-making power and remains collectively
responsible for the fulfi lment of its missions.
The Chairman of the Board of Directors is responsible for ensuring that the
number, missions, composition and operation of the committees refl ects
the needs of the Board of Directors and best corporate governance
practices at all times.
Each committee is chaired by an independent director drawn from its
members.
The secretary of each committee is an individual selected by the Chairman
of each committee.
These committees meet, as necessary, on the invitation of their Chairman,
or at the request of one-half of their members. They may call upon outside
experts as necessary. The committee Chairman may ask the Chairman of
the Board of Directors to interview any Group executive regarding issues
that fall within the committee’s purview, as defi ned by these by-laws.
3.2.3.1 The Accounts CommitteeThis committee meets at least four times per year.
Composition
At least two-thirds of the committee members must be independent, as
defi ned by the Board of Directors in accordance with the AFEP-MEDEF
Code to which it refers. At least one member of the committee must
have special expertise in fi nancial or accounting matters.
T he composition of the committee is as follows:
W Chairman: Georges Ralli (independent director)
W Members: Mathilde Lemoine (independent director), René Brillet
(independent director), Nicolas Bazire.
Sébastien Bazin’s term of offi ce as member of the Account Committee
e nded on January 15, 2014.

2013 REGISTRATION DOCUMENT 88
3 CORPORATE GOVERNANCEComposition and operation of the Board of Directors
Duties
The main duties of the committee are:
(i) I n respect of the fi nancial statements:
W to carry out a prior examination and offer an opinion on the annual
and half-yearly Company and Consolidated Financial Statements
before they are presented to the Board of Directors,
W to examine the relevance and permanence of the accounting
principles and rules used in drawing up the Company and
Consolidated Financial Statements and to warn of any deviation
from these rules,
W to examine the drafts of the annual report and fi nancial statements
prior to publication,
W more generally, to review all issues relating to fi nancial statements
and other documents, including the selection of accounting
standards, provisions, management accounting data, capital
suffi ciency requirements, profi tability indicators and any accounting
issues that raise methodological concerns or give rise to potential
risk;
(ii) I n respect of internal control:
W to assess the effectiveness and quality of the Group’s internal
control systems and procedures, to interview the internal audit
manager, to give an opinion on the organisation of the department
and to be informed of its programme of work,
W to examine, in conjunction with internal control managers, the
objectives and intervention and action plans in the area of internal
audit, the conclusions of such interventions and the actions,
recommendations and follow-up arising from them,
W to examine the methods and results of the internal audit and
check that the procedures used help the fi nancial statements to
refl ect a true and accurate picture of the business in accordance
with accounting rules,
W to assess the reliability of the systems and procedures used to
produce the fi nancial statements and the validity of the positions
taken in respect of presenting signifi cant transactions,
W to examine the methods used to report and present accounting and
fi nancial information from the subsidiaries and/or operational units,
W to examine the draft report on internal control procedures.
Relations with the Statutory Auditors
The committee oversees the process of selecting Statutory Auditors,
formulates an opinion on the appropriate fee levels for legal work pertaining
to internal control and submits the results of this selection to the Board.
It also ensures the Statutory Auditors’ independence. It issues a
recommendation on the Statutory Auditors whose appointment is
proposed by the Shareholders’ Meeting.
It reviews the Statutory Auditors’ audit plan, their recommendations and
the implementation of these recommendations.
It is annually notifi ed of the amount and breakdown of fees paid by
the Group to the Statutory Auditors and the networks to which they
belong, calculated according to a model approved by the committee.
It ensures that the amount or share of the Statutory Auditors’ revenues
represented by the Group is not likely to compromise the Statutory
Auditors’ independence.
It gives its prior consent for any undertaking whose fees (excluding tax)
exceed 1 million euros. The committee approves other undertakings after
the fact, based on submissions from the Group Finance department. Each
year, the committee receives a report from the Group Finance department
on all assignments other than auditing carried out by networks to which
the Group’s Statutory Auditors belong.
The committee ensures that the signatories of the fi nancial statements
rotate and that the expiry dates of the terms of offi ce of the Statutory
Auditors are staggered.
It ensures that neither the fi rm(s) responsible for statutory auditing of
the accounts nor the network to which it belongs provide any kind of
consultancy services to the Group.
The Statutory Auditors each provide an annual presentation to the
committee on the procedures within their internal-control system for
ensuring independence, and annually certify in writing their independence
in fulfi lling their audit responsibilities.
At least twice per year, the committee devotes part of its meeting to a
discussion with the Statutory Auditors’ teams without the presence of
the Company’s general management, after fi rst informing the Chairman
of the Board of Directors.
The committee meets in the presence of the Statutory Auditors’ teams
to review the half-yearly and annual fi nancial statements.
However, the Statutory Auditors do not attend any or all of the meeting
dealing with their fees and renewal of their terms of offi ce.
The Statutory Auditors do not attend any or all of the meeting at which
the committee deals with specifi c issues relating to any of them.
Where questions of interpretation of accounting standards arise in
connection with the half-yearly and annual results, involving choices
that have a material impact, the Statutory Auditors and the Group Finance
department present a memorandum to the committee analysing the nature
and signifi cance of the issue, presenting the pros and cons of various
possible solutions and explaining the reasons for the choice made.
Report by the Chairman
The committee reviews the draft report by the Chairman on internal-control
procedures relating to the preparation and processing of accounting
and fi nancial information.
Interviews
On all issues within its purview, the committee may – as it sees fi t and
outside the presence of any other general management members, if it
deems this appropriate – interview the Group’s fi nancial and accounting
managers as well as the audit and internal-control manager. The Chairman
of the Board of Directors must be informed of this in advance.
The committee may call on outside experts as necessary.

2013 REGISTRATION DOCUMENT 89
CORPORATE GOVERNANCE
3
Composition and operation of the Board of Directors
3.2.3.2 The Remuneration CommitteeThe committee meets as often as necessary.
Composition
A majority of the members of the Remuneration Committee members
must be independent directors as defi ned by the Board of Directors in
accordance with the AFEP-MEDEF Code to which it refers.
T he composition of the committee is as follows:
W Chairman: Thierry Breton (independent director);
W Members: René Brillet (independent director), Charles Edelstenne
(independent director).
Sébastien Bazin’s term of offi ce as member of the Remunation Committee
e nded on January 15, 2014.
Duties
The committee is responsible for formulating proposals on the various
elements of compensation paid to members of the Board and the
Chairman and Chief Executive Offi cer.
It is responsible for reviewing all issues relating to the personal status of
corporate offi cers, including remuneration, pension and welfare benefi ts,
benefi ts in kind and provisions governing the cessation of their term of
offi ce.
Its main responsibility is to formulate proposals for decisions on granting
subscription and/or purchase options for shares in the Company to
the benefi t of corporate offi cers and all or some of the salaried staff of
the Company and subsidiaries in accordance with the authoriz ations
granted by the Shareholders’ Meeting. It examines the conditions under
which options are granted and proposes a list of benefi ciaries of options
and the number of options allocated to each of them. It formulates any
proposals determining the characteristics of options and in particular,
the subscription and/or purchase price of shares, their duration, any
conditions to which exercising them may be subject and the terms under
which they may be taken up.
It is also responsible for formulating proposals in respect of the free
allocation of existing shares or shares to be issued in accordance with
the authorisations granted by the Shareholders’ Meeting. It proposes the
names of benefi ciaries of share allocations and any conditions, particularly
in respect of the length of acquisition and retention periods and criteria
for share allocations.
It is informed of the remuneration policy for top executives who are not
corporate offi cers.
3.2.3.3 The Appointments CommitteeThe committee meets as often as necessary.
Composition
A majority of the members of the Nominations Committee must be
independent directors as defi ned by the Board of Directors in accordance
with the AFEP-MEDEF Code to which it refers.
T he composition of the committee is as follows:
W Chairman: Bertrand de Montesquiou (independent director)
W Members: Anne-Claire Taittinger (independent director), Diane
Labruyère (independent director), Nicolas Bazire.
Duties
The committee examines and formulates an opinion on any application
for nomination to the post of director or a role as a corporate offi cer,
taking particular account of a desirable balance in the composition of the
Board. It assesses the appropriateness of the renewal of terms of offi ce.
It organises a procedure for the purpose of selecting future independent
directors.
The classifi cation of independent director is discussed by the committee
and reviewed each year by the Board prior to the publication of the
annual report.
It makes recommendations to the Board of Directors on the appointment
of members of the specialist committees when they are due for renewal.
It is also charged with assessing directors’ independence and reporting
its fi ndings to the Board of Directors. If necessary, the committee reviews
situations that result from a director’s repeated absence.
It also assists the Board of Directors in adapting the Company’s corporate
governance practices and assessing their operation.
It examines the Chairman’s draft report on corporate governance and
any other document required by law or regulations.
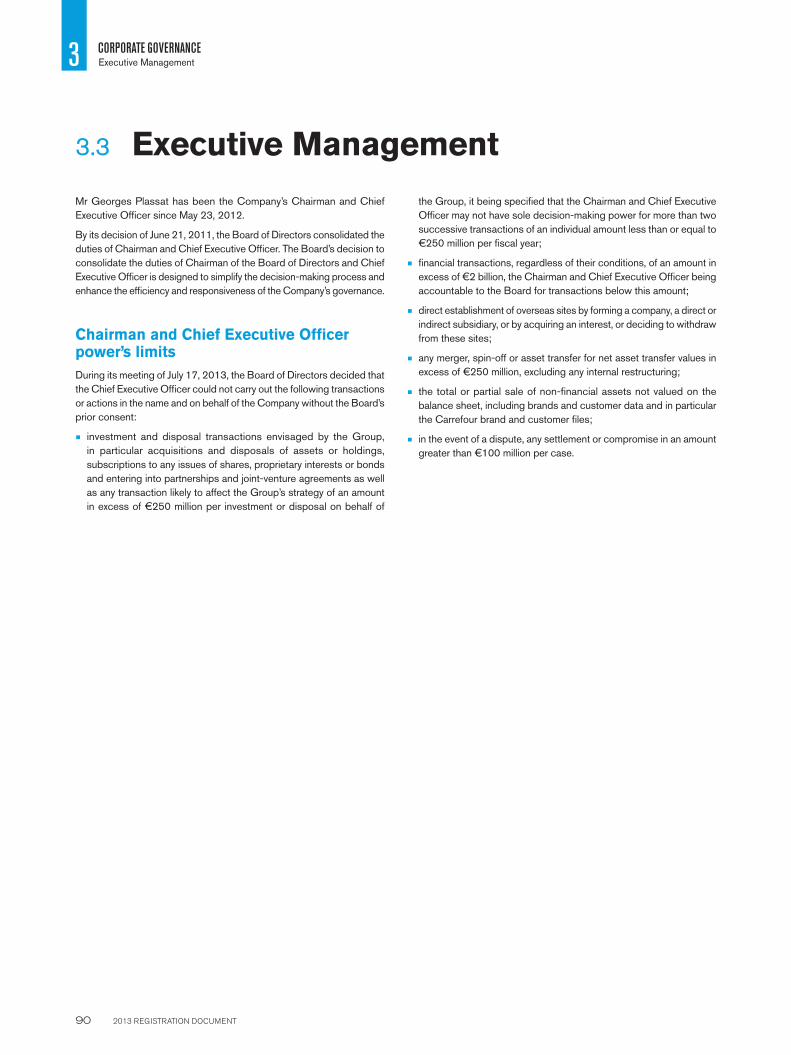
2013 REGISTRATION DOCUMENT 90
3 CORPORATE GOVERNANCEExecutive Management
Mr Georges Plassat has been the Company’s Chairman and Chief
Executive Offi cer since May 23, 2012.
By its decision of June 21, 2011, the Board of Directors consolidated the
duties of Chairman and Chief Executive Offi cer. The Board’s decision to
consolidate the duties of Chairman of the Board of Directors and Chief
Executive Offi cer is designed to simplify the decision-making process and
enhance the effi ciency and responsiveness of the Company’s governance.
Chairman and Chief Executive Officer power’s limits
During its meeting of July 17, 2013, the Board of Directors decided that
the Chief Executive Offi cer could not carry out the following transactions
or actions in the name and on behalf of the Company without the Board’s
prior consent:
W investment and disposal transactions envisaged by the Group,
in particular acquisitions and disposals of assets or holdings,
subscriptions to any issues of shares, proprietary interests or bonds
and entering into partnerships and joint-venture agreements as well
as any transaction likely to affect the Group’s strategy of an amount
in excess of €250 million per investment or disposal on behalf of
the Group, it being specifi ed that the Chairman and Chief Executive
Offi cer may not have sole decision-making power for more than two
successive transactions of an individual amount less than or equal to
€250 million per fi scal year;
W fi nancial transactions, regardless of their conditions, of an amount in
excess of €2 billion, the Chairman and Chief Executive Offi cer being
accountable to the Board for transactions below this amount;
W direct establishment of overseas sites by forming a company, a direct or
indirect subsidiary, or by acquiring an interest, or deciding to withdraw
from these sites;
W any merger, spin-off or asset transfer for net asset transfer values in
excess of €250 million, excluding any internal restructuring;
W the total or partial sale of non-fi nancial assets not valued on the
balance sheet, including brands and customer data and in particular
the Carrefour brand and customer fi les;
W in the event of a dispute, any settlement or compromise in an amount
greater than €100 million per case.
3.3 Executive Management

2013 REGISTRATION DOCUMENT 91
CORPORATE GOVERNANCE
3
Remuneration and benefi ts granted to corporate offi cers
3.4.1 REMUNERATION OF THE MEMBERS OF THE BOARD OF DIRECTORS
3.4 Remuneration and benefi ts granted to corporate offi cers
The Shareholders’ Meeting of July 28, 2008 established the amount of
directors’ fees allocated to the Board of Directors at 900,000 euros.
Based on discussions held on July 11, 2012 and on April 17, 2013, the
Board of Directors decided to allocate directors’ fees annually, as follows:
W Chairman of the Board of Directors: 10,000 euros;
W Vice-Chairman of the Board of Directors: 40,000 euros;
W Senior independent director: 40,000 euros;
W Chairman of the Accounts Committee: 30,000 euros;
W Chairman of the Remuneration and the Appointments Committees:
10,000 euros;
W Committee member: 10,000 euros;
W Members of the Board of Directors: 45,000 euros.
It being specifi ed that:
W 10,000 euros for membership in one or more committees will be
based on the committee member’s regular attendance at its meetings;
W 45,000 euros for membership in the Board will be comprised of a
fi xed portion of 35,000 euros and a variable portion of 10,000 euros
based on the Board member’s regular attendance at its meetings.
The variable portion of the directors’ fees is paid in proportion to the
number of Board and/or committee meetings attended by the directors
(100% of the variable portion will be allocated for attendance at all
meetings).
Directors’ fees are paid once per year, in July.
During 2012 and 2013 fi scal years, the members of the Board of Directors obtained director s’ fees (absence of other compensation except for the
Chairman and Chief Executive Offi cer as detail ed in 3.4.2) as detailed below.
TABLE OF DIRECTOR S ’ FEES AND OTHER REMUNERATION RECEIVED BY CORPORATE OFFICERS
Amount paid during fi scal year N-1 Amount paid during fi scal year N
Georges Plassat €13,339.00 €55,000.00
Sébastien Bazin €114,062.50 €105,000.00
René Brillet €75,000.00 €64,090.90
Thierry Breton €73,125.00 €61,363.63
Anne-Claire Taittinger €72,884.50 €54,090.90
Mathilde Lemoine €71,009.50 €49,881.81
Amaury de Sèze €92,187. 50 €85,000.00
Nicolas Bazire €60,000.00 €55,000.00
Charles Edelstenne €53,125.00 €45,000.00
Bernard Arnault €44,687.50 €38,636.36
Jean-Laurent Bonnafé €43,750.00 €43,181.81
Bertrand de Montesquiou €9,107.00 €65,000.00
Georges Ralli €9,107.00 €70,757.57
Diane Labruyere €7,902.00 €55,000.00
TOTAL €739,286.50 €847,002.98
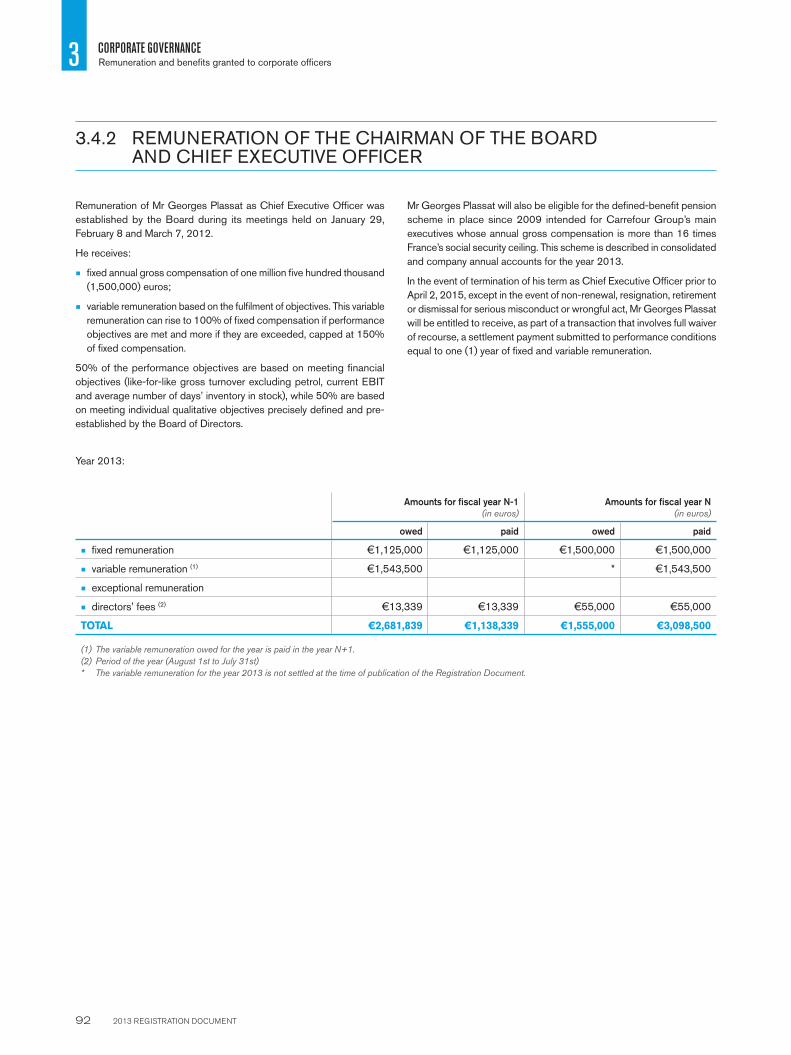
2013 REGISTRATION DOCUMENT 92
3 CORPORATE GOVERNANCERemuneration and benefi ts granted to corporate offi cers
3.4.2 REMUNERATION OF THE C HAIRMAN OF THE BOARD AND C HIEF E XECUTIVE O FFICER
Remuneration of Mr Georges Plassat as Chief Executive Offi cer was
established by the Board during its meetings held on January 29,
February 8 and March 7, 2012.
He receives:
W fi xed annual gross compensation of one million fi ve hundred thousand
(1,500,000) euros;
W variable remuneration based on the fulfi lment of objectives. This variable
remuneration can rise to 100% of fi xed compensation if performance
objectives are met and more if they are exceeded, capped at 150%
of fi xed compensation.
50% of the performance objectives are based on meeting fi nancial
objectives (like-for-like gross turnover excluding petrol, current EBIT
and average number of days’ inventory in stock), while 50% are based
on meeting individual qualitative objectives precisely defi ned and pre-
established by the Board of Directors.
Mr Georges Plassat will also be eligible for the defi ned-benefi t pension
scheme in place since 2009 intended for Carrefour Group’s main
executives whose annual gross compensation is more than 16 times
France’s social security ceiling. This scheme is described in consolidated
and company annual accounts for the year 2013.
In the event of termination of his term as Chief Executive Offi cer prior to
April 2, 2015, except in the event of non-renewal, resignation, retirement
or dismissal for serious misconduct or wrongful act, Mr Georges Plassat
will be entitled to receive, as part of a transaction that involves full waiver
of recourse, a settlement payment submitted to performance conditions
equal to one (1) year of fi xed and variable remuneration.
Year 2013:
Amounts for fi scal year N-1(in euros)
Amounts for fi scal year N(in euros)
owed paid owed paid
W fi xed remuneration € 1,125,000 € 1,125,000 € 1,500,000 € 1,500,000
W variable remuneration (1) € 1,543,500 * €1,543,500
W exceptional remuneration
W directors’ fees (2) € 13,339 € 13,339 €55, 000 € 55, 000
TOTAL €2,681,839 €1,138,339 €1,555,000 €3,098,500
(1) The variable remuneration owed for the year is paid in the year N+1.
(2) Period of the year (August 1st to July 31st)
* The variable remuneration for the year 2013 is not settled at the time of publication of the Registration Document.

2013 REGISTRATION DOCUMENT 93
CORPORATE GOVERNANCE
3
Remuneration and benefi ts granted to corporate offi cers
TABLE 1 - SUMMARY TABLE OF REMUNERATION, OPTIONS AND SHARES GRANTED TO EACH EXECUTIVE OFFICER
Fiscal year N-1 Fiscal year N
Name and position of executive offi cer
Georges Plassat Chairman and
Chief Executive Offi cer
Remuneration owed for the fi scal year (set forth in Table 2) €2, 681, 839 €1, 555 , 000
Pricing of options granted during the fi scal year (set forth in Tables 4 and 5) - -
Pricing of performance-based shares granted during the fi scal year (set forth in Tables 6 and 7) - -
TOTAL €2, 681 , 839 €1, 555 , 000
TABLE 2 - SUMMARY TABLE OF REMUNERATION FOR EACH EXECUTIVE OFFICER
Table presented o n the page 92.
TABLE 3 - TABLE OF DIRECTORS’ FEES AND OTHER REMUNERATION RECEIVED BY NON-MANAGEMENT CORPORATE OFFICERS
Table presented o n the page 91.
3.4.3 AFEP-MEDEF RECOMME NDATIONS: TABLE ON REMUNERATION AND BENEFITS GRANTED TO C ORPORATE OFFICERS

2013 REGISTRATION DOCUMENT 94
3 CORPORATE GOVERNANCERemuneration and benefi ts granted to corporate offi cers
TABLE 4 - SHARE SUBSCRIPTION OR PURCHASE OPTIONS GRANTED DURING THE FISCAL YEAR TO EACH EXECUTIVE OFFICER
Name of executive offi cer Number and date of plan
Type of options (purchase or subscription)
Pricing of options
according to the method used for the
Consolidated Financial
Statements
Number of options awarded during the fi scal
year Exercise price Exercise period
None
TABLE 5 - SHARE SUBSCRIPTION OR PURCHASE OPTIONS EXERCISED DURING THE FISCAL YEAR BY EACH EXECUTIVE OFFICER
Name of executive offi cer Number and date of plan
Number of options exercised during the
fi scal year Exercise price
None
TABLE 6 - PERFORMANCE-BASED SHARES GRANTED TO EACH EXECUTIVE OFFICER
Name of executive offi cer Number and date of plan
Number of shares
allocated during the fi scal year
Pricing of shares according to the method used for the
Consolidated Financial
Statements Vesting date Date available
for trading Performance
conditions
None
TABLE 7 - PERFORMANCE-BASED SHARES WHICH BECAME AVAILABLE FOR TRADING DURING THE FISCAL YEAR FOR EACH EXECUTIVE OFFICER
Name of executive offi cer Number and date of plan
Number of shares which became
available for trading during the fi scal year
Vesting conditions
None
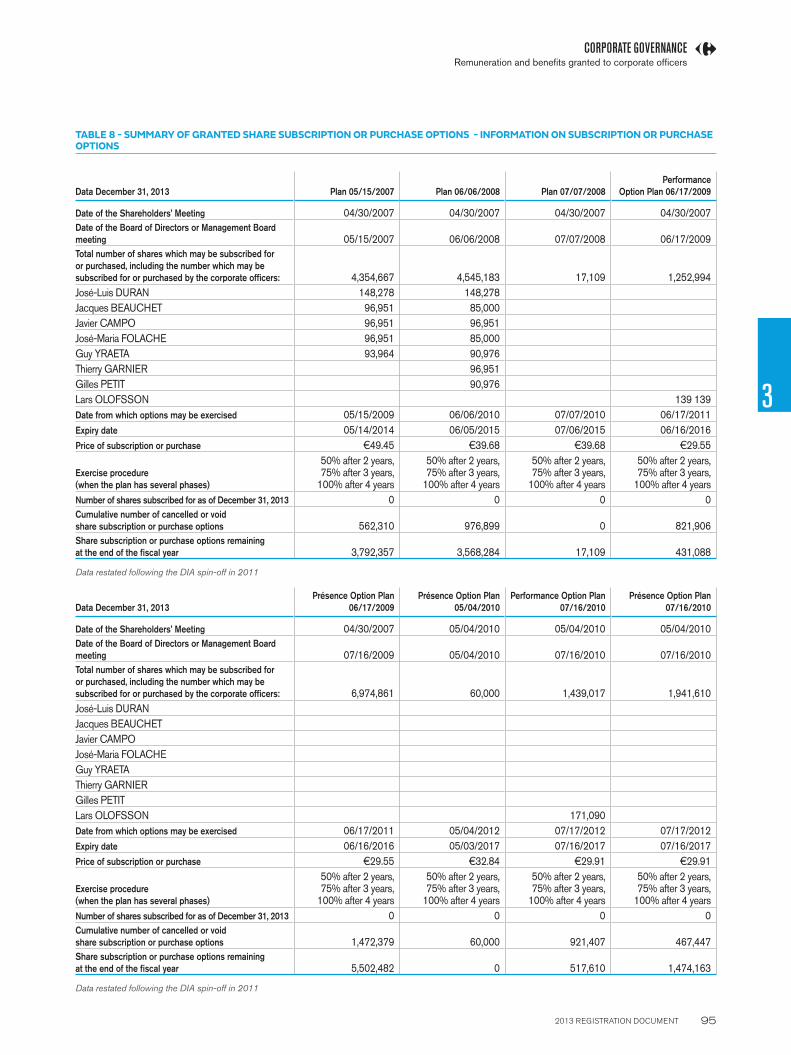
2013 REGISTRATION DOCUMENT 95
CORPORATE GOVERNANCE
3
Remuneration and benefi ts granted to corporate offi cers
TABLE 8 - SUMMARY OF GRANTED SHARE SUBSCRIPTION OR PURCHASE OPTIONS - INFORMATION ON SUBSCRIPTION OR PURCHASE OPTIONS
Data December 31, 2013 Plan 05/15/2007 Plan 06/06/2008 Plan 07/07/2008
Performance
Option Plan 06/17/2009
Date of the Shareholders’ Meeting 04/30 /2007 04/30 /2007 04/30 /2007 04/30 /2007
Date of the Board of Directors or Management Board
meeting 05/15 /2007 06 /06/2008 07 /07 /2008 06/17 /2009
Total number of shares which may be subscribed for
or purchased, including the number which may be
subscribed for or purchased by the corporate offi cers: 4, 354, 667 4, 545, 183 17, 109 1, 252, 994
José-Luis DURAN 148, 278 148, 278
Jacques BEAUCHET 96, 951 85, 000
Javier CAMPO 96, 951 96, 951
José-Maria FOLACHE 96, 951 85, 000
Guy YRAETA 93, 964 90, 976
Thierry GARNIER 96, 951
Gilles PETIT 90, 976
Lars OLOFSSON 139 139
Date from which options may be exercised 05/15 /2009 06/06/2010 07/07/2010 06/17 /2011
Expiry date 05/14 /2014 06/05 /2015 07/06 /2015 06/16 /2016
Price of subscription or purchase €49. 45 €39. 68 €39. 68 €29. 55
Exercise procedure
(when the plan has several phases)
50% after 2 years, 75% after 3 years,
100% after 4 years
50% after 2 years, 75% after 3 years,
100% after 4 years
50% after 2 years, 75% after 3 years,
100% after 4 years
50% after 2 years, 75% after 3 years,
100% after 4 years
Number of shares subscribed for as of December 31, 2013 0 0 0 0
Cumulative number of cancelled or void
share subscription or purchase options 562, 310 976, 899 0 821, 906
Share subscription or purchase options remaining
at the end of the fi scal year 3, 792, 357 3, 568, 284 17, 109 431, 088
Data restated following the DIA spin-off in 2011
Data December 31, 2013
Présence Option Plan
06/17/2009
Présence Option Plan
05/04/2010
Performance Option Plan
07/16/2010
Présence Option Plan
07/16/2010
Date of the Shareholders’ Meeting 04/30 /2007 05/04 /2010 05/04 /2010 05/04 /2010
Date of the Board of Directors or Management Board
meeting 07/16 /2009 05/04 /2010 07/16 /2010 07/16 /2010
Total number of shares which may be subscribed for
or purchased, including the number which may be
subscribed for or purchased by the corporate offi cers: 6, 974, 861 60, 000 1, 439, 017 1, 941, 610
José-Luis DURAN
Jacques BEAUCHET
Javier CAMPO
José-Maria FOLACHE
Guy YRAETA
Thierry GARNIER
Gilles PETIT
Lars OLOFSSON 171, 090
Date from which options may be exercised 06/17 /2011 05/04 /2012 07/17 /2012 07/17 /2012
Expiry date 06/16 /2016 05/03 /2017 07/16 /2017 07/16 /2017
Price of subscription or purchase €29. 55 €32. 84 €29. 91 €29. 91
Exercise procedure
(when the plan has several phases)
50% after 2 years, 75% after 3 years,
100% after 4 years
50% after 2 years, 75% after 3 years,
100% after 4 years
50% after 2 years, 75% after 3 years,
100% after 4 years
50% after 2 years, 75% after 3 years,
100% after 4 years
Number of shares subscribed for as of December 31, 2013 0 0 0 0
Cumulative number of cancelled or void
share subscription or purchase options 1, 472, 379 60, 000 921, 407 467, 447
Share subscription or purchase options remaining
at the end of the fi scal year 5, 502, 482 0 517, 610 1, 474, 163
Data restated following the DIA spin-off in 2011

2013 REGISTRATION DOCUMENT 96
3 CORPORATE GOVERNANCERemuneration and benefi ts granted to corporate offi cers
TABLE 9 - SUMMARY OF GRANTED PERFORMANCE SHARES - INFORMATION ON PERFORMANCE SHARES
Data December 31, 2013 Performance shares plan 07/16/2010 Performance shares plan Executive offi cer
07/16/2010
Date of the Shareholders’ Meeting 05/04/10 05/04/10
Date of the Board of Directors or Management Board meeting 07/16/2010 07/16/2010
Total number of free shares , including the number for each
executive offi cers: 391, 047 57, 030
Lars OLOFSSON 0 57, 030
Vesting date for performance shares 07/17/2012 07/17/2012
Transferability date for performance shares 07/17/2014 07/17/2014
Performance conditions
1) TSR Retail (50%)2) TSR Consumer Goods (50%)
Preceding conditions :Growth in 2011 ex-petrol net sales compared
to 2009 ex-petrol net sales, at constant currencies and comparable scope and
Activity contribution 2011 + 5 % compared to Activity contribution 2009
1) TSR Retail (50%) 2) TSR Consumer Goods (50%)
Number of performance shares vested at December 31, 2013 0 0
Cumulative number of cancelled or void performance shares 391, 047 57, 030
Performance Shares remaining at the end of the fi scal year 0 0
Data restated following the DIA spin-off in 2011
TABLE 10
Employment contract Supplemental pension
plan
Compensation or benefi ts owed or likely to be owed
due to termination or change in duties
Compensation related to a non-competition clause
Yes No Yes No Yes No Yes No
Georges PLASSAT :Chairman and Chief Executive Offi cer (since May 23, 2012) Start of term: 05/23/2012 X X X X

2013 REGISTRATION DOCUMENT 97
CORPORATE GOVERNANCE
3
Remuneration and benefi ts granted to corporate offi cers
In accordance with Article 223–26 of the General Regulations of the
AMF, we hereby inform you that, during transactions carried out during
the 20132 fi scal year by persons described in Article L. 621-18-2 of
the French Monetary and Financial Code:
W o n June 7, 2013, the company Blue Capital, a legal entity linked to
Bernard Arnault, director of the Company, acquired shares in respect
of the option for the payment of the dividend in shares for fi scal year
2012 in the amount of €182,524.86, i.e. a unit price of €19.62;
W o n June 6, 2013, Mr Jean Laurent Bonnafé, director of the Company,
acquired shares in the amount of €588.60, i.e. a unit price of €19.62;
W o n June 7, 2013, the company Bunt, a legal entity linked to Bernard
Arnault, director of the Company, acquired shares in respect of the
option for the payment of the dividend in shares for fi scal year 2012
in the amount of €18,573,861.60, i.e. a unit price of €19.62;
W o n September 16, 2013, a natural person linked to Bertrand de
Montesquiou, director of the Company, disposed of shares in the
amount of €1,269,928 at an average unit price of €25.39856;
W o n November 19, 2013, the company Groupe Arnault, a legal entity
linked to Bernard Arnault, director of the Company, extended share
purchase options in the amount of €1,648,861;
W o n November 20, 2013, the company Groupe Arnault, a legal entity
linked to Bernard Arnault, director of the Company, extended share
purchase options in the amount of €217,260;
W o n November 21, 2013, the company Cervinia Europe, a legal entity
linked to Bernard Arnault, director of the Company, purchased shares
in the amount of €4,538,156.85, i.e. a unit price of €27.479;
W o n November 22, 2013, the company Cervinia Europe, a legal entity
linked to Bernard Arnault, director of the Company, purchased shares
in the amount of €10,683,414.03, i.e. a unit price of €27.819;
W o n November 25, 2013, the company Cervinia Europe, a legal entity
linked to Bernard Arnault, director of the Company, purchased shares
in the amount of €9,960,911.94, i.e. a unit price of €28.262;
W o n November 26, 2013, the company C ervinia Europe, a legal entity
linked to Bernard Arnault, director of the Company, purchased shares
in the amount of €11,124,609.65, i.e. a unit price of €28.609;
W o n November 27, 2013, the company Cervinia Europe, a legal entity
linked to Bernard Arnault, director of the Company, purchased shares
in the amount of €10,333,130.82, i.e. a unit price of €28.881;
W o n November 28, 2013, the company Cervinia Europe, a legal entity
linked to Bernard Arnault, director of the Company, purchased shares
in the amount of €6,579,419.30, i.e. a unit price of €28.997;
W o n November 29, 2013, the company Cervinia Europe, a legal entity
linked to Bernard Arnault, director of the Company, purchased shares
in the amount of €5,145,354.10, i.e. a unit price of €28.968;
W o n December 2, 2013, the company Cervinia Europe, a legal entity
linked to Bernard Arnault, director of the Company, purchased shares
in the amount of €7,698,885.43, i.e. a unit price of €29.012;
W o n December 3, 2013, the company Cervinia Europe, a legal entity
linked to Bernard Arnault, director of the Company, purchased shares
in the amount of €15,071,927.43, i.e. a unit price of €28.245;
W o n December 4, 2013, the company Cervinia Europe, a legal entity
linked to Bernard Arnault, director of the Company, purchased shares
in the amount of €12,487,487.79, i.e. a unit price of €27.858;
W o n December 16, 2013, a natural person linked to Bertrand de
Montesquiou, director of the Company, disposed of shares in the
amount of €966,623 at an average unit price of €27.6197.
3.4.4 TRANSACTIONS CARRIED OUT BY CORPORATE OFFICERS WITH REGARD TO COMPANY SHARES

2013 REGISTRATION DOCUMENT 98
3 CORPORATE GOVERNANCERisk management
In an uncertain, constantly changing environment, proactive risk
management is an essential part of sustainable development for our
business, and is an aim shared by all of our employees. This approach also
enables the review of all processes within the Company and identifi cation
of opportunities and areas for improvement.
The risk management system implemented by the Group is primarily based
on identifying and accounting for risk factors which may have a signifi cant
impact on its activities, its fi nancial position and its image (3.5.1).
For the past several years, the Group has been committed to a coordinated
risk management policy based on risk mapping, rules and communication
of best practices, with a focus on prevention (3.5.2). The risk management
system is also presented in the section entitled “Chairman’s report on
internal control and risk management procedures” starting on page 106
of this Registration Document.
As part of a regular analysis and review of insurable risks, the Group also
implements solutions to transfer risks to the insurance market (3.5.3).
To manage diffi cult situations that may signifi cantly impact its activities
or its image, the Group has also developed a comprehensive crisis
management system (3.5.4.).
3.5 Risk management
3.5.1 RISK FACTORS
The principal risk factors identifi ed by the Group are presented below,
grouped into four themes: business environment, strategy and governance,
operations, and fi nancial.
All listed risks may have an impact on the Group’s activities or its ability
to fulfi l its objectives. There may also be other risks of which the Group
is unaware as of the date of this Document, or which may evolve with
signifi cant negative consequences.
The system presented in 3.5.2 aims for comprehensive risk management
in order to avoid the occurrence of risks or limit their impact, through a
customized protection and prevention policy.
The management and oversight systems for each risk factor are briefl y
stated.
Business environment
Political and social environment
Some of the Group’s activities are exposed to risk and uncertainty in
countries which have experienced or may experience a period of political
or social instability or weak governance.
During the past several years the Group has developed country-specifi c
risk mapping which takes into account a number of indicators, is updated
annually and provides forward-looking monthly tracking, in order to support
decision making in the context of the Group’s international growth.
Economic environment and market volatility
The economic situation in countries where the Group operates may affect
demand, spending levels and the purchasing habits of our customers,
increased by the instability and unpredictability of the global, national or
regional economic climate. Volatility in asset prices and the cost prices
of assets and products related to raw materials (agriculture, metals, fuel,
energy costs, etc.) may also impact sales, costs and balance sheet values.
Due to the nature of its activities, the Group pays particular attention to
monitoring and taking into account the changing economic climate and
future outlooks in the countries where it operates, specifi cally through a
number of studies and exchanges. Given the interdependence of activities
and the price sensitivity of Group customers, changes in market prices
are also taken into consideration at various levels, especially purchases
of merchandise and general and administrative expenses.
Environment, pressure and regulatory changes
Regulations applicable to the Group in countries where it operates,
along with regulatory changes and actions taken by local, national and
international regulators, are likely to impact our activities and the Group’s
fi nancial performance.
The local Legal department in each country is responsible for monitoring
regulations and taking them into consideration, under the coordination
and supervision of the Group Legal department.
2013 REGISTRATION DOCUMENT 99
CORPORATE GOVERNANCE
3
Risk management
With a focus on anticipation and optimal allocation of resources, the
Group Legal department has also developed and implemented a legal
risk mapping process, specifi cally taking into account the environment,
pressure and regulatory developments.
Changes in the sector and the competitive environment
Highly exposed to changes in consumer behaviour in a world of changing
technology, the retail sector is characterised by strong competitive
dynamics with saturated markets in Europe and relatively low margins.
This drives constant rapid changes within the sector, which could impact
the Group’s activity and performance.
The changing competitive environment is monitored and addressed at
country level, and handled at Group level by the Strategy department,
in an effort to anticipate and identify growth opportunities or decisions
to be made.
Natural disasters and climate change
In most countries where it operates, the Group may be exposed to natural
disasters, with direct or indirect impacts on its activities, its assets and
its employees, and consequences for its fi nancial position. In a context
of climate change, changing meteorological conditions may also impact
its operations, especially with regard to customer behaviour.
Since 2008, the Group has undertaken extensive work to better improve
the management of natural risks in its operations, in order to develop
knowledge, improve assessment, adapt preventive measures and adjust
insurance coverage. This work was carried out in all countries where the
Group operates, either directly or through franchises, with a forward-
looking exercise related to climate change, specifi cally through a mapping
of natural risks, assessments by risk and by country to identify ‘sensitive’
sites, and prevention fact sheets.
Terrorism and crime
Due to a multitude of counterparts, the vast number of sites and its
activity involving considerable human, product and fi nancial fl ows, the
mass retail sector is particularly exposed to risks of crime and terrorism,
with signifi cant direct and indirect impacts, especially in stores.
Preventive and protection measures for each site are determined based
on risk exposure, with regular review of the systems and adjustments
made based on the development of threats.
Strategy and governance
Strategy defi nition, adjustment and implementation
As with project management or restructuring problems, in an uncertain
and complex political, economic, social and competitive environment,
the ineffective or unsuitable design, communication and execution of the
Group’s vision and strategy may damage its reputation and its fi nancial
and operational performance.
Under the coordination of general management and as part of overseeing
activities and the principal action plans, extensive work is underway at the
country level to develop the strategy, with a regular review of objectives
and commitments enabling optimal allocation of resources.
Compliance and fair practices
In an increasingly litigious world, with regulatory authorities having
broad power, the failure to comply with regulations and contractual
commitments, within the scope of the Group’s operational activities and
in its relations with its employees, can have a signifi cant impact on its
fi nancial performance and its reputation.
As part of its preventive approach at the Group and country level, the
Legal department has created and implemented information and training
programmes involving all employees concerned. The top fundamental
principle of the Carrefour Code of Business Conduct, which applies to
all employees, emphasises strict compliance with regulations wherever
the Group operates and in all of its activities. The Company’s ethics
system is presented in Section 2.1.3 (page 21 and following pages ).
Corporate responsibility
Looking beyond regulatory compliance, given consumers’ growing
concerns about responsible and sustainable trade and the nature and
reality of commitments, sustainable development policies and actions
may impact the Company’s reputation and its fi nancial performance.
For a number of years, the Group has maintained a proactive and
committed sustainable development policy, described in detail in the
section on Corporate Responsibility, with a wide range of concrete
actions taken in every country in which the Group operates.

2013 REGISTRATION DOCUMENT 100
3 CORPORATE GOVERNANCERisk management
Environment
In the scope of its activities, the Group may be exposed to a wide range
of environmental risks (water, air and ground pollution, noise pollution or
visual pollution) mainly with respect to its large number of operated sites.
While environmental regulations have been developing in many countries,
along with increased consumer awareness of the stakes, certain activities
and processes are especially sensitive (waste treatment, recycling of
own-brand product packaging, consumption of refrigerants and energy,
explosive atmospheres, service stations, alternative transport, etc.) with
particular attention paid to natural resource management (water, fi sh
stocks, wood, etc.).
Environmental protection and preservation is naturally considered by the
Group along with industrial risks, with a focus on prevention through
study and analysis, but also through the operational implementation of
prevention or treatment systems, such as for risks related to service
stations. All actions intended to reduce the environmental footprint of
our business activities are presented in Section 2.5 of the Registration
Document (page 51 and following pages ).
Disputes/Litigation
In the scope of its normal activities, the Group is involved in various legal
and administrative proceedings and is subject to administrative audits,
whose outcomes are uncertain with potentially signifi cant impacts on
our fi nancial position or reputation.
The Legal department manages and oversees disputes at the country
level and at Group level.
Operations
Relevance and performance of economic and business models
In a highly competitive environment with very unstable markets, the
relevance of economic and business models and their rapid adjustment
to changing consumption habits and patterns, as well as effi cient and
effective purchasing, can have a signifi cant impact on the Group’s
operational and fi nancial performance, in its organisation and design as
well as in the ability to deploy in stores.
Adapting business models to customer expectations is a major challenge
for the teams in charge of development and concepts, using a forward-
looking approach and constant oversight. Careful oversight and numerous
pre-deployment studies are also used to fully account for all factors and
effects involved in establishing the economic models.
Operational and fi nancial control of growth and expansion
In a signifi cant competitive environment with cost pressure and
increasingly scarce high-quality locations in certain countries, the Group
faces the inability or diffi culties in identifying, obtaining or developing
the best sites, in a constant search for higher profi tability based on valid
and reliable assumptions while taking into account all risk factors. This
may impact its fi nancial performance and fulfi lment of its objectives,
along with inadequate identifi cation, assessment and integration of new
assets or companies.
All of these elements are considered in the dossiers analysed by the
country-level Financial departments, in connection with the Development
department and, where applicable, with the Carrefour Property teams.
The most signifi cant dossiers are reviewed and approved by the Group
Investment Committee (CIG).
Partnerships and franchising
Since most of the Group’s stores under banner are operated as franchises
and the Group’s growth relies on partnerships in several countries, the
evaluation, selection, support and oversight of these various franchisees
and partners may have a positive or negative impact on fi nancial and
operational performance, and on its reputation in the event the partners’
practices do not comply with regulations or with the Group’s standards
and values.
Looking beyond the contractual framework and the well-controlled
process of awarding banners under franchise, relations with our partners
and franchisees are maintained and developed through numerous regular
exchanges, with oversight by franchise advisers and support by business
experts. Establishment of standards and regular inspections enable us
to effectively support our partners and franchisees.
Control of the supply chain
In an interdependent global market with a large number of suppliers
and increased cross-docking, the performance of logistical processes
and continuity of supply to the Group’s stores are essential to customer
satisfaction and the fulfi lment of operational and fi nancial objectives, with
greater risk in emerging markets and multinational corporations’ growing
responsibility for their supply chains.
Although purchasing is a key aspect of standing out from the competition,
the Group’s organisation is adapted to its international scope (delete)
while capitalising on its knowledge of local markets and relying on entities
dedicated to sourcing new products.
Over a number of years, the Group has developed expertise which ensures
that its stores are supplied, relying on integrated logistics platforms and
service providers, along with business continuity plans in the event of
an unusual situation.
2013 REGISTRATION DOCUMENT 101
CORPORATE GOVERNANCE
3
Risk management
Product quality, compliance and safety
With regulatory authorities and customers increasingly attentive to
health and quality issues, ensuring product safety and complying with
health standards in stores is a major issue which can signifi cantly impact
reputation and fi nancial performance, and which may in some cases
result in liability for the Group.
The Group Quality department has developed a number of standards and
tools which are deployed in all countries where the Group operates. The
country-level Quality departments are also part of the Quality network,
with regular meetings and discussions aimed at increased sharing of best
practices and ensuring a consistent approach. The Group also launched
a signifi cant employee training programme and regularly communicates
with customers about food safety.
In addition, the system includes a procedure for the rapid withdrawal of
any potentially dangerous product inventory.
Carrefour brand products are subject to more stringent procedures and
controls, from design to marketing, as part of a comprehensive approach
presented in detail in Section 2.2.4 (Page 43 and following pages).
Safety of people and property
Compliance with health and safety regulations and the protection of
Group assets are important factors. Insuffi cient consideration of these
issues could negatively impact the Group’s reputation, activities and
fi nancial performance, and may also have legal consequences.
An appropriate crisis management system in case of a major event is an
important part of limiting its potentially signifi cant negative consequences,
especially with regard to business continuity.
The Group’s risk prevention organisation ensures the safety of people and
property at all Group sites by using human, technical and organisational
resources which are appropriate to the risks.
Coordinated by general management, each country has an organisation
which enables rapid information reporting in the event of an incident,
and utilises the appropriate resources. The crisis management system
is briefl y presented in Section 3.5.4.
Human resource management
As the largest private employer in many countries where the Group
operates, the retail profession is based on human relations and
employee commitment. In a highly competitive market for talent with
major demographic changes, the Group faces a challenge in attracting,
retaining, training, motivating, compensating and developing employees
and the top candidates.
As a responsible employer, the Group has implemented an important
system adapted to the challenges of human resources, presented in
Section 2.2.3 (Page 31 and following pages).
Continuity, integrity and confi dentiality of information systems
While most of the Group’s activities and a number of its functions largely
depend on information systems developed or administered by internal
resources or outside service providers, weakness in these systems could
noticeably disrupt operations. This could result in signifi cant impacts
on fi nancial and operational performance, especially with regard to the
ordering, cash handling and fi nancial reporting systems.
With information systems that are constantly changing and diffi cult to
grasp as a whole, along with the development of nomadic computing and
cybercrime, information systems security is also a challenge, especially
the protection of data concerning our customers and employees.
The Group Information Systems department handles the development
and consistency of all computer applications within the Group, as part of
a coordinated effort to promote synergies while taking a forward-looking
approach to incorporating technological developments.
A dedicated team, which relies on a network in all countries where the
Group operates, works to ensure information systems security through
tailored governance, shared standards and regular controls.
Control and valuation of assets
Site quality and control of the Group’s assets are key factors in terms of
competitiveness and success. This involves determining and maintaining
an optimal level of property holdings, while remaining attentive to the
maintenance, management and value of the Group’s assets.
With a signifi cant portion of stores operated under commercial leases,
the Group’s inability to renew them under favourable terms could impact
performance. The same applies to ineffi cient or sub-optimal management
of tenant relations at sites owned by the Group.
Under the responsibility and coordination of the Group Property director,
who is also in charge of all Carrefour Property activities, each country
implements an asset control and valuation policy which is tailored to
its strategy.
Under the direction of the Group Legal department, the Group has also
established an active and committed policy to protect all of its brands.

2013 REGISTRATION DOCUMENT 102
3 CORPORATE GOVERNANCERisk management
Financial market risks
Within the scope of its activities, the Group is exposed to fi nancial
risk, namely liquidity, credit, foreign exchange and interest rate risk. The
Carrefour Group’s fi nancial risk management policy addresses three
primary objectives: security, liquidity and profi tability. It is described in
detail in Note 36 to the Consolidated Financial Statements.
Risk is managed centrally by the Group’s cash and cash equivalent and
Financing Operations department (DTFG).
With regard to credit activities (banking and insurance), risk management
and oversight is directly managed by the concerned entity, with DTFG
ensuring proper application or rules applicable to credit activities, together
with its capital partners where applicable.
Liquidity risk
Distribution of borrowings by maturity and detailed information on liquidity
risk appear in Note 36 to the Consolidated Financial Statements.
Cash and cash equivalent available at the end of 2013 (4.76 billion
euros) covers bond maturities for the upcoming year.
As of the same date, the Group also had a commercial paper programme
with the capacity to issue 5 billion euros, and 4.15 billion euros in available
and undrawn syndicated loans (maturity 2016, 2017 and 2018), leading
to the conclusion that its liquidity is strong.
In 2013 the Group ca rried out one bond issue (1 billion euros with maturity
May 2019) and bought back 1.3 billion euros (excluding accru ed interest).
The Group’s debt profi le is balanced, with no peak in refi nancing needs
across the remaining life of bond debt, which averages 4 years 3 months.
Since 2007, issues under the Euro Medium Term Notes (EMTN)
programme have been subject to a soft change of control clause. This
clause would apply in the event that a change of control led to Carrefour
losing its long-term investment grade rating. In such case, the debt would
not become immediately repayable but the interest rate would increase.
Loan agreements for syndicated lines of credit held by the Group include
the usual commitments and default clauses, including pari passu, negative
pledge, change of control, a clause restricting sales of substantial assets
and cross-default clauses. There is no default clause in the event of a
change in the long-term rating. On the other hand, the drawdown margin
may change in the event of a long-term rating upgrade or downgrade
(pricing grid). The contracts do not include an acceleration clause in the
event of a material adverse change, nor is there any acceleration clause
based on fi nancial covenants.
Carrefour Banque’s liquidity risk is monitored under a ‘liquidity policy’
approved by general management with the following objectives:
W refi nancing security;
W gradual compliance with the new Basel III liquidity ratios;
W diversifi cation of refi nancing sources.
During 2013, Carrefour Banque completed two major public transactions
to fi nance and expand its activities:
W a bond issue in April 2013 (300 million euros for three years);
W a securitisation transaction in November 2013, raising 400 million
euros.
This total refi nancing of 700 millions euros is fully in line with the goal of
complying with the Basel III liquidity ratios through a signifi cant lengthening
of the original term and a perfect match of asset and liability cash fl ows.
Interest-rate risk
Interest rate risk management is centrally handled by the DTFG, which
reports on its operations each month, reviewed by a rate committee
which establishes a hedging strategy and methods of application in an
effort to limit interest rate risk exposure and optimise fi nancing costs.
Long-term debt is primarily incurred at fi xed rates, protecting the Group
against rate increases.
However, Carrefour holds various fi nancial instruments which are intended
to hedge the Group’s fi nancial debt against the risk of interest rate
changes. They are primarily swaps (vanilla) and interest rate options
(vanilla caps and fl oors).
When issued at a variable rate, long-term debt is hedged through fi nancial
instruments which cap interest rate increases for some or all of the period.
A sensitivity analysis of rate changes is presented in Note 36 to the
Consolidated Financial Statements.
Foreign-exchange risk
The Group’s operations throughout the world are conducted by
subsidiaries operating primarily in their own countries (with purchases
and sales in local currencies). As a result, the Group’s exposure to
exchange-rate risk in commercial operations is naturally limited and
primarily concerns imports. Risk related to fi xed import transactions
(purchase of goods in foreign currency) is hedged via forward currency
purchases.
Translation risk which burdens transactions conducted in countries
outside the euro zone concerns Brazilian real and Argentine Peso. For
example, the impact of average exchange rate fl uctuations used in 2013
as compared with 2012 affected Group sales by -2,326 million euros
(3.1% of 2013 sales) and operating income by - 73 million euros (3.1%
of 2013 operating income).
Finally, when local fi nancing is used, transactions are generally conducted
in the local currency.
Equity risk
Detailed information on equity risk appears in Note 36 of the notes to
the Consolidated Financial Statements.

2013 REGISTRATION DOCUMENT 103
CORPORATE GOVERNANCE
3
Risk management
3.5.2 RISK PREVENTION
Within the context of the stock option and free share allocation plans,
the Group purchases its own shares and stock options. A breakdown
of these plans is provided in Note 28.1 to the Consolidated Financial
Statements.
Quality of fi nancial management, budgets and reporting
The organisation and procedures for fi nancial and accounting matters
are set forth in the Group’s Reference Guide to Corporate Rules, which
applies to all subsidiaries.
Procedures and tools used are intended to control fi nancial fl ows in all
countries where the Group operates, to verify that budgets and forecasts
best refl ect observed trends, to constitute a realistic estimate of future
performance, and to ensure that the Consolidated Financial Statements
provide a true and fair view of the Group’s fi nancial position and its results.
Financial services
Financial services distribute consumer credit, savings products, insurance
products and payment services, exposing them to classic fi nancial risks
(risks of providing fi nancing and insurance, risk related to fi nancial ratios,
liquidity risk) along with regulatory obligations to which fi nancial and
banking institutions are subject, specifi cally systems to fi ght money
laundering and terrorism fi nancing.
Since 2009, Carrefour Banque has initiated a project to map processes
and operational risks and, since April 2012, has defi ned the principles
and outline for grouping and pooling operational risk management tools
for France and for entities in other countries.
In accordance with Article 17 of CRBF 97-02, Carrefour Banque has
defi ned materiality thresholds for incidents uncovered through internal
control procedures.
Credit risk
To address the risk of borrower insolvency, the Group’s fi nancial
companies have systems to check debtor quality and solvency (scoring
tools, budget and past references which attest to the counterparty’s
quality, searches on positive and negative credit fi les, active management
of debt collection and legal actions, etc.).
Consumer receivables are classifi ed as bad debts as soon as they show
a risk of total or partial non-recovery (late payment, etc.). Impairment
models are established based on current regulations applicable to
credit companies in each country (classifi cation of out standings into
homogeneous risk categories, in terms of the likelihood of recovery and
modelling loss probabilities on a historical basis).
Detailed information on the Group’s exposure to credit risk appears in
Note 36 to the Consolidated Financial Statements.
Effective risk management relies on a shared vision of challenges and
optimal coordination.
The Group incorporates risk management into its day-to-day business
practices. Risk management is a job shared by all employees with the
aim of developing a risk management culture.
Risk management within the Group is decentralised to the country
executive directors, who are tasked with identifying, analysing and handling
the main risks with which they are faced.
They are supported in this by the Group Risk & Compliance department,
which coordinates the deployment of a guidance and mapping tool
for major risks, while mapping operational risks and developing tools
deployed in the countries.
The Risk & Compliance department also worked on country-by-country
mapping of health risks, natural risks, risk of crime and terrorism and legal
risk, while conducting studies on emerging risks and supporting certain
operational departments. It also supports the Purchasing departments
in their knowledge and evaluation of supplier risk.
In operational terms, the Group Risk and Compliance department
coordinates and leads a network of risk prevention directors present
in all Group countries. During 2011, Carrefour communicated a Risk
Prevention Charter which defi nes the scope of action, the role and
responsibilities of the country-level Risk Prevention units, and the ethical
rules they must follow.
In each country where the Group operates, a Risk Prevention department
is responsible for the security of the Company’s tangible and intangible
assets and ensures the safety of persons present on its sites. It is tasked
with implementing the human, organisational and technical resources
necessary to manage both accidental and intentional risks (natural
disasters, malicious acts, theft etc.).

2013 REGISTRATION DOCUMENT 104
3 CORPORATE GOVERNANCERisk management
The prevention policy relies on risk mapping, loss analysis and identifi cation
of emerging risks as part of its on-going oversight and specifi c studies.
The Risk and Compliance department prepares a consolidated annual
report on the risk prevention function at Group level, with benchmarks
between management and performance indicators for the function in
each country, in terms of loss, workforce, resources and action plans.
3.5.3 INSURANCE
For the past several years, the Group’s insurance strategy has focused
on providing the best possible protection for people and property.
Group insurance policy
The Group’s insurance strategy is primarily based on identifying insurable
risks through a regular review of existing and emerging risks, in close
collaboration with operational managers, the various Carrefour Group
departments involved and outside specialists.
Worldwide programmes
The Group has implemented comprehensive, worldwide programmes
(especially for Property Damage and Business Interruption, Civil Liability
and Construction policies) that provide uniformity of coverage for all
formats (consolidated stores only), wherever the stores are located
(except in countries where regulations prohibit this type of arrangement).
Thus, the Group has a solid understanding of the limits of coverage in
place, and the certainty that its insurance programmes have been taken
out with insurers having an international reputation.
Acquisitions during the year
The Carrefour Group (delete) ensures that acquisitions over the course
of the insurance year quickly obtain this comprehensive coverage, or,
where applicable, benefi t from its DIC/DIL (difference in conditions/
difference in limits) coverage policies, in order to ensure solid control
over existing coverage and benefi ts.
Prevention policy
The Carrefour Group’s (delete) insurance policy requires that risk
prevention measures be monitored by the Risk and Compliance
department in coordination with local Group liaisons in each country,
as well as with the Group’s insurers.
Transfer of risk to the insurance market
The Group transfers identifi ed insurable risks to the insurance market
or self-insures, in accordance with the Group insurance policy and
consistent with the Group’s general policies.
Self-insurance of certain risks
In order to optimise insurance costs and better manage risk, the Group has
a policy for maintaining its frequency lines through its captive insurance
and re-insurance companies for certain risk categories. The results
of these captive companies are consolidated in the Group fi nancial
statements.
Information concerning the main insurance programmes
The following information is provided for information purposes only in
order to illustrate the scope of action in 2013 . This information should
not be regarded as static, since the insurance market is constantly
changing. Indeed, the Group’s insurance strategy depends on and adapts
to insurance market conditions.
Property Damage and Business Interruption
This insurance protects the Group’s assets through an “all risks, with
exceptions” policy, on the basis of guarantees and underwriting capacity
available on the insurance market to cover the traditional risks for this
type of coverage, which include fi re, lightning, theft, natural disaster
and operating loss.
The programme established by the Group for the period from July 1, 2012
to June 30, 2013 offers a coverage limit of 260 million euros per claim in
direct damages and operating losses combined. This programme includes
sub-limits, particularly with regard to natural disasters. Deductibles are
established as appropriate for the various store formats.
Exclusions in force for this policy comply with market practices.
For subsidiaries in Europe in what is known as ‘free service provision’ zone,
this coverage is acquired through the direct captive insurance company.
For subsidiaries located outside the European ‘free service provision’
zone, the Property Damage and Business Interruption programme is
reinsured through the captive insurance company.
A stop-loss provision per claim and per insurance year has been
established in order to protect the captive companies’ interests and
limit their commitments.
Finally, beyond a certain predefi ned limit, risk is transferred to the insurance
market.
2013 REGISTRATION DOCUMENT 105
CORPORATE GOVERNANCE
3
Risk management
Civil liability coverage
This programme is intended to cover the Group’s activities against the
fi nancial consequences of its civil liability in cases where the Company
may be held liable for resulting damage and/or bodily harm caused to
third parties.
The limits of its civil liability policy are consistent with those of an
international retail company. Deductibles vary from country to country.
Exclusions in force for this policy comply with market practices.
A specifi c subscription strategy applies to civil liability risk, through
the re-insurance scheme offered by its captive insurer. The captive
reinsurance company’s exposure is limited per claim and per insurance
year. Anything beyond a certain exposure level is transferred to the
traditional insurance market.
The Carrefour Group (delete) is covered against the risk of harming
the environment as part of its comprehensive, worldwide civil liability
insurance programme.
Such risk requires a specially designed approach because of conditions
imposed by re-insurers, which offer more limited coverage for gradual
pollution risk.
Mandatory Insurance
The Carrefour Group (delete) takes out different insurance programmes
in accordance with local law, including:
W automobile insurance;
W construction insurance (building defects, comprehensive worksite,
ten year builder liability, etc.);
W professional liability insurance related to its activities:
W b anking,
W i nsurance,
W t ravel.
3.5.4 CRISIS MANAGEMENT
To address extraordinary situations that may impact business continuity
and the fulfi lment of its objectives, the Group has established a global
crisis management organisation.
At Group level, the Risk and Compliance department coordinates the crisis
management system in close cooperation with the Group Communication
department.
Depending on the nature and scope of the event, the crisis may be
handled locally, reporting to a country-level Executive Board, or at country
level in accordance with crisis management principles, as defi ned in the
Group’s Reference Guide to Corporate Rules.
Each Country Executive director establishes a formal crisis management
organisation to address the main scenarios likely to impact business
continuity, by bringing together all internal functions concerned and
relying on a network of outside experts depending on the type of crisis.
This organisation specifi cally includes a backup plan at the level of each
establishment, an appropriate system for product recall and withdrawal,
in accordance with the Group Quality department’s recommendations
and standards, as well as an alert system to permit rapid reporting of
information from all sites.
All members of the country Executive Committee and the other
internal players concerned are trained in crisis management and crisis
communications. Regular organisation of crisis simulations tests the
collective abilities of each Country Executive Committee.
The Group has also developed a number of tools at Group level and
made them available to all crisis coordinators in each country through
a “Carrefouralert” website, dedicated to managing diffi cult situations.
This website includes contact information for all crisis management and
communication coordinators, practical information and reaction sheets,
prevention tools and a wide range of useful information.

2013 REGISTRATION DOCUMENT 106
3 CORPORATE GOVERNANCEInternal control
3.6.1 RISK MANAGEMENT AND INTERNAL CONTROL SYSTEM
3.6 Internal control
Introduction
The Group Internal Audit department has been asked to compile the
required components of this section, which incorporates contributions
of several Group departments.
Responsibility for the quality of internal-control and risk-management
systems lies with general management, which has submitted this section
of the report to the Statutory Auditors, the Accounts Committee and
the Board of Directors, which approved it on March 4, 2014 on the
recommendation of its committee.
Applicable reference framework
The Carrefour Group’s internal-control and risk-management system is
based on the reference framework of the Autorité des Marchés Financiers
(AMF), updated on July 22, 2010. This section has been drawn up in
accordance with Article L. 225-37 par. 5 of the French Commercial Code.
Definition of the internal-control system
The internal-control system, which comprises a set of resources,
patterns of conduct, procedures and actions adapted to the individual
characteristics of each Group company:
W contributes to the control of its activities, the effi ciency of its operations
and the effi cient utilization of its resources; and
W enables it to take into consideration, in an appropriate manner, all
major risks of an operational, fi nancial or compliance-related nature.
More specifi cally, the internal-control system is designed to ensure:
W that the Group’s economic and fi nancial objectives are achieved in
accordance with laws and regulations;
W that instructions and directional guidelines fi xed by general management
in respect of internal control and risk management are applied;
W that the internal processes are functioning correctly, particularly those
contributing to the security of assets;
W that fi nancial information is reliable.
By helping to prevent and control the risk of the Group not achieving its
objectives, the internal-control system plays a key role in the management
and oversight of its activities. However, as the AMF reference framework
underscores, no matter how well designed and properly applied, an
internal-control system cannot fully guarantee that the Group’s objectives
will be achieved.
There are inherent limitations in all internal-control systems, which arise,
in particular, from uncertainties in the outside world, the exercise of
judgment or problems that may occur due to human failure or simple error.
Scope
The internal-control and risk-management system presented in this
section is implemented in the Company and at all its fully consolidated
subsidiaries, and is not limited to a set of procedures or merely to
accounting and fi nancial processes.
3.6.1.1 Components of internal control
A. Organisation
Customers and consumers lie at the heart of everything the
Carrefour Group undertakes. The Company is organized
geographically to ensure that the specifi c needs and interests
of local customers and consumers are addressed most effectively
and its operations are optimally responsive. Each country serves
as a basic link in the Group’s organization. The internal-control
and risk-management system is based on this organizational
principle:
W General Management sets the reference framework for the Group’s
internal-control and risk-management system. Its role is to coordinate,
drive and supervise internal-control and risk-management systems;
W at country level, country executive directors coordinate and steer their
own internal-control and risk-management systems.
The Group has set up a formal control environment with a Code
of Professional Conduct and determination of the powers,
responsibilities and objectives assigned at each level of the
organization, according to the principle of the separation of
tasks:
W the Code of Professional Conduct is provided to every Group employee.
The Code establishes the ethical framework within which all Carrefour
employees must conduct their activities on a day-to-day basis;
W the corporate offi cers of each legal entity have limited powers in
some areas that require prior approval by the Board of Directors or
the equivalent body in each entity concerned;

2013 REGISTRATION DOCUMENT 107
CORPORATE GOVERNANCE
3
Internal control
W the powers and responsibilities of key employees are defi ned in
delegations of powers and responsibilities established in accordance
with hierarchical and functional organizational charts. This structure
complies with the principle of the separation of tasks;
W lastly, this structure is conveyed by a management framework that
is underpinned by medium-term objectives organized according to
country and by the steering of activities orientated in line with annual
budget targets and corresponding to individual plans.
Via its policies, the Human Resources department:
W ensures the proper availability level of resources, suitable for current
and future business requirements;
W monitors employees’ career development and commitment;
W ensures high-quality industrial relations;
W defi nes the framework for the remuneration policy and corporate
benefi ts and guides the associated commitments;
W helps to create a culture of collective development and performance.
The information systems aim to respond to needs and satisfy
requirements regarding information security, reliability,
availability and traceability:
W at Group level, the accounting and fi nancial information system is
based on reporting and consolidation tools for preparation of the
Consolidated Financial Statements and measurement of the Group’s
operating performance;
W the country executive directors are responsible for their own information
systems, and have implemented measures to ensure system security
and digital data integrity.
Each process is subject to formal procedures and operational
methods for each country, which stipulate ways of carrying out
an action or process in accordance with the Group’s regulatory
framework:
W the Group has established a Group regulatory framework to cover the
main risks to its assets. Implementation of this framework is mandatory
for all countries;
W the country executive directors have established procedures and
operating methods, including control activities required to cover all
the strategic, operational and asset risks relating to their businesses.
These procedures and operating methods include and extend the key
controls set out in the Group regulatory framework.
B. Dissemination of internal information
The Group ensures that relevant information is properly circulated and
conveyed to the individuals concerned so that they can perform their
duties in accordance with Group standards and procedures.
W the GroupOnline intranet regularly disseminates information on the
life of the Group and provides employees with a number of practical
tools, including information on the primary standards and procedures
with which they must comply;
W the Group regulatory framework has been communicated to all
executive directors responsible for disseminating it;
W procedures setting out best practices and the information reporting
process are also communicated to the various countries by the Group’s
main departments;
W the Group’s accounting policy is sent to every fi nancial director at
the end of each quarter.
Similarly, the countries ensure that relevant information is properly
circulated and conveyed to the individuals concerned so that they can
perform their duties in accordance with Group standards and procedures.
C. The risk-management system
The risk-management system implemented by the Group relies primarily
on identifying, analyzing and addressing risk factors likely to affect people,
assets, the environment, the Company’s objectives and its reputation.
The Group incorporates risk management into its day-to-day business
practices. Risk management is a job shared by all employees with the
aim of developing a risk management culture.
In particular, the system aims to:
W create and preserve the Company’s value, assets and reputation;
W increase the security of the Company’s decision-making and
procedures to promote achievement of objectives;
W promote actions consistent with the Company’s values;
W mobilize Company employees to adopt a shared vision of the principal
risks.
Risk management within the Group is decentralized to the country
executive directors, who are tasked with identifying, analyzing and handling
the main risks with which they are faced.
They are supported in this by the Group Risk & Compliance department,
which coordinates the deployment of a management and mapping tool
for major risks whilst developing mapping of operational risks.
The Risk & Compliance department has also worked on country-by-country
mapping of health risks, natural risks, risk of crime and terrorism and legal
risk, while conducting studies on emerging risks and supporting certain
operational departments. It also supports the Purchasing departments
in their knowledge and evaluation of supplier risk.
Twenty-three risk factors have been identifi ed by the Group and are
presented in the management report. These factors cover fi ve themes:
the business environment, strategy and governance, operations, fi nancial
risks and fi nancial services.
In operational terms, the Group Risk and Compliance department
coordinates and leads a network of Risk Prevention directors present
in all Group countries. During 2011, Carrefour communicated a Risk
Prevention Charter which defi nes the scope of action, the role and
responsibilities of the country-level Risk Prevention units, and the ethical
rules they must follow.
2013 REGISTRATION DOCUMENT 108
3 CORPORATE GOVERNANCEInternal control
In each country where the Group operates, a Risk Prevention department
is responsible for the security of the Company’s tangible and intangible
assets and ensures the safety of persons present on its sites. It is tasked
with implementing the human, organizational and technical resources
necessary to manage both accidental and intentional risks (natural
disasters, malicious acts, theft etc.).
The prevention policy relies on risk mapping, loss analysis and identifi cation
of emerging risks as part of its ongoing oversight and specifi c studies.
The Risk and Compliance department prepares a consolidated annual
report on the risk prevention function at Group level, with benchmarks
between management and performance indicators for the function in
each country, in terms of loss, workforce, resources and action plans.
A summary of the results is presented annually to general management
so that it can supervise the risk-management system, and specifi cally:
W update the Group risks register;
W update risk maps and the risk assessment and analysis system;
W progress action plans to reduce exposure to risk factors.
For the past several years, the Group’s insurance strategy has focused
on providing the best possible protection for people and property.
The Group’s insurance strategy is primarily based on identifying insurable
risks through a regular review of existing and emerging risks, in close
collaboration with operational managers, the various Carrefour Group
departments involved and outside specialists.
The Group’s Insurance department is responsible for covering insurable
risks for the entities when national legislation permits it. It is in charge
of the subscription and centralized management of insurance policies.
D. Control activities responding to these risks
Control activities are designed to ensure that the necessary measures
are taken in order to reduce exposure to three types of risk – strategic,
operational and asset – likely to affect the achievement of the Group’s
objectives. Control activities take place throughout the organization,
at every level and in every function, including prevention and detection
controls, manual and IT controls and hierarchical controls.
The Group’s regulatory framework includes control activities aimed at
covering asset risks, which include four risk families:
W accounting and fi nancial risks,
W risks associated with the safety and security of property and people,
W risks to the continuity, integrity, confi dentiality and security of information
systems,
W contractual obligation, compliance and communication risks.
Control activities are defi ned and implemented by process managers,
coordinated by internal controllers who report to members of the
Country Executive Committee and to the country executive director.
Coordination of the internal controllers ensures that control activities are
methodologically consistent and that risks are comprehensively covered
throughout all processes.
Details of internal-control procedures relating to the preparation and
processing of accounting and fi nancial information for the corporate
and Consolidated Financial Statements are provided in Section 3.6.2.
E. Guidance and monitoring of the internal-control system
Continuous monitoring
Continuous monitoring is organized so that incidents can be pre-empted
or detected as rapidly as possible. The framework plays a long-term
daily role in the effective implementation of the internal-control system.
Specifi cally, it establishes corrective action plans and reports to general
management on signifi cant malfunctions when necessary.
Periodic monitoring
Periodic monitoring takes place through managers and operatives, internal
country controllers and the Group Internal Audit department:
W managers and operatives check that the internal-control and risk-
management system is functioning correctly, identify the main risk
incidents, draw up action plans and ensure that the control and risk-
management system is appropriate for the Company’s objectives;
W the internal country controllers periodically check that control activities
are being properly implemented and that they are effective against risks;
W the Group Internal Audit department provides the country executive
directors and Group general management with the results of their
assignments and their recommendations.
In addition, the operational effectiveness of internal control relevant to
the preparation of the fi nancial information is subject to audit work by
the auditors, which report their conclusions and recommendations to the
country executive directors and Group general management.
Each country executive director has established a formal annual self-
assessment process:
W which uses standard tools that focus on existing frameworks and
are based on an internal-control risk analysis for each activity and on
identifi cation of key control points;
W the results of the internal-control self-assessment covering asset risks
are centralized periodically at Group Internal Audit level;
W one of the Group Internal Audit department’s objectives in implementing
actions is the quantitative measurement, through scoring systems,
of the divergence between the self-assessment and the level of
internal control determined on the basis of its work. Monitoring these
divergences allows the quality of the country’s internal-control self-
assessment to be gauged.
2013 REGISTRATION DOCUMENT 109
CORPORATE GOVERNANCE
3
Internal control
Guidance and supervision of internal control entails internal country
controllers’ monitoring of action plans relating to the internal-control self-
assessment and risk mapping processes and of the recommendations of
the Group Internal Audit department. The results of the internal-control
self-assessment covering asset risks are centralized periodically at Group
Internal Audit level.
The fi nal result of the supervision and guidance system is a letter of
affi rmation on risk management and internal control signed by the country
executive director and the fi nancial director, confi rming their appropriation
of and responsibility for internal control in terms of reporting and correcting
defi ciencies.
Group general management supervises the internal-control and risk-
management system in particular through the minutes of meetings of
the following bodies and departments:
W the Ethics Committee;
W the Group Investment Committee;
W the IT Request Management Committee;
W fi nancial committees that guide the Group’s fi nancial policy;
W the Information Systems Governance department;
W the Group Internal Audit department; and
W any other ad hoc committee meeting convened according to the needs
identifi ed by general management.
Lastly, the performance of the internal-control supervision and guidance
system for accounting and fi nancial risks is presented regularly to the
Accounts Committee.
3.6.1.2 Entities and individuals involved in internal control
A. At Group level
Group general management is responsible for the quality of the internal-
control and risk-management system. It is also tasked with designing,
implementing and supervising the internal-control and risk-management
system. It initiates any corrective actions necessary to rectify an identifi ed
malfunction and to maintain a situation within the limits of acceptable risk.
It ensures that these actions are successfully implemented.
General management performs its duties in relation to the internal-control
and risk-management system through the following structure:
W the Group Finance department is responsible for:
W maintaining the reliability of fi nancial and accounting information,
W controlling accounting and fi nancial risks,
W measuring Group performance and budget control;
W the Group Legal department is responsible for:
W establishing the governance policy of Group subsidiaries,
W managing the Group’s legal risks;
W the Group Risk & Compliance department is responsible for:
W establishing risk prevention policy within the Group,
W managing risks associated with the safety and security of property
and people,
W coordinating the Group crisis-management system;
W the Group Property department is responsible for:
W establishing the Group’s property policy,
W managing risks relating to building security;
W the Group Quality department is responsible for:
W establishing product quality and safety policy within the Group,
W managing product safety risks,
W coordinating crisis management relating to product safety risks;
W the Group Human Resources department is responsible for:
W establishing human resources management policy within the
Group,
W coordinating social risk management;
W the Group Information Systems Governance department is
responsible for:
W establishing the information systems management policy within
the Group,
W managing risks relating to the continuity, integrity, confi dentiality
and security of information systems;
W the Group Insurance department is responsible for setting up
insurance to cover the Group’s insurable assets as effectively as
possible and according to available capacity on the market, pursuant
to Group insurance policies. It works with the Risks & Compliance
department to identify risks and implement prevention procedures.
The Board of Directors reports on the principal risks and uncertainties
faced by the Group in the management report.
It takes note of the essential characteristics of the internal-control and
risk-management systems communicated in a timely manner by the
Accounts Committee and general management. In particular, it acquires
an overall understanding of procedures relating to the production and
treatment of fi nancial and accounting information.
The role of the Accounts Committee set up by the Board of Directors is:
W to assess the effectiveness and quality of the Group’s internal control
systems and procedures, to interview the internal audit manager,
to give an opinion on the organization of the department and to be
informed of its program of work;
W to examine, in conjunction with internal control managers, the objectives
and intervention and action plans in the area of internal audit, the
conclusions of such interventions and the actions, recommendations
and follow-up arising from them;
W to examine the methods and results of the internal audit and check that
the procedures used help the fi nancial statements to refl ect a true and
accurate picture of the business in accordance with accounting rules;
W to assess the reliability of the systems and procedures used to produce
the fi nancial statements and the validity of the positions taken in respect
of presenting signifi cant transactions;
W to examine the methods used to report and present accounting and
fi nancial information from the subsidiaries and/or operational units;
W to examine the draft report on internal control procedures.

2013 REGISTRATION DOCUMENT 110
3 CORPORATE GOVERNANCEInternal control
3.6.2 DATA RELATING TO INTERNAL ACCOUNTING AND FINANCIAL CONTROL
The Group Internal Audit department is tasked with:
W regularly assessing the operation of the internal-control and risk-
management systems related to asset risks, by performing the missions
included in the annual audit plan,
W making any necessary recommendations to improve these systems,
W helping to develop internal-control tools and frameworks relating to
asset risk.
B. At country level
The country executive director, whether acting directly or by delegation,
is responsible for the establishment, operation and supervision of the
internal-control and risk-management system at country level. The country
executive director is supported by internal controllers, who are tasked with:
W helping to defi ne the country internal-control system, particularly by
ensuring that the Group internal-control framework is properly rolled
out;
W ensuring that procedures defi ned by the country and the Group are
properly applied.
During 2013, the Group continued to enhance its accounting and fi nancial
internal-control system by boosting the role of the functional departments
and implementing the Corporate Rules.
3.6.2.1 General organizational principles of internal accounting and financial control
Internal accounting and fi nancial control aims to ensure:
W the compliance of published accounting information with applicable
rules (international accounting standards);
W the application of instructions and strategic directions established
by the Group;
W the prevention and detection of fraud and accounting and fi nancial
irregularities;
W the presentation and reliability of published fi nancial information.
Risks related to production of accounting and fi nancial information can
be classifi ed into two categories:
W those related to the accounting of current operations in the country,
whose control systems must be set as close as possible to decentralized
operations;
W those related to the accounting of non-current operations that may
have a signifi cant impact on the Group’s fi nancial statements.
The internal-control system described in the following paragraphs
incorporates this approach to risk.
Management within each country is responsible for identifying risks that
impact the preparation of fi nancial and accounting information and for
taking the necessary steps to adapt the internal-control system.
With regard to information that requires special attention given its impact
on the Consolidated Financial Statements, the Group Consolidation
department requests the necessary explanations and may perform such
controls itself, assign an outside auditor to carry out such controls or
request the involvement of the Internal Audit department through the
Chairman and Chief Executive Offi cer.
The Group Consolidation department checks the country-level
consolidated reporting packages at each quarterly closing. If need be,
corrections are made to the reporting packages. In addition, inspections
are conducted in each country at least twice per year.
Impairment testing of goodwill is handled by the Consolidation department
based on projections prepared by the countries. The Consolidation
department also obtains and reviews impairment tests performed by
the countries on tangible fi xed assets.
3.6.2.2 Management of the accounting and finance organisation
Organisation of the fi nancial function
The fi nancial function is mainly based on a two-level organization:
W the Group Financial Control department defi nes the IFRS accounting
principles applicable to Carrefour and provides leadership and
oversight of the production of Consolidated Financial Statements
and management reports. This department includes a Consolidation
department and a Performance Analysis department:
W the Consolidation department monitors standards, defi nes
the Group accounting doctrine (IFRS accounting principles
applicable to Carrefour), produces and explains the Consolidated
Financial Statements and prepares the consolidated accounting
and fi nancial information, and is the direct link to the fi nance
departments at country level,
W the Performance Analysis department aggregates and analyses
both prospective and retrospective management reports. It
requests explanations from the country-level fi nance departments
and/or the regional fi nance departments, and alerts General
Management to key issues and any potential impact;

2013 REGISTRATION DOCUMENT 111
CORPORATE GOVERNANCE
3
Internal control
W the country-level fi nance departments are responsible, under the
functional supervision of the fi nance directors for each region, for
production and control of the country-level company and Consolidated
Financial Statements. They are also responsible for deploying an
internal-control system within their scope that is adapted to their specifi c
challenges and risks, taking into account the Group’s recommendations
and directives. Management control and merchandise management
control at country level also fall under their responsibility.
The country/business administrator accounting function is handled by
centralized teams in each country, under the supervision of the country-
level fi nance director. These teams belong to the Finance line and are
led by the Group Finance department.
The Group executive director for fi nance appoints the country-level
fi nance directors.
Regional fi nance directors are mainly charged with improving dissemination
of the culture and principles of fi nancial control and ensuring their proper
application.
Accounting principles
Group accounting principles are specifi ed in a regularly updated
document that is communicated to all those involved in the process.
The IFRS accounting principles applicable to Carrefour are reviewed
twice per year, before the close of the half-yearly fi nancial statements and
before the balance sheet date. They are defi ned by the Standards director
belong to the Consolidation department and presented to the Statutory
Auditors for comment. Signifi cant changes, additions or withdrawals are
presented to the Accounts and Internal Audit Committee.
The most recent version is communicated to the country-level fi nance
directors before each consolidation.
The IFRS accounting principles applicable to Carrefour are incumbent
upon the country-level Finance departments, which have no leeway
in the interpretation or application of such principles. Should queries
arise, country-level fi nance departments are instructed to consult the
Consolidation department, which alone can provide interpretations and
clarifi cations.
A meeting of country-level fi nance directors is held once per year, during
which new changes to the IFRS accounting principles applicable to
Carrefour and any problems with application that have been encountered
since the last meeting are discussed.
The Standards department belong to the Consolidation department to
handle technical monitoring of IFRS standards, organize and manage the
process of updating Group accounting principles in connection with the
countries, analyze technical issues raised within the Group and ensure
that Carrefour is represented within professional organizations that deal
with accounting standards.
Tools and operating methods
In recent years, the Group has standardized the accounting systems used
in the various countries. Specifi cally, this has led to the implementation
of an organizational model that includes the establishment of shared
service centers (for the processing and payment of invoices involving
merchandise, fi xed assets, general expenses and payroll), thus
standardizing and documenting procedures in the various countries
and ensuring the appropriate separation of tasks. Operating methods
are made available to all users.
Each country implements tools to address its specifi c consolidation
needs. A tool was developed at Group level to facilitate transmission of
data, controls and consolidation operations.
Accounting and fi nancial information systems are subject to the same
requirements as all security systems.
Consolidation process and principal controls
Each country is responsible for consolidating fi nancial statements at
its own level. Consolidation at this level is provided by fi nancial teams
in each country.
The Group Consolidation department team leads this process and is
responsible for producing the Group’s Consolidated Financial Statements.
Responsibilities have been defi ned by country, as have cross-functional
analysis responsibilities within the Group team. Since 2008, consolidation
has occurred in each quarter. Only the half-yearly and annual Consolidated
Financial Statements are subject to an external audit and published. The
Group uses identical data and regional breakdowns for its management
reports and Consolidated Financial Statements.
Subsidiaries prepare their own statutory accounts and Consolidated
Financial Statements for their region, and then convert these reports
into euros. The fi nance directors in each country can refer to a list of
standard controls prepared by the Group’s Consolidation department staff
that are to be performed on these Consolidated Financial Statements.
Since 2010, through Group regulations, countries have had access to a
benchmark for expected controls during the production of accounting and
fi nancial information and the consolidation process. The Consolidation
department checks for consistency and performs a reconciliation at the
close of each quarter. The reporting system ensures consistent information
as a result of these controls.
The main options and accounting estimates are subject to review by the
Group and the country-level fi nance directors, including during meetings
for account closing options, organized before account closings at Group
and country level in cooperation with external auditors.
Between account closings, country visits by the Consolidation department
provide opportunities to improve the process at country level by promoting
understanding and dissemination of the Group’s accounting principles
and addressing specifi c issues within the various countries. If necessary,
inspections can lead to recommendations aimed at improving the country’s
consolidation procedures.
In 2012, the Consolidation department set up the fi rst “hard-close”
process at the end of September so as to anticipate, as far in advance
as possible, potentially sensitive subjects relating to account closing.
The process also identifi es any weaknesses in internal control and the
processes associated with assessing costs and income that, due to their
nature and amount, have a signifi cant impact on Group performance,
so that these can be rectifi ed if necessary before the annual closing.
The specifi c work that the countries are required to carry out, and the
Statutory Auditors’ reviews, have led in particular to internal control of
the supplier cycle, review of the main disputes and risks, and impairment
testing of stores and goodwill.

2013 REGISTRATION DOCUMENT 112
3 CORPORATE GOVERNANCEInternal control
In order to provide an opinion to the Board of Directors on the draft
fi nancial statements, the Accounts and Internal Audit Committee reviews
the annual and half-yearly fi nancial statements and the fi ndings of the
Statutory Auditors’ team concerning their work.
With this in mind, the Accounts and Internal Audit Committees meet
regularly and as necessary so that the committee can monitor the process
of preparing the accounting and fi nancial information and ensure that
the principal accounting options applied are pertinent.
Oversight of the internal-control system
Oversight of the internal-control system is mainly based on:
W a self-assessment process for the application and oversight of the
main regulations defi ned by the Group concerning internal accounting
and fi nancial controls. Action plans, defi ned at country level where
necessary and subject to monitoring;
W in-country actions by the Group Internal Audit department. The internal
audit plan incorporates missions to review internal accounting and
fi nancial controls.
Oversight also incorporates the assessment of information provided by the
Statutory Auditors as part of their in-country operations. Since 2010, the
country-level fi nance directors systematically provide the Consolidation
department with summaries of actions and letters of recommendation from
the Statutory Auditors. It oversees implementation of its recommendations.
The entire process is regularly presented to the Accounts and Internal
Audit Committee. When signifi cant shortcomings are detected in a
country’s internal-control system, the committee will have the region
and country-level fi nance directors present developments in their action
plans on a quarterly basis.
At each statement, the Group Internal Audit department receives letters
of affi rmation, signed by the country executive director and country
fi nance director, certifying that the consolidation reporting packages
are fair and were prepared in accordance with the IFRS accounting
principles applied by Carrefour.
3.6.2.3 Control over financial communications
Role and mission of fi nancial communications
The objective of fi nancial communications is to provide information:
W on a continuous basis: quality information must be provided regularly
over time. This is essential to the Group’s credibility and to ensuring
shareholder loyalty;
W that conveys a clear, consistent message: communications must allow
investors to gain a precise, accurate understanding of the Company’s
value and management’s capacity to boost value even further. Investors
must be properly informed in order to make decisions;
W while maintaining the principle of shareholder equality with regard to
information: any fi nancial information that might have an impact on
market prices must be made public via a single, centralized source
at Group level.
Organization of fi nancial communications
Financial announcements address a diverse audience, primarily comprised
of institutional investors, individuals and employees, via four channels:
W the Shareholder Relations department is responsible for informing
the general public (individual shareholders);
W the Investor Relations department, Finance department and the
Chairman and Chief Executive Offi cer are the sole contacts for analysts
and institutional investors;
W the Human Resources department, with support from the
Communications department, manages information intended for
employees;
W the Communications department manages press relations.
In practice, fi nancial messages are prepared through close collaboration
between the Finance and Communications departments.
They are delivered as required by law (via an annual Shareholders’
Meeting) and according to the regulations of the French Financial Markets
Authority (periodic publications, press releases). Furthermore, beyond its
legal obligations, Carrefour employs a wide array of media for its fi nancial
communications. The Group may utilize the press, the Internet, direct
telephone contact, individual meetings and special forums.
Procedures for controlling fi nancial communications
The Finance department is the exclusive source of fi nancial information.
Internal controls regarding the fi nancial communications process focus
on compliance with the principle of shareholder equality, among other
issues. All press releases and signifi cant announcements are prepared by
mutual agreement between the Financial Communications department,
which is part of the Finance department, and the Group Communications
department.
The segregation of roles and responsibilities allows for strict independence
between managers, sensitive departments (e.g. Mergers and Acquisitions)
and the Financial Communications department.
Financial communications policy
The fi nance director defi nes and implements the policy on disclosing
fi nancial results to the markets. The Carrefour Group discloses its sales
(including tax) each quarter, and reports all of its results on a half-yearly
basis. Each disclosure is fi rst presented to the Board of Directors.
In contrast to previous years, at the beginning of the 2012 fi scal year
the Group did not issue guidance on its underlying earnings target.
However, throughout the fi scal year the Finance department checks
that the underlying earnings target provided by the analyst consensus
remains achievable and, where applicable, issues a revision when budget
forecasts reveal a signifi cant discrepancy.
2013 REGISTRATION DOCUMENT 113
CORPORATE GOVERNANCE
3
Statutory Auditors’ report prepared in accordance with Article L.
3.7 Statutory Auditors’ report prepared in accordance with Article L. 225-235 of the French Commercial Code on the report of the Chairman of the Board of Directors
Year-ended December 31, 2013
This is a free translation into English of a report issued in French prepared in accordance with Article L. 225-235 of French Company law on the
report prepared by the Chairman of the Board of Directors and is provided solely for the convenience of English-speaking users.
This report should be read in conjunction with, and is construed in accordance with, French law and professional auditing standards applicable in France.
To the shareholders,
In our capacity as Statutory Auditors of Carrefour SA, and in accordance with Article L. 225-235 of the French Commercial Code (Code de commerce),
we hereby report on the report prepared by the Chairman of your Company in accordance with Article L. 225-37 of the French Commercial Code
for the year ended December 31, 2013.
It is the Chairman’s responsibility to prepare, and submit to the Board of Directors for approval, a report on the internal control and risk management
procedures implemented by the Company and providing the other disclosures required by Article L. 225-37 of the French Commercial Code,
particularly in terms of the corporate governance measures.
It is our responsibility:
W to report to you our observations on the information contained in the Chairman’s report regarding the internal control and risk management
procedures relating to the preparation and processing of the accounting and fi nancial information, and
W to attest that this report contains the other disclosures required by Article L. 225-37 of the French Commercial Code, it being specifi ed that we
are not responsible for verifying the fairness of these disclosures.
We conducted our work in accordance with professional standards applicable in France.
Information on the internal control and risk management procedures relating to the preparation and processing of accounting and fi nancial information
The professional standards require that we perform the necessary procedures to assess the fairness of the information provided in the Chairman’s
report regarding the internal control and risk management procedures relating to the preparation and processing of the accounting and fi nancial
information. These procedures consist mainly in:
W obtaining an understanding of the internal control and risk management procedures relating to the preparation and processing of the accounting
and fi nancial information on which the information presented in the Chairman’s report is based and existing documentation;
W obtaining an understanding of the work involved in the preparation of this information and existing documentation;
W determining if any material weaknesses in the internal control procedures relating to the preparation and processing of the accounting and fi nancial
information that we may have identifi ed in the course of our engagement are properly disclosed in the Chairman’s report.
On the basis of our work, we have nothing to report on the information regarding the Company’s internal control and risk management procedures
relating to the preparation and processing of accounting and fi nancial information contained in the report prepared by the Chairman of the Board,
in accordance with Article L. 225-37 of the French Commercial Code.
Other disclosures
We hereby attest that the report of the Chairman of the Board of Directors includes the other disclosures required by Article L. 225-37 of the French
Commercial Code.
The Statutory Auditors
Courbevoie, Paris-La Défense and Neuilly-sur-Seine, March 18, 2014
French original signed by
MAZARSKPMG audit
Department of KPMG S.A. Deloitte & Associés
Patrick de Cambourg Pierre Sardet Éric Ropert Arnaud de Planta Francisco Sanchez

2013 REGISTRATION DOCUMENT 114
2013 REGISTRATION DOCUMENT 115
MANAGEMENT’S DISCUSSION AND ANALYSIS YEAR ENDED
DECEMBER 31, 2013
4
4.1 Sales and earnings performance 1164.1.1 Main earnings indicators 116
4.1.2 Analysis of the main income statement items 117
4.2. Financial position 1214.2.1 Shareholders’ equity 121
4.2.2 Net debt 121
4.2.3 Cash flows for the year and cash and cash
equivalents at December 31, 2013 122
4.2.4 Financing and liquid resources 123
4.2.5 Restrictions on the use of capital resources 123
4.2.6 Expected sources of funding 123
4.3 Outlook for 2014 124
4.4 Other information 1254.4.1 Accounting principles 125
4.4.2 Significant events of the period 125
4.4.3 Main related party transactions 127
4.4.4 Subsequent events 127
4.5 Parent Company fi nancial review 1284.5.1 Activities and results 128
4.5.2 Subsidiaries and affiliates 129
4.5.3 Income appropriation 129
4.5.4 Agreements referred to in Article L. 225-38 et
seq. of the French Commercial Code 130
4.5.5 Research and development 130
4.5.6 Company earnings performance
in the last five fiscal years 131
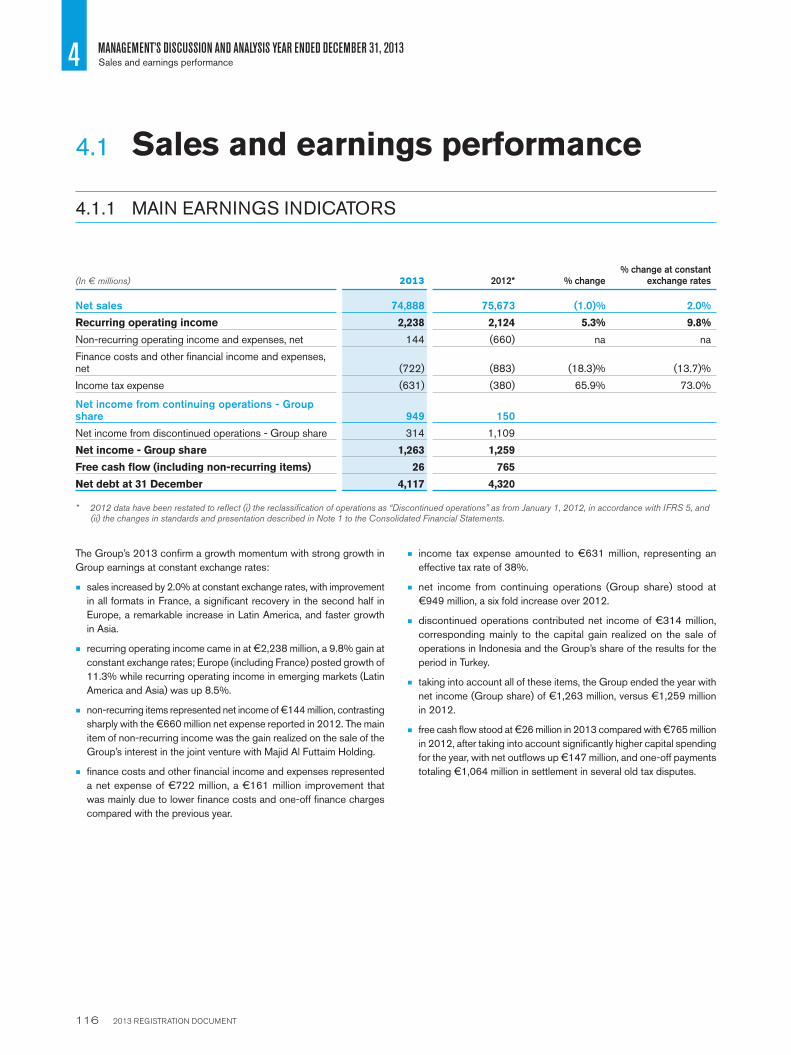
2013 REGISTRATION DOCUMENT 116
4 MANAGEMENT’S DISCUSSION AND ANALYSIS YEAR ENDED DECEMBER 31, 2013Sales and earnings performance
4.1 Sales and earnings performance
4.1.1 MAIN EARNINGS INDICATORS
(In € millions) 2013 2012* % change% change at constant
exchange rates
Net sales 74,888 75,673 (1.0)% 2.0%
Recurring operating income 2,238 2,124 5.3% 9.8%
Non-recurring operating income and expenses, net 144 (660) na na
Finance costs and other fi nancial income and expenses, net (722) (883) (18.3)% (13.7)%
Income tax expense (631) (380) 65.9% 73.0%
Net income from continuing operations - Group share 949 150
Net income from discontinued operations - Group share 314 1,109
Net income - Group share 1,263 1,259
Free cash fl ow (including non-recurring items) 26 765
Net debt at 31 December 4,117 4,320
* 2012 data have been restated to refl ect (i) the reclassifi cation of operations as “Discontinued operations” as from January 1, 2012, in accordance with IFRS 5, and (ii) the changes in standards and presentation described in Note 1 to the Consolidated Financial Statements.
The Group’s 2013 confi rm a growth momentum with strong growth in
Group earnings at constant exchange rates:
W sales increased by 2.0% at constant exchange rates, with improvement
in all formats in France, a signifi cant recovery in the second half in
Europe, a remarkable increase in Latin America, and faster growth
in Asia.
W recurring operating income came in at €2,238 million, a 9.8% gain at
constant exchange rates; Europe (including France) posted growth of
11.3% while recurring operating income in emerging markets (Latin
America and Asia) was up 8.5%.
W non-recurring items represented net income of €144 million, contrasting
sharply with the €660 million net expense reported in 2012. The main
item of non-recurring income was the gain realized on the sale of the
Group’s interest in the joint venture with Majid Al Futtaim Holding.
W fi nance costs and other fi nancial income and expenses represented
a net expense of €722 million, a €161 million improvement that
was mainly due to lower fi nance costs and one-off fi nance charges
compared with the previous year.
W income tax expense amounted to €631 million, representing an
effective tax rate of 38%.
W net income from continuing operations (Group share) stood at
€949 million, a six fold increase over 2012.
W discontinued operations contributed net income of €314 million,
corresponding mainly to the capital gain realized on the sale of
operations in Indonesia and the Group’s share of the results for the
period in Turkey.
W taking into account all of these items, the Group ended the year with
net income (Group share) of €1,263 million, versus €1,259 million
in 2012.
W free cash fl ow stood at €26 million in 2013 compared with €765 million
in 2012, after taking into account signifi cantly higher capital spending
for the year, with net outfl ows up €147 million, and one-off payments
totaling €1,064 million in settlement in several old tax disputes .
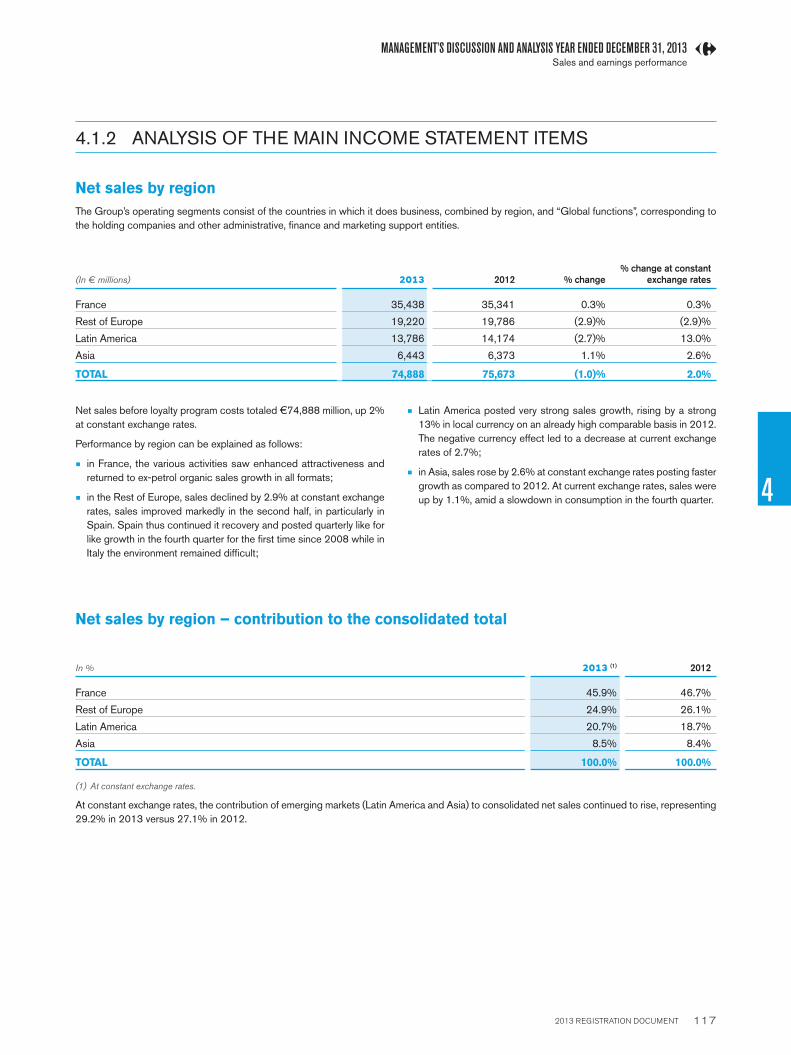
2013 REGISTRATION DOCUMENT 117
MANAGEMENT’S DISCUSSION AND ANALYSIS YEAR ENDED DECEMBER 31, 2013
4
Sales and earnings performance
4.1.2 ANALYSIS OF THE MAIN INCOME STATEMENT ITEMS
Net sales by region
The Group’s operating segments consist of the countries in which it does business, combined by region, and “Global functions”, corresponding to
the holding companies and other administrative, fi nance and marketing support entities.
(In € millions) 2013 2012 % change% change at constant
exchange rates
France 35,438 35,341 0.3% 0.3%
Rest of Europe 19,220 19,786 (2.9)% (2.9)%
Latin America 13,786 14,174 (2.7)% 13.0%
Asia 6,443 6,373 1.1% 2.6%
TOTAL 74,888 75,673 (1.0)% 2.0%
Net sales before loyalty program costs totaled €74,888 million, up 2%
at constant exchange rates.
Performance by region can be explained as follows:
W in France, the various activities saw enhanced attractiveness and
returned to ex-petrol organic sales growth in all formats;
W in the Rest of Europe, sales declined by 2.9% at constant exchange
rates, s ales improved markedly in the second half, in particularly in
Spain. Spain thus continued it recovery and posted quarterly like for
like growth in the fourth quarter for the fi rst time since 2008 while in
Italy the environment remained diffi cult;
W Latin America posted very strong sales growth, rising by a strong
13% in local currency on an already high comparable basis in 2012.
The negative currency effect led to a decrease at current exchange
rates of 2.7%;
W in Asia, sales rose by 2.6% at constant exchange rates posting faster
growth as compared to 2012. At current exchange rates, sales were
up by 1.1%, amid a slowdown in consumption in the fourth quarter.
Net sales by region – contribution to the consolidated total
In % 2013 (1) 2012
France 45.9% 46.7%
Rest of Europe 24.9% 26.1%
Latin America 20.7% 18.7%
Asia 8.5% 8.4%
TOTAL 100.0% 100.0%
(1) A t constant exchange rates.
At constant exchange rates, the contribution of emerging markets (Latin America and Asia) to consolidated net sales continued to rise, representing
29.2% in 2013 versus 27.1% in 2012.
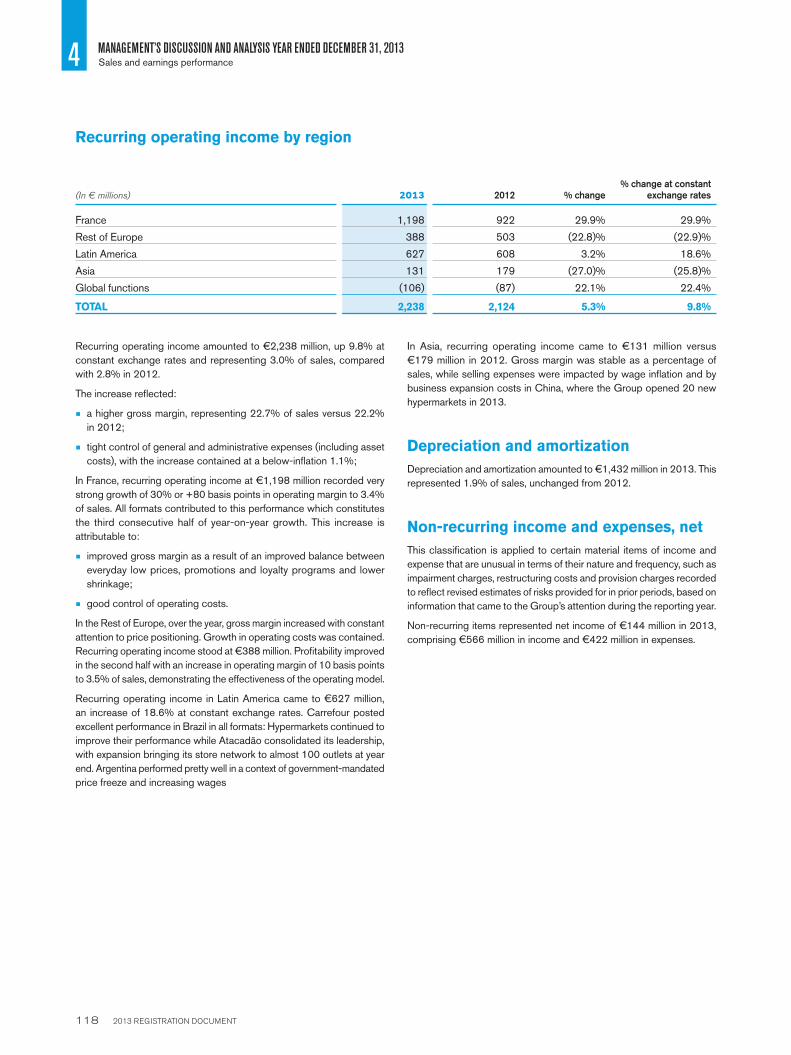
2013 REGISTRATION DOCUMENT 118
4 MANAGEMENT’S DISCUSSION AND ANALYSIS YEAR ENDED DECEMBER 31, 2013Sales and earnings performance
Recurring operating income by region
(In € millions) 2013 2012 % change% change at constant
exchange rates
France 1,198 922 29.9% 29.9%
Rest of Europe 388 503 (22.8)% (22.9)%
Latin America 627 608 3.2% 18.6%
Asia 131 179 (27.0)% (25.8)%
Global functions (106) (87) 22.1% 22.4%
TOTAL 2,238 2,124 5.3% 9.8%
Recurring operating income amounted to €2,238 million, up 9.8% at
constant exchange rates and representing 3.0% of sales, compared
with 2.8% in 2012.
The increase refl ected:
W a higher gross margin, representing 22.7% of sales versus 22.2%
in 2012;
W tight control of general and administrative expenses (including asset
costs), with the increase contained at a below-infl ation 1.1%;
In France, recurring operating income at €1,198 million recorded very
strong growth of 30% or +80 basis points in operating margin to 3.4%
of sales. All formats contributed to this performance which constitutes
the third consecutive half of year-on-year growth. This increase is
attributable to:
W improved gross margin as a result of an improved balance between
everyday low prices, promotions and loyalty programs and lower
shrinkage;
W good control of operating costs.
In the Rest of Europe, over the year, gross margin increased with constant
attention to price positioning. Growth in operating costs was contained.
Recurring operating income stood at €388 million. Profi tability i mproved
in the second half with an increase in operating margin of 10 basis points
to 3.5% of sales, demonstrating the effectiveness of the operating model.
Recurring operating income in Latin America came to €627 million,
an increase of 18.6% at constant exchange rates. Carrefour posted
excellent performance in Brazil in all formats: Hypermarkets continued to
improve their performance while Atacadão consolidated its leadership,
with expansion bringing its store network to almost 100 outlets at year
end. Argentina performed pretty well in a context of government-mandated
price freeze and increasing wages
In Asia, recurring operating income came to €131 million versus
€179 million in 2012. Gross margin was stable as a percentage of
sales, while selling expenses were impacted by wage infl ation and by
business expansion costs in China, where the Group opened 20 new
hypermarkets in 2013.
Depreciation and amortization
Depreciation and amortization amounted to €1,432 million in 2013. This
represented 1.9% of sales, unchanged from 2012.
Non-recurring income and expenses, net
This classifi cation is applied to certain material items of income and
expense that are unusual in terms of their nature and frequency, such as
impairment charges, restructuring costs and provision charges recorded
to refl ect revised estimates of risks provided for in prior periods, based on
information that came to the Group’s attention during the reporting year.
Non-recurring items represented net income of €144 million in 2013,
comprising €566 million in income and €422 million in expenses.

2013 REGISTRATION DOCUMENT 119
MANAGEMENT’S DISCUSSION AND ANALYSIS YEAR ENDED DECEMBER 31, 2013
4
Sales and earnings performance
The detailed breakdown is as follows:
(in € millions) 2013 2012
Net gains on sales of assets 425 234
Restructuring costs (52) (287)
Other non-recurring items (101) (374)
Non-recurring income and expenses net before asset impairments and write-offs 272 (427)
Asset impairments and write-offs (128) (233)
Impairments and write-offs of goodwill (16) (18)
Impairments and write-offs of property and equipment (112) (215)
Non-recurring income and expenses, net 144 (660)
Of which, non-recurring income 566 286
Of which, non recurring expenses (422) (946)
Gains on disposals of assets in 2013 mainly concerned the sale of the
Group’s 25% interest in Majid Al Futtaim Hypermarkets.
A description of non-recurring income and expenses is provided in Note
11 to the Consolidated Financial Statements.
Finance costs and other financial income and expenses, net
Finance costs and other fi nancial income and expenses represented
a net expense of €722 million, corresponding to 1% of sales versus
1.2% in 2012.
Operating income
The Group reported operating income of €2,382 million in 2013 compared
with €1,465 million the prior year, an improvement of €917 million.
(In € millions) 2013 2012
Finance costs, net (428) (488)
Other fi nancial income and expenses, net (294) (395)
FINANCE COSTS AND OTHER FINANCIAL INCOME AND EXPENSES, NET (722) (883)
Finance costs, net decreased by €60 million following the redemption
of bonds at relatively high rates of interest in 2013 and their refi nancing
at rates below 2%.
Income taxes
Income taxes amounted to €631 million in 2013 compared with
€380 million the year before. The effective tax rate was 38%.
Net income from companies accounted for by the equity method
Net income from companies accounted for by the equity method totaled
€30 million versus €72 million in 2012. The decrease primarily refl ects
the sale of the Group’s interest in Majid Al Futtaim Hypermarkets, which
was previously accounted for by the equity method.
2013 REGISTRATION DOCUMENT 120
4 MANAGEMENT’S DISCUSSION AND ANALYSIS YEAR ENDED DECEMBER 31, 2013Sales and earnings performance
Net income attributable to non-controlling interests
Net income attributable to non-controlling interests amounted to
€101 million in 2013 compared with €83 million in the previous year.
Net income from continuing operations – Group share
The Group reported net income from continuing operations of €949 million
in 2013, up from €150 million in 2012.
Net income from discontinued operations – Group share
Discontinued operations generated net income of €314 million in 2013,
compared with net income of €1,109 million in 2012. The 2013 fi gure
includes:
W the gain on the sale of the Group’s operations in Indonesia;
W the Group’s share of results for the period in Turkey, along with the
costs incurred for the reorganization of the local partnership with
Sabanci, which was completed on July 25, 2013 (see paragraph 4.2).
Net income from discontinued operations in 2012 mainly comprised:
W gains on disposal of the Group’s operations in Colombia and Malaysia
and results generated in these countries and in Indonesia in 2012,
for a total of €1,343 million;
W the €207 million loss on the reorganization of the partnership in Greece
completed in August 2012.

2013 REGISTRATION DOCUMENT 121
MANAGEMENT’S DISCUSSION AND ANALYSIS YEAR ENDED DECEMBER 31, 2013
4
Financial position
4.2.1 SHAREHOLDERS’ EQUITY
4.2. Financial position
At December 31, 2013, shareholders’ equity stood at €8,597 million,
compared with €8,047 million at the previous year-end. The €550 million
increase refl ected:
W net income for the period of €1,364 million;
W dividend payments of €499 million, of which €398 million paid to
Carrefour shareholders (including €290 million paid in shares) and
€101 million to minority shareholders of subsidiaries;
W the buyout of non-controlling interests in France, leading to a
€112 million net reduction in total shareholders’ equity;
W the removal from the balance sheet of non-controlling interests in
Indonesia, leading to a €72 million net reduction in total shareholders’
equity;
W the removal from the balance sheet of non-controlling interests in
Turkey, leading to a €21 million net increase in total shareholders’
equity;
W the €455 million negative exchange difference from translating foreign
operations.
4.2.2 NET DEBT
In 2013, the Group continued to strengthen its balance sheet: Net
debt declined by €203 million to €4,117 million from €4,320 million
at December 31, 2012. The net debt to equity ratio stood at 47.9% at
December 31, 2013, compared with 53.7% a year earlier.
A €1.4 billion bond buyback operation in June 2013 helped to lower
total debt, as well as the average cost of debt.
Net debt breaks down as follows:
(in € millions) 2013 2012
Bonds 7,462 8,992
Other borrowings 1,356 1,516
Commercial paper - -
Finance lease liabilities 388 420
Total borrowings before derivative instruments recorded in liabilities 9,206 10,928
Derivative instruments recorded in liabilities 27 318
Total long and short term borrowings 9,233 11,246
Of which, long term borrowings 7,550 8,983
Of which, short term borrowings 1,683 2,263
Other current fi nancial assets 359 352
Cash and cash equivalents 4,757 6,573
Total current fi nancial assets 5,116 6,925
NET DEBT 4,117 4,320

2013 REGISTRATION DOCUMENT 122
4 MANAGEMENT’S DISCUSSION AND ANALYSIS YEAR ENDED DECEMBER 31, 2013Financial position
Long and short-term borrowings (excluding derivatives) mature at different dates through 2021 for the longest tranche of bond debt, leading to
balanced repayment obligations in the coming years as shown below:
(in € millions) 2013 2012
Due within one year 1,683 2,263
Due in 1 to 2 years 1,242 1,773
Due in 2 to 5 years 2,955 4,067
Due beyond 5 years 3,326 2,824
TOTAL 9,206 10,928
In 2013, the Group issued €1 billion worth of 1.75% bonds due 2019.
At December 31, 2013, its liquidity position was strengthened by the availability of €4.15 billion in committed syndicated lines of credit with no
drawing restrictions expiring in 2016 and 2018.
4.2.3 CASH FLOWS FOR THE YEAR AND CASH AND CASH EQUIVALENTS AT D ECEMBER 31, 2013
Cash and cash equivalents totaled €4,757 million at December 31, 2013,
compared with €6,573 million at December 31, 2012, a decrease of
€1,816 million that primarily refl ects action by the Group to pay down
debt in 2013.
The reduction in net debt amounted to €203 million in 2013 versus
€2,591 million in 2012, breaking down as follows:
(In € millions) 2013 2012
Cash fl ow from operations 3,044 3,073
Change in trade working capital requirement 76 145
Investments (1,671) (1,524)
Other (359) (405)
Free cash fl ow excluding non-recurring items 1,091 1,289
Non-recurring cash outfl ows (1,064) (524)
Free cash fl ow (including non-recurring items) 26 765
Purchases and sales of securities 485 (50)
Cash dividends/reinvested dividends (206) (251)
Finance costs, net (428) (488)
Changes in the scope of consolidation and impact of discontinued operations 752 2,419
Other (426) 196
Decrease in net debt 203 2,591
Free cash fl ow stood at €26 million in 2013, compared with €765 million
in 2012, after taking into account signifi cantly higher capital expenditure
(with the net spend up €147 million) and one-off cash payments totalling
€1,064 million following settlement of several old tax disputes.
Purchases and sales of securities represented a net cash infl ow of
€485 million in 2013, compared with a net outfl ow of €50 million in 2012.
The favorable change primarily refl ects the sale of the Group’s interest in
Majid Al Futtaim Hypermarkets in 2013 (€526 million proceeds) on the
one hand and the 2012 acquisition of Guyenne & Gascogne on the other.

2013 REGISTRATION DOCUMENT 123
MANAGEMENT’S DISCUSSION AND ANALYSIS YEAR ENDED DECEMBER 31, 2013
4
Financial position
Changes in the scope of consolidation and discontinued operations had
a positive impact of €752 million in 2013, that was mainly due to the
sale of Indonesian operations during the year and the loss of control of
the subsidiary in Turkey.
This compares to a positive €2,419 million in 2012, corresponding
primarily to the sale of operations in Colombia and Malaysia.
4.2.4 FINANCING AND LIQUID RESOURCES
Corporate Treasury and Financing’s liquidity management strategy
consists of:
W promoting conservative fi nancing strategies in order to ensure that
the Group has a suffi ciently strong credit rating and can raise funds
on the bond and commercial paper markets;
W maintaining a presence in the debt market by conducting regular EMTN
and bond issues, mainly in euros, in order to guarantee a balanced
maturity profi le. The Group’s issuance capacity under its Euro Medium
Term Notes (EMTN) program totals €12 billion;
W using the €5 billion commercial paper program listed on NYSE
Euronext Paris;
W maintaining undrawn medium-term bank facilities that can be drawn
down at any time according to the Group’s needs. At December 31,
2013, the Group had three undrawn syndicated lines of credit obtained
from a pool of leading banks, for a total of €4.15 billion. Group policy
consists of keeping these facilities on stand-by, as backing for issues
under the commercial paper program. The loan agreements for the
syndicated lines of credit include the usual commitments and default
clauses, including pari passu, negative pledge, change of control and
cross-default clauses and a clause restricting sales of substantial
assets. They do not, however, include any rating trigger, although the
pricing grid may be adjusted up or down to refl ect changes in the
long-term credit rating. None of the agreements contains a material
adverse change clause.
The Group considers that its liquidity position was strong at December 31,
2013 since, at that date, it had €4.15 billion in committed syndicated
lines of credit with no drawing restrictions, expiring in 2016, 2017 and
2018. In addition, it had suffi cient cash reserves at that date to meet its
debt repayment obligations in the coming year.
The Group’s debt profi le is balanced, with no peak in refi nancing needs
across the remaining life of bond debt, which averages 4 years and 3
months.
At December 31, 2013, Carrefour was rated BBB/A-2, outlook positive
by S&P, while Carrefour Banque’s S&P rating at that date was BBB+/A-2,
outlook stable.
4.2.5 RESTRICTIONS ON THE USE OF CAPITAL RESOURCES
At December 31, 2013, there were no restrictions that could materially affect the availability of the cash and cash equivalent balances of foreign
subsidiaries.
4.2.6 EXPECTED SOURCES OF FUNDING
To meet its commitments, Carrefour can use its free cash fl ow and raise debt capital using its EMTN and commercial paper programs, as well as
its credit lines.

2013 REGISTRATION DOCUMENT 124
4 MANAGEMENT’S DISCUSSION AND ANALYSIS YEAR ENDED DECEMBER 31, 2013Outlook for 2014
Refocused on the markets in which it holds leading positions and with
a strengthened fi nancial structure, Carrefour is staying the course in a
low-growth environment, marked by currency volatility.
Mid-way through its three-year plan, Carrefour will focus in 2014 on the
following operational priorities:
W continue action plans in all countries aiming at continuous improvement
of its offer and price image to enhance the shopping experience, notably
in its three largest markets, France, Brazil and Spain;
W accelerate multi-channel roll-out:
W revamp and convergence of our websites in France, gradual
broadening of our offer,
W continued development of click & collect;
W implement new structural projects including:
W revamp of the supply chain in France,
W IT rationalization;
W enhance the attractiveness of our sites in France, Spain and Italy by
capitalizing on the creation of a shopping mall company;
W accelerate store remodelings and relaunch multi-format expansion:
W investments of between €2.4bn and €2.5bn in 2014,
W intensifi cation of the remodeling plan,
W continued long-term growth in emerging markets, particularly in
China and Brazil;
W maintain strict fi nancial discipline.
4.3 Outlook for 2014
2013 REGISTRATION DOCUMENT 125
MANAGEMENT’S DISCUSSION AND ANALYSIS YEAR ENDED DECEMBER 31, 2013
4
Other information
4.4.1 ACCOUNTING PRINCIPLES
4.4 Other information
The accounting and calculation methods used to prepare the Consolidated
Financial Statements for 2013 are the same as those used for the 2012
Consolidated Financial Statements, except as explained below:
W Amendments to IAS 19 – Employee Benefits. The main effects of
retrospectively applying IAS 19R result from the elimination of the
corridor method and the fact that it is no longer possible to defer
recognition of past service costs. They consisted primarily of a
reduction in shareholders’ equity (€172 million at January 1, 2012 and
€314 million at December 31, 2012, net of the deferred tax credit), due
for the most part to an increase in provisions for pensions and length-
of-service awards payable to employees on retirement (€266 million
at January 1, 2012 and €475 million at December 31, 2012).
W IFRS 13 – Fair Value Measurement. This standard provides a single
IFRS framework for measuring fair value that is applicable to all
IFRSs that require or permit fair value measurements or disclosures.
Its application had no material impact on the Group’s published
Consolidated Financial Statements.
W Amendment to IAS 1 – Presentation of Other Comprehensive Income,
which notably requires items that may be reclassifi ed subsequently
to profi t or loss to be presented separately from items that will not
be reclassifi ed.
The other new or amended standards and interpretations applicable in
the European Union as of January 1, 2013 do not have a material impact
on the Consolidated Financial Statements or do not concern the Group.
4.4.2 SIGNIFICANT EVENTS OF THE PERIOD
Reorganization of the partnership in Turkey
On April 30, 2013, Carrefour announced that it had reached an agreement
with its Turkish partner Sabanci Holding to reorganize the governance
of their joint venture, Carrefour SA.
Under the terms of the agreement, Sabanci Holding will become the
majority shareholder by acquiring an additional 12% of the capital of
Carrefour SA from Carrefour Group for a total consideration of TRY
141 million (approximately €60 million), while Carrefour will retain a 46.2%
stake, allowing it to exercise signifi cant infl uence over the joint venture.
Following the lifting of all the conditions precedent, including approval
of Carrefour SA’s new bylaws by Turkey’s securities regulator (CMB) on
July 2, 2013, the sale of one part of Carrefour’s stake in Carrefour SA
was completed on July 25, 2013.
In accordance with IAS 27, as the transaction will result in the loss of
control of Carrefour SA, it has been treated in the Consolidated Financial
Statements as the sale of the total pre-transaction interest (58.2%)
followed by the purchase of the post-transaction interest (46.2%),
accounted for at fair value by the equity method.
After taking into account the €81 million in negative cumulative exchange
differences recycled to the income statement, the loss of control led to
the recognition of a €41 million loss in the income statement, on the
line “Income/(loss) from discontinued operations”.
In accordance with IFRS 5, the following reclassifi cations have been
made in the fi nancial statements at December 31, 2013:
W Carrefour SA’s results up to the date when control was lost have been
presented under “Net income from discontinued operations” with the
portion attributable to non-controlling interests shown separately in
accordance with IAS 27. To permit period-on-period comparisons,
Carrefour SA’s 2012 results have been presented on the same basis;
W in the statement of cash fl ows, all of the Turkish entity’s cash fl ows for
2013 are presented on the lines “Impact of discontinued operations”,
with 2012 cash fl ows reclassifi ed accordingly.

2013 REGISTRATION DOCUMENT 126
4 MANAGEMENT’S DISCUSSION AND ANALYSIS YEAR ENDED DECEMBER 31, 2013Other information
Reorganization of the partnership with Majid Al Futtaim
On May 22, 2013, Carrefour announced that it was selling its 25% stake
in Majid Al Futtaim Hypermarkets to its partner, Majid Al Futtaim Holding,
for €530 million. At the same time, the exclusive partnership agreement
with the Carrefour Group is being rolled over until 2025 and extended
to include new formats and new countries.
The transaction was completed on June 23, 2013, after being approved
by the relevant authorities, leading to the recognition of a €426 million
disposal gain in non-recurring income. Majid Al Futtaim Hypermarkets
was accounted for by the equity method up to the completion date.
Bond buybacks
On June 5, 2013, Carrefour announced that it was launching a
€1,350 million bond buyback program. The three issues concerned
were as follows:
W €1,500 million 5.125% issue due October 2014;
W €1,000 million 5.375% issue due June 2015;
W €1,100 million 4.375% issue due November 2016.
The offer closed on June 12 and on June 18, the Group bought back
€1,293.7 million worth of bonds (excluding accrued interest), as follows:
W €601 million worth of 5.125% bonds due October 2014;
W €356.1 million worth of 5.375% bonds due June 2015;
W €336.6 million worth of 4.375% bonds due November 2016.
The cost of the buyback program, reported in fi nancial expense, amounted
to €119 million.
Divestment of operations in Indonesia
At the end of November 2012, Carrefour announced the sale of its 60%
stake in Carrefour Indonesia to its local partner, CT Corp, which has
become Carrefour’s exclusive franchisee in this country. The sale was
agreed at a price of €525 million.
The transaction was completed on January 16, 2013 and the €396 million
capital gain is therefore reported in the 2013 income statement, on the
line “Net income from discontinued operations”.
Payment of the 2012 dividend in shares
At the Annual General Meeting held on April 23, 2013, shareholders
decided to set the 2012 dividend at €0.58 per share with an option to
receive the dividend in shares.
The issue price of the new shares was set at €19.62 per share,
representing 95% of the average of the opening prices quoted on NYSE
Euronext Paris during the 20 trading days preceding the date of the
Annual General Meeting, less the net amount of the dividend of €0.58
per share and rounded up to the nearest euro cent.
The option period was open from May 2 to 23, 2013. At the end of this
period, shareholders owning 72.06% of Carrefour’s shares had elected
to reinvest their 2012 dividends.
June 7, 2013 was set as the date for:
W settlement/delivery of the 14,769,539 new shares corresponding to
reinvested dividends, leading to a total capital increase of €290 million;
W payment of the cash dividend to shareholders who chose not to reinvest
their dividends, representing a total payout of €108 million.
Creation of a company for shopping malls adjoining the Group’s hypermarkets in Europe
On December 16, 2013, Carrefour announced that it had signed a
memorandum of understanding with Klépierre for the purchase of 127
shopping malls.
The project will lead to the creation of a company that will include 172
shopping malls originating from:
W fi rstly, the acquisition from Klepierre for €2.0 billion of 127 sites in
France, Spain and Italy with gross annual rental income of around
€135 million;
W secondly, the contribution by Carrefour of 45 shopping malls in France
with a value of €0.7 billion and gross annual rental income of around
€45 million.
The company will be fi nanced through €1.8 billion in equity, 42% held
by Carrefour with the remainder held by institutional investors, as well
as through €900 million in debt.
The parties reached a fi nal agreement on January 24, 2014. The transaction
is still subject to the approval to the relevant regulatory authorities. It will
be submitted for consultation to employee representative bodies and
should close in the fi rst half of 2014.
At December 31, 2013, the properties at the 45 sites concerned were
reclassifi ed as held for sale, in accordance with IFRS 5 – Non-current
Assets Held for Sale and Discontinued Operations.
In 2014, in application of the consolidation standards applicable as
from that year (IFRS 10, IFRS 11 and IAS 28R), the new company will
be accounted for by the equity method as it will be jointly controlled by
Carrefour and its co-investors.

2013 REGISTRATION DOCUMENT 127
MANAGEMENT’S DISCUSSION AND ANALYSIS YEAR ENDED DECEMBER 31, 2013
4
Other information
4.4.3 MAIN RELATED PARTY TRANSACTIONS
The main related party transactions are disclosed in Note 41 to the Consolidated Financial Statements.
4.4.4 SUBSEQUENT EVENTS
No events have occurred since the year-end that would have a material impact on the Consolidated Financial Statements.

2013 REGISTRATION DOCUMENT 128
4 MANAGEMENT’S DISCUSSION AND ANALYSIS YEAR ENDED DECEMBER 31, 2013Parent Company fi nancial review
4.5 Parent Company fi nancial review
As the Carrefour Group’s holding company, Carrefour SA manages
a portfolio of shares in French and foreign subsidiaries and affi liates.
The Company’s main source of revenue - reported under «Other income»
in the income statement – consists of costs rebilled to other Group
entities. In 2013, other income amounted to €554 million.
Financial income, net amounted to €1,198 million in 2013 compared
with €1,029 million in 2012. The €169 million increase can be explained
as follows:
W Financial provision charges rose by a net €196 million, refl ecting:
W €283 million in net additions to provisions for impairment of shares
in subsidiaries and affi liates versus net reversals of €165 million
in 2012 (negative impact of €448 million),
W An increase in net reversals of provisions for impairment of treasury
stock, due to the rise in Carrefour’s share price between 2012
and 2013 (positive impact of €99 million),
W A decrease in net charges to provisions for other fi nancial risks
(€153 million positive impact);
W Dividend income from subsidiaries was higher, with a positive impact
of €343 million;
W Interest expense on intra-group and external borrowings decreased
year-on-year, with a positive impact of €22 million.
Non-recurring items represented net income of €604 million in 2013
consisted mainly of gains and losses on disposals of shares in subsidiaries
and affi liates and costs of buyback and retirement of bonds.
W Buyback and retirement of bonds
On June 5, 2013, Carrefour announced that it was launching a
€1,350 million bond buyback program. The three issues concerned
were as follows:
W €1,500 million 5.125% issue due October 2014,
W €1,000 million 5.375% issue due June 2015,
W €1,100 million 4.375% issue due November 2016;
The offer closed on June 12 and, on June 18, the Group bought
back €1,293.7 million worth of bonds (excluding accrued interest),
as follows:
W €601 million worth of 5.125% bonds due October 2014,
W €356,1 million worth of 5.375% bonds due June 2015,
W €336.6 million worth of 4.375% bonds due November 2016.
The €119 million cost of the transaction has been recognized in non-
recurring expense from revenue transactions.
W Disposals of shares in subsidiaries and affiliates
In 2013, Carrefour carried out several disposals (see section II
Subsidiaries and Affi liates below), the net impact of which has been
recognized in non-recurring income and expense from capital transaction.
Net income for the year amounted to €1,803,754,407.70.
Accounts payable balances at December 31, 2013 and 2012 break
down as follows by due date (disclosure made in accordance with
Article L.441-6-1 of France’s Commercial Code).
Amounts in millions of euros
Invoices not yet received and booked as trade payables are not broken down in this schedule.
Carrefour: due date of trade payables (in € millions) 12/31/2013 12/31/2012
Accounts payable due in less than one month 95.1 214.4
Accounts payable due in one to two months 1.0 0.1
TOTAL 96.0 214.5
4.5.1 ACTIVITIES AND RESULTS

2013 REGISTRATION DOCUMENT 129
MANAGEMENT’S DISCUSSION AND ANALYSIS YEAR ENDED DECEMBER 31, 2013
4
Parent Company fi nancial review
In 2013, Carrefour acquired Carrefour Hypermarchés shares representing
22.7% of the capital and valued at €583 million. On November 30, 2013,
47 hypermarket businesses in France were transferred to Carrefour
Hypermarchés in exchange for shares. The businesses are operated
by direct or indirect subsidiaries of Carrefour under business leases.
They were transferred at their net book value of €583 million. The new
Carrefour Hypermarchés shares received in payment for these assets
were recorded in Carrefour’s balance sheet for the same amount, under
“Investments”.
In 2013, Carrefour carried out several disposals, the net impact of which
has been recognized in non-recurring income and expense. These
transactions included the sale of:
W 39% of PT Carrefour Indonesia (Indonesia) to CT Corp (Indonesia);
W 19.1% of MAF Hypermarket (United Arab Emirates) to MAF Holding
(United Arab Emirates);
W 14.5% of Logidis (France) to Carrefour France;
W 28.6% of Interdis (France) to Carrefour France.
We propose to allocate and distribute earnings for the fi scal year as follows:
Net income for the year €1,803,754,407.70
Allocation to the legal reserve €-1,960,452.25
Retained earnings brought forward from prior year €3,565,810.42
Income available for distribution €1,805,359,765.87
2013 dividends €448,870,199.04
To be paid out of:
Distributable income, for €448,870,199.04
Balance to be credited to retained earnings €1,356,489,566.83
4.5.2 SUBSIDIARIES AND AFFILIATES
4.5.3 INCOME APPROPRIATION
The amount of retained earnings after tax for fi scal year 2012 was
increased owing to 2012 dividends not paid out on treasury shares.
It is specifi ed that the total dividend of €448,870,199.04, which
represents a dividend of €0.62 per share, before payroll taxes and non
fi nal withholding tax of 21% provided for in Article 117 quater of the
French General Tax Code, qualifi es, for individuals who are French tax
residents, for the tax relief equal to 40% of the amount of the dividend in
accordance with section 2° of paragraph 3 of Article 158 of the French
General Tax Code.
We propose offering each shareholder the option of a dividend payment:
W in cash; or
W in new Company shares.
The new shares, if the option is exercised, will be issued at a price equal to
95% of the average opening prices listed during the twenty stock market
trading sessions on Euronext Paris prior to the date of this shareholders’
general meeting, less the amount of the dividend that is the subject of
this resolution and rounded up to the nearest euro cent. Such issued
shares will immediately be entitled to dividends as of January 1, 2014 and
will be part of the share capital of the Company alongside other shares.
Shareholders may opt for payment of the dividend in cash or in new shares
from April 24, 2014 to May 15, 2014 inclusive, by sending their request
to the fi nancial intermediaries that are authorized to pay the dividend or,
for registered shareholders listed in the issuer-registered accounts held
by the Company, to its authorized agent (CACEIS Corporate Trust 14,
rue Rouget de Lisle – 92862 Issy-les-Moulineaux Cedex 09).
For shareholders who have not exercised their option by May 15, 2014,
the dividend will only be paid in cash.
For shareholders who have not opted for a payment in shares, the dividend
will be paid in cash on May 28, 2014 after the expiration of the option
period. For shareholders who have opted for a dividend payment in shares,
the settlement and delivery of shares will take place on the same date.

2013 REGISTRATION DOCUMENT 130
4 MANAGEMENT’S DISCUSSION AND ANALYSIS YEAR ENDED DECEMBER 31, 2013Parent Company fi nancial review
It is recalled in accordance with the law, that the dividends paid on each share for the three preceding fi scal years and the income eligible for tax
relief under Section 2° of paragraph 3 of Article 158 of the French General Tax Code per share, were as follows:
Fiscal year Gross dividend paid Dividends eligible for tax relief of 40%
2010 €1.08 €1.08
2011 €0.52 €0.52
2012 €0.58 €0.58
In 2011, the distributed earnings shown in this table do not include the distribution of Dia shares in the form of a dividend-in-kind on July 5, 2011,
amounting to €2, 310 million.
4.5.4 AGREEMENTS REFERRED TO IN ARTICLE L. 225-38 ET SEQ. OF THE FRENCH COMMERCIAL CODE
We inform you that two agreements governed by Articles L. 225-38 et seq. of the French Commercial Code were authorised by the Board of
Directors during the past year and at the very beginning of fi scal year 2014, as set out in the Statutory Auditors’ special report in accordance with
Article L.225-40 of said Code, which must mention any agreements authorised during the fi scal year and which have continued during the fi scal year.
4.5.5 RESEARCH AND DEVELOPMENT
The Company does not implement a research and development policy.

2013 REGISTRATION DOCUMENT 131
MANAGEMENT’S DISCUSSION AND ANALYSIS YEAR ENDED DECEMBER 31, 2013
4
Parent Company fi nancial review
4.5.6 COMPANY EARNINGS PERFORMANCE IN THE LAST FIVE FISCAL YEARS
(in € millions) 2013 2012 2011 2010 2009
I – Capital at year-end
Equity capital 1,810 1,773 1,698 1,698 1,762
Issue and merger premiums 15,672 15,419 15,094 15,094 15,953
Number of existing ordinary shares 723,984,192 709,214,653 679,336,000 679,336,000 704,902,716
II – Results of operations for the fi scal year
Income before tax, employee profi t-sharing and depreciation, amortization and provisions 1,758 473 582 1,521 470
Income tax 222 375 404 368 258
Employee profi t-sharing payable for the fi scal year
Income after tax and employee profi t-sharing and depreciation, amortization and provisions 1,804 5 (1,077) 2,150 818
Distribute income (1) 449 411 363 734 761
III – Net income per share
Income after tax and employee profi t-sharing but before depreciation, amortization and provisions 2.73 1.20 1.45 2.78 1.03
Income after tax, employee profi t-sharing and depreciation, amortization and provisions 2.49 0.01 (1.59) 3.16 1.17
Net dividend allocated to each share (1) 0.62 0.58 0.52 1.08 1.08
IV – Employee
Average number of employees during the fi scal year 9 9 12 8 12
Amount of payroll for the fi scal year 15 19 20 25 16
Amount paid as employee benefi ts for the fi scal year (social security, social services) 5 6 6 7 5
(1) For 2013, this has been set by the Board of Directors and will be submitted to the Ordinary Shareholders’ Meeting for approval.
In 2011, the distributed earnings shown in this table do not include the distribution of Dia shares in the form of a dividend-in-kind on July 5, 2011,
amounting to €2, 310 million.

2013 REGISTRATION DOCUMENT 132

2013 REGISTRATION DOCUMENT 133
CONSOLIDATED FINANCIAL STATEMENTS
YEAR ENDED DECEMBER 31, 2013
5
5.1 Consolidated income statement 134
5.2 Consolidated statement of comprehensive income 135
5.3 Consolidated statement of fi nancial position 136
5.4 Consolidated statement of cash fl ows 138
5.5 Consolidated statement of changes in shareholders’ equity 139
5.6 Notes to the Consolidated Financial Statements 140
5.7 Statutory Auditors’ report on the Consolidated Financial Statements 222

2013 REGISTRATION DOCUMENT 134
5 CONSOLIDATED FINANCIAL STATEMENTS YEAR ENDED DECEMBER 31, 2013Consolidated income statement
The 2012 comparative information presented in this report has been
restated to refl ect the reclassifi cation of certain operations in accordance
with IFRS 5 – Non-current Assets Held for Sale and Discontinued
Operations, and the retrospective application of IAS 19R – Employee
Benefits. These restatements are described in Note 4.
The Consolidated Financial Statements are presented in millions of
euros, rounded to the nearest million. As a result, there may be rounding
differences between the amounts reported in the various statements.
(in € millions) Notes 2013 2012(1) % change
Net sales 6 74,888 75,673 (1.0%)
Loyalty program costs (588) (653) (9.9%)
Net sales net of loyalty program costs 74,299 75,021 (1.0%)
Other revenue 7 2,375 2,309 2.9%
Total revenue 76,675 77,330 (0.8%)
Cost of sales 8 (59,828) (60,659) (1.4%)
Gross margin from recurring operations 16,847 16,671 1.1%
Sales, general and administrative expenses 9 (13,178) (13,028) 1.1%
Depreciation, amortization and provisions 10 (1,432) (1,518) (5.7%)
Recurring operating income 2,238 2,124 5.3%
Non-recurring income and expenses, net 11 144 (660) -
Operating income 2,382 1,465 62.6%
Finance costs and other fi nancial income and expenses, net 12 (722) (883) (18.3%)
Finance costs, net (428) (488) (12.4%)
Other fi nancial income and expenses, net (294) (395) (25.5%)
Income before taxes 1,660 581 185.5%
Income tax expense 13 (631) (380) 65.9%
Net income from companies accounted for by the equity method 30 72 (58.8%)
Net income from continuing operations 1,058 273 287.7%
Net income from discontinued operations 14 306 1,069 (71.4%)
Net income for the year 1,364 1,342 1.7%
Group share 1,263 1,259 0.3%
of which net income from continuing operations 949 150 531.7%
of which net income from discontinued operations 314 1,109 (71.6%)
Attributable to non-controlling interests 101 83 21.6%
(1) Restated, see Note 4.
Basic earnings/(loss) per share (in €) 2013 2012(1) % change
Earnings/(loss) from continuing operations per share 1.37 0.22 na
Earnings from discontinued operations per share 0.45 1.62 na
Basic earnings per share – Group share 1.82 1.84 (1.4%)
Diluted earnings/(loss) per share (in €) 2013 2012 % change
Diluted earnings/(loss) from continuing operations per share 1.37 0.22 na
Diluted earnings from discontinued operations per share 0.45 1.62 na
Diluted earnings per share – Group share 1.82 1.84 (1.4%)
(1) Restated.
Calculation details are provided in Note 15.
5.1 Consolidated income statement

2013 REGISTRATION DOCUMENT 135
CONSOLIDATED FINANCIAL STATEMENTS YEAR ENDED DECEMBER 31, 2013
5
Consolidated statement of comprehensive income
(in € millions) 2013 2012 (1)
Net income for the year 1,364 1,342
Effective portion of changes in the fair value of cash fl ow hedges (2) 39 6
Changes in the fair value of available-for-sale fi nancial assets (2) 5 7
Exchange differences on translating foreign operations (3) (455) (192)
Items that may be reclassifi ed subsequently to profi t or loss (411) (180)
Unrecognized actuarial gains and losses on defi ned benefi t plans (2) 25 (168)
Items that will not be reclassifi ed to profi t or loss 25 (168)
Other comprehensive income (386) (348)
Total comprehensive income 979 994
Group share 914 923
Attributable to non-controlling interests 64 72
(1) Restated, see Note 4.
(2) Presented net of the tax effect (see Note 16 for details).
(3) The change in exchange differences on translating foreign operations mainly refl ects the decline in the Brazilian and Argentine currencies.
5.2 Consolidated statement of comprehensive income

2013 REGISTRATION DOCUMENT 136
5 CONSOLIDATED FINANCIAL STATEMENTS YEAR ENDED DECEMBER 31, 2013Consolidated statement of fi nancial position
Assets
(in € millions) Notes 12/31/2013 12/31/2012 (1)
Goodwill 17 8,277 8,608
Other intangible assets 17 767 801
Property and equipment 18 11,109 11,509
Investment property 19 313 513
Investments in companies accounted for by the equity method 20 496 384
Other non-current fi nancial assets 20 1,146 1,125
Consumer credit granted by the fi nancial services companies – long term 33 2,381 2,360
Deferred tax assets 21 931 919
Non-current assets 25,419 26,219
Inventories 22 5,738 5,658
Trade receivables 23 2,213 2,144
Consumer credit granted by the fi nancial services companies – short-term 33 3,221 3,286
Other current fi nancial assets 24 359 352
Tax receivables 715 520
Other assets 25 841 789
Cash and cash equivalents 26 4,757 6,573
Assets held for sale (2) 301 465
Current assets 18,145 19,787
TOTAL ASSETS 43,564 46,006
(1) Restated, see Note 4.
(2) Assets held for sale and related liabilities correspond:
W at December 31, 2012, to the assets and liabilities associated with operations in Indonesia and Singapore, and certain assets in France and Italy;
W at December 31, 2013, essentially to the assets concerned by the real estate transaction described in Note 3.6.
5.3 Consolidated statement of fi nancial position

2013 REGISTRATION DOCUMENT 137
CONSOLIDATED FINANCIAL STATEMENTS YEAR ENDED DECEMBER 31, 2013
5
Consolidated statement of fi nancial position
Shareholders’ equity and liabilities
(in € millions) Notes 12/31/2013 12/312012 (1)
Share capital 27 1,810 1,773
Consolidated reserves and income for the year 6,034 5,408
Shareholders’ equity – Group share 7,844 7,181
Shareholders’ equity attributable to non-controlling interests 754 866
Total shareholders' equity 8,597 8,047
Long-term borrowings 32 7,550 8,983
Provisions 29 3,618 4,475
Consumer credit fi nancing – long-term 33 1,765 1,966
Deferred tax liabilities 21 521 580
Non-current liabilities 13,454 16,003
Short-term borrowings 32 1,683 2,263
Suppliers and other creditors 34 12,854 12,925
Consumer credit fi nancing – short-term 33 3,145 3,032
Tax payables 1,045 1,040
Other payables 35 2,763 2,422
Liabilities related to assets held for sale (2) 24 273
Current liabilities 21,513 21,955
TOTAL SHAREHOLDERS’ EQUITY AND LIABILITIES 43,564 46,006
(1) Restated, see Note 4.
(2) Assets held for sale and related liabilities correspond:
W at December 31, 2012, to the assets and liabilities associated with operations in Indonesia and Singapore, and certain assets in France and Italy;
W at December 31, 2013, essentially to the assets concerned by the real estate transaction described in Note 3.6.
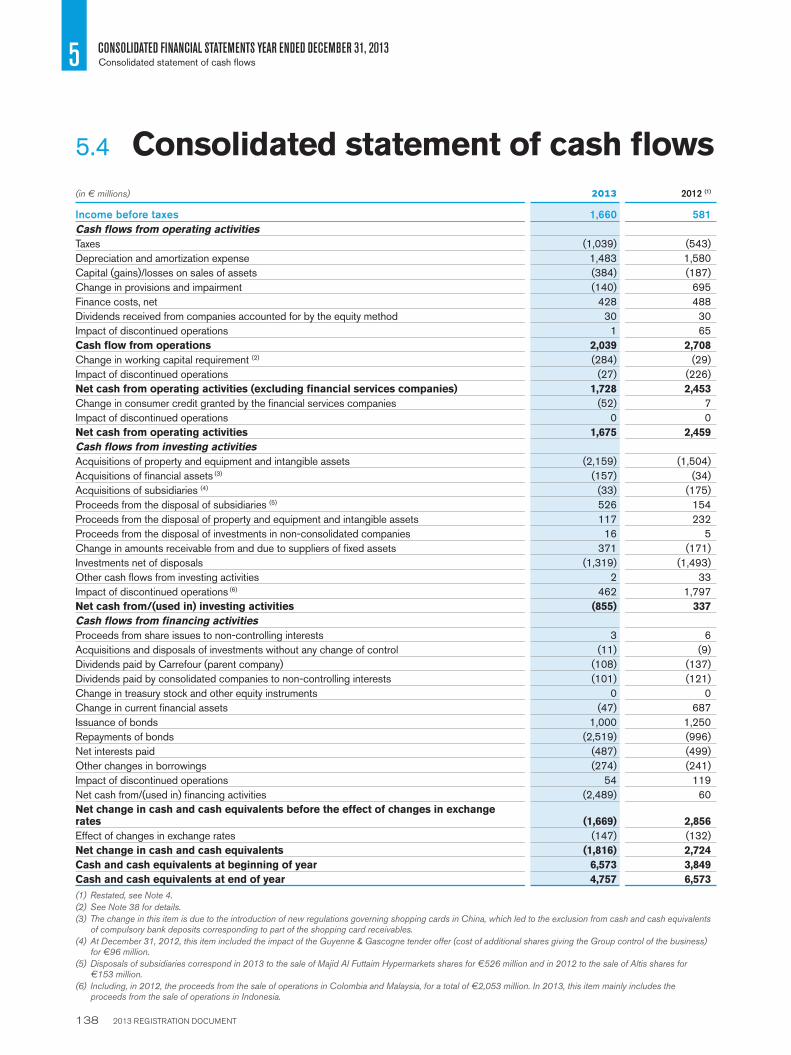
2013 REGISTRATION DOCUMENT 138
5 CONSOLIDATED FINANCIAL STATEMENTS YEAR ENDED DECEMBER 31, 2013Consolidated statement of cash fl ows
5.4 Consolidated statement of cash fl ows
(in € millions) 2013 2012 (1)
Income before taxes 1,660 581
Cash fl ows from operating activities
Taxes (1,039) (543)
Depreciation and amortization expense 1,483 1,580
Capital (gains)/losses on sales of assets (384) (187)
Change in provisions and impairment (140) 695
Finance costs, net 428 488
Dividends received from companies accounted for by the equity method 30 30
Impact of discontinued operations 1 65
Cash fl ow from operations 2,039 2,708
Change in working capital requirement (2) (284) (29)
Impact of discontinued operations (27) (226)
Net cash from operating activities (excluding fi nancial services companies) 1,728 2,453
Change in consumer credit granted by the fi nancial services companies (52) 7
Impact of discontinued operations 0 0
Net cash from operating activities 1,675 2,459
Cash fl ows from investing activities
Acquisitions of property and equipment and intangible assets (2,159) (1,504)
Acquisitions of fi nancial assets (3) (157) (34)
Acquisitions of subsidiaries (4) (33) (175)
Proceeds from the disposal of subsidiaries (5) 526 154
Proceeds from the disposal of property and equipment and intangible assets 117 232
Proceeds from the disposal of investments in non-consolidated companies 16 5
Change in amounts receivable from and due to suppliers of fi xed assets 371 (171)
Investments net of disposals (1,319) (1,493)
Other cash fl ows from investing activities 2 33
Impact of discontinued operations (6) 462 1,797
Net cash from/(used in) investing activities (855) 337
Cash fl ows from fi nancing activities
Proceeds from share issues to non-controlling interests 3 6
Acquisitions and disposals of investments without any change of control (11) (9)
Dividends paid by Carrefour (parent company) (108) (137)
Dividends paid by consolidated companies to non-controlling interests (101) (121)
Change in treasury stock and other equity instruments 0 0
Change in current fi nancial assets (47) 687
Issuance of bonds 1,000 1,250
Repayments of bonds (2,519) (996)
Net interests paid (487) (499)
Other changes in borrowings (274) (241)
Impact of discontinued operations 54 119
Net cash from/(used in) fi nancing activities (2,489) 60
Net change in cash and cash equivalents before the effect of changes in exchange rates (1,669) 2,856
Effect of changes in exchange rates (147) (132)
Net change in cash and cash equivalents (1,816) 2,724
Cash and cash equivalents at beginning of year 6,573 3,849
Cash and cash equivalents at end of year 4,757 6,573
(1) Restated, see Note 4.
(2) See Note 38 for details.
(3) The change in this item is due to the introduction of new regulations governing shopping cards in China, which led to the exclusion from cash and cash equivalents of compulsory bank deposits corresponding to part of the shopping card receivables.
(4) At December 31, 2012, this item included the impact of the Guyenne & Gascogne tender offer (cost of additional shares giving the Group control of the business) for €96 million.
(5) Disposals of subsidiaries correspond in 2013 to the sale of Majid Al Futtaim Hypermarkets shares for €526 million and in 2012 to the sale of Altis shares for €153 million.
(6) Including, in 2012, the proceeds from the sale of operations in Colombia and Malaysia, for a total of €2,053 million. In 2013, this item mainly includes the proceeds from the sale of operations in Indonesia.

2013 REGISTRATION DOCUMENT 139
CONSOLIDATED FINANCIAL STATEMENTS YEAR ENDED DECEMBER 31, 2013
5
Consolidated statement of changes in shareholders’ equity
(in € millions)
Share capital
Translation reserve
Fair value reserve (1)
Other consolidated
reserves and net income for the
year
Shareholders’ equity – Group
shareNon-controlling
interests
Total shareholders’
equity
Shareholers' equity at December 31, 2011 458 4,521 6,617 1,009 7,627
Application of IAS 19R (166) (166) (5) (172)
Shareholders' equity at January 1, 2012 1,698 458 (61) 4,355 6,451 1,004 7,455
Net income for the year (2) 1,259 1,259 83 1,342
Other comprehensive income after tax (2) (365) 12 (165) (518) (11) (529)
Total comprehensive income 0 (365) 12 1,094 741 72 813
Share-based payments 9 9 9
Treasury stock (net of tax) 0 0 0
2011 divident payment (3) 41 (178) (137) (121) (257)
Change in capital and additional paid-in capital (3) 33 155 188 6 194
Effect of changes in scope of consolidation and other movements (5) (72) (72) (95) (167)
Shareholders' equity at December 31, 2012 1,773 93 (49) 5,364 7,181 866 8,047
Net income for the year 1,263 1,263 101 1,364
Other comprehensive income after tax (407) 37 22 (349) (37) (386)
Total comprehensive income 0 (407) 37 1,285 914 64 979
Share-based payments 2 2 2
Treasury stock (net of tax) 0 0 0
2012 dividend payment (6) 37 (145) (108) (101) (209)
Change in capital and additional paid-in capital 0 3 3
Effect of changes in scope of consolidation and other movements (7) (146) (146) (79) (225)
Shareholders' equity at December 31, 2013 1,810 (314) (13) 6,360 7,844 754 8,597
(1) This item comprises:
W the effective portion of changes in the fair value of cash fl ow hedges;
W cumulative changes in the fair value of available-for-sale fi nancial assets.
(2) Restated to take into account the effect of the change of method resulting from application of IAS 19R (see Note 4.2)
(3) The 2011 dividend totaling €348 million was paid in cash for €137 million and in new shares for €211 million (corresponding to the aggregate par value of the new shares for €41 million and premiums for €170 million).
(4) The cash offer for Guyenne & Gascogne with a stock alternative led to the issue of 13.3 million new shares for a total of €188 million including premiums.
(5) This line includes the effect of:
W the buyout of non-controlling interests in Sogara and Centros Comerciales Carrefour in connection with the Guyenne & Gascogne acquisition, for a negative €263 million;
W the buyout of the Group’s partner in Brazil, followed by the sale of an interest in this business to Itaù Unibanco, for a positive €112 million.
(6) The 2012 dividend totaling €398 million was paid in cash for €108 million and in new shares for €290 million (corresponding to the aggregate par value of the new shares for €37 million and premiums for €253 million).
(7) Changes in scope of consolidation and other movements correspond primarily to the buyout of non-controlling interests in Indonesia (€72 million) and in France (€112 million).
5.5 Consolidated statement of changes in shareholders’ equity

2013 REGISTRATION DOCUMENT 140
5 CONSOLIDATED FINANCIAL STATEMENTS YEAR ENDED DECEMBER 31, 2013Notes to the Consolidated Financial Statements
TABLE OF CONTENTS
5.6 Notes to the Consolidated Financial Statements
Note 1 Basis of preparation of the consolidated
fi nancial statements 141
Note 2 Summary of signifi cant accounting policies 142
Note 3 Signifi cant events of the year 151
Note 4 Restatement of comparative information 153
Note 5 Segment information 158
Note 6 Net sales 160
Note 7 Other revenue by nature 160
Note 8 Cost of sales 161
Note 9 Sales, general and administrative expenses 161
Note 10 Depreciation and amortization 161
Note 11 Non-recurring income and expenses 162
Note 12 Finance costs and other fi nancial income and
expenses 163
Note 13 Income tax expense 164
Note 14 Net income from discontinued operations 165
Note 15 Earnings per share (Group share) 165
Note 16 Other comprehensive income 166
Note 17 Intangible assets 166
Note 18 Property and equipment 170
Note 19 Investment property 173
Note 20 Investments in companies accounted for by the
equity method and other non-current fi nancial
assets 174
Note 21 Deferred taxes 175
Note 22 Inventories 176
Note 23 Trade receivables 177
Note 24 Other current fi nancial assets 177
Note 25 Other assets 177
Note 26 Cash and cash equivalents 178
Note 27 Shareholders’ equity 178
Note 28 Share-based payments 180
Note 29 Provisions 183
Note 30 Post-employment benefi t obligations 184
Note 31 Claims and litigation 189
Note 32 Long and short-term borrowings 190
Note 33 Consumer credit fi nancing 193
Note 34 Financial instruments 194
Note 35 Other payables 195
Note 36 Risk management 196
Note 37 Contingent liabilities 201
Note 38 Change in working capital requirement 202
Note 39 Off-balance sheet commitments 202
Note 40 Employee information 203
Note 41 Related parties 204
Note 42 Management compensation 204
Note 43 Subsequent events 205
Note 44 Fees paid to the auditors 205
Note 45 Scope of consolidation 206

2013 REGISTRATION DOCUMENT 141
CONSOLIDATED FINANCIAL STATEMENTS YEAR ENDED DECEMBER 31, 2013
5
Notes to the Consolidated Financial Statements
1.1 ACCOUNTING PRINCIPLES AND STATEMENT OF COMPLIANCE
The Consolidated Financial Statements for the year ended
December 31, 2013 were approved for publication by the Board of
Directors on March 4, 2014. They will be submitted to shareholders for
fi nal approval at the Annual General Meeting on April 15, 2014.
Carrefour (the “Company”) is domiciled in France. The Consolidated
Financial Statements for the year ended December 31, 2013 comprise
the fi nancial statements of the Company and its subsidiaries (together
the “Group”) and the Group’s share of the profi ts and losses, assets and
liabilities of associated and jointly controlled companies. The presentation
currency of the Consolidated Financial Statements is the euro, which is
the Company’s functional currency.
In accordance with European Regulation (EC) 1606/2002 dated
July 19, 2002, the 2013 Consolidated Financial Statements have been
prepared in compliance with the international accounting standards
adopted for use in the European Union as of December 31, 2013 and
applicable at that date, with 2012 comparative information prepared
using the same standards.
International accounting standards comprise International Financial
Reporting Standards (IFRSs), International Accounting Standards (IASs),
International Financial Reporting Standards Interpretation Committee
(IFRIC) Interpretations and Standing Interpretations Committee (SIC)
Interpretations.
All of the standards and interpretations adopted for use in the European
Union are available on the European Commission’s website:
http://ec.europa.eu/internal_market/accounting/ias/index_en.htm
At December 31, 2013, the standards and interpretations adopted for
use in the European Union were the same as those published by the
IASB and applicable at that date, except for:
W IAS 39, which had been only partly adopted; the unadopted provisions
of IAS 39 have no impact on the Group’s Consolidated Financial
Statements;
W IFRS 10 – Consolidated Financial Statements, IFRS 11 – Joint
Arrangements, IFRS 12 – Disclosure of Interests in Other Entities,
IAS 27R – Separate Financial Statements and IAS 28R – Investments
in Associates and Joint Ventures. These new and revised standards
have been adopted for use in the European Union for annual periods
beginning on or after January 1, 2014. The Group has decided not
to early adopt them and will therefore apply them as from that date.
These new and revised standards will not have any material impact
on the Consolidated Financial Statements.
1.2 IFRSS AND INTERPRETATIONS APPLIED BY THE GROUP
The accounting and calculation methods used to prepare the 2013
Consolidated Financial Statements are the same as those used in 2012,
except for:
W amendments to IAS 19 – Employee Benefits. One of the main
amendments eliminates the use of the corridor method previously
applied by the Group. Under IAS 19R, changes in actuarial gains and
losses are recognized systematically in “Other comprehensive income”
and past service costs are recognized in full in profi t or loss. The
impact of retrospectively applying IAS 19R to comparative information
is presented in Notes 4.2 and 4.4;
W IFRS 13 – Fair Value Measurement. This standard provides a single
IFRS framework for measuring fair value that is applicable to all
IFRSs that require or permit fair value measurements or disclosures.
Its application had no material impact on the Group’s published
Consolidated Financial Statements;
W amendment to IAS 1 – Presentation of Other Comprehensive Income,
which notably requires items that may be reclassifi ed subsequently
to profi t or loss to be presented separately from items that will not
be reclassifi ed;
W amendment to IAS 12 – Deferred Tax: Recovery of Underlying Assets;
W amendment to IFRS 7 – Disclosures: Offsetting Financial Assets
and Financial Liabilities;
W 2009-2011 annual improvements.
The Group decided not to early adopt the following standards and
interpretations that were not applicable as of January 1, 2013:
Standards adopted for use in the European Union:
W standards dealing with consolidation (IFRS 10 – Consolidated
Financial Statements, IFRS 11 – Joint Arrangements, IFRS 12 –
Disclosure of Interests in Other Entities), their amended transition
guidance, and the resulting revisions to IAS 27 and IAS 28 (applicable
for annual periods beginning on or after January 1, 2014).
Application of IFRS 11, which eliminates proportionate consolidation
as a method of accounting for jointly controlled entities, should not
have any impact on the Consolidated Financial Statements as the
Group already uses the equity method to account for these entities;
W amendment to IAS 32 – Offsetting Financial Assets and Financial
Liabilities.
NOTE 1 BASIS OF PREPARATION OF THE CONSOLIDATED FINANCIAL
STATEMENTS

2013 REGISTRATION DOCUMENT 142
5 CONSOLIDATED FINANCIAL STATEMENTS YEAR ENDED DECEMBER 31, 2013Notes to the Consolidated Financial Statements
Standards not yet adopted for use in the European Union:
W IFRS 9 – Financial Instruments: Classification and Measurement of
Assets and Liabilities;
W IFRIC 21 – Levies, an Interpretation on the accounting for levies
imposed by governments;
W 2010-2012 and 2011-2013 annual improvements.
The possible impact on the Consolidated Financial Statements of applying
these new and amended standards is currently being assessed.
1.3 USE OF ESTIMATES
Preparation of Consolidated Financial Statements involves the use of
management estimates and assumptions that may affect the reported
amounts of certain assets, liabilities, income and expenses, as well as the
disclosures contained in the notes. These estimates and assumptions are
reviewed at regular intervals to ensure that they are reasonable in light
of past experience and the current economic situation. Actual results
may differ from current estimates.
The main management estimates used in the preparation of the
Consolidated Financial Statements concern the useful lives of operating
assets, the recoverable amount of goodwill and other intangible assets
(Note 17) and property and equipment (Note 18), and the amount of
provisions for contingencies and other business-related provisions
(Note 29). The main assumptions concern pension and other post-
employment benefi t obligations (Note 30) and recognized deferred
taxes (Note 21).
IAS 32 requires the recognition of a fi nancial liability for put options written
over non-controlling interests (“NCI puts”). The Group has chosen to
apply a differentiated treatment depending on whether the puts were
written before or after the fi rst-time adoption of IAS 27R on January 1,
2010, as explained in Note 2 – Summary of signifi cant accounting policies
(paragraph “Put options written over non-controlling interests”).
NOTE 2 SUMMARY OF SIGNIFICANT ACCOUNTING POLICIES
The accounting policies described below have been applied consistently
in all periods presented in the Consolidated Financial Statements and
by all Group entities.
2.1 BASIS OF CONSOLIDATION
Companies over which the Group exercises exclusive control, directly
or indirectly, are fully consolidated. Control is the power to govern the
fi nancial and operating policies of an entity so as to obtain benefi ts from
its activities. The existence and effects of potential voting rights that are
currently exercisable or convertible are considered when assessing
whether control exists.
Investments in associates – defi ned as entities over which the Group
has signifi cant infl uence – and joint ventures are accounted for by the
equity method. This method consists of recognizing in the Consolidated
Financial Statements the Group’s share of the total profi ts and losses
recorded by the associate or joint venture as adjusted to comply with
Group accounting policies, for the period from the date when signifi cant
infl uence or joint control is acquired until the date when it is lost.
Investments in companies where the Group does not exercise control
or signifi cant infl uence over fi nancial and operating policy decisions are
reported under “Non-current fi nancial assets”. The accounting treatment
of these investments is described in the paragraph “Financial assets
and liabilities”.
Control over special purpose entities (SPEs), as defi ned in SIC 12, is
determined based on an assessment of whether the Group obtains the
majority of the benefi ts of the SPE and therefore may be exposed to
risks incident to the SPE’s activities.
An SPE is consolidated when the substance of the relationship between
the Group and the SPE indicates that the SPE is controlled by the Group.
This is considered to be the case, for example, when:
W in substance, the activities of the SPE are being conducted on behalf
of the Group according to its specifi c business needs so that the
Group obtains benefi ts from the SPE’s operations;
W in substance, the Group has the decision-making powers to obtain
the majority of the benefi ts of the SPE’s activities or, by setting up
an “autopilot” mechanism, the Group has delegated these decision-
making powers;
W in substance, the Group has rights to obtain the majority of the benefi ts
of the SPE and therefore may be exposed to risks incident to the
SPE’s activities;
W in substance, the Group retains the majority of the residual or ownership
risks related to the SPE or its assets in order to obtain benefi ts from
its activities.

2013 REGISTRATION DOCUMENT 143
CONSOLIDATED FINANCIAL STATEMENTS YEAR ENDED DECEMBER 31, 2013
5
Notes to the Consolidated Financial Statements
2.2 SEGMENT INFORMATION
IFRS 8 – Operating Segments requires the disclosure of information
about an entity’s operating segments extracted from the internal reporting
system and used by the entity’s chief operating decision-maker to make
decisions about resources to be allocated to the segment and assess
its performance. The Carrefour Group’s operating segments consist of
the countries in which it conducts its business through consolidated
stores, as each country’s results are reviewed monthly by the Group’s
Chief Executive Offi cer who is the chief operating decision-maker within
the meaning of IFRS 8.
Countries located in the same region are considered as having similar
characteristics and have been combined to create four geographical
segments, as allowed by IFRS 8.
W France;
W Rest of Europe: Spain, Italy, Belgium, Poland and Romania;
W Latin America: Brazil and Argentina;
W Asia: China and Taiwan.
Effective January 1, 2012, the income and expenses of certain support
entities are allocated to the various countries proportionately to the
services provided to each, with any unallocated revenue and expenses
reported under “Global functions”. In prior periods, these entities were
allocated to the geographical segment corresponding to the country
where they were located.
2.3 BUSINESS COMBINATIONS
At the IFRS transition date, the Group elected not to apply IFRS 3 to
business combinations carried out prior to that date, in line with the
option available to fi rst-time adopters under IFRS 1.
Whenever the Group acquires control of an entity or group of entities,
the identifi able assets acquired and liabilities assumed are recognized
and measured at fair value. The difference between the consideration
transferred (i.e. the acquisition cost) and the fair value of the identifi able
assets acquired, net of the liabilities and contingent liabilities assumed, is
recognized as goodwill. Goodwill is recorded directly in the statement of
fi nancial position of the acquired entity, in the entity’s functional currency.
Its recoverable amount is subsequently monitored at the level of the
cash-generating unit to which the entity belongs.
Since the adoption of IFRS 3 (revised) on January 1, 2010, the Group
applies the following principles:
W transaction costs are recorded directly as an operating expense for
the period in which they are incurred;
W for each business combination, the Group determines whether to
apply the full goodwill or partial goodwill method:
W the full goodwill method consists of measuring non-controlling
interests in the acquiree at fair value and allocating to these
interests part of the goodwill recognized at the time of the business
combination,
W under the partial goodwill method, non-controlling interests are
measured at their proportionate share of the acquiree’s identifi able
net assets and no goodwill is allocated to these interests;
W any contingent consideration is measured at its acquisition-date
fair value. Any subsequent change in fair value during the 12-month
measurement period is recognized by adjusting goodwill only if it
results from additional information about facts and circumstances
that existed at the acquisition date. If this criterion is not met or the
change in fair value arises after the measurement period, it is recorded
in other comprehensive income;
W for a business combination achieved in stages (step acquisition), when
control is acquired the previously held equity interest is remeasured
at fair value through profi t. In the case of a reduction in the Group’s
equity interest resulting in a loss of control, the remaining interest is
also remeasured at fair value through profi t;
W in the case of a bargain purchase, the gain is recognized immediately
in profi t;
W any acquisition or disposal of equity interests that does not result in
control being acquired or lost is treated as a transaction between
owners and recognized directly in shareholders’ equity in accordance
with IAS 27R.
For entities or additional equity interests acquired during the year, the
Group’s share or increased share of the entity’s profi t or loss for the
period from the transaction date is recognized in the consolidated income
statement. For entities sold or or for which control was lost during the
year, the Group’s share of the entity’s profi t or loss for the period up to
the transaction date is recognized in the consolidated income statement.
2.4 TRANSLATION OF THE FINANCIAL STATEMENTS OF FOREIGN OPERATIONS
The Consolidated Financial Statements are presented in euros.
An entity’s functional currency is the currency of the primary economic
environment in which the entity operates. The functional currency of
Group entities is the currency of their home country.
The fi nancial statements of entities whose functional currency is not the
euro and is not the currency of a hyperinfl ationary economy are translated
into euros as follows:
W assets and liabilities are translated at the period-end closing rate;
W income and expenses are translated at the weighted average exchange
rate for the period;
W all resulting exchange differences are recognized in other comprehensive
income and are taken into account in the calculation of any gain or
loss realized on the subsequent disposal of the foreign operation;
W items in the statement of cash fl ows are translated at the average
rate for the period unless the rate on the transaction date is materially
different.
No Group companies operated in a hyperinfl ationary economy in either
2012 or 2013.

2013 REGISTRATION DOCUMENT 144
5 CONSOLIDATED FINANCIAL STATEMENTS YEAR ENDED DECEMBER 31, 2013Notes to the Consolidated Financial Statements
2.5 TRANSLATION OF FOREIGN CURRENCY TRANSACTIONS
Transactions by Group entities in a currency other than their functional
currency are initially translated at the exchange rate on the transaction
date.
At each period-end, monetary assets and liabilities denominated in foreign
currency are translated at the period-end closing rate and the resulting
exchange gain or loss is recorded in the income statement.
Intra-group loans to certain foreign operations are treated as part of
the net investment in that operation if settlement of the loan is neither
planned nor likely to occur. The gains or losses arising from translation
of the loan at each successive period-end are recorded directly in other
comprehensive income in accordance with IAS 21.
2.6 INTANGIBLE ASSETS AND PROPERTY AND EQUIPMENT
2.6.1 Goodwill
In accordance with IAS 36 – Impairment of Assets, goodwill recognized
on business combinations is not amortized but is tested for impairment
every year, at December 31. Additional tests are performed at interim
period-ends when there is an indication that it may be impaired.
The main impairment indicators used by the Group are as follows:
W internal indicator: a material deterioration in the ratio of recurring
operating income before depreciation, amortization and provision
expense to net revenues excluding gasoline between the budget and
the most recent forecast;
W external indicators: a material increase in the discount rate and/or a
severe downgrade in the IMF’s GDP growth forecast.
Impairment losses recognized on goodwill are irreversible, including
those recorded at an interim period-end.
Impairment methods are described in Note 2.6.4 «Impairment tests».
2.6.2 Other intangible assets
Other intangible assets consist mainly of software, which is amortized
over periods ranging from one to eight years.
2.6.3 Property and equipment
In accordance with IAS 16 – Property, Plant and Equipment, land,
buildings and equipment are stated at cost less accumulated depreciation
and any accumulated impairment losses. Borrowing costs that are directly
attributable to the acquisition, construction or production of a qualifying
asset (defi ned in IAS 23 – Borrowing Costs as an asset that necessarily
takes a substantial period of time to get ready for its intended use or
sale), are capitalized as part of the cost of the asset.
Assets under construction are recognized at cost less any identifi ed
impairment losses.
Depreciation of property and equipment begins when the asset is available
for use and ends when the asset is sold, scrapped or reclassifi ed as
held for sale in accordance with IFRS 5.
Property and equipment, or each signifi cant part of an item of property or
equipment, are depreciated by the straight-line method over the following
estimated useful lives:
BuildingsBuildingSite improvementsCar parks
40 years10 years
6 years
Equipment, fi xtures and fi ttings 6 to 8 years
Other 4 to 10 years
In light of the nature of its business, the Group considers that its property
and equipment have no residual value.
Depreciation methods and periods are reviewed at each period-end
and, where appropriate, adjusted prospectively.
New long-term leases – particularly property leases – are analyzed to
determine whether they represent operating leases or fi nance leases,
i.e. leases that transfer substantially all the risks and rewards incidental
to ownership of the asset to the lessee. For property leases, the analysis
is performed separately for the land on the one hand and the building
on the other.
Finance leases are accounted for as follows:
W the leased assets are recognized in the statement of fi nancial position at
fair value or, if lower, the present value of the minimum lease payments.
They are depreciated over their useful life, in the same way as assets
owned outright, or, if shorter, over the lease term;
W the liability for the future lease payments is recognized in the statement
of fi nancial position under liabilities;
W lease payments are apportioned between the fi nance charge and the
reduction of the outstanding liability.
2.6.4 Impairment tests
In accordance with IAS 36 – Impairment of Assets, intangible assets and
property and equipment are tested for impairment whenever events or
changes in the market environment indicate that the recoverable amount
of an individual asset and/or a cash-generating unit (CGU) may be less
than its carrying amount. For assets with an indefi nite useful life – mainly
goodwill in the case of the Carrefour Group – the test is performed at
least once a year.
Individual assets or groups of assets are tested for impairment by
comparing their carrying amount to their recoverable amount, defi ned
as the higher of their fair value less costs of disposal and their value in
use. Value in use is the present value of the future cash fl ows expected
to be derived from the asset.

2013 REGISTRATION DOCUMENT 145
CONSOLIDATED FINANCIAL STATEMENTS YEAR ENDED DECEMBER 31, 2013
5
Notes to the Consolidated Financial Statements
If the recoverable amount is less than the carrying amount, an impairment
loss is recognized for the difference. Impairment losses on property and
equipment and intangible assets (other than goodwill) may be reversed
in future periods provided that the asset’s increased carrying amount
attributable to the reversal does not exceed the carrying amount that
would have been determined, net of depreciation or amortization, had no
impairment loss been recognized for the asset in prior years.
2.6.4.1 Impairment of intangible assets other than
goodwill and property and equipment
Impairment tests on property and equipment are performed at the level
of the individual stores, for all formats.
In accordance with IAS 36, intangible assets (other than goodwill)
and property and equipment are tested for impairment whenever there
is an indication that their recoverable amount may be less than their
carrying amount. All stores that report a recurring operating loss before
depreciation and amortization in two consecutive years (after the start-up
period) are tested. Intangible assets with an indefi nite useful life such as
brands are tested at least once a year.
Value in use is considered as being equal to the store’s discounted future
cash fl ows over a period of up to fi ve years plus a terminal value. Fair
value is estimated based on the prices of recent transactions, industry
practice, independent valuations or the estimated price at which the
store could be sold to a competitor.
The discount rate applied is the same as for impairment tests on goodwill.
2.6.4.2 Impairment of goodwill
IAS 36 – Impairment of Assets requires impairment tests to be performed
annually at the level of each CGU or group of CGUs to which the
goodwill is allocated.
According to the standard, goodwill is allocated to the CGU or group
of CGUs that is expected to benefi t from the synergies of the business
combination. Each unit or group of units to which the goodwill is so
allocated should represent the lowest level within the entity at which
the goodwill is monitored for internal management purposes and should
not be larger than an operating segment as defi ned in IFRS 8 before
aggregation.
For the purpose of analyzing the recoverable amount of goodwill, each
individual country is considered as representing a separate CGU. The
choice of this level is based on a combination of organizational and
strategic criteria:
W operations within each country (hypermarkets, supermarkets, etc.) use
shared resources (country-level centralized purchasing organization,
marketing systems, headquarters functions, etc.) that represent an
essential source of synergies between the various operations;
W decisions to dispose of business portfolios are generally made at
country level and it is rare for just a single store to be sold.
Value in use is considered as corresponding to the sum of discounted
future cash fl ows for a period generally not exceeding fi ve years, plus a
terminal value calculated by projecting data for the fi nal year to perpetuity
at a perpetual growth rate. A specifi c discount rate by country is used
for the calculation. Future cash fl ows are estimated based on the 3-year
business plan drawn up by country management and approved by Group
management.
The discount rate for each country corresponds to the weighted average
cost of equity and debt, determined using the median gearing rate for
the sector. Each country’s cost of equity is determined based on local
parameters (risk-free interest rate and market premium). The cost of debt
is determined by applying the same logic.
The main assumptions used for impairment testing purposes are
presented in Note 17.
2.7 FINANCIAL ASSETS AND LIABILITIES (EXCLUDING BANKING ACTIVITIES)
2.7.1 Non-derivative financial assets
2.7.1.1 Accounting policy
In accordance with IAS 39, the main fi nancial assets are classifi ed in
one of the following four categories:
W fi nancial assets at fair value through profi t or loss;
W loans and receivables;
W held-to-maturity investments;
W available-for-sale fi nancial assets.
The classifi cation of these assets determines their accounting treatment.
Classifi cation is determined by the Group upon initial recognition, based
on the type of asset and the purpose for which it was acquired. Purchases
and sales of fi nancial assets are recognized on the trade date, defi ned as
the date on which the Group is committed to buying or selling the asset.
Financial assets at fair value through profi t or loss
These are fi nancial assets held for trading, i.e. assets acquired principally
for the purpose of selling them at a profi t in the short term, or fi nancial
assets designated at the outset as at fair value through profi t or loss.
They are measured at fair value with changes in fair value recognized in
the income statement, under fi nancial income or expense.
Loans and receivables
Loans and receivables are non-derivative fi nancial assets with fi xed or
determinable payments that are not quoted in an active market and that
do not meet the criteria for classifi cation as either held for trading or
available for sale.

2013 REGISTRATION DOCUMENT 146
5 CONSOLIDATED FINANCIAL STATEMENTS YEAR ENDED DECEMBER 31, 2013Notes to the Consolidated Financial Statements
They are initially recognized at fair value and are subsequently measured at
amortized cost by the effective interest method. For short-term receivables
with no specifi ed interest rate, fair value is considered as being equal to
the original invoice amount.
These assets are tested for impairment when there is an indication that
their recoverable amount may be less than their carrying amount. If this
is found to be the case, an impairment loss is recorded.
This category includes receivables from non-consolidated companies,
other loans and receivables and trade receivables. They are reported
under “Other fi nancial assets” or “Trade receivables”.
Held-to-maturity investments
Held-to-maturity investments are non-derivative fi nancial assets other
than loans and receivables with fi xed or determinable payments and a
fi xed maturity that the Group has the positive intention and ability to hold
to maturity. They are initially recognized at fair value and are subsequently
measured at amortized cost by the effective interest method.
These assets are tested for impairment when there is an indication that
their recoverable amount may be less than their carrying amount. If this
is found to be the case, an impairment loss is recorded.
Held-to-maturity investments are reported under “Other fi nancial assets”.
The Group did not hold any assets classifi ed as held-to-maturity at
December 31, 2013 or December 31, 2012.
Available-for-sale fi nancial assets
Available-for-sale fi nancial assets are fi nancial assets that do not meet
the criteria for classifi cation in any of the other three categories. They
consist mainly of shares in non-consolidated companies.
Available-for-sale fi nancial assets are measured at fair value, with changes
in fair value recognized in other comprehensive income, under “Changes
in the fair value of available-for-sale fi nancial assets”. When the assets
are sold, the gains and losses accumulated in shareholders’ equity are
reclassifi ed to the income statement.
However, in the event of a prolonged or signifi cant fall in value of an
equity instrument or a decline in estimated cash fl ows from a debt
instrument, an impairment loss is recognized in the income statement.
If, in a subsequent period, the impairment loss decreases, the previously
recognized impairment loss is released:
W for equity instruments (equities and other): through other comprehensive
income;
W for debt instruments (bonds, notes and other) where an increase is
observed in estimated future cash fl ows: through profi t or loss for an
amount not exceeding the previously recognized impairment loss.
The fair value of listed securities corresponds to their market price.
For unlisted securities, fair value is determined by reference to recent
transactions or by using valuation techniques based on reliable and
observable market data. When it is impossible to obtain a reasonable
estimate of an asset’s fair value, it is measured at historical cost.
2.7.1.2 Non-derivative fi nancial assets held
by the Group
The main non-derivative fi nancial assets held by the Group are as follows:
Non-current fi nancial assets
This line item mainly comprises investments in non-consolidated
companies and long-term loans.
Trade receivables
Trade receivables include amounts receivable from suppliers and
franchisees and rent receivable from tenants of shopping mall units.
Impairment losses are recognized where necessary, based on an estimate
of the debtor’s ability to pay the amount due and the age of the receivable.
Current fi nancial assets
Current fi nancial assets consist mainly of available-for-sale fi nancial
assets, measured at fair value, and short-term loans and deposits.
Cash and cash equivalents
Cash equivalents are highly liquid investments with an original maturity of
less than three months that are readily convertible to a known amount of
cash and are subject to an insignifi cant risk of changes in value.
Cash includes cash on hand and demand deposits.
2.7.2 Non-derivative financial liabilities
2.7.2.1 Accounting policy
Non-derivative fi nancial liabilities are initially recognized at fair value plus
transaction costs and premiums directly attributable to their issue. They
are subsequently measured at amortized cost.
2.7.2.2 Non-derivative fi nancial liabilities held
by the Group
The main fi nancial liabilities held by the Group are as follows:
Borrowings
“Long-term borrowings” and “Short-term borrowings” include bonds and
notes issued by the Group, fi nance lease liabilities, other bank loans,
fi nancial liabilities for put options written over non-controlling interests
in subsidiaries, and fi nancial liabilities related to securitized receivables
for which the credit risk is retained by the Group.
Suppliers and other creditors
This line corresponds to trade payables.
Other payables
Other payables classifi ed in current liabilities correspond to all other
operating payables (mainly accrued employee benefi ts expense and
amounts due to suppliers of non-current assets) and miscellaneous
liabilities.

2013 REGISTRATION DOCUMENT 147
CONSOLIDATED FINANCIAL STATEMENTS YEAR ENDED DECEMBER 31, 2013
5
Notes to the Consolidated Financial Statements
2.7.2.3 Put options written over non-controlling
interests in subsidiaries (“NCI puts”)
The Group has written put options over certain non-controlling interests
in fully consolidated subsidiaries. The option exercise price may be fi xed
or it may be determined according to a predefi ned formula, and the
options may be exercisable at any time or on a fi xed date.
IAS 27R, which has been applied by the Group since January 1, 2010,
describes the accounting treatment of purchases of additional shares
in controlled subsidiaries. The Group has decided to apply two different
accounting methods to these puts, depending on whether they were
written before or after fi rst-time adoption of the amended standard.
NCI puts written prior to January 1, 2010: continued application of the partial goodwill method
W a fi nancial liability was recognized for NCI puts;
W the liability, initially recognized at the present value of the exercise price,
is remeasured at each period-end at the fair value of the shares that
would be purchased if the exercise price were to be based on fair value;
W the initial liability was recognized by recording a deduction from non-
controlling interests and, if necessary, goodwill;
W subsequent changes in the value of the liability are recognized by
adjusting non-controlling interests and goodwill (except for discounting
adjustments, which are recognized in fi nancial income and expense);
W “Income – Group share” continues to be calculated based on the
Group’s percent interest in the subsidiary, without taking into account
the percent interest represented by the NCI puts.
NCI puts written since January 1, 2010
IAS 27R stipulates that transactions in equity instruments with non-
controlling interest shareholders that do not result in a change of control
should be recognized by adjusting shareholders’ equity. The Group
therefore considers that the NCI puts written after the date of fi rst-
time adoption of the amended standard should only affect consolidated
shareholders’ equity. Accordingly:
W a fi nancial liability is recognized for NCI puts;
W the liability is initially recognized at the present value of the exercise
price and is subsequently measured at each period-end at the fair
value of the shares that would be purchased if the exercise price were
to be based on fair value;
W the initial liability is recognized by recording a deduction from non-
controlling interests and, if necessary, “Shareholders’ equity – Group
share”;
W subsequent changes in the value of the liability are recognized by
adjusting non-controlling interests and “Shareholders’ equity – Group
share” (except for discounting adjustments, which are recognized in
fi nancial income and expense);
W “Income – Group share” continues to be calculated based on the
Group’s percent interest in the subsidiary, without taking into account
the percent interest represented by the NCI puts.
2.7.3 Derivative financial instruments
The Group uses derivative fi nancial instruments to hedge its exposure
to risks arising in the course of business, mainly currency and interest
rate risks. Exceptionally, the risk of changes in the prices of certain
commodities – mainly diesel – may also be hedged.
Derivatives are initially recognized at fair value. They are subsequently
measured at fair value with the resulting unrealized gains and losses
recorded as explained below.
2.7.3.1 Derivatives designated as hedging
instruments
Hedge accounting is applied if, and only if, the following conditions
are met:
W at the inception of the hedge, there is formal designation and
documentation of the hedging relationship;
W the effectiveness of the hedge is demonstrated at inception.
The derivatives used by the Group may be qualifi ed as either cash fl ow
hedges or fair value hedges. The Group does not currently hedge its
net investment in foreign operations.
Cash fl ow hedges
For instruments qualifi ed as cash fl ow hedges, the portion of the change
in fair value determined to be an effective hedge is recognized directly in
other comprehensive income and accumulated in shareholders’ equity
until the hedged transaction affects profi t. The ineffective portion of
the change in fair value is recognized in the income statement, under
“Financial income and expense”.
The main cash fl ow hedges consist of interest rate swaps that convert
variable rate debt to fi xed rate, and forward purchases of foreign currencies
that hedge future goods purchases in foreign currency.
Fair value hedges
Changes in fair value of instruments qualifi ed as fair value hedges are
recognized in the income statement, with the effective portion offsetting
changes in the fair value of the hedged item.
Examples of fair value hedges include swaps set up at the time of issue
of fi xed rate bonds and notes. The hedged portion of the underlying
fi nancial liability is remeasured at fair value. Changes in fair value are
recognized in the income statement and are offset by the effective portion
of symmetrical changes in the fair value of the interest rate swaps.
2.7.3.2 Other derivative instruments
Other derivative instruments are measured at fair value, with changes
in fair value recognized in profi t or loss. Hedging instruments used by
the Group include interest rate swaps and vanilla interest rate options.

2013 REGISTRATION DOCUMENT 148
5 CONSOLIDATED FINANCIAL STATEMENTS YEAR ENDED DECEMBER 31, 2013Notes to the Consolidated Financial Statements
2.7.4 Fair value calculation method
The fair values of currency and interest rate instruments are determined
using market-recognized pricing models or prices quoted by external
fi nancial institutions.
Values estimated using pricing models are based on discounted future
cash fl ows for futures and forward contracts or, for options, the Black &
Scholes option pricing model. The models are calibrated using market
data such as yield curves and exchange rates obtained from recognized
fi nancial data services.
The fair value of long-term borrowings is estimated based on the quoted
market price for bonds and notes or the value of future cash fl ows
discounted at the interest rate for similar instruments (in terms of currency,
maturity, interest rate and other characteristics).
Fair value measurements of derivative fi nancial instruments incorporate
counterparty risk in the case of instruments with a positive fair value,
and own credit risk for instruments with a negative fair value. Credit risk
is measured using the mathematical models commonly used by market
analysts. At December 31, 2013, the effect of incorporating these two
types of risk was not material.
2.8 BANKING ACTIVITIES
To support its core retailing business, the Group offers banking and
insurance services to customers through Carrefour Banque and other
subsidiaries.
Due to its specifi c fi nancial structure, this secondary business is presented
separately in the Consolidated Financial Statements:
W consumer credit granted by the fi nancial services companies (payment
card receivables, personal loans, etc.) is presented in the statement
of fi nancial position under “Consumer credit granted by the fi nancial
services companies - long-term” and “Consumer credit granted by
the fi nancial services companies - short-term”, as appropriate;
W fi nancing for these loans is presented under “Consumer credit
fi nancing – long-term” and “Consumer credit fi nancing – short-term”,
as appropriate;
W the other assets and liabilities of the banking activities (property and
equipment, intangible assets, cash and cash equivalents, accrued
taxes and payroll costs, etc.) are presented on the corresponding
lines of the statement of fi nancial position;
W revenues from banking activities are reported in the income statement
under “Other revenue”;
W cash fl ows generated by banking activities are reported in the statement
of cash fl ows under “Change in consumer credit granted by the fi nancial
services companies”.
2.9 INVESTMENT PROPERTY
IAS 40 defi nes investment property as property (land or a building or
both) held to earn rentals or for capital appreciation or both. Based on this
defi nition, investment property held by the Group consists of shopping
malls (retail and service units located behind the stores’ check-out area)
that are exclusively or jointly owned and represent a surface area of at
least 2,500 sq. m.
Investment property is recognized at cost and is depreciated over the
same period as owner-occupied property.
The properties’ fair value is measured twice a year:
W by applying a multiple that is a function of (i) each shopping mall’s
profi tability and (ii) a country-specifi c capitalization rate, to the gross
annualized rental revenue generated by each property; or
W based on independent valuations performed using two methods, the
discounted cash fl ows method and the yield method. Valuers generally
also compare the results of applying these methods to market values
per square meter and to recent transaction values.
In view of the limited external data available, particularly concerning
capitalization rates, the complexity of the property valuation process and
the fact that valuations are based on passing rents for the Group’s own
properties, the fair value of investment property is considered as being
determined on the basis of level 3 inputs.
The fair value of investment property is presented in Note 19.
2.10 INVENTORIES
In accordance with IAS 2 – Inventories, goods inventories are measured
at the lower of cost and net realizable value.
Cost corresponds to the latest purchase price plus all related expenses.
This method is appropriate given the rapid inventory turnover, and the
resulting values are close to those obtained by the FIFO method. The
cost of inventories includes all components of the purchase cost of goods
sold (with the exception of exchange gains and losses) and takes into
account the purchasing terms negotiated with suppliers.
Net realizable value corresponds to the estimated selling price in the
ordinary course of business, less the estimated costs necessary to
make the sale.

2013 REGISTRATION DOCUMENT 149
CONSOLIDATED FINANCIAL STATEMENTS YEAR ENDED DECEMBER 31, 2013
5
Notes to the Consolidated Financial Statements
2.11 PROVISIONS
In accordance with IAS 37 - Provisions, Contingent Liabilities and
Contingent Assets, a provision is recorded when, at the period-end,
the Group has a present obligation (legal or constructive) as a result
of a past event, it is probable that an outfl ow of resources embodying
economic benefi ts will be required to settle the obligation, and a reliable
estimate can be made of the amount of the obligation. The amount of
the provision is estimated based on the nature of the obligation and the
most probable assumptions. Provisions are discounted when the effect
of the time value of money is material.
2.12 EMPLOYEE BENEFITS
Group employees receive short-term benefi ts (such as paid vacation, paid
sick leave, statutory profi t-sharing bonuses), long-term benefi ts (such as
long-service awards, seniority bonuses) and post-employment benefi ts
(such as length-of-service awards and supplementary pension benefi ts).
Post-employment benefi ts may be paid under defi ned contribution or
defi ned benefi t plans.
a) Defined contribution plans
Defi ned contribution plans are post-employment benefi t plans under
which the Group pays fi xed contributions into a separate entity that is
responsible for the plan’s administrative and fi nancial management as
well as for the payment of benefi ts, such that the Group has no obligation
to pay further contributions if the plan assets are insuffi cient. Examples
include government-sponsored pension schemes, defi ned contribution
supplementary pension plans and defi ned contribution pension funds.
The contributions are recorded as an expense for the period in which
they become due.
b) Defined benefit and long-term benefit plans
A liability is recognized for defi ned benefi t obligations that are determined
by reference to the plan participants’ years of service with the Group.
The defi ned benefi t obligation is calculated annually using the projected
unit credit method, taking into account actuarial assumptions concerning
future salary levels, retirement age, mortality and staff turnover rates.
The discount rate corresponds to the interest rate observed at the period-
end for investment grade corporate bonds with a maturity close to that
of the defi ned benefi t obligation. The calculations are performed by a
qualifi ed actuary.
c) Share-based payments
Two types of share-based payment plans have been set up for management
and selected employees – stock option plans and stock grant plans.
As allowed under IFRS 1, upon fi rst-time adoption of IFRS the Group
elected to apply IFRS 2 – Share-based Payment only to equity-settled
stock options granted after November 7, 2002 that had not yet vested
as of January 1, 2004. This had no impact on opening shareholders’
equity at January 1, 2004.
All subsequent share-based payment plans have been accounted for
in accordance with IFRS 2. As the plans are equity-settled, the benefi t
represented by the share-based payment is recorded in employee benefi ts
expense with a corresponding increase in shareholders’ equity. The
amount recorded in employee benefi ts expense corresponds to the
recognition over the vesting period of the benefi t’s fair value. Fair value is
the value determined using the Black & Scholes option pricing model at the
grant date in the case of options or the share price at the grant date in the
case of stock grants. In accordance with IFRS 2, performance conditions
that are not market conditions are not taken into account to estimate the
fair value of stock grants and stock options at the measurement date.
2.13 INCOME TAX EXPENSE
Income tax expense includes current taxes and deferred taxes.
Deferred taxes are calculated on all temporary differences between the
carrying amount of assets and liabilities and their tax basis (except in
the specifi c cases referred to in IAS 12).
They are measured at the tax rates that are expected to apply to the period
when the asset will be realized or the liability will be settled, based on
tax rates and tax laws that have been enacted or substantively enacted
by the end of the reporting period.
Deferred tax assets and liabilities are not discounted and are classifi ed
in the statement of fi nancial position under “Non-current assets” and
“Non-current liabilities”.
The recoverability of deferred tax assets is assessed separately for each
tax entity, based on business plan estimates of future taxable profi ts
and the amount of deferred tax liabilities at the period-end. A valuation
allowance is recorded to write down deferred tax assets whose recovery
is not considered probable.
The CVAE local business tax in France, which is assessed on the basis
of the value-added generated by the business, is reported under income
tax expense because the Group considers that it meets the defi nition of
a tax on income contained in IAS 12.

2013 REGISTRATION DOCUMENT 150
5 CONSOLIDATED FINANCIAL STATEMENTS YEAR ENDED DECEMBER 31, 2013Notes to the Consolidated Financial Statements
2.14 TREASURY STOCK
Treasury stock is recorded as a deduction from shareholders’ equity, at
cost. Gains and losses from sales of treasury stock (and the related tax
effect) are recorded directly in shareholders’ equity without affecting
income for the period.
2.15 NON-CURRENT ASSETS AND DISPOSAL GROUPS HELD FOR SALE AND DISCONTINUED OPERATIONS
A discontinued operation is a component of an entity that has been either
disposed of or classifi ed as held for sale, and:
W represents a separate major line of business or geographical area
of operations; and
W is part of a single coordinated plan to dispose of a separate major line
of business or geographical area of operations; or
W is a subsidiary acquired exclusively with a view to resale.
It is classifi ed as a discontinued operation at the time of sale or earlier if its
assets and liabilities meet the criteria for classifi cation as «held for sale».
When a component of an entity is classifi ed as a discontinued operation,
comparative income statement and cash fl ow information are restated
as if the entity had met the criteria for classifi cation as a discontinued
operation on the fi rst day of the comparative period.
In addition, all the assets and liabilities of the discontinued operation are
presented on separate lines on each side of the statement of fi nancial
position, for the amounts at which they would be reported at the time of
sale after eliminating intra-group items.
2.16 NET SALES NET OF LOYALTY PROGRAM COSTS
Net sales correspond exclusively to sales realized in the Group’s stores
and cash and carry outlets.
In accordance with IFRIC 13 – Customer Loyalty Programmes, which
describes the accounting treatment of loyalty award credits granted to
customers as part of a sales transaction, award credits are considered
as a separately identifi able component of the sales transaction and are
deducted from the amount of the sale at fair value.
2.17 OTHER REVENUE
Other revenue, corresponding mainly to sales of fi nancial services and
travel, rental revenues and franchise fees, is reported on a separate line
below «Net sales» in the income statement.
Financial services revenues correspond mainly to bank card fees and
arranging fees for traditional and revolving credit facilities, which are
recognized over the life of the contract.
2.18 GROSS MARGIN FROM RECURRING OPERATIONS
Gross margin from recurring operations corresponds to the sum of net
sales and other revenue less cost of sales as defi ned in Note 8.
2.19 RECURRING OPERATING INCOME
Recurring operating income corresponds to gross margin from
recurring operations less sales, general and administrative expenses
and depreciation, amortization and provisions.
2.20 NON-RECURRING INCOME AND EXPENSES
In accordance with the recommendation of the French accounting
authorities (Autorité des Normes Comptables recommendation 2013-
03 dated November 7, 2013), non-recurring income and expenses are
reported on a separate line of the income statement. Non-recurring
items are defi ned as “items that are limited in number, clearly identifi able
and non-recurring that have a material impact on consolidated results”.
This classifi cation is applied to certain material items of income and
expense that are unusual in terms of their nature and frequency, such as
impairment charges, restructuring costs and provision charges recorded
to refl ect revised estimates of risks provided for or that arose in prior
periods, based on information that came to the Group’s attention during
the reporting year.
They are presented separately in the income statement to “help users
of the fi nancial statements to better understand the Group’s underlying
operating performance and provide them with useful information to assess
the earnings outlook”.
2013 REGISTRATION DOCUMENT 151
CONSOLIDATED FINANCIAL STATEMENTS YEAR ENDED DECEMBER 31, 2013
5
Notes to the Consolidated Financial Statements
2.21 EARNINGS PER SHARE
Basic earnings per share is calculated by dividing consolidated income
– Group share by the weighted average number of shares outstanding
during the period. Treasury stock is not considered as being outstanding
and is therefore deducted from the number of shares used for the
calculation. Contingently issuable shares are treated as outstanding
and included in the calculation only from the date when all necessary
conditions are satisfi ed.
Diluted earnings per share is calculated by adjusting consolidated income
– Group share and the weighted average number of shares outstanding
for the effects of all dilutive potential ordinary shares (if any). Dilutive
potential ordinary shares correspond mainly to convertible bonds and
employee stock options. Stock options are considered as potentially
dilutive if they are in the money (based on the sum of the exercise price
and the fair value of the services rendered by the grantee, in accordance
with IFRS 2 – Share-based Payment). Stock grants are considered as
potentially dilutive if the vesting conditions have been fulfi lled.
NOTE 3 SIGNIFICANT EVENTS OF THE YEAR
3.1 REORGANIZATION OF THE PARTNERSHIP IN TURKEY
On April 30, 2013, Carrefour announced that it had reached an agreement
with its Turkish partner Sabanci Holding to reorganize the governance
of their joint venture, Carrefour SA .
Under the terms of the agreement, Sabanci Holding will become the
majority shareholder by acquiring an additional 12% of the capital of
Carrefour SA from Carrefour Group for a total consideration of TRY
141 million (approximately €60 million), while Carrefour will retain a 46.2%
stake, allowing it to exercise signifi cant infl uence over the joint venture.
Following the lifting of all the conditions precedent, including approval
of Carrefour SA ’s new bylaws by Turkey’s securities regulator (CMB) on
July 2, 2013, the sale of part of Carrefour’s stake in Carrefour SA was
completed on July 25, 2013.
In accordance with IAS 27, as the transaction resulted in the loss of
control of Carrefour SA , it has been treated in the Consolidated Financial
Statements as the sale of the total pre-transaction interest (58.2%)
followed by the purchase of the post-transaction interest (46.2%),
accounted for at fair value by the equity method.
After taking into account the €81 million in negative cumulative exchange
differences recycled to the income statement, the loss of control led
to the recognition of a loss of approximately €41 million in the income
statement, on the line “Net income from discontinued operations”.
In accordance with IFRS 5, the following reclassifi cations have been
made in the fi nancial statements at December 31, 2013:
W Carrefour SA ’s results up to the date when control was lost have been
presented under “Net income from discontinued operations” with the
portion attributable to non-controlling interests shown separately in
accordance with IAS 27. To permit period-on-period comparisons,
Carrefour SA ’s 2012 results have been presented on the same basis;
W in the statement of cash fl ows, all of the Turkish entity’s cash fl ows for
2013 are presented on the lines “Impact of discontinued operations”,
with 2012 cash fl ows reclassifi ed accordingly.
3.2 REORGANIZATION OF THE PARTNERSHIP WITH MAJID AL FUTTAIM
On May 22, 2013, Carrefour announced that it was selling its 25%
stake in Majid Al Futtaim Hypermarkets to its partner, Majid Al Futtaim
Holding, for €530 million. At the same time, the exclusive partnership
agreement with the Carrefour Group is being rolled over until 2025 and
extended to include new formats and new countries.
The transaction was completed on June 23, 2013, after being approved
by the relevant authorities, leading to the recognition of a €426 million
disposal gain in non-recurring income. Majid Al Futtaim Hypermarkets
was accounted for by the equity method up to the completion date.
3.3 BOND BUYBACKS
On June 5, 2013, Carrefour announced that it was launching a
€1,350 million bond buyback program. The three issues concerned
were as follows:
W €1,500 million 5.125% issue due October 2014;
W €1,000 million 5.375% issue due June 2015;
W €1,100 million 4.375% issue due November 2016.
The offer closed on June 12 and on June 18, the Group bought back
€1,293.7 million worth of bonds (excluding accrued interest), as follows:
W €601 million worth of 5.125% bonds due October 2014;
W €356.1 million worth of 5.375% bonds due June 2015;
W €336.6 million worth of 4.375% bonds due November 2016.
The cost of the buyback program, reported in fi nancial expense, amounted
to €119 million.

2013 REGISTRATION DOCUMENT 152
5 CONSOLIDATED FINANCIAL STATEMENTS YEAR ENDED DECEMBER 31, 2013Notes to the Consolidated Financial Statements
3.4 DISPOSAL OF OPERATIONS IN INDONESIA
At the end of November 2012, Carrefour announced the sale of its 60%
stake in Carrefour Indonesia to its local partner, CT Corp, which has
become Carrefour’s exclusive franchisee in this country. The sale was
agreed at a price of €525 million.
The transaction was completed on January 16, 2013 and the €396 million
capital gain has therefore been reported in the 2013 income statement,
on the line “Net income from discontinued operations”.
3.5 2012 DIVIDEND REINVESTMENT OPTION
At the Annual General Meeting held on April 23, 2013, shareholders
decided to set the 2012 dividend at €0.58 per share with an option to
receive the dividend in shares.
The issue price of the new shares was set at €19.62 per share,
representing 95% of the average of the opening prices quoted on NYSE
Euronext Paris during the 20 trading days preceding the date of the
Annual General Meeting, less the net amount of the dividend of €0.58
per share and rounded up to the nearest euro cent.
The option period was open from May 2 to 23, 2013. At the end of this
period, shareholders owning 72.06% of Carrefour’s shares had elected
to reinvest their 2012 dividends.
June 7, 2013 was set as the date for:
W settlement/delivery of the 14,769,539 new shares corresponding to
reinvested dividends, leading to a total capital increase of €290 million;
W payment of the cash dividend to shareholders who chose not to reinvest
their dividends, representing a total payout of €108 million.
3.6 CREATION OF A COMPANY FOR SHOPPING MALLS ADJOINING THE GROUP’S HYPERMARKETS IN EUROPE
On December 16, 2013, Carrefour announced that it had signed a
memorandum of understanding with Klépierre for the purchase of 127
shopping malls.
The project will lead to the creation of a company that will include 172
shopping malls originating from:
W fi rstly, the acquisition from Klepierre for €2.0 billion of 127 sites in
France, Spain and Italy with gross annual rental income of around
€135 million;
W secondly, the contribution by Carrefour of 45 shopping malls in France
with a value of €0.7 billion and gross annual rental income of around
€45 million.
The company will be fi nanced through €1.8 billion in equity, 42% held
by Carrefour with the remainder held by institutional investors, as well
as through €900 million in debt.
The parties reached a fi nal agreement on January 24, 2014. The transaction
is still subject to the approval of the relevant regulatory authorities. It will
be submitted for consultation to employee representative bodies and
should close in the fi rst half of 2014.
At December 31, 2013, the properties at the 45 sites concerned were
reclassifi ed as held for sale, in accordance with IFRS 5 – Non-current
Assets Held for Sale and Discontinued Operations.
In 2014, in application of the consolidation standards applicable as
from that year (IFRS 10, IFRS 11 and IAS 28R), the new company will
be accounted for by the equity method as it will be jointly controlled by
Carrefour and its co-investors.

2013 REGISTRATION DOCUMENT 153
CONSOLIDATED FINANCIAL STATEMENTS YEAR ENDED DECEMBER 31, 2013
5
Notes to the Consolidated Financial Statements
4.1 REORGANISATION OF OPERATIONS
Details of the reorganization of operations in Turkey and its impact on the Consolidated Financial Statements at December 31, 2013 are presented
in Note 3.1.
In India, the Group has entered into discussions with a potential partner.
NOTE 4 RESTATEMENT OF COMPARATIVE INFORMATION
Key consolidated fi gures for entities classifi ed as held for sale in 2013 and 2012 in accordance with IFRS 5 are as follows:
(in € millions) 2013 (1) 2012
Net sales 620 1,115
Gross margin from recurring operations 145 266
Recurring operating loss (20) (6)
Operating loss (35) (9)
Loss before taxes (36) (12)
Income taxes 3 0
Net loss (34) (12)
(1) The 2013 amounts include results in Turkey up to July 25, 2013, the date on which control was lost.
4.2 EFFECT OF APPLYING IAS 19R
The amendments to IAS 19 – Employee Benefits are applicable for annual
periods beginning on or after January 1, 2013 and, in accordance with
IAS 19R’s transitional provisions, retrospectively to all periods presented.
Restated fi nancial statements and notes have therefore been prepared
at December 31, 2012 and for the year then ended.
The main effects of retrospectively applying IAS 19R resulted from the
elimination of the corridor method and the fact that it is no longer possible
to defer recognition of past service costs. They consisted primarily of a
reduction in shareholders’ equity (€172 million at January 1, 2012 and
€314 million at December 31, 2012, net of the deferred tax credit), due
for the most part to an increase in provisions for pensions and length-
of-service awards payable to employees on retirement (€266 million at
January 1, 2012 and €475 million at December 31, 2012).
4.3 RECLASSIFICATION IN THE CONSOLIDATED STATEMENT OF CASH FLOWS
Up to now, fi nance cost, net was reported under “Cash fl ows from
operating activities”. IAS 7 (paragraph 33) offers the alternative of
classifying the components of fi nance cost, net as fi nancing cash fl ows,
in the same way as the issuance and repayment of bonds and other
changes in borrowings.
The Group considers that this presentation is more appropriate in view of
the nature of these cash fl ows. Consequently, fi nance cost, net has been
reclassifi ed as “Cash fl ows from fi nancing activities” in the statement of
cash fl ows for both 2013 and 2012.

2013 REGISTRATION DOCUMENT 154
5 CONSOLIDATED FINANCIAL STATEMENTS YEAR ENDED DECEMBER 31, 2013Notes to the Consolidated Financial Statements
4.4 IMPACT ON THE 2012 FINANCIAL STATEMENTS
4.4.1 Impact on the 2012 income statement and 2012 statement of cash flows
INCOME STATEMENT FOR THE YEAR ENDED DECEMBER 31, 2012
(in € millions)
2012 reported
IFRS 5 reclassifi cations IAS 19R
2012 restated
Net sales 76,789 (1,115) 0 75,673
Loyalty program costs (662) 10 0 (653)
Net sales net of loyalty program costs 76,127 (1,106) 0 75,021
Other revenue 2,333 (24) 0 2,309
Total revenue 78,460 (1,130) 0 77,330
Cost of sales (61,523) 864 0 (60,659)
Gross margin from recurring operations 16,937 (266) 0 16,671
Sales, general and administrative expenses (13,249) 242 (22) (13,028)
Depreciation, amortization and provisions (1,548) 30 0 (1,518)
Recurring operating income 2,140 6 (22) 2,124
Non-recurring income and expenses, net (707) 2 45 (660)
Operating income 1,434 9 23 1,465
Finance costs and other fi nancial income and expenses, net (882) 4 (5) (883)
Income before taxes 552 12 18 581
Income tax expense (388) (0) 8 (380)
Net income from companies accounted for by the equity method 72 0 0 72
Net income from continuing operations 235 12 26 273
Net income from discontinued operations 1,081 (12) 0 1,069
Net income for the year 1,316 0 26 1,342
Group share 1,233 0 26 1,259
of which net income from continuing operations 113 11 26 150
of which net income from discontinued operations 1,120 (11) 0 1,109
Attributable to non-controlling interests 83 0 (0) 83
Net income for the year 1,316 0 26 1,342
Effective portion of changes in the fair value of cash fl ow hedges 6 6
Changes in the fair value of available-for-sale fi nancial assets 7 7
Exchange differences on translating foreign operations (192) (192)
Items that may be reclassifi ed subsequently to profi t or loss (180) 0 0 (180)
Unrecognized actuarial gains and losses on defi ned benefi t plans 0 (168) (168)
Items that will not be reclassifi ed to profi t or loss 0 0 (168) (168)
TOTAL COMPREHENSIVE INCOME 1,136 0 (142) 994
Group share 1,061 (139) 923
Attributable to non-controlling interests 75 (3) 72
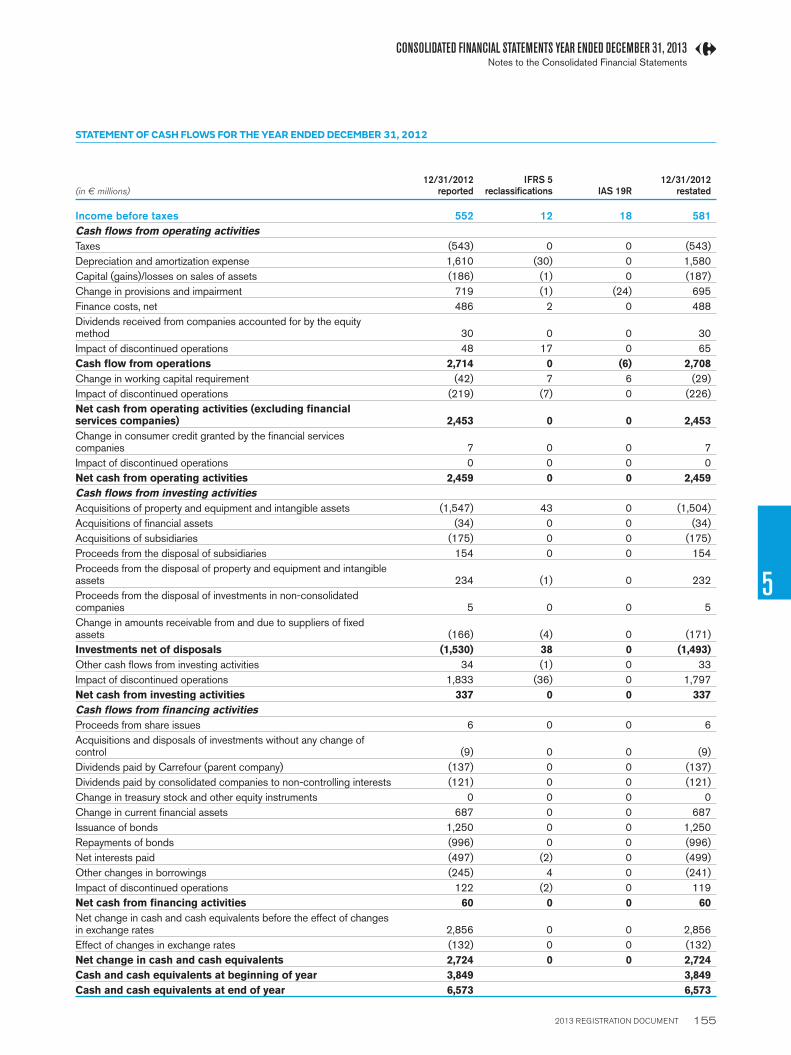
2013 REGISTRATION DOCUMENT 155
CONSOLIDATED FINANCIAL STATEMENTS YEAR ENDED DECEMBER 31, 2013
5
Notes to the Consolidated Financial Statements
STATEMENT OF CASH FLOWS FOR THE YEAR ENDED DECEMBER 31, 2012
(in € millions)
12/31/2012reported
IFRS 5 reclassifi cations IAS 19R
12/31/2012restated
Income before taxes 552 12 18 581
Cash fl ows from operating activities
Taxes (543) 0 0 (543)
Depreciation and amortization expense 1,610 (30) 0 1,580
Capital (gains)/losses on sales of assets (186) (1) 0 (187)
Change in provisions and impairment 719 (1) (24) 695
Finance costs, net 486 2 0 488
Dividends received from companies accounted for by the equity method 30 0 0 30
Impact of discontinued operations 48 17 0 65
Cash fl ow from operations 2,714 0 (6) 2,708
Change in working capital requirement (42) 7 6 (29)
Impact of discontinued operations (219) (7) 0 (226)
Net cash from operating activities (excluding fi nancial services companies) 2,453 0 0 2,453
Change in consumer credit granted by the fi nancial services companies 7 0 0 7
Impact of discontinued operations 0 0 0 0
Net cash from operating activities 2,459 0 0 2,459
Cash fl ows from investing activities
Acquisitions of property and equipment and intangible assets (1,547) 43 0 (1,504)
Acquisitions of fi nancial assets (34) 0 0 (34)
Acquisitions of subsidiaries (175) 0 0 (175)
Proceeds from the disposal of subsidiaries 154 0 0 154
Proceeds from the disposal of property and equipment and intangible assets 234 (1) 0 232
Proceeds from the disposal of investments in non-consolidated companies 5 0 0 5
Change in amounts receivable from and due to suppliers of fi xed assets (166) (4) 0 (171)
Investments net of disposals (1,530) 38 0 (1,493)
Other cash fl ows from investing activities 34 (1) 0 33
Impact of discontinued operations 1,833 (36) 0 1,797
Net cash from investing activities 337 0 0 337
Cash fl ows from fi nancing activities
Proceeds from share issues 6 0 0 6
Acquisitions and disposals of investments without any change of control (9) 0 0 (9)
Dividends paid by Carrefour (parent company) (137) 0 0 (137)
Dividends paid by consolidated companies to non-controlling interests (121) 0 0 (121)
Change in treasury stock and other equity instruments 0 0 0 0
Change in current fi nancial assets 687 0 0 687
Issuance of bonds 1,250 0 0 1,250
Repayments of bonds (996) 0 0 (996)
Net interests paid (497) (2) 0 (499)
Other changes in borrowings (245) 4 0 (241)
Impact of discontinued operations 122 (2) 0 119
Net cash from fi nancing activities 60 0 0 60
Net change in cash and cash equivalents before the effect of changes in exchange rates 2,856 0 0 2,856
Effect of changes in exchange rates (132) 0 0 (132)
Net change in cash and cash equivalents 2,724 0 0 2,724
Cash and cash equivalents at beginning of year 3,849 3,849
Cash and cash equivalents at end of year 6,573 6,573
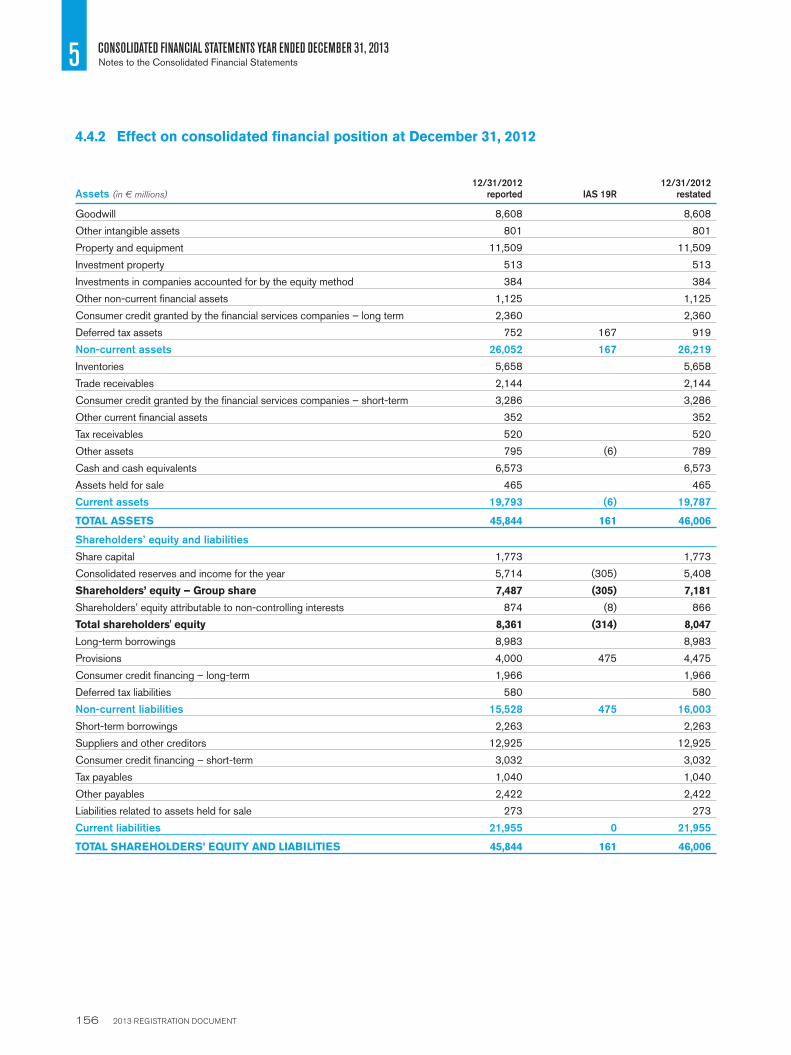
2013 REGISTRATION DOCUMENT 156
5 CONSOLIDATED FINANCIAL STATEMENTS YEAR ENDED DECEMBER 31, 2013Notes to the Consolidated Financial Statements
4.4.2 Effect on consolidated financial position at December 31, 2012
Assets (in € millions)
12/31/2012reported IAS 19R
12/31/2012restated
Goodwill 8,608 8,608
Other intangible assets 801 801
Property and equipment 11,509 11,509
Investment property 513 513
Investments in companies accounted for by the equity method 384 384
Other non-current fi nancial assets 1,125 1,125
Consumer credit granted by the fi nancial services companies – long term 2,360 2,360
Deferred tax assets 752 167 919
Non-current assets 26,052 167 26,219
Inventories 5,658 5,658
Trade receivables 2,144 2,144
Consumer credit granted by the fi nancial services companies – short-term 3,286 3,286
Other current fi nancial assets 352 352
Tax receivables 520 520
Other assets 795 (6) 789
Cash and cash equivalents 6,573 6,573
Assets held for sale 465 465
Current assets 19,793 (6) 19,787
TOTAL ASSETS 45,844 161 46,006
Shareholders’ equity and liabilities
Share capital 1,773 1,773
Consolidated reserves and income for the year 5,714 (305) 5,408
Shareholders’ equity – Group share 7,487 (305) 7,181
Shareholders’ equity attributable to non-controlling interests 874 (8) 866
Total shareholders' equity 8,361 (314) 8,047
Long-term borrowings 8,983 8,983
Provisions 4,000 475 4,475
Consumer credit fi nancing – long-term 1,966 1,966
Deferred tax liabilities 580 580
Non-current liabilities 15,528 475 16,003
Short-term borrowings 2,263 2,263
Suppliers and other creditors 12,925 12,925
Consumer credit fi nancing – short-term 3,032 3,032
Tax payables 1,040 1,040
Other payables 2,422 2,422
Liabilities related to assets held for sale 273 273
Current liabilities 21,955 0 21,955
TOTAL SHAREHOLDERS’ EQUITY AND LIABILITIES 45,844 161 46,006
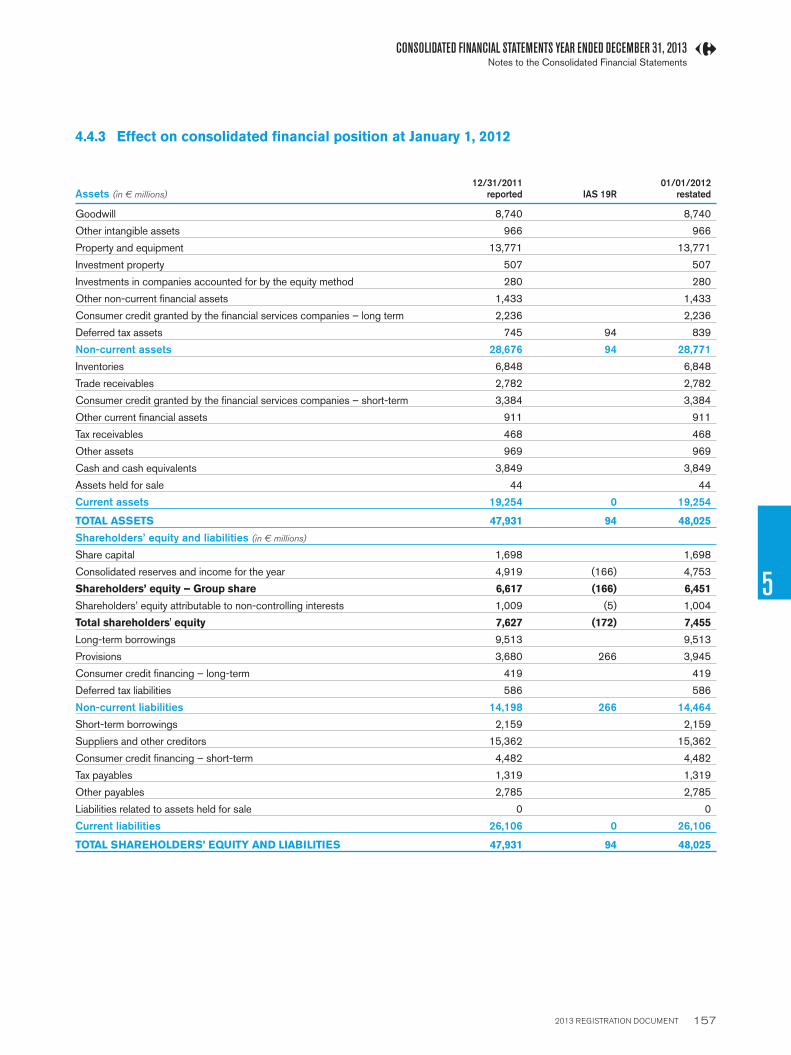
2013 REGISTRATION DOCUMENT 157
CONSOLIDATED FINANCIAL STATEMENTS YEAR ENDED DECEMBER 31, 2013
5
Notes to the Consolidated Financial Statements
4.4.3 Effect on consolidated financial position at January 1, 2012
Assets (in € millions)
12/31/2011reported IAS 19R
01/01/2012restated
Goodwill 8,740 8,740
Other intangible assets 966 966
Property and equipment 13,771 13,771
Investment property 507 507
Investments in companies accounted for by the equity method 280 280
Other non-current fi nancial assets 1,433 1,433
Consumer credit granted by the fi nancial services companies – long term 2,236 2,236
Deferred tax assets 745 94 839
Non-current assets 28,676 94 28,771
Inventories 6,848 6,848
Trade receivables 2,782 2,782
Consumer credit granted by the fi nancial services companies – short-term 3,384 3,384
Other current fi nancial assets 911 911
Tax receivables 468 468
Other assets 969 969
Cash and cash equivalents 3,849 3,849
Assets held for sale 44 44
Current assets 19,254 0 19,254
TOTAL ASSETS 47,931 94 48,025
Shareholders’ equity and liabilities (in € millions)
Share capital 1,698 1,698
Consolidated reserves and income for the year 4,919 (166) 4,753
Shareholders’ equity – Group share 6,617 (166) 6,451
Shareholders’ equity attributable to non-controlling interests 1,009 (5) 1,004
Total shareholders' equity 7,627 (172) 7,455
Long-term borrowings 9,513 9,513
Provisions 3,680 266 3,945
Consumer credit fi nancing – long-term 419 419
Deferred tax liabilities 586 586
Non-current liabilities 14,198 266 14,464
Short-term borrowings 2,159 2,159
Suppliers and other creditors 15,362 15,362
Consumer credit fi nancing – short-term 4,482 4,482
Tax payables 1,319 1,319
Other payables 2,785 2,785
Liabilities related to assets held for sale 0 0
Current liabilities 26,106 0 26,106
TOTAL SHAREHOLDERS’ EQUITY AND LIABILITIES 47,931 94 48,025

2013 REGISTRATION DOCUMENT 158
5 CONSOLIDATED FINANCIAL STATEMENTS YEAR ENDED DECEMBER 31, 2013Notes to the Consolidated Financial Statements
The Group’s operating segments consist of the countries in which it does business, combined by region, and “Global functions” corresponding to
the holding companies and other support entities.
5.1 SEGMENT RESULTS
2013 (in € millions) Total France Europe Latin America AsiaGlobal
Functions
Net sales 74,888 35,438 19,220 13,786 6,443
Other revenue 2,375 968 555 520 267 65
Recurring operating income 2,238 1,198 388 627 131 (106)
Operating income 2,382
Finance costs and other fi nancial income and expenses, net (722)
Income before taxes 1,660
NET INCOME FOR THE YEAR 1,364
Capital expenditure (1) 2,159 997 409 457 261 35
Depreciation and amortization expense (1,426) (622) (393) (187) (184) (39)
(1) Capital expenditure corresponds to the acquisitions of property and equipment and intangible assets reported in the statement of cash fl ows.
2012 (in € millions) Total France Europe Latin America AsiaGlobal
Functions
Net sales 75,673 35,341 19,786 14,174 6,373
Other revenue 2,309 911 539 528 262 69
Recurring operating income 2,124 922 503 608 179 (87)
Operating income 1,465
Finance costs and other fi nancial income and expenses, net (883)
Income before taxes 581
NET INCOME FOR THE YEAR 1,342
Capital expenditure (1) 1,504 602 309 308 251 35
Depreciation and amortization expense (1,494) (620) (428) (219) (185) (43)
(1) Capital expenditure corresponds to the acquisitions of property and equipment and intangible assets reported in the statement of cash fl ows.
NOTE 5 SEGMENT INFORMATION

2013 REGISTRATION DOCUMENT 159
CONSOLIDATED FINANCIAL STATEMENTS YEAR ENDED DECEMBER 31, 2013
5
Notes to the Consolidated Financial Statements
5.2 SEGMENT ASSETS AND LIABILITIES
December 31, 2013 (in € millions) Total France Europe Latin America Asia Global functions
Assets
Goodwill 8,277 4,394 3,082 705 95 1
Other intangible assets 767 307 288 90 9 73
Property and equipment 11,109 4,357 3,485 2,082 1,151 34
Investment property 313 8 207 43 54
Other segment assets (2 ) 15,311 6,962 4,226 2,695 907 521
Total segment assets 35,777 16,028 11,288 5,616 2,216 629
Unallocated assets 7,990
Total assets 43,766
Liabilities (excluding equity)
Segment liabilities (3 ) 21,774 10,782 4,913 3,295 2,227 558
Unallocated liabilities 13,395
TOTAL 35,169
(2 ) Other segment assets consist of inventories, trade receivables, consumer credit granted by the fi nancial services companies and other receivables.
(3 ) Segment liabilities comprise suppliers and other creditors, consumer credit fi nancing and other payables.
December 31, 2012 (in € millions) Total France Europe Latin America Asia Global functions
ACTIF
Goodwill 8,608 4,337 3,256 880 99 35
Other intangible assets 801 314 289 118 8 73
Property and equipment 11,509 4,203 3,820 2,306 1,142 37
Investment property 513 145 280 33 54
Other segment assets (2 ) 14,756 6,424 4,188 2,884 817 444
Total segment assets 36,187 15,422 11,833 6,222 2,120 590
Unallocated assets 9,819
Total assets 46,006
Liabilities (excluding equity)
Segment liabilities (3 ) 21,385 9,998 5,236 3,578 2,083 490
Unallocated liabilities 16,574
TOTAL 37,958
(2 ) Other segment assets consist of inventories, trade receivables, consumer credit granted by the fi nancial services companies and other receivables.
(3 ) Segment liabilities comprise suppliers and other creditors, consumer credit fi nancing and other payables.

2013 REGISTRATION DOCUMENT 160
5 CONSOLIDATED FINANCIAL STATEMENTS YEAR ENDED DECEMBER 31, 2013Notes to the Consolidated Financial Statements
Excluding the currency effect, 2013 net sales amounted to €77,214 million versus €75,673 million the previous year, an increase of 2.0%.
Changes in exchange rates reduced net sales by €2,326 million in 2013, refl ecting negative effects of €2,232 million in the Latin America segment
and €96 million in Asia, partly offset by a positive effect of €2 million in the Rest of Europe segment.
(in € millions) 2013 2012 % change
Net sales 74,888 75,673 -1.0%
NET SALES BY COUNTRY
(in € millions) 2013 2012
France 35,438 35,341
Rest of Europe 19,220 19,786
Spain 7,798 7,975
Italy 4,771 5,103
Belgium 3,968 3,913
Poland 1,677 1,809
Romania 1,006 986
Latin America 13,786 14,174
Brazil 10,855 11,273
Argentina 2,930 2,901
Asia 6,443 6,373
China 4,990 4,838
Taiwan 1,453 1,535
NOTE 6 NET SALES
NOTE 7 OTHER REVENUE BY NATURE
(in € millions) 2013 2012 % change
Financing fees and commissions (1) 1,384 1,331 4.0%
Rental revenue 247 245 0.5%
Revenue from sub-leases 235 232 1.1%
Other revenue 510 500 2.0%
TOTAL 2,375 2,309 2.9%
(1) Revenue generated by the fi nancial services companies.
The amounts reported on the line «Other revenue» in the above table correspond mainly to franchise fees, business lease fees and related revenue.

2013 REGISTRATION DOCUMENT 161
CONSOLIDATED FINANCIAL STATEMENTS YEAR ENDED DECEMBER 31, 2013
5
Notes to the Consolidated Financial Statements
Cost of sales comprises purchase costs, changes in inventory, the cost of products sold by the fi nancial services companies, discounting revenue
and exchange gains and losses on goods purchases.
NOTE 8 COST OF SALES
NOTE 9 SALES, GENERAL AND ADMINISTRATIVE EXPENSES
(in € millions) 2013 2012 % change
Employee benefi ts expense (7,679) (7,475) 2.7%
Property rentals (905) (893) 1.4%
Maintenance and repair costs (697) (693) 0.6%
Fees (771) (788) (2.1%)
Advertising expense (856) (887) (3.4%)
Taxes other than on income (545) (512) 6.5%
Energy and electricity (631) (642) (1.7%)
Other (1,093) (1,139) (4.1%)
TOTAL (13,178) (13,028) 1.1%
NOTE 10 DEPRECIATION AND AMORTIZATION
(in € millions) 2013 2012 % change
Depreciation (1,199) (1,245) (3.7%)
Amortization (180) (202) (10.9%)
Depreciation – fi nance leases (30) (33) (7.4%)
Depreciation – investment property (17) (15) 8.4%
Provision expense, net (6) (24) (73.5%)
TOTAL (1,432) (1,518) (5.7%)

2013 REGISTRATION DOCUMENT 162
5 CONSOLIDATED FINANCIAL STATEMENTS YEAR ENDED DECEMBER 31, 2013Notes to the Consolidated Financial Statements
Non-recurring income and expenses correspond to certain material items that are unusual in terms of their nature and frequency, such as impairment
charges, restructuring costs and provision charges recorded to refl ect revised estimates of risks provided for or that arose in prior periods, based
on information that came to the Group’s attention during the reporting year.
NOTE 11 NON-RECURRING INCOME AND EXPENSES
11.1 NET GAINS ON SALES OF ASSETS
In 2013, the Group sold its 25% interest in Majid Al Futtaim Hypermarkets,
realizing a capital gain of €426 million.
In 2012, the Group sold its 50% interest in Altis (and its subsidiaries)
to Eroski, realizing a pre-tax gain of €111 million. Other asset sales
during the period, mainly in France, generated total gains of €123 million.
11.2 RESTRUCTURING COSTS
The fi nal cost of the voluntary separation plan carried out between
January and July 2013 to reduce support staff numbers in France was
less than the related provision, as a higher-than-expected number of
employees was transferred within the organization.
Restructuring costs recorded in 2012 mainly concerned reorganization
plans in Europe, including the voluntary separation plan announced during
the year to reduce support staff numbers in France.
11.3 OTHER NON-RECURRING INCOME AND EXPENSES
In 2013, the Group revised its estimates of the potential costs associated
with certain risks provided for in prior periods, based on information that
came to the Group’s attention during the year.
Other non-recurring income and expenses for 2012 included various
special taxes introduced in France’s amended Finance Act for a total
of €51 million, including a €36 million retroactive levy on the value of
gasoline inventories held in the fourth quarter of 2011.
11.4 IMPAIRMENT LOSSES AND ASSET WRITE-OFFS
Impairment losses of €60 million were recorded in 2013, mainly in Spain
and Italy, and assets totaling €43 million were written off.
In 2012, an €18 million impairment loss was recorded on Polish goodwill
following the decision to close the Group’s stores in that country to which
the goodwill was allocated.
Impairment losses recorded on property and equipment in 2012 totaled
€155 million. The write-downs mainly concerned Spain, Italy and France
and refl ected the fall in value of certain assets used in environments that
were severely affected by the economic crisis.
(in € millions) 2013 2012
Net gains on sales of assets 425 234
Restructuring costs (52) (287)
Other non-recurring income and expenses (101) (374)
Non-recurring income and expenses, net before asset impairments and write-offs 272 (427)
Asset impairments and write-offs (128) (233)
Impairments and write-offs of goodwill (16) (18)
Impairments and write-offs of property and equipment (112) (215)
NON-RECURRING INCOME AND EXPENSES, NET 144 (660)
of which:
Non-recurring income 566 286
Non-recurring expense (422) (946)
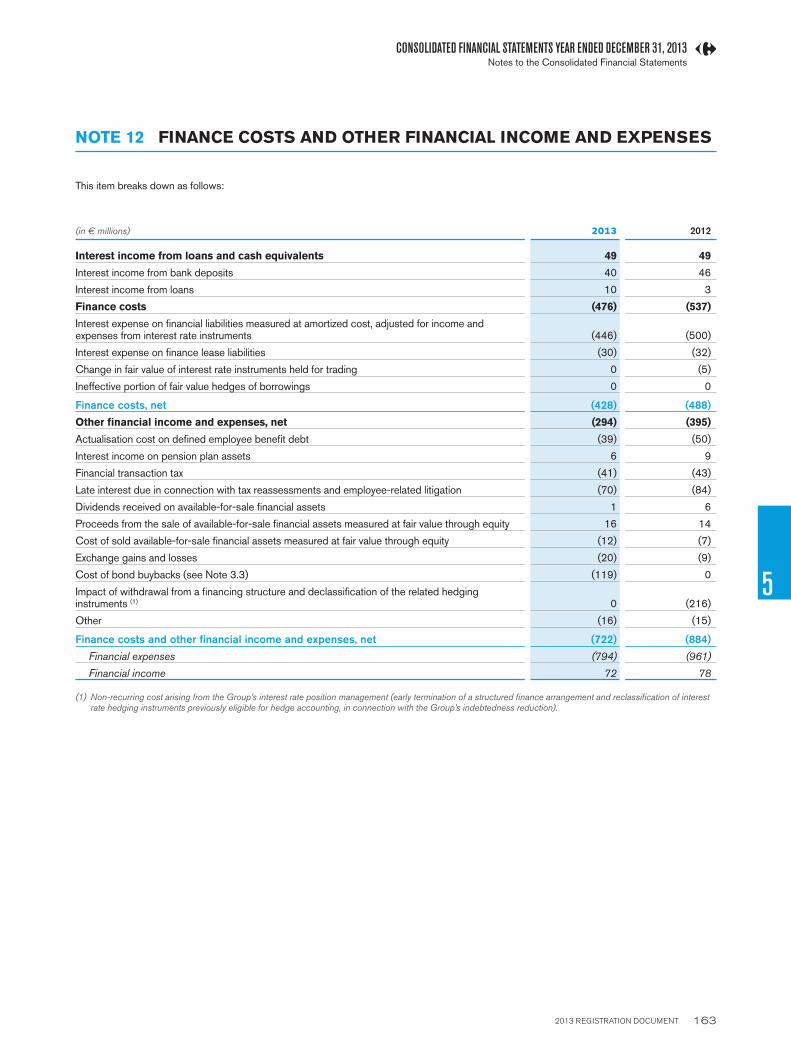
2013 REGISTRATION DOCUMENT 163
CONSOLIDATED FINANCIAL STATEMENTS YEAR ENDED DECEMBER 31, 2013
5
Notes to the Consolidated Financial Statements
This item breaks down as follows:
(in € millions) 2013 2012
Interest income from loans and cash equivalents 49 49
Interest income from bank deposits 40 46
Interest income from loans 10 3
Finance costs (476 ) (537)
Interest expense on fi nancial liabilities measured at amortized cost, adjusted for income and expenses from interest rate instruments (446) (500)
Interest expense on fi nance lease liabilities (30) (32)
Change in fair value of interest rate instruments held for trading 0 (5)
Ineffective portion of fair value hedges of borrowings 0 0
Finance costs, net (428) (488)
Other fi nancial income and expenses, net (294) (395)
Actualisation cost on defi ned employee benefi t debt (39) (50)
Interest income on pension plan assets 6 9
Financial transaction tax (41) (43)
Late interest due in connection with tax reassessments and employee-related litigation (70) (84)
Dividends received on available-for-sale fi nancial assets 1 6
Proceeds from the sale of available-for-sale fi nancial assets measured at fair value through equity 16 14
Cost of sold available-for-sale fi nancial assets measured at fair value through equity (12) (7)
Exchange gains and losses (20) (9)
Cost of bond buybacks (see Note 3.3) (119) 0
Impact of withdrawal from a fi nancing structure and declassifi cation of the related hedging instruments (1) 0 (216)
Other (16) (15)
Finance costs and other fi nancial income and expenses, net (722) (884)
Financial expenses (794) (961)
Financial income 72 78
(1) Non-recurring cost arising from the Group’s interest rate position management (early termination of a structured fi nance arrangement and reclassifi cation of interest rate hedging instruments previously eligible for hedge accounting, in connection with the Group’s indebtedness reduction).
NOTE 12 FINANCE COSTS AND OTHER FINANCIAL INCOME AND EXPENSES
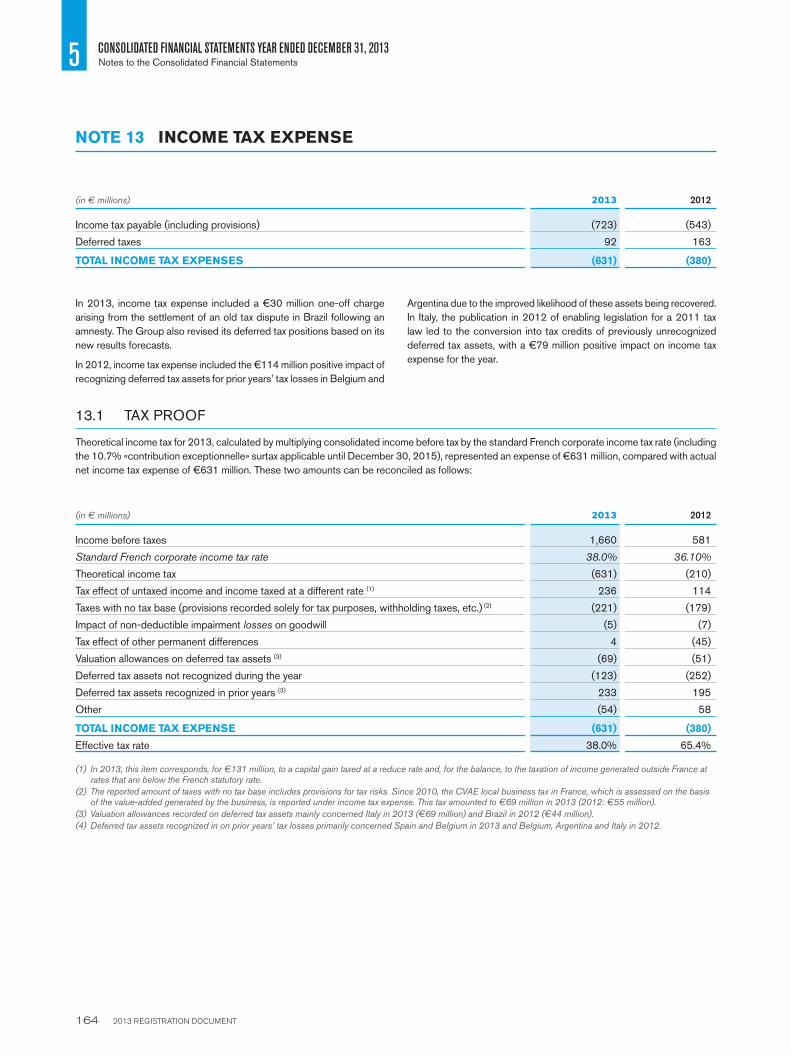
2013 REGISTRATION DOCUMENT 164
5 CONSOLIDATED FINANCIAL STATEMENTS YEAR ENDED DECEMBER 31, 2013Notes to the Consolidated Financial Statements
(in € millions) 2013 2012
Income tax payable (including provisions) (723) (543)
Deferred taxes 92 163
TOTAL INCOME TAX EXPENSES (631) (380)
NOTE 13 INCOME TAX EXPENSE
In 2013, income tax expense included a €30 million one-off charge
arising from the settlement of an old tax dispute in Brazil following an
amnesty. The Group also revised its deferred tax positions based on its
new results forecasts.
In 2012, income tax expense included the €114 million positive impact of
recognizing deferred tax assets for prior years’ tax losses in Belgium and
Argentina due to the improved likelihood of these assets being recovered.
In Italy, the publication in 2012 of enabling legislation for a 2011 tax
law led to the conversion into tax credits of previously unrecognized
deferred tax assets, with a €79 million positive impact on income tax
expense for the year.
13.1 TAX PROOF
Theoretical income tax for 2013, calculated by multiplying consolidated income before tax by the standard French corporate income tax rate (including
the 10.7% «contribution exceptionnelle» surtax applicable until December 30, 2015), represented an expense of €631 million, compared with actual
net income tax expense of €631 million. These two amounts can be reconciled as follows:
(in € millions) 2013 2012
Income before taxes 1,660 581
Standard French corporate income tax rate 38.0% 36.10%
Theoretical income tax (631) (210)
Tax effect of untaxed income and income taxed at a different rate (1) 236 114
Taxes with no tax base (provisions recorded solely for tax purposes, withholding taxes, etc.) (2) (221) (179)
Impact of non-deductible impairment losses on goodwill (5) (7)
Tax effect of other permanent differences 4 (45)
Valuation allowances on deferred tax assets (3) (69) (51)
Deferred tax assets not recognized during the year (123) (252)
Deferred tax assets recognized in prior years (3) 233 195
Other (54) 58
TOTAL INCOME TAX EXPENSE (631) (380)
Effective tax rate 38.0% 65.4%
(1) In 2013, this item corresponds, for €131 million, to a capital gain taxed at a reduce rate and, for the balance, to the taxation of income generated outside France at rates that are below the French statutory rate.
(2) The reported amount of taxes with no tax base includes provisions for tax risks. Since 2010, the CVAE local business tax in France, which is assessed on the basis of the value-added generated by the business, is reported under income tax expense. This tax amounted to €69 million in 2013 (2012: €55 million).
(3) Valuation allowances recorded on deferred tax assets mainly concerned Italy in 2013 (€69 million) and Brazil in 2012 (€44 million).
(4) Deferred tax assets recognized in on prior years’ tax losses primarily concerned Spain and Belgium in 2013 and Belgium, Argentina and Italy in 2012.
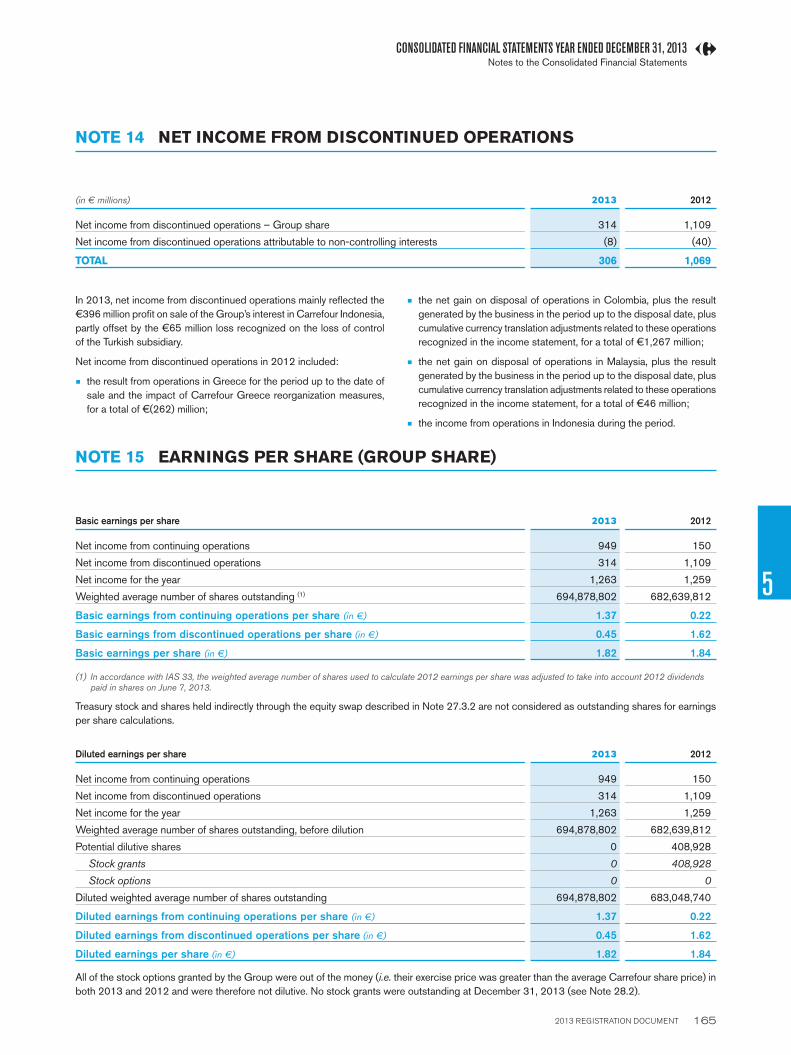
2013 REGISTRATION DOCUMENT 165
CONSOLIDATED FINANCIAL STATEMENTS YEAR ENDED DECEMBER 31, 2013
5
Notes to the Consolidated Financial Statements
(in € millions) 2013 2012
Net income from discontinued operations – Group share 314 1,109
Net income from discontinued operations attributable to non-controlling interests (8) (40)
TOTAL 306 1,069
NOTE 14 NET INCOME FROM DISCONTINUED OPERATIONS
In 2013, net income from discontinued operations mainly refl ected the
€396 million profi t on sale of the Group’s interest in Carrefour Indonesia,
partly offset by the €65 million loss recognized on the loss of control
of the Turkish subsidiary.
Net income from discontinued operations in 2012 included:
W the result from operations in Greece for the period up to the date of
sale and the impact of Carrefour Greece reorganization measures,
for a total of €(262) million;
W the net gain on disposal of operations in Colombia, plus the result
generated by the business in the period up to the disposal date, plus
cumulative currency translation adjustments related to these operations
recognized in the income statement, for a total of €1,267 million;
W the net gain on disposal of operations in Malaysia, plus the result
generated by the business in the period up to the disposal date, plus
cumulative currency translation adjustments related to these operations
recognized in the income statement, for a total of €46 million;
W the income from operations in Indonesia during the period.
NOTE 15 EARNINGS PER SHARE (GROUP SHARE)
Basic earnings per share 2013 2012
Net income from continuing operations 949 150
Net income from discontinued operations 314 1,109
Net income for the year 1,263 1,259
Weighted average number of shares outstanding (1) 694,878,802 682,639,812
Basic earnings from continuing operations per share (in €) 1.37 0.22
Basic earnings from discontinued operations per share (in €) 0.45 1.62
Basic earnings per share (in €) 1.82 1.84
(1) In accordance with IAS 33, the weighted average number of shares used to calculate 2012 earnings per share was adjusted to take into account 2012 dividends paid in shares on June 7, 2013.
Treasury stock and shares held indirectly through the equity swap described in Note 27.3.2 are not considered as outstanding shares for earnings
per share calculations.
Diluted earnings per share 2013 2012
Net income from continuing operations 949 150
Net income from discontinued operations 314 1,109
Net income for the year 1,263 1,259
Weighted average number of shares outstanding, before dilution 694,878,802 682,639,812
Potential dilutive shares 0 408,928
Stock grants 0 408,928
Stock options 0 0
Diluted weighted average number of shares outstanding 694,878,802 683,048,740
Diluted earnings from continuing operations per share (in €) 1.37 0.22
Diluted earnings from discontinued operations per share (in €) 0.45 1.62
Diluted earnings per share (in €) 1.82 1.84
All of the stock options granted by the Group were out of the money (i.e. their exercise price was greater than the average Carrefour share price) in
both 2013 and 2012 and were therefore not dilutive. No stock grants were outstanding at December 31, 2013 (see Note 28.2).

2013 REGISTRATION DOCUMENT 166
5 CONSOLIDATED FINANCIAL STATEMENTS YEAR ENDED DECEMBER 31, 2013Notes to the Consolidated Financial Statements
(in € millions)
December 2013 December 2012
Pre-tax Tax Net Pre-tax Tax Net
Group share
Effective portion of changes in the fair value of cash fl ow hedges 39 (11) 28 19 (8) 11
Changes in the fair value of available-for-sale fi nancial assets 7 1 8 2 (2) 1
Exchange differences on translating foreign operations (407) (407) (184) (184)
Items that may be reclassifi ed subsequently to profi t or loss (360) (11) (371) (163) (9) (172)
Unrecognized actuarial gains and losses on defi ned benefi t plans 27 (5) 22 (228) 63 (165)
Items that will not be reclassifi ed to profi t or loss 27 (5) 22 (228) 63 (165)
TOTAL COMPREHENSIVE INCOME - GROUP SHARE (333) (15) (349) (391) 54 (337)
Non-controlling interests
Effective portion of changes in the fair value of cash fl ow hedges 17 (5) 11 (8) 3 (6)
Changes in the fair value of available-for-sale fi nancial assets (5) 2 (3) 10 (3) 6
Exchange differences on translating foreign operations (48) (48) (9) (9)
Items that may be reclassifi ed subsequently to profi t or loss (36) (4) (40) (8) (1) (8)
Unrecognized actuarial gains and losses on defi ned benefi t plans 5 (2) 3 (4) 1 (3)
Items that will not be reclassifi ed to profi t or loss 5 (2) 3 (4) 1 (3)
TOTAL COMPREHENSIVE INCOME - NON-CONTROLLING INTERESTS (31) (6) (37) (12) 1 (11)
NOTE 16 OTHER COMPREHENSIVE INCOME
NOTE 17 INTANGIBLE ASSETS
Goodwill, which constitutes the main intangible asset, is reported on a separate line of the statement of fi nancial position from other intangible assets.
(in € millions) 12/31/2013 12/31/2012
Goodwill, net 8,277 8,608
Other intangible assets 767 801
INTANGIBLE ASSETS, NET 9,044 9,409
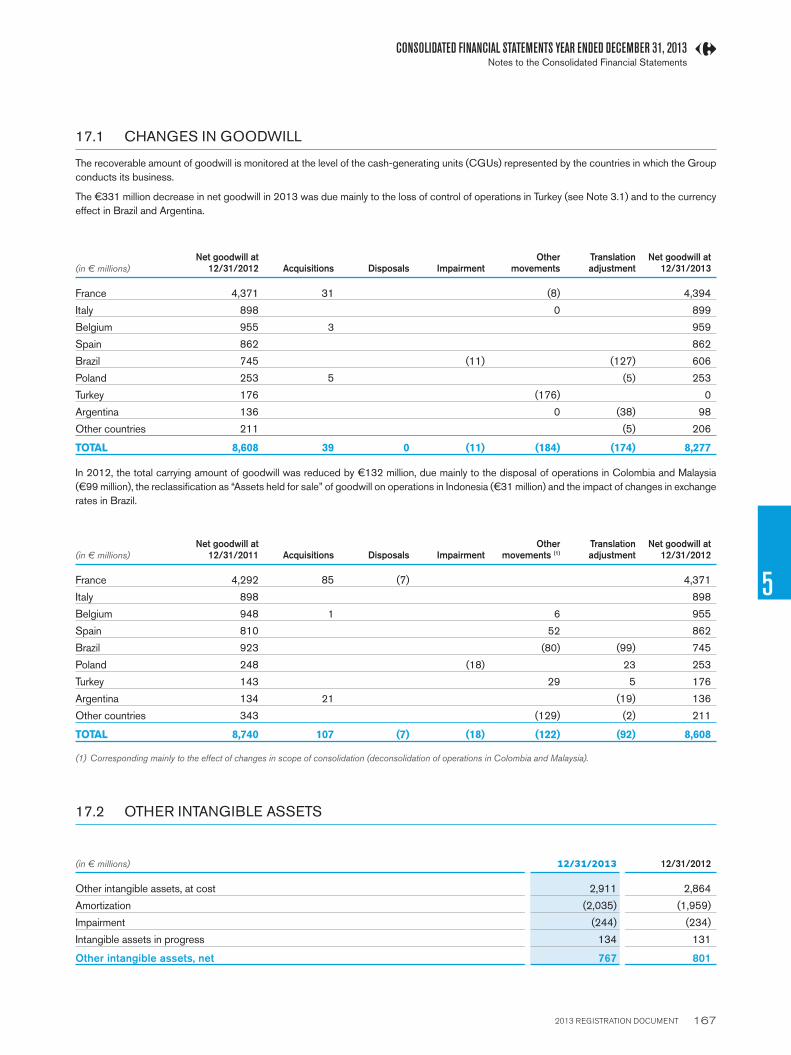
2013 REGISTRATION DOCUMENT 167
CONSOLIDATED FINANCIAL STATEMENTS YEAR ENDED DECEMBER 31, 2013
5
Notes to the Consolidated Financial Statements
(in € millions)
Net goodwill at 12/31/2012 Acquisitions Disposals Impairment
Other movements
Translation adjustment
Net goodwill at 12/31/2013
France 4,371 31 (8) 4,394
Italy 898 0 899
Belgium 955 3 959
Spain 862 862
Brazil 745 (11) (127) 606
Poland 253 5 (5) 253
Turkey 176 (176) 0
Argentina 136 0 (38) 98
Other countries 211 (5) 206
TOTAL 8,608 39 0 (11) (184) (174) 8,277
In 2012, the total carrying amount of goodwill was reduced by €132 million, due mainly to the disposal of operations in Colombia and Malaysia
(€99 million), the reclassifi cation as “Assets held for sale” of goodwill on operations in Indonesia (€31 million) and the impact of changes in exchange
rates in Brazil.
(in € millions)
Net goodwill at 12/31/2011 Acquisitions Disposals Impairment
Other movements (1)
Translation adjustment
Net goodwill at 12/31/2012
France 4,292 85 (7) 4,371
Italy 898 898
Belgium 948 1 6 955
Spain 810 52 862
Brazil 923 (80) (99) 745
Poland 248 (18) 23 253
Turkey 143 29 5 176
Argentina 134 21 (19) 136
Other countries 343 (129) (2) 211
TOTAL 8,740 107 (7) (18) (122) (92) 8,608
(1) Corresponding mainly to the effect of changes in scope of consolidation (deconsolidation of operations in Colombia and Malaysia).
17.2 OTHER INTANGIBLE ASSETS
(in € millions) 12/31/2013 12/31/2012
Other intangible assets, at cost 2,911 2,864
Amortization (2,035) (1,959)
Impairment (244) (234)
Intangible assets in progress 134 131
Other intangible assets, net 767 801
17.1 CHANGES IN GOODWILL
The recoverable amount of goodwill is monitored at the level of the cash-generating units (CGUs) represented by the countries in which the Group
conducts its business.
The €331 million decrease in net goodwill in 2013 was due mainly to the loss of control of operations in Turkey (see Note 3.1) and to the currency
effect in Brazil and Argentina.

2013 REGISTRATION DOCUMENT 168
5 CONSOLIDATED FINANCIAL STATEMENTS YEAR ENDED DECEMBER 31, 2013Notes to the Consolidated Financial Statements
(in € millions) Cost Amortization and impairment Net
At December 31, 2011 3,166 (2,200) 966
Acquisitions 165 0 165
Disposals (150) 129 (21)
Translation adjustment (54) 36 (17)
Amortization 0 (206) (206)
Impairment 0 (24) (24)
Changes in scope of consolidation, transfers and other movements (132) 71 (61)
At December 31, 2012 2,995 (2,194) 801
Acquisitions 211 211
Disposals (65) 33 (32)
Translation adjustment (82) 61 (21)
Amortization (185) (185)
Impairment (15) (15)
Changes in scope of consolidation, transfers and other movements (15) 23 8
At December 31, 2013 3,044 (2,277) 767
17.3 IMPAIRMENT OF GOODWILL AND SENSITIVITY ANALYSIS
Asset impairment policies are described in Note 2 – Summary of Signifi cant Accounting Policies.
The impairment tests performed on goodwill and other intangible assets in 2012 in accordance with IAS 36 did not lead to the recognition of any
impairment losses on these assets.
The perpetual growth rates and discount rates (corresponding to the weighted average cost of capital – WACC) applied for impairment testing
purposes in 2013 and 2012 are presented below by CGU:
Country
2013 2012
After-tax discount rate
Perpetual growth rate
After-tax discount rate
Perpetual growth rate
France 6.2% 2.0% 5.3% 1.5%
Spain 7.6% 2.0% 7.0% 1.5%
Italy 7.3% 1.8% 7.1% 1.5%
Belgium 6.4% 2.0% 5.1% 1.5%
Poland 7.8% 2.3% 6.7% 1.5%
Turkey na na 11.4% 4.5%
Romania 9.2% 2.3% 8.3% 1.5%
Brazil 10.3% 3.5% 7.9% 2.0%
Argentina 20.7% 6.2% 21.0% 9.0%
China 9.2% 3.0% 6.5% 2.0%
Taiwan 6.9% 2.0% 5.4% 2.0%

2013 REGISTRATION DOCUMENT 169
CONSOLIDATED FINANCIAL STATEMENTS YEAR ENDED DECEMBER 31, 2013
5
Notes to the Consolidated Financial Statements
17.3.1 CGUs for which the recoverable amount of goodwill was close to the carrying amount
The tests carried out at December 31, 2013 did not reveal any impairments of goodwill. For the Italy CGU, the recoverable amount of goodwill was
found to be close to – but still greater than – the carrying amount.
Sensitivity analyses were performed to determine the changes in the main assumptions that would lead to an impairment loss being recognized. The
amounts shown below correspond to the difference between the recoverable amount and the carrying amount; the minus sign denotes scenarios
that would lead to the recognition of an impairment loss for the amount indicated.
ITALY
Sensitivity to changes in WACC and perpetual growth rate
WACC (%)
-0.50% -0.25% 0.00% 0.25% 0.50%
Perpetual growth (%)
-0.50% 110 23 -57 -130 -198
-0.25% 193 98 11 -68 -141
0.00% 284 180 86 -0 -79
0.25% 385 270 167 74 -12
0.50% 497 370 257 154 62
Sensitivity to changes in net sales and EBITDA margin growth rates
Net sales growth (%)*
-1.00% -0.50% 0.00% 0.50% 1.00%
EBITDA margin growth (%)*
-0.50% -299 -263 -226 -187 -148
-0.25% -152 -111 -70 -28 16
0.00% -4 40 86 132 180
0.25% 144 192 241 292 344
0.50% 291 343 397 451 507
* Adjustment variable for each of the fi ve years covered by the business plan.
17.3.2 Other countries
For the other countries where the Group conducts business, the analysis of sensitivity to a simultaneous change in the key parameters based on
reasonably possible assumptions did not reveal any probable scenario according to which the recoverable amount of any of the CGUs would be
less than its carrying amount.

2013 REGISTRATION DOCUMENT 170
5 CONSOLIDATED FINANCIAL STATEMENTS YEAR ENDED DECEMBER 31, 2013Notes to the Consolidated Financial Statements
NOTE 18 PROPERTY AND EQUIPMENT
Property and equipment correspond mainly to the retail space managed by the Group.
(in € millions) 12/31/2013 12/31/2012
Land 2,380 2,518
Buildings 8,856 9,298
Equipment, fi xtures and fi ttings 13,173 13,567
Other 423 424
Assets under construction 583 408
Finance leases – land 449 450
Finance leases – buildings 1,177 1,213
Finance leases – equipment, fi xtures and fi ttings 83 88
Finance leases – other 0 (0)
Property and equipment at cost 27,124 27,965
Depreciation (14,552) (14,962)
Depreciation of assets under fi nance leases (919) (936)
Impairment (544) (558)
PROPERTY AND EQUIPMENT, NET 11,109 11,509
18.1 CHANGES IN PROPERTY AND EQUIPMENT
(in € millions) CostDepreciation
and impairment Net
At December 31, 2011 30,867 (17,096) 13,771
Acquisitions 1,262 0 1,262
Disposals (1,010) 897 (113)
Depreciation 0 (1,317) (1,317)
Impairment 0 (122) (122)
Translation adjustment (371) 148 (223)
Changes in scope of consolidation, transfers and other movements (1) (2,782) 1,034 (1,748)
At December 31, 2012 27,965 (16,456) 11,509
Acquisitions 1,882 1,882
Disposals (1,144) 1,028 (116)
Depreciation (1,266) (1,266)
Impairment (52) (52)
Translation adjustment (966) 456 (510)
Changes in scope of consolidation, transfers and other movements (2) (612) 275 (337)
At December 31, 2013 27,124 (16,015) 11,109
(1) The net decrease of €1,748 million was primarily due to the disposal of operations in Colombia, Greece and Malaysia, and the reclassifi cation as “Assets held for sale” of the property and equipment associated with operations in Indonesia.
(2) The net decrease of €317 million was due for the most part to the loss of control of operations in Turkey.

2013 REGISTRATION DOCUMENT 171
CONSOLIDATED FINANCIAL STATEMENTS YEAR ENDED DECEMBER 31, 2013
5
Notes to the Consolidated Financial Statements
18.2 LEASES
All property leases have been reviewed. Where the criteria for classifi cation as fi nance leases are met, the properties are recognized in the statement
of fi nancial position. All other leases are classifi ed as operating leases.
18.3 LEASE COMMITMENTS AT DECEMBER 31, 2013
Finance leases (in € millions) Total Within one year In one to fi ve years Beyond fi ve years
Minimum future lease payments 736 60 206 471
Discounted present value 447 56 163 228
Operating leases (in € millions) Total Within one year In one to fi ve years Beyond fi ve years
Minimum future lease payments 3,217 886 1,446 885
Discounted present value 2,551 826 1,136 587
18.4 LEASE FINANCIAL IMPACT RELATED TO 2013
Finance leases (in € millions) Total
Minimum revenue receivable from sub-leases 11
Minimum lease payments made during the period 52
Contingent rentals 14
Revenue from sub-leases 16
Operating leases (in € millions) Total
Minimum revenue receivable from sub-leases 26
Minimum lease payments made during the period 913
Contingent rentals 34
Revenue from sub-leases 274

2013 REGISTRATION DOCUMENT 172
5 CONSOLIDATED FINANCIAL STATEMENTS YEAR ENDED DECEMBER 31, 2013Notes to the Consolidated Financial Statements
18.5 LEASE COMMITMENTS AT DECEMBER 31, 2012
Finance leases (in € millions) Total Within one year In one to fi ve years Beyond fi ve years
Minimum future lease payments 786 66 213 507
Discounted present value 486 62 172 252
Operating leases (in € millions) Total Within one year In one to fi ve years Beyond fi ve years
Minimum future lease payments 4,116 948 1,888 1,280
Discounted present value 3,119 885 1,479 755
18.6 LEASE FINANCIAL IMPACT RELATED TO 2012
Finance leases (in € millions) Total
Minimum revenue receivable from sub-leases 11
Minimum lease payments made during the period 58
Contingent rentals 18
Revenue from sub-leases 17
Operating leases (in € millions) Total
Minimum revenue receivable from sub-leases 40
Minimum lease payments made during the period 929
Contingent rentals 55
Revenue from sub-leases 276
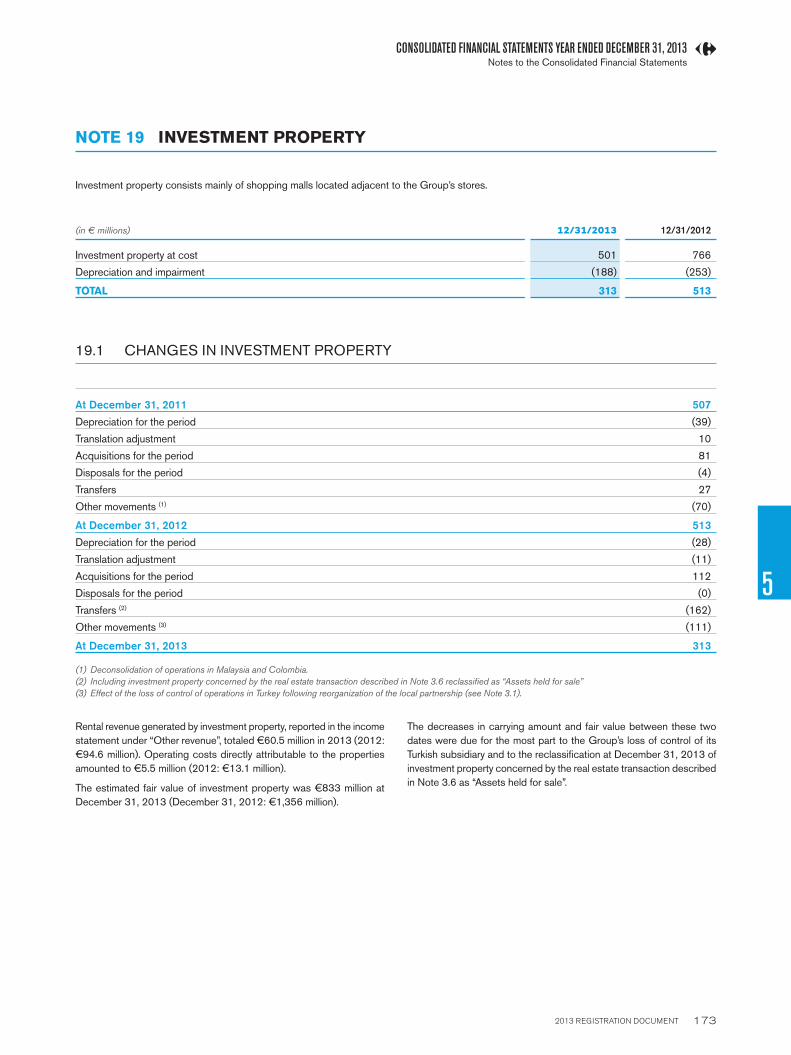
2013 REGISTRATION DOCUMENT 173
CONSOLIDATED FINANCIAL STATEMENTS YEAR ENDED DECEMBER 31, 2013
5
Notes to the Consolidated Financial Statements
NOTE 19 INVESTMENT PROPERTY
Investment property consists mainly of shopping malls located adjacent to the Group’s stores.
(in € millions) 12/31/2013 12/31/2012
Investment property at cost 501 766
Depreciation and impairment (188) (253)
TOTAL 313 513
19.1 CHANGES IN INVESTMENT PROPERTY
At December 31, 2011 507
Depreciation for the period (39)
Translation adjustment 10
Acquisitions for the period 81
Disposals for the period (4)
Transfers 27
Other movements (1) (70)
At December 31, 2012 513
Depreciation for the period (28)
Translation adjustment (11)
Acquisitions for the period 112
Disposals for the period (0)
Transfers (2) (162)
Other movements (3) (111)
At December 31, 2013 313
(1) Deconsolidation of operations in Malaysia and Colombia.
(2) Including investment property concerned by the real estate transaction described in Note 3.6 reclassifi ed as “Assets held for sale”
(3) Effect of the loss of control of operations in Turkey following reorganization of the local partnership (see Note 3.1).
Rental revenue generated by investment property, reported in the income
statement under “Other revenue”, totaled €60.5 million in 2013 (2012:
€94.6 million). Operating costs directly attributable to the properties
amounted to €5.5 million (2012: €13.1 million).
The estimated fair value of investment property was €833 million at
December 31, 2013 (December 31, 2012: €1,356 million).
The decreases in carrying amount and fair value between these two
dates were due for the most part to the Group’s loss of control of its
Turkish subsidiary and to the reclassifi cation at December 31, 2013 of
investment property concerned by the real estate transaction described
in Note 3.6 as “Assets held for sale”.

2013 REGISTRATION DOCUMENT 174
5 CONSOLIDATED FINANCIAL STATEMENTS YEAR ENDED DECEMBER 31, 2013Notes to the Consolidated Financial Statements
20.1 INVESTMENTS IN COMPANIES ACCOUNTED FOR BY THE EQUITY METHOD
Changes in this item can be analyzed as follows:
At December 31, 2011 280
Translation adjustment (2)
Equity in net income 72
Dividends received (27)
Other (1) 61
At December 31, 2012 384
Translation adjustment (29)
Equity in net income 30
Dividends received (30)
Other (2) 141
At December 31, 2013 496
(1) Including a €68 million increase following the use of the equity method to account for 90 new entities in France previously accounted for at cost, and a €22 million decrease following the disposal of operations in Greece (Balkans joint venture).
(2) The year-on-year change is mainly due to the use of the equity method to account for Carrefour SA following reorganization of the partnership with Sabanci Holding in Turkey (see Note 3.1).
The main 2013 fi nancial indicators for companies accounted for by the equity method are presented below:
(in € millions) % interest
On a 100% basis, including consolidation adjustments (1)
Total assetsShareholders'
equityNon-current
assets Net salesNet income/
(loss)
Total
Of which:
W Carrefour SA (Turkey) (2) 46% 602 327 391 481 (9)
W Provencia SA 50% 376 213 191 790 24
W Iper Orio 50% 99 26 83 127 (7)
W Mestdagh 25% 204 85 63 591 (7)
W As Cancelas S.XXI,S.L. 50% 90 46 86 8 1
W Costasol 34% 61 31 47 74 1
W Iliturgitana de Hyper, S.L. 34% 46 16 21 103 0
W Ploesti Shopping City S.R.L. 50% 31 1 66 6 (5)
W Other companies (3) 694 271 461 1,287 31
(1) Source: fi nancial statements available when the Group’s Consolidated Financial Statements were drawn up.
(2) The “net sales” and “net income” fi gures for Carrefour SA concern the period from the date of fi rst-time application of the equity method.
(3) Corresponding to a total of 141 companies, none of which is individually material.
NOTE 20 INVESTMENTS IN COMPANIES ACCOUNTED FOR BY THE EQUITY
METHOD AND OTHER NON-CURRENT FINANCIAL ASSETS

2013 REGISTRATION DOCUMENT 175
CONSOLIDATED FINANCIAL STATEMENTS YEAR ENDED DECEMBER 31, 2013
5
Notes to the Consolidated Financial Statements
20.2 OTHER NON-CURRENT FINANCIAL ASSETS
(in € millions) 12/31/2013 12/31/2012
Investments in non-consolidated companies 60 66
Long-term loans 4 1
Other (1) 1,081 1,058
TOTAL OTHER NON-CURRENT FINANCIAL ASSETS 1,146 1,125
(1) Mainly deposits and other long-term receivables.
NOTE 21 DEFERRED TAXES
The Group had a net deferred tax asset of €411 million at December 31, 2013, an increase of €72 million compared with the previous year-end.
(in € millions) 12/31/2013 12/31/2012 Change
Deferred tax assets 931 919 12
Deferred tax liabilities (521) (580) 60
NET DEFERRED TAX ASSET 411 339 72

2013 REGISTRATION DOCUMENT 176
5 CONSOLIDATED FINANCIAL STATEMENTS YEAR ENDED DECEMBER 31, 2013Notes to the Consolidated Financial Statements
The following table shows the main sources of deferred taxes:
(in € millions)
Change
12/31/2012Income
statement
Shareholder s’ equity (other
comprehensive income)
Changes in consolidation
scope, translation
adjustment, other 12/31/2013
Tax loss carryforwards 1,194 52 0 (375) 870
Property and equipment 476 (35) (0) (96) 344
Non-deductible provisions 912 53 (14) (100) 851
Goodwill amortization allowed for tax purposes 60 14 0 99 173
Other intangible assets 5 0 0 0 5
Inventories 135 16 0 (16) 135
Financial instruments 70 (24) (17) (1) 28
Other temporary differences 513 (59) 0 11 464
Deferred tax assets before netting 3,365 15 (32) (478) 2,871
Effect of netting deferred tax assets and liabilities (466) 0 0 (29) (495)
Deferred tax assets net of deferred tax liabilities 2,899 15 (32) (507) 2,375
Valuation allowances on deferred tax assets (1,980) 124 (1) 413 (1,444)
Net deferred tax assets 919 139 (32) (94) 931
Property and equipment (375) (21) 0 78 (318)
Untaxed provisions (235) (10) 0 (3) (248)
Goodwill amortization allowed for tax purposes (206) (12) 0 36 (182)
Other intangible assets (10) 1 0 1 (8)
Inventories (26) (10) 0 0 (36)
Financial instruments (16) (23) 2 4 (32)
Other temporary differences (178) 34 (0) (47) (192)
Deferred tax liabilities before netting (1,046) (40) 2 68 (1,016)
Effect of netting deferred tax assets and liabilities 466 0 0 29 495
Deferred tax liabilities net of deferred tax assets (580) (40) 2 97 (520)
NET DEFERRED TAXES 339 99 (30) 3 411
21.1 UNRECOGNIZED DEFERRED TAX ASSETS
Unrecognized deferred tax assets amounted to €1,444 million at December 31, 2013 (December 31, 2012: €1,980 million), including €743 million
related to tax loss carryforwards (December 31, 2012: €1,028 million) and €701 million on temporary differences (December 31, 2012: €952 million).
NOTE 22 INVENTORIES
(in € millions) 12/31/2013 12/31/2012
Inventories at cost 5,978 5,933
Depreciation (240) (275)
INVENTORIES, NET 5,738 5,658

2013 REGISTRATION DOCUMENT 177
CONSOLIDATED FINANCIAL STATEMENTS YEAR ENDED DECEMBER 31, 2013
5
Notes to the Consolidated Financial Statements
(in € millions) 12/31/2013 12/31/2012
Trade receivables 1,330 1,302
Depreciation (203) (209)
Trade receivables, net 1,127 1,093
Receivables from suppliers 1,086 1,051
TOTAL 2,213 2,144
Trade receivables correspond for the most part to amounts due by franchisees, for delivered goods and franchise fees.
Receivables from suppliers correspond to rebates and supplier contributions to marketing costs.
NOTE 23 TRADE RECEIVABLES
NOTE 24 OTHER CURRENT FINANCIAL ASSETS
(in € millions) 12/31/2013 12/31/2012
Available-for-sale fi nancial assets 51 238
Derivative instruments 137 46
Deposits with maturities of more than three months (1) 170 61
Other 1 8
TOTAL 359 352
(1) New regulations governing shopping cards in China that came into effect on January 1, 2013, require part of the shopping card fl oat to be placed in a dedicated, interest-bearing bank account controlled by the Group. At December 31, 2013, these deposits amounted to €130 million.
NOTE 25 OTHER ASSETS
(in € millions) 12/31/2013 12/31/2012
Employee advances 18 18
Short-term loans 69 52
Proceeds receivable from disposals of non-current assets 14 42
Prepaid expenses 297 307
Other operating receivables, net 443 370
TOTAL 841 789

2013 REGISTRATION DOCUMENT 178
5 CONSOLIDATED FINANCIAL STATEMENTS YEAR ENDED DECEMBER 31, 2013Notes to the Consolidated Financial Statements
(in € millions) 12/31/2013 12/31/2012
Cash equivalents 3,019 4,881
Cash 1,738 1,693
TOTAL 4,757 6,573
There are no restrictions (as defi ned in IAS 7) that could materially affect the availability of the cash and cash equivalent balances of foreign subsidiaries.
NOTE 26 CASH AND CASH EQUIVALENTS
NOTE 27 SHAREHOLDERS’ EQUITY
27.1 CAPITAL MANAGEMENT
The parent company, Carrefour, must have suffi cient equity capital to
comply with the provisions of French Commercial Code.
The Group owns interests in a certain number of fi nancial services
companies (banks, insurance companies). These subsidiaries must have
suffi cient equity capital to comply with capital adequacy ratios and the
minimum capital rules set by their local banking and insurance supervisors.
Capital management objectives (equity and debt capital) are to:
W ensure that the Group can continue operating as a going concern, in
particular by maintaining high levels of liquid resources;
W optimize shareholder returns;
W keep gearing at an appropriate level, in order to minimize the cost of
capital and maintain the Group’s credit rating at a level that allows it
to access a wide range of fi nancing sources and instruments.
In order to maintain or adjust its gearing, the Group may take on new
borrowings or retire existing borrowings, adjust the dividend paid to
shareholders, return capital to shareholders, issue new shares, buy back
shares or sell assets in order to use the proceeds to pay down debt.
27.2 SHARE CAPITAL
At December 31, 2013, the share capital was made up of 723,984,192 ordinary shares with a par value of €2.5 each, all fully paid.
(in thousands of shares) 2013 2012
Outstanding at January 1 709,215 679,336
Issued for cash - -
Issued upon exercise of stock options - -
Issued in connection with the Guyenne & Gascogne acquisition - 13,331
Issued in payment of dividends 14,770 16,547
Cancelled shares - -
Outstanding at December 31 723,984 709,215
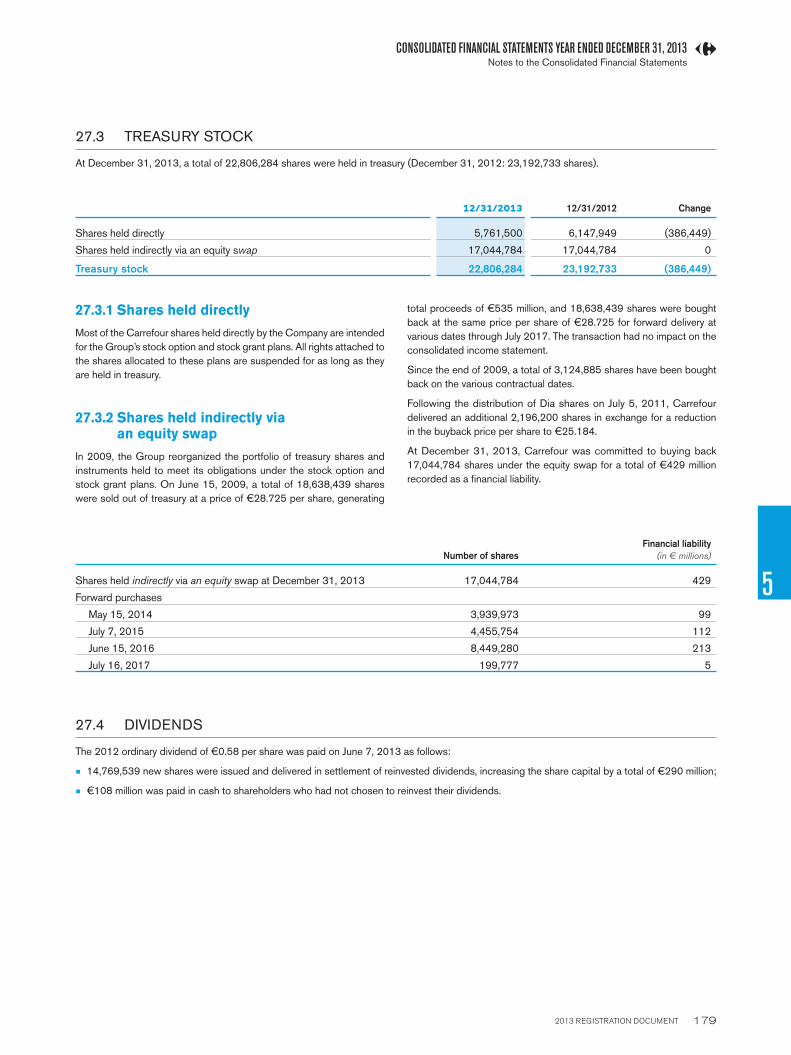
2013 REGISTRATION DOCUMENT 179
CONSOLIDATED FINANCIAL STATEMENTS YEAR ENDED DECEMBER 31, 2013
5
Notes to the Consolidated Financial Statements
27.3 TREASURY STOCK
At December 31, 2013, a total of 22,806,284 shares were held in treasury (December 31, 2012: 23,192,733 shares).
12/31/2013 12/31/2012 Change
Shares held directly 5,761,500 6,147,949 (386,449)
Shares held indirectly via an equity swap 17,044,784 17,044,784 0
Treasury stock 22,806,284 23,192,733 (386,449)
27.3.1 Shares held directly
Most of the Carrefour shares held directly by the Company are intended
for the Group’s stock option and stock grant plans. All rights attached to
the shares allocated to these plans are suspended for as long as they
are held in treasury.
27.3.2 Shares held indirectly via an equity swap
In 2009, the Group reorganized the portfolio of treasury shares and
instruments held to meet its obligations under the stock option and
stock grant plans. On June 15, 2009, a total of 18,638,439 shares
were sold out of treasury at a price of €28.725 per share, generating
total proceeds of €535 million, and 18,638,439 shares were bought
back at the same price per share of €28.725 for forward delivery at
various dates through July 2017. The transaction had no impact on the
consolidated income statement.
Since the end of 2009, a total of 3,124,885 shares have been bought
back on the various contractual dates.
Following the distribution of Dia shares on July 5, 2011, Carrefour
delivered an additional 2,196,200 shares in exchange for a reduction
in the buyback price per share to €25.184.
At December 31, 2013, Carrefour was committed to buying back
17,044,784 shares under the equity swap for a total of €429 million
recorded as a fi nancial liability.
Number of shares
Financial liability
(in € millions)
Shares held indirectly via an equity swap at December 31, 2013 17,044,784 429
Forward purchases
May 15, 2014 3,939,973 99
July 7, 2015 4,455,754 112
June 15, 2016 8,449,280 213
July 16, 2017 199,777 5
27.4 DIVIDENDS
The 2012 ordinary dividend of €0.58 per share was paid on June 7, 2013 as follows:
W 14,769,539 new shares were issued and delivered in settlement of reinvested dividends, increasing the share capital by a total of €290 million;
W €108 million was paid in cash to shareholders who had not chosen to reinvest their dividends.
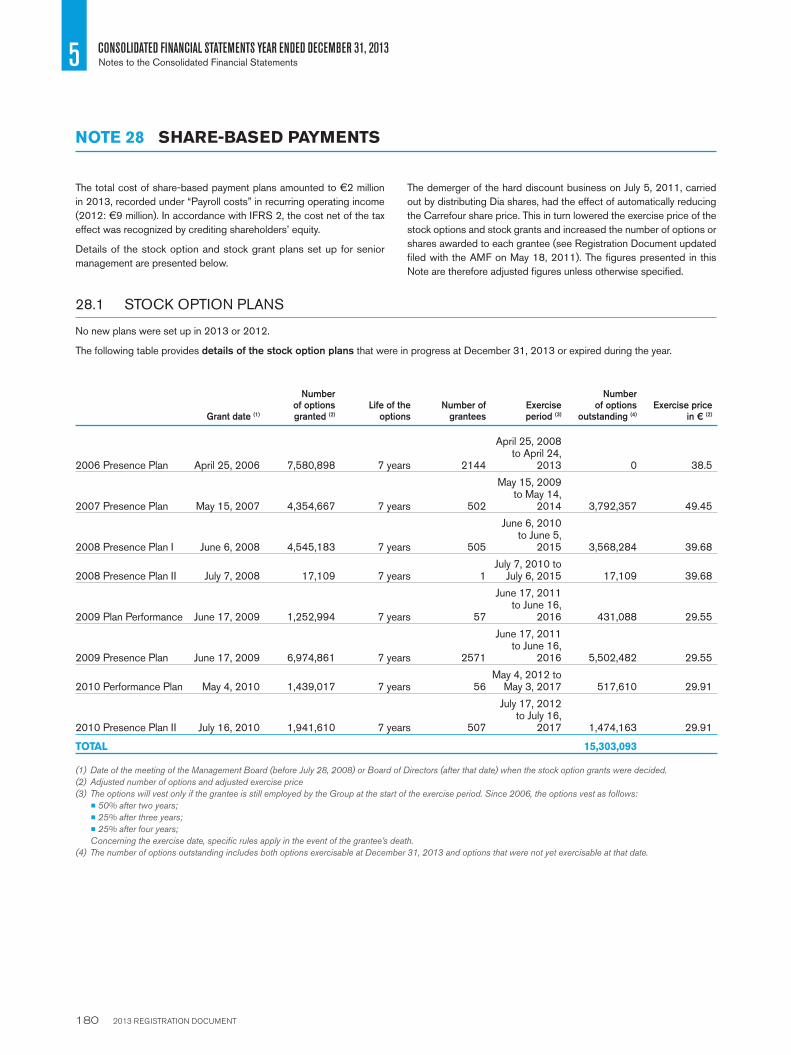
2013 REGISTRATION DOCUMENT 180
5 CONSOLIDATED FINANCIAL STATEMENTS YEAR ENDED DECEMBER 31, 2013Notes to the Consolidated Financial Statements
The total cost of share-based payment plans amounted to €2 million
in 2013, recorded under “Payroll costs” in recurring operating income
(2012: €9 million). In accordance with IFRS 2, the cost net of the tax
effect was recognized by crediting shareholders’ equity.
Details of the stock option and stock grant plans set up for senior
management are presented below.
The demerger of the hard discount business on July 5, 2011, carried
out by distributing Dia shares, had the effect of automatically reducing
the Carrefour share price. This in turn lowered the exercise price of the
stock options and stock grants and increased the number of options or
shares awarded to each grantee (see Registration Document updated
fi led with the AMF on May 18, 2011). The fi gures presented in this
Note are therefore adjusted fi gures unless otherwise specifi ed.
NOTE 28 SHARE-BASED PAYMENTS
28.1 STOCK OPTION PLANS
No new plans were set up in 2013 or 2012.
The following table provides details of the stock option plans that were in progress at December 31, 2013 or expired during the year.
Grant date (1)
Number of options granted (2)
Life of the options
Number of grantees
Exercise period (3)
Number of options
outstanding (4)
Exercise price in € (2)
2006 Presence Plan April 25, 2006 7,580,898 7 years 2144
April 25, 2008 to April 24,
2013 0 38.5
2007 Presence Plan May 15, 2007 4,354,667 7 years 502
May 15, 2009 to May 14,
2014 3,792,357 49.45
2008 Presence Plan I June 6, 2008 4,545,183 7 years 505
June 6, 2010 to June 5,
2015 3,568,284 39.68
2008 Presence Plan II July 7, 2008 17,109 7 years 1July 7, 2010 to
July 6, 2015 17,109 39.68
2009 Plan Performance June 17, 2009 1,252,994 7 years 57
June 17, 2011 to June 16,
2016 431,088 29.55
2009 Presence Plan June 17, 2009 6,974,861 7 years 2571
June 17, 2011 to June 16,
2016 5,502,482 29.55
2010 Performance Plan May 4, 2010 1,439,017 7 years 56May 4, 2012 to
May 3, 2017 517,610 29.91
2010 Presence Plan II July 16, 2010 1,941,610 7 years 507
July 17, 2012 to July 16,
2017 1,474,163 29.91
TOTAL 15,303,093
(1) Date of the meeting of the Management Board (before July 28, 2008) or Board of Directors (after that date) when the stock option grants were decided.
(2) Adjusted number of options and adjusted exercise price
(3) The options will vest only if the grantee is still employed by the Group at the start of the exercise period. Since 2006, the options vest as follows:
W 50% after two years;
W 25% after three years;
W 25% after four years;
Concerning the exercise date, specifi c rules apply in the event of the grantee’s death.
(4) The number of options outstanding includes both options exercisable at December 31, 2013 and options that were not yet exercisable at that date.
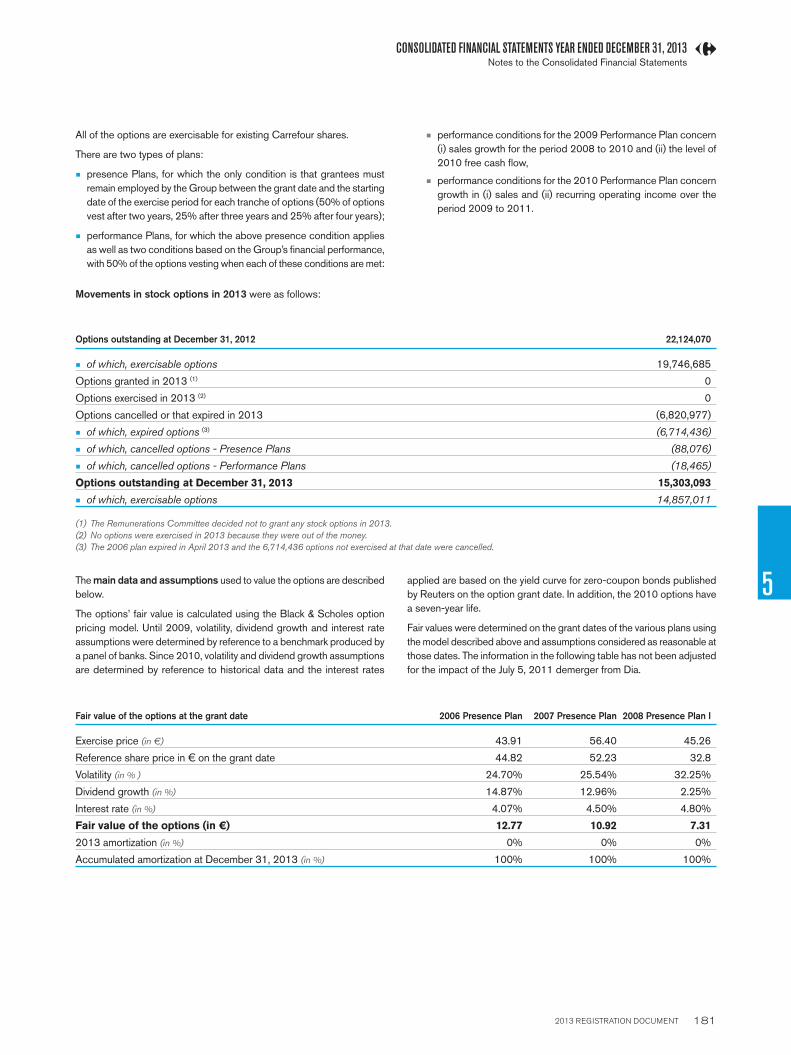
2013 REGISTRATION DOCUMENT 181
CONSOLIDATED FINANCIAL STATEMENTS YEAR ENDED DECEMBER 31, 2013
5
Notes to the Consolidated Financial Statements
All of the options are exercisable for existing Carrefour shares.
There are two types of plans:
W presence Plans, for which the only condition is that grantees must
remain employed by the Group between the grant date and the starting
date of the exercise period for each tranche of options (50% of options
vest after two years, 25% after three years and 25% after four years);
W performance Plans, for which the above presence condition applies
as well as two conditions based on the Group’s fi nancial performance,
with 50% of the options vesting when each of these conditions are met:
W performance conditions for the 2009 Performance Plan concern
(i) sales growth for the period 2008 to 2010 and (ii) the level of
2010 free cash fl ow,
W performance conditions for the 2010 Performance Plan concern
growth in (i) sales and (ii) recurring operating income over the
period 2009 to 2011.
Movements in stock options in 2013 were as follows:
Options outstanding at December 31, 2012 22,124,070
W of which, exercisable options 19,746,685
Options granted in 2013 (1) 0
Options exercised in 2013 (2) 0
Options cancelled or that expired in 2013 (6,820,977)
W of which, expired options (3) (6,714,436)
W of which, cancelled options - Presence Plans (88,076)
W of which, cancelled options - Performance Plans (18,465)
Options outstanding at December 31, 2013 15,303,093
W of which, exercisable options 14,857,011
(1) The Remunerations Committee decided not to grant any stock options in 2013.
(2) No options were exercised in 2013 because they were out of the money.
(3) The 2006 plan expired in April 2013 and the 6,714,436 options not exercised at that date were cancelled.
The main data and assumptions used to value the options are described
below.
The options’ fair value is calculated using the Black & Scholes option
pricing model. Until 2009, volatility, dividend growth and interest rate
assumptions were determined by reference to a benchmark produced by
a panel of banks. Since 2010, volatility and dividend growth assumptions
are determined by reference to historical data and the interest rates
applied are based on the yield curve for zero-coupon bonds published
by Reuters on the option grant date. In addition, the 2010 options have
a seven-year life.
Fair values were determined on the grant dates of the various plans using
the model described above and assumptions considered as reasonable at
those dates. The information in the following table has not been adjusted
for the impact of the July 5, 2011 demerger from Dia.
Fair value of the options at the grant date 2006 Presence Plan 2007 Presence Plan 2008 Presence Plan I
Exercise price (in €) 43.91 56.40 45.26
Reference share price in € on the grant date 44.82 52.23 32.8
Volatility (in % ) 24.70% 25.54% 32.25%
Dividend growth (in %) 14.87% 12.96% 2.25%
Interest rate (in %) 4.07% 4.50% 4.80%
Fair value of the options (in €) 12.77 10.92 7.31
2013 amortization (in %) 0% 0% 0%
Accumulated amortization at December 31, 2013 (in %) 100% 100% 100%
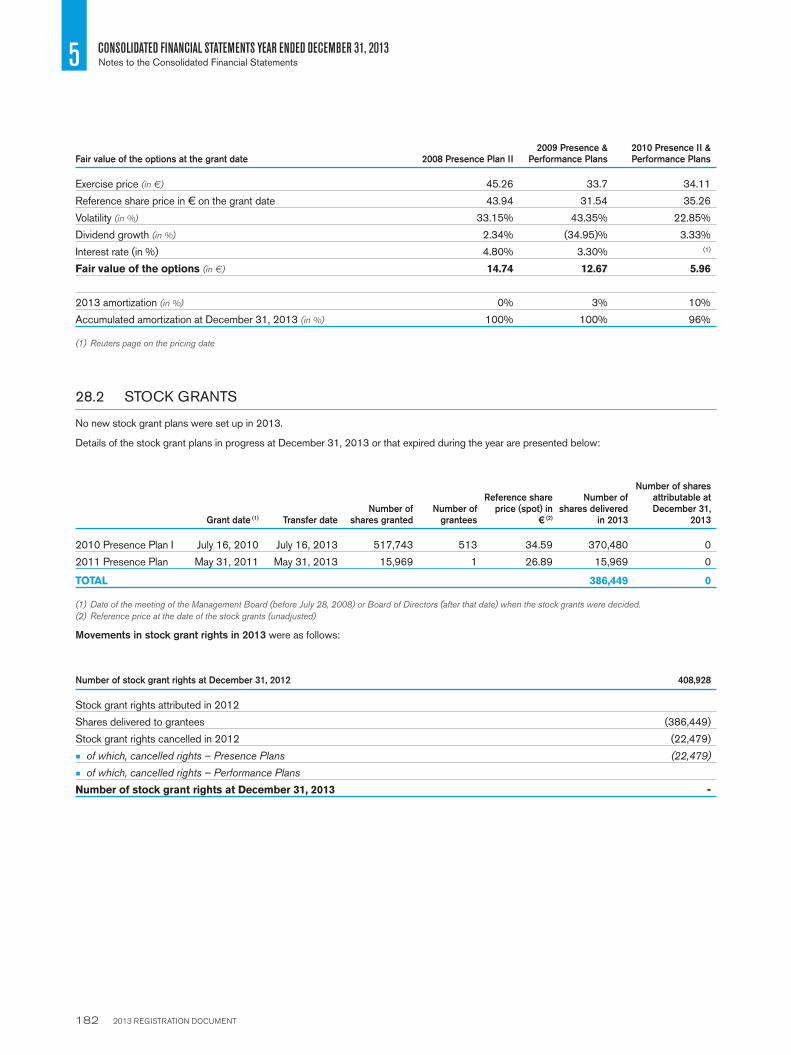
2013 REGISTRATION DOCUMENT 182
5 CONSOLIDATED FINANCIAL STATEMENTS YEAR ENDED DECEMBER 31, 2013Notes to the Consolidated Financial Statements
Fair value of the options at the grant date 2008 Presence Plan II2009 Presence &
Performance Plans2010 Presence II & Performance Plans
Exercise price (in €) 45.26 33.7 34.11
Reference share price in € on the grant date 43.94 31.54 35.26
Volatility (in %) 33.15% 43.35% 22.85%
Dividend growth (in %) 2.34% (34.95)% 3.33%
Interest rate (in %) 4.80% 3.30% (1)
Fair value of the options (in €) 14.74 12.67 5.96
2013 amortization (in %) 0% 3% 10%
Accumulated amortization at December 31, 2013 (in %) 100% 100% 96%
(1) Reuters page on the pricing date
28.2 STOCK GRANTS
No new stock grant plans were set up in 2013.
Details of the stock grant plans in progress at December 31, 2013 or that expired during the year are presented below:
Grant date (1) Transfer dateNumber of
shares grantedNumber of
grantees
Reference share price (spot) in
€ (2)
Number of shares delivered
in 2013
Number of shares attributable at December 31,
2013
2010 Presence Plan I July 16, 2010 July 16, 2013 517,743 513 34.59 370,480 0
2011 Presence Plan May 31, 2011 May 31, 2013 15,969 1 26.89 15,969 0
TOTAL 386,449 0
(1) Date of the meeting of the Management Board (before July 28, 2008) or Board of Directors (after that date) when the stock grants were decided.
(2) Reference price at the date of the stock grants (unadjusted)
Movements in stock grant rights in 2013 were as follows:
Number of stock grant rights at December 31, 2012 408,928
Stock grant rights attributed in 2012
Shares delivered to grantees (386,449)
Stock grant rights cancelled in 2012 (22,479)
W of which, cancelled rights – Presence Plans (22,479)
W of which, cancelled rights – Performance Plans
Number of stock grant rights at December 31, 2013 -

2013 REGISTRATION DOCUMENT 183
CONSOLIDATED FINANCIAL STATEMENTS YEAR ENDED DECEMBER 31, 2013
5
Notes to the Consolidated Financial Statements
(in € millions) 12/31/2012Translation adjustment Increases
Discounting adjustment
Reversals of surplus provisions Utilizations Other 12/31/2013
Post-employment benefi t obligations – Note 30 1,256 (2) 93 (32) (2) (31) (10) 1,272
Claims and litigation 2,584 (220) 539 0 (142) (924) (22) 1,814
Tax reassessments (1) 1,915 (156) 259 0 (71) (790) (81) 1,075
Disputes with current and former employees 389 (44) 191 0 (45) (83) 14 423
Legal disputes 280 (20) 89 0 (26) (51) 44 316
Restructuring 185 (3) 56 0 (60) (65) 6 120
Other (2) 451 (3) 84 0 (50) (46) (22) 413
TOTAL 4,475 (228) 772 (32) (254) (1,066) (49) 3,618
(1) Provisions for tax claims decreased by a net €840 million in 2013, refl ecting translation adjustments, changes in the scope of consolidation, revised estimates of the potential cost associated with certain tax risks, and the reversal of certain provisions following payments in settlement of several old tax disputes.
(2) Other provisions primarily concern technical risks associated mainly with the insurance business, store closure costs and onerous contracts.
NOTE 29 PROVISIONS
Group companies are involved in a certain number of claims and legal
proceedings in the normal course of business. They are also subject to
tax audits that may result in reassessments. The main claims and legal
proceedings are described in Note 31. In each case, the risk is assessed
by Group management and their advisors.
A provision is recorded when the Group has a present obligation (legal or
constructive) as a result of a past event, it is probable that an outfl ow of
resources will be required to settle the obligation, and a reliable estimate
can be made of the amount of the obligation.
At December 31, 2013, the claims and legal proceedings in which the
Group was involved were covered by provisions totalling €1,814 million
(December 31, 2012: €2,584 million). No details are provided because
the Group considers that disclosure of the amount set aside in each
case could be seriously detrimental to its interests.

2013 REGISTRATION DOCUMENT 184
5 CONSOLIDATED FINANCIAL STATEMENTS YEAR ENDED DECEMBER 31, 2013Notes to the Consolidated Financial Statements
NOTE 30 POST-EMPLOYMENT BENEFIT OBLIGATIONS
The cost of defi ned benefi t plans is determined at each period-end by
the projected unit credit method. The calculation is performed using an
actuarial method that takes into account in particular future salary levels
and retirement ages.
30.1 DESCRIPTION OF THE MAIN DEFINED BENEFIT PLANS
The main defi ned benefi t plans concern supplementary pension benefi ts
paid annually in some countries to retired employees of the Group,
and length-of-service awards provided for in collective bargaining
agreements that are paid to employees upon retirement. The plans,
which are presented below, mainly concern France, Belgium and Italy.
French plans
Group employees in France are entitled to a length-of-service award when
they retire, determined in accordance with the law and the applicable
collective bargaining agreement. The award is measured as a multiple
of the individual’s monthly salary for the last twelve months before
retirement, determined by reference to his or her years of service. The
impact at January 1, 2012 of applying IAS 19R included incorporating
new retirement age assumptions taking into account the consequences
of France’s 2008 Act on the modernization of the job market.
In 2009, the Group set up a supplementary pension plan. The main terms
of this defi ned benefi t plan are as follows:
W plan participants must have completed at least three years’ service
at the time of retirement, their annual compensation must be greater
than 16 times the annual ceiling for Social Security contributions and
they must still be employed by the Group at the time of retirement;
W plan participants hired at age 45 or over are credited with up to 10
years’ service as follows: age 45 = 0 year; age 46 = 1 year; age 47
= 2 years, etc.;
W years of service taken into account for the calculation of plan benefi ts
are capped at 20 years;
W benefi ts are calculated as 1.5% of the “reference compensation”
per year of service. The reference compensation corresponds to the
average of the last three years’ salary and bonus or 60 times the
annual ceiling for Social Security contributions whichever is lower;
W maximum replacement rate: the benefi ts are capped so that total
pension benefi ts received by the individual from all sources do not
exceed 50% of the reference compensation;
W the annual benefi t is capped at 25% of the participant’s compensation
for the last full year of service;
W upon the participant’s death, a reversionary pension is payable to the
surviving spouse in an amount equal to 50% of the original benefi t.
Belgian plans
The Group’s main commitments in Belgium concern “prepensions” and
the “solidarity fund”.
Until the end of 2014, the prepension scheme provides for the payment
of unemployment benefi ts during the period from the retirement age
proposed in the collective bargaining agreement (58, or 52 for employees
concerned by the downsizing plan set up in 2010) and the legal retirement
age (65). Carrefour is committed to topping up the benefi ts paid by the
Belgian State, so that the individuals concerned receive 95% of their
fi nal net salary.
New legislation that came into effect in Belgium on January 1, 2012
has pushed back the retirement age and increased the number of years
that will have to be worked to qualify for the scheme as from January 1,
2015. Under the collective bargaining agreement applicable to Carrefour,
employees will be eligible for prepension benefi ts from the age of 60
provided they have worked for 40 years, versus age 58 and 38 years’
work previously.
The solidarity fund is a corporate supplementary pension plan that offers
participants the choice between a lump sump payment on retirement or
a monthly pension for the rest of their lives. The plan was closed in 1994
and replaced by a defi ned contribution plan. Consequently, the projected
benefi t obligation only concerns pension rights that vested before 1994.
Italian plans
The Group’s commitments in Italy primarily concern the Trattemento di Fine
Rapporto (TFR) deferred salary scheme. The TFR scheme underwent a
radical reform in 2007, with employers now required to pay contributions
to an independent pension fund. The Group’s obligation therefore only
concerns deferred salary rights that vested before 2007.

2013 REGISTRATION DOCUMENT 185
CONSOLIDATED FINANCIAL STATEMENTS YEAR ENDED DECEMBER 31, 2013
5
Notes to the Consolidated Financial Statements
30.2 NET EXPENSE FOR THE PERIOD
Expense recognized in the income statement
(in € millions) France Belgium Italy Other countries Group total
Service cost (1) 60 (38) 0 7 30
Interest cost (discount effect) 30 15 2 1 48
Return on plan assets (5) (4) 0 (0) (10)
Other items 2 0 0 0 2
Expense (income) for 2012 87 (28) 2 8 70
Service cost (1) 60 7 0 (0) 67
Interest cost (discount effect) 27 10 1 1 39
Return on plan assets (3) (3) 0 (0) (6)
Other items 0 (0) 0 0 (0)
Expense (income) for 2013 84 15 1 0 100
(1) The following table presents details of service cost.
2012 (in € millions) France Belgium Italy Other countries Group total
Current service cost 44 6 0 7 58
Past service cost (plan amendments and curtailments) 16 (45) (28)
Settlements and other 0
TOTAL SERVICE COST 60 (38) 0 7 30
2013 (in € millions) France Belgium Italy Other countries Group total
Current service cost 59 6 0 2 67
Past service cost (plan amendments and curtailments) 7 0 0 0 7
Settlements and other (5) 1 0 (2) (6)
TOTAL SERVICE COST 60 7 0 (0) 67
The net expense for 2013, in the amount of €100 million, is recorded in employee benefi ts expense for €67 million and in fi nancial expense for
€33 million.

2013 REGISTRATION DOCUMENT 186
5 CONSOLIDATED FINANCIAL STATEMENTS YEAR ENDED DECEMBER 31, 2013Notes to the Consolidated Financial Statements
30.3 CHANGE IN THE PROVISION
Balance sheet movements (in € millions) France Belgium Italy Other countries Group total
Provision at December 31, 2011 315 272 133 60 777
Adjustment (IAS 19R) 254 (15) 17 9 266
Provision at January 1, 2012 569 257 150 70 1,043
Movements recorded in the income statement 87 (28) 2 8 70
Benefi ts paid directly by the employer 6 0 0 (29) (23)
Effect of changes in scope of consolidation (5) (22) (12) (2) (41)
Change in actuarial gains and losses 178 42 4 8 232
Other (22) 0 0 (4) (26)
Provision at December 31, 2012 813 249 145 50 1,256
Movements recorded in the income statement 84 15 1 0 100
Benefi ts paid directly by the employer (6) (21) (8) (0) (36)
Effect of changes in scope of consolidation (4) 0 0 (10) (15)
Change in actuarial gains and losses (1) (28) (16) 13 (1) (32)
Other (0) 0 (0) (2) (3)
Provision at December 31, 2013 859 227 150 37 1,272
(1) This line breaks down as follows:
(in € millions) France Belgium Italy Other countries Group total
Actuarial (gain)/loss due to experience 4 (6) 2 2 1
Actuarial (gain)/loss due to demographic assumption changes (7) 0 (2) (0) (9)
Actuarial (gain)/loss due to financial assumption changes (24) (5) 13 (2) (18)
Return on Plan Assets (Greater) / Less than Discount Rate (1) (4) 0 0 (5)
CHANGES IN ACTUARIAL GAINS AND LOSSES (28) (16) 13 (1) (32)

2013 REGISTRATION DOCUMENT 187
CONSOLIDATED FINANCIAL STATEMENTS YEAR ENDED DECEMBER 31, 2013
5
Notes to the Consolidated Financial Statements
30.4 PLAN ASSETS
Change in the fair value of plan assets (in € millions) France Belgium Italy Other countries Group total
Fair value at December 31, 2011 119 89 0 6 214
Effect of changes in scope of consolidation (0) 0 0 0 (0)
Expected return on plan assets 5 4 0 0 9
Benefi ts paid out of plan assets (15) (11) 0 (1) (27)
Actuarial gain/(loss) 5 7 0 (0) 12
Other 20 4 0 1 25
Fair value at December 31, 2012 134 93 0 6 233
Effect of changes in scope of consolidation 0 0 0 0 0
Expected return on plan assets 3 3 0 0 6
Benefi ts paid out of plan assets (30) (13) 0 (0) (43)
Actuarial gain/(loss) 1 4 0 0 5
Other 0 5 0 (1) 4
Fair value at December 31, 2013 108 92 0 4 204
Plan assets break down as follows by asset class:
December 31, 2013 December 31, 2012
Bonds EquitiesReal estate
and other Bonds EquitiesReal estate
and other
France 79% 20% 1% 81% 17% 3%
Belgium 70% 20% 10% 80% 18% 2%
All bonds and equities held in plan asset portfolios are listed securities.
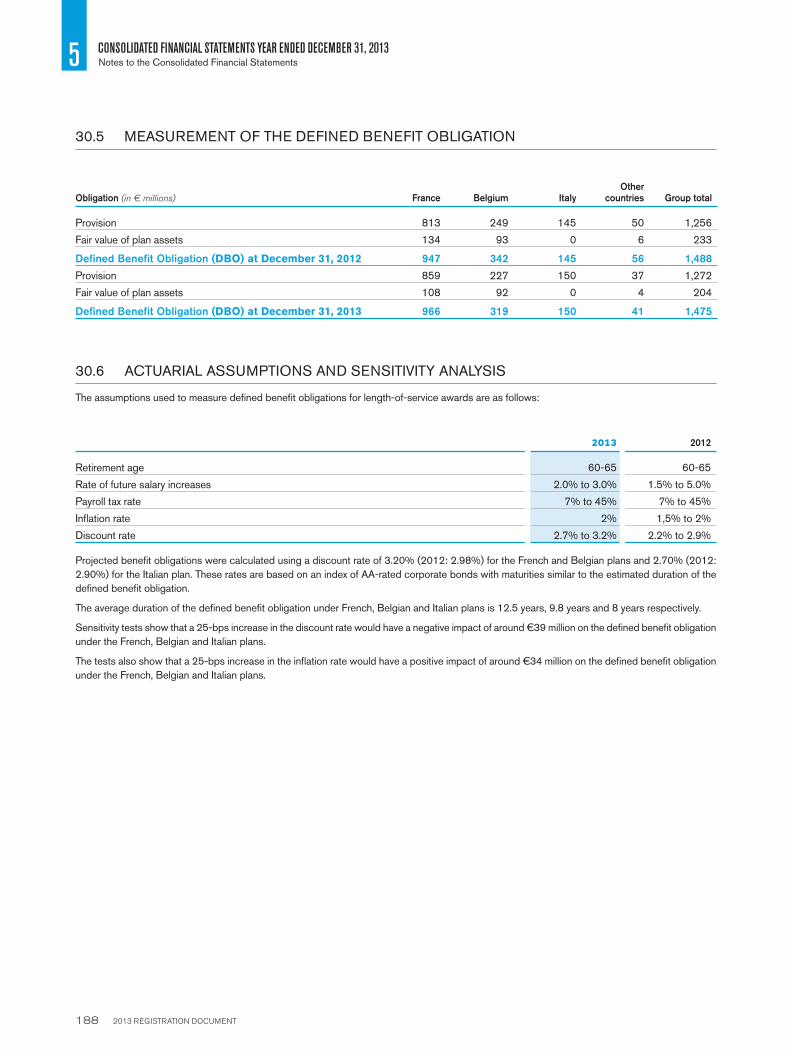
2013 REGISTRATION DOCUMENT 188
5 CONSOLIDATED FINANCIAL STATEMENTS YEAR ENDED DECEMBER 31, 2013Notes to the Consolidated Financial Statements
30.5 MEASUREMENT OF THE DEFINED BENEFIT OBLIGATION
Obligation (in € millions) France Belgium ItalyOther
countries Group total
Provision 813 249 145 50 1,256
Fair value of plan assets 134 93 0 6 233
Defi ned Benefi t Obligation (DBO) at December 31, 2012 947 342 145 56 1,488
Provision 859 227 150 37 1,272
Fair value of plan assets 108 92 0 4 204
Defi ned Benefi t Obligation (DBO) at December 31, 2013 966 319 150 41 1,475
30.6 ACTUARIAL ASSUMPTIONS AND SENSITIVITY ANALYSIS
The assumptions used to measure defi ned benefi t obligations for length-of-service awards are as follows:
2013 2012
Retirement age 60-65 60-65
Rate of future salary increases 2.0% to 3.0% 1.5% to 5.0%
Payroll tax rate 7% to 45% 7% to 45%
Infl ation rate 2% 1,5% to 2%
Discount rate 2.7% to 3.2% 2.2% to 2.9%
Projected benefi t obligations were calculated using a discount rate of 3.20% (2012: 2.98%) for the French and Belgian plans and 2.70% (2012:
2.90%) for the Italian plan. These rates are based on an index of AA-rated corporate bonds with maturities similar to the estimated duration of the
defi ned benefi t obligation.
The average duration of the defi ned benefi t obligation under French, Belgian and Italian plans is 12.5 years, 9.8 years and 8 years respectively.
Sensitivity tests show that a 25-bps increase in the discount rate would have a negative impact of around €39 million on the defi ned benefi t obligation
under the French, Belgian and Italian plans.
The tests also show that a 25-bps increase in the infl ation rate would have a positive impact of around €34 million on the defi ned benefi t obligation
under the French, Belgian and Italian plans.

2013 REGISTRATION DOCUMENT 189
CONSOLIDATED FINANCIAL STATEMENTS YEAR ENDED DECEMBER 31, 2013
5
Notes to the Consolidated Financial Statements
In the normal course of its operations in around a dozen different countries, the Group is involved in tax, employee-related and commercial disputes
and legal proceedings.
NOTE 31 CLAIMS AND LITIGATION
31.1 TAX REASSESSMENTS
Certain Group companies have been or are currently the subject of tax
audits conducted by their local tax authorities.
In Brazil, Carrefour is subject to tax audits covering, in particular, the tax
on the distribution of goods and services (ICMS), related tax credits
(determination of the amounts claimable and documentation of the claims),
and federal contributions to the social integration program and to the
fi nancing of the social security system (Pis-Cofi ns). The Group has
challenged most of the reassessments, particularly the constitutionality
of certain legislative provisions on which they are based. The estimated
risk in each case is reviewed regularly with Carrefour Brazil’s advisors
and an appropriate provision is recorded.
In France, proposed reassessments notifi ed by the tax authorities to
the parent company, Carrefour SA, on a stand-alone basis represented
a principal amount of €191 million at December 31, 2013. These
reassessments, which have been contested by Carrefour, concern the
years 2003 to 2010.
In 2008 and 2009, certain French companies in the Group were notifi ed
of proposed reassessments of output VAT for the years 2003 to 2008,
totalling €313 million. Carrefour has contested these reassessments
and lodged an appeal before the administrative court. However, as the
appeal process does not have a suspensory effect, the tax claimed for
the years 2003 to 2008 has been settled.
In Argentina, the tax authorities have notifi ed Carrefour of ARS 500 million
(approximately €56 million) in reassessments for the period 1996-2004
on the grounds that the Group had failed to include certain categories of
supplier rebates in the calculation of sales tax. The Group has contested
the tax authorities’ interpretation.
In France, up until 2003, Carrefour paid a rendering levy (taxe
d’équarrissage) on its meat purchases. In 2003, the Court of Justice
of the European Union ruled that this levy, which was paid over by the
French State to abattoirs, constituted State aid awarded in breach of
EU rules. As a result of this ruling, the rendering levy paid for the years
1997 to 2003 was refunded to the Group. In 2004, however, the French
tax authorities reversed their decision and instructed the Group to repay
the refunded amounts for the years 2001 to 2003, totalling €145 million.
Although this amount was paid by Carrefour in 2012, the Group has
contested the validity of the claim and the case is currently pending
before the tax courts.
31.2 DISPUTES WITH CURRENT AND FORMER EMPLOYEES
As a major employer, the Group is regularly involved in disputes with
current or former employees.
From time to time, disputes may also arise with a large group of current
or former employees. In Brazil, many former employees have initiated
legal proceedings against the Group, claiming overtime pay that they
allege is due to them.
31.3 LEGAL AND COMMERCIAL DISPUTES
The Group is subject to regular audits by the authorities responsible for
overseeing compliance with the laws applicable to the retail industry and
by the competition authorities. Disputes may also arise with suppliers
as a result of differing interpretations of legal or contractual provisions.
On October 1, 2012, a report on the price increases applied by major
retailers for “household and personal care” products was handed to the
Belgian competition authorities. The report alleges that between 2002 and
2007, the leading retailers coordinated price increases for these products
with the help of the products’ suppliers. The matter is currently under
review by the Belgian competition authorities, who will decide whether
competition law has been breached and, if so, the amount of the fi ne.

2013 REGISTRATION DOCUMENT 190
5 CONSOLIDATED FINANCIAL STATEMENTS YEAR ENDED DECEMBER 31, 2013Notes to the Consolidated Financial Statements
32.1 NET DEBT
32.1.1 Net debt calculation
Net debt at December 31, 2013 amounted to €4,117 million, a decrease of €203 million from December 31, 2012. This amount breaks down as
follows:
(in € millions) 12/31/2013 12/31/2012
Bonds and notes 7,462 8,992
Other borrowings 1,356 1,516
Commercial paper - -
Finance lease liabilities 388 420
TOTAL BORROWINGS BEFORE DERIVATIVE INSTRUMENTS RECORDED IN LIABILITIES 9,206 10,928
Derivative instruments recorded in liabilities 27 318
TOTAL LONG AND SHORT-TERM BORROWINGS (1) 9,233 11,246
Of which, long-term borrowings 7,550 8,983
Of which, short-term borrowings 1,683 2,263
Other current fi nancial assets 359 352
Cash and cash equivalents 4,757 6,573
TOTAL CURRENT FINANCIAL ASSETS (2) 5,116 6,925
NET DEBT = (1) – (2) 4,117 4,320
NOTE 32 LONG AND SHORT-TERM BORROWINGS
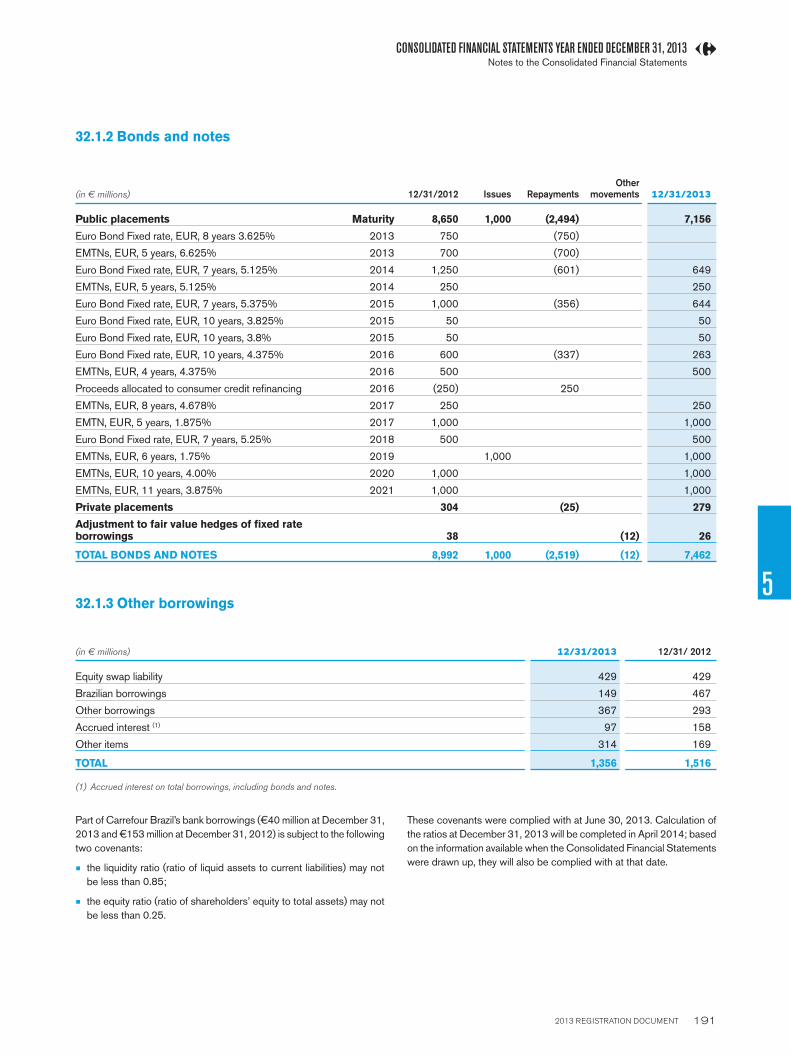
2013 REGISTRATION DOCUMENT 191
CONSOLIDATED FINANCIAL STATEMENTS YEAR ENDED DECEMBER 31, 2013
5
Notes to the Consolidated Financial Statements
32.1.2 Bonds and notes
(in € millions) 12/31/2012 Issues RepaymentsOther
movements 12/31/2013
Public placements Maturity 8,650 1,000 (2,494) 7,156
Euro Bond Fixed rate, EUR, 8 years 3.625% 2013 750 (750)
EMTNs, EUR, 5 years, 6.625% 2013 700 (700)
Euro Bond Fixed rate, EUR, 7 years, 5.125% 2014 1,250 (601) 649
EMTNs, EUR, 5 years, 5.125% 2014 250 250
Euro Bond Fixed rate, EUR, 7 years, 5.375% 2015 1,000 (356) 644
Euro Bond Fixed rate, EUR, 10 years, 3.825% 2015 50 50
Euro Bond Fixed rate, EUR, 10 years, 3.8% 2015 50 50
Euro Bond Fixed rate, EUR, 10 years, 4.375% 2016 600 (337) 263
EMTNs, EUR, 4 years, 4.375% 2016 500 500
Proceeds allocated to consumer credit refi nancing 2016 (250) 250
EMTNs, EUR, 8 years, 4.678% 2017 250 250
EMTN, EUR, 5 years, 1.875% 2017 1,000 1,000
Euro Bond Fixed rate, EUR, 7 years, 5.25% 2018 500 500
EMTNs, EUR, 6 years, 1.75% 2019 1,000 1,000
EMTNs, EUR, 10 years, 4.00% 2020 1,000 1,000
EMTNs, EUR, 11 years, 3.875% 2021 1,000 1,000
Private placements 304 (25) 279
Adjustment to fair value hedges of fi xed rate borrowings 38 (12) 26
TOTAL BONDS AND NOTES 8,992 1,000 (2,519) (12) 7,462
32.1.3 Other borrowings
(in € millions) 12/31/2013 12/31/ 2012
Equity swap liability 429 429
Brazilian borrowings 149 467
Other borrowings 367 293
Accrued interest (1) 97 158
Other items 314 169
TOTAL 1,356 1,516
(1) Accrued interest on total borrowings, including bonds and notes.
Part of Carrefour Brazil’s bank borrowings (€40 million at December 31,
2013 and €153 million at December 31, 2012) is subject to the following
two covenants:
W the liquidity ratio (ratio of liquid assets to current liabilities) may not
be less than 0.85;
W the equity ratio (ratio of shareholders’ equity to total assets) may not
be less than 0.25.
These covenants were complied with at June 30, 2013. Calculation of
the ratios at December 31, 2013 will be completed in April 2014; based
on the information available when the Consolidated Financial Statements
were drawn up, they will also be complied with at that date.

2013 REGISTRATION DOCUMENT 192
5 CONSOLIDATED FINANCIAL STATEMENTS YEAR ENDED DECEMBER 31, 2013Notes to the Consolidated Financial Statements
32.2 ANALYSIS OF BORROWINGS (EXCLUDING DERIVATIVE INSTRUMENTS RECORDED IN LIABILITIES)
32.2.1 Analysis by interest rate
12/31/ 2013 12/31/2012
(in € millions) before hedging after hedging before hedging after hedging
Fixed rate borrowings 8,483 8,161 10,210 9,960
Variable rate borrowings 696 1,045 680 967
TOTAL 9,179 9,206 10,890 10,928
32.2.2 Analysis by currency
The following analysis by currency concerns borrowings including the impact of currency swaps.
(in € millions) 12/31/2013 12/31/2012
Euro 8,802 10,211
Brazilian real 157 499
Chinese yuan 79 65
Turkish lira 13
Taiwan dollar 78 95
Argentine peso 46 1
Polish zloty 36 37
Romanian leu 6 7
TOTAL 9,206 10,928
Euro-denominated borrowings represented 96% of total borrowings at December 31, 2013 (December 31, 2012: 93%).
32.2.3 Analysis by maturity
(in € millions) 12/31/2013 12/31/2012
Due within one year 1,683 2,263
Due in 1 to 2 years 1,242 1,773
Due in 3 to 5 years 2,955 4,067
Due beyond 5 years 3,326 2,824
TOTAL 9,206 10,928

2013 REGISTRATION DOCUMENT 193
CONSOLIDATED FINANCIAL STATEMENTS YEAR ENDED DECEMBER 31, 2013
5
Notes to the Consolidated Financial Statements
To support its core retailing business, the Group offers banking and
insurance services to customers, mainly in France, Spain and Brazil.
The fi nancial services companies offer their customers “Carrefour” bank
cards that can be used in the Group’s stores and elsewhere, consumer
loans and savings products such as life insurance and passbook savings
accounts.
In light of the size and signifi cant nature of the amounts involved, consumer
credit is reported on a separate line of the Group’s consolidated statement
of fi nancial position, in current assets (for the short-term portion) and non-
currents assets (for the long-term portion) and consumer credit fi nancing
is reported separately in current liabilities and non-current liabilities.
NOTE 33 CONSUMER CREDIT FINANCING
At December 31, 2013, consumer credit totaled €5,602 million (December 31, 2012: €5,646 million), as follows:
(in € millions) 12/31/2013 12/31/2012
Payment card receivables 3,834 3,867
Loans 2,063 2,020
Consumer credit (on purchases made in Carrefour stores) 191 172
Other fi nancing 305 326
Provisions (796) (750)
Other 5 10
TOTAL CONSUMER CREDIT GRANTED BY THE FINANCIAL SERVICES COMPANIES 5,602 5,646
Short-term fi nancing 3,221 3,285
Long-term fi nancing 2,381 2,360
The related consumer credit fi nancing amounted to €4,909 million at December 31, 2013, as follows:
(in € millions) 12/31/2013 12/31/2012
Debt securities (retail certifi cates of deposit, medium-term notes) 1,292 1,238
Bank borrowings 507 850
Bonds and notes (1) 897 1,009
Customer passbook savings deposits 580 655
Securitizations (2) 900 500
Consumer credit portfolios sold to banks 348 363
Other 385 382
TOTAL 4,909 4,997
Short-term borrowings 3,145 3,032
Long-term borrowings 1,765 1,966
(1) In 2013:
W Carrefour Banque €300 million 3-year bond issue at 3-month Euribor + 85 bps carried out on April 16;
W buyback and retirement on December 16 of €150 million worth of bonds included in the €710 million issue carried out in 2012.
In 2012:
W €600 million 3-year, 2.875% notes issue carried out by Carrefour Banque on September 25, and €110 million tap issue carried out on November 9;
W €250 million allocated to Carrefour Banque out of the proceeds of a Carrefour SA notes issue (see Note 32).
(2) In 2013: Master Credit Cards Pass reloadable securitization program with compartments launched by Carrefour Banque in November. Asset pool: €560 million. Proceeds from the securitization: €400 million.
In 2012: FCT Copernic 2012-1 compartment of the FCT Copernic reloadable securitization fund launched by Carrefour Banque. Asset pool: €855 million. Proceeds from the securitization: €500 million (class A1 notes).
The two securitization funds are fully consolidated in the Group’s accounts.

2013 REGISTRATION DOCUMENT 194
5 CONSOLIDATED FINANCIAL STATEMENTS YEAR ENDED DECEMBER 31, 2013Notes to the Consolidated Financial Statements
AT 12/31/2013
(in € millions)
Carrying amount
Breakdown by category
Fair value
Financial assets at fair
value through profi t or loss
Available-for-sale
fi nancial assets
Loans, receivables
and other
Financial liabilities at amortized
cost (1)
Debt hedged by
fair value hedges
Derivative instruments
Investments in non-consolidated companies 60 60 60
Other long-term investments 1,086 225 860 1,096
Other non-current fi nancial assets 1,146 285 860 1,146
Consumer credit granted by the fi nancial services companies 5,602 5,597 5 5,602
Trade receivables 2,213 2,213 2,213
Other current fi nancial assets 359 51 171 137 359
Other assets (1) 545 545 545
Cash and cash equivalents 4,757 4,757 4,757
Assets 14,621 4,757 336 9,385 142 14,621
Total long- and short-term borrowings 9,233 8,679 526 27 9,592
Total consumer credit fi nancing 4,911 4,542 369 4,911
Suppliers and other creditors 12,854 12,854 12,854
Other payables (2) 2,763 2,686 2,686
Liabilities 29,759 15,539 13,221 895 27 30,042
(1) Excluding prepaid expenses.
(2) Excluding deferred revenue.
AT 12/31/2012
(in € millions)
Carrying amount
Breakdown by category
Fair value
Financial assets at fair
value through profi t or loss
Available-for-sale
fi nancial assets
Loans, receivables
and other
Financial liabilities at amortized
cost (1)
Debt hedged by
fair value hedges
Derivative instruments
Investments in non-consolidated companies 66 66 66
Other long-term investments 1,059 219 840 1,059
Other non-current fi nancial assets 1,125 285 840 1,125
Consumer credit granted by the fi nancial services companies 5,646 5,635 11 5,646
Trade receivables 2,144 2,144 2,144
Other current fi nancial assets 352 238 69 46 352
Other assets (1) 482 482 482
Cash and cash equivalents 6,573 6,573 6,573
Assets 16,322 6,573 522 9,170 57 16,322
Total long- and short-term borrowings 11,246 10,390 538 318 11,910
Total consumer credit fi nancing 4,998 4,470 528 4,998
Suppliers and other creditors 12,925 12,925 12,925
Other payables (2) 2,358 2,358 2,358
Liabilities 31,526 15,283 14,860 1,066 318 32,191
(1) Excluding prepaid expenses.
(2) Excluding deferred revenue.
NOTE 34 FINANCIAL INSTRUMENTS
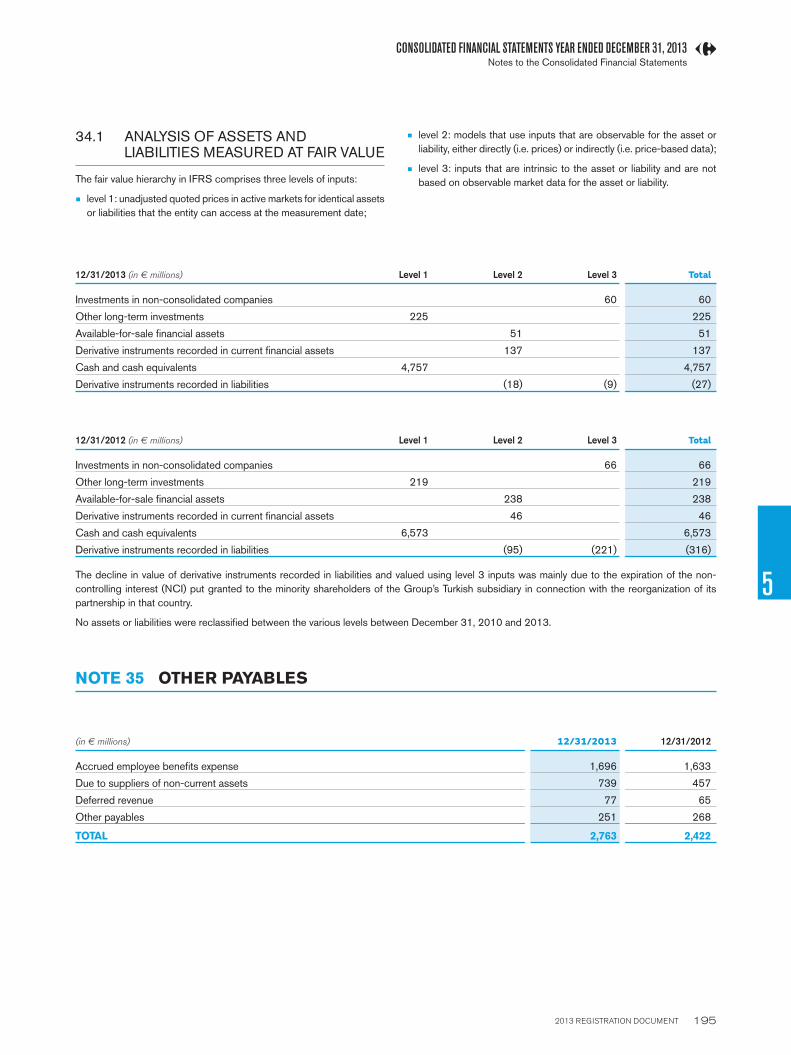
2013 REGISTRATION DOCUMENT 195
CONSOLIDATED FINANCIAL STATEMENTS YEAR ENDED DECEMBER 31, 2013
5
Notes to the Consolidated Financial Statements
12/31/2013 (in € millions) Level 1 Level 2 Level 3 Total
Investments in non-consolidated companies 60 60
Other long-term investments 225 225
Available-for-sale fi nancial assets 51 51
Derivative instruments recorded in current fi nancial assets 137 137
Cash and cash equivalents 4,757 4,757
Derivative instruments recorded in liabilities (18) (9) (27)
12/31/2012 (in € millions) Level 1 Level 2 Level 3 Total
Investments in non-consolidated companies 66 66
Other long-term investments 219 219
Available-for-sale fi nancial assets 238 238
Derivative instruments recorded in current fi nancial assets 46 46
Cash and cash equivalents 6,573 6,573
Derivative instruments recorded in liabilities (95) (221) (316)
The decline in value of derivative instruments recorded in liabilities and valued using level 3 inputs was mainly due to the expiration of the non-
controlling interest (NCI) put granted to the minority shareholders of the Group’s Turkish subsidiary in connection with the reorganization of its
partnership in that country.
No assets or liabilities were reclassifi ed between the various levels between December 31, 2010 and 2013.
34.1 ANALYSIS OF ASSETS AND LIABILITIES MEASURED AT FAIR VALUE
The fair value hierarchy in IFRS comprises three levels of inputs:
W level 1: unadjusted quoted prices in active markets for identical assets
or liabilities that the entity can access at the measurement date;
W level 2: models that use inputs that are observable for the asset or
liability, either directly (i.e. prices) or indirectly (i.e. price-based data);
W level 3: inputs that are intrinsic to the asset or liability and are not
based on observable market data for the asset or liability.
NOTE 35 OTHER PAYABLES
(in € millions) 12/31/2013 12/31/2012
Accrued employee benefi ts expense 1,696 1,633
Due to suppliers of non-current assets 739 457
Deferred revenue 77 65
Other payables 251 268
TOTAL 2,763 2,422
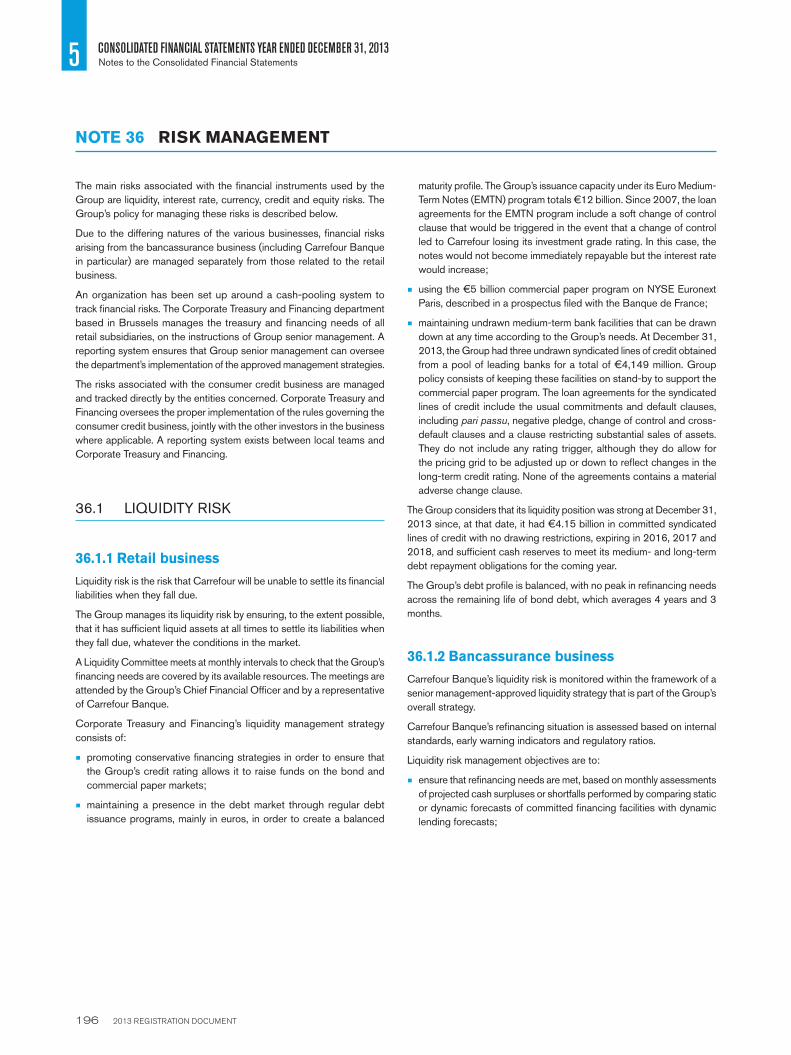
2013 REGISTRATION DOCUMENT 196
5 CONSOLIDATED FINANCIAL STATEMENTS YEAR ENDED DECEMBER 31, 2013Notes to the Consolidated Financial Statements
The main risks associated with the fi nancial instruments used by the
Group are liquidity, interest rate, currency, credit and equity risks. The
Group’s policy for managing these risks is described below.
Due to the differing natures of the various businesses, fi nancial risks
arising from the bancassurance business (including Carrefour Banque
in particular) are managed separately from those related to the retail
business.
An organization has been set up around a cash-pooling system to
track fi nancial risks. The Corporate Treasury and Financing department
based in Brussels manages the treasury and fi nancing needs of all
retail subsidiaries, on the instructions of Group senior management. A
reporting system ensures that Group senior management can oversee
the department’s implementation of the approved management strategies.
The risks associated with the consumer credit business are managed
and tracked directly by the entities concerned. Corporate Treasury and
Financing oversees the proper implementation of the rules governing the
consumer credit business, jointly with the other investors in the business
where applicable. A reporting system exists between local teams and
Corporate Treasury and Financing.
36.1 LIQUIDITY RISK
36.1.1 Retail business
Liquidity risk is the risk that Carrefour will be unable to settle its fi nancial
liabilities when they fall due.
The Group manages its liquidity risk by ensuring, to the extent possible,
that it has suffi cient liquid assets at all times to settle its liabilities when
they fall due, whatever the conditions in the market.
A Liquidity Committee meets at monthly intervals to check that the Group’s
fi nancing needs are covered by its available resources. The meetings are
attended by the Group’s Chief Financial Offi cer and by a representative
of Carrefour Banque.
Corporate Treasury and Financing’s liquidity management strategy
consists of:
W promoting conservative fi nancing strategies in order to ensure that
the Group’s credit rating allows it to raise funds on the bond and
commercial paper markets;
W maintaining a presence in the debt market through regular debt
issuance programs, mainly in euros, in order to create a balanced
maturity profi le. The Group’s issuance capacity under its Euro Medium-
Term Notes (EMTN) program totals €12 billion. Since 2007, the loan
agreements for the EMTN program include a soft change of control
clause that would be triggered in the event that a change of control
led to Carrefour losing its investment grade rating. In this case, the
notes would not become immediately repayable but the interest rate
would increase;
W using the €5 billion commercial paper program on NYSE Euronext
Paris, described in a prospectus fi led with the Banque de France;
W maintaining undrawn medium-term bank facilities that can be drawn
down at any time according to the Group’s needs. At December 31,
2013, the Group had three undrawn syndicated lines of credit obtained
from a pool of leading banks for a total of €4,149 million. Group
policy consists of keeping these facilities on stand-by to support the
commercial paper program. The loan agreements for the syndicated
lines of credit include the usual commitments and default clauses,
including pari passu, negative pledge, change of control and cross-
default clauses and a clause restricting substantial sales of assets.
They do not include any rating trigger, although they do allow for
the pricing grid to be adjusted up or down to refl ect changes in the
long-term credit rating. None of the agreements contains a material
adverse change clause.
The Group considers that its liquidity position was strong at December 31,
2013 since, at that date, it had €4.15 billion in committed syndicated
lines of credit with no drawing restrictions, expiring in 2016, 2017 and
2018, and suffi cient cash reserves to meet its medium- and long-term
debt repayment obligations for the coming year.
The Group’s debt profi le is balanced, with no peak in refi nancing needs
across the remaining life of bond debt, which averages 4 years and 3
months.
36.1.2 Bancassurance business
Carrefour Banque’s liquidity risk is monitored within the framework of a
senior management-approved liquidity strategy that is part of the Group’s
overall strategy.
Carrefour Banque’s refi nancing situation is assessed based on internal
standards, early warning indicators and regulatory ratios.
Liquidity risk management objectives are to:
W ensure that refi nancing needs are met, based on monthly assessments
of projected cash surpluses or shortfalls performed by comparing static
or dynamic forecasts of committed fi nancing facilities with dynamic
lending forecasts;
NOTE 36 RISK MANAGEMENT

2013 REGISTRATION DOCUMENT 197
CONSOLIDATED FINANCIAL STATEMENTS YEAR ENDED DECEMBER 31, 2013
5
Notes to the Consolidated Financial Statements
W gradually achieve compliance with the new Basel III liquidity ratios;
W diversify refi nancing sources to include bank loans, bond issues,
securitization programs, money market issues and customer deposits.
During 2013, Carrefour Banque carried out two major public
placements to support the fi nancing and development of its businesses:
W €300 million was raised through a 3-year variable rate bond issue
carried out in April;
W €400 million was raised through the November launch of a
reloadable securitization program. The program’s master trust
structure will allow Carrefour Banque to dynamically manage
asset-backed securities series issued by the securitization fund.
These two operations, which together raised €700 million, contribute to
the objective of complying with Basel III liquidity ratios by signifi cantly
extending the original life of the Bank’s debt and closely matching the
maturities of loans and borrowings.
The following tables analyze the cash fl ows generated by the Group’s fi nancial and other liabilities by period.
12/31/2013 (in € millions) Carrying amountContractual cash fl ows Within 1 year In 1 to 5 years Beyond 5 years
Borrowings hedged by fair value hedges 500 572 23 549 0
Borrowings hedged by cash fl ow hedges 251 252 0 251 0
Fixed rate borrowings 7,637 8,624 1,927 3,550 3,147
Unhedged borrowings 429 441 105 336 0
Finance lease liabilities 388 745 68 206 471
Derivative instruments 27 37 10 10 17
Total long and short-term borrowings 9,233 10,671 2,133 4,903 3,635
Suppliers and other creditors 12,854 12,854 12,854
Consumer credit fi nancing 4,911 4,911 3,145 1,765
Other payables 2,763 2,763 2,763
TOTAL 29,759 31,198 20,895 6,668 3,635
12/31/2012 (in € millions) Carrying amountContractual cash fl ows Within 1 year In 1 to 5 years Beyond 5 years
Borrowings hedged by fair value hedges 538 593 22 570
Borrowings hedged by cash fl ow hedges 251 252 1 252
Fixed rate borrowings 9,290 10,077 2,722 4,608 2,747
Unhedged borrowings 429 431 1 431
Finance lease liabilities 420 786 66 213 507
Derivative instruments 317 278 30 26 222
Total long and short-term borrowings 11,245 12,417 2,842 6,100 3,476
Suppliers and other creditors 12,925 12,925 12,925
Consumer credit fi nancing 4,998 4,998 3,032 1,966
Other payables 2,358 2,358 2,358
TOTAL 31,526 32,698 21,157 8,066 3,476

2013 REGISTRATION DOCUMENT 198
5 CONSOLIDATED FINANCIAL STATEMENTS YEAR ENDED DECEMBER 31, 2013Notes to the Consolidated Financial Statements
The following table shows the sensitivity of total borrowings to changes in interest rates over one year:
(- = loss; + = gain) (in € millions)
50-bps decline 50-bps increase
Impact on shareholders' equity
Impact on income statement
Impact on shareholders' equity
Impact on income statement
Investments (3.2) (1) 9.0
Variable rate borrowings 2.1 (2.1)
Borrowings hedged by fair value hedges (8.1) 8.0
Swaps qualifi ed as fair value hedges 7.9 (7.8)
Swaps qualifi ed as cash fl ow hedges (1.1) 1.1
Options classifi ed as cash fl ow hedges (0.2) (14.6) 4.2 15.8
Options classifi ed as held for trading 3.5 0.9
TOTAL EFFECT (1.3) (12.4) 5.3 23.8
(1) Rate subject to a 0% fl oor.
36.2 INTEREST RATE RISK
Interest rate risk is the risk of a change in interest rates leading to an
increase in the Group’s net borrowing costs.
It is managed at headquarters level by Corporate Treasury and Financing,
which reports monthly to an Interest Rate Risk Committee responsible
for recommending hedging strategies and methods to be used to limit
interest rate exposures and optimize borrowing costs.
Long-term borrowings are generally at fi xed rates of interest and do not
therefore give rise to any exposure to rising interest rates.
Various fi nancial instruments are nonetheless used to hedge borrowings
against the risk of changes in interest rates. These are mainly basic
swaps and options. Hedge accounting is applied in all cases where the
required criteria are met.
Variable rate long-term borrowings are hedged using fi nancial instruments
that cap rises in interest rates over all or part of the life of the debt.
36.3 CURRENCY RISK
Currency transaction risk is the risk of an unfavorable change in exchange
rates having an adverse effect on cash fl ows from commercial transactions
denominated in foreign currency.
The Group conducts its international operations through subsidiaries that
operate almost exclusively in their home country, such that purchases
and sales are denominated in local currency. As a result, the Group’s
exposure to currency risk on commercial transactions is naturally limited
and mainly concerns imported products. Currency risks on import
transactions (i.e. goods purchases billed in foreign currencies) covered
by fi rm commitments are hedged by forward purchases of the payment
currency. Currency hedges are generally for periods of less than 12
months.
Effect of an increase/decrease in exchange rates on instruments accounted for as cash fl ow hedges:
(in € millions)
10% decline 10% increase
Impact on shareholders' equity
Impact on income statement
Impact on shareholders' equity
Impact on income statement
USD/EUR Cash Flow hedging position (30.8) - 30.8 -
RON/EUR Cash Flow hedging position 1.3 - (1.3) -
HKD / EUR Cash Flow hedging position 0.3 - (0.3) -
SGD / EUR Cash Flow hedging position (0.3) - 0.3 -

2013 REGISTRATION DOCUMENT 199
CONSOLIDATED FINANCIAL STATEMENTS YEAR ENDED DECEMBER 31, 2013
5
Notes to the Consolidated Financial Statements
36.4 CREDIT RISK
The Group’s estimated exposure to credit risk is presented below:
Exposure to credit risk (in € millions) 12/31/2013 12/31/2012
Investments in non-consolidated companies 60 66
Other long-term investments 1,086 1,059
TOTAL OTHER NON-CURRENT FINANCIAL ASSETS 1,146 1,125
Consumer credit granted by the fi nancial services companies 5,602 5,646
Trade receivables 2,213 2,144
Other current fi nancial assets 359 352
Other assets 545 482
Cash and cash equivalents 4,757 6,573
MAXIMUM EXPOSURE TO CREDIT RISK 14,641 16,322
36.4.1 Retail business
1) Trade receivables
Trade receivables correspond mainly to amounts receivable from franchisees (for delivered goods and franchise fees), suppliers (mainly rebates) and
tenants of shopping mall units (rent). Depreciation is recognized where necessary, based on an estimate of the debtor’s ability to pay the amount
due and the age of the receivable.
CHANGES IN DEPRECIATION ON TRADE RECEIVABLES
December 31, 2011 (240)
Increases (116)
Reversals 106
Other movements 41
December 31, 2012 (209)
Increases (41)
Reversals 43
Other movements 4
December 31, 2013 (203)
The currency translation risk is the risk of an unfavorable change in
exchange rates reducing the value of the net assets of a subsidiary
whose functional currency is not the euro, after conversion into euro for
inclusion in the Group’s consolidated statement of fi nancial position.
The consolidated statement of fi nancial position and income statement
are exposed to a currency translation risk: consolidated fi nancial ratios
are affected by changes in exchange rates used to translate the income
and net assets of foreign subsidiaries operating outside the euro zone.
The translation risk on foreign operations outside the euro zone mainly
concerns the Brazilian real and Argentine pesos. For example, changes
in the average exchange rates used in 2013 compared with those for
2012 reduced consolidated net sales by €2,326 million or 3.1% and
operating income by €73 million or 3.1%.
Lastly, when fi nancing is arranged locally, it is generally denominated
in local currency.

2013 REGISTRATION DOCUMENT 200
5 CONSOLIDATED FINANCIAL STATEMENTS YEAR ENDED DECEMBER 31, 2013Notes to the Consolidated Financial Statements
At December 31, 2013, trade receivables net of depreciation amounted
to €1,127 million (see Note 23). At that date, past due receivables
amounted to a net €120 million, with receivables over 90 days past
due representing 2.1% of total trade receivables net of impairment. No
additional depreciation has been recognized for these receivables as the
Group considers that the risk of non-recovery is very limited.
2) Investments
The Group’s short-term cash management strategy focuses on acquiring
liquid investments that are easily convertible into cash and are subject
to an insignifi cant risk of changes in value.
Investments are made for the most part by Corporate Treasury and
Financing, in diversifi ed instruments such as term deposits with leading
banks and mutual funds classifi ed by the AMF as “money market” and
“short-term money market” funds without any withdrawal restrictions.
Investments made at the country level are approved by Corporate Treasury
and Financing.
Counterparty risk monitoring procedures are implemented to track
counterparties’ direct investment strategies and the underlying assets
held by mutual funds in which the Group invests. The Group’s objective
is to never hold more than 5% of a fund’s units and to never invest more
than €250 million in any single fund.
36.4.2 Bancassurance business
1) Credit risk management
To protect against default by borrowers, the Group’s fi nance companies
have set up systems to check the quality and repayment capacity of their
customers. These include:
W decision-making aids such as credit scoring applications, income/debt
simulation tools and credit history checking procedures;
W interrogation of positive and negative credit history databases, where
they exist;
W active management of collection processes;
W credit risk monitoring and control systems.
Within each credit company, a Credit Risk department is responsible
for all of these processes, and the Board of Directors receives copies
of all Credit Risk Management Committee reports.
At Group level, a Credit Risk – Europe unit has been set up to oversee
and implement credit risk management policies in France, Spain, Belgium
and Italy.
2) Provisions for non-performing consumer loans
Consumer loans are classifi ed as non-performing when the Group
believes that there is a risk that all or part of the amount due will not be
recovered (for example, because of overdue payment).
Provision models are developed in accordance with local banking
regulations in each country, according to a two-step process:
W classifi cation of outstanding loans in uniform risk categories based
on the probability of default; then
W modeling of the loss given default based on historical data.
In a certain number of countries, specifi c provisions are also recorded for
certain types of exposures, to comply with local central bank guidelines.
ANALYSIS OF DUE AND PAST DUE CONSUMER LOANS
(in € millions)
12/31/2013 Amounts due and past-due at the period-end
Amounts not yet due at the
period-end 0 to 3 months 3 to 6 months6 months to 1 year
More than one year
Consumer credit granted by the fi nancial services companies 5,602 5,387 92 30 17 75
(in € millions)
12/31/2012 Amounts due and past-due at the period-end
Amounts not yet due at the
period-end 0 to 3 months 3 to 6 months6 months to 1 year
More than one year
Consumer credit granted by the fi nancial services companies 5,646 5,146 352 46 28 73
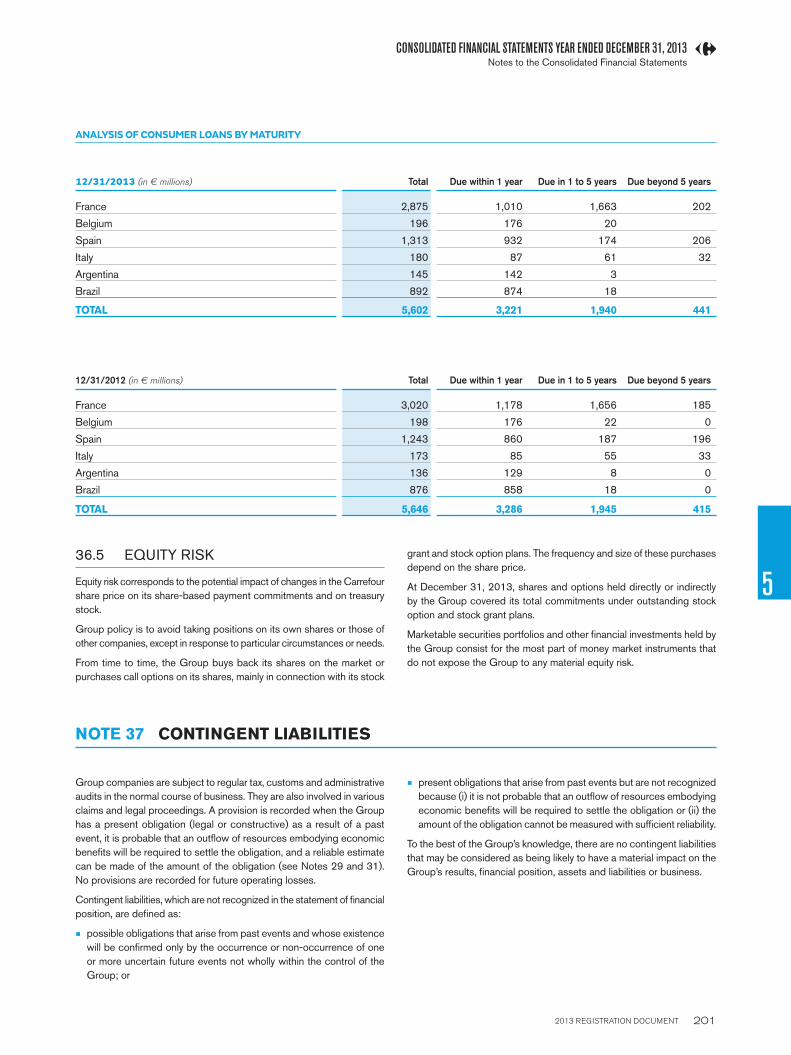
2013 REGISTRATION DOCUMENT 201
CONSOLIDATED FINANCIAL STATEMENTS YEAR ENDED DECEMBER 31, 2013
5
Notes to the Consolidated Financial Statements
ANALYSIS OF CONSUMER LOANS BY MATURITY
12/31/2013 (in € millions) Total Due within 1 year Due in 1 to 5 years Due beyond 5 years
France 2,875 1,010 1,663 202
Belgium 196 176 20
Spain 1,313 932 174 206
Italy 180 87 61 32
Argentina 145 142 3
Brazil 892 874 18
TOTAL 5,602 3,221 1,940 441
12/31/2012 (in € millions) Total Due within 1 year Due in 1 to 5 years Due beyond 5 years
France 3,020 1,178 1,656 185
Belgium 198 176 22 0
Spain 1,243 860 187 196
Italy 173 85 55 33
Argentina 136 129 8 0
Brazil 876 858 18 0
TOTAL 5,646 3,286 1,945 415
36.5 EQUITY RISK
Equity risk corresponds to the potential impact of changes in the Carrefour
share price on its share-based payment commitments and on treasury
stock.
Group policy is to avoid taking positions on its own shares or those of
other companies, except in response to particular circumstances or needs.
From time to time, the Group buys back its shares on the market or
purchases call options on its shares, mainly in connection with its stock
grant and stock option plans. The frequency and size of these purchases
depend on the share price.
At December 31, 2013, shares and options held directly or indirectly
by the Group covered its total commitments under outstanding stock
option and stock grant plans.
Marketable securities portfolios and other fi nancial investments held by
the Group consist for the most part of money market instruments that
do not expose the Group to any material equity risk.
NOTE 37 CONTINGENT LIABILITIES
Group companies are subject to regular tax, customs and administrative
audits in the normal course of business. They are also involved in various
claims and legal proceedings. A provision is recorded when the Group
has a present obligation (legal or constructive) as a result of a past
event, it is probable that an outfl ow of resources embodying economic
benefi ts will be required to settle the obligation, and a reliable estimate
can be made of the amount of the obligation (see Notes 29 and 31).
No provisions are recorded for future operating losses.
Contingent liabilities, which are not recognized in the statement of fi nancial
position, are defi ned as:
W possible obligations that arise from past events and whose existence
will be confi rmed only by the occurrence or non-occurrence of one
or more uncertain future events not wholly within the control of the
Group; or
W present obligations that arise from past events but are not recognized
because (i) it is not probable that an outfl ow of resources embodying
economic benefi ts will be required to settle the obligation or (ii) the
amount of the obligation cannot be measured with suffi cient reliability.
To the best of the Group’s knowledge, there are no contingent liabilities
that may be considered as being likely to have a material impact on the
Group’s results, fi nancial position, assets and liabilities or business.

2013 REGISTRATION DOCUMENT 202
5 CONSOLIDATED FINANCIAL STATEMENTS YEAR ENDED DECEMBER 31, 2013Notes to the Consolidated Financial Statements
(in € millions) 12/31/013 12/31/2012 Change
Change in inventory (135) 687 (822)
Change in trade receivables (34) 79 (113)
Change in trade payables (31) (764) 733
Change in loyalty program liabilities and other 276 142 134
Change in trade working capital requirement 76 145 (69)
Change in other receivables and payables (361) (174) (187)
Change in working capital requirement (284) (29) (255)
NOTE 38 CHANGE IN WORKING CAPITAL REQUIREMENT
NOTE 39 OFF-BALANCE SHEET COMMITMENTS
Commitments given and received by the Group that are not recognized in
the statement of fi nancial position correspond to contractual obligations
whose performance depends on the occurrence of conditions or
transactions after the period-end. There are three types of off-balance
sheet commitments, related to (i) cash transactions, (ii) retailing operations
and (iii) acquisitions of securities. The Group is also party to leases that
give rise to future commitments such as for the payment of rent on retail
units leased by the Group from owners (commitments given), and the
payment of rent on retail units in shopping malls owned by the Group
and leased to other parties (commitments received).
12/31/2013 By maturity 12/31/2012 (1)
Commitments given (in € millions)
Due within 1 year
Due in 1 to 5 years
Due beyond 5 years
Related to cash management transactions 8,258 4,835 2,603 820 9,159
Financial services companies 7,150 4,659 2,483 8 7,526
Other companies 1,107 176 120 811 1,633
Related to operations/real estate/expansion, etc. 1,942 1,047 747 148 2,407
Related to sales of securities 169 39 63 67 313
Related to leases 3,217 886 1,446 885 4,116
TOTAL 15,586 6,806 4,860 1,920 15,996
(1) Including €486 million concerning entities classifi ed as discontinued operations in accordance with IFRS 5.
12/31/2013 By maturity 12/31/2012 (1)
Commitments received (in € millions)
Due within 1 year
Due in 1 to 5 years
Due beyond 5 years
Related to cash management transactions 6,752 1,535 5,177 40 7,216
Financial services companies 1,656 698 958 0 1,848
Other companies 5,096 837 4,219 40 5,368
Related to operations/real estate/expansion, etc. 882 174 444 264 740
Related to sales of securities 303 188 79 36 298
Related to leases 830 293 385 152 990
TOTAL 8,766 2,191 6,085 491 9,245
(1) Including €151 million concerning entities classifi ed as discontinued operations in accordance with IFRS 5.

2013 REGISTRATION DOCUMENT 203
CONSOLIDATED FINANCIAL STATEMENTS YEAR ENDED DECEMBER 31, 2013
5
Notes to the Consolidated Financial Statements
Off-balance sheet commitments related to cash transactions include:
W credit commitments given to customers by the fi nancial services
companies in the course of their operating activities, and credit
commitments received from banks;
W mortgages and other guarantees given or received, mainly in connection
with the Group’s real estate activities;
W committed lines of credit available to the Group but not drawn down
at the period-end.
Off-balance sheet commitments related to operations include:
W commitments to purchase land given in connection with the Group’s
expansion programs;
W miscellaneous commitments arising from commercial contracts;
W performance bonds issued in connection with the Group’s expansion
programs;
W rent guarantees and guarantees from shopping mall operators;
W guarantees for the payment of receivables;
W other commitments given or received.
Off-balance sheet commitments related to purchases and sales of
securities consist of fi rm commitments to purchase and sell securities
received from third parties:
W for the most part in France, in connection with the Group’s franchising
activities;
W including immediately exercisable put and call options and sellers’
warranties given to third parties. No value is attributed to sellers’
warranties received by the Group.
Off-balance sheet commitments related to leases:
At December 31, 2013, 692 hypermarket properties and 530 supermarket
properties were owned outright out of a total consolidated store base
of 1,168 hypermarkets and 1,274 supermarkets.
Rent on store properties not owned by the Group totaled €905 million
in 2013 (see Note 9).
Of total future minimum rentals, 24% are due within one year, 42% in
one to fi ve years and 34% beyond fi ve years.
Future minimum rentals under operating leases – determined based on
the Group’s maximum commitment in terms of both duration and amount
for each of the property leases in progress at the period-end – amounted
to €3,217 million, or €2,551 million after discounting.
The Group also owns various shopping malls, mainly built on the same
sites as its hypermarkets and supermarkets. Rental of the retail units in
these malls generated revenues of €247 million in 2013. Future minimum
rentals receivable from these retail units – determined based on the
tenants’ maximum commitment in terms of both duration and amount for
each of the leases in progress at the period-end – amounted to €830
million, or €678 million after discounting.
NOTE 40 EMPLOYEE INFORMATION
12/31/2013 12/31/2012 (1)
Average number of Group employees 351,463 349,776
Number of Group employees at the period-end 363,989 357,342
(1) To permit meaningful comparisons, employee numbers for 2012 have been restated to take into account the loss of control of operations in Turkey and the reclassifi cation of the Indian subsidiary as a discontinued operation in accordance with IFRS 5.

2013 REGISTRATION DOCUMENT 204
5 CONSOLIDATED FINANCIAL STATEMENTS YEAR ENDED DECEMBER 31, 2013Notes to the Consolidated Financial Statements
41.1 RELATED PARTY TRANSACTIONS
The following table presents the main related party transactions carried out in 2013 with companies over which the Group exercised signifi cant
infl uence or joint control at December 31, 2013.
(in € millions) Carrefour SA Provencia Mestdagh
Net sales (sales of goods) 0 556 125
Franchise fees 1 8 7
Receivables at December 31 2 36 12
NOTE 41 RELATED PARTIES
41.2 OTHER RELATED PARTY TRANSACTIONS
Massy building leased off-plan from the Colony Group
The 12-year lease came into effect on delivery of the building, on
December 20, 2013. The annual rent for the entire building is set at
€21 million. The rent paid by Carrefour depends on the actual surface
area leased and is subject to an escalation clause based on France’s
INSEE construction cost index. Carrefour has negotiated an initial rent-
free period of 12 months.
NOTE 42 MANAGEMENT COMPENSATION
The following table shows the compensation paid by the Group to serving members of the Management team and the Board of Directors during
2013 and 2012. Comparative information for 2012 has been restated on the same basis.
(in € millions) 2013 2012
Compensation for the period 4.3 5.5
Prior year bonus 4.7 3.4
Benefi ts in kind (accommodation and company car) 0.2 0.1
Total compensation paid during the period 9.2 9.0
Employer payroll taxes 3.2 4.2
Termination benefi ts 0.4 3.8
Other management benefi t plans are as follows:
W defi ned benefi t pension plan described in Note 30;
W stock option and stock grant plans. At December 31, 2013, serving
members of Group management held 142,575 stock options (at
December 31, 2012, serving members of Group management held
511,845 stock options and 4,107 stock grant rights).
Directors’ attendance fees paid to members of the Board of Directors
amounted to €0.8 million in 2013 (2012: €0.8 million).

2013 REGISTRATION DOCUMENT 205
CONSOLIDATED FINANCIAL STATEMENTS YEAR ENDED DECEMBER 31, 2013
5
Notes to the Consolidated Financial Statements
No events have occurred since the year-end that would have a material impact on the Consolidated Financial Statements.
NOTE 43 SUBSEQUENT EVENTS
NOTE 44 FEES PAID TO THE AUDITORS
2013 2012
(in € millions)
Deloitte & Associés KPMG Mazars Total
Deloitte & Associés KPMG Mazars Total
Audit services 2.3 9.1 2.5 13.9 2.7 9.8 2.9 15.4
Other services 0.7 0.5 0.1 1.3 0.3 0.2 0.0 0.5
TOTAL 3.0 9.6 2.6 15.2 3.0 10.0 2.9 15.9
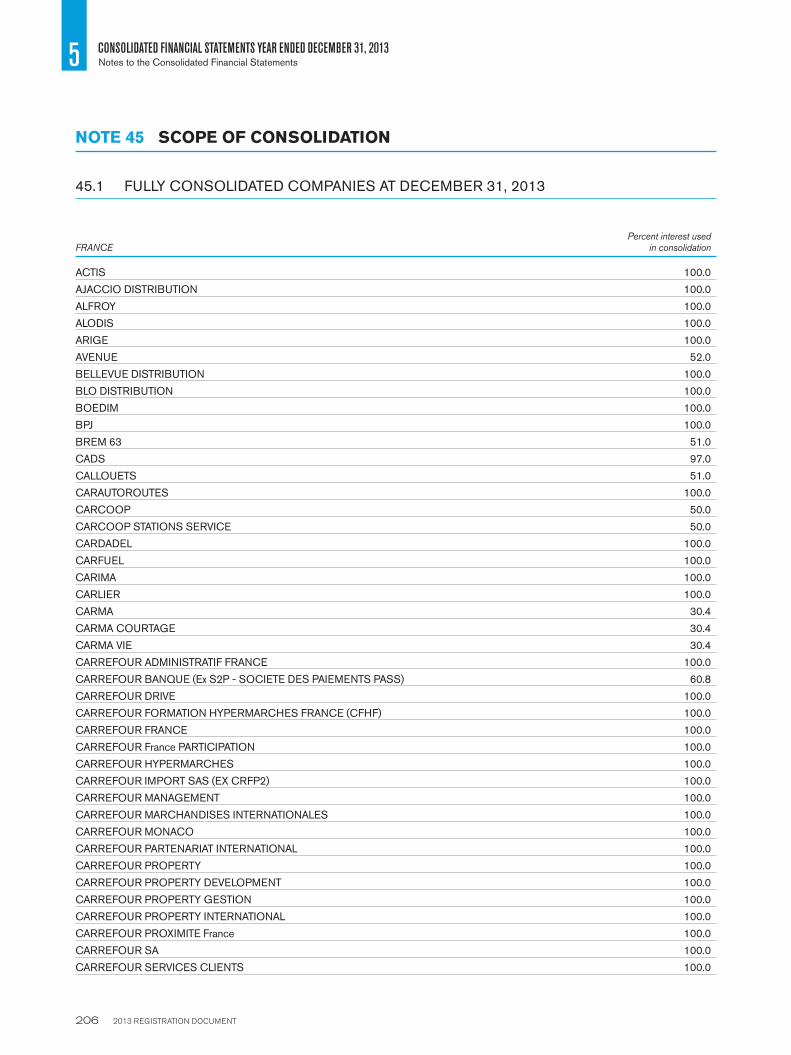
2013 REGISTRATION DOCUMENT 206
5 CONSOLIDATED FINANCIAL STATEMENTS YEAR ENDED DECEMBER 31, 2013Notes to the Consolidated Financial Statements
45.1 FULLY CONSOLIDATED COMPANIES AT DECEMBER 31, 2013
FRANCEPercent interest used
in consolidation
ACTIS 100.0
AJACCIO DISTRIBUTION 100.0
ALFROY 100.0
ALODIS 100.0
ARIGE 100.0
AVENUE 52.0
BELLEVUE DISTRIBUTION 100.0
BLO DISTRIBUTION 100.0
BOEDIM 100.0
BPJ 100.0
BREM 63 51.0
CADS 97.0
CALLOUETS 51.0
CARAUTOROUTES 100.0
CARCOOP 50.0
CARCOOP STATIONS SERVICE 50.0
CARDADEL 100.0
CARFUEL 100.0
CARIMA 100.0
CARLIER 100.0
CARMA 30.4
CARMA COURTAGE 30.4
CARMA VIE 30.4
CARREFOUR ADMINISTRATIF FRANCE 100.0
CARREFOUR BANQUE (Ex S2P - SOCIETE DES PAIEMENTS PASS) 60.8
CARREFOUR DRIVE 100.0
CARREFOUR FORMATION HYPERMARCHES FRANCE (CFHF) 100.0
CARREFOUR FRANCE 100.0
CARREFOUR France PARTICIPATION 100.0
CARREFOUR HYPERMARCHES 100.0
CARREFOUR IMPORT SAS (EX CRFP2) 100.0
CARREFOUR MANAGEMENT 100.0
CARREFOUR MARCHANDISES INTERNATIONALES 100.0
CARREFOUR MONACO 100.0
CARREFOUR PARTENARIAT INTERNATIONAL 100.0
CARREFOUR PROPERTY 100.0
CARREFOUR PROPERTY DEVELOPMENT 100.0
CARREFOUR PROPERTY GESTION 100.0
CARREFOUR PROPERTY INTERNATIONAL 100.0
CARREFOUR PROXIMITE France 100.0
CARREFOUR SA 100.0
CARREFOUR SERVICES CLIENTS 100.0
NOTE 45 SCOPE OF CONSOLIDATION

2013 REGISTRATION DOCUMENT 207
CONSOLIDATED FINANCIAL STATEMENTS YEAR ENDED DECEMBER 31, 2013
5
Notes to the Consolidated Financial Statements
FRANCEPercent interest used
in consolidation
CARREFOUR STATION SERVICE (ex PARIDIS 75) 100.0
CARREFOUR SYSTEMES D'INFORMATIONS FRANCE 100.0
CARREFOUR VOYAGES 100.0
CARVILLENEUVE 100.0
CASCH 100.0
CENTRE COMMERCIAL DE LESCAR 99.5
CHALLENGER 100.0
CHAMNORD 59.6
CHAMPION SUPERMARCHES FRANCE (C.S.F) 100.0
CHRISTHALIE 100.0
CLAIREFONTAINE 100.0
COMPAGNIE D'ACTIVITE ET DE COMMERCE INTERNATIONAL -CACI- 100.0
CONTINENT 2001 100.0
COSG 100.0
COVICAR 23 100.0
COVIAM 8 100.0
COVICAR 2 100.0
CP TRANSACTIONS 100.0
CPF ASSET MANAGEMENT 100.0
CRF REGIE PUBLICITAIRE 100.0
CRFP4 100.0
CRFP8 100.0
CRFP10 100.0
CRFP11 100.0
CRFP13 100.0
CRFP14 100.0
CRFP15 100.0
CRFP16 100.0
CSD 74.0
CSD TRANSPORTS 74.0
CSF France 100.0
CSF France STATIONS SERVICES 100.0
DAUPHINOISE DE PARTICIPATIONS 100.0
DE LA COQUERIE 51.0
DE LA FONTAINE 51.0
DE LA VALLEE 100.0
DE SIAM 51.0
DELDIS 100.0
DES TROIS G 97.0
DISTRIVAL 100.0
DUCAR 100.0
ECALHAN 51.0
EPG 66.0
EUROMARCHE 100.0
FALDIS 100.0
FINANCIERE RSV 100.0
FINIFAC 100.0
FLORADIS 100.0

2013 REGISTRATION DOCUMENT 208
5 CONSOLIDATED FINANCIAL STATEMENTS YEAR ENDED DECEMBER 31, 2013Notes to the Consolidated Financial Statements
FRANCEPercent interest used
in consolidation
FORUM DEVELOPPEMENT 100.0
FRANCY 100.0
GAMACASH 100.0
GENEDIS 100.0
GERFLO 100.0
GERNIMES 100.0
GIE CARREFOUR PERSONAL FINANCE SERVICES 53.0
GIMONDIS 100.0
GM CARREFOUR (ex COVICAR 18) 100.0
GMC FRANCE 100.0
GMC STATIONS SERVICE 100.0
GUILVIDIS 100.0
GUYENNE ET GASCOGNE 100.0
GVTIMM 51.0
HAUTS DE ROYA 100.0
HERMES 100.0
HYPARLO SAS 100.0
IMMAUFFAY 51.0
IMMO ARTEMARE 51.0
IMMO BACQUEVILLE 51.0
IMMO DRIVE 100.0
IMMO REBAIS 51.0
IMMOBILIERE CARREFOUR 100.0
IMMOCYPRIEN 51.0
IMMODIS 100.0
IMMODIS (ex HYPARMO) 100.0
IMMODIVINE 51.0
IMMOLOUBES 51.0
IMMOTOURNAY 51.0
IMMOTRIVE 100.0
INTERDIS 100.0
KERGALYS 99.96
LA BAUDRIERE 51.0
LA BLANCHISSERIE 100.0
LA CIOTAT DISTRIBUTION SNC 100.0
LA CROIX VIGNON 51.0
LA GERSOISE 51.0
LA MESTRASAISE 51.0
LA SABLONNIERE 100.0
LALAUDIS 99.0
LANN KERGUEN 51.3
LAPALUS & FILS (ETABS) 100.0
LE COURTEMBLET 100.0
LES TASSEAUX 51.0
LES TRANCHEES 100.0
LES VALLES 51.0
LIMADOR 100.0
LOGIDIS 100.0
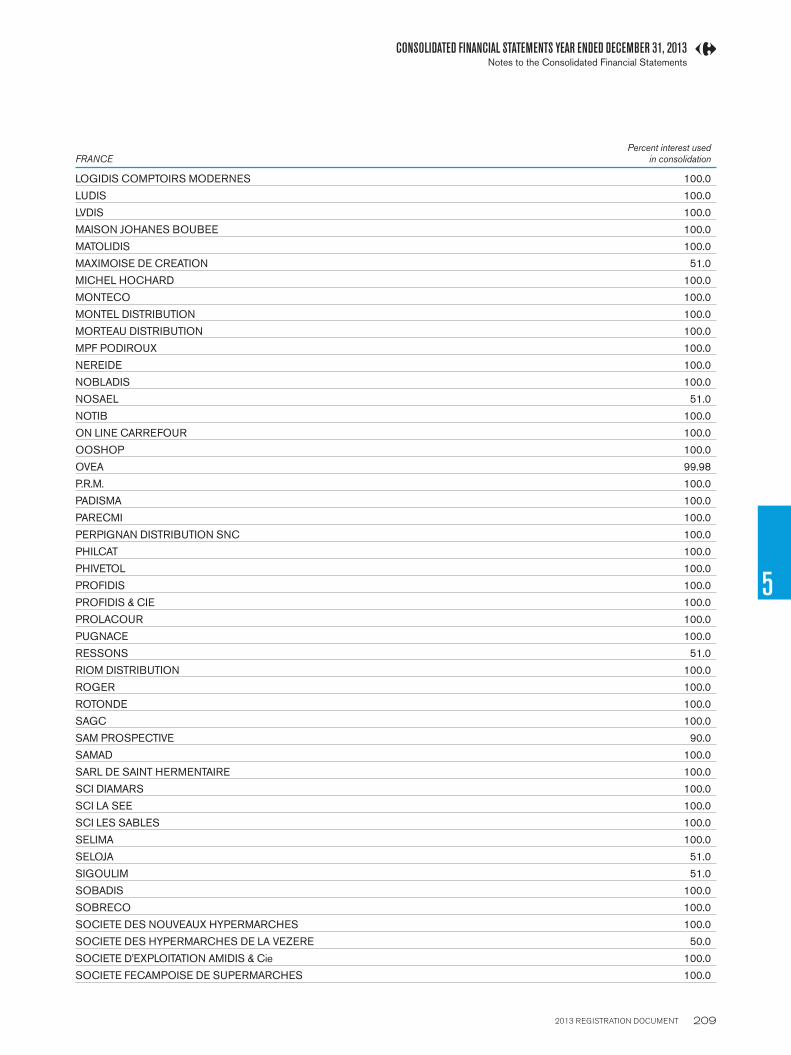
2013 REGISTRATION DOCUMENT 209
CONSOLIDATED FINANCIAL STATEMENTS YEAR ENDED DECEMBER 31, 2013
5
Notes to the Consolidated Financial Statements
FRANCEPercent interest used
in consolidation
LOGIDIS COMPTOIRS MODERNES 100.0
LUDIS 100.0
LVDIS 100.0
MAISON JOHANES BOUBEE 100.0
MATOLIDIS 100.0
MAXIMOISE DE CREATION 51.0
MICHEL HOCHARD 100.0
MONTECO 100.0
MONTEL DISTRIBUTION 100.0
MORTEAU DISTRIBUTION 100.0
MPF PODIROUX 100.0
NEREIDE 100.0
NOBLADIS 100.0
NOSAEL 51.0
NOTIB 100.0
ON LINE CARREFOUR 100.0
OOSHOP 100.0
OVEA 99.98
P.R.M. 100.0
PADISMA 100.0
PARECMI 100.0
PERPIGNAN DISTRIBUTION SNC 100.0
PHILCAT 100.0
PHIVETOL 100.0
PROFIDIS 100.0
PROFIDIS & CIE 100.0
PROLACOUR 100.0
PUGNACE 100.0
RESSONS 51.0
RIOM DISTRIBUTION 100.0
ROGER 100.0
ROTONDE 100.0
SAGC 100.0
SAM PROSPECTIVE 90.0
SAMAD 100.0
SARL DE SAINT HERMENTAIRE 100.0
SCI DIAMARS 100.0
SCI LA SEE 100.0
SCI LES SABLES 100.0
SELIMA 100.0
SELOJA 51.0
SIGOULIM 51.0
SOBADIS 100.0
SOBRECO 100.0
SOCIETE DES NOUVEAUX HYPERMARCHES 100.0
SOCIETE DES HYPERMARCHES DE LA VEZERE 50.0
SOCIETE D'EXPLOITATION AMIDIS & Cie 100.0
SOCIETE FECAMPOISE DE SUPERMARCHES 100.0

2013 REGISTRATION DOCUMENT 210
5 CONSOLIDATED FINANCIAL STATEMENTS YEAR ENDED DECEMBER 31, 2013Notes to the Consolidated Financial Statements
FRANCEPercent interest used
in consolidation
SOCIETE NOUVELLE SOGARA 100.0
SODIMOB 100.0
SODISAL 100.0
SODISCAF 100.0
SODITRIVE 100.0
SOFALINE 100.0
SOFIDIM 99.0
SOFODIS 100.0
SOGARA 100.0
SOGARA DRIVE 100.0
SOGARA FRANCE 100.0
SOGARA STATION SERVICE 100.0
SOLEDIS 100.0
SOMAFRE 100.0
SOPROMAL 100.0
SOVAL 100.0
SOVIDIS 100.0
SOVIDIS PROPRIANO 100.0
STELAUR 100.0
SUPERDIS 96.5
TERTRA 51.0
TOURANGELLE DE PARTICIPATIONS 100.0
UNICAGES 100.0
UNIVU 100.0
VARJEA 100.0
VEZERE DISTRIBUTION 50.0
VIERDIS 100.0
VISAGE 100.0
VIZEGU 90.0
GERMANY
CARREFOUR PROCUREMENT INTERNATIONAL AG & CO. KG 100.0
ARGENTINA
BANCO DE SERVICIOS FINANCIEROS SA 60.0
INC S.A. 100.0

2013 REGISTRATION DOCUMENT 211
CONSOLIDATED FINANCIAL STATEMENTS YEAR ENDED DECEMBER 31, 2013
5
Notes to the Consolidated Financial Statements
BELGIUM
ALL IN FOOD 100.0
BIGG'S SA 100.0
BRUGGE RETAIL ASSOCIATE 100.0
CARREFOUR BELGIUM 100.0
CARREFOUR Finance 100.0
CARUM 100.0
DE NETELAAR 100.0
DEURNE RETAIL ASSOCIATE 100.0
DIKON 100.0
ECLAIR 100.0
EXTENSION BEL-TEX 100.0
FILUNIC 100.0
FIMASER 60.8
FOMAR 100.0
FRESHFOOD 100.0
GB RETAIL ASSOCIATES SA 100.0
GENT DAMPOORT RETAIL ASSOCIATE 100.0
GMR 100.0
GROSFRUIT 100.0
HALLE RETAIL ASSOCIATE 100.0
HEPPEN RETAIL ASSOCIATE 100.0
LA LOUVIERE RETAIL ASSOCIATE 100.0
MABE 100.0
MARKET A1 CBRA 100.0
MARKET B2 CBRA 100.0
MARKET C3 CBRA 100.0
MARKET D4 CBRA 100.0
NORTHSHORE PARTICIPATION 100.0
OUDENARDE RETAIL 100.0
QUIEVRAIN RETAIL ASSOCIATE 100.0
R&D FOOD 100.0
ROB 100.0
RULUK 100.0
SAMDIS 100.0
SCHILCO 100.0
SOCIETE RELAIS 100.0
SOUTH MED INVESTMENTS 100.0
STIGAM 100.0
VANDEN MEERSSCHE NV 100.0
VERSMARKT 100.0
WAPRO 100.0

2013 REGISTRATION DOCUMENT 212
5 CONSOLIDATED FINANCIAL STATEMENTS YEAR ENDED DECEMBER 31, 2013Notes to the Consolidated Financial Statements
BRAZIL
ATACADAO DISTRIBUICAO COMERCIO E INDUSTRIA LTDA 100.0
BANCO CSF S.A. 51.0
BREPA COMERCIO PARTICIPACAO LTDA 100.0
BSF HOLDING S.A. 51.0
CARREFOUR COMMERCIO E INDUSTRIA LTDA 100.0
CARREFOUR VIAGENS E TURISMO LTDA. 100.0
COMERCIAL DE ALIMENTOS CARREFOUR S.A. 100.0
IMOPAR PARTICIPCOES E ADMINISTRACAO IMOBILIARIA LTDA 100.0
LOJIPART PARTICIPACOES SA 100.0
NOVA GAULE COMERCIO E PARTICIPACOES S.A. 100.0
PANDORA PARTICIPACOES LTDA 100.0
POSTO ARRUDA PEREIRA 100.0
RIO BONITO ASSESSORIA DE NEGOCIOS LTDA 100.0
TROPICARGAS TRANSPORTES LTDA. 100.0
VERPARINVEST SA 100.0
CHINA
BEIJING CARREFOUR COMMERCIAL CO., LTD. 55.0
BEIJING CHAMPION SHOULIAN COMMUNITY CHAIN STORES CO LTD 100.0
BEIJING CHUANGYIJIA CARREFOUR COMMERCIAL 100.0
BEIJING REPRESENTATIVE OFFICE OF CARREFOUR S.A. 100.0
CARREFOUR (CHINA) MANAGEMENT & CONSULTING SERVICES CO. 100.0
CHANGCHUN CARREFOUR COMMERCIAL CO., LTD. 75.0
CHANGSHA CARREFOUR HYPERMARKET 100.0
CHANGZHOU YUEDA CARREFOUR COMMERCIAL CO., LTD. 60.0
CHENGDU CARREFOUR HYPERMARKET CO LTD 80.0
CHENGDU YUSHENG INDUSTRIAL DEVELOPMENT CO LTD 100.0
CHONGQING CARREFOUR COMMERCIAL CO LTD 65.0
DALIAN CARREFOUR COMMERCIAL CO., LTD. 65.0
DONGGUAN CARREFOUR COMMERCIAL CO., LTD 100.0
DONGGUAN DONESHENG SUPERMARKET CO 100.0
FOSHAN CARREFOUR COMMERCIAL CO.,LTD 100.0
FUZHOU CARREFOUR COMMERCIAL CO LTD 100.0
GUANGZHOU JIAGUANG SUPERMARKET CO 100.0
GUIZHOU CARREFOUR COMMERCIAL CO.,LTD 100.0
HAIKOU CARREFOUR COMMERCIAL 100.0
HANGZHOU CARREFOUR HYPERMARKET CO., LTD 80.0
HARBIN CARREFOUR HYPERMARKET CO., LTD 65.0
HEBEI BAOLONGCANG CARREFOUR COMMERCIAL CO., LTD. 51.0
HEFEI YUEJIA COMMERCIAL CO., LTD. 60.0
HUHHOT CARREFOUR COMMERCIAL COMPANY CO.,LTD. 100.0
JINAN CARREFOUR COMMERCIAL CO., LTD 100.0
KUNMING CARREFOUR HYPERMARKET CO., LTD 100.0
NANCHANG YUEJIA COMMERCIAL CO.,LTD 60.0
NANJING YUEJIA SUPERMARKET CO LTD 65.0

2013 REGISTRATION DOCUMENT 213
CONSOLIDATED FINANCIAL STATEMENTS YEAR ENDED DECEMBER 31, 2013
5
Notes to the Consolidated Financial Statements
CHINA
NINGBO CARREFOUR COMMERCIAL 80.0
NINGBO LEFU INDUSTRIAL DEVELOPMENT CO. LTD 100.0
QINGDAO CARREFOUR COMMERCIAL 95.0
QUJING CARREFOUR HYPERMARKET CO.,LTD. 100.0
SHANDONG CARREFOUR COMMERCIAL CO., LTD. 100.0
SHANGHAI CARHUA SUPERMARKET LTD 55.0
SHANGHAI GLOBAL SOURCING CONSULTING CO LTD 100.0
SHANXI YUEJIA COMMERCIAL CO.,LTD 55.0
SHENYANG CARREFOUR COMMERCIAL CO LTD 65.0
SHENZHEN CARREFOUR COMMERCIAL 100.0
SHENZHEN LERONG SUPERMARKET CO LTD 100.0
SHIJIAZHUANG CARREFOUR COMMERCIAL CO., LTD. 51.0
SICHUAN CARREFOUR COMMERCIAL CO., LTD. 100.0
SUZHOU YUEJIA SUPERMARKET CO., LTD 55.0
THE CARREFOUR (CHINA) FOUNDATION FOR FOOD SAFETY LTD. 100.0
TIANJIN JIAFU COMMERCIAL CO., LTD. 100.0
TIANJIN QUANYE CARREFOUR HYPERMARKET CO., LTD 65.0
VICOUR LIMITED 100.0
WUHAN HANFU SUPERMARKET CO., LTD. 100.0
WUXI YUEJIA COMMERCIAL CO., LTD. 55.0
XIAMEN CARREFOUR COMMERCIAL CO LTD 100.0
XIAN CARREFOUR HYPERMARKET CO LTD 100.0
XINJIANG CARREFOUR HYPERMARKET 100.0
XUZHOU YUEJIA COMMERCIAL CO LTD 60.0
ZHENGZHOU YUEJIA COMMERCIAL CO., LTD. 60.0
ZHUHAI CARREFOUR COMMERCIAL CO.,LTD. 100.0
ZHUHAI LETIN SUPERMARKET CO., LTD. 100.0
ZHUZHOU CARREFOUR COMMERCIAL CO., LTD. 100.0

2013 REGISTRATION DOCUMENT 214
5 CONSOLIDATED FINANCIAL STATEMENTS YEAR ENDED DECEMBER 31, 2013Notes to the Consolidated Financial Statements
SPAIN
ALCYION BV 100.0
CARREFOUR ESPANA PROPERTIES, SL 100.0
CARREFOUR NAVARRA, SL 100.0
CARREFOUR NORTE, SL 100.0
CARREFOUR PROPERTY SANTIAGO, SL 100.0
CARREFOURONLINE SL (SUBMARINO HISPANIA) 100.0
CENTROS COMERCIALES CARREFOUR, S.A. 100.0
CORREDURIA DE SEGUROS CARREFOUR 100.0
ESTABLECIMIENTOS DE DESCUENTO STONE 100.0
GROUP SUPECO MAXOR 100.0
INVERSIONES PRYCA, S.A. 100.0
JANENBAN INVERSIONES S.L 100.0
NORFIN HOLDER S.L. 100.0
SERVICIOS FINANCIEROS CARREFOUR EF.C. (FINANCIERA PRYCA) 60.1
SIDAMSA CONTINENTE HIPERMERCADOS, S.A. 100.0
SOCIEDAD DE COMPRAS MODERNAS, S.A. (SOCOMO) 100.0
SUPERMERCADOS CHAMPION, S.A. 100.0
VIAJES CARREFOUR, S.L.UNIPERSONAL 100.0
HONG KONG
CARREFOUR ASIA LTD 100.0
CARREFOUR GLOBAL SOURCING ASIA 100.0
CARREFOUR TRADING ASIA LTD (CTA) 100.0
INDIA
CARREFOUR INDIA MASTER FRANCHISE LTD 100.0
CARREFOUR WC & C INDIA PRIVATE LTD 100.0
IRELAND
CARREFOUR INSURANCE 100.0
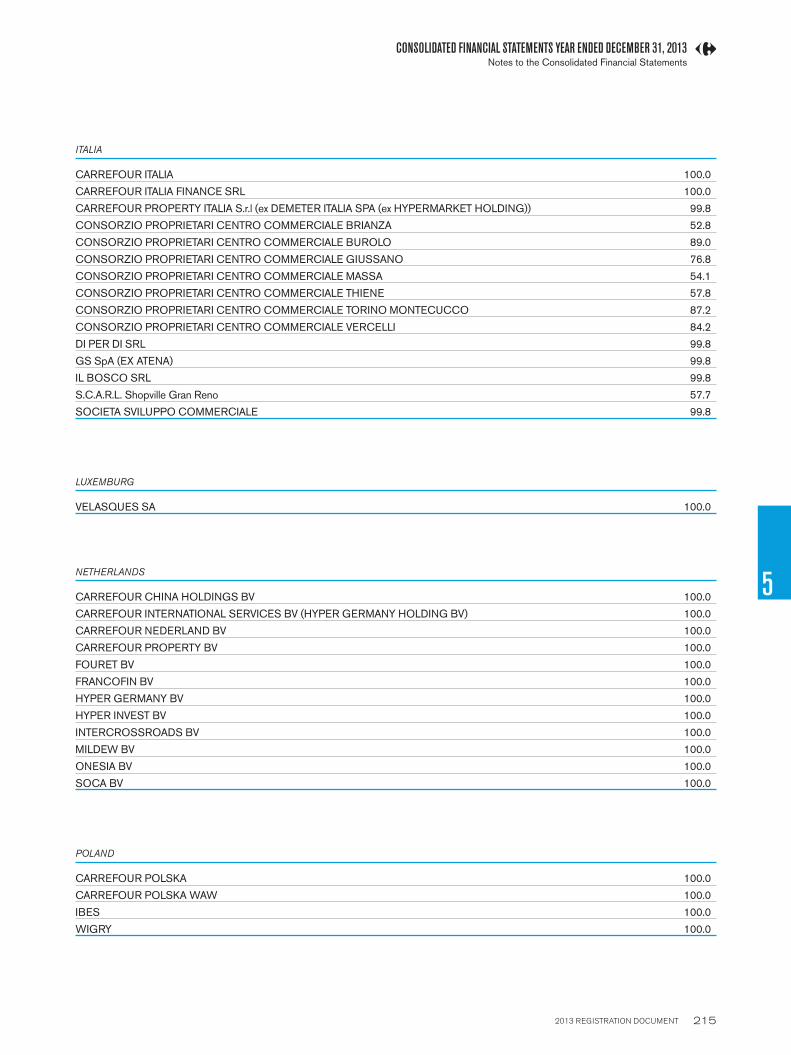
2013 REGISTRATION DOCUMENT 215
CONSOLIDATED FINANCIAL STATEMENTS YEAR ENDED DECEMBER 31, 2013
5
Notes to the Consolidated Financial Statements
ITALIA
CARREFOUR ITALIA 100.0
CARREFOUR ITALIA FINANCE SRL 100.0
CARREFOUR PROPERTY ITALIA S.r.l (ex DEMETER ITALIA SPA (ex HYPERMARKET HOLDING)) 99.8
CONSORZIO PROPRIETARI CENTRO COMMERCIALE BRIANZA 52.8
CONSORZIO PROPRIETARI CENTRO COMMERCIALE BUROLO 89.0
CONSORZIO PROPRIETARI CENTRO COMMERCIALE GIUSSANO 76.8
CONSORZIO PROPRIETARI CENTRO COMMERCIALE MASSA 54.1
CONSORZIO PROPRIETARI CENTRO COMMERCIALE THIENE 57.8
CONSORZIO PROPRIETARI CENTRO COMMERCIALE TORINO MONTECUCCO 87.2
CONSORZIO PROPRIETARI CENTRO COMMERCIALE VERCELLI 84.2
DI PER DI SRL 99.8
GS SpA (EX ATENA) 99.8
IL BOSCO SRL 99.8
S.C.A.R.L. Shopville Gran Reno 57.7
SOCIETA SVILUPPO COMMERCIALE 99.8
LUXEMBURG
VELASQUES SA 100.0
NETHERLANDS
CARREFOUR CHINA HOLDINGS BV 100.0
CARREFOUR INTERNATIONAL SERVICES BV (HYPER GERMANY HOLDING BV) 100.0
CARREFOUR NEDERLAND BV 100.0
CARREFOUR PROPERTY BV 100.0
FOURET BV 100.0
FRANCOFIN BV 100.0
HYPER GERMANY BV 100.0
HYPER INVEST BV 100.0
INTERCROSSROADS BV 100.0
MILDEW BV 100.0
ONESIA BV 100.0
SOCA BV 100.0
POLAND
CARREFOUR POLSKA 100.0
CARREFOUR POLSKA WAW 100.0
IBES 100.0
WIGRY 100.0

2013 REGISTRATION DOCUMENT 216
5 CONSOLIDATED FINANCIAL STATEMENTS YEAR ENDED DECEMBER 31, 2013Notes to the Consolidated Financial Statements
ROMANIA
ARTIMA SA 100.0
CARREFOUR PROPERTY ROMANIA 100.0
CARREFOUR MERCHANDISING 100.0
CARREFOUR ROUMANIE 100.0
SINGAPORE
CARREFOUR SINGAPOUR PTE LTD 100.0
CARREFOUR SOUTH EAST ASIA 100.0
SWITZERLAND
CARREFOUR WORLD TRADE 100.0
HYPERDEMA (PHS) 100.0
PROMOHYPERMARKT AG (PHS) 100.0
TAIWAN
CARREFOUR INSURANCE BROKER CO 60.0
CARREFOUR STORES TAIWAN CO 60.0
CARREFOUR TELECOMMUNICATION CO 30.6
CHARNG YANG DEVELOPMENT CO 30.0
PRESICARRE 60.0

2013 REGISTRATION DOCUMENT 217
CONSOLIDATED FINANCIAL STATEMENTS YEAR ENDED DECEMBER 31, 2013
5
Notes to the Consolidated Financial Statements
45.2 COMPANIES ACCOUNTED FOR BY THE EQUITY METHOD AT DECEMBER 31, 2013
FRANCEPercent interest used
in consolidation
ABREDIS 50.0
ALEXANDRE 50.0
AUDIST 50.0
AZAYDIS 50.0
AZIMMO 50.0
BORDEROUGE 40.0
CARDUTOT 26.0
CARGAN 50.0
CARTAILLAN 50.0
CERBEL 50.0
CEVIDIS 50.0
CHERBOURG INVEST 48.0
CHRISTIA 50.0
CJA DISTRIBUTION 50.0
COLODOR 50.0
CONCEPT 2003 50.0
COROU 50.0
COVIAM 21 50.0
DE L'ARCHE 50.0
DECODIS 50.0
DEPOT PETROLIER DE LYON 50.0
DEPOTS PETROLIERS COTIERS 20.0
DIPLO 50.0
DIRIC 50.0
DISMONPT 50.0
DU MOULIN 50.0
ENTREPOT PETROLIER DE VALENCIENNES 34.0
FABCORJO 50.0
FARO 50.0
FAVICAR 50.0
FERRARI 50.0
FIVER 50.0
FONCIERE MARSEILLAN 50.0
FONCIERE PLANES 50.0
FONCIERE SOLANDIS 33.8
FRELUM 50.0
GANDIS 50.0
GERIC GIE 43.1
GMDIS 50.0
GPVM 30.0
GRANDI 50.0
GWENDA 50.0
HBLP 25.0
IDEC 50.0
IMMO ST PIERRE EGLISE 50.0
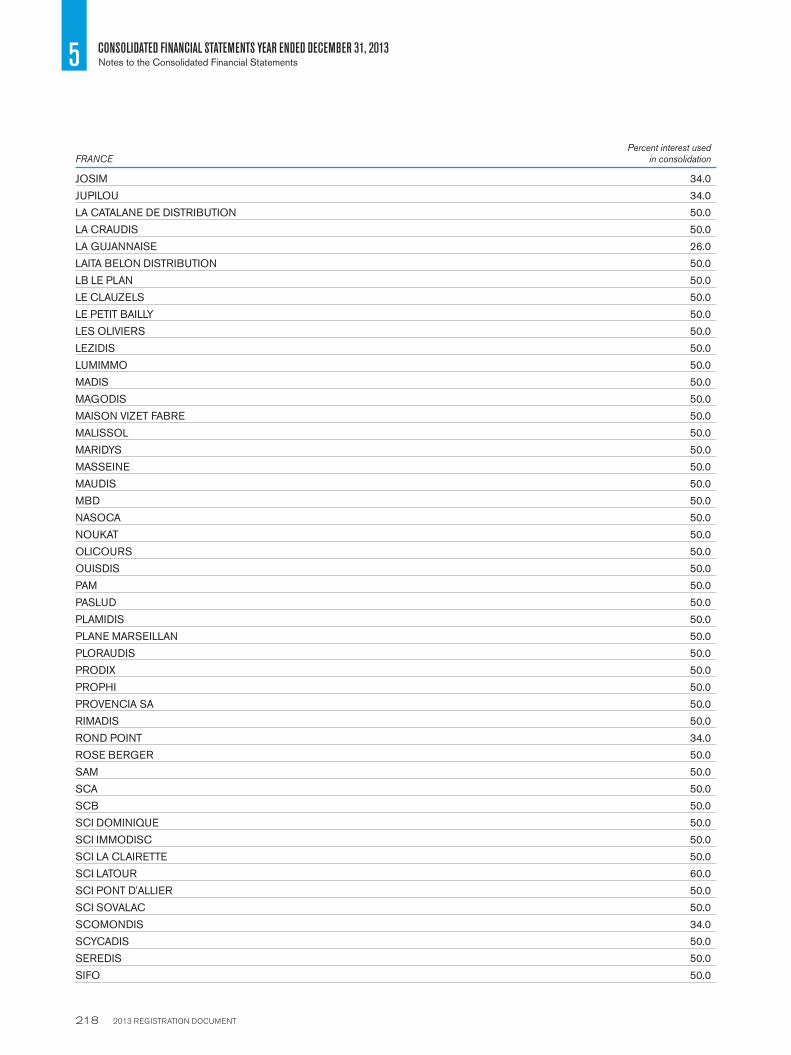
2013 REGISTRATION DOCUMENT 218
5 CONSOLIDATED FINANCIAL STATEMENTS YEAR ENDED DECEMBER 31, 2013Notes to the Consolidated Financial Statements
FRANCEPercent interest used
in consolidation
JOSIM 34.0
JUPILOU 34.0
LA CATALANE DE DISTRIBUTION 50.0
LA CRAUDIS 50.0
LA GUJANNAISE 26.0
LAITA BELON DISTRIBUTION 50.0
LB LE PLAN 50.0
LE CLAUZELS 50.0
LE PETIT BAILLY 50.0
LES OLIVIERS 50.0
LEZIDIS 50.0
LUMIMMO 50.0
MADIS 50.0
MAGODIS 50.0
MAISON VIZET FABRE 50.0
MALISSOL 50.0
MARIDYS 50.0
MASSEINE 50.0
MAUDIS 50.0
MBD 50.0
NASOCA 50.0
NOUKAT 50.0
OLICOURS 50.0
OUISDIS 50.0
PAM 50.0
PASLUD 50.0
PLAMIDIS 50.0
PLANE MARSEILLAN 50.0
PLORAUDIS 50.0
PRODIX 50.0
PROPHI 50.0
PROVENCIA SA 50.0
RIMADIS 50.0
ROND POINT 34.0
ROSE BERGER 50.0
SAM 50.0
SCA 50.0
SCB 50.0
SCI DOMINIQUE 50.0
SCI IMMODISC 50.0
SCI LA CLAIRETTE 50.0
SCI LATOUR 60.0
SCI PONT D'ALLIER 50.0
SCI SOVALAC 50.0
SCOMONDIS 34.0
SCYCADIS 50.0
SEREDIS 50.0
SIFO 50.0

2013 REGISTRATION DOCUMENT 219
CONSOLIDATED FINANCIAL STATEMENTS YEAR ENDED DECEMBER 31, 2013
5
Notes to the Consolidated Financial Statements
FRANCEPercent interest used
in consolidation
SMD 50.0
SME 50.0
SOCADIS 50.0
SOCADIS CAVALAIRE 50.0
SODIBOR 50.0
SODITA 50.0
SOFIDIS 50.0
SOLANDIS 34.0
SOQUIMDIS 50.0
SOTRESCO 50.0
SOVADIS 50.0
ST PAUL DE DISTRIBUTION 50.0
Ste du Depot pétrolier de Nanterre 20.0
STE FINANCIERE GERIC 34.9
TURENNE 50.0
VALECAR 50.0
VALMENDIS 50.0
BELGIUM
MESTDAGH 25.0
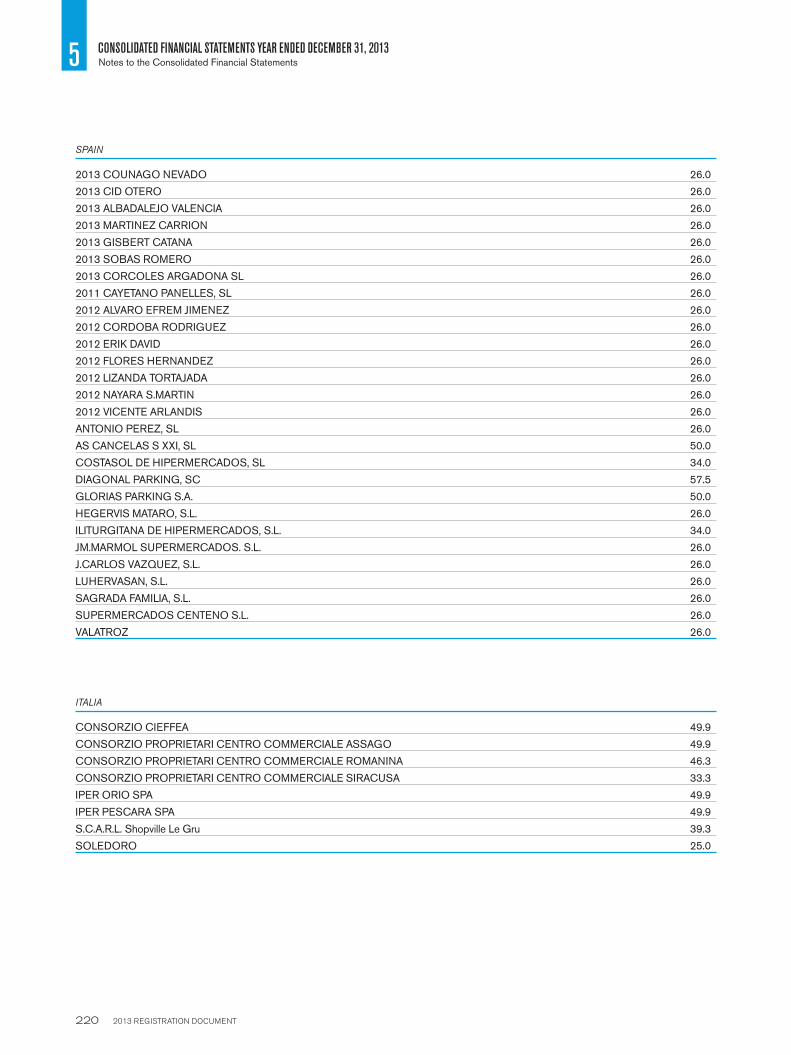
2013 REGISTRATION DOCUMENT 220
5 CONSOLIDATED FINANCIAL STATEMENTS YEAR ENDED DECEMBER 31, 2013Notes to the Consolidated Financial Statements
SPAIN
2013 COUNAGO NEVADO 26.0
2013 CID OTERO 26.0
2013 ALBADALEJO VALENCIA 26.0
2013 MARTINEZ CARRION 26.0
2013 GISBERT CATANA 26.0
2013 SOBAS ROMERO 26.0
2013 CORCOLES ARGADONA SL 26.0
2011 CAYETANO PANELLES, SL 26.0
2012 ALVARO EFREM JIMENEZ 26.0
2012 CORDOBA RODRIGUEZ 26.0
2012 ERIK DAVID 26.0
2012 FLORES HERNANDEZ 26.0
2012 LIZANDA TORTAJADA 26.0
2012 NAYARA S.MARTIN 26.0
2012 VICENTE ARLANDIS 26.0
ANTONIO PEREZ, SL 26.0
AS CANCELAS S XXI, SL 50.0
COSTASOL DE HIPERMERCADOS, SL 34.0
DIAGONAL PARKING, SC 57.5
GLORIAS PARKING S.A. 50.0
HEGERVIS MATARO, S.L. 26.0
ILITURGITANA DE HIPERMERCADOS, S.L. 34.0
JM.MARMOL SUPERMERCADOS. S.L. 26.0
J.CARLOS VAZQUEZ, S.L. 26.0
LUHERVASAN, S.L. 26.0
SAGRADA FAMILIA, S.L. 26.0
SUPERMERCADOS CENTENO S.L. 26.0
VALATROZ 26.0
ITALIA
CONSORZIO CIEFFEA 49.9
CONSORZIO PROPRIETARI CENTRO COMMERCIALE ASSAGO 49.9
CONSORZIO PROPRIETARI CENTRO COMMERCIALE ROMANINA 46.3
CONSORZIO PROPRIETARI CENTRO COMMERCIALE SIRACUSA 33.3
IPER ORIO SPA 49.9
IPER PESCARA SPA 49.9
S.C.A.R.L. Shopville Le Gru 39.3
SOLEDORO 25.0
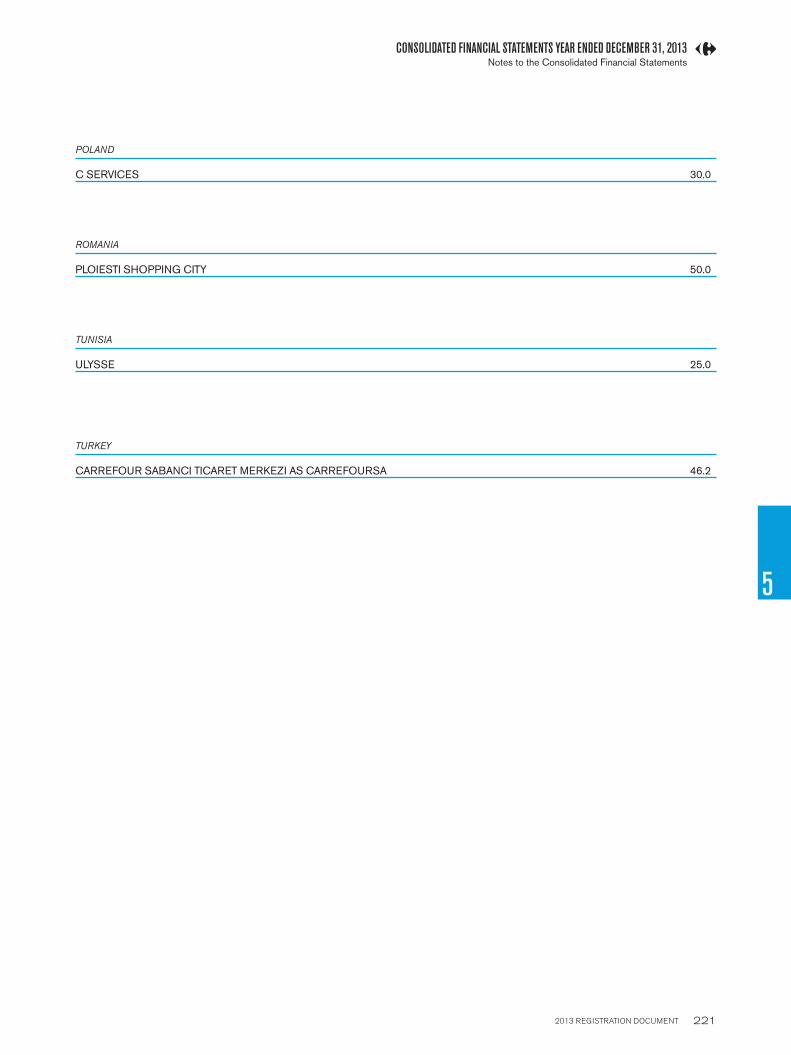
2013 REGISTRATION DOCUMENT 221
CONSOLIDATED FINANCIAL STATEMENTS YEAR ENDED DECEMBER 31, 2013
5
Notes to the Consolidated Financial Statements
POLAND
C SERVICES 30.0
ROMANIA
PLOIESTI SHOPPING CITY 50.0
TUNISIA
ULYSSE 25.0
TURKEY
CARREFOUR SABANCI TICARET MERKEZI AS CARREFOUR SA 46.2

2013 REGISTRATION DOCUMENT 222
5 CONSOLIDATED FINANCIAL STATEMENTS YEAR ENDED DECEMBER 31, 2013Statutory Auditors’ report on the Consolidated Financial Statements
5.7 Statutory Auditors’ report on the Consolidated Financial Statements
Year-ended December 31, 2013
This is a free translation into English of the Statutory Auditors’ report on the Consolidated Financial Statements issued in French and it is provided
solely for the convenience of English-speaking users.
The Statutory Auditors’ report includes information specifically required by French law in such reports, whether modified or not. This information is
presented below the opinion on the Consolidated Financial Statements and includes an explanatory paragraph discussing the Auditors’ assessments
of certain significant accounting and auditing matters. These assessments were considered for the purpose of issuing an audit opinion on the
Consolidated Financial Statements taken as a whole and not to provide separate assurance on individual account captions or on information taken
outside of the Consolidated Financial Statements.
This report also includes information relating to the specific verification of information given in the Group’s management report.
This report should be read in conjunction with, and construed in accordance with, French law and professional auditing standards applicable in France.
To the shareholders,
In compliance with the assignment entrusted to us by your shareholders’ meetings, we hereby report to you, for the year ended December 31, 2013, on:
W the audit of the Consolidated Financial Statements of Carrefour “the Group”, as attached to the present report;
W the justifi cation of our assessments;
W the specifi c verifi cation required by French law.
The Consolidated Financial Statements have been approved by the Board of Directors. Our role is to express an opinion on these consolidated
fi nancial statements based on our audit.
1. Opinion on the Consolidated Financial Statements
We conducted our audit in accordance with the professional standards applicable in France; those standards require that we plan and perform the
audit to obtain reasonable assurance that the Consolidated Financial Statements are free of material misstatement. An audit involves performing
procedures, using sampling techniques or other methods of selection, to obtain audit evidence about the amounts and disclosures in the Consolidated
Financial Statements. An audit also includes evaluating the appropriateness of accounting policies used and the reasonableness of accounting
estimates made, as well as the overall presentation of the Consolidated Financial Statements. We believe that the evidence we have obtained is
suffi cient and appropriate to provide a basis for our audit opinion.
In our opinion, the Consolidated Financial Statements give a true and fair view of the fi nancial position and the assets and liabilities of the Group
as of December 31, 2013, and of the results of its operations, in accordance with International Financial Reporting Standards (“IFRS”) as adopted
by the European Union.
Without qualifying our opinion, we draw your attention to the matter set out in Notes 1.2, 4.2 and 4.4 to the Consolidated Financial Statements
which expose the impact of the fi rst application of IAS 19 revised “Employee Benefi ts”.
2. Justification of assessments
The accounting estimates used to prepare the Consolidated Financial Statements were made in an uncertain environment due to the economic
crisis in certain countries in the euro zone, in particular Italy, which makes it diffi cult to anticipate the economic outlook. It is within this context that,
in accordance with the provisions of Article L. 823-9 of the French Commercial Code relating to the justifi cation of our assessments, we bring to
your attention the following matters:
Note 1.3 to the Consolidated Financial Statements states that the Company’s Group’s Management uses estimates and makes assumptions that
may affect the book value of certain assets and liabilities as well as the accompanying notes to the fi nancial statements. Note 1.3 also states that,
depending on the evolutions of those assumptions, the book value of these assets and liabilities in the future fi nancial statements may differ from
the current estimates.
We have notably verifi ed the followings:
W Your Group has performed at year-end an impairment test of goodwill and also assessed whether there was any indication of impairment of other
tangible and intangible assets, according to the methodology described in Note 2.6.4 to the Consolidated Financial Statements. We have reviewed
the methodology used to conduct the impairment test and the identifi cation of triggers of impairment, the cash fl ow forecasts and assumptions
used, together with the information provided in Note 17 to the Consolidated Financial Statements. We have reviewed the calculations performed

2013 REGISTRATION DOCUMENT 223
CONSOLIDATED FINANCIAL STATEMENTS YEAR ENDED DECEMBER 31, 2013
5
Statutory Auditors’ report on the Consolidated Financial Statements
by your Group; we have compared previous periods’ accounting estimates with actual results and reviewed Management’s approval process of
these estimates.
W With respect to provisions, we have assessed the basis upon which such provisions have been set up, reviewed the Group’s procedures to
identify them, their assessment, and their recording and reviewed the information relating to the risks presented in Notes 29, 30, and 31 to the
Consolidated Financial Statements.
Furthermore, as described in Note 4.2 to the Consolidated Financial Statements, in accordance with IAS 8, the comparative information for the year
2012 presented in the Consolidated Financial Statements has been restated to take into account the retrospective application of IAS 19 revised.
Accordingly, the comparative information differs from the published consolidated fi nancial statements for the year 2012. As part of our assessment
of the accounting principles applied by your company, we have examined the correct restatement of the Consolidated Financial Statements for the
year 2012 and the information provided in this respect in Note 4.4 of the notes to consolidated fi nancial statements.
These assessments were made as part of our audit of the Consolidated Financial Statements taken as a whole and therefore contributed to the
opinion we formed which is expressed in the fi rst part of this report.
3. Specific verification
As required by French law, and in accordance with the professional standards applicable in France, we have also verifi ed the information presented
in the Group’s management report.
We have no matters to report as to its fair presentation and its consistency with the Consolidated Financial Statements.
The Statutory Auditors
Courbevoie, Paris-La Défense and Neuilly-sur-Seine, March 4, 2014
French original signed by
MAZARS KPMG Audit DELOITTE & ASSOCIES
Département de KPMG S.A.
PATRICK DE CAMBOURG ERIC ROPERT FRANCISCO SANCHEZ
PIERRE SARDET ARNAUD DE PLANTA

2013 REGISTRATION DOCUMENT 224
2013 REGISTRATION DOCUMENT 225
COMPANY FINANCIAL STATEMENT YEAR ENDED
DECEMBER 31, 2013
6
6.1 Balance Sheet at December 31, 2013 226
6.2 Income Statement for the year ended December 31, 2013 227
6.3 Statement of cash fl ows for the year ended December 31, 2013 228
6.4 Notes to the fi nancial statements 229
6.5 Statutory Auditors’ report on the annual fi nancial statements 244

2013 REGISTRATION DOCUMENT 226
6 COMPANY FINANCIAL STATEMENT YEAR ENDED DECEMBER 31, 2013Balance Sheet at December 31, 2013
6.1 Balance Sheet a t December 31, 2013
The fi nancial statements are presented in million euros. There may be rounding differences between the amounts reported in the different statements.
Assets
(in € millions) Notes
2013 2012
GrossDepreciation &
amortization Net Net
Intangible fi xed assets 14,244 4,378 9,866 10,486
Tangible fi xed assets 3 3 - -
Financial investments 26,191 1,959 24,232 23,987
Fixed assets 3 40,438 6,340 34,098 34,473
Accounts receivable 4 727 186 541 442
Marketable securities 5 656 8 648 3,243
Current assets 1,384 194 1,190 3,685
Prepayments and deferred charges 4 48 - 48 59
TOTAL ASSETS 41,870 6,534 35,336 38,217
Equity and liabilities
(in € millions) Notes 2013 2012
Share capital 1,810 1,773
Issue and merger premiums 15,672 15,419
Statutory reserve 179 179
Regulated reserves 378 378
Other reserves 39 439
Retained earnings 4 6
Net income for the year 1,804 5
Shareholders’ equity 6 19,886 18,199
Provisions for contingencies and charges 7 472 527
Financial liabilities
Bonds 7,521 9,296
Bank borrowings 5,017 6,000
Operating liabilities
Trade payables 129 227
Accrued taxes and payroll costs 34 29
Other operating liabilities 32 1
Miscellaneous liabilities
Other miscellaneous liabilities 2,245 3,938
Liabilities 8 14,978 19,491
TOTAL EQUITY AND LIABILITIES 35,336 38,217

2013 REGISTRATION DOCUMENT 227
COMPANY FINANCIAL STATEMENT YEAR ENDED DECEMBER 31, 2013
6
Income Statement for the year ended December 31, 2013
(in € millions) 2013 2012
Reversals of impairment and provisions, and transferred charges 40 2
Other income 514 462
Total operating income 554 464
Other purchases and external charges (570) (532)
Wages and salaries, payroll taxes (20) (25)
Depreciation, amortization, impairment and other provision expense (173) (68)
Taxes other than on income, other operating expenses (11) (4)
Total operating expenses (774) (629)
Operating loss (220) (165)
Income from shares in subsidiaries and affi liates 1,712 1,369
Interest income, revenue from disposals of marketable securities 37 119
Reversals of impairment and other provisions 245 308
Total fi nancial income 1,994 1,796
Provision charges and impairment of fi nancial assets (308) (175)
Interest expense (488) (592)
Total fi nancial expenses (796) (767)
Financial income, net 1,198 1,029
Recurring income before tax 978 864
Net non-recurring expense from revenue transactions (119) (1)
Net non-recurring income/(expense) from capital transactions 703 (323)
Non-recurring amortization, impairment and other provision income/(expense), net 20 (910)
Net non-recurring income/(expense) 604 (1,234)
Employee profi t-sharing - -
Income tax benefi t 222 375
Net income 1,804 5
6.2 Income Statement for the year ended December 31, 2013

2013 REGISTRATION DOCUMENT 228
6 COMPANY FINANCIAL STATEMENT YEAR ENDED DECEMBER 31, 2013Statement of cash fl ows for the year ended December 31, 2013
(in € millions) 2013 2012
Net income 1,804 5
Depreciation and amortization (45) 19
Provisions and impairment, net of reversals 253 1,105
Capital gains and losses on sale of fi xed assets (703) 37
Other changes - -
Cash fl ow from operations 1,309 1,166
Change in other receivables and payables 729 (106)
Net cash from operating activities 2,038 1,060
Acquisitions of tangible and intangible fi xed assets (23) (18)
Acquisitions of shares in subsidiaries and affi liates - (242)
Disposals of shares in subsidiaries and affi liates 868 12
Change in other fi nancial investments - 329
Other cash fl ows from investing activities (1) (68) (18)
Net cash from investing activities 777 63
Dividends paid (118) (145)
Net change in debt (1,791) 1,208
Change in intra-group receivables and payables (3,537) 231
Net cash from (used in) fi nancing activities (5,446) 1,294
Net change in cash and cash equivalents (2,631) 2,417
Cash and cash equivalents at beginning of year (2) 3,117 700
Cash and cash equivalents at end of year (2) 486 3,117
Net change in cash and cash equivalents (2,631) 2,417
(1) Of which changes of treasury stock (recorded on the asset sides of the balance sheet as marketable securities)
(2) Except treasury stock.
6.3 Statement of cash fl ows for the year ended December 31, 2013
2013 REGISTRATION DOCUMENT 229
COMPANY FINANCIAL STATEMENT YEAR ENDED DECEMBER 31, 2013
6
Notes to the fi nancial statements
TABLE OF CONTENTS
6.4 Notes to the fi nancial statements
Note 1 Accounting principles 230
Note 2 Signifi cant events of the year 234
Note 3 Fixed assets 235
Note 4 Current assets, prepayments and deferred
charges 235
Note 5 Marketable securities 236
Note 6 Shareholders’ equity 236
Note 7 Provisions and impairment 237
Note 8 Change in fi nancial liabilities 238
Note 9 Related party transactions 238
Note 10 Other commitments 239
Note 11 employees 240
Note 12 Taxes 241
Note 13 Subsequent events 241
Note 14 Subsidiaries and affi liates 241

2013 REGISTRATION DOCUMENT 230
6 COMPANY FINANCIAL STATEMENT YEAR ENDED DECEMBER 31, 2013Notes to the fi nancial statements
The fi nancial statements of the Company have been prepared and
presented in accordance with the principles and methods defi ned in
Comité de la Réglementation Comptable (CRC) Regulation 99-03,
approved by government order of June 22, 1999.
The fi nancial statements have been prepared on a going concern basis
using the accruals method, in accordance with the basic principle of
prudence. Accounting policies have been applied consistently from one
period to the next.
Assets and liabilities are measured according to the historical cost
convention.
There were no changes in measurement or presentation methods in
2013 compared with the previous year.
1.1 TANGIBLE AND INTANGIBLE FIXED ASSETS
Intangible assets are mainly composed of software, stated at acquisition
or development cost, goodwill stated at contributed value, and the defi cits
arising from the Carrefour-Promodès merger in 2000 and the Carrefour-
Hofi dis II merger in 2010. Goodwill is tested for impairment at each year-
end, to confi rm that its net book value does not exceed its recoverable
amount, defi ned as the higher of fair value less costs to sell and value
in use. Value in use is determined by discounting the future cash fl ows
expected to be generated by the use of the asset, adjusted for the net
debt of the tested entity if applicable.
The assets of a number of businesses were transferred to Carrefour
Hypermarchés in 2013 (see “Signifi cant events of the year” below).
Tangible fi xed assets are stated at cost, corresponding to the purchase
price and ancillary expenses.
Tangible and intangible fi xed assets are amortized over their estimated
useful lives, as follows:
W s oftware: 3 to 8 years;
W c omputer equipment: 3 years;
W b uilding fi xtures and fi ttings: 8 years;
W o ther: 3 to 10 years.
If the net book value of a tangible or intangible fi xed asset is not expected
to be recovered through the future economic benefi ts generated by the
asset, an impairment loss is recognized for the difference between its net
book value and the higher of its value in use and fair value less costs to sell.
1.2 FINANCIAL INVESTMENTS
Financial investments consist of shares in subsidiaries and affi liates,
advances to subsidiaries and affi liates, loans and other fi nancial
investments.
1.3 SHARES IN AND ADVANCES TO SUBSIDIARIES AND AFFILIATES
Shares in subsidiaries and affi liates are stated at the lower of cost and
either fair value or value in use.
Value in use is estimated based on a range of criteria including the
Company’s interest in the investee’s net assets, projected future cash
fl ows from the investment and a fair value measurement based on
reasonable business projections.
Impairment losses are recorded in net fi nancial expense, along with
impairments written off on disposal of the interests concerned. Gains and
losses on disposal of shares in subsidiaries and affi liates are recorded
in non-recurring income and expense.
1.4 LOANS AND OTHER FINANCIAL INVESTMENTS
Loans and other fi nancial investments are stated at nominal value.
An impairment loss is recognized when their estimated recoverable
amount is less than their carrying amount.
1.5 ACCOUNTS RECEIVABLE
Accounts receivable mainly correspond to intra-group receivables arising
from the provision of services. They are recognized when the service
is provided.
Accounts receivable are stated at the lower of their nominal amount and
recoverable amount.
NOTE 1 ACCOUNTING PRINCIPLES

2013 REGISTRATION DOCUMENT 231
COMPANY FINANCIAL STATEMENT YEAR ENDED DECEMBER 31, 2013
6
Notes to the fi nancial statements
1.6 MARKETABLE SECURITIES
Marketable securities include:
W Carrefour shares designated as being held for allocation to employees
under stock option and stock grant plans. These shares are stated
at cost. They are not written down to market value because they are
intended to be allocated to employees and a provision is recorded in
liabilities as explained below in the note on provisions;
W Carrefour shares available for allocation to employees or to stabilize the
share price. These shares are stated at the lower of cost and market,
corresponding to the average share price for the month of December;
W mutual fund units, retail certifi cates of deposit and commercial paper,
stated at the lower of cost and market.
Details of marketable securities at December 31 are presented in Note 5.
1.7 FOREIGN CURRENCY TRANSACTIONS
Revenues and expenses in foreign currencies are recorded at the
exchange rate on the transaction date. Receivables, payables and cash
in foreign currency are recorded in the balance sheet at the year-end
exchange rate or the hedging rate if applicable. The difference arising
from the application of the year-end rate is recorded in the balance sheet
under “Other miscellaneous liabilities”.
1.8 RETIREMENT OBLIGATIONS
The Company’s total liability for length-of-service awards payable to
employees on retirement is covered by a provision recorded in the
balance sheet.
The assumptions used to calculate the provision are as follows:
W i nfl ation rate: 2%;
W r ate of future salary increases: 2.5%;
W p ayroll tax rate: 45%;
W d iscount rate: 3,2%.
Staff turnover rate: average of the actual turnover rates for headquarters
staff over the period 2011-2013, i.e. employees with 0 to 5 years’
seniority: 19.82%, employees with 6 to 10 years’ seniority: 14.95%,
employees with 11 to 15 years’ seniority: 2.53%. For employees aged
over 55, the turnover rate is assumed to be zero.
Mortality table: TH TF 00-02
1.9 SUPPLEMENTARY PENSION PLAN
A defi ned benefi t pension plan was set up in 2009 with the following
characteristics:
W plan participants must be employed by the Company when they retire
and have completed more than three years’ service at the time of
retirement, and their annual compensation must be greater than 16
times the annual ceiling for calculating Social Security contributions;
W plan participants hired at age 45 or over are credited with up to 10
years’ service as follows: age 45 = 0 year; age 46 = 1 year; age 47
= 2 years, etc.;
W years of service taken into account for the calculation of plan benefi ts
are capped at 20 years;
W benefi ts correspond to 1.5% of the reference compensation per year
of service;
W the reference compensation corresponds to the average of the last
three years’ salary and bonus or 60 times the annual ceiling for Social
Security contributions whichever is lower;
W the replacement rate represented by pension benefi ts from all sources
is capped at 50% of the reference compensation, with the annual
benefi t capped at 25% of the participant’s compensation for the last
full year of service;
W upon the participant’s death, a reversionary pension is payable to the
surviving spouse in an amount equal to 50% of the original benefi t;
W discount rate: 2.20%;
W expected return on plan assets: 2.20%;
W staff turnover rate: 25% before the age of 55, 0% after 55.
Unrecognized past service cost and actuarial gains and losses amounted
to €62 million at December 31, 2013. This amount is being recognized
over the remaining life of the plan in accordance with Conseil National
de la Comptabilité (CNC) recommendation 2003-R-01.
1.10 INCOME TAX
Carrefour SA is the lead company of a tax group.
Under the terms of the agreement between the companies in the tax group,
each company records in its accounts the income tax expense or benefi t
that it would have paid or received if it had been taxed on a stand-alone
basis, and the tax saving or additional tax charge corresponding to the
difference between the sum of the taxes payable by the companies in
the tax group and the tax expense or benefi t calculated on the basis of
the tax group’s consolidated profi t or loss is recorded by Carrefour SA.
The corporate income tax rate in France is 33.33% and companies are
also required to pay a surtax (contribution additionnelle) corresponding
to 3.3% of their tax liability beyond the fi rst €763,000, plus an additional
10,7% (taxe additionnelle), bringing the total tax rate to 38.00%.
Tax credits deductible from income tax expense are reported in the
income statement under “Income tax”.
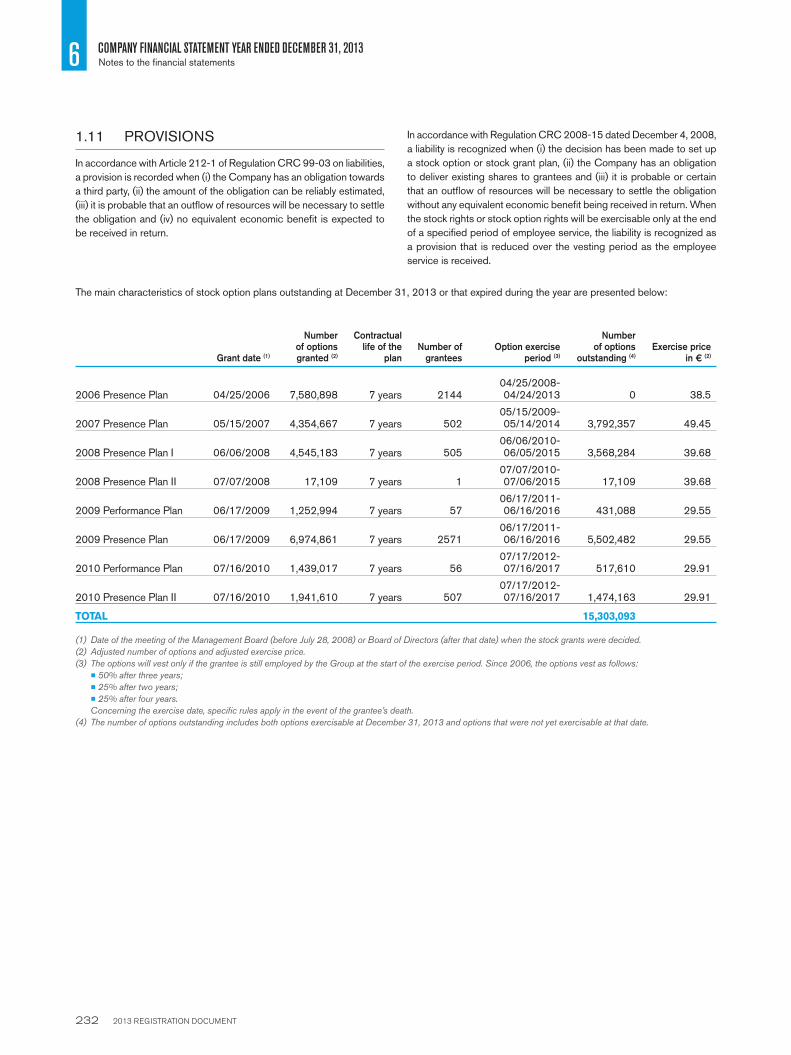
2013 REGISTRATION DOCUMENT 232
6 COMPANY FINANCIAL STATEMENT YEAR ENDED DECEMBER 31, 2013Notes to the fi nancial statements
The main characteristics of stock option plans outstanding at December 31, 2013 or that expired during the year are presented below:
Grant date (1)
Number of options granted (2)
Contractual life of the
planNumber of
granteesOption exercise
period (3)
Number of options
outstanding (4)
Exercise price in € (2)
2006 Presence Plan 04/25/2006 7,580,898 7 years 214404/25/2008-04/24/2013 0 38.5
2007 Presence Plan 05/15/2007 4,354,667 7 years 50205/15/2009-05/14/2014 3,792,357 49.45
2008 Presence Plan I 06/06/2008 4,545,183 7 years 50506/06/2010-06/05/2015 3,568,284 39.68
2008 Presence Plan II 07/07/2008 17,109 7 years 107/07/2010-07/06/2015 17,109 39.68
2009 Performance Plan 06/17/2009 1,252,994 7 years 5706/17/2011-06/16/2016 431,088 29.55
2009 Presence Plan 06/17/2009 6,974,861 7 years 257106/17/2011-06/16/2016 5,502,482 29.55
2010 Performance Plan 07/16/2010 1,439,017 7 years 5607/17/2012-07/16/2017 517,610 29.91
2010 Presence Plan II 07/16/2010 1,941,610 7 years 50707/17/2012-07/16/2017 1,474,163 29.91
TOTAL 15,303,093
(1) Date of the meeting of the Management Board (before July 28, 2008) or Board of Directors (after that date) when the stock grants were decided.
(2) Adjusted number of options and adjusted exercise price.
(3) The options will vest only if the grantee is still employed by the Group at the start of the exercise period. Since 2006, the options vest as follows:
W 50% after three years;
W 25% after two years;
W 25% after four years.
Concerning the exercise date, specifi c rules apply in the event of the grantee’s death.
(4) The number of options outstanding includes both options exercisable at December 31, 2013 and options that were not yet exercisable at that date.
1.11 PROVISIONS
In accordance with Article 212-1 of Regulation CRC 99-03 on liabilities,
a provision is recorded when (i) the Company has an obligation towards
a third party, (ii) the amount of the obligation can be reliably estimated,
(iii) it is probable that an outfl ow of resources will be necessary to settle
the obligation and (iv) no equivalent economic benefi t is expected to
be received in return.
In accordance with Regulation CRC 2008-15 dated December 4, 2008,
a liability is recognized when (i) the decision has been made to set up
a stock option or stock grant plan, (ii) the Company has an obligation
to deliver existing shares to grantees and (iii) it is probable or certain
that an outfl ow of resources will be necessary to settle the obligation
without any equivalent economic benefi t being received in return. When
the stock rights or stock option rights will be exercisable only at the end
of a specifi ed period of employee service, the liability is recognized as
a provision that is reduced over the vesting period as the employee
service is received.

2013 REGISTRATION DOCUMENT 233
COMPANY FINANCIAL STATEMENT YEAR ENDED DECEMBER 31, 2013
6
Notes to the fi nancial statements
Details of the stock grant plans in progress at December 31, 2013 are presented below:
Grant date (1) Transfer dateNumber of
shares grantedNumber of
grantees
Reference share price (spot)
in € (2)
Number of shares delivered
in 2013
Number of shares
attributable at 12/31/2013
2010 Presence Plan I 07/16/2010 07/16/2013 517,743 513 34.59 370,480 0
2011 Presence Plan 05/31/2011 05/31/2013 15,969 1 26.89 15,969 0
TOTAL 386,449 0
(1) Date of the meeting of the Management Board (before July 28, 2008) or Board of Directors (after that date) when the stock grants were decided.
(2) Reference price at the date of the stock grants (unadjusted).
1.12 RISK INFORMATION
Interest rate and foreign exchange risk
Interest rate hedging instruments are used mainly to limit the effects of
changes in exchange rates on the Company’s variable rate borrowings.
The main instruments are interest rate swaps and options and forward
foreign exchange purchase and sale contracts, purchased over-the-
counter from leading banking counterparties.
Gains and losses on hedging instruments are recognized on a symmetrical
basis with the loss or gain on the hedged item. A provision is booked
at the year-end for losses on derivative instruments that do not qualify
for hedge accounting.
Details of derivative instruments outstanding at December 31 are
presented in Note 10.
Equity risk
Equity risk concerns Carrefour shares acquired for allocation upon
exercise of stock options. When their market price is less than the
option exercise price, the shares are reclassifi ed as “shares available
for allocation” in the marketable securities account, and an impairment
loss is recognized for the difference between their purchase price and
the average Carrefour share price for the month of December.
See Note 5 for details.
There are two types of plans:
W presence Plans, for which the only condition is that grantees must
remain employed by the Group between the grant date and the starting
date of the exercise period for each tranche of options (50% of options
vest after two years, 25% after three years and 25% after four years);
W performance Plans, for which the above presence condition applies
as well as two conditions based on the Group’s fi nancial performance,
with 50% of the options vesting when each of these conditions are met:
W performance conditions for the 2009 Performance Plan concern
(i) sales growth for the period 2008 to 2010 and (ii) the level of
2010 free cash fl ow,
W performance conditions for the 2010 Performance Plan concern
growth in (i) sales and (ii) recurring operating income over the
period 2009 to 2011.

2013 REGISTRATION DOCUMENT 234
6 COMPANY FINANCIAL STATEMENT YEAR ENDED DECEMBER 31, 2013Notes to the fi nancial statements
2.1 TRANSFER OF 47 HYPERMARKET BUSINESSES TO CARREFOUR HYPERMARCHÉS
On November 30, 2013, Carrefour transferred 47 hypermarket
businesses in France to Carrefour Hypermarchés in exchange for shares.
The businesses are operated by direct or indirect subsidiaries of Carrefour
under business leases. They were transferred at their net book value
of €583 million. The new Carrefour Hypermarchés shares received in
payment for these assets were recorded in Carrefour’s balance sheet
for the same amount, under “Investments”.
2.2 FINANCIAL INCOME, NET
Financial income, net amounted to €1,198 million in 2013 compared
with €1,029 million in 2012. The €169 million increase can be explained
as follows:
W fi nancial provision charges rose by a net €196 million, refl ecting:
W €283 million in net additions to provisions for impairment of shares
in subsidiaries and affi liates versus net reversals of €165 million
in 2012 (negative impact of €448 million),
W an increase in net reversals of provisions for impairment of treasury
stock, due to the rise in Carrefour’s share price between 2012
and 2013 (positive impact of €99 million),
W a decrease in net charges to provisions for other fi nancial risks
(€153 million positive impact);
W dividend income from subsidiaries was higher, with a positive impact
of €343 million;
W interest expense on intra-group and external borrowings decreased
year-on-year, with a positive impact of €22 million.
2.3 NET NON-RECURRING INCOME
Non-recurring items represented net income of €604 million in 2013
consisted mainly of gains and losses on disposals of shares in subsidiaries
and affi liates and costs of buyback and retirement of bonds.
2.4 DISPOSALS OF SHARES IN SUBSIDIARIES AND AFFILIATES
In 2013, Carrefour carried out several disposals, the net impact of which
has been recognized in non-recurring income and expense from capital
transaction:
W 39% of PT Carrefour Indonesia (Indonesia) to CT Corp. (Indonesia);
W 19.1% of MAF Hypermarket (United Arab Emirates) to MAF Retail
(United Arab Emirates);
W 14.5% of Logidis (France) to Carrefour France;
W 28.6% of Interdis (France) to Carrefour France.
2.5 BUYBACK AND RETIREMENT OF BONDS
On June 5, 2013, Carrefour announced that it was launching a €1,350
million bond buyback program. The three issues concerned were as
follows:
W €1,500 million 5.125% issue due October 2014;
W €1,000 million 5.375% issue due June 2015;
W €1,100 million 4.375% issue due November 2016.
The offer closed on June 12 and, on June 18, the Group bought back
€1,293.7 million worth of bonds (excluding accrued interest), as follows:
W €601 million worth of 5.125% bonds due October 2014;
W €356,1 million worth of 5.375% bonds due June 2015;
W €336.6 million worth of 4.375% bonds due November 2016.
The €119 million cost of the transaction has been recognized in non-
recurring expense from revenue transactions.
NOTE 2 SIGNIFICANT EVENTS OF THE YEAR
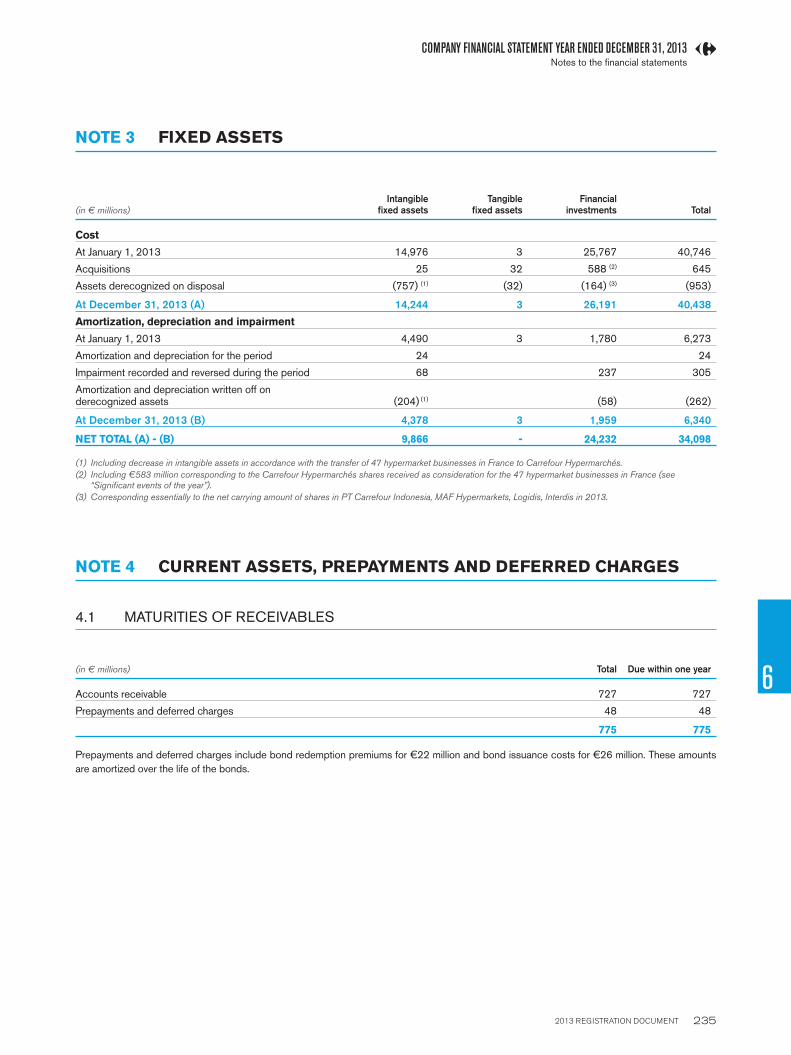
2013 REGISTRATION DOCUMENT 235
COMPANY FINANCIAL STATEMENT YEAR ENDED DECEMBER 31, 2013
6
Notes to the fi nancial statements
(in € millions)
Intangible fi xed assets
Tangible fi xed assets
Financial investments Total
Cost
At January 1, 2013 14,976 3 25,767 40,746
Acquisitions 25 32 588 (2) 645
Assets derecognized on disposal (757) (1) (32) (164) (3) (953)
At December 31, 2013 (A) 14,244 3 26,191 40,438
Amortization, depreciation and impairment
At January 1, 2013 4,490 3 1,780 6,273
Amortization and depreciation for the period 24 24
Impairment recorded and reversed during the period 68 237 305
Amortization and depreciation written off on derecognized assets (204) (1) (58) (262)
At December 31, 2013 (B) 4,378 3 1,959 6,340
NET TOTAL (A) - (B) 9,866 - 24,232 34,098
(1) Including decrease in intangible assets in accordance with the transfer of 47 hypermarket businesses in France to Carrefour Hypermarchés.
(2) Including €583 million corresponding to the Carrefour Hypermarchés shares received as consideration for the 47 hypermarket businesses in France (see “Signifi cant events of the year”).
(3) Corresponding essentially to the net carrying amount of shares in PT Carrefour Indonesia, MAF Hypermarkets, Logidis, Interdis in 2013.
NOTE 3 FIXED ASSETS
NOTE 4 CURRENT ASSETS, PREPAYMENTS AND DEFERRED CHARGES
4.1 MATURITIES OF RECEIVABLES
(in € millions) Total Due within one year
Accounts receivable 727 727
Prepayments and deferred charges 48 48
775 775
Prepayments and deferred charges include bond redemption premiums for €22 million and bond issuance costs for €26 million. These amounts
are amortized over the life of the bonds.
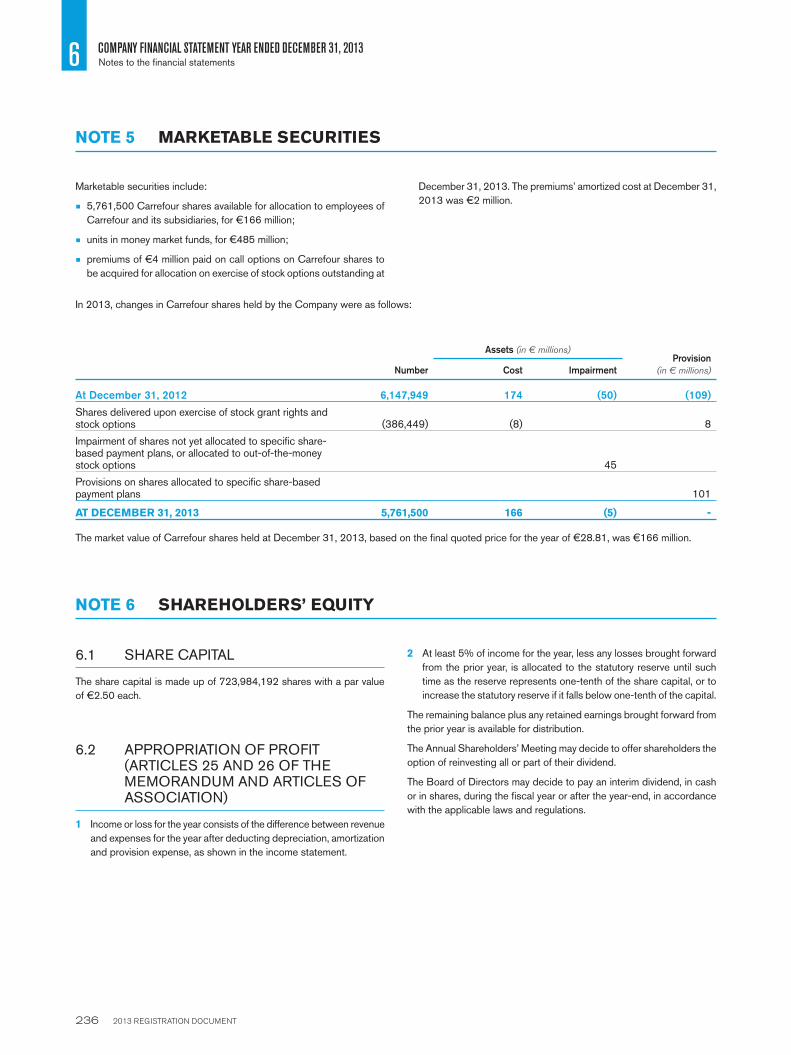
2013 REGISTRATION DOCUMENT 236
6 COMPANY FINANCIAL STATEMENT YEAR ENDED DECEMBER 31, 2013Notes to the fi nancial statements
Marketable securities include:
W 5,761,500 Carrefour shares available for allocation to employees of
Carrefour and its subsidiaries, for €166 million;
W units in money market funds, for €485 million;
W premiums of €4 million paid on call options on Carrefour shares to
be acquired for allocation on exercise of stock options outstanding at
December 31, 2013. The premiums’ amortized cost at December 31,
2013 was €2 million.
NOTE 5 MARKETABLE SECURITIES
In 2013, changes in Carrefour shares held by the Company were as follows:
Number
Assets (in € millions)Provision
(in € millions)Cost Impairment
At December 31, 2012 6,147,949 174 (50) (109)
Shares delivered upon exercise of stock grant rights and stock options (386,449) (8) 8
Impairment of shares not yet allocated to specifi c share-based payment plans, or allocated to out-of-the-money stock options 45
Provisions on shares allocated to specifi c share-based payment plans 101
AT DECEMBER 31, 2013 5,761,500 166 (5) -
The market value of Carrefour shares held at December 31, 2013, based on the fi nal quoted price for the year of €28.81, was €166 million.
NOTE 6 SHAREHOLDERS’ EQUITY
6.1 SHARE CAPITAL
The share capital is made up of 723,984,192 shares with a par value
of €2.50 each.
6.2 APPROPRIATION OF PROFIT (ARTICLES 25 AND 26 OF THE MEMORANDUM AND ARTICLES OF ASSOCIATION)
1 Income or loss for the year consists of the difference between revenue
and expenses for the year after deducting depreciation, amortization
and provision expense, as shown in the income statement.
2 At least 5% of income for the year, less any losses brought forward
from the prior year, is allocated to the statutory reserve until such
time as the reserve represents one-tenth of the share capital, or to
increase the statutory reserve if it falls below one-tenth of the capital.
The remaining balance plus any retained earnings brought forward from
the prior year is available for distribution.
The Annual Shareholders’ Meeting may decide to offer shareholders the
option of reinvesting all or part of their dividend.
The Board of Directors may decide to pay an interim dividend, in cash
or in shares, during the fi scal year or after the year-end, in accordance
with the applicable laws and regulations.

2013 REGISTRATION DOCUMENT 237
COMPANY FINANCIAL STATEMENT YEAR ENDED DECEMBER 31, 2013
6
Notes to the fi nancial statements
(in € millions) Share capitalIssue and merger
premiums
Other reserves, retained earnings
and net incomeTotal shareholders'
equity
Shareholders’ equity at 12/31/2012 including income for the year 1,773 15,419 1,007 18,199
Distribution of dividends (1)
Decided at the 2013 Annual Shareholders’ Meeting (411) (411)
2013 stock dividends 37 253 290
Change in premiums, reserves and retained earnings 4 4
Shareholders’ equity at 12/31/2013 before income for the year 1,810 15,672 600 18,082
Net income for the year 1,804 1,804
SHAREHOLDERS' EQUITY AT 12/31/2013 INCLUDING INCOME FOR THE YEAR 1,810 15,672 2,404 19,886
(1) The 2013 dividend was paid in cash for €118 million and in Carrefour shares for €290 million (i.e. 14,769,539 shares issued).
Dividends not paid on Carrefour shares held in treasury on the ex-dividend date, in the amount of €4 million, were credited to retained earnings.
6.3 TREASURY SHARE RESERVE
The carrying amount of Carrefour shares held in treasury at December 31, 2013 was €161 million.
NOTE 7 PROVISIONS AND IMPAIRMENT
(in € millions) January 1, 2013 Increases
Reversals
OthersDecember 31,
2013Used Unused
Provisions for contingencies and charges
Obligations to deliver shares 15 (8) (7) -
Pension obligations (3 ) 3 20 (6) 17
Other (1) 506 122 (74) (101) 453
Provisions for impairment - -
On intangible assets (2 ) 2,410 123 (35) (20) (198) 2,280
On fi nancial investments 1,781 246 (58) (9) 1,960
On accounts receivable 188 1 (4) 185
Other (marketable securities) 54 1 (2) (45) 8
TOTAL 4,957 513 (181) (182) (204) 4,903
Analysis
Movements recorded in operating income and expense 133 146 (39) - 240
Movements recorded in fi nancial income and expense 2,284 308 (83) (162) 2,347
Movements recorded in non-recurring income and expense 2,540 59 (59) (20) 2,520
Others (204) (204)
TOTAL 4,957 513 (181) (182) (204) 4,903
(1) Provisions for risks related to subsidiaries and affi liates and provisions for miscellaneous contingencies and litigations.
(2) The €198 million reclassifi cation corresponds to provisions for impairment of the businesses transferred to Carrefour Hypermarchés.
(3) The €6 million reclassifi cation corresponds to a prepaid expense recognized in assets at 12/31/2012.

2013 REGISTRATION DOCUMENT 238
6 COMPANY FINANCIAL STATEMENT YEAR ENDED DECEMBER 31, 2013Notes to the fi nancial statements
(in € millions) 2012 Increases Decreases 2013o/w accrued
interest
Bonds 9,296 1,000 2,775 7,521 113
Bank borrowings 6,000 5,017 6,000 5,017 17
TOTAL 15,296 6,017 8,775 12,538 130
MATURITIES OF LIABILITIES (EXCLUDING DIVIDENDS PAYABLE)
(in € millions) Amount Due within 1 year Due in 1 to 5 years Due beyond 5 years
Bonds 7,521 1,012 3,509 3,000
Bank borrowings (1) 5,017 5,017
Trade payables 129 129
Accrued taxes and payroll costs 34 20
Other miscellaneous liabilities (1) 2,277 2,277
TOTAL 14,978 8,455 3,509 3,000
(1) Bank borrowings and other miscellaneous liabilities due within one year correspond for the most part to amounts due to related companies.
NOTE 8 CHANGE IN FINANCIAL LIABILITIES
NOTE 9 RELATED PARTY TRANSACTIONS
Assets 12/31/2013 Liabilities 12/31/2012
Financial investments 24,230 Financial liabilities 5,000
Accounts receivable 537 Operating liabilities 122
Miscellaneous liabilities 2,216
TOTAL ASSETS 24,767 TOTAL LIABILITIES 7,338
Expenses 12/31/2013 Revenue 12/31/2012
Operating expenses (500) Operating revenue 486
Interest expense (421) Dividend and interest income 1,958
Income tax benefi t 306
TOTAL EXPENSES (921) TOTAL REVENUE 2,750
There were no material transactions with related parties other than wholly-owned subsidiaries that were not entered into on arm’s length terms.

2013 REGISTRATION DOCUMENT 239
COMPANY FINANCIAL STATEMENT YEAR ENDED DECEMBER 31, 2013
6
Notes to the fi nancial statements
(in € millions) Guarantee amount o/w Related parties
Commitments given
Guarantees 119 98
Forward purchases of Carrefour shares (1) 429
Subsidiaries’ tax losses utilized by Carrefour SA 883 883
Rent guarantees (2) 235 235
Other guarantees given 130
TOTAL 1,797 1,217
Commitments received
Undrawn syndicated lines of credit 4,149
Rent guarantees (2) 235 235
TOTAL 4,384 235
(1) Forward share purchase agreement:
W in 2009, 18,638,439 Carrefour shares were purchased forward at a price of €28.725 per share;
W in 2010, 2,774,041 shares were purchased under the contract. At December 31, 2010, 15,620,200 shares were available for purchase under the contract at a price of €28.725 per share;
W in 2011, 2,196,200 shares were delivered for repurchase under the contract and the forward price was reduced from €28.725 to €25.184. In addition, 106,646 shares were purchased at the new price of €25.184;
W in 2012, 664,970 shares were purchased at the price of €25.184;
W at December 31, 2013, 17,044,784 shares were available for purchase under the contract at a price of €25.184 per share, representing a total commitment of €429 million.
(2) Rent guarantees correspond to the future minimum payments due under non-cancellable real estate leases.
NOTIONAL AMOUNT OF DERIVATIVE INSTRUMENTS BY MATURITY AT DECEMBER 31
(in € millions) 12/31/2013Due within
1 yearDue in 1
to 5 years
Due beyond 5 years 12/31/2012
Due within 1 year
Due in 1 to 5 years
Due beyond 5 years
Interest rate swaps (Carrefour fi xed rate borrower)
Euribor/fi xed quarterly rate E/360 251 0 251 0 2,251 750 1,501 0
Issuer swap (Carrefour variable rate)
Euribor/fi xed rate 500 0 500 0 500 0 500 0
Purchased interest rate options (caps/fl oors/collars)
Notional amount 5,150 1,750 3,200 200 4,250 1,750 2,500 0
Purchased fl oors
Notional amount 1,500 1,500 0 0 0 0 0 0
FAIR VALUE OF DERIVATIVE INSTRUMENTS AT DECEMBER 31
(in € millions) 12/31/2013
Interest rate swaps (Carrefour fi xed rate borrower)
Euribor/fi xed quarterly rate E/360 (10)
Issuer swap (Carrefour variable rate borrower)
Euribor/fi xed rate 27
Purchased interest rate options (caps) 29
Purchased interest rate options (fl oors) 0
NOTE 10 OTHER COMMITMENTS

2013 REGISTRATION DOCUMENT 240
6 COMPANY FINANCIAL STATEMENT YEAR ENDED DECEMBER 31, 2013Notes to the fi nancial statements
2013
Managers 9
Supervisors 0
Administrative staff 0
TOTAL 9
11.2 REMUNERATION
Statutory and discretionary profi t-sharing plans have been set up by the Company for all employees with at least three months’ service with the
Carrefour Group.
The amounts payable under these plans were as follows:
(in €) 2013 2012
Discretionary profi t shares paid in respect of the prior year and invested in the discretionary profi t sharing fund 0 0
Statutory profi t shares in respect of the prior year invested in the statutory profi t-sharing fund 99,000 95,879
Details of management compensation are provided in the management report.
NOTE 11 EMPLOYEES
11.3 TRAINING
Individual training entitlement under the “DIF” plan:
W at December 31, 2013, employees’ cumulative entitlement to training
under the “DIF” plan totaled 309 hours;
W no requests to use “DIF” training hours were received in 2013.
11.4 EMPLOYEE RETIREMENT AND PENSION BENEFITS
Length-of-service awards payable to employees on retirement
The provision recorded in the balance sheet for length-of-service
awards payable to employees on retirement amounted to €17 million
at December 31, 2013.
Supplementary pension plan
In 2012, an amount of €6 million was recorded under “Prepayments»
in assets, corresponding to the difference between the contributions
paid to the insurance company that funds the supplementary pension
plan and the projected benefi t obligation (plan surplus). In 2013, this
amount was reclassifi ed to “Provisions for contingencies”, as the total
outstanding obligation was greater than the sum of the contributions
paid to the insurance company (plan defi cit).
Unrecognized past service cost at December 31, 2013 amounted to
€62 million. Unrecognized actuarial gains and losses totaled €20 million,
after taking into account the effect of lower interest rates and higher
taxes in 2012 and 2013.
The total of €62 million is included in off-balance sheet commitments
given by the Company (see Note 10).
11.1 AVERAGE NUMBER OF EMPLOYEES

2013 REGISTRATION DOCUMENT 241
COMPANY FINANCIAL STATEMENT YEAR ENDED DECEMBER 31, 2013
6
Notes to the fi nancial statements
UNRECOGNIZED DEFERRED TAXES
12.1 CHANGES IN UNRECOGNIZED DEFFERED TAXES
Permanent and temporary differences
12/31/2012 Changes 12/31/2013
ASSETS LIABILITIES ASSETS LIABILITIES ASSETS LIABILITIES
1- Temporarily non-deductible expenses
W Provisions for pension obligations 1 5 6
W Provisions for impairment of receivables 64 (64)
W Provisions for contingencies and charges 57 (57)
W Other 9 (1) 8
2 - Temporarily non-taxable revenue
W Capital gains on mergers and asset contributions qualifying for rollover relief 363 393 756
TOTAL 131 363 (117) 393 14 756
12.2 BREAKDOWN OF NET INCOME AND CORRESPONDING TAX
(in € millions) Before tax Tax After tax
Recurring income before profi t-sharing 979 123 1,102
Non-recurring items 603 4 607
Employee profi t-sharing - - -
Group relief 95 95
Book income 1,582 222 1,804
NOTE 12 TAXES
NOTE 13 SUBSEQUENT EVENTS
There were no events after the balance sheet date requiring disclosure.
NOTE 14 SUBSIDIARIES AND AFFILIATES
14.1 FINANCIAL INFORMATION
Some information has not been provided because its disclosure would be seriously prejudicial to the Company’s interests.

2013 REGISTRATION DOCUMENT 242
6 COMPANY FINANCIAL STATEMENT YEAR ENDED DECEMBER 31, 2013Notes to the fi nancial statements
(in € millions)
Share capital
Reserves and retained
earnings % interest
Investment Last published
income
Last published
revenueDividends
received Notesat cost net
A- Detailed information
1. Subsidiaries (over 50% owned)
France
Alodis 42.8 (36.4) 99.99 43.7 43.7 1.7 2.9 (1)
Amidis et cie 22.8 1,173.6 71.60 1,032.6 1,032.6 (34.4) 43.4 (1)
Boedim 75.9 26.5 100.00 76.9 76.9 24.6 23.3
Carrefour Banque 100.0 467.8 56.33 95.5 95.5 52.0 374.6 22.0 (1)
Carrefour France 1,166.9 185.3 99.35 1,561.7 1,561.7 (267.9) 257.0 (1)
Carrefour Import 0.0 4.3 99.99 27.9 4.4 (2.6) 942.3
CRFP 4 20.2 2.1 100.00 20.5 20.5 0.0
CRFP 8 3,381.5 167.9 74.76 2,528.0 2,528.0 141.3 0.0 96.1
CRFP13 41.3 (3.0) 100.00 41.3 38.2 0.0 0.0
Finifac 3.7 82.3 49.32 18.0 18.0 10.1 18.7 (1)
Guyenne et gascogne 106.4 108.3 100.00 427.7 427.7 6.6 558.9 (1)
Hyparlo 63.0 36.8 100.00 449.6 449.6 10.4 704.8 10.4 (1)
Prm 151.5 56.7 100.00 151.9 151.9 55.4 0.0 23.2
Soval 1.8 39.5 72.98 28.7 28.7 4.9 11.8 3.5 (1)
Total 6,504.1 6,477.5 1.9 2,914.5 178.5
International
Carrefour Asia 15.8 (66.2) 100.00 22.9 0.0 (1)
Carrefour Nederland 3,396.2 60.6 100.00 3,457.4 3,457.4 1,153.7 (1)
GMR 8,129.5 1,838.3 35.96 3,219.6 3,219.6 (1)
Norfi n Holder 2.0 5,004.7 79.94 3,177.1 3,177.1 268.2 (1)
Northshore 6,334.1 (0.3) 99.99 6,334.1 6,334.1 (1)
Total 16,211.1 16,188.1 0.0 0.0 1,421.9
2. Affi liates (10%-50% owned)
France
Euromarché 24.7 951.9 13.44 419.2 274.8 127.0 187.6 17.1 (1)
Carrefour Hypermarchés 4.9 774.8 22.7 583.2 583.2 (301.8) 14,675.2
Total 1,002.3 858.0 (174,9) 14,862.8 17.1
International
Carrefour Italia 1,182.0 (16.8) 31,15 1,865.5 271.0 (16.8) 28.0 (1)
Total 1,865.5 271.0 (16.8) 28.0 0.0

2013 REGISTRATION DOCUMENT 243
COMPANY FINANCIAL STATEMENT YEAR ENDED DECEMBER 31, 2013
6
Notes to the fi nancial statements
(in € millions)
Share capital
Reserves and retained
earnings % interest
Investment Last published
income
Last published
revenueDividends
received Notesat cost net
B- Aggregate information
1.Other subsidiaries
France 68.8 65.8 71.1
International 11.0 3.2 1.5
2. Other affi liates
France 12.7 12.6 0.3
International 258.9 98.9 0.4
C- General information about investments
French subsidiaries (total) 6,572.9 6,543.3 249.5
International subsidiaries (total) 16,222.1 16,191.3 1,423.4
French affi liates (total) 1,015.0 870.6 17.3
International affi liates (total) 2,124.4 369.8 0.4
TOTAL GENERAL 25,934.3 23,975.0 1,690.7
(1) The columns “Share capital”, “Reserves and retained earnings”, “Last published income” and “Last published revenue” correspond to information for 2012, because the 2013 fi gures are not yet available.
2013 REGISTRATION DOCUMENT 244
6 COMPANY FINANCIAL STATEMENT YEAR ENDED DECEMBER 31, 2013Statutory Auditors’ report on the annual fi nancial statements
6.5 Statutory Auditor s’ report on the annual fi nancial statements
This is a free translation into English of the statutory auditors’ report on the annual fi nancial statements issued in French and it is provided solely for
the convenience of English-speaking users.
The Statutory Auditors’ report includes information specifi cally required by French law in such reports, whether modifi ed or not. This information is
presented below the opinion on the fi nancial statements and includes an explanatory paragraph discussing the Auditors’ assessments of certain
signifi cant accounting and auditing matters. These assessments were considered for the purpose of issuing an audit opinion on the fi nancial
statements taken as a whole and not to provide separate assurance on individual account captions or on information taken outside of the fi nancial
statements. This report also includes information relating to specifi c verifi cations of information given in the management report and in the documents
addressed to shareholders.
This report should be read in conjunction with, and construed in accordance with, French law and professional auditing standards applicable in France.
Year-ended December 31, 2013
To the Shareholders,
In compliance with the assignment entrusted to us by your shareholders’ meetings, we hereby report to you, for the year ended December 31, 2013, on:
W the audit of the annual fi nancial statements for Carrefour, “the Company”, as attached to the present report;
W the justifi cation of our assessments;
W the specifi c verifi cations and information required by French law.
The annual fi nancial statements have been approved by the Board of Directors. Our role is to express an opinion on these fi nancial statements
based on our audit.
1. Opinion on the annual financial statements
We conducted our audit in accordance with the professional standards applicable in France; those standards require that we plan and perform the
audit to obtain reasonable assurance that the annual fi nancial statements are free of material misstatement. An audit involves performing procedures,
using sampling techniques or other methods of selection, to obtain audit evidence about the amounts and disclosures in the annual fi nancial
statements. An audit also includes evaluating the appropriateness of accounting policies used and the reasonableness of accounting estimates
made, as well as the overall fi nancial statements presentation. We believe that the evidence we have obtained is suffi cient and appropriate to provide
a basis for our audit opinion.
In our opinion, the annual fi nancial statements give a true and fair view of the results of the operations for the year ended as of December 31, 2013,
and of the fi nancial position and its assets and liabilities, in accordance with French accounting principles.
2. Justification of assessments
The accounting estimates used to prepare the fi nancial statements were made in an uncertain environment due to the economic crisis in certain
countries in the euro zone, in particular in Italy, which makes it diffi cult to anticipate the economic outlook. It is within this context that, in accordance
with the provisions of Article L. 823-9 of the French Commercial Code relating to the justifi cation of our assessments, we draw your attention to
the following matters:
As stated in note 1 to the fi nancial statements, intangible assets for which future cash fl ows do no longer support the ability to recover their carrying
amount, are depreciated. This impairment is determined by comparing the carrying amount to the recoverable amount, which is the higher of the
asset’s value in use and its market value.
As stated in note 1 to the fi nancial statements, equity investments are subject to impairment by comparing their carrying amount to their market
value or their value in use; the value in use was estimated by the Company based on the value of the shareholders’ equity, future cash fl ows or
reasonable operating forecasts.
We assessed the information and assumptions on which the calculations of values in use are based, in particular cash fl ow forecasts prepared by
your Company’s Management. We have reviewed the calculations performed by your Company; we have compared previous periods’ accounting
estimates with actual results and reviewed Management’s approval process of these estimates. We remind however that, since these estimates are
based on forecasts which by nature are uncertain, the actual results may differ, sometimes signifi cantly, from the current estimates.
These assessments were made as part of our audit of the annual fi nancial statements, taken as a whole, and therefore contributed to the opinion
we formed which is expressed in the fi rst part of this report.

2013 REGISTRATION DOCUMENT 245
COMPANY FINANCIAL STATEMENT YEAR ENDED DECEMBER 31, 2013
6
Statutory Auditors’ report on the annual fi nancial statements
3. Specific verifications and information
In accordance with the professional standards applicable in France, we have also performed the specifi c verifi cations required by French law.
We have nothing to report on the fair presentation and consistency with the annual fi nancial statements of the information provided in the management
report of the Board of Directors and in the documents addressed to shareholders regarding the fi nancial position and the annual fi nancial statements.
With regard to the information provided in accordance with article L. 225-102-1 of the French Commercial Code on remunerations and benefi ts
received by corporate offi cers, as well as any other commitments granted in their favor, we have verifi ed their consistency with the fi nancial statements
or with the underlying information used to prepare the fi nancial statements and, where necessary, with the information collected by your Company
from companies controlling or controlled by your Company. Based on this work, we attest the accuracy and fair presentation of this information,
being specifi ed that, at the date of this report, the variable remuneration of the Chairman of the Board of Directors and Chief Executive Offi cer for
the year ended December 31, 2013 is not disclosed as it was not adopted by the Board of Directors.
In accordance with French law, we have verifi ed that the management report provides you with all the required information relating to the acquisition
of investments and controlling stakes and the identity of the shareholders and holders of the voting rights. .
The Statutory Auditors
Courbevoie, Paris-La Défense and Neuilly-sur-Seine, March 18, 2014
French original signed by
MAZARS KPMG Audit DELOITTE & ASSOCIES
Départ ment de KPMG S.A.
PATRICK DE CAMBOURG ERIC ROPERT ARNAUD DE PLANTA
PIERRE SARDET FRANCISCO SANCHEZ

2013 REGISTRATION DOCUMENT 246

2013 REGISTRATION DOCUMENT 247
INFORMATION ABOUT THE COMPANY
AND THE CAPITAL
7
7.1 Information about the Company 2487.1.1 Corporate name/trade and companies register 248
7.1.2 Head office 248
7.1.3 Legal form/term 248
7.1.4 Main provisions of the bylaws 248
7.2 Information on the capital 2517.2.1 Change in share capital 251
7.2.2 Summary overview of delegations of powers and
authorities concerning capital increases 251
7.2.3 Treasury shares buybacks 253
7.3 Shareholders 2557.3.1 Principal shareholders 255
7.3.2 Information referred to in Article L. 233-13 of the French
Commercial Code 257
7.3.3 Information referred to in Article L. 225-100-3
of the French Commercial Code 257
7.4 Stock market information 258

2013 REGISTRATION DOCUMENT 248
7 INFORMATION ABOUT THE COMPANY AND THE CAPITALInformation about the Company
7.1 Information about the Company
7.1.1 CORPORATE NAME/TRADE AND COMPANIES REGISTER
Carrefour
Nanterre Trade and Companies Register no. 652 014 051
7.1.2 HEAD OFFICE
33 Avenue Émile-Zola, Boulogne-Billancourt (92100), France.
Phone: + 33 (0)1 41 04 26 00
7.1.3 LEGAL FORM/TERM
Public limited company (société anonyme) formed under French law and
governed by the provisions of the French Commercial Code.
By decision of the Shareholders’ Meeting of April 20, 2005, the Company
was converted into a public limited company (société anonyme) with
a Management Board and Supervisory Board. By decision of the
Shareholders’ Meeting of July 28, 2008, the Company changed its
governance structure and adopted the form of public limited company
(société anonyme) with a Board of Directors, with the positions of
Chairman and Chief Executive Offi cer separated. Following its discussions
on June 21, 2011, the Board decided to consolidate the duties of
Chairman of the Board of Directors and Chief Executive Offi cer. The
Board’s decision to consolidate the duties of Chairman of the Board
of Directors and Chief Executive Offi cer was designed to simplify the
decision-making process and enhance the effi ciency and responsiveness
of the Company’s governance.
The term of the Company, which began on July 11, 1959, will expire
on July 10, 2058, except in the event of early dissolution or extension.
7.1.4 MAIN PROVISIONS OF THE BYLAWS
7.1.4.1 Corporate purpose (article 3)The purpose of the Company is to:
W create, acquire and operate, in France and abroad, stores for the sale
of all items, products, foodstuffs and merchandise and, secondarily,
to provide within the said stores all services that may be of interest
to customers;
W purchase, manufacture, sell, represent and package the said products,
foodstuffs and merchandise; and
W in general, carry out all industrial, commercial, fi nancial, movable and
immovable property operations relating directly or indirectly to the
said purpose or which may facilitate the said purpose or ensure its
development.
The Company may act, directly or indirectly, and conduct all of these
operations in all countries, on its own behalf or on behalf of third parties,
either alone or within partnerships, alliances, groups or companies, with
any other persons or companies, and carry out and complete them in
any manner whatsoever.
The Company may also acquire all interests and stakes in any French or
foreign companies or businesses, regardless of their purpose.

2013 REGISTRATION DOCUMENT 249
INFORMATION ABOUT THE COMPANY AND THE CAPITAL
7
Information about the Company
7.1.4.2 The Board of Directors (articles 11, 12, 13 and 14)
The Company is administered by a Board of Directors comprising three
to eighteen members.
As soon as the number of directors over age 70 is greater than one third
of the directors in offi ce, the oldest director is automatically deemed to
have resigned and his/her appointment will end on the date of the next
Ordinary Shareholders’ Meeting.
Each director must own at least 1,000 shares during the term of his/
her appointment.
The members of the Board of Directors are appointed for a three-year
term, and one-third (or as close a percentage as possible) of its members
are replaced each year. During the Board of Directors’ meeting following
the fi rst appointments, the names of the directors whose terms will expire
early at the end of the fi rst and second years are determined by drawing
lots. The outgoing directors may be reappointed.
The directors’ duties end following the Ordinary Shareholders’ Meeting
called to approve the previous year’s fi nancial statements and held during
the year in which their term expires.
The Board of Directors elects a Chairman from among its members, who
must be a private individual. The age limit for the position of Chairman
is 70. The Chairman may perform his/her duties until the Ordinary
Shareholders’ Meeting called to approve the previous year’s fi nancial
statements and held during the year in which he/she reaches age 70.
The Chairman may be appointed for the entire term of his/her appointment
as director.
The Board of Directors appoints a Vice-Chairman from among its
members, who is asked to replace the Chairman in case of absence,
temporary unavailability, resignation, death or non-renewal of his/her
term of offi ce.
In the event of temporary unavailability, this replacement is valid only as
long as the Chairman is unavailable; in all other cases, it is valid until a
new Chairman is elected.
The Chairman organises and directs the Board of Directors’ work, on
which it reports to the Shareholders’ Meeting.
The Chairman ensures the proper functioning of the Company’s bodies
and, in particular, sees to it that the directors are able to perform their
duties.
The Board of Directors meets as often as required to serve the Company’s
interests, either at the head offi ce or at any other place indicated in the
notice of meeting.
The directors are called to meetings by the Chairman or, where necessary,
by the Vice-Chairman, by any means, including verbally.
Board of Directors’ meetings are chaired by the Chairman of the Board
of Directors or, where necessary, by the Vice-Chairman.
Proceedings are conducted under the conditions of quorum and majority
prescribed by law.
The Secretary of the Board of Directors is authorised to certify copies
and extracts of the proceedings’ minutes.
The Board of Directors determines the Company’s business strategy
and oversees its implementation.
Subject to the powers expressly attributed to the Shareholders’ Meetings
and within the scope of the corporate purpose, it deals with all matters
relating to the proper management of the Company and, through its
proceedings, handles other matters concerning the Board.
The Board conducts the controls and audits that it deems appropriate.
The directors receive all information needed to perform their duties and
may consult any documents that they deem appropriate.
7.1.4.3 Management (article 16)As provided by law, management of the Company comes under the
responsibility of either the Chairman of the Board of Directors or another
private individual appointed by the Board of Directors and bearing the
title of Chief Executive Offi cer.
Based on a majority of the directors present or represented, the Board
of Directors chooses between the two aforementioned management
methods.
The Board of Directors appoints, from among its members or otherwise,
the Chief Executive Offi cer, who must be a private individual under the
age of 65 and who has the broadest powers to act on the Company’s
behalf under all circumstances. The Chief Executive Offi cer exercises
his/her powers within the scope of the corporate purpose and subject to
those powers expressly attributed by law to the Shareholders’ Meetings
and Board of Directors. The Chief Executive Offi cer represents the
Company in its dealings with third parties.
The age limit for the position of Chief Executive Offi cer is 65. The duties
of a Chief Executive Offi cer who reaches this age end following the
Shareholders’ Meeting called to approve the previous year’s fi nancial
statements and held during the year in which this age is reached.
When the Company is managed by the Chairman, the provisions of the
laws and regulations or bylaws relating to the Chief Executive Offi cer
are applicable to him/her. The Chairman assumes the title of Chairman-
Chief Executive Offi cer and may perform his/her duties until the Ordinary
Shareholders’ Meeting called to approve the previous year’s fi nancial
statements and held during the year in which he/she reaches age 65.
The Board of Directors may determine the areas in which the Chief
Executive Offi cer must consult the Board in performing his/her duties.

2013 REGISTRATION DOCUMENT 250
7 INFORMATION ABOUT THE COMPANY AND THE CAPITALInformation about the Company
7.1.4.4 Breach of thresholds (article 7)Pursuant to Article 7 of the bylaws, in addition to compliance with the legal
obligation to inform the Company when holding certain percentages of
the capital and related voting rights, any private individual or legal entity,
acting alone or in concert, that holds a number of shares representing a
proportion of the share capital or voting rights greater than or equal to 1%
of the share capital or voting rights, or any multiple of this percentage, must
inform the Company of the total number of shares and voting rights held,
as well as the securities giving future access to the capital and the voting
rights potentially related to them, by registered mail with return receipt
within fi ve trading days of the date on which the threshold is breached.
The obligation to inform the Company also applies when the
shareholder’s percentage of capital or voting rights falls below each of
the aforementioned thresholds.
The penalties provided by law for failure to comply with the obligation
to declare a breach of the statutory thresholds also apply in the event of
non-declaration of breach of the thresholds stipulated in these bylaws,
at the request, as noted in the minutes of the Shareholders’ Meeting, of
one or more shareholders holding at least 5% of the Company’s capital
or voting rights.
7.1.4.5 Shareholder rights (article 9)Double voting rights are conferred on all fully paid up registered shares
that have been registered in the name of the same shareholder for at
least two years.
The Extraordinary Shareholders’ Meeting is solely authorised to modify
shareholders’ rights, as provided by law.
7.1.4.6 Shareholders’ meetings (articles 20 to 23)
All shareholders are entitled to attend Shareholders’ Meetings in person
or by proxy, upon presentation of proof of identity and share ownership
(in the form and at the place indicated in the notice of meeting) by no
later than midnight Paris time three business days prior to the date of
the Shareholders’ Meeting.
Every shareholder has the right to participate in shareholders’ general
meetings by way of a proxy given to any other person of his or her choice,
and may also participate by sending their proxy and mail voting forms,
subject to the conditions set forth under applicable laws and regulations.
Any shareholder may, if the Board of Directors so decides when convening
the Shareholders’ Meeting, also participate in and vote at Shareholders’
Meetings via videoconference or any other means of telecommunication
(including the Internet) that enables him/her to be identifi ed under the
conditions and according to the procedures laid down by the laws in
force. Shareholders are notifi ed of such a decision in the meeting notice
published in the Bulletin des Annonces Légales Obligatoires (French
bulletin of compulsory legal notices).
Those shareholders who use, for this purpose and within the required
periods, the electronic voting form provided on the website set up by
the Shareholders’ Meeting’s centraliser are considered shareholders
present or represented. The electronic form may be completed and signed
directly on this site through a user Code and password, as provided for
in the fi rst sentence of the second paragraph of Article 1316-4 of the
French Civil Code.
The proxy or vote thus cast electronically prior to the Shareholders’
Meeting, as well as the acknowledgement of receipt provided, will be
considered irrevocable documents that are valid against all persons, it
being specifi ed that, in case of a transfer of shares occurring prior to
midnight Paris time of the third business day preceding the Shareholders’
Meeting, the Company will invalidate or modify accordingly, depending
on the situation, the proxy or vote cast prior to the said date and time.
Shareholders’ Meetings are convened by the Board of Directors under
the conditions and within the times prescribed by law. They are held at
the head offi ce or in any other place indicated in the notice of meeting.
The Shareholders’ Meeting is presided over by the Chairman of the
Board of Directors or, in his/her absence, by the Vice-Chairman or a
director designated by the Board.
Returning offi cer duties are fulfi lled by the two shareholders, present
and willing, who hold the greatest number of votes, both in their own
name and as agents.
The committee appoints a secretary, who does not need to be a member
of the Shareholders’ Meeting.
Ordinary and Extraordinary Shareholders’ Meetings voting under the
conditions of quorum and majority prescribed by law exercise the powers
assigned to them in accordance with the law.
7.1.4.7 Provision of the issuer’s bylaws that would cause a change in its control to be delayed, postponed or prevented
None.

2013 REGISTRATION DOCUMENT 251
INFORMATION ABOUT THE COMPANY AND THE CAPITAL
7
Information on the capital
7.2.1 CHANGE IN SHARE CAPITAL
7.2 Information on the capital
The Ordinary and Extraordinary General Shareholders’ Meeting of April 23,
2013, under its third resolution, resolved to offer each shareholder the
option of payment of the net dividend, to which the shareholder is entitled
by virtue of shares held, in the form of new Company shares.
The Company’s share capital was accordingly increased by a nominal
amount of €36,923,847.50 through the creation of 14,769,539 new
Company shares, which were fully paid up as of their issue, carry dividend
rights as of January 1, 2013 and rank pari passu with the other shares
in the Company’s share capital.
Following this increase, the share capital amounts to €1,809,960,480
(one thousand and eight hundred nine million, ninety-six hundred
thousand, four hundred and eighty euros). It is divided into 723,984,192
shares of €2.50 each.
Shares not representing capital; number and main characteristics
None.
Amount of convertible or exchangeable securities or securities with stock purchase warrants
None.
Information on the conditions governing any right of acquisition and/or any obligation relating to unpaid share capital, or on any
undertaking to increase the capital
None.
Information on the capital of any member of the Group that is under option or agreed, conditionally or unconditionally, to be put
under option, and the details of such options
None.
7.2.2 SUMMARY OVERVIEW OF DELEGATIONS OF POWERS AND AUTHORITIES CONCERNING CAPITAL INCREASES
Type Amount Duration Expiration
Issue of shares and/or marketable securities with preferential subscription rights maintained
W Shares €500 million 26 months June 23, 2015
W Other marketable securities €4,000 million 26 months June 23, 2015
Issue of shares and/or marketable securities with preferential subscription rights cancelled (Public offer)
W Shares €90 million 26 months June 23, 2015
W Other marketable securities €720 million 26 months June 23, 2015
Issue of shares and/or marketable securities with preferential subscription rights cancelled (Private investment)
W Shares €90 million 26 months June 23, 2015
W Other marketable securities €720 million 26 months June 23, 2015
Issue of shares and/or marketable securities to remunerate contributions-in-kind granted to the Company in an amount of up to 10% of capital 10% 26 months June 23, 2015
Capital increase through capitalisation of reserves, profi ts, premiums or otherwise €500 million 26 months June 23, 2015
Capital increase for the employees who are members of a company savings plan (shareholder waiver of preferential subscription right) €35 million 26 months June 23, 2015
Issue of shares and marketable securities giving access to capital in the event of a tender offer initiated by the Company for the securities of another listed company with preferential subscription rights cancelled €90 million 26 months June 23, 2015
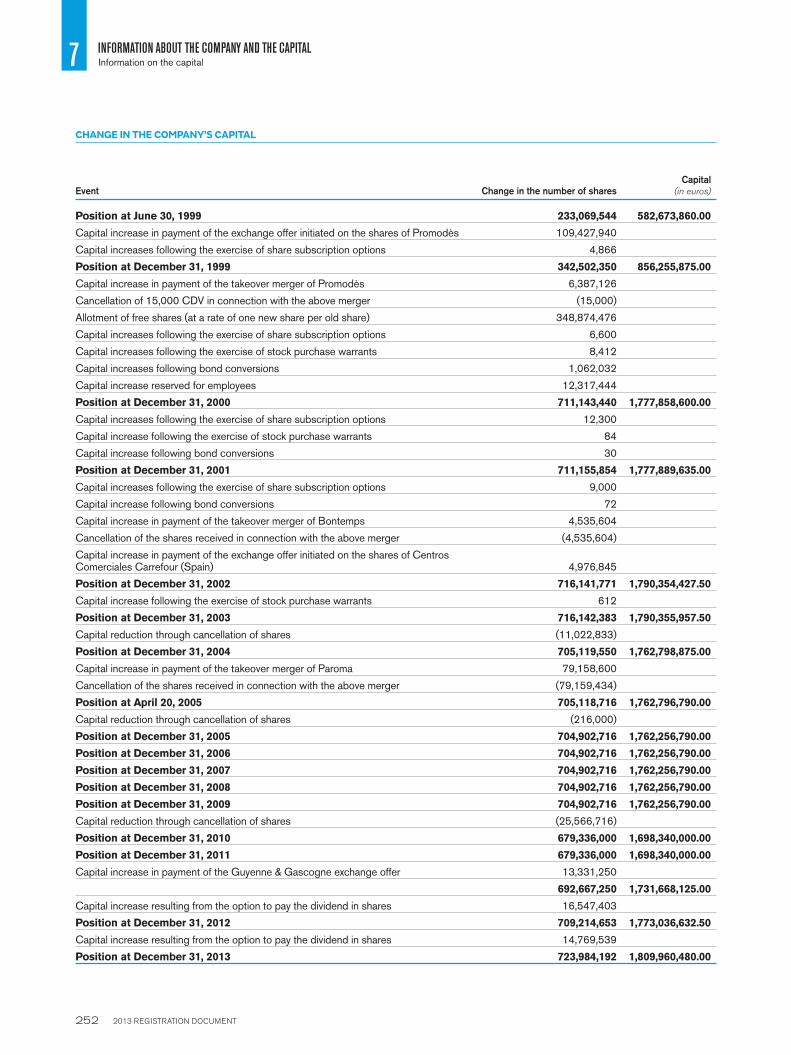
2013 REGISTRATION DOCUMENT 252
7 INFORMATION ABOUT THE COMPANY AND THE CAPITALInformation on the capital
CHANGE IN THE COMPANY’S CAPITAL
Event Change in the number of sharesCapital
(in euros)
Position at June 30, 1999 233,069,544 582,673,860.00
Capital increase in payment of the exchange offer initiated on the shares of Promodès 109,427,940
Capital increases following the exercise of share subscription options 4,866
Position at December 31, 1999 342,502,350 856,255,875.00
Capital increase in payment of the takeover merger of Promodès 6,387,126
Cancellation of 15,000 CDV in connection with the above merger (15,000)
Allotment of free shares (at a rate of one new share per old share) 348,874,476
Capital increases following the exercise of share subscription options 6,600
Capital increases following the exercise of stock purchase warrants 8,412
Capital increases following bond conversions 1,062,032
Capital increase reserved for employees 12,317,444
Position at December 31, 2000 711,143,440 1,777,858,600.00
Capital increases following the exercise of share subscription options 12,300
Capital increase following the exercise of stock purchase warrants 84
Capital increase following bond conversions 30
Position at December 31, 2001 711,155,854 1,777,889,635.00
Capital increases following the exercise of share subscription options 9,000
Capital increase following bond conversions 72
Capital increase in payment of the takeover merger of Bontemps 4,535,604
Cancellation of the shares received in connection with the above merger (4,535,604)
Capital increase in payment of the exchange offer initiated on the shares of Centros Comerciales Carrefour (Spain) 4,976,845
Position at December 31, 2002 716,141,771 1,790,354,427.50
Capital increase following the exercise of stock purchase warrants 612
Position at December 31, 2003 716,142,383 1,790,355,957.50
Capital reduction through cancellation of shares (11,022,833)
Position at December 31, 2004 705,119,550 1,762,798,875.00
Capital increase in payment of the takeover merger of Paroma 79,158,600
Cancellation of the shares received in connection with the above merger (79,159,434)
Position at April 20, 2005 705,118,716 1,762,796,790.00
Capital reduction through cancellation of shares (216,000)
Position at December 31, 2005 704,902,716 1,762,256,790.00
Position at December 31, 2006 704,902,716 1,762,256,790.00
Position at December 31, 2007 704,902,716 1,762,256,790.00
Position at December 31, 2008 704,902,716 1,762,256,790.00
Position at December 31, 2009 704,902,716 1,762,256,790.00
Capital reduction through cancellation of shares (25,566,716)
Position at December 31, 2010 679,336,000 1,698,340,000.00
Position at December 31, 2011 679,336,000 1,698,340,000.00
Capital increase in payment of the Guyenne & Gascogne exchange offer 13,331,250
692,667,250 1,731,668,125.00
Capital increase resulting from the option to pay the dividend in shares 16,547,403
Position at December 31, 2012 709,214,653 1,773,036,632.50
Capital increase resulting from the option to pay the dividend in shares 14,769,539
Position at December 31, 2013 723,984,192 1,809,960,480.00

2013 REGISTRATION DOCUMENT 253
INFORMATION ABOUT THE COMPANY AND THE CAPITAL
7
Information on the capital
7.2.3 TREASURY SHARES BUYBACKS
Treasury shares
At December 31, 2013, the Company held 5,761,500 treasury shares
(0.80% of capital).
The market value of Carrefour shares held at December 31, 2013, based
on the fi nal quoted price for 2013 of €28.81, was €166 million.
None of the Issuer’s subsidiaries held Carrefour company shares.
Share buyback
The Ordinary and Extraordinary General Shareholders’ Meeting held on
April 23, 2013, deliberating pursuant to Article L. 225-209 of the French
Commercial Code, the General Regulations of the Autorité des Marchés
Financiers (AMF) and European Commission Regulation 2273/2003
of December 22, 2003, authorised the Board of Directors to purchase
Company shares, enabling it to use the option of dealing in treasury
shares, in particular to:
W engage in market making activities with respect to Carrefour shares
through an investment services provider, in the context of a liquidity
contract conforming to the professional rules approved by the French
Financial Markets Authority (Autorité des Marchés Financiers);
W fulfi ll any stock option plan in respect of the Company, free share
allocation or other forms of allocation of shares or compensation
related to the share price, to employees or corporate offi cers of the
Company or a Group company;
W allot or exchange shares, upon the exercise of rights attached to
securities giving access to share capital;
W keep shares and subsequently use them as payment or as exchange
within the scope of acquisitions, mergers, demergers or contributions,
and under the limits set by the applicable regulations;
W cancel shares, subject to the approval by the shareholders’ general
meeting of the tenth resolution, according to the terms and conditions
stated therein or any other similar authorization; or
W engage in any market making activities that may be recognized by
law or the French Financial Markets Authority (Autorité des Marchés
Financiers).
For each of the goals pursued, the number of shares purchased was
as follows:
1. Liquidity contract
During 2013, the Company did not carry out any purchases or sales
under a liquidity contract.
As of January 20, 2014 and for a period of twelve months the Company has
contracted with Oddo Corporate Finance to implement a liquidity contract
applying to Carrefour ordinary shares (ISIN code FR0000120172) that
are traded on the regulated market of NYSE Euronext in Paris.
For the implementation of this contract, the following resources have
been allocated to the liquidity account:
W Cash: € 50,000,000.
2. Hedging of share purchase option plans and free share allocation
plans
The Company did not buy any shares during 2013.
3. Cancellation
The Company did not cancel any shares during 2013.
Description of the share buyback programme approved by the shareholders at the shareholders’ meeting of April 23, 2013
1. Date of the Shareholders’ Meeting that approved the share buyback
programme and implementation decision:
Approval of the programme: Shareholders’ Meeting of April 23, 2013.
Implementation decision: Board of Directors’ meeting of April 23, 2013.
2. Number of shares and percentage of capital held directly or indirectly
by the issuer:
At March 31, 2013, the Company held 6,147,949 treasury stocks, i.e.
0.87% of the share capital.
3. Purposes for which shares are held by the Company:
All of the treasury shares are used to cover share purchase option
plans and free share allocation plans based on years of service and/
or performance.
4. Objectives of the buyback programme:
Purchases are made, in descending order of priority, to:
W engage in market making activities with respect to Carrefour shares
through an investment services provider, in the context of a liquidity
contract conforming to the professional rules approved by the French
Financial Markets Authority (Autorité des Marchés Financiers);
W fulfi ll any stock option plan in respect of the Company, free share
allocation or other forms of allocation of shares or compensation
related to the share price, to employees or corporate offi cers of the
Company or a Group company;
W allot or exchange shares, upon the exercise of rights attached to
securities giving access to share capital;
W keep shares and subsequently use them as payment or as exchange
within the scope of acquisitions, mergers, demergers or contributions,
and under the limits set by the applicable regulations;
W cancel shares, subject to the approval by the shareholders’ general
meeting of the tenth resolution, according to the terms and conditions
stated therein or any other similar authorization; or
W engage in any market making activities that may be recognized by
law or the French Financial Markets Authority (Autorité des Marchés
Financiers).

2013 REGISTRATION DOCUMENT 254
7 INFORMATION ABOUT THE COMPANY AND THE CAPITALInformation on the capital
7. Transactions carried out by way of acquisition, disposal or transfer under the previous buyback programme
Percentage of capital held directly and indirectly by the Company (in shares + as percentage) at the beginning of the previous programme on June 30, 2012
6,182,167/0.89%
Number of shares cancelled over the past 24 months:
Number of shares held at March 31, 2013 (in shares + as a percentage) 6,147,949/0.87%
Gross book value of the portfolio 173,435,328
Market value of the portfolio 132,020,176
Total gross fl ows Open positions on the day of the programme description’s publication
Purchases Sales/Transfers Open purchase position Open sale position
Number of shares 34,218Call options
purchasedForward
purchasesCall options
soldForward
sales
Average maximum maturity 745 days 911 days
Average transaction price
Average exercise price 34.49 25.184
Amount
2013 allocation of options and shares
The number of shares delivered by recipients of free share allocations granted by the Management Board and/or Board of Directors held in previous
years totalled to 386,449 shares for the 2013 fi scal year.
The purchase, sale or transfer of shares may be carried out and paid
for by any means, on one or more occasions, on the open market or
through a private transaction, including the use of option mechanisms,
derivatives – in particular the purchase of call options – or securities
giving a right to shares of the Company, under the terms set forth by the
market authorities. Moreover, the maximum portion of capital that can
be transferred as blocks of securities may extend to the entire share
buyback programme.
The Company may not use the authority granted by the Shareholders’
Meeting of April 23, 2013 and continue to implement its share buyback
programme in the event of a tender offer involving shares or other
securities issued or initiated by the Company.
5. Maximum percentage of capital, maximum number and characteristics
of the shares the Company intends to acquire and maximum purchase
price:
The maximum purchase price per share is 35 euros and the maximum
number of shares that may be purchased is 70,000,000 (i.e. approximately
10% of the capital at December 31, 2012). The total amount that
the Company may use to buy back its own shares may not exceed
2,450,000,000 euros.
Given that the Company already held 6,147,949 treasury stock at
March 31, 2013, i.e. 0.87% of share capital as of that date, the maximum
number of shares that may be purchased under this authoriz ation is
63,852,051 (approximately 9.13% of capital).
6. Term of the buyback programme:
18 months from April 23, 2013 pursuant to the authoriz ation granted at
the Shareholders’ Meeting of April 23, 2013, i.e. until October 23, 2014.
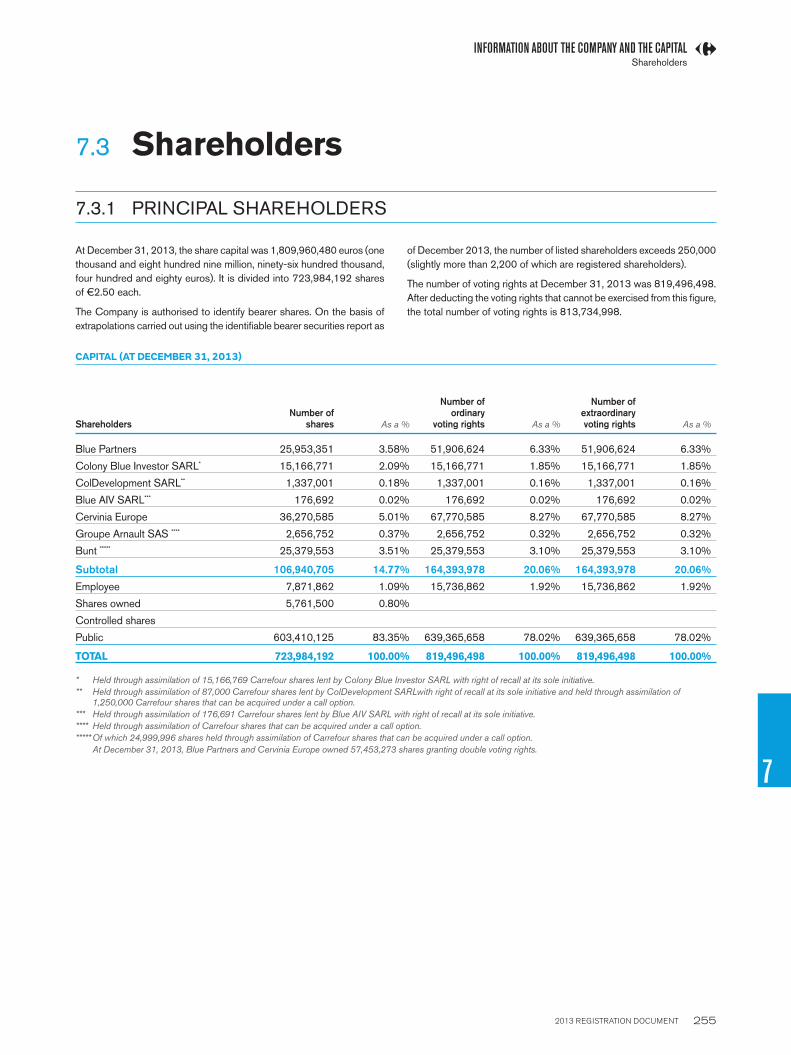
2013 REGISTRATION DOCUMENT 255
INFORMATION ABOUT THE COMPANY AND THE CAPITAL
7
Shareholders
7.3 Shareholders
7.3.1 PRINCIPAL SHAREHOLDERS
At December 31, 2013, the share capital was 1,809,960,480 euros (one
thousand and eight hundred nine million, ninety-six hundred thousand,
four hundred and eighty euros). It is divided into 723,984,192 shares
of €2.50 each.
The Company is authorised to identify bearer shares. On the basis of
extrapolations carried out using the identifi able bearer securities report as
of December 2013, the number of listed shareholders exceeds 250,000
(slightly more than 2,200 of which are registered shareholders).
The number of voting rights at December 31, 2013 was 819,496,498.
After deducting the voting rights that cannot be exercised from this fi gure,
the total number of voting rights is 813,734,998.
CAPITAL (AT DECEMBER 31, 2013)
ShareholdersNumber of
shares As a %
Number of ordinary
voting rights As a %
Number of extraordinary voting rights As a %
Blue Partners 25,953,351 3.5 8% 51,906,624 6.33% 51,906,624 6.33%
Colony Blue Investor SARL* 15,166,771 2.09% 15,166,771 1.85% 15,166,771 1.85%
ColDevelopment SARL** 1,337,001 0.18% 1,337,001 0.16% 1,337,001 0.16%
Blue AIV SARL*** 176,692 0.02% 176,692 0.02% 176,692 0.02%
Cervinia Europe 36,270,585 5.01% 67,770,585 8.27% 67,770,585 8.27%
Groupe Arnault SAS **** 2,656,752 0.37% 2,656,752 0.32% 2,656,752 0.32%
Bunt ***** 25,379,553 3.51% 25,379,553 3.10% 25,379,553 3.10%
Subtotal 106,940,705 14.77% 164,393,978 20.06% 164,393,978 20.06%
Employee 7,871,862 1.09% 15,736,862 1.92% 15,736,862 1.92%
Shares owned 5,761,500 0.80%
Controlled shares
Public 603,410,125 83.35% 639,365,658 78.02% 639,365,658 78.02%
TOTAL 723,984,192 100.00% 819,496,498 100.00% 819,496,498 100.00%
* Held through assimilation of 15,166,769 Carrefour shares lent by Colony Blue Investor SARL with right of recall at its sole initiative.
** Held through assimilation of 87,000 Carrefour shares lent by ColDevelopment SARLwith right of recall at its sole initiative and held through assimilation of 1,250,000 Carrefour shares that can be acquired under a call option.
*** Held through assimilation of 176,691 Carrefour shares lent by Blue AIV SARL with right of recall at its sole initiative.
**** Held through assimilation of Carrefour shares that can be acquired under a call option.
***** Of which 24,999,996 shares held through assimilation of Carrefour shares that can be acquired under a call option.
At December 31, 2013, Blue Partners and Cervinia Europe owned 57,453,273 shares granting double voting rights.

2013 REGISTRATION DOCUMENT 256
7 INFORMATION ABOUT THE COMPANY AND THE CAPITALShareholders
Carrefour shareholder agreement
There is no shareholder agreement at Carrefour.
As a reminder, the breakdown of capital and voting rights at December 31, 2012 and December 31, 2011 was as follows:
CAPITAL (AT DECEMBER 31, 2012)
ShareholdersNumber of
shares As a %
Number of ordinary voting
rights As a %
Number of extraordinary voting rights As a %
Blue Capital * 66,556,464 9.38% 130,604,274 16.23% 130,604,274 16.23%
Colony Blue Investor ** 15,166,771 2.14% 15,166,771 1.88% 15,166,771 1.88%
CZ2 Blue SARL *** 860,148 0.12% 860,148 0.11% 860,148 0.11%
Blue AIV SARL **** 176,691 0.02% 176,691 0.02% 176,691 0.02%
Groupe Arnault SAS ***** 2,656,752 0.37% 2,656,752 0.33% 2,656,752 0.33%
Bunt ****** 25,370,250 3.58% 25,370,250 3.15% 25,370,250 3.15%
Subtotal 110,787,076 15.62% 174,834,886 21.73% 174,834,886 21.73%
Employee 8,267,870 1.17% 15,258,370 1.90% 15,251,036 1.90%
Shares owned 6,147,949 0.87%
Controlled shares
Public 584,011,758 82.35% 614,531,681 76.37% 614,531,681 76.37%
TOTAL 709,214,653 100.00% 804,624,937 100.00% 804,624,937 100.00%
* Of which 2,508,612 Carrefour shares held through assimilation under a call option.
** Held through assimilation of Carrefour shares lent by Colony Blue Investor SARL with right of recall at its sole initiative.
** Held through assimilation of the number of Carrefour shares resulting from the delta of cash-settled call options (at December 31, 2012).
**** Held through assimilation of Carrefour shares that can be acquired by Blue AIV SARL under call options.
***** Held through assimilation of Carrefour shares that can be acquired under a call option.
****** Formerly Blue Participations et Gestion, of which 24,999,996 shares held through assimilation of Carrefour shares that can be acquired under a call option.
At December 31, 2012, Blue Capital owned 65,302,137 shares granting double voting rights.
CAPITAL (AT DECEMBER 31, 2011)
ShareholdersNumber
of shares As a %
Number of ordinary
voting rights As a %
Number of extraordinary voting rights As a %
Blue Capital 64,047,813 9.43% 128,095,623 16.45% 128,095,623 16.45%
Colony Blue Investor * 15,166,770 2.23% 15,166,770 1.95% 15,166,770 1.95%
Groupe Arnault SAS ** 5,156,752 0.76% 5,156,752 0.66% 5,156,752 0.66%
Blue Participations et Gestion *** 25,359,996 3.73% 25,359,996 3.26% 25,359,996 3.26%
Employee 8,260,536 1.22% 15,251,036 1.96% 15,251,036 1.96%
Shares owned 5,598,650 0.82%
Controlled shares
Public 555,745,483 81.81% 589,571,180 75.72% 589,571,180 75.72%
TOTAL 679,336,000 100.00% 778,601,357 100.00% 778,601,357 100.00%
* Of which 15,166,769 shares lent by Colony Blue Investor with right of recall at its sole initiative.
** Held through assimilation of Carrefour shares that can be acquired under a call option.
*** Of which 24,999,996 shares held through assimilation of Carrefour shares that can be acquired under a call option.
Employee shareholding
At year-end, Group employees held 1.09% of the Company’s share capital through the Company mutual fund.

2013 REGISTRATION DOCUMENT 257
INFORMATION ABOUT THE COMPANY AND THE CAPITAL
7
Shareholders
7.3.2 INFORMATION REFERRED TO IN ARTICLE L. 233-13 OF THE FRENCH COMMERCIAL CODE
At the end of the 2013 fi scal year, Blue Partners a private limited company
formed under Luxembourg law whose head offi ce is located at 2-4 Avenue
Marie-Thérèse, L-2132 Luxembourg, Grand Duchy of Luxembourg, acting
in concert with the Colony Blue Investor a private limited company formed
under Luxembourg law whose head offi ce is located at 2-4 Avenue
Marie-Thérèse, L-2132 Luxembourg, Grand Duchy of Luxembourg,
ColDevelopment a private limited company formed under Luxembourg
law whose head offi ce is located at 2-4, avenue Marie-Thérèse, L-2132
Luxembourg, Grand Duchy of Luxembourg, Blue AIV a private limited
company formed under Luxembourg law whose head offi ce is located
at 2-4, avenue Marie-Thérèse, L-2132 Luxembourg, Grand Duchy of
Luxembourg, Cervinia Europe a private limited company formed under
Luxembourg law whose head offi ce is located at 2-4 Avenue Marie-
Thérèse, L-2132 Luxembourg, Grand Duchy of Luxembourg, the Groupe
Arnault SAS a simplifi ed joint-stock company (41 Avenue Montaigne,
75008 Paris, France) and Bunt a private limited company formed under
Luxembourg whose head offi ce is located at 2-4, avenue Marie-Thérèse,
L-2132 Luxembourg, Grand Duchy of Luxembourg held more than one-
tenth of the share capital and more than one-fi fth of the voting rights.
7.3.3 INFORMATION REFERRED TO IN ARTICLE L. 225-100-3 OF THE FRENCH COMMERCIAL CODE
To the Company’s knowledge, the composition of the capital stock is as
shown in the table on page 255.
To the Company’s knowledge, there is no agreement between its principal
shareholders that could result in a change of control of the Company if
implemented subsequently.

2013 REGISTRATION DOCUMENT 258
7 INFORMATION ABOUT THE COMPANY AND THE CAPITALStock market information
7.4 Stock market information
Carrefour is listed on the Paris Stock Exchange (Euronext Paris -
Compartment A – ISIN code: FR0000120172). It is eligible for the
Deferred Settlement Service. It is included in the CAC 40, SBF 120,
FTSE Eurotop 100 and DJ Euro STOXX 50 indices.
At December 31, 2013, Carrefour’s share was in 22 nd position in the
CAC 40 index in terms of market capitalisation, with a weighting of 2 .1 %.
2009 (2) 2010 (2) 2011 2012 2013
Closing price (in euros ) (1):
highest 33.79 41.28 36.08 (2) 19.63 29.02
31.52 (3)
lowest 22.89 30.85 15.07 13.07 18.9
at December 31 33.56 30.85 17.62 19.35 28.81
Number of shares at December 31 704,902,716 679,336,000 679,336,000 709,214,653 723,984,192
Market capitalisation at December 31 (in billion euros) 23.7 21.0 12.0 13.7 20.9
Average daily volume 2,927,925 (4) 2,874,196 (4) 3,935,400 (2) (4) 3,239,839(4) 2,598,027 (4)
Net income from recurring operations per share (in euros) 0.56 0.56 (3.35) 0.17 1.37
Net dividend 1.08 1.08 0.52 0.58 0.62 (5)
Yield 3.22% 3.50% 2.95% 3.00% 2.15%
(1) Source: NYSE Euronext.
(2) Data not adjusted for the distribution-in-kind on July 5, 2011 (Dia).
(3) Data adjusted for distribution-in-kind on July 5, 2011 (Dia).
(4) Average daily volume on Euronext.
(5) Subject to approval by the shareholders at the Shareholders' Meeting on April 15, 2014.
CARREFOUR SHARE PRICE IN 2013
Highest* Lowest* Average
closing price *Number of
shares traded Capital*
January 21.63 18.76 20.32 72,138,001 1,464,678,919
February 21.44 19.86 20.69 56,750,655 1,174,071,307
March 23.03 20.34 21.65 68,879,912 1,497,917,541
April 22.94 20.26 21.51 64,881,661 1,395,847,662
May 24.42 22.02 23.27 52,687,437 1,224,510,018
June 23.03 19.37 21.27 64,060,915 1,354,966,926
July 23.60 20.46 22.13 52,730,523 1,169,992,152
August 24.58 22.27 23.70 44,658,320 1,055,411,459
September 26.11 23.70 25.20 51,072,037 1,284,401,074
October 27.79 25.29 26.73 48,969,983 1,308,645,248
November 29.14 26.49 27.68 40,162,916 1,112,229,722
December 29.16 26.81 27.84 45,559,862 1,266,361,255
Source: NYSE Euronext.
* In euros.

2013 REGISTRATION DOCUMENT 259
INFORMATION ABOUT THE COMPANY AND THE CAPITAL
7
Stock market information
CHANGE IN SHARE PRICE
Carrefour share price in 2013 in relation to the CAC 40, BEFOODR * and STOXX Europe 600 Retail ** indices (base 100 at January 1, 2013).
Jan. 13
Carrefour Stoxx Europe 600 Retail Index CAC 40 BEFOODR
Fev. 13 Mar. 13 Apr. 13 May. 13 Jun. 13 Jul. 13 Aug. 13 Sept. 13 Oct. 13 Nov. 13 Dec. 13
148.93
119.56117.99
115.58
90
100
110
120
130
140
150
Source Bloomberg
* Composition of the Bloomberg Europe Food Retailers Index (BEFOODR): Ahold, Carrefour, Casino, Colruyt, Delhaize, Dia, Greene King, ICA
Gruppen, Sainsbury, Jeronimo Martins, Kesko OYJ, Metro, Morrison, Tesco.
** Composition of the STOXX Europe 600 Retail (SXRP): Ahold, Booker Group, Carrefour, Casino, Celesio, Colruyt, Debenhams, Delhaize, Dixons
Retail, Dia, Dufry, Galenica, H&M, Home Retail, ICA Gruppen, Inchcape, Inditex, Jeronimo Martins, Kering, Kesko, Kingfi sher, Marks & Spencer,
Metro, Morrison, Next, Ocado, Sainsbury, Tesco.

2013 REGISTRATION DOCUMENT 260

2013 REGISTRATION DOCUMENT 261
ANNUAL SHAREHOLDER S’
MEETING
8.1 Agenda 262
8.2 Board of Directors’ report to the Ordinary and Extraordinary Shareholders’ Meeting of April 15, 2014 2628.2.1 Ordinary resolutions 262
8.2.2 Extraordinary resolutions 264
8.3 Resolutions 265
8.4 Auditors’ special reports 269
8

2013 REGISTRATION DOCUMENT 262
8 ANNUAL SHAREHOLDERS’ MEETINGAgenda
8.1 Agenda
Meeting as an Ordinary Shareholders’ Meeting
W A pproval of corporate fi nancial statements for fi scal year 2013;
W A pproval of consolidated fi nancial statements for fi scal year 2013;
W A llocation of earnings and setting the dividend; option for payment
of the dividend in shares;
W A pproval of regulated agreements referred to in Articles L.225-38 et
seq. of the French Commercial Code;
W A dvisory opinion on the elements of compensation due or awarded
for fi scal year 2013 to Mr Georges Plassat, Chairman and Chief
Executive Offi cer;
W R atifi cation of the cooptation of Mr. Thomas J. Barrack Jr as Director;
W R enewal of the appointment of Mr. Amaury de Seze as a Director;
W R enewal of the appointment of Mr. Bernard Arnault as a Director;
W R enewal of the appointment of Mr. Jean-Laurent Bonnafé as a Director;
W R enewal of the appointment of Mr. René Brillet as a Director; and
W A uthorization for the Board of Directors to trade in the Company’s
own shares for a period of 18 months pursuant to Article L. 225-209
of the French Commercial Code.
Meeting as an Extraordinary Shareholders’ Meeting
W A mendment to Article 16 of the Company’s articles of association;
W A uthorization granted for a period of 24 months to the Board of
Directors to reduce the share capital by cancelling shares already
acquired through a share repurchase program.
8.2 Board of Directors’ report to the Ordinary and Extraordinary Shareholders’ Meeting of April 15, 2014
This Shareholders’ Meeting will be asked to vote on ordinary resolutions, for which a majority of the votes is required for adoption, and extraordinary
resolutions, for which two-thirds of the votes are required for adoption.
8.2.1 ORDINARY RESOLUTIONS
The Board of Directors asks that the Shareholders’ Meeting vote on the
following ordinary resolutions:
First, second and third resolutions: approval of the financial statements, allocation of net income and setting of dividend
In its fi rst and second resolutions, the Board of Directors asks that the
Shareholders’ Meeting approves the annual and consolidated fi nancial
statements for the fi scal year ended December 31, 2013.
The Meeting is asked to approve:
W the corporate fi nancial statements, including the income statement,
which shows a net profi t of €1,803,754,407.70 in 2013 compared
with €4,943,747.27 in 2012;
W the consolidated fi nancial statements for fi scal year 2013.
Details of the fi nancial statements are shown in the chapter 5 and 6 of
this Document (pages 133 and 225).
The purpose of the third resolution is to propose the Shareholders’
Meeting the allocation of net income and to set the dividend per share
for fi scal year 2013 at €0.62, payable in cash or in new shares after
shareholders’ options.

2013 REGISTRATION DOCUMENT 263
ANNUAL SHAREHOLDERS’ MEETING
8
Board of Directors’ report to the Ordinary and Extraordinary Shareholders’ Meeting of April 15, 2014
The proposed dividend amounts to a payout ratio of 46% of net income,
Group share, adjusted for exceptional items, in line with the policy set
out in March 2012.
The full dividend amount of €448,870,199.04 which represents a
dividend per share of €0.62 before social security contributions and
the compulsory levy (prélèvement obligatoire non libératoire) of 21%
stipulated in Article 117, subparagraph four, of the French General
Tax Code, is, for private individuals who are residents in France for tax
purposes, eligible for the 40% tax reduction described in Article 158-3-2
of the French General Tax Code.
In case of payment of the dividends in new shares, these shares would
be issued at a price equal to 95% of the average of the opening prices
quoted on the Euronext Paris regulated market during the 20 trading
sessions preceding the date of the Shareholders’ Meeting, reduced by
the net amount of the dividend and rounded up to the nearest euro cent.
The quotation date of the ex-dividend shares is set at April 24, 2014.
The option period during which shareholders may opt for a payment
of the dividends in cash or in new shares would begin on April 24 and
continue until May 15, 2014 inclusive. Shareholders may submit their
request to the fi nancial intermediaries authorised to pay the dividend or,
for shareholders listed in the registered accounts held by the Company,
to its agent, CACEIS Corporate Trust, 14 Rue Rouget de Lisle, 92862
Issy-les-Moulineaux Cedex 09, France.
Payment of the dividend and delivery of the new shares would occur
on May 28, 2014.
Fourth resolution: regulated agreements
The Statutory Auditors’ Special Report, in accordance with article L. 225-
40 of said Code, mentions the agreements authorised by the board
of directors during the fi scal year 2013 and at the beginning of fi scal
year 2014 and also the ones which have continued during the fi scal
year 2013.
The Board of Directors asks that the Shareholders’ Meeting approves
these agreements.
Fifth resolution : advisory opinion on the elements of compensation due or awarded for fiscal year 2013 to Mr. Georges Plassat Chairman and Chief Executive Officer
Pursuant to the recommendations in the AFEP-MEDEF Code of
Corporate Governance for listed companies, to which the Company
refers for Corporate Governance matters, the Board of Directors asks that
the Shareholders’ Meeting gives its favourable opinion on the elements
of compensation due or awarded for fi scal year 2013 to Mr. Georges
Plassat, Chairman and Chief Executive Offi cer, as shown in chapter 3
of the Registration Document 2013.
Sixth resolution : ratification of the cooptation of a director
The Board of Directors held on January 15, 2014 decided the cooptation
of Mr. Thomas J. Barrack Jr as director, in replacement of Mr. Sébastien
Bazin, who resigned.
The Board of Directors asks that the Shareholders’ Meeting ratifi es this
cooptation for the remaining period of Mr. Sébastien Bazin’s offi ce as
director until the shareholders’ general meeting called to approve the
fi nancial statements for fi scal year 2015.
Before founding Colony Capital in 1990, Mr. Thomas J. Barrack Jr., a
US national, was a principal with The Robert M. Bass Group, a Forth
Worth, Texas-based investment group. He also served in the Reagan
administration as Deputy Undersecretary of the United States Department
of the Interior. He holds a Bachelor of Arts from the University of Southern
California and a J.D. from the University of San Diego.
All the information related to Mr. Thomas J. Barrack Jr is shown in the
chapter 3 of this Document (page 78).
Seventh, eighth, ninth and tenth resolutions: renewal of the terms of four directors
The terms of Mr. Amaury de Seze, Mr. Bernard Arnault, Mr. Jean-
Laurent Bonnafé and Mr. René Brillet are due to expire at the end of
this Shareholders’ Meeting.
At the recommendation of the Appointments Committee, the Board of
Directors asks that the shareholders’ meeting renews their terms for a
period of three years.
Mr. Amaury de Seze began his career in 1968 with Bull General Electric.
In 1978, he joined the Volvo Group, where he held the posts of Chief
Executive Offi cer, Chairman-CEO of Volvo France, Chairman of Volvo
Corporate Europe, member of the Executive Committee of the Volvo
Group and member of the Strategic Committee of Renault Volvo. He
joined the Paribas Group in 1993 as member of the Executive Board of
the Compagnie Financière de Paribas and Banque Paribas, in charge of
equity holdings and industrial affairs, and as head of the Equity Holdings
Division of BNP-Paribas. He served as Chairman of PAI Partners from
1998 to December 2007.
Mr. Bernard Arnault began his career as an engineer at Ferret-Savinel.
In 1974, he became the company’s Head of Construction, and then
Chief Executive Offi cer in 1977 and fi nally Chairman-CEO in 1978.
He remained there until 1984, when he became Chairman-CEO of
Financière Agache SA and Christian Dior SA.
He embarked on the restructuring of the Financière Agache Group
as part of a development strategy based on prestige brands, making
Christian Dior the cornerstone of the organization. In 1989, he became
the majority shareholder of LVMH Moët Hennessy-Louis Vuitton, thus
creating the world’s fi rst luxury goods group. He became its Chairman
in January 1989.
An engineering graduate of the École Polytechnique and École des Mines,
Mr. Jean-Laurent Bonnafé joined the BNP Group in 1993 in the Major
Accounts Division. After serving as Head of Strategy and Development
from 1997, he oversaw the merger process between BNP and Paribas.
Since 2002, he has been Head of French Retail Banking, Director of
Networks for French Retail Banking and a member of the BNP Paribas
Executive Committee. He has been appointed Deputy Chief Executive
Offi cer and has been managing the Group’s retail banking business.
Carrefour’s former Chief Executive Offi cer Asia, Mr. René Brillet began his
career as a radio offi cer in the merchant navy in 1968. In 1972 he joined
Carrefour and held a series of posts, ranging from Senior Accountant
in Italy and Brazil, to Store Manager and Head of Organization and
Procedures, also while he was in Brazil. In 1981, he moved to Argentina

2013 REGISTRATION DOCUMENT 264
8 ANNUAL SHAREHOLDERS’ MEETINGBoard of Directors’ report to the Ordinary and Extraordinary Shareholders’ Meeting of April 15, 2014
as Executive Director, and then to Spain from 1982 to 1985, and fi nally
to France, which he managed from 1986 to 1995. In 1996, he was
appointed Chief Executive Offi cer for Europe and then Chief Executive
Offi cer for Asia in 1998, a position he held until February 28, 2004.
Pursuant to the recommendations in the AFEP-MEDEF Code of
Corporate Governance for listed companies and the recommendations
of the Appointments Committee, the Board of Directors decided that
Mr. Amaury de Seze and Mr. René Brillet can continue to be considered
as independent directors.
Eleventh resolution: buyback programme
Pursuant to Articles L. 225-209 et seq. of the French Commercial Code,
the General Regulations of the Autorité des Marchés Financiers (AMF)
and European Commission Regulation no. 2273/2003 of December 22,
2003, the Board of Directors proposes that the shareholders’ meeting
authorise the board of directors, for a period of 18 months, to buyback and
sell the Company’s shares, except during a tender offer, in particular to:
W ensure an active market in Carrefour shares through an investment
services provider;
W honour the obligations related to stock option plans, free share
allocation programmes and any other restricted sharetypes of share
allocation or compensation related to the share price;
W proceed with deliveries or exchanges of shares during the exercise of
rights attached to marketable securities giving access to the Company’s
share capital;
W retain them and deliver them at a later date as payment or exchange
in connection with external growth operations;
W cancel them;
W or engage in any acceptable market practice that may be recognised
by law or by the AMF.
In execution of the last authorization and in relation to the hedging of
share-purchase option plans and free-share allocation plans, the Company
did not buy any shares during 2013.
As of January 20, 2014 and for a period of twelve months, Carrefour has
contracted with Oddo Corporate Finance to implement a liquidity contract
applying to Carrefour ordinary shares (ISIN code FR0000120172) that
are traded on the regulated market of NYSE Euronext in Paris.
For the implementation of this contract, the following resources have
been allocated to the liquidity account:
W Cash: €50,000,000.
This new authorization will be granted for a maximum purchase price
per share set at €45, with a maximum number of shares that may be
purchased set at 65,649,919 (i.e. nearly 10% of the capital stock as
of January 31, 2014).
In accordance with the regulations in force, the Company may not hold, at
any given time, more than 10% of the shares comprising its share capital.
The total amount that the Company may use to buyback its own shares
may not exceed €2,954,246,355 million.
This authorization will be granted for a period of 18 months from the
date of this Shareholders’ Meeting.
8.2.2 EXTRAORDINARY RESOLUTIONS
The Board of Directors asks that the shareholders’ meeting vote on the
following extraordinary resolutions:
Twelth resolution: amendment to the by-laws
The amendment to Article 16 of the Company’s Articles of Association
is to align the age limit of the Chief Executive Offi cer, which is set at 65,
with that of the Chairman of the Board of Directors, which is set at 70.
Thirteenth resolution: capital reduction through cancellation of treasury shares
Pursuant to the provisions of Article L. 225-209 of the French Commercial
Code, the Board of Directors proposes that the shareholders meeting
renew, for a period of 24 months, the authorization granted to the Board
on April 23, 2013 to reduce the share capital, on one or more occasions,
by cancelling shares already held by the Company and/or shares that it
may purchase as part of a share buyback.
The Company did not cancel any shares during 2013.
As provided by law, such a reduction may not exceed 10% of the share
capital per 24-month period.
This authorization will be granted for a period of 24 months from the date
of this Shareholders’ Meeting.
The Board of Directors.

2013 REGISTRATION DOCUMENT 265
ANNUAL SHAREHOLDERS’ MEETING
8
Resolutions
8.3 R esolutions
For consideration by the meeting as an Ordinary General Meeting
First Resolution
(Approval of the corporate fi nancial statements)
The shareholders’ general meeting, deliberating under the conditions
required for ordinary shareholders’ general meetings as to quorum and
majority, and having been informed of the Board of Directors’ and Statutory
Auditors’ reports, approves the corporate fi nancial statements for fi scal
year 2013 including the balance sheet, the income statement and the
notes, as presented, together with the transactions refl ected in those
fi nancial statements and summarized in those reports.
Second Resolution
(Approval of the consolidated fi nancial statements)
The shareholders’ general meeting, deliberating under the conditions
required for ordinary shareholders’ general meetings as to quorum and
majority, and having been informed of the Board of Directors’ and Statutory
Auditors’ reports, approves the consolidated fi nancial statements for fi scal
year 2013 including the balance sheet, the income statement and the
notes, as presented, together with the transactions refl ected in those
fi nancial statements and summarized in those reports.
Third Resolution
(Allocation of earnings and setting the dividend; option for payment of the dividend in shares)
The shareholders’ general meeting, under the conditions required for ordinary shareholders’ general meetings as to quorum and majority, on a
proposal from the Board of Directors resolves to allocate the profi t for year 2013 which amounts to EUR 1,803,754,407.70:
Profi t for fi scal year 2012 EUR 1,803,754,407.70
Statutory Reserves EUR – 1,960,452.25
Retained earnings EUR 3,5 65,810.42
Total distributable profi t EUR 1,805,359,765.87
2013 Dividends EUR 448,870,199.04
Paid out of
Distributable profi t EUR 448,870,199.04
Balance of retained earnings EUR 1,356,489,566.83
The amount of retained earnings after tax for fi scal year 2012 was
increased owing to 2012 dividends not paid out on treasury shares.
It is specifi ed, in accordance with current fi scal reglementation, that the
total dividend of EUR 448,870,199.04 which represents a dividend of
EUR 0,62 per share, before payroll taxes and non fi nal withholding tax
of 21% provided for in Article 117 quater of the French General Tax
Code, qualifi es, for individuals who are French tax residents, for the tax
relief equal to 40% of the amount of the dividend in accordance with
section 2° of paragraph 3 of Article 158 of the French General Tax Code.
The General Meeting, in accordance with Article L. 232-18 of the French
Commercial Code and Article 26 of the articles of association, noting that
share capital has been paid up in full, decide to offer each shareholder
the option to choose for his/her dividend to be paid either:
W in cash; or
W in new shares of the Company.
The new shares, if the option is exercised, will be issued at a price equal to
95% of the average opening prices listed during the twenty stock market
trading sessions on Euronext Paris prior to the date of this shareholders’
general meeting, less the amount of the dividend that is the subject of
this resolution and rounded up to the nearest euro cent. Such issued
shares will immediately be entitled to dividends as of January 1, 2014 and
will be part of the share capital of the Company alongside other shares.
Shareholders may opt for payment of the dividend in cash or in new shares
from April 24, 2014 to May 15, 2014 inclusive, by sending their request
to the fi nancial intermediaries that are authorized to pay the dividend or,
for registered shareholders listed in the issuer-registered accounts held
by the Company, to its authorized agent (CACEIS Corporate Trust 14,
rue Rouget de Lisle - 92862 Issy-les-Moulineaux Cedex 09).
For shareholders who have not exercised their option by May 15, 2014,
the dividend will only be paid in cash.

2013 REGISTRATION DOCUMENT 266
8 ANNUAL SHAREHOLDERS’ MEETINGResolutions
For shareholders who have not opted for a payment in shares, the dividend
will be paid in cash on May 28, 2014 after the expiration of the option
period. For shareholders who have opted for a dividend payment in shares,
the settlement and delivery of shares will take place on the same date.
If the amount of the dividends for which the option is exercised does not
correspond to a whole number of shares, shareholders may obtain the
immediately higher number of shares by paying the difference in cash
on the date they exercise the option, or receive the immediately lower
number of shares, with the balance in cash.
The shareholders’ general meeting gives full powers to the Board of
Directors, with the option of sub-delegation to the Chairman of the
Board, in accordance with the conditions provided for by law, in order
to make the payment of the dividend in new shares, to specify the terms
and conditions of application and implementation thereof, to record
the number of shares issued pursuant to this resolution and to make
all requisite amendments to the articles of association concerning the
share capital and the number of shares that make up the share capital
and, in general, to take all requisite action.
It is recalled in accordance with the law, that the dividends paid on each share for the three preceding fi scal years and the income eligible for tax
relief under section 2 of paragraph 3 of Article 158 of the French General Tax Code per share, were as follows:
Fiscal year Gross dividend paid Dividends eligible for tax relief of 40%
2010 EUR 1.08 EUR 1.08
2011 EUR 0.52 EUR 0.52
2012 EUR 0.58 EUR 0.58
Fourth Resolution
(Approval of regulated agreements referred to in Articles L. 225-38 et seq. of the French Commercial Code)
The shareholders’ general meeting, deliberating under the conditions
required for ordinary shareholders’ general meetings as to quorum
and majority, having examined the Statutory Auditors’ special report
on regulated agreements prepared pursuant to Article L. 225-38 et
seq. of the French Commercial Code, approves the new agreements
signed during fi scal year 2013 and at the beginning of fi scal year 2014,
referred to therein.
Fifth Resolution
(Advisory opinion on the elements of compensation due or awarded for fi scal year 2013 to Mr Georges Plassat, Chairman and Chief Executive Offi cer).
The Shareholders’ Meeting, consulted pursuant to the AFEP-MEDEF
Corporate Governance Code for listed companies, deliberating in
accordance with the conditions required for ordinary shareholders’
meetings as to quorum and majority, gives a favourable opinion on the
elements of compensation due or awarded for fi scal year 2013 to Mr
Georges Plassat, Chairman and Chief Executive Offi cer, as shown in
chapter 3 of the Registration Document 2013.
Sixth Resolution
(Ratifi cation of the cooptation of Mr Thomas J. Barrack Jr as Director)
The shareholders’ general meeting, deliberating under the conditions
required for ordinary shareholders’ general meetings as to quorum and
majority, ratifi es the cooptation of Mr. Thomas J. Barrack Jr as Director,
decided at the Board of Directors held on January 15, 2014 in replacement
of Mr Sébastien Bazin who resigned, for the remaining period of his offi ce
as Director until the shareholders’ general meeting called to approve the
fi nancial statements for fi scal year 2015.
Seventh Resolution
(Renewal of the appointment of Mr. Amaury de Seze as a Director)
The shareholders’ general meeting, deliberating under the conditions
required for ordinary shareholders’ general meetings as to quorum and
majority, renews the term of offi ce of Mr. Amaury de Seze, as a member
of the Board of Directors of the Company for a period of three years,
until the shareholders’ general meeting called to approve the fi nancial
statements for fi scal year 2016.
Eighth Resolution
(Renewal of the appointment of Mr. Bernard Arnault as a Director)
The shareholders’ general meeting, deliberating under the quorum and
majority conditions required for ordinary shareholders’ general meetings,
renews the term of offi ce of Mr. Bernard Arnault, as a member of the
Board of Directors of the Company for a period of three years, until the
shareholders’ general meeting called to approve the fi nancial statements
for fi scal year 2016.
Ninth Resolution
(Renewal of the appointment of Mr. Jean-Laurent Bonnafé as a Director)
The shareholders’ general meeting, deliberating under the quorum and
majority conditions required for ordinary shareholders’ general meetings,
renews the term of offi ce of Mr. Jean-Laurent Bonnafé, as a member
of the Board of Directors of the Company for a period of three years,
until the shareholders’ general meeting called to approve the fi nancial
statements for fi scal year 2016.

2013 REGISTRATION DOCUMENT 267
ANNUAL SHAREHOLDERS’ MEETING
8
Resolutions
Tenth Resolution
(Renewal of the appointment of Mr. René Brillet as a Director)
The shareholders’ general meeting, deliberating under the quorum
and majority conditions required for ordinary shareholders’ general
meetings, renews the term of offi ce of Mr. René Brillet, as a member
of the Board of Directors of the Company for a period of three years,
until the shareholders’ general meeting called to approve the fi nancial
statements for fi scal year 2016.
Eleventh Resolution
(Authorization for the Board of Directors to trade in the Company’s own shares for a period of 18 months)
The shareholders’ general meeting, deliberating under the quorum and
majority conditions required for ordinary shareholders’ general meetings
and having reviewed the report of the Board of Directors, authorizes the
Board of Directors, with the option of sub-delegation, to trade in the shares
of the Company as provided below, in accordance with Article L. 225-209
of the French Commercial Code, the General Regulation of the French
Financial Markets Authority (Autorité des Marchés Financiers) and the
European Commission’s Regulation n° 2273/2003 of December 22,
2003.
The maximum purchase price of the shares is set at EUR 45 per share
and the maximum number of shares that may be acquired is 65,649,919
(approximately 10% of the share capital as of January 31, 2014).
The total amount that the Company may allocate to the share repurchase
program shall not exceed EUR 2,954,246,355.
In the event of an alteration of the Company’s share capital structure,
in particular by a share capital increase through the capitalization of
reserves, grant of free shares, share split or consolidation, the number of
shares and the aforementioned purchase price will be adjusted to take
account of the impact of such transactions on the value of the shares.
This authorization intends to allow the Company to use the possibilities
of intervention on its own shares, in particular for the following purposes:
W to engage in market making activities with respect to Carrefour shares
through an investment services provider, in the context of a liquidity
contract conforming to the professional rules approved by the French
Financial Markets Authority (Autorité des Marchés Financiers);
W to fulfi ll any stock option plan in respect of the Company, free share
allocation or other forms of allocation of shares or compensation
related to the share price, to employees or corporate offi cers of the
Company or a Group company;
W to allot or exchange shares, upon the exercise of rights attached to
securities giving access to share capital;
W to keep shares and subsequently use them as payment or as exchange
within the scope of acquisitions, mergers, demergers or contributions,
and under the limits set by the applicable regulations;
W to cancel shares, subject to the approval by the shareholders’ general
meeting of the thirteenth resolution, according to the terms and
conditions stated therein or any other similar authorization; or
W to engage in any market making activities that may be recognized by
law or the French Financial Markets Authority (Autorité des Marchés
Financiers).
The shareholders’ general meeting resolves that (i) the purchase, sale
or transfer of shares may be effected and fi nanced by all means and
in one or several installments, on the market, off-market or over the
counter, including by use of options, derivatives - including the purchase
of options - or securities giving access to shares of the Company, as
provided for by the market authorities, and (ii) the maximum number of
shares that can be transferred in the form of blocks of shares may be
equal to the entirety of the share repurchase program.
The shareholders’ general meeting resolves that the Company shall
not use this authorization and at the same time continue its repurchase
program in the event a public offer on the shares or other securities
issued by the Company is made.
The shareholders’ general meeting gives full powers to the Board of
Directors, with the option of sub-delegation, pursuant to the conditions
provided for by law and by the articles of association, to decide upon
and implement this authorization, by placing any stock exchange orders,
entering into any agreements, carrying out all formalities and declarations
(in particular, in accordance with the regulations set out by the French
Financial Markets Authority (Autorité des Marchés Financiers)), allocate
or reallocate the shares acquired for various purposes in accordance
with any legal and regulatory requirements, and more generally taking
any necessary action for the implementation of this resolution.
This authorization is granted for a period of eighteen months from the
date of this General meeting, and supersedes, for the remainder of its
on-going validity period the authorization granted by the shareholders’
general meeting on April 23, 2013.

2013 REGISTRATION DOCUMENT 268
8 ANNUAL SHAREHOLDERS’ MEETINGResolutions
For the consideration by the meeting as an Extraordinary General Meeting.
Twelfth Resolution
(Amendment to Article 16 of the Company’s articles of association)
The shareholders’ general meeting, deliberating under the conditions
required for extraordinary shareholders’ general meetings as to quorum
and majority, after having reviewed the report of the Board of Directors,
resolves:
W To amend Article 16 of the Company’s articles of association as follows:
Current version:
The Board of Directors appoints, from among its members or otherwise,
the Chief Executive Offi cer, who must be a private individual under the
age of 65 and who has the broadest powers to act on the Company’s
behalf under all circumstances.
The age limit for the position of Chief Executive Offi cer is 65. The duties
of a Chief Executive Offi cer who reaches this age end following the
Shareholders’ Meeting called to approve the previous year’s fi nancial
statements and held during the year in which this age is reached.
When the Company is managed by the Chairman, the provisions of the
laws and regulations or bylaws relating to the Chief Executive Offi cer
are applicable to him/her. The Chairman assumes the title of Chairman-
Chief Executive Offi cer and may perform his/her duties until the Ordinary
Shareholders’ Meeting called to approve the previous year’s fi nancial
statements and held during the year in which he/she reaches age 65.
Proposed new wording:
The Board of Directors appoints, from among its members or otherwise,
the Chief Executive Offi cer, who must be a private individual under the
age of 70 and who has the broadest powers to act on the Company’s
behalf under all circumstances.
The age limit for the position of Chief Executive Offi cer is 70. The duties
of a Chief Executive Offi cer who reaches this age end following the
Shareholders’ Meeting called to approve the previous year’s fi nancial
statements and held during the year in which this age is reached.
When the Company is managed by the Chairman, the provisions of the
laws and regulations or bylaws relating to the Chief Executive Offi cer
are applicable to him/her. The Chairman assumes the title of Chairman-
Chief Executive Offi cer and may perform his/her duties until the Ordinary
Shareholders’ Meeting called to approve the previous year’s fi nancial
statements and held during the year in which he/she reaches age 70.
The other provisions of Article 16 remain unchanged.
Thirteenth Resolution
(Authorization granted to the Board of Directors for a period of 24 months, to reduce the share capital by cancelling shares).
The shareholders’ general meeting, deliberating under the conditions
required for ordinary shareholders’ general meetings as to quorum
and majority, having reviewed the report of the Board of Directors and
the special report of the Statutory Auditors, authorizes the Board of
Directors, with the option of sub-delegation, pursuant to the provisions
of Article L. 225-209 of the French Commercial Code, to reduce the
share capital, on one or more occasions, at its sole discretion and at any
time it deems appropriate, through the cancellation of shares already
held by the Company and/or shares the Company might acquire through
a share repurchase program.
As required by law, the reduction may be made on no more than 10%
of the share capital during each twenty-four month period.
All powers are granted to the Board of Directors, with the option of
sub-delegation, in order to:
W perform and record the capital reduction transactions;
W perform and determine the terms and conditions for the cancellation
of shares;
W modify accordingly the Company’s articles of association;
W deduct the difference between the carrying value of the cancelled
shares and their par value on all reserves or premiums;
W and, generally, take all necessary measures, enter into all agreements
and carry out all formalities in order to successfully complete the
proposed share capital reduction, record its completion and
subsequently amend the Company’s articles of association.
This authorization is granted for a period of twenty-four months from the
date of this General Meeting. It supersedes the authorization granted by
the shareholders’ general meeting on April 23, 2013.
2013 REGISTRATION DOCUMENT 269
ANNUAL SHAREHOLDERS’ MEETING
8
Auditors’ special reports
8.4 Auditor s’ special reports
8.4.1 STATUTORY AUDITORS’ SPECIAL REPORT ON REGULATED AGREEMENTS AND COMMITMENTS
This is a free translation into English of the Statutory Auditors’ special reports on regulated agreements and commitments with third parties issued
in French and it is provided solely for the convenience of English-speaking users. This report should be read in conjunction with, and construed in
accordance with, French law and professional auditing standards applicable in France.
To the Shareholders,
In our capacity as Statutory Auditors of your Company, we hereby report on the regulated agreements and commitments.
It is our duty to inform you, on the basis of the information provided to us, of the main features and terms and conditions of the agreements and
commitments of which we were notifi ed or of which we became aware during the course of our assignment. We are not required to determine whether
they are useful or appropriate or whether other agreements and commitments exist. It is your responsibility, under the terms of Article R. 225-31 of
the French Commercial Code, to assess the benefi ts resulting from these agreements and commitments prior to their approval.
It is also our duty, where applicable, to provide you with the information stipulated in Article R. 225-31 of the French Commercial Code in relation
to the implementation during the year, of the agreements and commitments already approved by the Shareholders’ Meeting.
We performed the procedures that we deemed necessary in accordance with professional standards applicable in France for such engagements.
These procedures consisted in verifying that the information provided to us was consistent with the source documents from which it was taken.
A greements and commitments subject to the approval of the S hareholders’ meeting
Agreements and commitments authorized during the past year
In accordance with Article R. 225-40 of the French Commercial Code, we have been informed that the following agreements and commitments
had received prior approval by the Board of Directors:
Amendments to Syndicated loans with a syndicate of banks of which BNP Paribas is a member
W Person concerned: Jean-Laurent Bonnafé, company director and director of BNP Paribas.
W Nature and purpose: At its meeting on April 17, 2013, your Board of Directors authorized the signing of amendments to syndicated loans with a
syndicate of banks of which BNP Paribas is a member.
W Terms and conditions:
W 1st contract (Revolving Facility Agreement) signed on July 23, 2010, modifi ed by an amendment dated July 19, 2013
The syndicated loan agreement, as modifi ed, provides now a revolving line of credit in the amount of 1,591 million euros. The term of this
loan is 84 months (due July 2017).
The interest due on the amounts used is calculated based on EURIBOR plus an initial margin of 0.70% and mandatory costs. The initial
margin of 0.70% is adjusted on the basis of a credit margin grid depending on the long term credit rating. In addition to interest, a utilization
fee is charged based on the portion of the loan used (fee representing from 0.15% to 0.45% of the portion of the loan used).
If the line of credit is not used, Carrefour must pay a non-utilization fee equal to 35% of the margin (35% of the margin of 0.70% adjusted, if
applicable, on the basis of the credit margin grid).
W 2st contract (Revolving Facility Agreement) signed on November 21, 2011, modifi ed by an amendment dated July 19, 2013
The syndicated loan agreement, as modifi ed, provides now a revolving line of credit in the amount of 1,458 million euros. The term of this
loan is 84 months (due November 2018).
The interest due on the amounts used is calculated based on EURIBOR plus an initial margin of 0.75% and mandatory costs. The initial
margin of 0.75% is adjusted on the basis of a credit margin grid depending on the long term credit rating. In addition to interest, a utilization
fee is charged based on the portion of the loan used (fee representing from 0.15% to 0.45% of the portion of the loan used).
If the line of credit is not used, Carrefour must pay a non-utilization fee equal to 35% of the margin (35% of the margin of 0.75% adjusted, if
applicable, on the basis of the credit margin grid).
2013 REGISTRATION DOCUMENT 270
8 ANNUAL SHAREHOLDERS’ MEETINGAuditors’ special reports
W 3rd contract (Revolving Facility Agreement) signed on April 4, 2012, modifi ed by an amendment dated July 19, 2013
The syndicated loan agreement, as modifi ed, provides now a revolving line of credit in the amount of 1,100 million euros. The term of this
loan is 4 years (due April 2016).
The interest due on the amounts used is calculated based on EURIBOR plus an initial margin of 0.65% and mandatory costs. The initial
margin of 0.65% is adjusted on the basis of a credit margin grid depending on the long term credit rating. In addition to interest, a utilization
fee is charged based on the portion of the loan used (fee representing from 0.15% to 0.45% of the portion of the loan used).
If the line of credit is not used, Carrefour must pay a non-utilization fee equal to 35% of the relevant margin (35% of the margin of 0.65%
adjusted, if applicable, on the basis of the credit margin grid).
At December 31, 2013, the Company had not drawn on these lines of credit.
Agreements and commitments authorized since the end of the year-end closing
We have been informed that the following agreements and commitments authorized since the year-end closing had received prior approval by the
Board of Directors:
Investment agreement with Colony Capital Acquisitions LLC
W Person concerned: Thomas J. Barrack, company director and managing director of Colony Capital LLC, managing company of Colony Capital
Acquisitions LLC.
W Nature and purpose: At its meeting on January 15, 2014, your Board of Directors authorized the signing of an investment agreement including
Colony Capital Acquisitions LLC.
W Terms and conditions:
This agreement is intended to defi ne the terms and conditions of the transfer of Carrefour assets and the terms and conditions of investments of
Carrefour and other investors, including Colony Capital Acquisitions LLC, in a new company that will include 172 shopping malls originating from:
W fi rstly, the acquisition from Klepierre for 2.0 billion euros of 127 sites in France, Spain and Italy with gross annual rental income of around
135 million euros,
W secondly, the contribution by Carrefour of 45 sites in France with a value of 0.7 billion euros and gross annual rental income of around 45
million euros.
The company will be fi nanced through 1.8 billion euros in equity, 42% held by Carrefour with the remainder held by institutional investors,
as well as through 900 million euros in debt.
The transaction remains subject to the approval of the relevant regulatory authorities.
A greements and commitments already approved by the S hareholders’ meeting
Agreements and commitments approved during previous years that remained in force during the past year
In accordance with Article R. 225-30 of the French Commercial Code, we have been informed that the following agreements and commitments,
already approved by the Shareholders’ Meeting during previous years, remained in force during the past year.
Lease of future building located in Massy and owned by the Colony Group
W Person concerned: Sébastien Bazin, company director and Chief Executive Offi cer of Colony Europe.
W Nature and purpose: At its meeting on October 12, 2010, your Board of Directors authorized the lease of a future offi ce and commercial building
located in Massy and owned by Colmabu S.A.S., a subsidiary of Colony Europe.
W Terms and conditions:
The lease is granted and accepted for a fi rm term of 12 years and will take effect on the date of completion, scheduled for December 20, 2013.
The annual lease payment, excluding taxes and charges, has been adjusted based on the actual number of square meters of leasable fl oor area
to 21,379,815.59 euros.
This lease payment, payable quarterly in advance, will be indexed to the change in the INSEE construction index. Carrefour has also been granted
a rent-free period of 12 months as of the effective date of the lease.
Consequently, no rent was paid during the fi nancial year ended December 31, 2013.

2013 REGISTRATION DOCUMENT 271
ANNUAL SHAREHOLDERS’ MEETING
8
Auditors’ special reports
Agreements and commitments approved during previous years with no effect during the past year
Furthermore, we have been informed that the following agreements and commitments, already approved by the Shareholders’ Meeting during
previous years, remained in force but had no effect during the past year.
Commitments made by the Company for the benefi t of Mr Georges Plassat, Chief Executive Offi cer, in the event that his duties
are terminated
W Person concerned: Georges Plassat, Chief Executive Offi cer (Chief Operating Offi cer at the meeting of the Board of Directors held on January
29, 2012).
W Nature and purpose: At its meeting on January 29, 2012, your Board of Directors approved a severance clause for the benefi t of the interested
party. At its meetings on February 8 and March 7, 2012, the Board of Directors approved the performance conditions under which this severance
payment would be made.
W Terms and conditions: In the event of termination of his appointment, except in cases of non-renewal, resignation, involuntary or voluntary retirement
or removal for serious misconduct or wrongful act, the Chief Executive Offi cer will be entitled to receive, under a settlement involving waiver of
recourse on his part, a settlement payment in an amount equal to one year’s fi xed and variable remuneration, if the termination of the appointment
as Chief Executive Offi cer occurs before April 2, 2015.
The performance conditions to which this settlement is subject are as follows: like-for-like sales targets for 2012 and 2013 respectively achieve
at least 98% of like-for-like sales budgeted for 2012 and 2013 and 85% of the recurring operating income targets are achieved or, alternatively,
sales and recurrent operating income achieved in 2012 and 2013 increase by 3% and 10% respectively as compared with the previous year.
Commitments made by the Company for the benefi t of Mr Georges Plassat, Chief Executive Offi cer, concerning the supplemental
pension plan
W Person concerned: Georges Plassat, Chief Executive Offi cer (Chief Operating Offi cer at the meeting of the Board of Directors held on January
29, 2012).
W Nature and purpose: On January 29, 2012, your Board of Directors approved George Plassat’s eligibility for the supplemental pension plan.
W Terms and conditions:
This top-up defi ned benefi t pension scheme is intended for the Group’s main executives (Chief Executive Offi cer and certain key executives)
working in France or as expatriates outside of France for at least three years, whose gross annual compensation is more than 16 times France’s
social security ceiling.
W The scheme’s main features are:
_ a minimum of three years’ actual seniority to benefi t from the scheme,
_ Benefi t paid: 1.5% of benchmark remuneration per year of seniority,
_ recognition of seniority for newly hired persons aged 45 and up (age 45 = 0, age 46 = one year, age 47 = two years etc.), continued
rights to the plan if no new position is taken,
_ the benchmark remuneration is calculated on the average of the last three annual remunerations (base salary + bonus), capped at 60 times
France’s social security ceiling,
_ maximum replacement rate of 50% of benchmark remuneration (all schemes combined),
_ recognition of a maximum 20 years’ seniority under the scheme,
_ in case of death, a death benefi t for the surviving spouse is provided at 50% of the benefi ciary’s retirement pension.
The Statutory Auditors
Courbevoie, Paris-La Défense and Neuilly-sur-Seine, March 18, 2014
French original signed by
MAZARS KPMG Audit DELOITTE & ASSOCIES
Départ ment de KPMG S.A.
PATRICK DE CAMBOURG ERIC ROPERT ARNAUD DE PLANTA
PIERRE SARDET FRANCISCO SANCHEZ

2013 REGISTRATION DOCUMENT 272
8 ANNUAL SHAREHOLDERS’ MEETINGAuditors’ special reports
8.4.2 STATUTORY AUDITORS’ REPORT ON THE CAPITAL REDUCTION THROUGH CANCELLATION OF SHARES
Combined Shareholders’ Meeting of April 15, 2014
13th resolution
This is a free translation into English of the statutory auditors’ report on the capital reduction through cancellation of shares issued in French and it
is provided solely for the convenience of English-speaking users. This report should be read in conjunction with, and construed in accordance with,
French law and professional auditing standards applicable in France.
To the Shareholders,
In our capacity as Statutory Auditors of your Company and pursuant to the duties set forth in Article L. 225-209 of the French Commercial Code
governing capital reductions through cancellation of acquired shares, we have prepared this report to provide you with our assessment of the bases
for and the terms and conditions of the proposed capital reduction.
Your Board of Directors is requesting that you delegate to it, for a period of 24 months, full authority to cancel, on one or more occasions and up
to a limit of 10% of its capital per 24-month period, the shares acquired pursuant to an authorisation that allows the Company to purchase its own
shares in accordance with the provisions of the aforementioned article.
We conducted our work in accordance with the professional standards of the National Auditors Association (Compagnie Nationale des Commissaires
aux Comptes) applicable to our assignment. This work entailed determining whether the bases for and terms and conditions of the proposed capital
reduction, which is consistent with the principle of equality of shareholders, are appropriate.
We have no matters to report as to the bases for and terms and conditions of the proposed capital reduction.
The Statutory Auditors
Courbevoie, Paris-La Défense and Neuilly-sur-Seine, March 18, 2014
French original signed by
MAZARS KPMG Audit DELOITTE & ASSOCIES
Départ ment de KPMG S.A.
PATRICK DE CAMBOURG ERIC ROPERT FRANCISCO SANCHEZ
PIERRE SARDET ARNAUD DE PLANTA

DOCUMENT DE RÉFÉRENCE 2013 273
ADDITIONAL INFORMATION
9.1 Publicly available documents 274
9.2 Person responsible for the Registration Document and Annual Financial Report 274
9.3 Certifi cation by the person responsible for the Registration Document and Annual Financial Report 274
9.4 Persons responsible for auditing the fi nancial statements and fees 275
9.5 Information included by reference 277
9.6 CSR cross-reference tables 278
9.7 Registration Document concordance table 282
9.8 Annual Financial Report concordance table 285
9.9 Management report concordance table 286
9

DOCUMENT DE RÉFÉRENCE 2013 274
9 ADDITIONAL INFORMATIONPublicly available documents
Documents concerning the Company and, in particular, its bylaws, fi nancial statements and reports presented to its Shareholders’ Meetings by the
Board of Directors and the Statutory Auditors may be consulted at the head offi ce at 33 Avenue Émile Zola, 92100 Boulogne-Billancourt, France.
These documents are also available on the Company’s website at www.carrefour.com.
9.2 Person responsible for the Registration Document and A nnual F inancial R eport
9.1 Publicly available documents
Mr Georges Plassat, Chairman and Chief Executive Offi cier .
9.3 Certifi cation by the person responsible for the Registration Document and A nnual F inancial R eport
I hereby certify, having taken all reasonable measures to this end, that the information contained in this Registration Document is, to the best of my
knowledge, true and correct, and that there are no omissions that could alter its scope.
I hereby certify that, to the best of my knowledge, the fi nancial statements were prepared in accordance with applicable accounting standards and
give a true and fair view of the assets and liabilities, fi nancial situation and income of the Company and of all the consolidated companies, and that
the attached management report gives a true and fair view of the changes in the business, results and fi nancial situation of the Company and of all
the consolidated companies, as well as a description of the main risks and uncertainties to which they are subject.
I have obtained a letter from the Statutory Auditors stating that they have completed their assignment, which included checking the information
concerning the fi nancial situation and the fi nancial statements provided in this document and reading the entire document.
The historical fi nancial information presented in the Registration Document has been subjected to the Statutory Auditors’ reports, which contain an
observation on page 222 relating to the impact of the fi rst application of the revised IAS 19 «Employee Benefi ts».
March 24 , 2014
Georges Plassat
Chairman and Chief Executive Offi cer

DOCUMENT DE RÉFÉRENCE 2013 275
ADDITIONAL INFORMATION
9
Persons responsible for auditing the fi nancial statements and fees
9.4 Persons responsible for auditing the fi nancial statements and fees
Principal Statutory Auditors
Deloitte & Associés
185 Avenue Charles-de-Gaulle, (92524) Neuilly-sur-Seine Cedex, France
Signatories: Messrs Arnaud de Planta and Francisco Sanchez
Date of initial appointment: Ordinary Shareholders’ Meeting of April 15,
2003
Expiration of the current appointment during the Ordinary Shareholders’
Meeting called to approve the fi nancial statements for the fi scal year
ended December 31, 2014.
KPMG SA
3 Cours du Triangle, 92939 Paris la Défense Cedex, France
Signatory: Mr Eric Ropert
Date of initial appointment: Ordinary Shareholders’ Meeting of May 9,
1968
Expiration of the current appointment during the Ordinary Shareholders’
Meeting called to approve the fi nancial statements for the fi scal year
ended December 31, 2014.
Cabinet Mazars
61 Rue Henri-Régnault, (92075) Paris La Défense, France
Signatories: Messrs Patrick de Cambourg and Pierre Sardet
Date of initial appointment: Combine d Shareholders’ Meeting
of June 21, 2011
Expiration of the current appointment during the Ordinary Shareholders’
Meeting called to approve the fi nancial statements for the fi scal year
ended December 31, 2016.
Alternate Statutory Auditors
BEAS
7-9 Villa Houssay, (92524) Neuilly-sur-Seine Cedex, France
Date of initial appointment: Ordinary Shareholders’ Meeting of April 15,
2003
Expiration of the current appointment during the Ordinary Shareholders’
Meeting called to approve the fi nancial statements for the fi scal year
ended December 31, 2014.
Mr Bernard Perot
32 Rue du 19 Janvier, (92500) Rueil Malmaison, France
Date of initial appointment: Ordinary Shareholders’ Meeting of April 28,
2009
Expiration of the current appointment: Appointment expiring during the
Ordinary Shareholders’ Meeting called to approve the fi nancial statements
for the fi scal year ended December 31, 2014.
Mr Thierry Colin
61 Rue Henri-Regnault, (92400) Courbevoie, France
Date of initial appointment: Combine d Shareholders’ Meeting of
June 21, 2011
Expiration of the current appointment during the Ordinary Shareholders’
Meeting called to approve the fi nancial statements for the fi scal year
ended December 31, 2016.

DOCUMENT DE RÉFÉRENCE 2013 276
9 ADDITIONAL INFORMATIONPersons responsible for auditing the fi nancial statements and fees
STATUTORY AUDITORS’ FEES (FISCAL YEAR 2012-2013)
Deloitte & Associés KPMG Mazars
Amount(in thousands
of euros) %
Amount(in thousands
of euros) %
Amount(in thousands
of euros) %
Fiscal year 2012 2013 2012 2013 2012 2013 2012 2013 2012 2013 2012 2013
Audit
Audit of fi nancial statements, certifi cation, review of individual and Consolidated Financial Statements
Issuer 360 367 12.11 12. 33 716 702 7.19 7.31 363 348 3.65 13.25
Fully consolidated subsidiaries 2,018 1, 888 67.90 63. 42 7,674 7,689 77.10 80.13 2,400 2,037 80.08 77.54
Other work and services directly relating to the Statutory Auditors’ assignment
Issuer 23 0 0.77 0 164 74 1.65 0.77 98 94 0.91 3.58
Fully consolidated subsidiaries 266 21 8.95 0. 70 1,210 661 12.16 6.89 51 52 0.51 1.98
Subtotal 2,667 2, 276 89.74 76. 45 9,764 9,126 98.10 95.10 2,912 2,531 96.93 96.35
Other services provided by the networks to fully consolidated subsidiaries
Legal, fi scal, labour 305 495 10.26 16. 63 69 236 0.69 2.46 3 0 0.03 0.00
Others 0 206 0.00 6. 92 120 234 1.21 2.44 0 96 0.89 3.65
Subtotal 305 701 10.26 23. 55 189 470 1.90 4.9 3 96 0.92 3.65
TOTAL 2,972 2, 977 100.00 100. 00 9,953 9,596 100.00 100.00 2,915 2,627 100.00 100.00

DOCUMENT DE RÉFÉRENCE 2013 277
ADDITIONAL INFORMATION
9
Information included by reference
9.5 Information included by reference
In accordance with Article 28 of EU Regulation 809/2004 of April 29,
2004, this Registration Document includes by reference the following
information, to which the reader is invited to refer:
W for the fi scal year ended December 31, 2012: Consolidated Financial
Statements, corporate fi nancial statements and related Statutory
Auditors’ reports included in the Registration Document fi led with the
Autorité Des Marchés Financiers (AMF – French Markets Authority)
on April 4, 2013 under number D. 13-0289, on pages 153 to 246,
247 to 248, 249 to 268 and 269 to 270 respectively;
W for the fi scal year ended December 31, 2011: Consolidated Financial
Statements, corporate fi nancial statements and related Statutory
Auditors’ reports included in the Registration Document fi led with the
Autorité Des Marchés Financiers (AMF – French Markets Authority)
on March 21, 2012 under number D. 12-0182, on pages 100 to 185,
186 to 206, 247 to 252 and 250 to 252 respectively.
The information included in these two Registration Documents, other
than that indicated above, is, where applicable, replaced or updated
by the information included in this Registration Document. These two
Registration Documents are available under the conditions described in
Section 9.1 – Publicly available documents of this Registration Document.

DOCUMENT DE RÉFÉRENCE 2013 278
9 ADDITIONAL INFORMATIONCSR cross-reference tables
9.6 CSR cross-reference tables
GRI reference G3.1 Principles
of the Global Compact Principles
of the OECD Pages of the
Management Report
Strategy and analysis
1.1 Principle 9 General principle 1 18
1.2 Disclosure 4 and 5 18
Company profi le
2.1 Disclosure 3 1
2.2 Disclosure 1 7
2.3 Disclosure 3 16
2.4 Disclosure 3 IV
2.5 Disclosure 3 2
2.6 Disclosure 3 7
2.7 Disclosure 3 2
2.8 Disclosure 3 2
2.9 6
2.10 35-45-50-52-56-58
Report scope
3.1 Disclosure 2 66-70
3.2 Disclosure 2 66-70
3.3 Disclosure 2 66-70
3.4 Disclosure 2 3rd cover
3.5 Disclosure 2 18
3.6 Disclosure 2 66-70
3.7 Disclosure 2 66-70
3.8 Disclosure 2 66-70
3.9 Disclosure 2 66-70
3.10 Disclosure 2 66-70
3.11 66-70
3.12 73
3.13 Disclosure 2 70
Governance
4.1 - 4.7 General principle 6 18-22
4.8 General principles 7 and 6
Disclosure 5 21
4.9 21
4.11 Environment 3 and 4
Principle 7 44-45 et 48
4.12 General principles 7 and 8Disclosure 2, 3, 5 and 12 21
4.13 19
4.14 18-20
4.15 18-20
4.16 18-20
4.17 Disclosure 5 18-20

DOCUMENT DE RÉFÉRENCE 2013 279
ADDITIONAL INFORMATION
9
CSR cross-reference tables
GRI reference G3.1 Principles
of the Global Compact Principles
of the OECD Pages of the
Management Report
Management and performance
Finance
Financial performance
EC1 Disclosure 1 and 4a 20
EC2 28
Market presence
EC6 57-59
EC7 59 et 33-35
Indirect economic impact
EC8 61-63
Environment
Materials
EN1 Principle 8 25-29
EN2 Principle 8 26
Energy
EN3 Principle 8 28-29
EN5 Principle 8 28
EN6 Principles 8 and 9 Environment 6.b 28 et 54
Water
EN8 Principle 8 55
Biodiversity
EN12 Principle 8 47-51
EN14 Principle 8 47-51
EN15 Principle 8 49
Emissions, effl uents and waste
EN16 Principle 8 28
EN17 Principle 8 65
EN18 Principles 8 and 9 27-28
EN22 Principle 8 26
Emissions, effl uents and waste
EN26 Principle 8 44-51
Transportation
EN29 Principle 8 27
Labour relations
Employment
LA1 32
LA2 33
Workplace health and safety
LA7 38
Training and education
LA10 General principle 4 41
LA13 32-33
Human rights
Investment and purchasing practices
HR1 Principle 1 General principle 2 29-31
HR2 Principles 1 and 2 General principle 10 29-31
Child labour
HR6 Principle 5 Employment and labour/
management relations 1.b 29-31
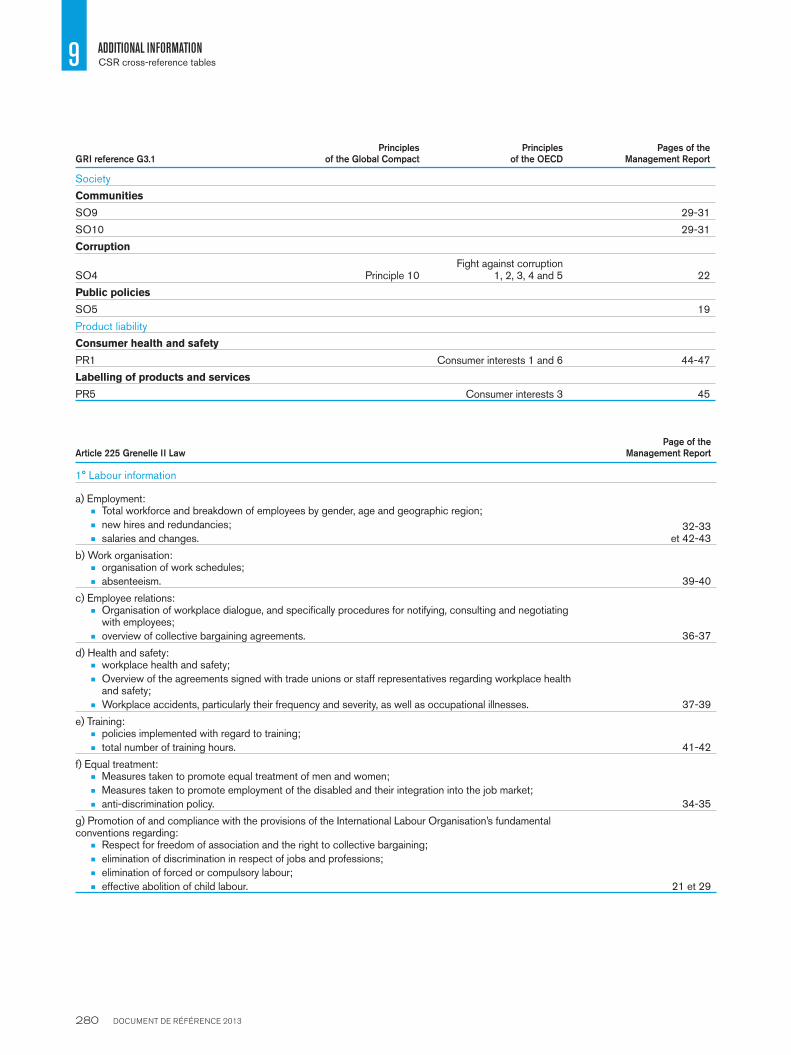
DOCUMENT DE RÉFÉRENCE 2013 280
9 ADDITIONAL INFORMATIONCSR cross-reference tables
GRI reference G3.1 Principles
of the Global Compact Principles
of the OECD Pages of the
Management Report
Society
Communities
SO9 29-31
SO10 29-31
Corruption
SO4 Principle 10 Fight against corruption
1, 2, 3, 4 and 5 22
Public policies
SO5 19
Product liability
Consumer health and safety
PR1 Consumer interests 1 and 6 44-47
Labelling of products and services
PR5 Consumer interests 3 45
Article 225 Grenelle II Law Page of the
Management Report
1° Labour information
a) Employment: W Total workforce and breakdown of employees by gender, age and geographic region;
W new hires and redundancies;
W salaries and changes. 32-33
et 42-43
b) Work organisation: W organisation of work schedules;
W absenteeism. 39-40
c) Employee relations: W Organisation of workplace dialogue, and specifi cally procedures for notifying, consulting and negotiating
with employees;
W overview of collective bargaining agreements. 36-37
d) Health and safety: W workplace health and safety;
W Overview of the agreements signed with trade unions or staff representatives regarding workplace health and safety;
W Workplace accidents, particularly their frequency and severity, as well as occupational illnesses. 37-39
e) Training: W policies implemented with regard to training;
W total number of training hours. 41-42
f) Equal treatment: W Measures taken to promote equal treatment of men and women;
W Measures taken to promote employment of the disabled and their integration into the job market;
W anti-discrimination policy. 34-35
g) Promotion of and compliance with the provisions of the International Labour Organisation’s fundamental conventions regarding:
W Respect for freedom of association and the right to collective bargaining;
W elimination of discrimination in respect of jobs and professions;
W elimination of forced or compulsory labour;
W effective abolition of child labour. 21 et 29

DOCUMENT DE RÉFÉRENCE 2013 281
ADDITIONAL INFORMATION
9
CSR cross-reference tables
Article 225 Grenelle II Law Page of the
Management Report
2° Environmental information
a) General environmental policy: W organisation of the company to handle environmental issues and, where applicable,
procedures for conducting environmental assessments or certifi cations;
W actions taken to train and educate employees regarding environmental protection;
W resources devoted to environmental and pollution risk prevention;
W The amount of provisions and guarantees for environmental risks, provided that this information is not likely to seriously harm the company in the context of pending litigation.
20-26-51
99-100
none (scope France)
b) Pollution and waste management: W measures taken to prevent, reduce or redress any discharge into the air, water or soil that has a serious
impact on the environment;
W measures taken with regard to waste prevention, recycling and disposal;
W steps taken to reduce noise pollution and any other form of pollution specifi c to an activity. 26 et 53 à 56
c) Sustainable use of resources: W water consumption and water supply based on local requirements;
W consumption of raw materials and measures taken to use them more effi ciently;
W energy consumption and measures taken to improve energy effi ciency and the use of renewable energy sources;
W land use.
54-55 27-47 à 51
28-29
56
d) Climate change W greenhouse gas emissions;
W adaptation to the consequences of climate change.
27-28-53-54
e) Biodiversity protection W measures taken to preserve and develop biodiversity.
47 à 51
3° Information regarding sustainable development commitments
a) Local, economic and social impact of the company’s activity: W on regional employment and development;
W on nearby or local populations.
57 à 61
b) Relations with the people and organisations affected by the company’s activities, including integration associations, educational institutions, environmental protection associations, consumer groups and local populations:
W conditions for building dialogue with these people and organisations;
W partnership and sponsorship activities .
18 à 20
61 à 63
c) Subcontracting and suppliers: W attention to social and environmental concerns as a factor in the purchasing policy;
W use of subcontracting and consideration of suppliers’ and subcontractors’ social and environmental responsibility in dealings with them.
29 à 31
59
d) Fair practices: W actions taken to prevent corruption;
W measures taken to promote consumer health and safety.
21-22
44 à 47
e) Other actions taken pursuant to this section 3 to promote human rights. 29 à 31

DOCUMENT DE RÉFÉRENCE 2013 282
9 ADDITIONAL INFORMATIONRegistration Document concordance table
9.7 Registration Document concordance table
Appendix I Commission Regulation (EC) 809/2004 Page no. Chapter no.
1/ Persons responsible
1.1. Identity 274 9.2
1.2. Certifi cation 274 9.3
2/ Statutory Auditors
2.1. Identity 275 9.4
2.2. Change, if any: NA
3/ Selected fi nancial information
3.1. Historical fi nancial information 4-5 1.1
3.2. Interim fi nancial information NA
4/ Risk factors 98-105 3.5
5/ Information concerning the issuer
5.1. Company history and development 13-14 1.6
5.2. Investments
5.2.1. Main investments made for each fi scal year of the covered period 9-11,122,
158-159,202-203
1.3.4,4.2.3,
5.6 (note 5), 5.6 (note 39)
5.2.2. Current main investments 9-11,122,
158-159,202-203
1.3.4,4.2.3,
5.6 (note 5), 5.6 (note 39)
5.2.3. Coming main investments 124 4.3
6/ Business overview
6.1. Principal activities 6-9 1.3.1, 1.3.2, 1.3.3
6.2. Principal markets 9-11 1.3.4
6.3. Exceptional events 5 1.2
6.4. Issuer’s dependence 13 1.5
6.5. Competitive position 9-11 1.3.4
7/ Organisational chart
7.1. Brief description of the Group 15 1.7
7.2. List of signifi cant subsidiaries206-221242-243
5.6 (note 45)6.4 (note 14)
8/ Real estate, plants and equipment
8.1. Signifi cant tangible fi xed assets 12, 170-173 1.4, 5.6
(notes 18 et 19)
8.2. Environmental issues 51-57 2.2.5
9/ Review of fi nancial situation and income
9.1. Financial situation 121-123 4.2
9.2. Operating income 116-120 4.1

DOCUMENT DE RÉFÉRENCE 2013 283
ADDITIONAL INFORMATION
9
Registration Document concordance table
Appendix I Commission Regulation (EC) 809/2004 Page no. Chapter no.
10/ Cash and cash equivalents and capital
10.1. Information about capital
121, 139, 178-179,236-237
4.2.1, 5.5, 5.6 (Note 27), 6.4
(Note 6)
10.2. Cash fl ow 122-123, 138 4.2.3, 5.4
10.3. Borrowing terms and fi nancing structure121-122, 123,
190-192 4.2.2, 4.2.4, 5.6
(Note 32)
10.4. Restrictions on the use of capital 123, 178 4.2.5, 5.6 (Note 26)
10.5. Expected fi nancing sources 123 4.2.6
11/ Research and development, patents and licences 130 4.5.5
12/ Information on trends
12.1. Principal trends since the end of the last fi scal year 127 4.4.3
12.2. Events that could signifi cantly impact future outlook 124 4.3
13/ Profi t forecasts and estimates N/A
14/ Administrative, management and supervisory bodies and general management
14.1. Information concerning members 76-86 3.2.1
14.2. Confl icts of interest 77, 87 3.2.1, 3.2.2
15/ Remuneration and benefi ts
15.1. Remuneration paid and benefi ts-in-kind 91-97 3.4
15.2. Provisions for pensions and retirement92,
184-1883.4.2, 5.6 (Note 30)
16/ Operation of administrative and management bodies
16.1. Date of expiration of appointments 76-81 3.2.1
16.2. Service contracts binding members of administrative, management and supervisory bodies 76-77 3.2.1
16.3. Information about the Board of Directors’ committees 87-89 3.2.3
16.4. Compliance with the corporate governance system in force 76 3.1
17/ Employees
17.1. Number of employees 32-33 2.2.1
17.2. Profi t-sharing and stock options 95-96, 254 3.4.3, 7.2.2
17.3. Agreement on employee profi t-sharing 43, 96, 256 2.2.3.3, 3.4.3, 7.3.1
18/ Principal shareholders
18.1. Shareholders holding more than 5% of capital 255-256 7.3.1
18.2. Existence of different voting rights 250 7.1.4.5
18.3. Direct or indirect control N/A
18.4. Agreement that could result in a change of control if implemented 255-257 7.3
19/ Transactions with related parties130, 204,
272 4.5.4, 5.6
(note 41), 8.4
20/ Financial information concerning the issuer’s assets and liabilities, fi nancial situation and results
20.1. Historical fi nancial information 133-221, 225-243 5, 6
20.2. Pro forma fi nancial information N/A
20.3. Financial statements 133-221, 225-243 -
20.4. Verifi cation of annual historical fi nancial information 222-223, 244-245 5.7, 6.5
20.5. Date of most recent fi nancial information 133-221, 225-243 5.6
20.6. Interim fi nancial information and other N/A
20.7. Dividend distribution policy 129-130 4.5.3
20.8. Judicial and arbitration proceedings 189 5.6 (Note 31)
20.9. Signifi cant change in the fi nancial or commercial situation 127, 2054.4.3, 5.6 (Note 43)

DOCUMENT DE RÉFÉRENCE 2013 284
9 ADDITIONAL INFORMATIONRegistration Document concordance table
Appendix I Commission Regulation (EC) 809/2004 Page no. Chapter no.
21/ Additional information
21.1. Equity capital 251-254 7.2
21.2. Articles of incorporation and bylaws 248-250 7.1
22/ Key agreements N/A
23/ Information from third parties, expert statements and declarations of interest
23.1. Identity 72 2.7.4
23.2. Certifi cation 71-72 2.7.4
24/ Publicly available documents 274 9.1
25/ Information about equity interests206-221,242-243
5.6 (Note 45) 6.4 (Note 14)

DOCUMENT DE RÉFÉRENCE 2013 285
ADDITIONAL INFORMATION
9
Annual Financial Report concordance table
9.8 Annual F inancial R eport concordance table
Sections of Article L. 451-1-2 of the French Monetary and Financial Code Page no. Chapter no.
1/ Management report
Analysis of change in sales 116-120 4.1
Analysis of results 116-120 4.1
Analysis of fi nancial situation 121-123 4.2
Principal risks and uncertainties 98-105 3.5
Capital structure and factors that could have an impact in case of a tender offer 251, 255-257 7.2.1, 7.3
Company buybacks of its own shares 253-254 7.2.3
2/ Consolidated Financial Statements 133-221 5
3/ Corporate fi nancial statements 225-243 6
4/ Statutory Auditors’ reports on the corporate and Consolidated Financial Statements 222-223, 244-245 5, 6
5/ Statutory Auditors’ fees 274 9.4
6/ Chairman of the Board of Directors’ report on governance and internal control 76-112 3
7/ Statutory Auditors’ report on the Chairman of the Board of Directors’ report on governance and internal control 113 3.7
8/ Declaration of the private individuals assuming responsibility for the annual fi nancial report 272 9.3

DOCUMENT DE RÉFÉRENCE 2013 286
9 ADDITIONAL INFORMATIONManagement report concordance table
9.9 Management report concordance table
Reference texts Page no. Chapter no.
Comment on the fi scal year
French Commercial Code
L. 225-100, L. 225-100-2, L. 232-1, L. 233-6 and L. 233-26
Objective, comprehensive analysis of changes in the business, results and fi nancial situation of the Company and of the Group 115-131 4
French Commercial Code
L. 225-100 and L. 225-100-2
Key non-fi nancial performance indicators relating to the Company’s specifi c activity 64-66 2.3
French Commercial Code L. 233-6
Signifi cant acquisitions during the fi scal year of equity interests in companies whose head offi ce is located in France 125-126 4.4.2
French Commercial Code
L. 232-1 and L. 233-26
Signifi cant events between the fi scal year closing date and the report preparation date 127 4.4.3
French Commercial Code
L. 232-1 and L. 233-26
Foreseeable change in the situation of the Company and of the Group 124 4.3
French General Tax Code 243 bis
Dividends distributed for the three previous fi scal years and amount of income distributed for these same fi scal years eligible for the 40% tax reduction 129-130 4.5.3
Presentation of the Group
French Commercial Code
L. 225-100 and L. 225-100-2
Description of the principal risks and uncertainties to which the Company is subject 98-105 3.5
French Commercial Code
L. 225-100 and L. 225-100-2
Use of fi nancial instruments by the Company: fi nancial risk management objectives and policy 102-103 3.5.1
French Commercial Code
L. 225-100 and L. 225-100-2
The Company’s exposure to price, credit, liquidity and, cash fl ow risks 102-103 3.5.1
French Commercial Code
L. 225-102-1, L. 225-102-2 and R. 225-104
Social and environmental consequences of the business (including “Seveso” installations) 17-73 2
French Commercial Code L. 232-1 Research and development activities 130 4.5.5
Information regarding corporate governance
French Commercial Code L. 225-102-1
List of all corporate offi cers and duties they performed at any company during the fi scal year 82-86 3.2
French Commercial Code L. 225-102-1
Total remuneration and benefi ts of any kind paid during the fi scal year to each corporate offi cer 91-96 3.4
French Commercial Code L. 225-102-1
Commitments of any kind made by the Company in favour of its corporate offi cers relating to remuneration, compensation or benefi ts owed or likely to be owed due to the assumption or termination of or change in these duties or subsequent thereto 91-96 3.4
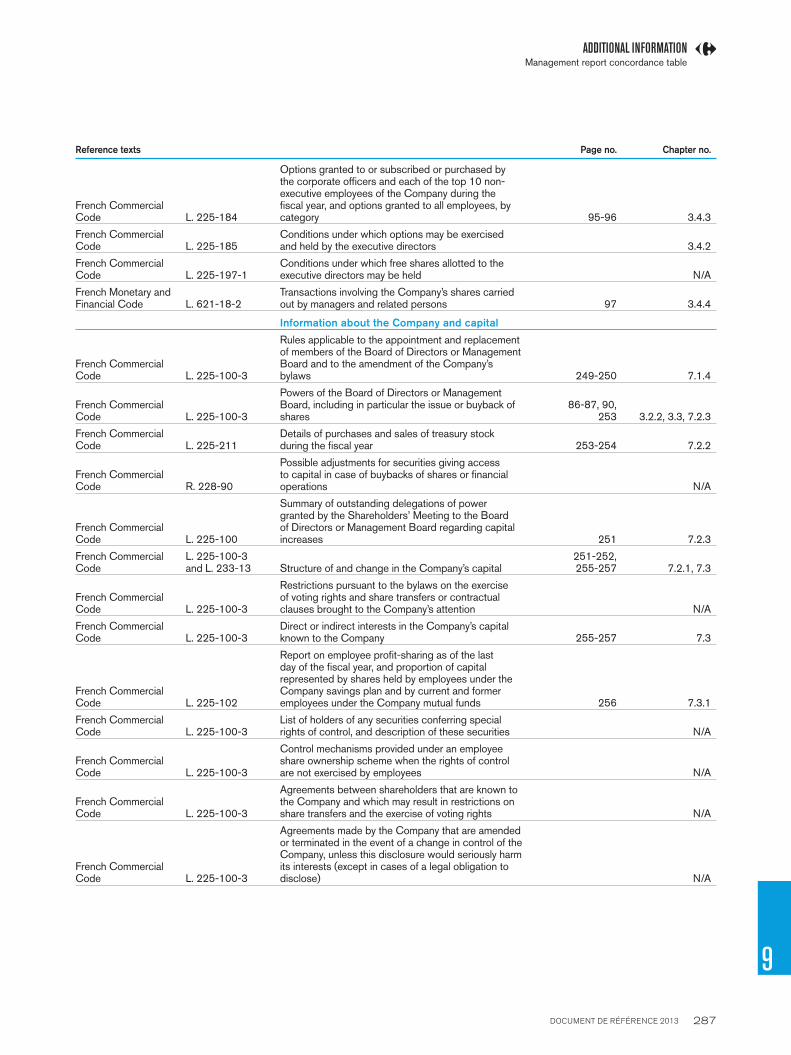
DOCUMENT DE RÉFÉRENCE 2013 287
ADDITIONAL INFORMATION
9
Management report concordance table
Reference texts Page no. Chapter no.
French Commercial Code L. 225-184
Options granted to or subscribed or purchased by the corporate offi cers and each of the top 10 non-executive employees of the Company during the fi scal year, and options granted to all employees, by category 95-96 3.4.3
French Commercial Code L. 225-185
Conditions under which options may be exercised and held by the executive directors 3.4.2
French Commercial Code L. 225-197-1
Conditions under which free shares allotted to the executive directors may be held N/A
French Monetary and Financial Code L. 621-18-2
Transactions involving the Company’s shares carried out by managers and related persons 97 3.4.4
Information about the Company and capital
French Commercial Code L. 225-100-3
Rules applicable to the appointment and replacement of members of the Board of Directors or Management Board and to the amendment of the Company’s bylaws 249 -250 7.1.4
French Commercial Code L. 225-100-3
Powers of the Board of Directors or Management Board, including in particular the issue or buyback of shares
86-87, 90, 253 3.2.2, 3.3, 7.2.3
French Commercial Code L. 225-211
Details of purchases and sales of treasury stock during the fi scal year 253-254 7.2.2
French Commercial Code R. 228-90
Possible adjustments for securities giving access to capital in case of buybacks of shares or fi nancial operations N/A
French Commercial Code L. 225-100
Summary of outstanding delegations of power granted by the Shareholders’ Meeting to the Board of Directors or Management Board regarding capital increases 251 7.2.3
French Commercial Code
L. 225-100-3 and L. 233-13 Structure of and change in the Company’s capital
251-252, 255-257 7.2.1, 7.3
French Commercial Code L. 225-100-3
Restrictions pursuant to the bylaws on the exercise of voting rights and share transfers or contractual clauses brought to the Company’s attention N/A
French Commercial Code L. 225-100-3
Direct or indirect interests in the Company’s capital known to the Company 255-257 7.3
French Commercial Code L. 225-102
Report on employee profi t-sharing as of the last day of the fi scal year, and proportion of capital represented by shares held by employees under the Company savings plan and by current and former employees under the Company mutual funds 256 7.3.1
French Commercial Code L. 225-100-3
List of holders of any securities conferring special rights of control, and description of these securities N/A
French Commercial Code L. 225-100-3
Control mechanisms provided under an employee share ownership scheme when the rights of control are not exercised by employees N/A
French Commercial Code L. 225-100-3
Agreements between shareholders that are known to the Company and which may result in restrictions on share transfers and the exercise of voting rights N/A
French Commercial Code L. 225-100-3
Agreements made by the Company that are amended or terminated in the event of a change in control of the Company, unless this disclosure would seriously harm its interests (except in cases of a legal obligation to disclose) N/A

DOCUMENT DE RÉFÉRENCE 2013 288
9 ADDITIONAL INFORMATIONManagement report concordance table
Reference texts Page no. Chapter no.
Information about the Company and capital
French Commercial Code L. 225-100-3
Agreements providing for payments to members of the Board of Directors or Management Board or employees if they resign or are dismissed without real and serious cause or if their employment ends as a result of a tender offer 91-96 3.4
French Commercial Code L. 464-2
Injunctions or fi nancial penalties for anti-competitive practices N/A
Information related to the fi nancial statements
French Commercial Code L. 232-6
Possible changes in the presentation of the fi nancial statements and the valuation methods used N/A
French Commercial Code R. 225-102
Company earnings performance in the last fi ve fi scal years 131 4.5.6

DISCOVER OUR OTHER PUBLICATIONS
2013 annual activity
and responsible
commitment report
2013
Carrefour Foundation
annual report
2014
Shareholder’s guide
(in French version)
CONTACTSCarrefour group
Head Offi ce
33 avenue Émile Zola
TSA 55 555
92649 Boulogne-Billancourt Cedex
Investor Relations
Shareholder Relations
Toll-free number for shareholders in France:
0 805 902 902
Number for shareholders outside France:
+33 (01) 41 04 26 00
Registered Shareholders CACEIS Corporate Trust
Investor relations
14, rue Rouget-de-Lisle
92852 Issy-les-Moulineaux Cedex 09
Phone : +33 (0)1 57 78 34 44
Fax : +33 (0)1 49 08 05 80
GET THE LATEST NEWS ON THE CARREFOUR GROUP’S WEBSITEwww.carrefour.com
Conception:
Carrefour group Legal Department
Photo credits:
Gilles Leimdorfer / Interlinks Image.
Design and production:
This paper comes from sustainably managed
forests and controlled sources.

www.carrefour.comSociété Anonyme with capital of €1,809,960,480
Head offi ce: 33, avenue Emile Zola - 92100 Boulogne-Billancourt - France
652 014 051 RCS Nanterre