Embed Size (px)
Citation preview

Clase 4: Balance de Flujos Metabólicos 2
Prof: Guillermo R. Castro
Lab de Nanobiomateriales – CINDEFI
UNLP – CONICET, La Plata
Materia de Articulación CEBI - E4b
Ingeniería Metabólica
CARRERA DE ESPECIALIZACION EN BIOTECNOLOGIA
INDUSTRIAL . FCEyN-INTI

Flujo metabólico (def.)
El flujo metabólico se define como la velocidad a la que un sustrato se convierte en un producto mediante reacciones y rutas metabólicas.
Sustrato –> Metabolito Intermedio –> Producto

3
Vias en E. coli
(A) This version of the overview shows all interconnections between occurren-ces of the same metabolite to communicate the complexity of the interconnections in the metabolic network.
Ouzonis, Karp, Genome Res. 10, 568 (2000)
Guillermo R. Castro

Guillermo R. Castro Page 4
La Cascada “Omica”
Que puede suceder?
Que podría suceder?
Que hace que eso suceda?
Que ha sucedido y que pasara?

Estructuracion de modelos metabolicos
Metabolic Networks Quantitative Model
Omics data Molecular Biology data
Integration of heterogenous data
(BASE)
Genomics Transcriptomics Proteomics Metabolomics Fluxomics Physiomics
Page 5 Guillermo R. Castro

De genes a flujos metabolicos
Page 6 Guillermo R. Castro

Construcción de un modelo biológico
Guillermo R. Castro Page 7

Aplicaciones de los modelos
Metabolic engineering
Model-directed discovery
Interpretation of phenotypic screens
Analysis of network properties
Studies of evolutionary processes
Ej.: iAF1260 model Lycopene L-valine L-threonine
Network analysis – how much value? What are the inputs and output? Buchnera has some high-value waste products. Missing biology?
Evolution of reduced networks Pan genomes.
Compare KO strains and/or Biolog data to model predictions - Improves model.
Informing on the biological function of metabolism. Orphan enzymes and transporters.
Page 8 Guillermo R. Castro

E. coli K12
Guillermo R. Castro Page 9
E. coli Metabolic Model IAF1260
Metabolic
Reactions 2382
Regulatory data RegulonDB
Regulatory Interactions 1773
Microarrays 907
Total Genes in the model 1400
Validation Data set 1875 growth phenotypes

Guillermo R. Castro 10
Modelo iAF1260 de E. coli K 12

A genome-scale metabolic reconstruction for Escherichia coli K-12 MG1655 that accounts for 1260 ORFs and thermodynamic information
Mol Syst Biol. 2007; 3: 121.
Guillermo R. Castro Page 11

Modelo iAF1260 de E. coli K 12
Guillermo R. Castro Page 12

Guillermo R. Castro Page 13
Glucosa,
eje central
del
metabolismo

Guillermo R. Castro Page 14
Glicólisis – fase preparatoria

Guillermo R. Castro Page 15
Glicólisis – fase de síntesis

Guillermo R. Castro Page 16
Glicólisis – resumen energético
La glicólisis se encuentra muy regulada en la célula y
coordinada con otras rutas metabólicas que producen
energía para poder suministrar ATP. Las enzimas
Hexokinasa, PFK-1 y Piruvato Kinasa se encuentran
reguladas alostericamente, lo que permite controlar el flujo
de C a través de la vía metabólica y mantiene constante
los niveles de los intermediarios de la ruta.
Detalle de los mecanismos: http://www.iubmb-nicholson.org/swf/glycolysis.swf

Un problema a ser resuelto S. cerevisae
Page 17 Guillermo R. Castro

Un problema a ser resuelto
Hauf, J., Zimmermann, F.K., Müller, S., 2000. Simultaneous
genomic over expression of seven glycolytic enzymes in the yeast
Saccharomyces cerevisiae. Ezyme. Microbiol. Technol. 26, 688-
698.
Page 18 Guillermo R. Castro
Consumo de glucosa y prod de etanol en mutante sobreexpresada y WT

Se pueden determinar los flujos utilizando datos expresion genica
Sin embargo NO existe correlacion lineal
Page 19 Guillermo R. Castro

The PEP carboxykinase promoter region, showing the complexity of
regulatory
Guillermo R. Castro Page 20

Transcriptoma & proteoma Olivares R, Bordel S, Nielsen J. Codon usage variability determines the correlation
between proteome and transcriptome fold changes. BMC Systems Biology.
Page 21 Guillermo R. Castro

P Rj jf f[ P ] k[mRNA]
[ P ] k( )[mRNA]
[ P ] k( , j )[mRNA] P Rj j jf f
P Rj jf f
Page 22 Guillermo R. Castro
P, protein, R, mRNA

Page 23 Guillermo R. Castro

js , j d , jj j j
d Pk mRNA k P P
dt
j Rjd , jj j j
j
d PmRNA k P P
dt t
j ij ii
t S
Page 24 Guillermo R. Castro
ks,j and kdj are the protein synthesis & degradation rate constants
the number of ribosomes united to each mRNA molecule ρRj
and the elongation time of the protein tj.
Where Sij is the number of codons i in the gene j and
Ʈi is the average time that will take to add the corresponding amino acid to the nascent peptide

Agrupamiento de genes por similaridad de secuencias
Page 25 Guillermo R. Castro

Analisis de varianza
2
Pj
j Rj
fx log
f Total between withinSS SS SS
2
within jc cc j
SS x x
2
between c cc
SS n x x
Page 26 Guillermo R. Castro
C, cluster, N, de Prot en el cluster

Resultados
Usaite.sn
f1
Usaite.sn
f4
Usaite.snf
1.4
Griffin Ideker Washburn
Within/Total 0.27 0.09 0.27 0.13 0.39 0.20
Between/Total 0.73 0.91 0.73 0.87 0.61 0.80
F-test (B/W) 2.70 10.06 2.75 6.63 1.54 4.09
p-value 0.001 1E-06 4.5E-5 0.015 0.55 2E-5
Page 27 Guillermo R. Castro

Statistical description of gene-expression and flux changes
The RNA arrays provide measurements for the significance of the expression changes in every gene. We need a method to provide measurements for the significance of flux changes in every reaction.
Bordel S, Agren R, Nielsen J. Sampling the Solution Space in Genome-Scale Metabolic Networks Reveals Transcriptional Regulation in Key Enzymes. 2010. PLoS Comput. Boil. 6: e1000859
Page 28 Guillermo R. Castro

Page 29 Guillermo R. Castro

Geometry of the sampling method
Page 30 Guillermo R. Castro

Comparison between the Hit and Run algorithm and the sampling of the convex basis.
The Hit and Run algorithm seems to underestimate the variance. Page 31 Guillermo R. Castro
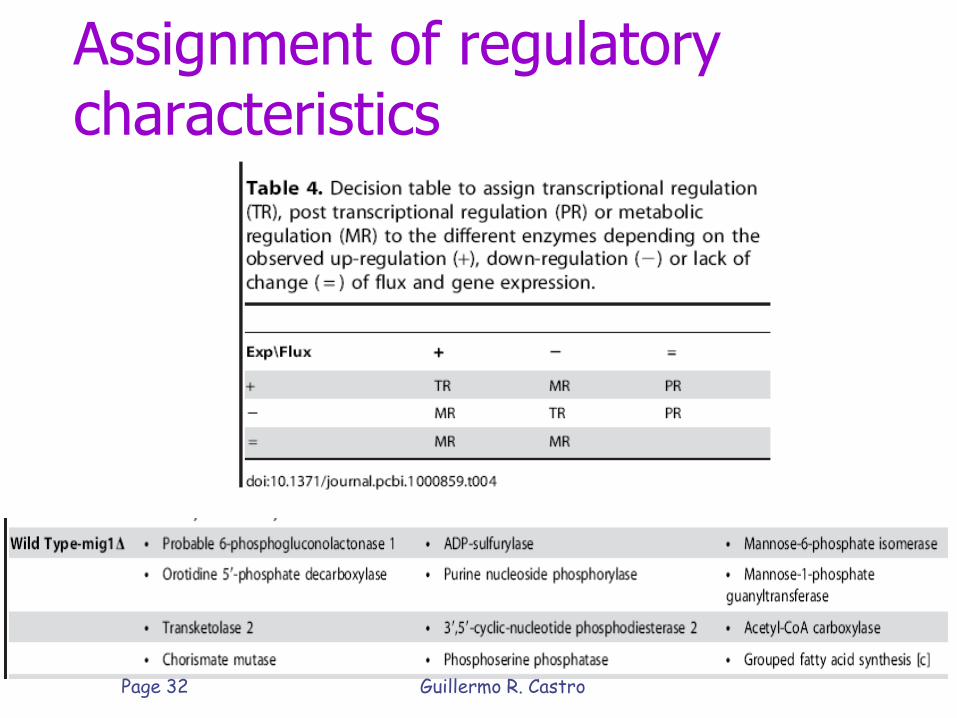
Assignment of regulatory characteristics
Page 32 Guillermo R. Castro

Some results Deletion of HXK2
Page 33 Guillermo R. Castro
Gluc to Ethanol --- Transcritional reg (up) --- down regulation

Transcription factor enrichment (very significant for many TFs)
Transition from glucose to ethanol or acetate:
Gcr1, Gcr2 and Hap4.
Glucose-Ethanol 19 enzymes TR, Gcr1 in 11 of them 22 enzymes PR, Gcr1 in none of them
Wild type versus grr1∆ and hxk2 ∆ mutants:
Pho2 and Bas1:
Regulators of purine and histidine biosynthesis.
Wild type- grr1∆ 26 enzymes TR, Pho2 in 10 of them 73 enzymes PR, Pho2 in 6 of them
Wild type versus mig1∆ mig2∆ mutant:
Gcn4 and Cbf1: response against starvation
increases growth rate by stimulating amino-acid synthesis and ribosome proliferation
Page 34 Guillermo R. Castro
TR, transcriptional regulation
PR, post-TR

Page 35 Guillermo R. Castro

The role of constraints
Bordel S, Nielsen J. Identification of flux control in metabolic networks using non-
equilibrium thermodynamics. 2010. Metab. Eng. 13, 369-377 Page 36 Guillermo R. Castro

How does the cell “choose” its metabolic state?
Objective function +
Set of constraints
Metabolic state
?
Page 37 Guillermo R. Castro

Aerobic and oxygen limited chemostats
Page 38 Guillermo R. Castro

Anaerobic chemostat and glucose excess batch
Vemuri et. al. 2006 Batch fermentation
Page 39 Guillermo R. Castro NOX= NADPH oxidasas

Modelo dinamicos: Ecuaciones diferenciales, gran cantidad de parametros desconocidos
Modelos Cuantitativos
Modelos de estado estacionario: Ecuaciones Algebraicas lineales
( , , , ) d
tdt
y
F x y p
0 S v
El analisis de flujos debe ser restringuido a estado estacionario
40 Guillermo R. Castro

S: matriz estequiometrica
V: distribucion de flujos
3.- Restriccion :
Prediccion de la distribucion de flujos en estado estacionario:
X1
X2
X3
100 v1
v2
v3
v4
v5
v6
5( )F vv
0 S v
2.- Definir funcion:
Analisis de flujos
Page 41 Guillermo R. Castro
1.- Componentes del sistema: moleculas? (x=3) Flujos? (v=6)

X1
X2
X3
100 v1
v2
v3
v4
v5
v6
1
2
1
3
2
4
3
5
6
0 1 1 1 0 0 0
0 0 1 0 1 1 0
0 0 0 1 1 0 1
v
vX
vX
vX
v
v
Analisis de flujos (cont)
Page 42 Guillermo R. Castro
1ra regla: balance de
masas = CERO
X1 = X2 + X3

Para mutantes con genes delecionados se empela un flujo de estado estacionario predecido mediante logica boleana
0S v Method Optimization Algorithm Additional information
rFBA
(regulatory Flux Balance Analysis)
Linear Programming Regulatory network
(genomics)
SR-FBA
(Steady-state Regulatory-FBA)
Mixed Integer Linear
Programming
Regulatory network
MOMA
(Minimization Of Metabolic Adjustment)
Quadratic Programming Flux distribution of wild type
(fluxomics)
ROOM
(Regulatory On/Off Minimization)
Mixed Integer Linear
Programming
Flux distribution of wild type
Reactions for knockout gene = 0 Other reactions =1
Page 43 Guillermo R. Castro

Mayores problemas: En mutantes en donde se delecionaron genes muchas otras expresiones de genes varian. Como integrar el transcriptoma o proteoma en analisis de flujos metabolicos?.
Propuesta:
Metodo de analisis
elemental para realizar
la integracion.
Page 44 Guillermo R. Castro

Modo Elemental de analisis (EMs)
1
2 1 2
3
1 1
1 0
0 1
v
v
v
EM1 EM2
A B 1v
3v
1
2
2vEM1
EM2
Minimiza la cantidad de enzimas en un grupo de
cascadas enzimaticas compuestas por
reacciones irreversibles en estado estacionario
Page 45 Guillermo R. Castro

X1
X2
X3
100
60
70
20
4030
v1
v2
v3
v4
v5
v6
v7
30
Modos Elemetales (Ems)
Matrix estequiometrica
1
2
3
4
5
6
7
1
1 2
1 3
3 2
2
3
2 3
v X
v X X
v X X
v X X
v X
v X
v X X
1
2
3
4
5
ME
v P
Flujos
Matriz Elemental
Coeficiente EM
Page 46 Guillermo R. Castro

1
2
3
4 1 2 3 4 5
5
6
7
1 1 1 1 0
1 0 0 1 0
0 1 1 0 0
0 0 1 0 1
1 0 1 0 0
0 1 0 1 0
0 0 0 1 1
v
v
v
v
v
v
v
1
2 1
3 2
4 3
5 4
6 5
7
1 1 1 1 0
1 0 0 1 0
0 1 1 0 0
0 0 1 0 1
1 0 1 0 0
0 1 0 1 0
0 0 0 1 1
v
v
v
v
v
v
v
1 1 1 1 1
100 1 1 1 1 0
60 1 0 0 1 0
40 0 1 1 0 0
( 30) (70 ) (60 ) ( 40)30 0 0 1 0 1
70 1 0 1 0 0
30 0 1 0 1 0
20 0 0 0 1 1
1 2 3 4 5
Problema: el CEM is not uniquely determined.
Matriz estequiometrica Flujo Flujo= ME ・ CEM
v P
ES NECESARIO determinar un objetivo Page 47 Guillermo R. Castro
(CEM, coef estequiometrico de la matriz)

Objetivos
Maximizacion del crecimiento: pgm Lineal
Funcion conveniente: programacion cuadratica
2
1
ne
i
i
Max
,
1
ne
biomass biomass i i
i
Max v p
Maximizar la Entropia (MEP)
Page 48 Guillermo R. Castro
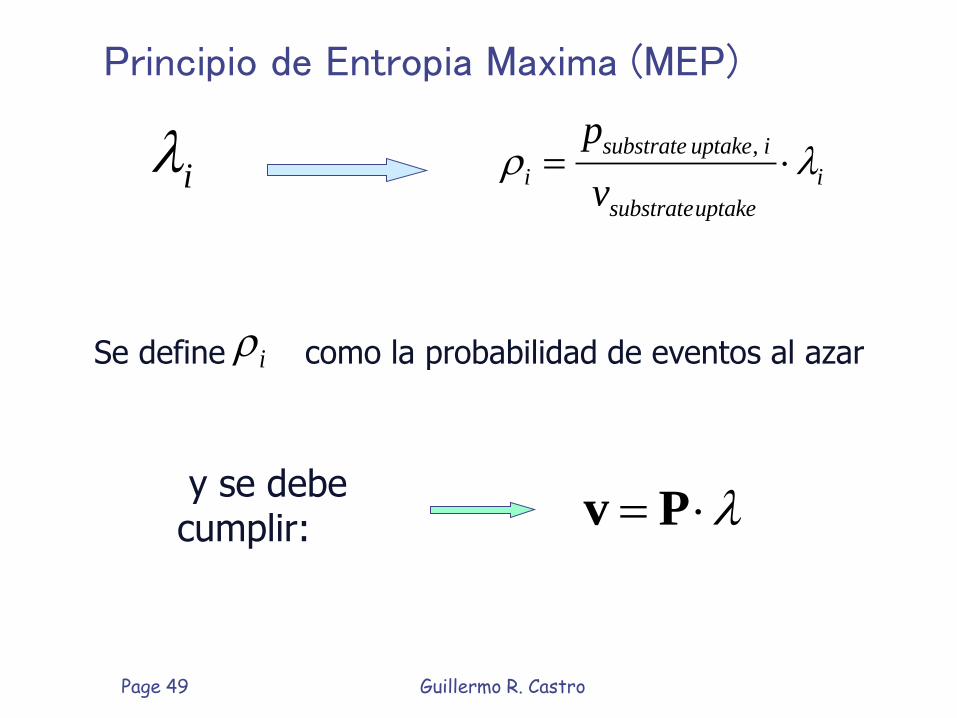
i ,substrate uptake i
i i
substrateuptake
p
v
Principio de Entropia Maxima (MEP)
v P
Page 49 Guillermo R. Castro
y se debe cumplir:
iSe define como la probabilidad de eventos al azar

1
logn
i i
i
Maximize
1
1n
i
i
,
1
1,2,...,n
i r i r
i
x v r m
Principio de Entropia Maxima (MEP)
,
1
n
i r i r
i
p v
Shannon information entropy
Restricciones
v PQ. Zhao, H. Kurata, Maximum entropy decomposition of flux distribution at steady state to elementary modes. J Biosci Bioeng, 107: 84-89, 2009
Page 50 Guillermo R. Castro

ECF integra los perfiles actividad enzimatica en
modos elementales.
ECF es descripta por una ecuacion de poder.
La ecuacion describe como los cambios en un perfil de
actividad enzimatica entre la cepa salvaje y la mutada se
relaciona con los cambios de los coef. de la matriz
estequiometrica (EMCs).
Control de Flujos por Enzimas (ECF)
Kurata H, Zhao Q, Okuda R, Shimizu K. Integration of enzyme activities into metabolic flux distributions by elementary mode analysis. BMC Syst Biol. 2007;1:31.
Page 51 Guillermo R. Castro
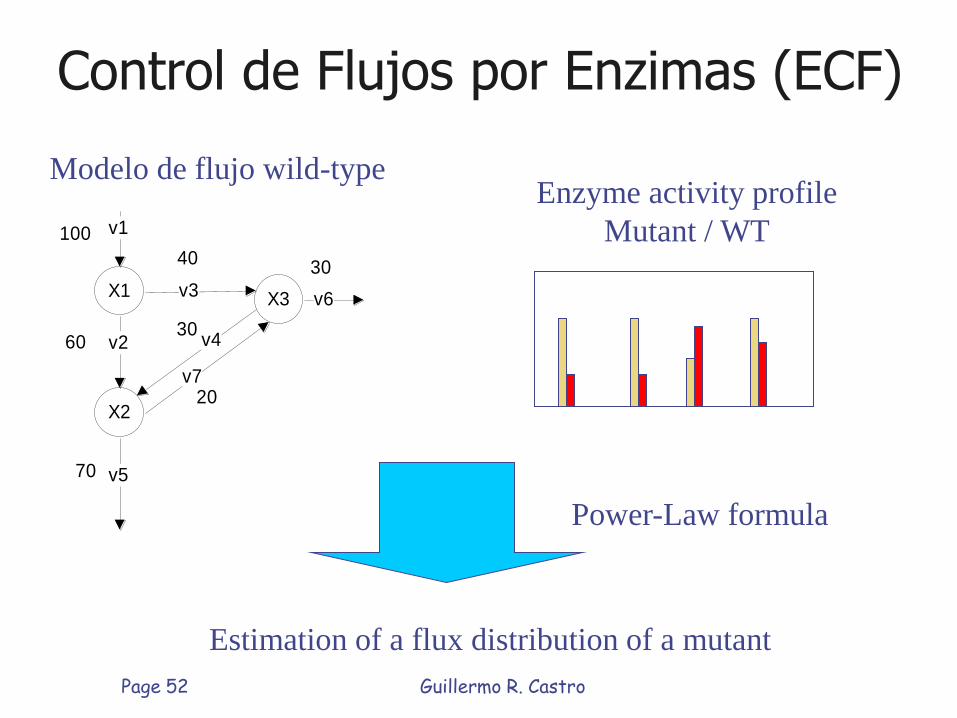
Modelo de flujo wild-type Enzyme activity profile
Mutant / WT
X1
X2
X3
100
60
70
20
4030
v1
v2
v3
v4
v5
v6
v7
30
Estimation of a flux distribution of a mutant
Power-Law formula
Page 52 Guillermo R. Castro
Control de Flujos por Enzimas (ECF)

ref ref v P
Modelo de Referencia
Power Law Formula
Change in enzyme activity profile
target target v P
Prediction of a flux distribution of a target cell
ref target
refMEP
1 2( , ,..., )na a a
ECF Algorithmo
Page 53 Guillermo R. Castro
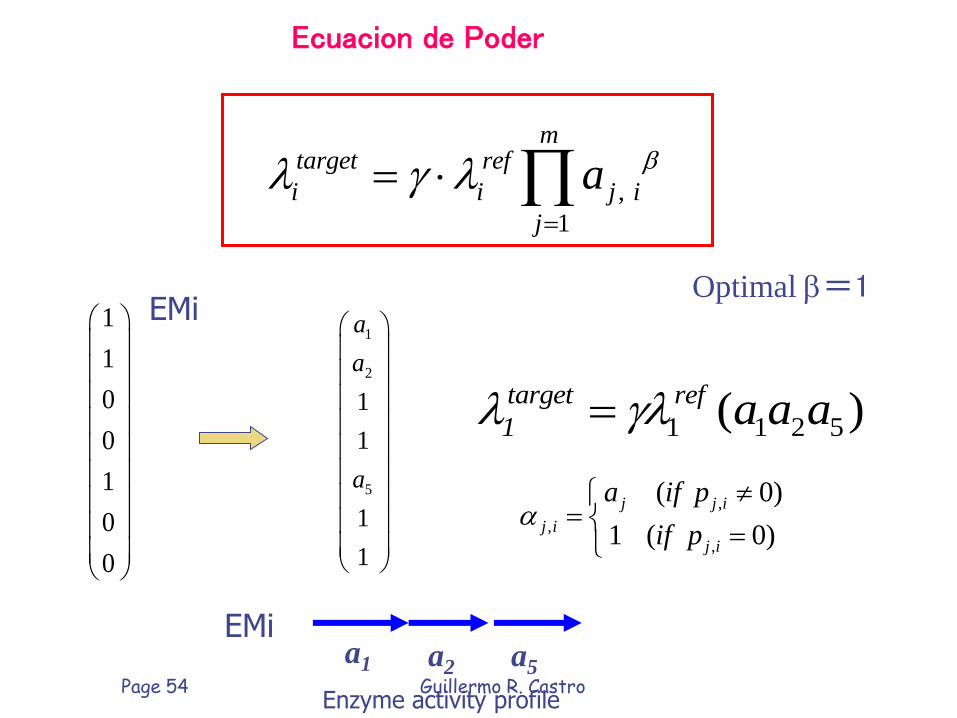
a1 a5 a2
,
1
mtarget ref
i i j i
j
a
,
,
,
( 0)
1 ( 0)
j j i
j i
j i
a if p
if p
1
1
0
0
1
0
0
1
2
5
1
1
1
1
a
a
a
1 1 2 5( )target ref
1 a a a
EMi
Ecuacion de Poder
EMi
Enzyme activity profile
Optimal =1
Page 54 Guillermo R. Castro

pykF knockout in a metabolic network
74 EMs
Glc
G6P
F6P
GAP
6PG
Ru5P
E4P
Sed7P
PEP
AcCoA
ICT
AKGMAL
OAA
Acetate
PYR
glycolysis
Pentose
Phosphate
Pathways
TCA cycle
1, pts
2, pfkA
3, gapA
4, pykF
5, aceE6, pta
7, gltA
8, icdA
9, sucA
10, mdh
11, ppc
12, mez
18, pgi
13, zwf
15, ktkA
14, gnd
16, tktB
17, talB
19
20
21
22
24
25
29
30
27
28
23
26
Page 55 Guillermo R. Castro
pykF Piruvato kinasa
Effect of a pyruvate kinase (pykF-gene) knockout mutation on the control of gene expression and metabolic fluxes in Escherichia coli

Guillermo R. Castro Page 56

Effecto del numero de
enzimas integradas en el
error del modelo de
Control de Flujo por
Enzimas (ECF)
5
10
15
20
25
30
0 2 4 6 8 10
Mo
de
l E
rro
r
Number of Integrated Enzymes
=> A mayor N de enzimas en el modelo => mayor
exactitud de calculo.
Page 57 Guillermo R. Castro

Exactitud de la Prediction del ECF
Gene deletion Number of
enzymes used for
prediction
Prediction accuracy
(control: no enzyme activity
profile is used)
pykF 11 +++
ppc 8 +++
pgi 5 +
cra 6 +++
gnd 4 +
fnr 6 +++
FruR 6 +++
58 Guillermo R. Castro

ECF provee una correlacion
cuantitativa entre los perfiles de
actividad enzimatica y la
distribucion de flujos
VENTAJAS del ECF
Page 59 Guillermo R. Castro

Modificacion genetica
de Flujos
Quanyu Zhao, Hiroyuki Kurata, Genetic modification of flux for flux prediction of mutants, Bioinformatics, 25: 1702-1708, 2009
Page 60 Guillermo R. Castro

Gene expression (enzyme activity) profile
Metabolic Networks /gene deletion
Distribucion de flujos Metabolicos
Metabolic flux distribution for genetic mutants
ECF MOMA/rFBA
Prediccion de la distribucion de flujos en mutantes geneticos
Page 61
MOMA mimimalizacion
de ajustes metabolicos
(FBA Analisis de
Balance de flujos)
ECF Enzyme Control
Flux
Guillermo R. Castro

Flow chart of GMF
Gene expression (enzyme activity) profile
Metabolic networks /genetic modification
Metabolic flux distribution
Metabolic flux distribution for genetic mutants
mCEF
ECF
Page 62 Guillermo R. Castro
Control effective fluxes (CEFs)
mCEF modified Control Effective
Flux

Expected advantage of GMF
• Available to gene knockout,
over-expressing or under-expressing mutants
• MOMA/rFBA are available only for gene deletion, because they use Boolean Logic.
Page 63 Guillermo R. Castro

Control Effective Flux (CEF)
Transcript ratio for the growth on glycerol versus glucose
Stelling J, et al, Nature, 2002, 420, 190-193
( 2)( 1, 2)
( 1)
i
i
i
cef ss s
cef s
Transcript ratio of metabolic genes
CEFs for different substrates glucose, glycerol and acetate.
64 Guillermo R. Castro

GMF = mCEF+ECF
m mv = P
( )( , )
( )
ii
i
mCEF mw m
mCEF w
S (Stoichiometric matrix)
w wv = P
P (EMs matrix) mCEF
ECF
mCEF
WT
Mutant
w
iλ λ1
nm
i p
p
Experimental data Page 65 Guillermo R. Castro

mCEF is an extension of CEF (control efectivo de flujo)
(if reaction is modified)
1 (if reaction is not modified)
i
i
EAP i
i
, ,
max
,
( )1
( )
j CELLOBJ i j
j
i
CELLOBJ j CELLOBJ
j
p
mCEF wp
( )( , )
( )
ii
i
mCEF mutw mut
mCEF w
,
,
,
CELLOBJ j jm
j CELLOBJ
i j i
i
p EA
p
, ,
max
,
1( )
m
j CELLOBJ i j i
j
i m
CELLOBJ j CELLOBJ
j
p
mCEF mutp
available for Genetically modification mutants:
Up-regulation Down-regulation Deletion
Page 66 Guillermo R. Castro
En rojo: parametro que incorpora el cambio en cada modifcacion de las reacciones. En azul: el costo que requiere para modificar el gen Y es usado para contrapesar los cambios de EM
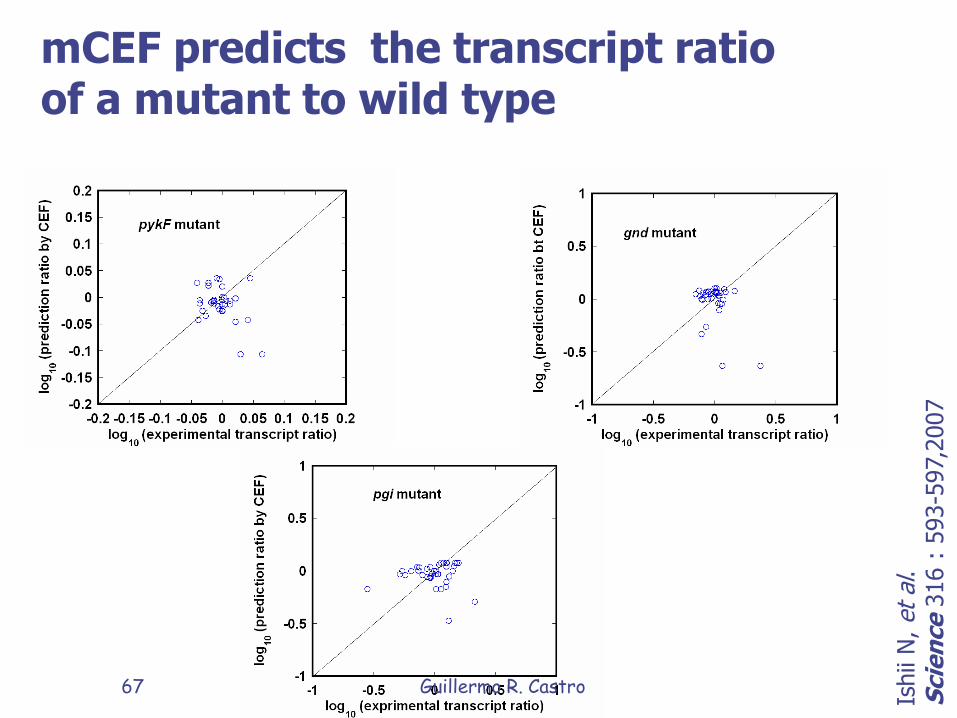
Ishii
N, et
al.
Scie
nce 3
16 :
593-5
97,
2007
mCEF predicts the transcript ratio of a mutant to wild type
67 Guillermo R. Castro

Comparison of GMF(CEF+ECF) with FBA and MOMA for E. coli gene deletion mutants
Characterization of GMF
Page 68 Guillermo R. Castro

• FBA (flux balance analysis)
• MOMA (Minimization Of Metabolic Adjustment )
,min ,max
0
0
[ , ] 1,...,
biomass
k
i i i
Maximize v
subject to S v
v
v v v i n
2
1
,min ,max
( )
0
0
[ , ] 1,...,
N
i i
i
k
i i i
Minimize w x
subject to S v
v
v v v i n
Vk is the flux of gene knockout reaction k
Vk is the flux of gene knockout reaction k
69 Guillermo R. Castro

Prediction of the flux distribution of an E. coli zwf mutant by GMF, FBA, and MOMA
Zhao J
, Baba T
, M
ori H
, Shim
izu K
. A
pp
l M
icro
bio
l B
iote
ch
no
l. 2
004;6
4(1
):91-8
.
Page 70 Guillermo R. Castro
zwf gene, glucose-
6-phosphate
dehydrogenase

Prediction of the flux distribution of an E. coli gnd mutant by CEF+ECF, FBA, and MOMA
Zhao J
, Baba T
, M
ori H
, Shim
izu K
. A
pp
l M
icro
bio
l B
iote
ch
no
l. 2
004;6
4(1
):91-8
.
Page 71 Guillermo R. Castro
gnd, gluconato P-DH
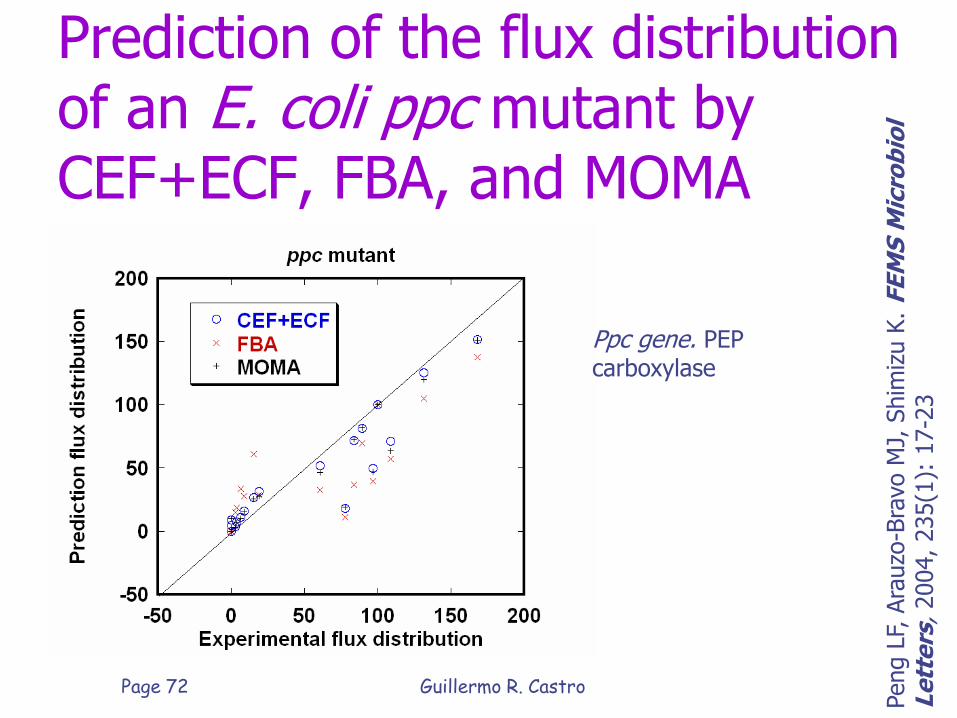
Prediction of the flux distribution of an E. coli ppc mutant by CEF+ECF, FBA, and MOMA
Peng L
F, A
rauzo
-Bra
vo M
J, S
him
izu K
. FE
MS
Mic
rob
iol
Le
tte
rs,
2004, 235(1
): 1
7-2
3
Page 72 Guillermo R. Castro
Ppc gene. PEP carboxylase

Prediction of the flux distribution of an E. coli pykF mutant by CEF+ECF, FBA, and MOMA
Sid
diq
uee K
A, Ara
uzo
-Bra
vo M
J, S
him
izu K
.
Ap
pl
Mic
rob
iol
Bio
tech
ol 2004, 63(4
):407-4
17
Page 73 Guillermo R. Castro
pykF, Piruvate Kinase

Prediction of the flux distribution of an E. coli pgi mutant by CEF+ECF, FBA, and MOMA
Hua Q
, Yang C
, Baba T
, M
ori H
, Shim
izu K
. J
B
acte
rio
l 2003,
185(2
4):
7053-7
067
Page 74 Guillermo R. Castro
pgi, Phosphoglucose isomerase

Prediction errors of FBA, MOMA and GMF for five mutants of E. coli
Method zwf gnd pgi ppc pykF
FBA 18.38 14.76 23.68 29.92 21.10
MOMA 18.06 14.27 29.38 19.79 25.83
GMF 6.43 9.21 18.47 18.95 20.46
Model Error = Difference in the flux distributions between WT & a mutant
75 Guillermo R. Castro

Is GMF applicable to over-expressing or less-expressing mutants?
(FBA and MOMA are not applicable to these mutants.)
Page 76 Guillermo R. Castro

Summary of GMF
• mCEF is combined to ECF for the accurate prediction of flux distribution of mutants.
• GMF is applied to the mutants where an enzyme is over-expressed, less-expressed. It has an advantage over rFBA and MOMA.
Page 77 Guillermo R. Castro

Up/down-regulation mutants FBP over-expressing mutant of C. glutamicum G6P dehydrogenase over-expressing mutant of C. glutamicum gnd deficient mutant of C. glutamicum G6P dehydrogenase over-expressing mutant of E. coli
78 Guillermo R. Castro

Conclusiones
• ECF is available for the quantitative correlation between an enzyme activity profile and its associated flux distribution
• GMF is a new tool for predicting a flux distribution for genetically modified mutants.
Page 79 Guillermo R. Castro

Guillermo R. Castro Page 80

Guillermo R. Castro 81