Embed Size (px)
Citation preview
Cartographic Visualization
Jennifer Tillett
November 10, 2004
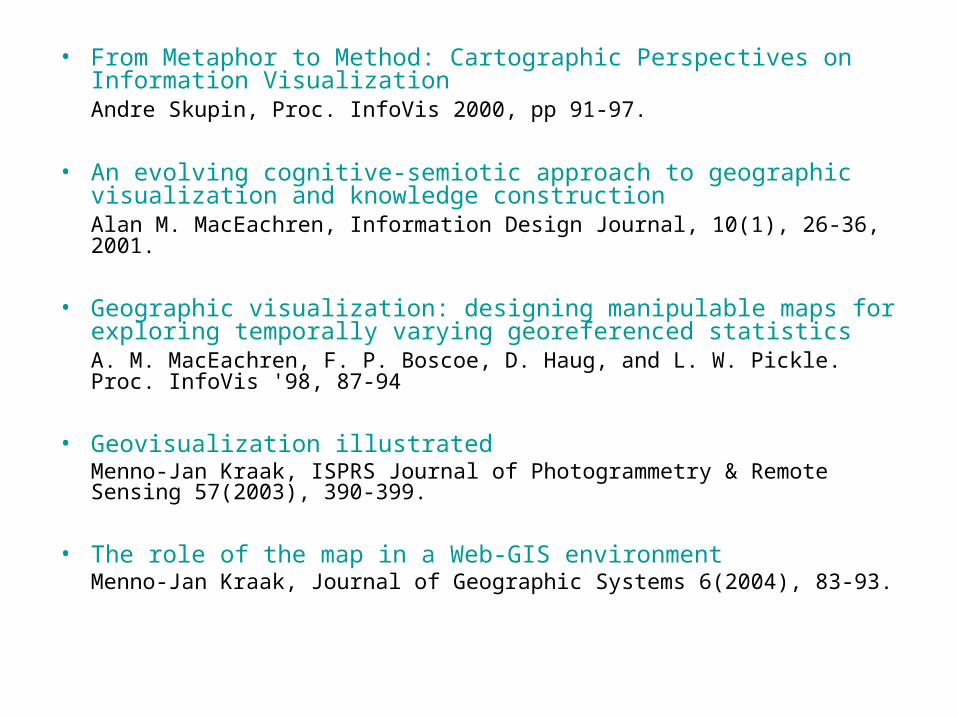
• From Metaphor to Method: Cartographic Perspectives on Information Visualization Andre Skupin, Proc. InfoVis 2000, pp 91-97.
• An evolving cognitive-semiotic approach to geographic visualization and knowledge construction Alan M. MacEachren, Information Design Journal, 10(1), 26-36, 2001.
• Geographic visualization: designing manipulable maps for exploring temporally varying georeferenced statisticsA. M. MacEachren, F. P. Boscoe, D. Haug, and L. W. Pickle. Proc. InfoVis '98, 87-94
• Geovisualization illustratedMenno-Jan Kraak, ISPRS Journal of Photogrammetry & Remote Sensing 57(2003), 390-399.
• The role of the map in a Web-GIS environment Menno-Jan Kraak, Journal of Geographic Systems 6(2004), 83-93.
From Metaphor to Method: Cartographic
Perspectives on Information Visualization
• InfoVis often uses map/spatial metaphors for exploring non-geographic information. How can we use existing cartographic methods to improve upon our methods?– graphic complexity / generalizations– feature labeling– map projections– map design
Scale
• First Law of Geography
• Representations of:– structure– content
Generalization
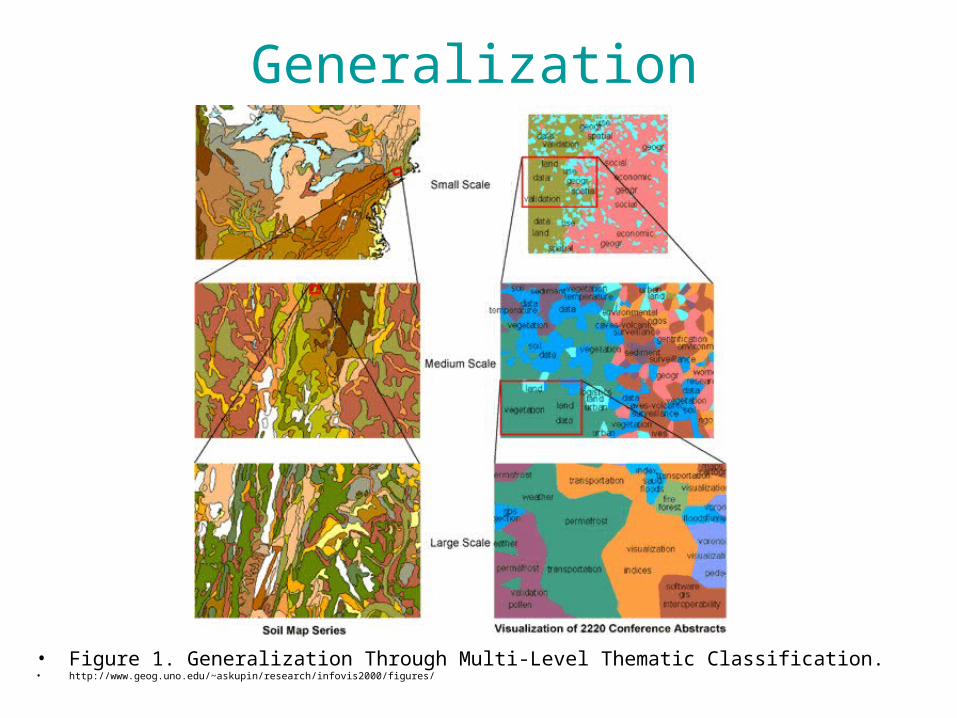
• Figure 1. Generalization Through Multi-Level Thematic Classification.• http://www.geog.uno.edu/~askupin/research/infovis2000/figures/
Feature Labeling
• graphic complexity
• choice of label positions
• choice of label terms
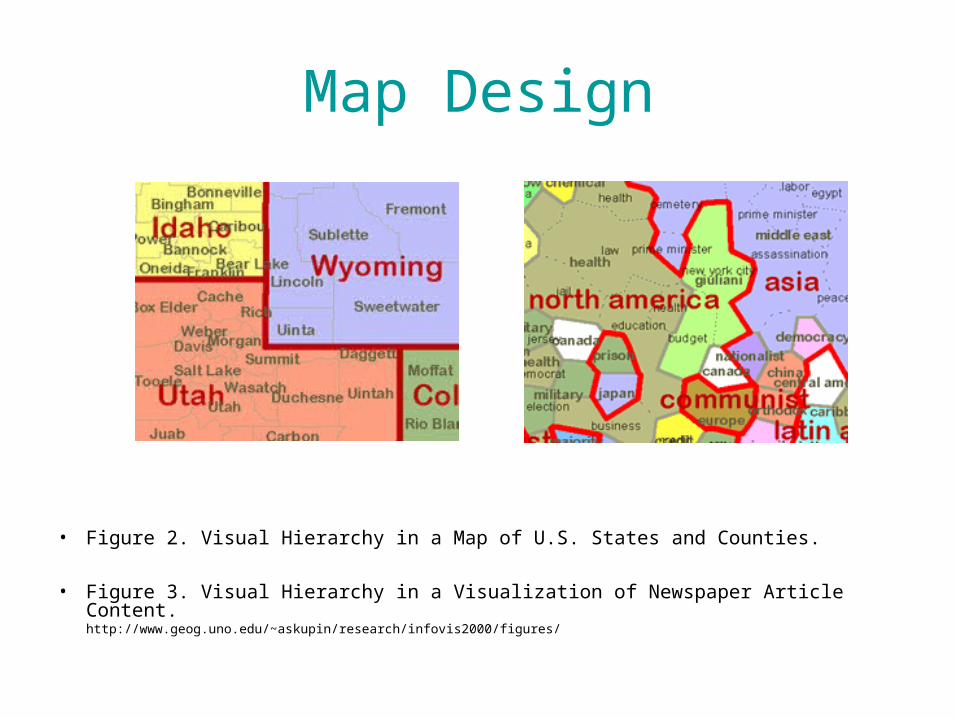
Map Design
• Figure 2. Visual Hierarchy in a Map of U.S. States and Counties.
• Figure 3. Visual Hierarchy in a Visualization of Newspaper Article Content.http://www.geog.uno.edu/~askupin/research/infovis2000/figures/
Map Projection
• Distortion
-- MDS
-- SOM
Critique
+ Useful overview
+ Good contributions to InfoVis
- Reaching, at times. Some of his contributions have already been acknowledged in InfoVis
- Severe lack of details in places, with a "paper-pointer" inserted instead
An evolving cognitive-semiotic approach to geographic visualization and knowledge
construction
• Discusses how current work in geographic visualization has extended and critiqued Bertin's work, expecially "graphic variables."
• Also outlines 3 specific geovisualization
challenges for the next decade.
"Graphic Variables"
• location
• size
• value
• texture/grain
• color
• orientation
• shape
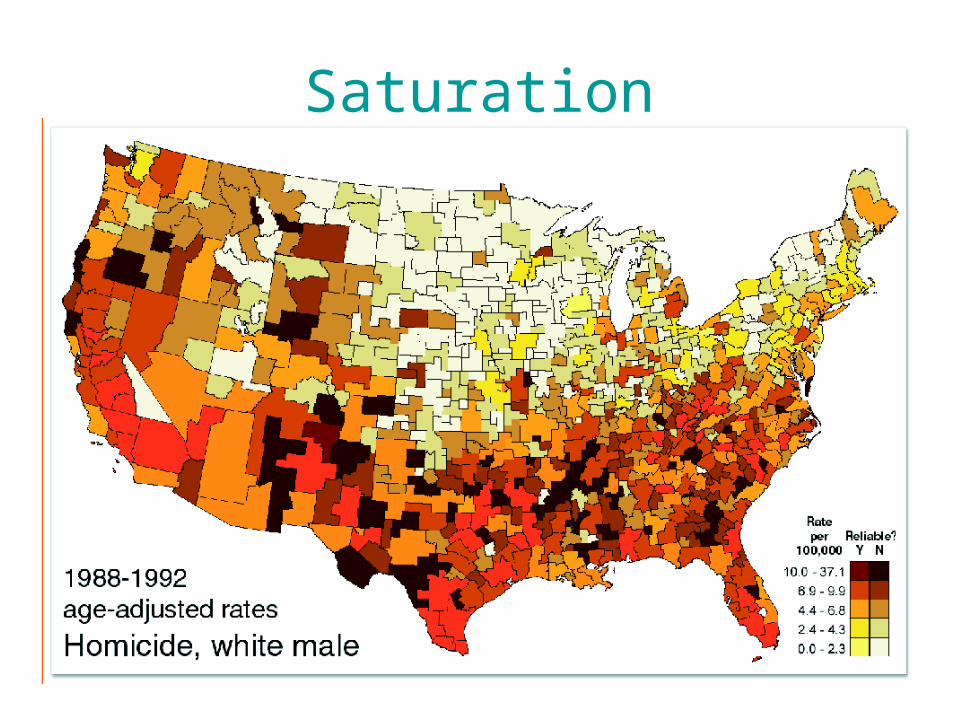
Saturation
Tactile Variables
• location• size• value• texture/grain• color ===>elevation• orientation• shape• Resistance, friction, kinesthetic location?
Dynamic & Sonic Variables
• Size loudness, duration• Value pitch & register• Shape timbre • Location position (in time) • Texture order• Rate of change & attack/decay• Frequency• synchronization
Graphic Info Processing => Geovisualization
Geovis uses visual geospatial displays to:
– Explore data– Generate hypotheses– Develop problem solutions– Construct knowledge
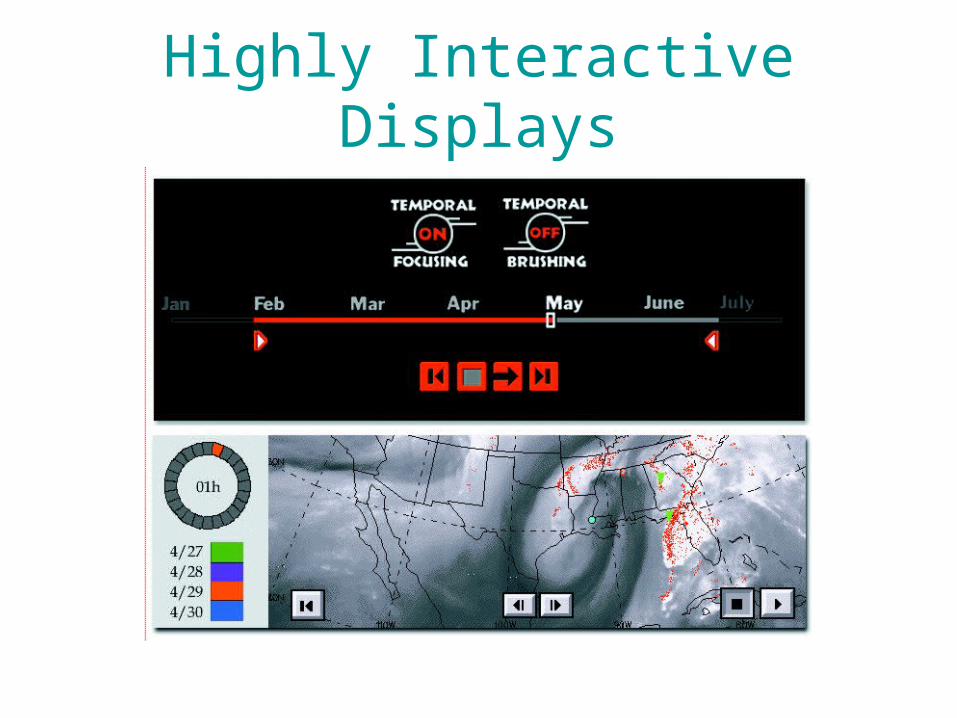
Highly Interactive Displays
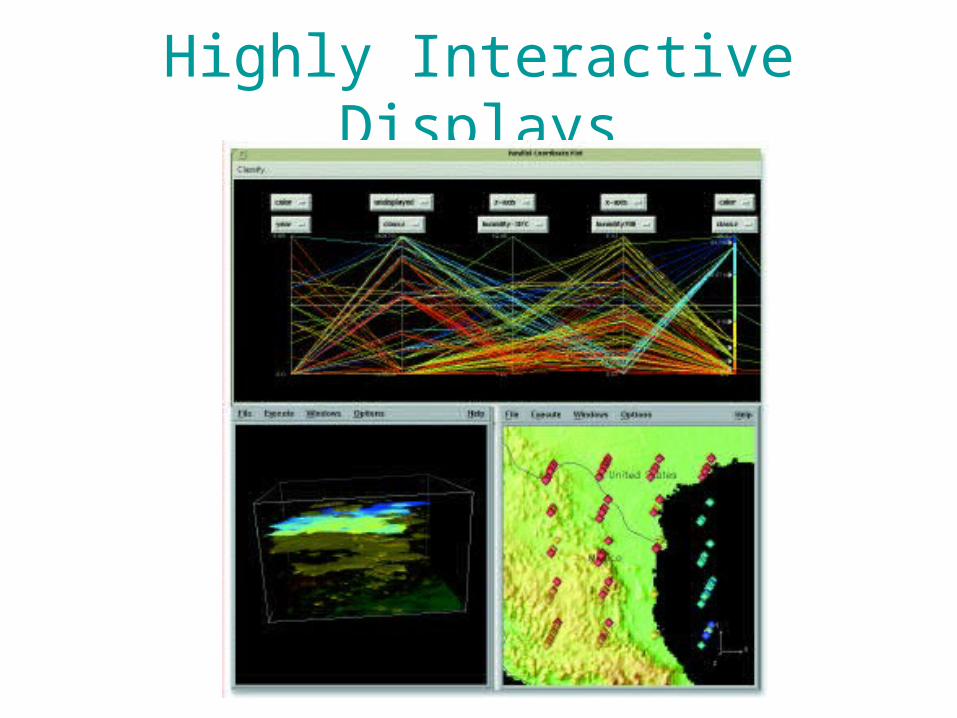
Highly Interactive Displays
GeoVis Challenges For Next Decade
• Developing a typology of operations for georepresentations and a syntactics for their use
• Balancing abstraction and realism in GeoVirtual environments
• Facilitating different-place collaboration
Critique
+ Nice commentary on Bertin
+ Extensions useful and shed more light on rare Bertin book
- Quite self-referential, without explanations
- Points reader to systems that use principles, but doesn't discuss
Geographic visualization: designing manipulable maps for exploring
temporally varying georeferenced statistics
Research was aimed to understand the cognitive aspects of map use in the context of health data analysis, and develop visual analysis tools that integrate principles from cartography, GIS and EDA.
Geographic Visualization
• Construct knowledge– Using maps and other representation forms
• Dynamically link the visual map display with
– underlying geographic data structures and– the system users (resulting in maps that
change in response to changes in data and/or to actions on the part of users)
Related Work
• Map Animation
• Multivariate Representation
• Interactivity
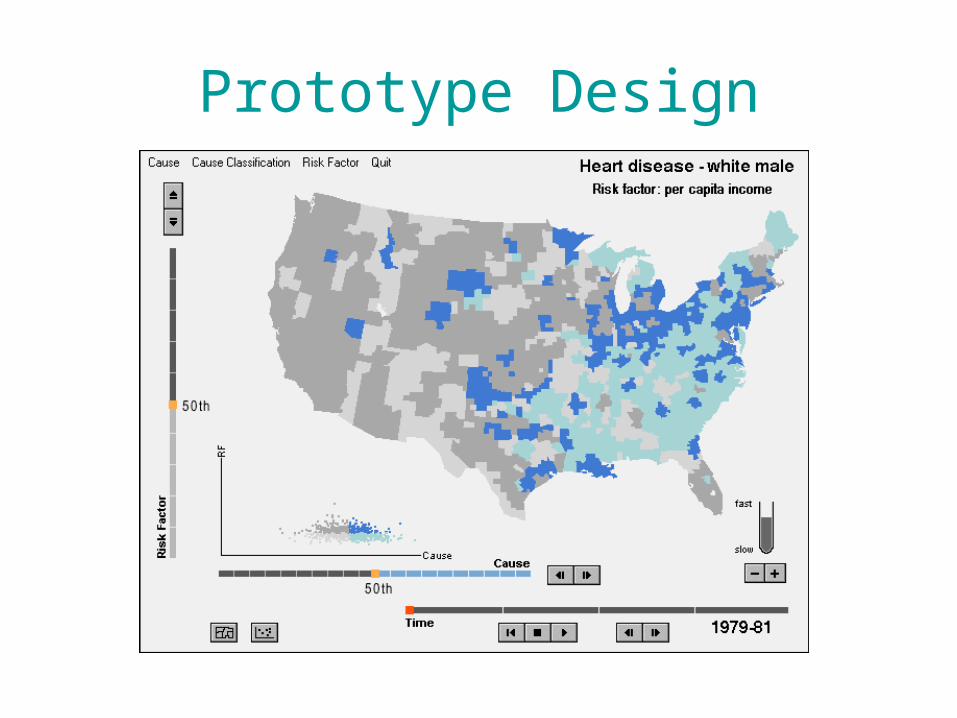
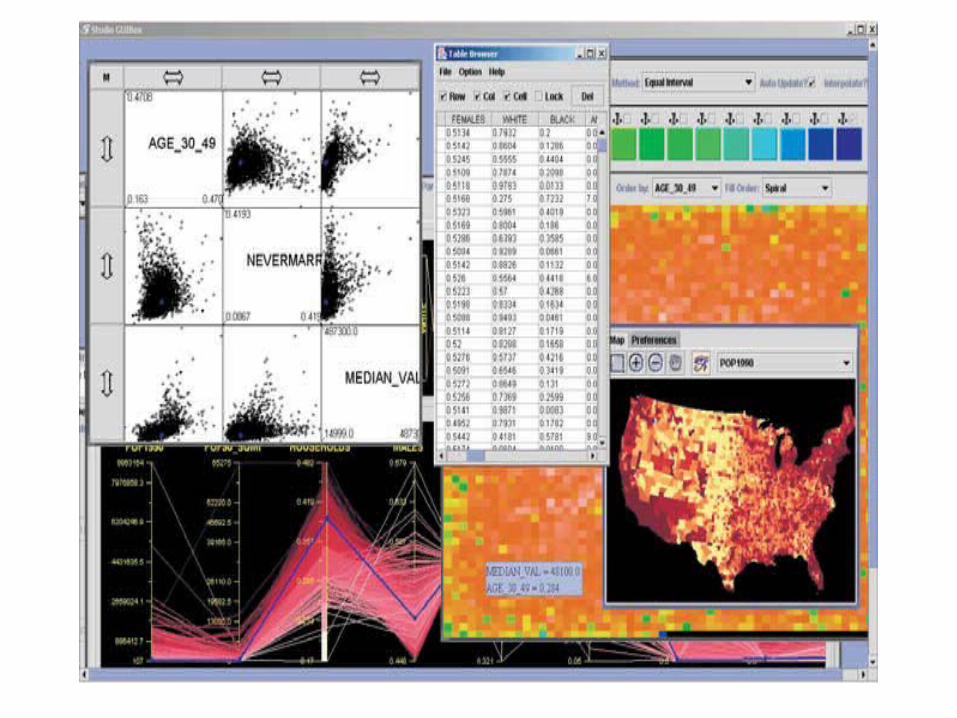
Prototype Design
Goal: Enhance ability of health/statistics specialists to recognize (and draw inferences about) mortality rate patterns, risk factor patterns, relations between risk factors and mortality, and change in both mortality and risk factors (and their relations) over time.
- spatial pattern analysis
- spatiotemporal analysis
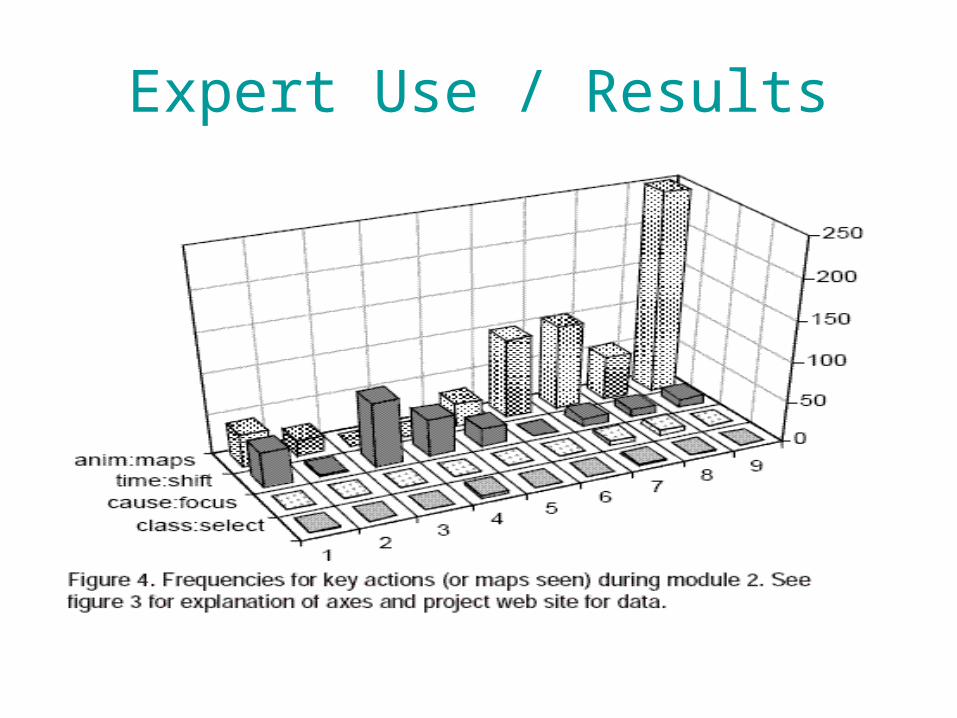
Expert Use / Results
Critique
+ lots of different tasks
+ appropriate conclusions
- vis for examining results a little confusing
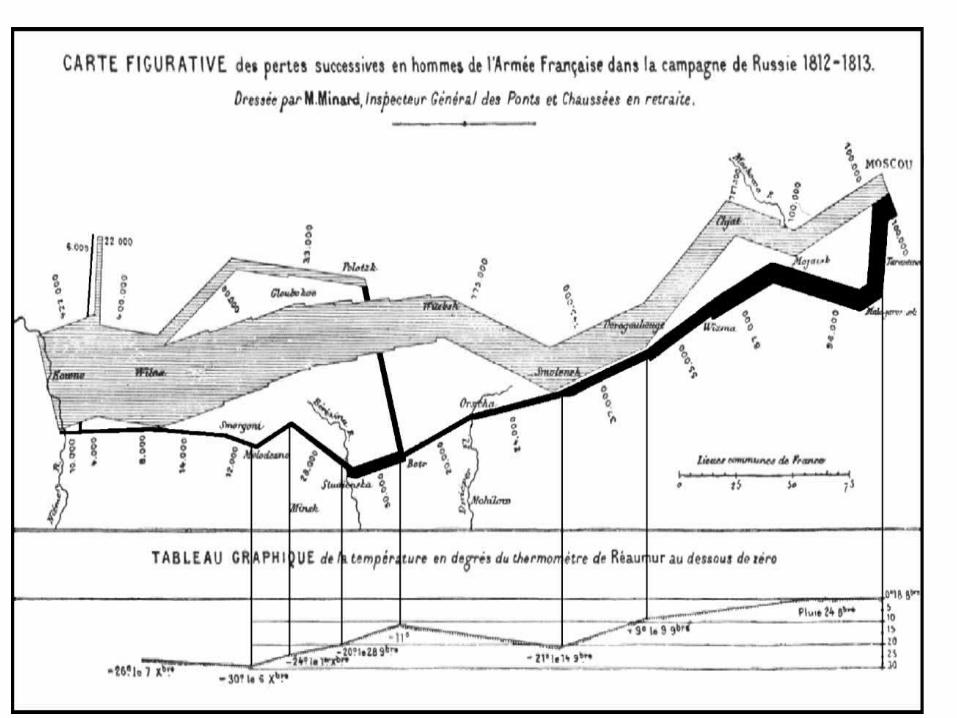
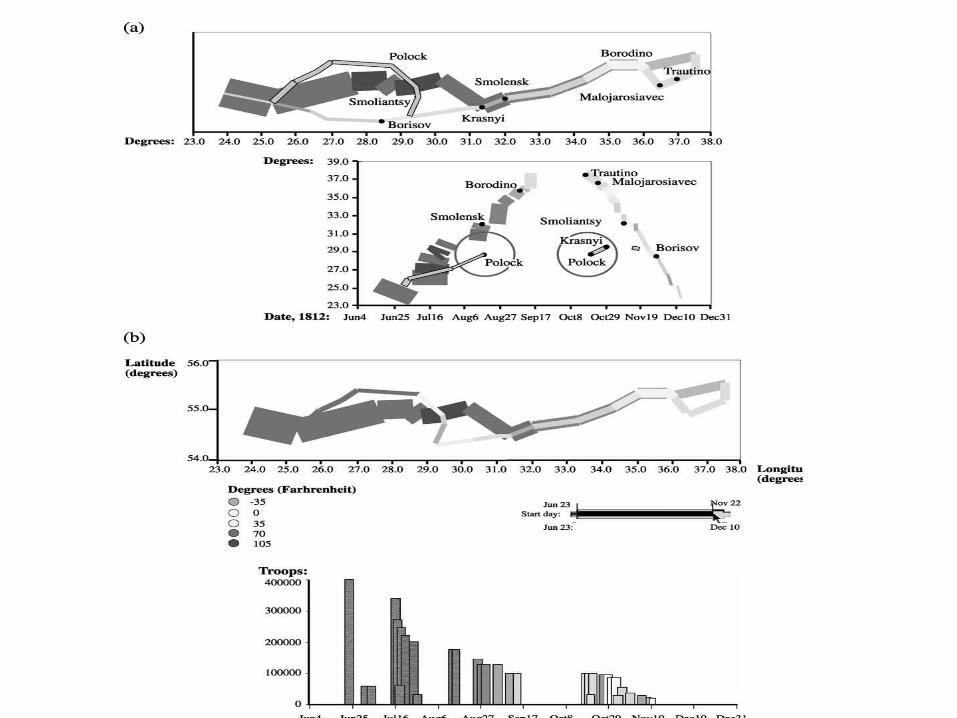
Geovisualization illustrated
• Demonstrates usefulness of geovis and
• How alternative graphic representations can stimulate the visual thought process.
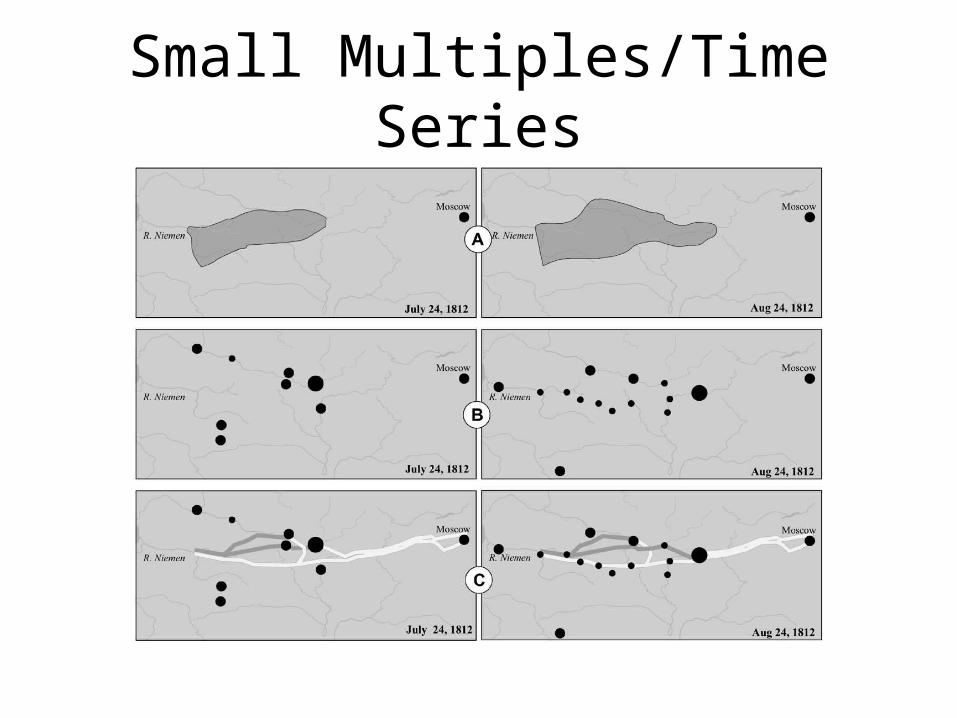
Small Multiples/Time Series
Animation
• Better able to represent time
• See web site www.itc.nl/personal/kraak/1812
Other Views
• See web site for:– 3D view– Space-time cube
Critique
+ Nice array of techniques presented
-Too little discussion of techniques’ advantages/disadvantages
-Makes same assertions as MacEachren without evidence
The role of the map in a Web-GIS environment
• Defines the function of the map in WebGIS– Traditional– Search engine– Index– Interface to other geographic and non-
geographic info on the Web
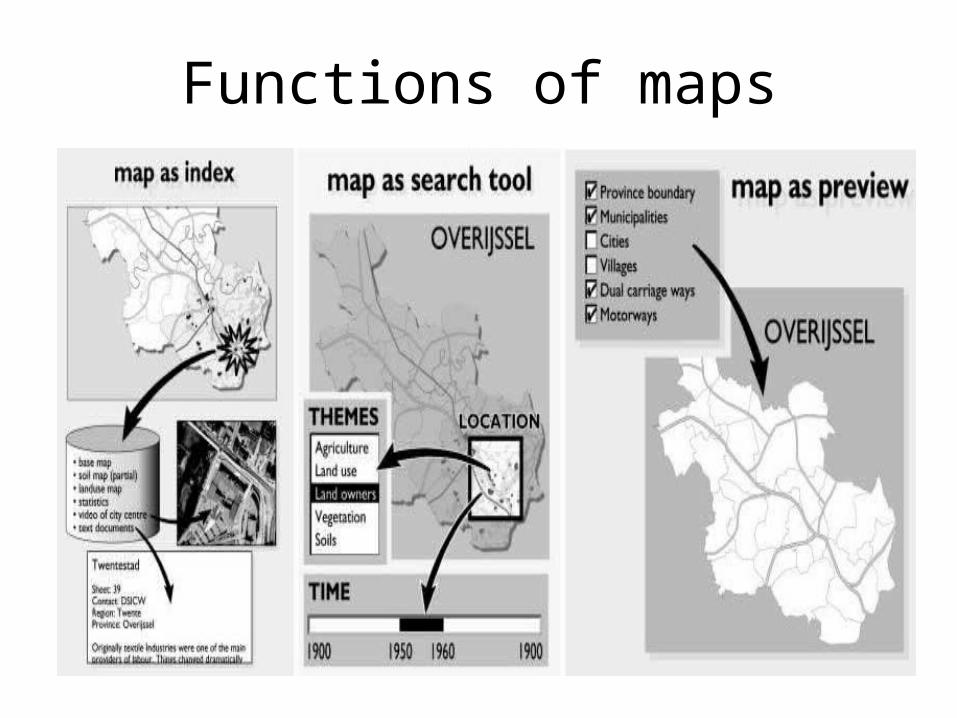
Functions of maps
Critique
+ Survey points out really cool things
- Surveys without saying much
- Plagiarizes himself from last paper (for no good reason)