Embed Size (px)
Citation preview

377
C A S E 3 0China’s Home Improvement Market: Should Home Depot Enter or Will it Have a Late-Mover (Dis)advantage?
Markus Kreutzer, Christoph Lechner
University of St. Gallen
IntroductionIn 2008, the UK-based international food and general merchandising retailer Tesco reached a market share of about 30 percent in the United Kingdom, roughly the same as its rivals Sainsbury’s and ASDA combined. In recent years, Tesco has greatly diversified, extending its business lines from food into non-food, clothing, finan-cial services, and telecommunications. It ranks sixth in the international retail market behindWal-Mart (United States), Carrefour (France), Home Depot (United States), Metro (Germany), and Royal Ahold (Netherlands).1
Tesco was not always the dominant player it is today. In 1990, it was a mid-sized food chain far behind its rival, Sainsbury’s. Starting in the 1990s, it pursued a broad set of growth initiatives, steadily increasing its market share and gaining importance. In 1995, Tesco surpassed Sainsbury’s to become the U.K. market leader. Today, Tesco is the clear market leader. How did that happen? Why was Tesco so successful in growing sales and prof-its, while Sainsbury’s could not keep pace? Where did the competitive actions of these firms differ? Let us start with a close look at their origins.
Sainsbury’s, Tesco, and the U.K. Retail Market in 1990Sainsbury’s was established in 1869 by John James and Mary Ann Sainsbury, making it the oldest food retailing chain in Britain. In 1922, J Sainsbury became a private company, with J Sainsbury plc acting as parent company of Sainsbury’s Supermarkets Ltd, commonly known as Sainsbury’s, a chain of supermarkets in the United Kingdom. In 1973, the company was floated as J Sainsbury plc in what was at the time the largest flotation on the London Stock Exchange. The family currently
retains about 14 percent of its shares. The group is also engaged in property and banking, owning real estate worth about £8.6 billion. For much of the twentieth century, Sainsbury’s was the market leader in the U.K. supermarket sector, but in 1995 it lost its place to Tesco; in 2003, it was pushed to third place by ASDA.
Tesco was founded by Jack Cohen in London’s East End. From a modest background, Cohen began selling groceries in Well Street market, Hackney, in 1919. In the aftermath of World War I, food supplies were low, so he bought damaged goods from other stores and re-sold them at reasonable prices. The Tesco brand first appeared in 1924. The name originated after Cohen bought a shipment of tea from TE Stockwell. He made new labels using the first three letters of the supplier’s name and the first two letters of his surname. The first Tesco store opened in 1929 in Burnt Oak, Edgware, Middlesex. Tesco was floated on the London Stock Exchange in 1947 as Tesco Stores (Holdings) Ltd. During the 1950s and 1960s, Tesco grew slowly, until it owned more than 800 stores. The company purchased 70 Williamsons stores (1957), 200 Harrow Stores outlets (1959), 212 Irwins stores (1960), 97 Charles Phillips stores (1964), and the Victor Value chain (1968) (sold to Bejam in 1986). In 1973, Jack Cohen resigned and was replaced as chairman by his son-in-law, Leslie Porter. Porter and managing director Ian MacLaurin abandoned the “pile it high and sell it cheap” philosophy of Cohen, which had left the company stagnating with a bad image. In 1977, Tesco launched “Operation Checkout,” which included price reductions and centralized purchasing for all its stores. As a result, its market share rose by 4 percent within two months.
At the beginning of the 1990s, the U.K. retail market slowly became more competitive. Three players dominated the food market: ASDA2 (which
C A S E 2 7Tesco versus Sainsbury’s: Growth Strategies and Corporate Competitiveness
377
The case was written by Markus Kreutzer and Professor Dr. Christoph Lechner, University of St. Gallen. It is intended to be used as the basis for class discussion rather than to illustrate either effective or ineffective handling of a management situation. The case was compiled from published sources. © 2008, University of St. Gallen. No part of this publication may be copied, stored, transmitted, reproduced or distributed in any form or medium whatsoever without the permission of the copyright owner.
CHE-HITT-09-0102-Case-027.indd 377CHE-HITT-09-0102-Case-027.indd 377 11/14/09 2:48:38 AM11/14/09 2:48:38 AM
378C
ase
27: T
esco
ver
sus
Sain
sbur
y’s became Wal-Mart’s largest overseas subsidiary in
1999), Sainsbury’s, and Tesco. ASDA positioned itself as the price leader and held this position for some time, closely followed by Tesco. Sainsbury’s targeted the upper price segment, positioning itself between mass market and high end.
In the mid-1990s, competition intensified as a price war among these players emerged, resulting in squeezed margins and cost cutting. It is not surprising that this also had an adverse impact on the service level these cor-porations provided.
In general, prices of standard brands and private labels at both Sainsbury’s and Tesco came closer, while the two firms differed slightly in their discounting policies. Tesco emphasized its low-price private label (“Value”) and continued to cut prices, while Sainsbury’s empha-sized price reductions on the standard private labels. The price cuts were prompted by the increased price pressure from the market entry of discounters. For example, Aldi entered the market in 1990, followed by Lidl in 1994. In 2005, these two hard discounters had acquired a market share of 2.2 percent and 1.9 percent, respectively.
Store FormatsIn 1975, Sainsbury’s launched the “Sainsbury’s SavaCentre” hypermarket format as a joint venture with British Home Stores. This was the first attempt in the United Kingdom to launch supermarkets with a large non-food range. SavaCentre became a wholly owned Sainsbury’s subsidiary in 1989. As the hypermarket for-mat became mainstream, with rivals such as ASDA and Tesco launching ever-larger stores, Sainsbury’s decided that a separate brand was no longer needed. Over the following years, these stores were converted to the regu-lar Sainsbury’s superstore format and, subsequently, Sainsbury’s retreated from hypermarkets and changed its store formats. Now, Sainsbury’s operates three formats: regular Sainsbury’s stores, Sainsbury’s local stores (con-venience stores), and Sainsbury’s central stores (smaller supermarkets in urban locations). For an overview of Sainsbury’s U.K. store portfolio at the end of fiscal year 2005–06, see Exhibit 1.
While Sainsbury’s retreated from hypermarkets, Tesco expanded Tesco Extra and strengthened its hypermarket formats.3 Its overarching store strategy is reflected in its core marketing slogan adopted when Terry Leahy became CEO in 1997. “The Tesco Way” implies a shift from a focus on the corporation to a focus on people, both employees and customers. Tesco stores are divided into five formats, differentiated by size and range of products, and are customized to specific segments: Tesco Extra, Tesco Superstores, Tesco Metro, Tesco Express, and One Stop (see Exhibit 2). The approximately 500 One Stop stores are the smallest units. They stay open in the late evening and feature a differentiated pricing and offer system. Tesco Extra, launched in 1997, is the largest format, consisting mainly of out-of-town hypermarkets that stock Tesco’s entire product range and offer free parking. Their number has increased about 20 percent annually, mainly by conversions of other formats. Tesco Superstores are the standard large grocery supermarkets, with a much smaller range of non-food goods than Extra. They are referred to as “superstores” for convenience, but not as part of the name. It is the standard Tesco format. Most are located in suburbs of cities or on the edges of large- and medium-sized towns. Tesco Metro stores are sized between normal Tesco stores and Tesco Express stores. They are mostly located in city centers and on the high streets of small towns. The first Tesco Metro was opened in Covent Garden, London, in 1992. Tesco Express stores are neighborhood convenience stores, stocking mainly food, with an emphasis on high-margin products alongside everyday essentials. They are found in busy city center districts, in small shopping precincts in residential areas, and in petrol station forecourts. As CEO Terry Leahy remarked in the company’s 2000 annual report:This obsession with our customers, their needs, and how these must be changing, means that you should not expect us to go on opening large edge-of-town superstores long after the need for new ones has passed. Expect . . . con-tinual evolution: expect us to provide a mix of formats in different locations . . . to meet special needs of customers in each location.
Exhibit 1 Sainsbury’s Store Portfolio in the United Kingdom (at the end of 2006)
Format Number Area (ft²) Area (m²) Percentage of Space
Supermarkets 455 15,916,000 1,467,000 95.1%
Convenience stores 297 821,000 76,000 4.9%
Total 752 16,737,000 1,543,000 100%
CHE-HITT-09-0102-Case-027.indd 378CHE-HITT-09-0102-Case-027.indd 378 11/14/09 2:48:40 AM11/14/09 2:48:40 AM

Case 27: Tesco
versus Sainsbury’s
379
Much of Tesco’s sales increases occurred through increases in total square footage with the opening of new stores, including new formats such as Metro and Express. From 1994 to 1996, selling areas increased by 22 percent for Tesco and 10 percent for Sainsbury’s. At the same time, Tesco managed to increase sales per square foot by 14 percent, while Sainsbury’s gained only 3 percent. In addition, acquisitions and alliances complemented the organic growth strategy. Tesco, for example, purchased Adminstore in 2004, owner of 45 Cullens, Europa, and Harts convenience stores in and around London. In late 2005, it purchased the 21 remaining Safeway/BP stores after Morrison’s dissolved the Safeway/BP partnership. In 1997, Tesco formed an alliance with Esso Petroleum Company Ltd (now part of ExxonMobil Corp.). The agreement included several petrol filling stations on lease from Esso, where Tesco would operate the store under the Express format. In turn, Esso would oper-ate the forecourts and sell their fuel via the Tesco store. Ten years later, over 600 Tesco/Esso stores can be found across the United Kingdom.
Sainsbury’s also expanded by acquisition. As part of the acquisition of Safeway Group by Morrison’s, Morrison’s was to dispose of 53 of the combined group’s stores. In May 2004, Sainsbury’s announced that it would acquire 14 of these stores, 13 Safeway stores, and one Morrison’s outlet, all located primarily in the Midlands and the north of England. The first of these new stores opened in August 2004. In 2004, Sainsbury’s also expanded its share of the convenience store mar-ket through other acquisitions. Bell’s Stores, a 54-store chain based in northeast England, was acquired in February 2004. Jackson’s Stores, a chain of 114 stores based in Yorkshire and the North Midlands, was pur-chased in August 2004. JB Beaumont, a chain of six stores in the East Midlands, was acquired in November
2004. SL Shaw Ltd, which owned six stores, was acquired in April 2005 for £6 million. On September 29, 2004, Sainsbury’s established Sainsbury’s Convenience Stores Ltd to manage its Sainsbury’s local stores and the Bell’s and Jackson’s chains. The latter two are to be rebranded as Sainsbury’s local stores by 2009.
Service Offerings and Distribution Systems“An inclusive offer” is how Tesco describes its aspi-ration to appeal to upper-, medium-, and low-income customers in the same stores. According to Citigroup retail analyst David McCarthy, “They’ve pulled off a trick that I’m not aware of any other retailer achiev-ing. That is, to appeal to all segments of the market.” One plank of this program has been Tesco’s use of its private label products, including the upmarket “Finest” and low price “Value.” Other examples include organic, kids, British specialty food, and “free from” brands. As Edward Garner, the communications director of the TNS Superpanel, remarks: “Tesco’s winning formula is largely due to its ability to be all things to all people. According to TNS, over 60 percent of British house-holds shop in Tesco every four weeks. That’s 20 percent more than its nearest rival. The store appeals to wide- reaching demographics across the country and has built up a heritage of reliability and trustworthiness, which keeps shoppers returning to its stores. These fac-tors have enabled Tesco to gain close to a third of the British grocery market.”
Sainsbury’s has also invested in private labels. A large Sainsbury’s store typically stocks around 50,000 lines, of which about half are private labels. These lines include, for example, “Basics” (an economy range similar to
Exhibit 2 Tesco’s Store Portfolio in the United Kingdom (at the end of 2007)
Format Number Total Area (m²) Total Area (sq ft) Mean Area (m²) Mean Area (sq ft) Percentage of Space
Tesco Extra 147 952,441 10,252,000 6,479 69,741 36.89%
Tesco 433 1,227,434 13,212,000 2,834 30,512 47.55%
Tesco Metro 162 177,073 1,906,000 1,093 11,765 6.85%
Tesco Express 735 145,114 1,562,000 197 2,125 5.62%
One Stop 506 62,988 678,000 124 1,339 2.44%
Tesco Homeplus 5 16,258 175,000 3,251 35,000 0.62%
Total 1,988 2,581,310 27,785,000 1,298 13,976 100%
CHE-HITT-09-0102-Case-027.indd 379CHE-HITT-09-0102-Case-027.indd 379 11/14/09 2:48:40 AM11/14/09 2:48:40 AM

380C
ase
27: T
esco
ver
sus
Sain
sbur
y’s Tesco’s “Values”), “Taste the Difference” (a premium
range similar to Tesco’s “Finest”), “Different by Design” (a smaller range of premium non-food lines), “Kids,” “Be Good to Yourself” (products with reduced calorific and/or fat content), “Free from,” “Sainsbury Organic,” “Fair Trade,” and “Super Naturals™” (a range of ready-made meals with healthy ingredients).
While service offerings today are quite similar, the rivals’ distribution strategies differ significantly. In com-mon with most other large retailers, Tesco decided to draw goods from suppliers into regional distribution centers for preparation and delivery to stores. Tesco is extending this logistic practice to cover collection from suppliers (factory gate pricing) and input to suppliers in a drive to reduce costs and improve reliability.
In contrast, Sainsbury’s has heavily invested in fully automated depots. On January 14, 2000, Sir Peter Davis was appointed Sainsbury’s CEO. This decision was well received by investors and analysts, as in his first two years he raised profits above targets. By 2004, however, the group had suffered a decline in performance rela-tive to its competitors and fell to third in the U.K. food market. Davis oversaw an almost £3 billion upgrade of stores, distribution, and IT equipment. Part of this investment included the construction of four fully auto-mated depots, which, at £100 million each, cost four times more than standard depots.
Loyalty ProgramsRetailers try to gain the loyalty of their customers in various ways. Tesco was the first to launch a Clubcard system. It was introduced in 1995 and has become the most popular card in the United Kingdom, with around 13 million active Clubcard holders. Customers collect one Clubcard point for every £1 (€1 in Ireland) they spend in a Tesco store, Tesco Petrol, or at Tesco.com. Customers also collect points by paying with a Tesco credit card or by using Tesco Mobile, Tesco Homephone, Tesco Broadband, selected Tesco Personal Finance products, or by using its Clubcard partners, Powergen or Avis. Each point is worth 1p in-store when redeemed or 4p when used with Clubcard deals (offers for holidays, day trips, etc.). Every three months, holders receive a Clubcard statement offering discount coupons that can be spent in-store, online (if opted into eVouchers), or on various Clubcard deals. The program has numerous partners (e.g., hundreds of British pubs), but the Clubcard belongs to Tesco alone. Tesco implemented the Clubcard rewards program to gather customer information, which is then used to cater to specific potential customer needs and wants. When shoppers sign up for the card, they automatically submit their ages, genders, and incomes.
Tesco segments their shoppers on the basis of these factors. As soon as the shopper uses the card online or in-store, product information is automatically uploaded into the Tesco database. Product information is used to cross-sell additional products and services, such as food delivery.
Tesco is the most customer-focused business that I have ever worked for. They are absolutely obsessed with the customer.
—John Hoerner, Non-Food Director, Tesco
Sainsbury’s was “wrong-footed” in its original reac-tion to the Tesco Clubcard, showing “no immediate response apart from disdain.”4 It lost market share in subsequent years. In 2004, the London Times quoted a former executive and others who viewed this event as the start of the company’s downturn due to management failures by David Sainsbury and his successors, Dino Adriano and Peter Davis. David Sainsbury, who in 1992 replaced his cousin, the long-time CEO John Sainsbury, first dismissed Tesco’s Clubcard. After long internal debates, Sainsbury introduced the Sainsbury’s reward card in 1996. A multiparty card program, “Nectar,” was launched in the autumn of 2002. Nectar gives the cus-tomer a versatile and powerful point-gathering system to be used and redeemed at a variety of stores. In Nectar, Sainsbury’s has strong partners such as Barclaycard, British Petroleum, and the department store chain Debenhams. The Nectar card was re-launched in sum-mer 2007 to celebrate its fifth anniversary. The scheme was changed from a reward- to a treats-based program. In its early days, the Nectar scheme was criticized as being among the worst card schemes offered. At the time, it was said that some consumers who spent £5,000 on Barclaycard received as little as £12.50 in points to redeem, while Sainsbury’s customers had to spend as much as £1,000 just to get two tickets to the cinema. Today, points on spending in-store are earned at a rate of two points per £1 spent (except 1 point per liter of fuel); 500 points can subsequently be exchanged for a voucher worth £2.50 to spend in Sainsbury’s. The card scheme is run by a third-party company, Loyalty Management UK (LMUK), which collects information on behalf of the partner sponsors.
Online Sales ChannelsToward the end of the 1990s, both firms targeted online distribution channels that promised large growth potential. Non-store retailing growth rates were expected to be higher than store-based rates, as online usage gained popularity among British consumers (see Exhibit 3). Following these predictions, the United
CHE-HITT-09-0102-Case-027.indd 380CHE-HITT-09-0102-Case-027.indd 380 11/14/09 2:48:40 AM11/14/09 2:48:40 AM

Case 27: Tesco
versus Sainsbury’s
381
Kingdom has evolved into a leader of Internet retailing in Europe, and growth is continuing.
Tesco5 has operated on the Internet since 1994 and was the first retailer in the world to offer a robust home-shopping service in 1996. Tesco.com was for-mally launched in 2000. It also has online operations in the Republic of Ireland and in South Korea. Food sales are available within delivery range of selected stores, goods being hand-picked within each store, in contrast to the warehouse model followed by most competi-tors (e.g., Ocado6), which allows rapid expansion with limited investment. In 2003, Tesco.com’s then-CEO, John Browett, received the Wharton Infosys Business Transformation Award for the innovative processes he used to support this online food service. Today, Tesco operates the world’s largest food home-shopping ser-vice, as well as provides consumer goods, telecommu-nications, and financial services online. As of November 2006, Tesco was the only food retailer to make online shopping profitable.
Sainsbury’s has been involved in e-business and home-shopping development since 2000, when it launched Sainsbury’s to You in April of that year. Although some employees transferred from the tradi-tional side of the business, Sainsbury’s also hired new staff with Web and marketing skills. Specific training was provided on e-business, as well as cross-functional training. Sainsbury’s to You did not completely spin off
but occupied a separate building, thereby combining entrepreneurial flexibility with the strength and security of a strong brand. Sainsbury’s Online currently oper-ates from 144 stores and uses two dedicated picking cen-ters that are not open to the public. In addition to food, also available are flowers, wine, gifts, and electronics. In October 2007, Sainsbury’s was receiving around 80,000 online orders per week. This represents quite strong growth, but is far less than Tesco, which processes weekly orders of 250,000. Sainsbury’s did not release any e-commerce sales figures, but said it was still on track to expand its Web service to 200 stores by March 2010. Tesco.com captured two-thirds of all online food orders in the first seven months of 2007, generating sales of approximately ₤2.5 million per day. Sainsburystoyou.com took third place with 14 percent, behind ASDA with 16 percent. Customers of Sainsbury’s, however, spent the most per order, averaging almost £90, compared to £80 for both Tesco and ASDA. ASDA and Sainsbury’s online shoppers also bought more items per order, with both averaging 69 units per order compared to 58 for Tesco. Sainsbury’s online customers incurred the lowest average delivery charge during the period, at just over £3. Tesco online customers paid over £4 per delivery, and ASDA online customers paid nearly £5.50.
Diversification into Non-FoodA number of retailers have created such sense of nearness with customers in terms of perception, safety and security that you can refer to them as brands.
—Karel Vuursteen, Chairman & CEO, Heineken
Originally specializing in food, Tesco began to diversify into areas such as discount clothes, consumer electronics, consumer financial services, DVD sales and rentals, compact discs and music downloads, Internet service, consumer telecoms, consumer health insurance, consumer dental plans, and budget software. In these new product segments, Tesco heavily built on its skills in private labels. For example, it introduced brands such as “Cherokee” and “F+F” in clothing, “Technika” and “Digilogic” in consumer electronics, and other labels ranging from DVD players to televisions and computers. Tesco used its food brands “Finest” and “Value” to expand into non-food items. In its Extra stores, Finest health and beauty, home, and clothing lines resulted.
In 1997, Tesco Personal Finance was launched as a fifty-fifty banking joint venture with the Royal Bank of Scotland. Products offered included credit cards, loans, mortgages, savings accounts, and several types of insurance, including car, home, life, pet, and travel. They are promoted by leaflets in Tesco stores and through its
Exhibit 3 Retailing: Growth in Value Sales by Broad Sector/Sector 2001–2006 (percentage of current value growth)
2005–2006 2001–2006 CAGR
2001–2006 Total
Non-store retailing
13.3 13.8 91.2
Internet retailing
24.8 32.9 313.9
Vending 2.5 5.0 27.7
Home shopping 2.8 3.8 20.6
Direct selling −1.0 −1.5 −7.4
Store-based retailing
2.4 3.7 19.8
Food retailers 3.0 4.0 21.7
Non-food retailers
1.9 3.4 18.3
Retailing 3.1 4.2 23.1
Source: 2007, Official statistics, trade associations, trade press, company research, trade interviews, Euromonitor International estimates; Euromonitor, U.K. Retail Market: Market overview.
CHE-HITT-09-0102-Case-027.indd 381CHE-HITT-09-0102-Case-027.indd 381 11/14/09 2:48:41 AM11/14/09 2:48:41 AM

382C
ase
27: T
esco
ver
sus
Sain
sbur
y’s Web site. All of its offers are simple, providing customers
few but clear options and choices. Profits were £130 million for the 52 weeks prior to February 24, 2007, of which Tesco’s share was £66 million. This move toward the financial sector has diversified the Tesco brand and provides opportunities for growth outside the retailing sector. For example, Tesco offers Clubcard points or free petrol when consumers purchase Tesco car insurance. The company is currently conducting trials at a finance center in the Glasgow Silverburn Extra store, providing free financial advice and quotes for insurance and loans; this service is staffed by trained Royal Bank of Scotland employees. The center also has a Euro cash machine providing commission-free Euros and a Bureau de Change run by Travelex. If successful, this service will be rolled out to more key and flagship stores.
Tesco also entered the telecommunications sec-tor. Though it launched its Internet service provider in 1998, the company was not seriously active in tele-communications until 2003. Rather than purchasing or building its own telecom network, Tesco paired its mar-keting strength with the expertise of existing telecom operators. In autumn 2003, Tesco Mobile was launched as a joint venture with O2, and Tesco Home Phone was created in partnership with Cable & Wireless. In August 2004, Tesco Broadband, an ADSL-based service delivered via BT phone lines, was launched in partner-ship with NTL. In January 2006, Tesco Internet Phone, a Voice over Internet Protocol service, was launched in conjunction with Freshtel of Australia. Simple and clear offering logic is also evident in the strategic move into telecommunications. Tesco Mobile offers only four different pay-as-you-go tariffs: Value, Standard, Extra, and Staff (for employees). Tesco announced in December 2004 that it had signed up 500,000 custom-ers to its mobile service in the 12 months since launch. By December 2005, one million customers were using its mobile service, and by April 2006, Tesco claimed over one and, one-half million telecom accounts in total, including mobile, fixed line, and broadband. On December 19, 2006, Tesco Ireland announced that it would enter into a joint venture with O2 Ireland to offer mobile telecommunications services, also under the Tesco Mobile brand.
Recently, Tesco entered the housing market with a self-advertising Web site, Tesco Property Market. Other strategic initiatives into non-food items include, for example, following a successful trial in 2006, “Apple” zones in 12 outlets, where the iPod range is sold along-side Mac computers and other Apple products.
Sainsbury’s was much more reluctant to move into non-food retailing. Inspired by the success of its main rivals (ASDA had also moved strongly into the non-
food area) and the sheer size of the U.K. non-food retail market (in 2003, it was estimated at over ₤100 mil-lion), it launched 2,500 home and cookware products in September 2003. Copying Tesco, Sainsbury’s also used its own food brands and transferred them to non-food items. For example, it extended its clothing range with an organic line. In addition to food and non-food items, Sainsbury’s expanded into retail banking and property development. In 1997, Sainsbury’s bank was established as a joint venture between J Sainsbury plc and the Bank of Scotland (now HBOS). Sainsbury’s bank offers ser-vices similar to Tesco’s, including travel (insurance and money), savings, and lending; it also offers a Sainsbury’s credit card. By 2010, Sainsbury’s expects to achieve sales of ₤3.5 billion, with 33 percent of its total sales coming from non-food businesses.
International DiversificationThese results show that our new growth businesses—in international, in non-food and in services—have con-tributed as much profit as the entire business was making in 1997.
—CEO Terry Leahy, 2005
Tesco’s international expansion7 began in the late 1970s with the purchase of a small company in the Republic of Ireland. The small-scale nature of this first foray was seen as a weakness, and the company was eventually sold in the mid-1980s. In 1994, Tesco acquired the Scottish super-market chain William Low. Tesco successfully fought off Sainsbury’s for control of the Dundee-based firm, which then operated 57 stores. This paved the way for Tesco to expand its presence in Scotland, where it was weaker than in England. Inverness was recently branded “Tescotown” because well over 50p in every £1 spent on food is believed to be spent in its three Tesco stores. In March 1997, Tesco announced the purchase of the retail arm of Associated British Foods, which consisted of the Quinnsworth, Stewarts, and Crazy Prices chains in the Republic of Ireland and Northern Ireland, as well as associated busi-nesses, for £640 million. This acquisition gave Tesco both a major presence in the Republic of Ireland and a larger presence in Northern Ireland than Sainsbury’s, which had begun its move into the province in 1995.
In the 1990s, Tesco strongly expanded overseas by increasing investments in emerging markets such as Hungary, the Czech Republic, Thailand, and South Korea. Tesco was buying into successful companies, a strategy that resulted in strong positions in these mar-kets. In 1997, the new CEO, Terry Leahy, enforced Tesco’s international growth strategies beyond Great Britain. However, outside the United Kingdom the
CHE-HITT-09-0102-Case-027.indd 382CHE-HITT-09-0102-Case-027.indd 382 11/14/09 2:48:41 AM11/14/09 2:48:41 AM

Case 27: Tesco
versus Sainsbury’s
383
supermarket firm’s position was far from dominant and remained in the shadow of larger, more high-profileinternational operators such as Wal-Mart and Carrefour. Tesco then analyzed countries for expansion, putting high emphasis on two dimensions: the market potential for growth and the competitive situation in the market. Only if a market was characterized by relatively high growth potential and relatively low rivalry was it con-sidered a real target market and approached in an orderly fashion.
In 2002, Tesco purchased 13 HIT hypermarkets in Poland. In June 2003, Tesco purchased the C Two-Network in Japan. It also acquired a majority stake in the Turkish supermarket chain Kipa. Another acqui-sition was the Lotus chain in Thailand. In mid-2006, Tesco purchased an 80 percent stake in Casino’s Leader Price supermarkets in Poland, which were subsequently reconfigured as small Tesco stores.
Many British retailers attempting to build inter-national businesses have failed. Tesco has responded to the need to be sensitive to local expectations in foreign countries by entering into joint ventures with
local partners, such as Samsung Group in South Korea (Samsung-Tesco Homeplus), and Charoen Pokphand in Thailand (Tesco Lotus), and by appointing a high proportion of local personnel to management positions.
In late 2004, the amount of floor space Tesco oper-ated outside the United Kingdom surpassed its home market space for the first time, although the United Kingdom still accounted for more than 75 percent of group revenue due to lower sales per unit area outside the territory (for an overview of Tesco’s international store portfolio, see Exhibit 4). Tesco regularly contin-ues to make small acquisitions to expand its interna-tional businesses. For example, in the 2005–06 fiscal year, acquisitions were made in South Korea, Poland, and Japan.
In September 2005, Tesco announced that it was selling its operations in Taiwan to Carrefour and pur-chasing Carrefour stores in the Czech Republic and Slovakia. Both companies stated that they were concen-trating their efforts in countries where they had strong market positions. Tesco entered China by acquiring a 50 percent stake in the Hymall chain from Ting Hsin of
Exhibit 4 Tesco’s Store Portfolio “International”
Country Entered Stores Area (m²) Area (sq ft) Turnover (£ million)
China 2004 47 392,422 4,224,000 552
Czech Republic 1996 84 381,459 4,106,000 807
France 1992 1 1,400 16,000 Note 3
Hungary 1994 101 448,164 4,824,000 1,180
Republic of Ireland 1997 95 205,780 2,215,000 1,683
Japan 2003 109 29,078 313,000 287
Malaysia 2002 19 174,750 1,881,000 247
Poland 1995 280 606,935 6,533,000 1,135
Slovakia 1996 48 225,475 2,427,000 498
South Korea 1999 81 473,340 5,095,000 2,557
Thailand 1998 370 698,166 7,515,000 1,326
Turkey 2003 30 102,936 1,108,000 256
United States of America 2007 6 Unknown 60,000 (est.) Unknown
Note 1: The store numbers and floor area figures are as of February 24, 2007, but the turnover figures are for the year 2005, except for the Republic of Ireland data, which are for the year ending February 24, 2007, like the U.K. figures. This information is taken from the 2007 final broker pack.
Note 2: China: Joint venture in February 2006; now a 90 percent–owned subsidiary.
Note 3: France: Tesco owned a French chain called Catteau between 1992 and 1997. Its existing single store in France is a wine warehouse in Calais (opened in 1995 and targeted at British day trippers).
Note 4: Malaysia: Tesco Stores (Malaysia) Sdn Bhd was incepted on November 29, 2001, as a strategic alliance with local conglomerate, Sime Darby Bhd of which the latter holds 30 percent of total shares.
CHE-HITT-09-0102-Case-027.indd 383CHE-HITT-09-0102-Case-027.indd 383 11/14/09 2:48:41 AM11/14/09 2:48:41 AM
384C
ase
27: T
esco
ver
sus
Sain
sbur
y’s Taiwan in September 2004. In December 2006, it raised
its stake to 90 percent in a £180 million deal, which was just after Tesco lost out to Wal-Mart to partner with the Indian group, Bharti, to develop a national retail chain in India.
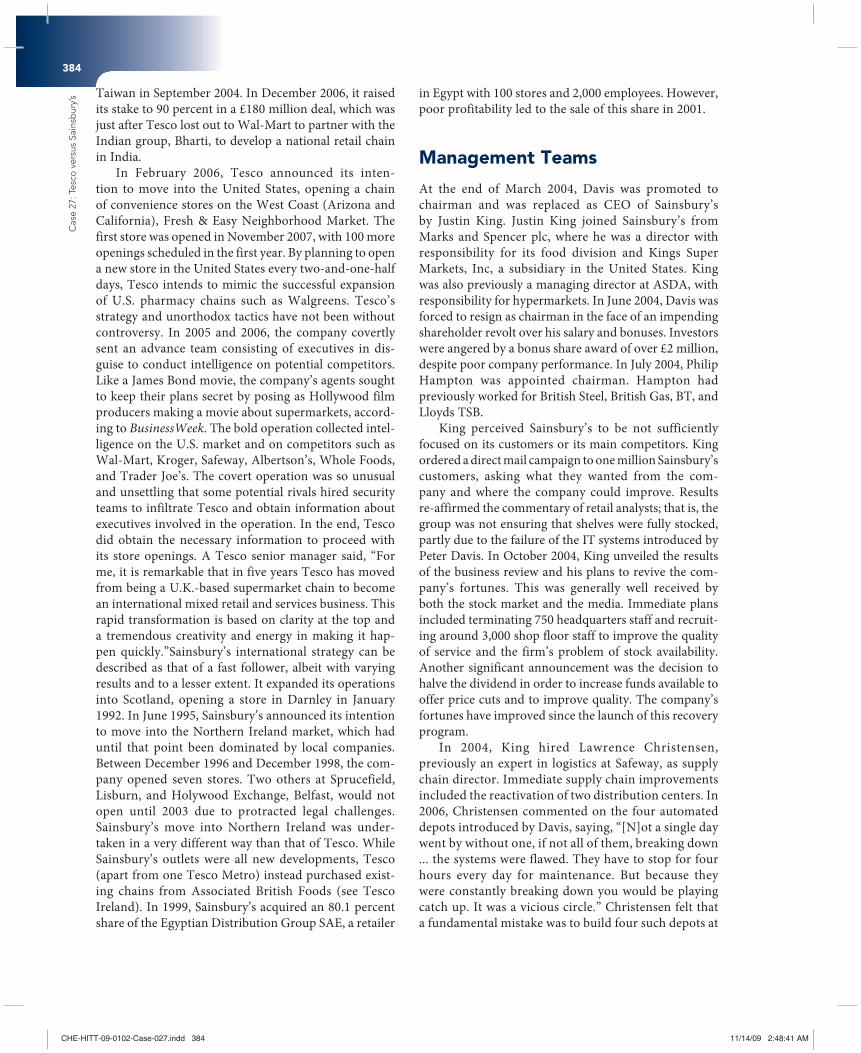
In February 2006, Tesco announced its inten-tion to move into the United States, opening a chain of convenience stores on the West Coast (Arizona and California), Fresh & Easy Neighborhood Market. The first store was opened in November 2007, with 100 more openings scheduled in the first year. By planning to open a new store in the United States every two-and-one-half days, Tesco intends to mimic the successful expansion of U.S. pharmacy chains such as Walgreens. Tesco’s strategy and unorthodox tactics have not been without controversy. In 2005 and 2006, the company covertly sent an advance team consisting of executives in dis-guise to conduct intelligence on potential competitors. Like a James Bond movie, the company’s agents sought to keep their plans secret by posing as Hollywood film producers making a movie about supermarkets, accord-ing to BusinessWeek. The bold operation collected intel-ligence on the U.S. market and on competitors such as Wal-Mart, Kroger, Safeway, Albertson’s, Whole Foods, and Trader Joe’s. The covert operation was so unusual and unsettling that some potential rivals hired security teams to infiltrate Tesco and obtain information about executives involved in the operation. In the end, Tesco did obtain the necessary information to proceed with its store openings. A Tesco senior manager said, “For me, it is remarkable that in five years Tesco has moved from being a U.K.-based supermarket chain to become an international mixed retail and services business. This rapid transformation is based on clarity at the top and a tremendous creativity and energy in making it hap-pen quickly.”Sainsbury’s international strategy can be described as that of a fast follower, albeit with varying results and to a lesser extent. It expanded its operations into Scotland, opening a store in Darnley in January 1992. In June 1995, Sainsbury’s announced its intention to move into the Northern Ireland market, which had until that point been dominated by local companies. Between December 1996 and December 1998, the com-pany opened seven stores. Two others at Sprucefield, Lisburn, and Holywood Exchange, Belfast, would not open until 2003 due to protracted legal challenges. Sainsbury’s move into Northern Ireland was under-taken in a very different way than that of Tesco. While Sainsbury’s outlets were all new developments, Tesco (apart from one Tesco Metro) instead purchased exist-ing chains from Associated British Foods (see Tesco Ireland). In 1999, Sainsbury’s acquired an 80.1 percent share of the Egyptian Distribution Group SAE, a retailer
in Egypt with 100 stores and 2,000 employees. However, poor profitability led to the sale of this share in 2001.
Management Teams
At the end of March 2004, Davis was promoted to chairman and was replaced as CEO of Sainsbury’s by Justin King. Justin King joined Sainsbury’s from Marks and Spencer plc, where he was a director with responsibility for its food division and Kings Super Markets, Inc, a subsidiary in the United States. King was also previously a managing director at ASDA, with responsibility for hypermarkets. In June 2004, Davis was forced to resign as chairman in the face of an impending shareholder revolt over his salary and bonuses. Investors were angered by a bonus share award of over £2 million, despite poor company performance. In July 2004, Philip Hampton was appointed chairman. Hampton had previously worked for British Steel, British Gas, BT, and Lloyds TSB.
King perceived Sainsbury’s to be not sufficiently focused on its customers or its main competitors. King ordered a direct mail campaign to one million Sainsbury’s customers, asking what they wanted from the com-pany and where the company could improve. Results re-affirmed the commentary of retail analysts; that is, the group was not ensuring that shelves were fully stocked, partly due to the failure of the IT systems introduced by Peter Davis. In October 2004, King unveiled the results of the business review and his plans to revive the com-pany’s fortunes. This was generally well received by both the stock market and the media. Immediate plans included terminating 750 headquarters staff and recruit-ing around 3,000 shop floor staff to improve the quality of service and the firm’s problem of stock availability. Another significant announcement was the decision to halve the dividend in order to increase funds available to offer price cuts and to improve quality. The company’s fortunes have improved since the launch of this recovery program.
In 2004, King hired Lawrence Christensen, previously an expert in logistics at Safeway, as supply chain director. Immediate supply chain improvements included the reactivation of two distribution centers. In 2006, Christensen commented on the four automated depots introduced by Davis, saying, “[N]ot a single day went by without one, if not all of them, breaking down ... the systems were flawed. They have to stop for four hours every day for maintenance. But because they were constantly breaking down you would be playing catch up. It was a vicious circle.” Christensen felt that a fundamental mistake was to build four such depots at
CHE-HITT-09-0102-Case-027.indd 384CHE-HITT-09-0102-Case-027.indd 384 11/14/09 2:48:41 AM11/14/09 2:48:41 AM

Case 27: Tesco
versus Sainsbury’s
385
once, rather than building one and testing it thoroughly before building the others. In 2007, Sainsbury’s announced an additional £12 million investment in its depots to keep pace with sales growth and to remove the failed automated systems from its depots.
The Competitive Landscape TodayThe situation today is clear. Tesco has outpaced its closest rival in its local and international markets. Edward Garner, communications director of the TNS Superpanel, said, “TNS supermarket share information shows that the retailer’s market share has grown consis-tently and strongly over the last decade and shows no sign of abating.”
These events led to shifts in the competitive landscape. The U.K. retail industry has become highly concentrated. The top four store-based retailers—Tesco, Sainsbury’s ASDA, and Morrison’s Supermarkets—dominate the market; all are original food retailers. This illustrates the status of food retailers in the market (see Exhibit 5). All are British, except ASDA, which was acquired in 1999 by the U.S. retail giant Wal-Mart.
Discounters adapted to this less-favorable environ-ment by slightly improving their meager U.K. presence by expanding their number of outlets and moving upscale. This was helped by the trend of consumers to increas-ingly combine bargain shopping with purchases of luxury products or services. This “schizophrenic” shop-ping behavior blurs previously separate boundaries. The traditional structure of upper, middle, and mass market has been more or less abolished.
Since the launch of King’s recovery program, Sainsbury’s has reported nine consecutive quarters of sales growth, most recently in March 2007, even out-pacing Tesco, making the company’s performance the best since its glory days of the 1980s and early 1990s. Sales increases were credited to solving problems with the company’s distribution system. More recent sales improvements have been attributed to significant price cuts and the company’s focus on fresh and healthy food. On October 4, 2007, Sainsbury’s announced plans to relocate their Store Support Centre from Holborn to Kings Cross in 2011. This office, part of a new build-ing complex, will allow both cost savings and energy efficiency.
Despite this positive news, according to the lat-est Taylor Nelson Sofres rankings published in March 2007, Sainsbury’s market share in food retailing remains third in the United Kingdom at 16.37 percent compared to Tesco’s 31.35 percent, ASDA’s 16.83 percent, and Morrison’s 11.08 percent (see Exhibit 6). Tesco remains the clear market leader. In the past, Tesco showed itself
to be the quickest at seizing expansion opportunities. Furthermore, it has succeeded in building an image of providing good value at low prices.The recovery in the Sainsbury market share builds on the positive picture already established. This strong performance has been achieved in the face of relentless pressure from Tesco, which continues its recent run of double-digit turnover growth. . . .
Whilst Tesco remains dominant, there are signs that it is experiencing increased competition. It is still growing, but the year-on-year share increase is below the average we were seeing last year. Looking towards the future, Tesco will continue to face challenging competition from its nearest competitor Asda as well as the likes of Sainsbury’s, which is showing positive growth trends and Morrisons once the Safeway store conversions are complete. Tesco will need to prove its ability to meet increasingly chal-lenging consumer demands and stay a step ahead of the competition. . . .
Exhibit 5 Retailing: Company Shares by Value 2004–2006 (in percentage of retail value)
2004 2005 2006
Tesco plc 10.2 11.0 11.4
J Sainsbury plc 5.4 5.8 5.9
Asda Stores Ltd 4.7 4.9 5.1
Wm Morrison Supermarkets plc
3.7 3.7 3.5
Marks and Spencer plc 2.7 2.7 2.7
Alliance Boots plc — — 2.1
Dixons Group plc 1.3 1.4 1.4
Argos plc 1.3 1.4 1.4
B&Q plc 1.5 1.5 1.4
Somerfi eld Ltd 1.7 1.7 1.3
Waitrose Ltd 1.0 1.0 1.2
Co-operative Group (CWS) Ltd
1.3 1.3 1.2
Next plc 1.0 1.0 1.1
Spar Ltd (UK) 0.8 0.9 0.9
Debenhams Retail plc 0.7 0.8 0.8
Source: 2007, Official statistics, trade associations, trade press, company research, trade interviews, Euromonitor International estimates; Euromonitor, U.K. Retail Market: Market overview.
CHE-HITT-09-0102-Case-027.indd 385CHE-HITT-09-0102-Case-027.indd 385 11/14/09 2:48:41 AM11/14/09 2:48:41 AM

386C
ase
27: T
esco
ver
sus
Sain
sbur
y’s
Future Internationalization: It has a long way to go before it overhauls Wal-Mart as the world’s biggest grocer—but analysts said the same about overhauling Sainsbury’s in the U.K. market 15 years ago and now Tesco is almost double its size.
—Edward Garner, Communications Director of TNS Superpanel, 2007
New Challenges AheadAfter a relatively long period of economic growth during the review period, conditions may well stagnate in the coming years, thus dampening the forecast performance of store-based retailing. Consumer debt levels have reached record highs and, with the United Kingdom’s negative saving rate, there is less room for continued growth in consumption. As a result, discounters (both food and non-food) are well placed to gain importance. Euromonitor predicts food retailers to outperform non-food retailers with a value compound annual growth rate of 1 percent. Recent trends, such as health and well-ness and ethical concerns, have opened opportunities, even in the saturated food category; however, most food retailers’ growth is expected to stem from non-food items.
Consolidation is expected to continue (see the Safeway takeover), with independent shops closing, being taken over, or joining larger chains. This is evident
in the decline of the number of total outlets, particularly independent ones.
Sainsbury’s might be the target of additional take-over bids, since family investment in the company is only 18 percent. A first private equity bid was considered by CVC Capital Partners, Kohlberg Kravis Roberts (which later left the consortium in order to focus on its bid for Alliance Boots), and Blackstone Group; in February 2007, this also included Goldman Sachs and Texas Pacific Group. The initial offer submitted in April 2007 of 562p a share was rejected after discussions between Sainsbury’s top management and the two largest family shareholders. A subsequent offer of 582p a share was also rejected. As a consequence, the CVC-led consortium abandoned its quest, stating “[I]t became clear the con-sortium would be unable to make a proposal that would result in a successful offer.” In April 2007, Delta Two, a Qatari investment company, bought a 14 percent stake in Sainsbury’s (causing its share price to rise 7.17 percent); this stake was increased to 25 percent in June 2007. On July 18, 2007, BBC News reported that Delta Two had tabled a conditional bid proposal. On November 5, 2007, it was announced that Delta Two had abandoned its take-over bid due to the “deterioration of credit markets” and concerns about funding the company’s pension scheme. Following the withdrawal of the interest of Qatari invest-ment, shares in Sainsbury’s dropped about 20 percent (115p) to 440p on the day of this announcement.
Exhibit 6 Food Retailing: Company Shares by Sales 1990–2007 (in percentage of retail value)
1990 . . . 1994 1995 . . . 2002 . . . 2004 2005 2006 2007
Tesco plc 9.7 11.4 13.4 16.7 27.5 29.8 31.1 31.35
J Sainsbury plc 11.0 12.3 12.2 11.7 15.5 15.9 16.0 16.37
Asda Stores Ltd 6.8 6.7 7.2 10.6 16.6 16.5 16.4 16.83
Wm Morrison Supermarkets plc (Safeway included)
7.5 (only Safeway)
14.4 12.2 11.3 11.08
Source: TNS (Taylor Nelson Sofres) World Panel market-share data released June 2007.
Appendix 1 Retail: Number of Employees: 2001–2006 (in thousands)
2001 2002 2003 2004 2005 2006
Retail employees 3,048 3,077 3,136 3,308 3,329 3,316
% growth — 1.0 1.9 5.5 0.6 −0.4
Source: 2007, Official statistics, trade associations, trade press, company research, trade interviews, Euromonitor International estimates; Euromonitor, U.K. Retail Market: Market overview.
CHE-HITT-09-0102-Case-027.indd 386CHE-HITT-09-0102-Case-027.indd 386 11/14/09 2:48:41 AM11/14/09 2:48:41 AM

Case 27: Tesco
versus Sainsbury’s
387
Appendix 2 Number of Employees of Food Retailers (full-time equivalents)
Employees 2006 2007
Tesco 380,000 318,283
Asda 150,00090,000 part-time60,000 full-time
143,125
Sainsbury’s 96,200104,100 part-time49,200 full-time
95,50098,100 part-time48,800 full-time
Appendix 3 Tesco’s Financial Figures
52 weeks ended Turnover (£m) Profi t before Tax (£m) Profi t for Year (£m) Basic Earnings per Share (p)
2007 46,600 2,653 1,899 22.36
2006 38,300 2,210 1,576 19.70
2005 33,974 1,962 1,366 17.44
2004 30,814 1,600 1,100 15.05
2003 26,337 1,361 946 13.54
2002 23,653 1,201 830 12.05
2001 20,988 1,054 767 11.29
2000 18,796 933 674 10.07
1999 17,158 842 606 9.14
1998 16,452 760 532 8.12
Note: The numbers include non-UK and Ireland results.
Appendix 4 Growth Rates (Tesco vs. Sainsbury) 1990–2007
Growth Rates (%) Sales Operating Income
Net Income Div. Per Share
Equity Total Assets
Sainsbury’s Y2007 21.88
Tesco Y2007 8.08 5.88 20.51 11.70 12.00 9.86
Sainsbury’s Y2006 5.65 7.55 –64.67 2.56 –0.21 9.24
Tesco Y2006 16.50 13.40 16.82 14.15 9.03 11.97
Sainsbury’s Y2005 –10.10 –53.04 –84.60 –56.50 –15.48 –7.11
Tesco Y2005 10.26 12.47 24.18 10.53 13.76 10.12
Sainsbury’s Y2004 –1.66 –2.03 –12.78 0.70 2.05 4.70
Tesco Y2004 17.00 19.78 16.28 10.32 22.50 12.68
(Continued)
CHE-HITT-09-0102-Case-027.indd 387CHE-HITT-09-0102-Case-027.indd 387 11/14/09 2:48:41 AM11/14/09 2:48:41 AM

388C
ase
27: T
esco
ver
sus
Sain
sbur
y’s
Growth Rates (%) Sales Operating Income
Net Income Div. Per Share
Equity Total Assets
Sainsbury’s Y2003 1.56 11.46 24.73 4.99 3.30 8.76
Tesco Y2003 11.35 12.49 13.98 10.71 18.24 21.91
Sainsbury’s Y2002 7.57 9.95 38.93 3.63 –1.31 6.85
Tesco Y2002 12.70 13.29 8.21 12.45 4.02 16.00
Sainsbury’s Y2001 –1.95 –5.78 –24.93 — 3.23 –1.94
Tesco Y2001 11.66 12.55 13.80 11.16 12.05 18.80
Sainsbury’s Y2000 –0.99 –25.32 –41.64 — 0.65 4.32
Tesco Y2000 9.55 7.92 11.22 8.74 9.58 13.88
Sainsbury’s Y1999 13.33 8.48 22.79 3.02 12.89 10.13
Tesco Y1999 7.81 5.03 20.00 6.54 10.42 15.58
Sainsbury’s Y1998 8.25 11.58 20.84 13.01 12.01 25.23
Tesco Y1998 14.60 18.09 –2.88 12.09 –0.36 12.32
Sainsbury’s Y1997 6.08 –11.94 –17.42 1.65 3.88 7.88
Tesco Y1997 14.83 6.91 11.59 7.81 8.78 6.74
Sainsbury’s Y1996 11.18 –4.09 –8.87 3.43 7.45 15.81
Tesco Y1996 19.73 17.34 22.63 11.61 15.21 5.01
Sainsbury’s Y1995 7.31 13.36 278.18 10.38 8.21 6.22
Tesco Y1995 17.45 18.38 27.43 10.99 12.92 18.84
Sainsbury’s Y1994 9.27 1.80 –71.84 5.99 0.36 3.95
Tesco Y1994 13.43 –5.53 –28.59 9.13 –0.15 9.82
Sainsbury’s Y1993 11.39 17.48 14.74 14.29 14.68 12.26
Tesco Y1993 6.82 15.06 5.56 12.71 12.50 9.03
Sainsbury’s Y1992 11.29 14.29 23.37 20.41 57.92 22.22
Tesco Y1992 11.84 20.48 30.69 20.00 13.29 13.01
Sainsbury’s Y1991 12.74 23.83 13.23 20.50 18.98 14.75
Tesco Y1991 17.48 25.63 19.27 25.72 72.23 50.90
Sainsbury’s Y1990 22.47 17.16 24.88 20.79 20.38 16.97
Tesco Y1990 14.50 20.50 36.23 22.86 21.60 19.75
Source: Thompson Database 2007.
Appendix 4 Growth Rates (Tesco vs. Sainsbury) 1990–2007 (Continued)
CHE-HITT-09-0102-Case-027.indd 388CHE-HITT-09-0102-Case-027.indd 388 11/14/09 2:48:41 AM11/14/09 2:48:41 AM

Case 27: Tesco
versus Sainsbury’s
389
Appendix 5 Financial Leverage and Return on Equity/Assets 1990–2007
Profi tability (%) Financial LeverageTesco
Financial LeverageSainsbury’s
Return on EquityTesco
Return on EquitySainsbury’s
Return on AssetsTesco
Return on AssetsSainsbury’s
Y2007 42.41 45.42 18.81 8.62
Y2006 41.59 30.62 17.50 1.67 8.11 1.02
Y2005 44.13 36.50 16.20 −1.10 7.86 1.56
Y2004 42.72 40.12 15.65 8.09 7.31 3.70
Y2003 39.29 41.16 16.17 9.49 7.37 4.59
Y2002 40.51 43.34 15.65 7.71 7.72 4.21
Y2001 45.18 46.92 15.62 5.60 8.30 3.34
Y2000 47.91 44.57 15.26 7.55 8.54 4.12
Y1999 49.78 46.20 14.99 13.71 8.56 6.94
Y1998 52.11 45.07 13.01 12.56 8.08 6.79
Y1997 58.74 50.38 13.98 11.21 8.74 6.63
Y1996 57.64 52.32 14.02 14.29 8.90 8.48
Y1995 52.54 56.39 13.00 16.88 8.08 10.04
Y1994 55.29 55.36 10.84 4.70 6.96 2.77
Y1993 60.81 57.34 16.07 17.74 10.58 10.39
Y1992 58.93 56.13 17.17 19.88 11.18 11.96
Y1991 58.79 43.44 19.36 23.11 11.12 12.05
Y1990 51.51 41.90 21.05 24.40 12.82 12.20
Source: Thompson Database 2007.
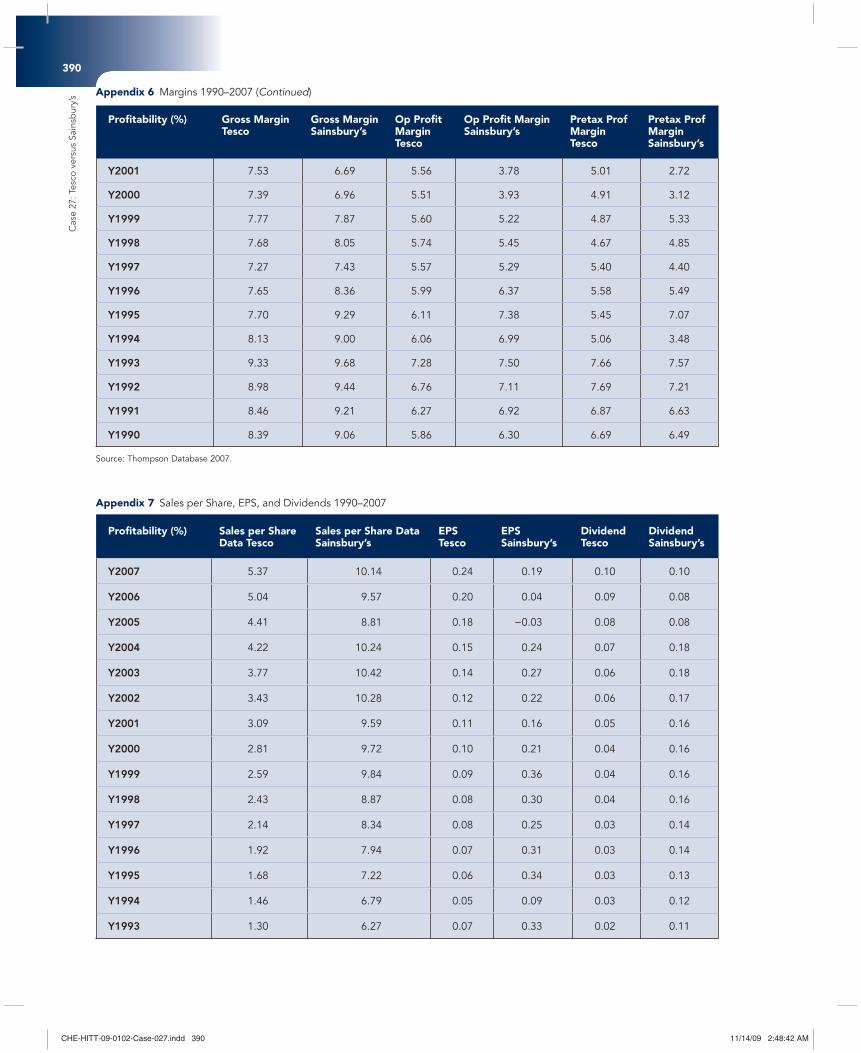
Appendix 6 Margins 1990–2007
Profi tability (%) Gross MarginTesco
Gross MarginSainsbury’s
Op Profi t MarginTesco
Op Profi t MarginSainsbury’s
Pretax Prof MarginTesco
Pretax Prof MarginSainsbury’s
Y2007 7.60 6.83 5.02 3.00 5.91 2.78
Y2006 7.67 6.95 5.13 2.22 5.46 0.65
Y2005 7.77 7.20 5.89 2.21 5.49 0.10
Y2004 7.65 8.89 5.78 4.22 4.92 3.56
Y2003 7.50 8.20 5.64 4.24 4.96 3.83
Y2002 7.51 7.41 5.58 3.86 4.97 3.33
(Continued)
CHE-HITT-09-0102-Case-027.indd 389CHE-HITT-09-0102-Case-027.indd 389 11/14/09 2:48:41 AM11/14/09 2:48:41 AM
390C
ase
27: T
esco
ver
sus
Sain
sbur
y’s
Appendix 7 Sales per Share, EPS, and Dividends 1990–2007
Profi tability (%) Sales per Share Data Tesco
Sales per Share DataSainsbury’s
EPSTesco
EPSSainsbury’s
DividendTesco
DividendSainsbury’s
Y2007 5.37 10.14 0.24 0.19 0.10 0.10
Y2006 5.04 9.57 0.20 0.04 0.09 0.08
Y2005 4.41 8.81 0.18 −0.03 0.08 0.08
Y2004 4.22 10.24 0.15 0.24 0.07 0.18
Y2003 3.77 10.42 0.14 0.27 0.06 0.18
Y2002 3.43 10.28 0.12 0.22 0.06 0.17
Y2001 3.09 9.59 0.11 0.16 0.05 0.16
Y2000 2.81 9.72 0.10 0.21 0.04 0.16
Y1999 2.59 9.84 0.09 0.36 0.04 0.16
Y1998 2.43 8.87 0.08 0.30 0.04 0.16
Y1997 2.14 8.34 0.08 0.25 0.03 0.14
Y1996 1.92 7.94 0.07 0.31 0.03 0.14
Y1995 1.68 7.22 0.06 0.34 0.03 0.13
Y1994 1.46 6.79 0.05 0.09 0.03 0.12
Y1993 1.30 6.27 0.07 0.33 0.02 0.11
Profi tability (%) Gross MarginTesco
Gross MarginSainsbury’s
Op Profi t MarginTesco
Op Profi t MarginSainsbury’s
Pretax Prof MarginTesco
Pretax Prof MarginSainsbury’s
Y2001 7.53 6.69 5.56 3.78 5.01 2.72
Y2000 7.39 6.96 5.51 3.93 4.91 3.12
Y1999 7.77 7.87 5.60 5.22 4.87 5.33
Y1998 7.68 8.05 5.74 5.45 4.67 4.85
Y1997 7.27 7.43 5.57 5.29 5.40 4.40
Y1996 7.65 8.36 5.99 6.37 5.58 5.49
Y1995 7.70 9.29 6.11 7.38 5.45 7.07
Y1994 8.13 9.00 6.06 6.99 5.06 3.48
Y1993 9.33 9.68 7.28 7.50 7.66 7.57
Y1992 8.98 9.44 6.76 7.11 7.69 7.21
Y1991 8.46 9.21 6.27 6.92 6.87 6.63
Y1990 8.39 9.06 5.86 6.30 6.69 6.49
Source: Thompson Database 2007.
Appendix 6 Margins 1990–2007 (Continued)
CHE-HITT-09-0102-Case-027.indd 390CHE-HITT-09-0102-Case-027.indd 390 11/14/09 2:48:42 AM11/14/09 2:48:42 AM

Case 27: Tesco
versus Sainsbury’s
391
Appendix 8 Retailing: Company Shares by Value 2004–2006 (in percentage of retail value)
Company 2004 2005 2006
Tesco plc 10.2 11.0 11.4
J Sainsbury plc 5.4 5.8 5.9
Asda Stores Ltd 4.7 4.9 5.1
Wm Morrison Supermarkets plc 3.7 3.7 3.5
Marks and Spencer plc 2.7 2.7 2.7
Alliance Boots plc — — 2.1
Dixons Group plc 1.3 1.4 1.4
Argos plc 1.3 1.4 1.4
B&Q plc 1.5 1.5 1.4
Somerfi eld Ltd 1.7 1.7 1.3
Waitrose Ltd 1.0 1.0 1.2
Co-operative Group (CWS) Ltd 1.3 1.3 1.2
Next plc 1.0 1.0 1.1
Spar Ltd (UK) 0.8 0.9 0.9
Debenhams Retail plc 0.7 0.8 0.8
Source: 2007, Official statistics, trade associations, trade press, company research, trade interviews, Euromonitor International estimates; Euromonitor, U.K. Retail Market: Market overview.
Appendix 9 Food Retailing: Company Shares by Value 2004–2006 (in percentage of retail value)
Company 2004 2005 2006
Tesco plc 23.0 24.4 25.2
J Sainsbury plc 12.5 13.1 13.3
Asda Stores Ltd 10.9 11.0 11.2
Wm Morrison Supermarkets plc 8.7 8.5 8.1
Somerfi eld Ltd 4.0 3.8 3.1
Waitrose Ltd 2.3 2.3 2.8
Profi tability (%) Sales per Share Data Tesco
Sales per Share DataSainsbury’s
EPSTesco
EPSSainsbury’s
DividendTesco
DividendSainsbury’s
Y1992 1.22 5.83 0.07 0.29 0.02 0.10
Y1991 1.28 5.81 0.06 0.26 0.02 0.08
Y1990 1.13 5.19 0.05 0.24 0.01 0.07
Source: Thompson Database 2007.
(Continued)
Appendix 7 Sales per Share, EPSs and Dividends 1990–2007 (Continued)
CHE-HITT-09-0102-Case-027.indd 391CHE-HITT-09-0102-Case-027.indd 391 11/14/09 2:48:42 AM11/14/09 2:48:42 AM

392C
ase
27: T
esco
ver
sus
Sain
sbur
y’s
Appendix 10 Food Retailers: Value Sales by Sector 2001–2006 (in millions of pounds, current rsp)
Retailer Type 2001 2002 2003 2004 2005 2006
Supermarkets 40,502.8 42,591.0 43,106.1 44,356.0 45,198.8 46,284.0
Hypermarkets 22,766.5 24,677.2 27,569.9 31,698.9 35,521.1 38,175.9
Convenience stores 10,514.3 11,895.7 13,729.7 14,306.0 14,577.8 14,875.2
Food/drink/tobacco specialists 12,074.0 11,460.6 11,100.0 10,700.0 10,144.0 9,667.0
Independent grocers 8,563.0 8,135.0 7,647.0 7,119.4 6,592.5 6,203.6
Discounters 2,395.0 2,582.6 2,672.2 2,725.4 2,980.2 3,375.5
Other food retailers 2,365.7 2,395.0 2,218.9 2,159.0 2,129.0 2,088.0
Food retailers 99,181.2 102,737.0 108,043.9 113,064.6 117,143.4 120,669.1
Source: 2007, Official statistics, trade associations, trade press, company research, trade interviews, Euromonitor International estimates; Euromonitor, U.K. Retail Market: Market overview.
Appendix 11 Food Retailers: Growth in Value Sales by Sector 2001–2006 (percentage of current value growth)
Retailer Type 2005/2006 2001–2006 CAGR 2001/2006 TOTAL
Hypermarkets 7.5 10.9 67.7
Convenience stores 2.0 7.2 41.5
Discounters 13.3 7.1 40.9
Supermarkets 2.4 2.7 14.3
Other food retailers −1.9 −2.5 −11.7
Food/drink/tobacco specialists −4.7 −4.3 −19.9
Independent grocers −5.9 −6.2 −27.6
Food retailers 3.0 4.0 21.7
Source: 2007, Official statistics, trade associations, trade press, company research, trade interviews, Euromonitor International estimates; Euromonitor, U.K. Retail Market: Market overview.
Company 2004 2005 2006
Co-operative Group (CWS) Ltd 2.7 2.6 2.5
Spar Ltd (UK) 2.0 2.0 2.0
Musgrave Group plc 1.6 1.8 1.8
Lidl Ltd 1.0 1.1 1.1
Aldi Stores Ltd 0.9 1.0 1.1
Iceland Frozen Foods Ltd. 1.2 1.1 1.0
Others 26.6 24.8 23.6
Source: 2007, Official statistics, trade associations, trade press, company research, trade interviews, Euromonitor International estimates; Euromonitor, U.K. Retail Market: Market overview.
Appendix 9 Food Retailing: Company Shares by Value 2004–2006 (in percentage of retail value) (Continued)
CHE-HITT-09-0102-Case-027.indd 392CHE-HITT-09-0102-Case-027.indd 392 11/14/09 2:48:42 AM11/14/09 2:48:42 AM
Case 27: Tesco
versus Sainsbury’s
393
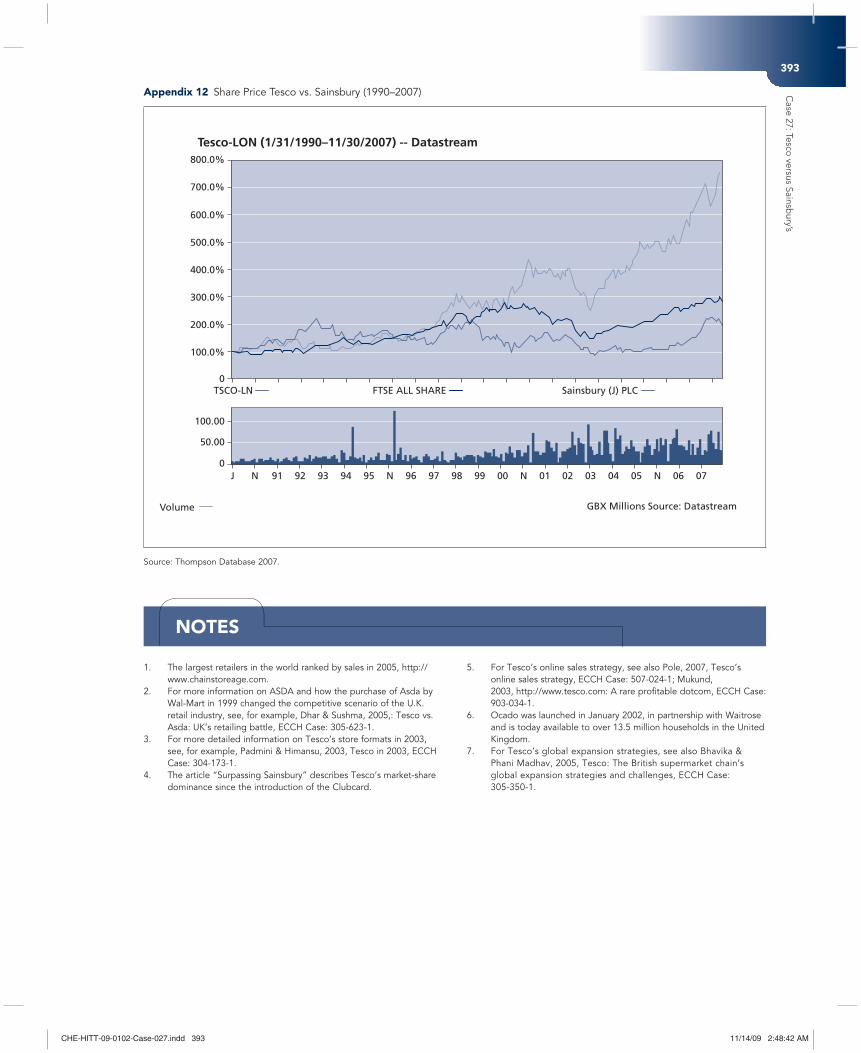
Appendix 12 Share Price Tesco vs. Sainsbury (1990–2007)
Source: Thompson Database 2007.
The largest retailers in the world ranked by sales in 2005, http://1. www.chainstoreage.com.
For more information on ASDA and how the purchase of Asda by 2. Wal-Mart in 1999 changed the competitive scenario of the U.K. retail industry, see, for example, Dhar & Sushma, 2005,: Tesco vs. Asda: UK’s retailing battle, ECCH Case: 305-623-1.
For more detailed information on Tesco’s store formats in 2003, 3. see, for example, Padmini & Himansu, 2003, Tesco in 2003, ECCH Case: 304-173-1.
The article “Surpassing Sainsbury” describes Tesco’s market-share 4. dominance since the introduction of the Clubcard.
For Tesco’s online sales strategy, see also Pole, 2007, Tesco’s 5. online sales strategy, ECCH Case: 507-024-1; Mukund, 2003, http://www.tesco.com: A rare profitable dotcom, ECCH Case: 903-034-1.
Ocado was launched in January 2002, in partnership with Waitrose 6. and is today available to over 13.5 million households in the United Kingdom.
For Tesco’s global expansion strategies, see also Bhavika & 7. Phani Madhav, 2005, Tesco: The British supermarket chain’s global expansion strategies and challenges, ECCH Case: 305-350-1.
NOTES
Tesco-LON (1/31/1990–11/30/2007) -- Datastream800.0%
700.0%
600.0%
500.0%
400.0%
300.0%
200.0%
100.0%
100.00
50.00
0J N 91 92 93 94 95 96 97 98 99 00 N 01 02 03 04 05 N 06 07N
TSCO-LN0
Volume
FTSE ALL SHARE Sainsbury (J) PLC
GBX Millions Source: Datastream
CHE-HITT-09-0102-Case-027.indd 393CHE-HITT-09-0102-Case-027.indd 393 11/14/09 2:48:42 AM11/14/09 2:48:42 AM


![Merchandising Produktkatalog [Kompatibilitätsmodus] fileMerchandising – Hochschulprodukte HfWU Ansteck – Pin Schirm Baumwolltasche (blau) Blütenzauber Samen-Bleistift Kugelschreiber](https://img.pdfslide.net/doc/110x75/5e11cb837a975466155d4a6b/merchandising-produktkatalog-kompatibilittsmodus-a-hochschulprodukte-hfwu.jpg)