Embed Size (px)
Citation preview
The south-eastern corner of Australia suffered a major drought from 1998 to 2010, which severely affected the water supply of urban communities in the region. Canberra, the capital city of Australia, reacted to this situation by initiating a number of water supply projects to reduce the long term risk of significant impacts of future droughts. One of these projects is the Enlarged Cotter Dam (ECD), consisting of an 87 m high RCC dam on the Cotter River, and two auxiliary saddle dams on the right bank to the south-west of the main dam that span neighbouring low-lying valleys.
The dam replaces an existing 30 m high concrete gravity dam and in so doing increases the reservoir capacity from 4GL to 78GL, augmenting the total storage capacity of the Canberra supply system by about 35%.
Construction of the saddle dams was undertaken over the period of February 2010 to March 2011. The main dam was constructed over the period of November 2009 to September 2013, with the RCC being placed between August 2011 and December 2012.
The river diversion capacity was determined on a risked-based approach, determining an acceptable probability of inundation, and the associated costs of delay and clean-up, compared to the initial investment on the diversion structure. However during the construction of the project, the Cotter River experienced three significant floods, all exceeding the capacity of the diversion and resulting in delays and damage beyond the assumptions of the risk model.
The flood events did not impact significantly on the permanent works, with the majority of the damage being limited to the temporary works. However following the second flood, and with
long range predictions of further wet weather, the diversion for the latter part of construction (i.e., during final excavation, clean-up of the valley floor and the initial phase of RCC construction) was increased to reduce the risk of further flood delays.
The diversion generally served the project well, until it was far exceeded and the partially constructed dam was overtopped by a 1-in-100 AEP flood. This flood caused extended delays to RCC placement. The long delay, coupled with the onset of colder ambient temperatures, provided the conditions for the development of thermal shock of the RCC, resulting in longitudinal cracking of the RCC surface.
This paper reviews the floods and their impact on the project, and in particular the thermal cracking, its implications and how it was assessed.
The construction phase of the ECD coincided with a strong La Niña event. La Niña cooling of the central and eastern tropical Pacific Ocean is often accompanied by warmer than normal surface temperatures in the western Pacific and to the north of Australia. La Niña events are associated with increased probability of wetter conditions over much of Australia, particularly over eastern and northern areas (BOM 2012). During this time the ACT experienced its wettest period since the mid 1970s, which included the three largest flood events since 1974. Each of these events is within the ten largest floods in recorded history on the Cotter River (over 100 years).
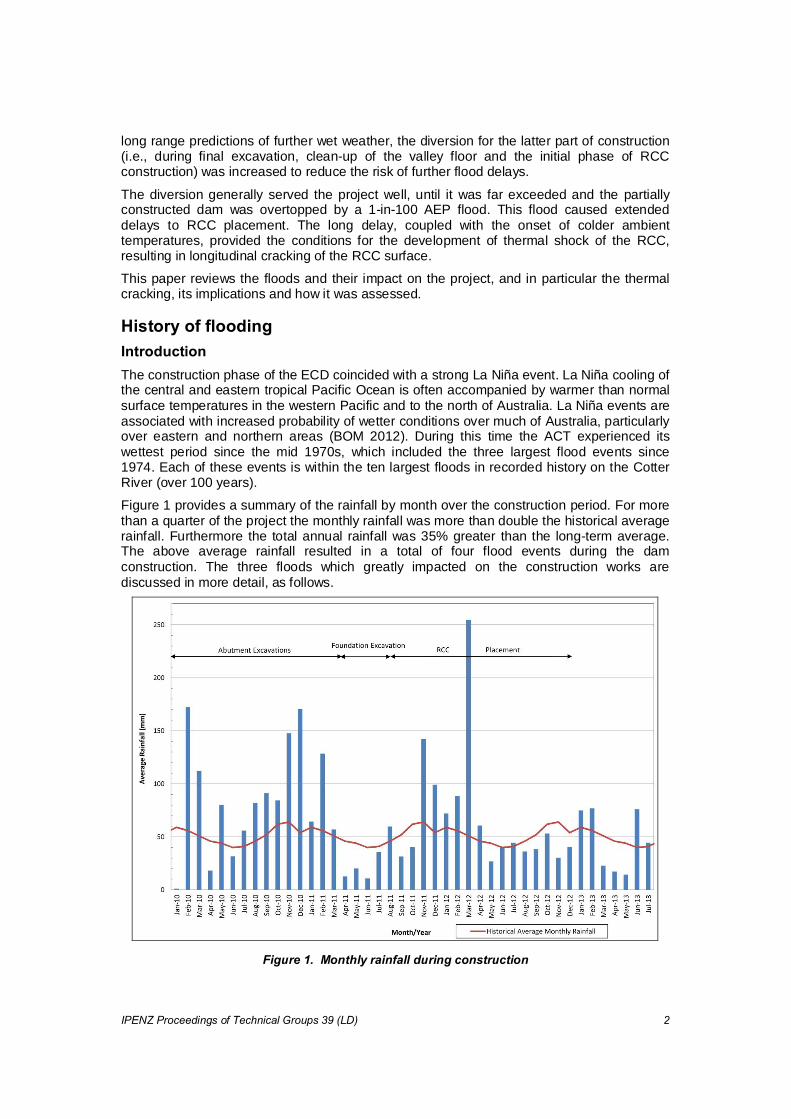
Figure 1 provides a summary of the rainfall by month over the construction period. For more than a quarter of the project the monthly rainfall was more than double the historical average rainfall. Furthermore the total annual rainfall was 35% greater than the long-term average. The above average rainfall resulted in a total of four flood events during the dam construction. The three floods which greatly impacted on the construction works are discussed in more detail, as follows.

The October 2010 flood occurred during the excavation of the abutments for the main dam. The peak outflow from the existing Cotter Dam was 167 m3/s, the largest the river had experienced in over 20 years.
At this time, a three-metre diameter corrugated metal pipe was serving as the diversion. The inlet was situated in the stilling basin of the existing Cotter Dam and it discharged downstream of a temporary shotcrete-faced cofferdam, which was constructed at the downstream extent of the works in the valley floor.
The abutment excavation methodology involved working from top down, using drill and blast techniques and dumping the excavated material over the edge of the excavation as it progressed. The rock and spoil heap gradually made its way down the abutments until it filled the valley floor, above the buried 3 m diversion. The rock and spoil was ultimately collected from the valley floor and carted to either the raw feed stockpile for RCC aggregate production or to waste as appropriate.
At the time of the October flood some of the excavated material had accumulated in the valley floor. The material that had stockpiled there tended to be the larger boulders and cobbles that had segregated from the rest of the material and rolled into the valley.
The flood exceeded the capacity of the 3 m diversion. The upstream cofferdam was overtopped, resulting in overland flow though the valley floor. The rocks from the abutment excavation had accumulated to the point that they were higher than the upstream cofferdam. Velocities over the upstream cofferdam were therefore not significant and it withstood the overtopping with little impact.
The downstream cofferdam, however, was overtopped and failed. A dominant breach section formed near the right abutment, where it had never been fully constructed. This meant that whilst one section of the dam had washed away, much of the rockfill remained in place elsewhere, along with the shotcrete facing.
The diversion pipe itself survived the flood and no repairs were necessary. The downstream cofferdam had to be rebuilt, but much of the original cofferdam was salvaged when it was reconstructed. Some material from the excavation was lost down the river, but the scree slopes from the excavation largely survived and excavation of the abutment was able to resume soon after the flood waters had subsided. The flood ultimately delayed the construction program by approximately one week.
The December flood also occurred during the abutment excavation phase of the project. By this time however, haulage of abutment excavation material from the valley floor was well underway. Access to the active excavation areas on the abutments was now from spoil ramps from the valley floor, rather than being accessed from tracks above.
The peak outflow from the existing Cotter Dam was 150 m3/s. The consequences of this flood were far more significant.
As a substantial amount of spoil from the abutment excavations was present in the valley at the time, when the diversion capacity was exceeded the overland flow was more constricted, creating higher velocities and more erosion (Figure 2). A notable amount of excavated material that had accumulated in the valley floor was transported downstream during this flood. This included the ramps that were being used to access the active excavation areas. The original water supply pipeline was damaged from the flood and had to be discarded. The downstream cofferdam failed again, but this time very little could be salvaged.
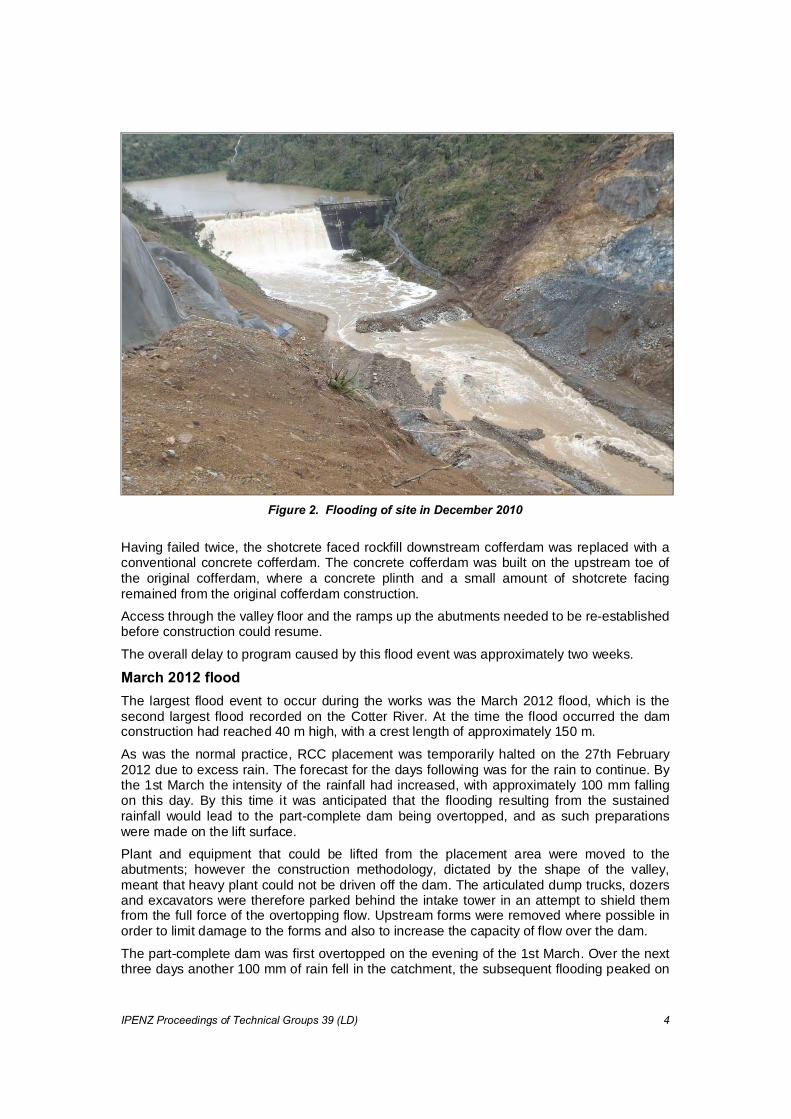
Having failed twice, the shotcrete faced rockfill downstream cofferdam was replaced with a conventional concrete cofferdam. The concrete cofferdam was built on the upstream toe of the original cofferdam, where a concrete plinth and a small amount of shotcrete facing remained from the original cofferdam construction.
Access through the valley floor and the ramps up the abutments needed to be re-established before construction could resume.
The overall delay to program caused by this flood event was approximately two weeks.
The largest flood event to occur during the works was the March 2012 flood, which is the second largest flood recorded on the Cotter River. At the time the flood occurred the dam construction had reached 40 m high, with a crest length of approximately 150 m.
As was the normal practice, RCC placement was temporarily halted on the 27th February 2012 due to excess rain. The forecast for the days following was for the rain to continue. By the 1st March the intensity of the rainfall had increased, with approximately 100 mm falling on this day. By this time it was anticipated that the flooding resulting from the sustained rainfall would lead to the part-complete dam being overtopped, and as such preparations were made on the lift surface.
Plant and equipment that could be lifted from the placement area were moved to the abutments; however the construction methodology, dictated by the shape of the valley, meant that heavy plant could not be driven off the dam. The articulated dump trucks, dozers and excavators were therefore parked behind the intake tower in an attempt to shield them from the full force of the overtopping flow. Upstream forms were removed where possible in order to limit damage to the forms and also to increase the capacity of flow over the dam.
The part-complete dam was first overtopped on the evening of the 1st March. Over the next three days another 100 mm of rain fell in the catchment, the subsequent flooding peaked on
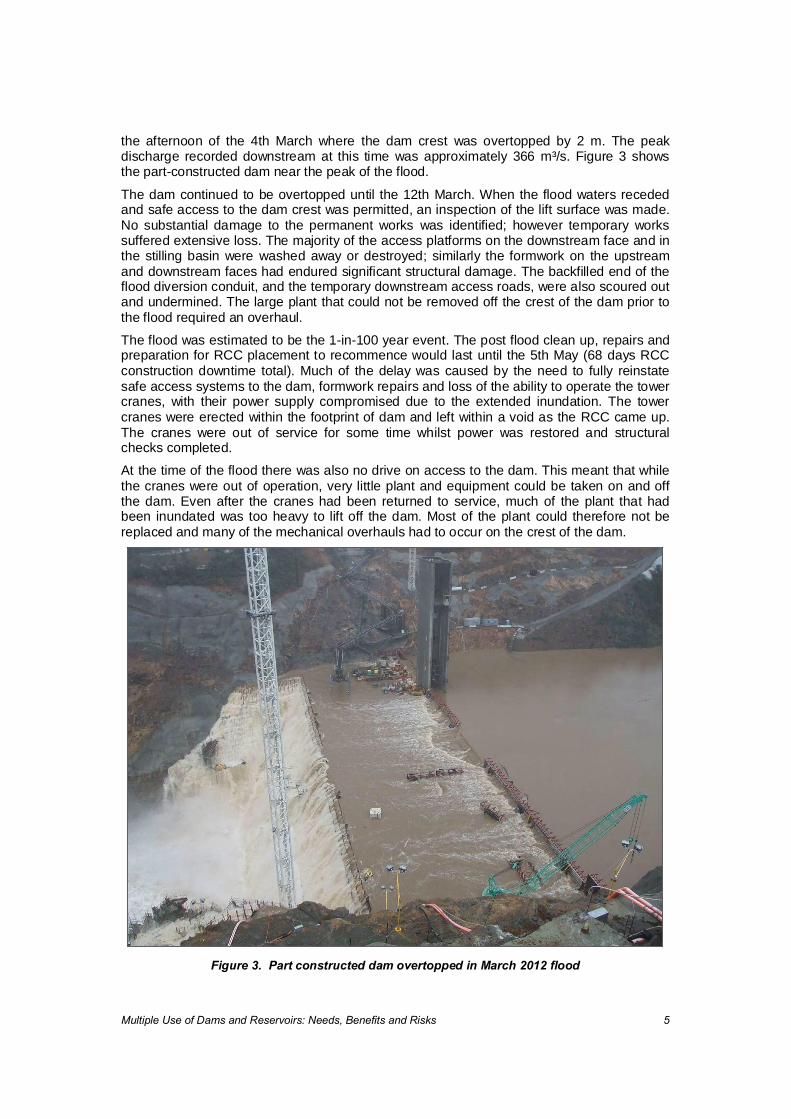
the afternoon of the 4th March where the dam crest was overtopped by 2 m. The peak discharge recorded downstream at this time was approximately 366 m³/s. Figure 3 shows the part-constructed dam near the peak of the flood.
The dam continued to be overtopped until the 12th March. When the flood waters receded and safe access to the dam crest was permitted, an inspection of the lift surface was made. No substantial damage to the permanent works was identified; however temporary works suffered extensive loss. The majority of the access platforms on the downstream face and in the stilling basin were washed away or destroyed; similarly the formwork on the upstream and downstream faces had endured significant structural damage. The backfilled end of the flood diversion conduit, and the temporary downstream access roads, were also scoured out and undermined. The large plant that could not be removed off the crest of the dam prior to the flood required an overhaul.
The flood was estimated to be the 1-in-100 year event. The post flood clean up, repairs and preparation for RCC placement to recommence would last until the 5th May (68 days RCC construction downtime total). Much of the delay was caused by the need to fully reinstate safe access systems to the dam, formwork repairs and loss of the ability to operate the tower cranes, with their power supply compromised due to the extended inundation. The tower cranes were erected within the footprint of dam and left within a void as the RCC came up. The cranes were out of service for some time whilst power was restored and structural checks completed.
At the time of the flood there was also no drive on access to the dam. This meant that while the cranes were out of operation, very little plant and equipment could be taken on and off the dam. Even after the cranes had been returned to service, much of the plant that had been inundated was too heavy to lift off the dam. Most of the plant could therefore not be replaced and many of the mechanical overhauls had to occur on the crest of the dam.
During the post-flood clean up period, a series of cross valley cracks were identified. Due to the cooling of the RCC surface, both from the inundation of the flood waters and the atmospheric conditions during the period of post-flood clean up when it was not possible to recommence the placement of RCC, -conditions arose for the development of a strong thermal gradient near the surface of the RCC. This resulted in the formation of longitudinal cracks; the cracking is discussed in greater detail below.
The original diversion strategy was based on what was considered to be an acceptable probability of the works being overtopped during the construction, the duration of the overtopping and subsequent clean up, the likely damage and environmental impact, and the cost of providing diversions of suitable capacity.
The project had the advantage of the existing Cotter Dam immediately upstream of the construction site, which provided a degree of flood mitigation for smaller rainfall events. The flood capacity of the existing dam was enhanced with the use of 2 m high flashboards installed across the spillway, and also the ability to run the reservoir 4 m below full supply level (inflows allowing) for all but two months of the construction period, when the reservoir had to be returned to 1 m below FSL to allow fish spawning.
A number of different diversion arrangements were considered in the planning stages. Each arrangement was assessed using a reservoir simulation model based on 33 years of historical rainfall and inflow records for the Cotter Catchment. Based on these simulations it was possible to estimate the likely delay, and associated delay costs, for each arrangement (BWA 2009).
It was accepted that the partially constructed dam could endure some overtopping without significant damage, thus allowing a smaller capacity diversion to be used once the dam foundation excavation was completed. This resulted in the selection of a two-stage diversion strategy, with the initial diversion structure being a 3 m diameter corrugated steel conduit placed along the floor of the valley; the second stage being a 900 mm conduit through the base of the new RCC dam. This arrangement had a 1 in 5 annual probability of its capacity being exceeded for Stage 1, and 1 in 2 AEP for Stage 2. This strategy required a period of approximately one to two months where no diversion was required; in which time the 3 m conduit would be removed and the foundation excavation completed, and then the initial RCC placed on the new dam before installing the 900 mm conduit. During this period it was intended that the existing reservoir would be drawn down 4 m below the original full supply level, giving a total freeboard of 6 m.
Both the October 2010 and December 2010 floods occurred during the abutment excavation phase of the project, while the Stage 1, the 3 m diameter diversion culvert, was in operation. Both floods exceeded the capacity of this diversion. However of a greater consequence to the security of the works were the on-going high inflows to the original dam. This meant the intended 4 m drawdown in reservoir level could not be achieved, and as such the intended flood mitigation was not available. Flooding of the construction works would therefore be more likely to occur from smaller rainfall events.
Following a review of the possible delays and costs, it became apparent that with the higher upstream reservoir levels and the forecast for above average rainfall, the basis of the original diversion strategy was no longer valid. The conditions meant that there would be an unacceptable risk of flooding the works during the two month period without a diversion and during the early stages of the RCC placement with the 900 mm diversion pipe through the new dam.
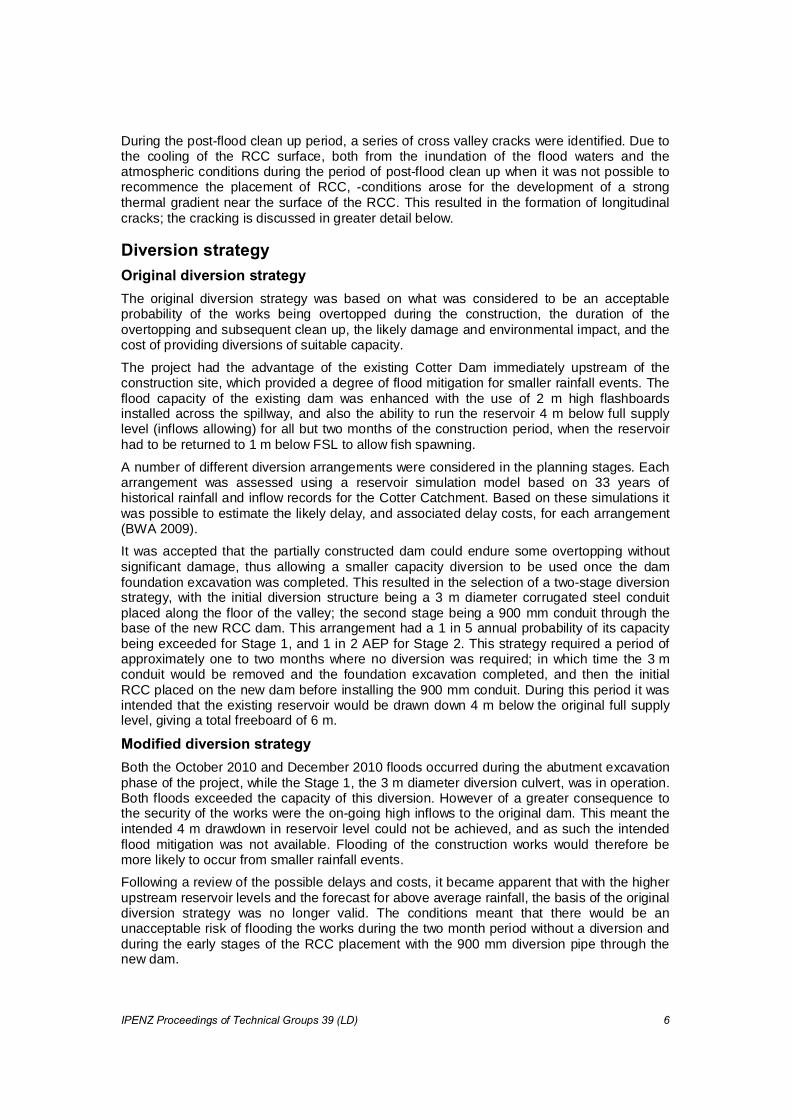
The modified diversion strategy involved the 3 m diameter culvert in the valley floor being retained in operation whilst a second 3 m diameter concrete encased diversion was constructed on the left abutment. This second diversion remains permanently encased within the dam; Figure 4 shows the encased conduit shortly after construction, and as excavations into the valley floor proceeded. Construction of the new diversion impacted on the program as excavation in the vicinity had to cease whilst it was constructed. This delayed the foundation excavation by area by one month. The total cost of the modified diversion was approximately $3 million.
The revised Stage 2 diversion also required the upstream cofferdam to be raised by approximately 4 m to accommodate the new intake. The downstream cofferdam, following its failure during the December 2010 flood, was reconstructed in concrete to reduce its likelihood of failure during subsequent overtopping events.
A vertical gate was included at the upstream face of the new dam to enable the diversion to be closed or throttled if necessary (Nitzsche 2012). To limit the impact on the program, the decision was made to concrete encase the 3 m conduit within the body of the dam and only part of the way past the stilling basin. The downstream end of the culvert was encapsulated with fill, in the form of a small fill embankment. The diversion was designed as a non-pressure conduit with a peak discharge capacity of 30m3/s. If flows were likely to exceed these limits then it was necessary to throttle the flow so as not to exceed its capacity.
On completion of all works on the upstream face of the dam, the diversion culvert was permanently closed in March 2013. A concrete plug was constructed downstream of the gate on the upstream face of the dam to ensure the diversion was sealed.
In principal the sizing of the diversion utilising a risk-based approach was sound, particularly under the Alliance delivery model, where risk costing needed to be transparent. However a number of shortcomings in the model developed for the ECD possibly resulted in a diversion capacity smaller than it should have been. Two of the more critical shortcomings were:
The delays resulting from inundation of the works were underestimated;
The modelling did not take into account the fact that the dam was to be constructed during a La Niña event, a period in which above average rainfall is likely.
The first of these was partially brought about by the calculated risks of reducing the robustness of the diversion during its construction to recover some lost time. This resulted in both of the downstream cofferdams not being fully constructed but relying on in-situ material of uncertain quality being retained as part of the cofferdam. Furthermore the original 3 m diversion culvert was not fully encased at the downstream end. Both these departures from the initial design resulted in failures during the October and December 2010 floods. Although there is no evidence that a failure of the diversion would not have occurred if it had been constructed as designed, it is clear that the likelihood of failure was higher with the ‘as constructed’ arrangement.
Irrespective of the failure of the diversion and the need to reconstruct it, the assumed period of a delay adopted for the risk model considerably underestimated the actual delay.
The second shortcoming in the model, which with hindsight proved to be significant, was the actual rainfall over the construction period being greater than the historic rainfall data used in the model. Review of the streamflow data during La Niña events should have been undertaken to investigate the sensitivity to this parameter. If the La Niña event had been included then higher rainfalls would have been modelled. There would have still been the uncertainty of the actual rainfall that should have been adopted in the model, and therefore the level of conservatism that had been included in the model, and whether this conservatism was justified.
The modified diversion strategy proved to be the correct decision; whilst it proved to be inadequate for the March 2012 flood, it reduced the duration of overtopping for that event and prevented overtopping during other periods of high flow. No detailed modelling of the original diversion arrangement with the actual rainfall data has been undertaken, but preliminary modelling indicates that if the 900 mm diversion had been retained the works would have been overtopped for a total duration in excess of 100 days with a total delay in excess of 6 months. This would have added approximately $20 million in delay costs to the project.
As discussed previously, RCC placement at the Enlarged Cotter Dam halted on the 27th February 2012 after the commencement of heavy rainfall and the subsequent flooding.
Immediately after the recession of the flood no cracking was identified on the surface of the last RCC lift. However, on the 5th April, approximately five weeks after RCC was last placed, a small crack was noted on what was then the left abutment monolith block of the dam. The crack ran adjacent to the abutment rock, and was approximately 8 m long. The site was closed the days following for the Easter long weekend; after which the crack was reinspected and found to have been intercepted by a cross valley crack. The cross valley crack extended to the transverse joint of the then left abutment monolith.
The cracks observed were routinely monitored over the coming weeks, light plastic covers were applied where possible to the lift surface in an attempt to limit further cooling of the of
the RCC and reduce the potential for further cracking. Limited coverage was however achieved on account of much of the surface being used by construction machinery and personnel in preparation for placement to resume. Prior to RCC placement resuming, cross valley cracks were found to extend most of the way across the dam (almost from one abutment to the other).
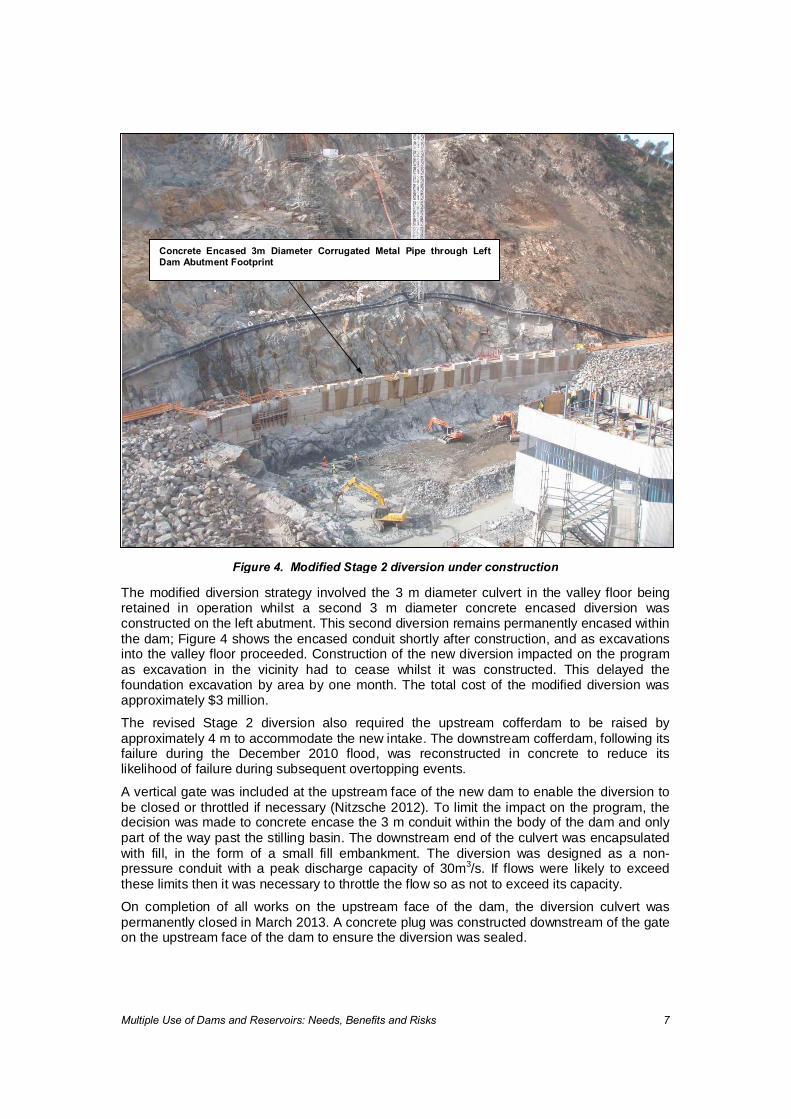
All cracking noted on the RCC lift surface was surveyed prior to placement recommencing, the crack plan is shown in Figure 5. The majority of the cracking ran longitudinally along the dam axis, the offset of these cracks from the upstream face of the dam ranged from 15 m to 23 m in the central, highest monolith blocks. In addition to the cross valley cracks, a crack was noted to extend from the left and right abutment rock towards the corner of the inclined gallery stair block outs (labelled A in Figure 5). A 7.5 m long transverse crack was also noted on the left abutment (labelled B) which connected to the abutment rock.
The cracks ranged in width from 0.2 mm to 3 mm.
The cracks are believed to have been caused by thermal shock. Prior to the flooding in March, thermocouplers installed during RCC placement showed the temperature within the body of the dam to be approximately 36°C, and 24°C at the upstream and downstream faces. Following the flood, and upon reconnection of the thermocoupler logger, the temperatures within the dam body still remained at 36°C; however the temperature had cooled at the extremities to 15°C (in the RCC, 500 mm from the faces).
The ambient temperatures in the days leading up to the first observations of the cracking on the lift surface had similarly dropped as Canberra headed into what would be a cold winter. At the time the cross valley cracks across the majority of the dam surface were found, the ambient temperatures had dropped to as low as 0°C at night.
The preparation work for the RCC placement to restart required the scabbling and cleaning of the lift surface; as well as repair of formwork, reinstatement of water and power supply
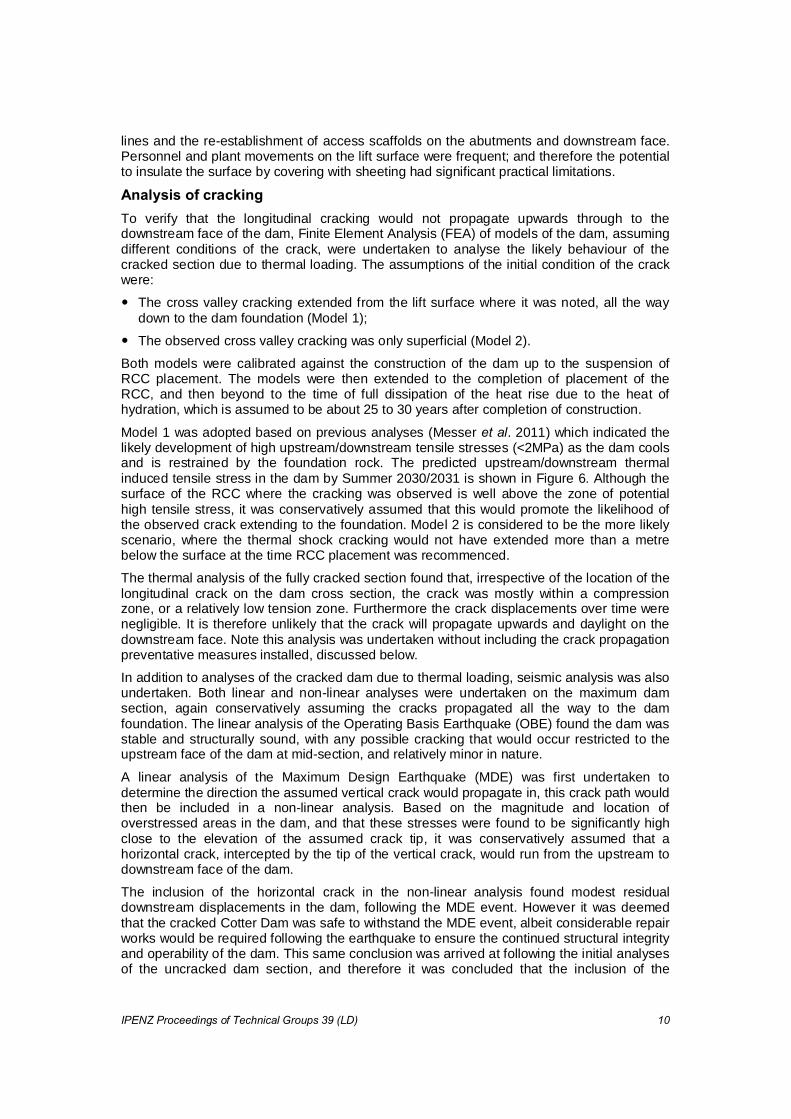
lines and the re-establishment of access scaffolds on the abutments and downstream face. Personnel and plant movements on the lift surface were frequent; and therefore the potential to insulate the surface by covering with sheeting had significant practical limitations.
To verify that the longitudinal cracking would not propagate upwards through to the downstream face of the dam, Finite Element Analysis (FEA) of models of the dam, assuming different conditions of the crack, were undertaken to analyse the likely behaviour of the cracked section due to thermal loading. The assumptions of the initial condition of the crack were:
The cross valley cracking extended from the lift surface where it was noted, all the way down to the dam foundation (Model 1);
The observed cross valley cracking was only superficial (Model 2).
Both models were calibrated against the construction of the dam up to the suspension of RCC placement. The models were then extended to the completion of placement of the RCC, and then beyond to the time of full dissipation of the heat rise due to the heat of hydration, which is assumed to be about 25 to 30 years after completion of construction.
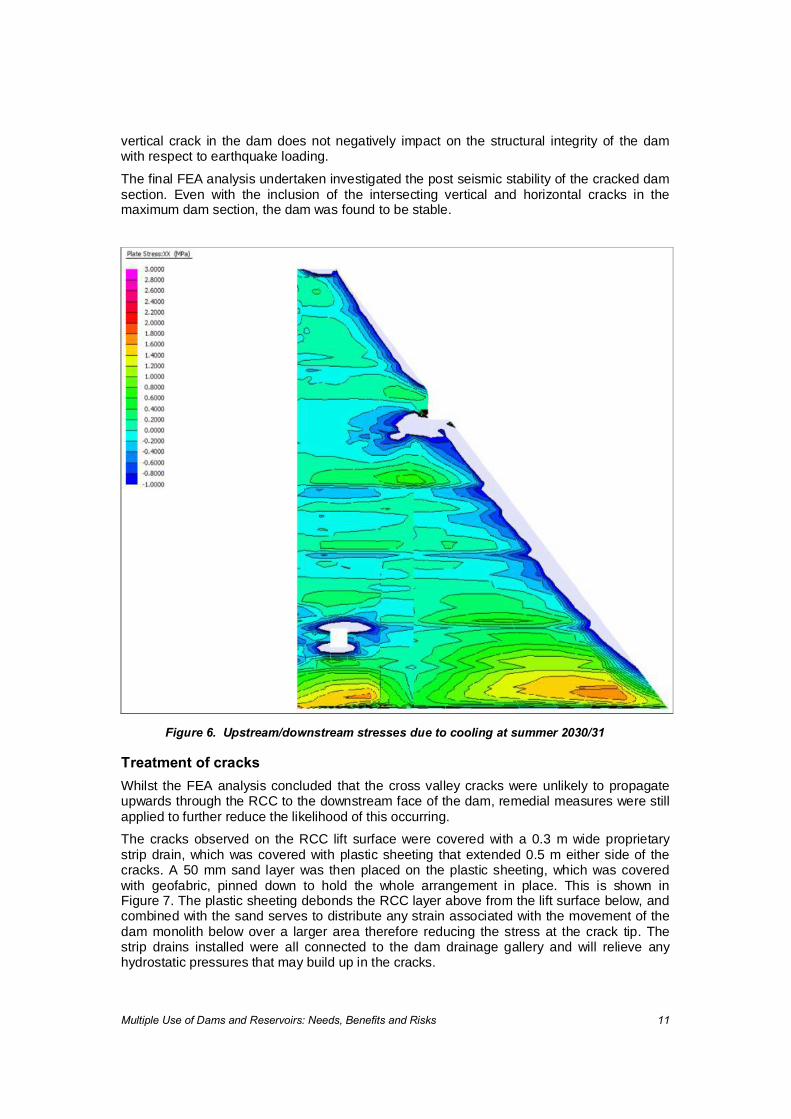
Model 1 was adopted based on previous analyses (Messer . 2011) which indicated the likely development of high upstream/downstream tensile stresses (<2MPa) as the dam cools and is restrained by the foundation rock. The predicted upstream/downstream thermal induced tensile stress in the dam by Summer 2030/2031 is shown in Figure 6. Although the surface of the RCC where the cracking was observed is well above the zone of potential high tensile stress, it was conservatively assumed that this would promote the likelihood of the observed crack extending to the foundation. Model 2 is considered to be the more likely scenario, where the thermal shock cracking would not have extended more than a metre below the surface at the time RCC placement was recommenced.
The thermal analysis of the fully cracked section found that, irrespective of the location of the longitudinal crack on the dam cross section, the crack was mostly within a compression zone, or a relatively low tension zone. Furthermore the crack displacements over time were negligible. It is therefore unlikely that the crack will propagate upwards and daylight on the downstream face. Note this analysis was undertaken without including the crack propagation preventative measures installed, discussed below.
In addition to analyses of the cracked dam due to thermal loading, seismic analysis was also undertaken. Both linear and non-linear analyses were undertaken on the maximum dam section, again conservatively assuming the cracks propagated all the way to the dam foundation. The linear analysis of the Operating Basis Earthquake (OBE) found the dam was stable and structurally sound, with any possible cracking that would occur restricted to the upstream face of the dam at mid-section, and relatively minor in nature.
A linear analysis of the Maximum Design Earthquake (MDE) was first undertaken to determine the direction the assumed vertical crack would propagate in, this crack path would then be included in a non-linear analysis. Based on the magnitude and location of overstressed areas in the dam, and that these stresses were found to be significantly high close to the elevation of the assumed crack tip, it was conservatively assumed that a horizontal crack, intercepted by the tip of the vertical crack, would run from the upstream to downstream face of the dam.
The inclusion of the horizontal crack in the non-linear analysis found modest residual downstream displacements in the dam, following the MDE event. However it was deemed that the cracked Cotter Dam was safe to withstand the MDE event, albeit considerable repair works would be required following the earthquake to ensure the continued structural integrity and operability of the dam. This same conclusion was arrived at following the initial analyses of the uncracked dam section, and therefore it was concluded that the inclusion of the
vertical crack in the dam does not negatively impact on the structural integrity of the dam with respect to earthquake loading.
The final FEA analysis undertaken investigated the post seismic stability of the cracked dam section. Even with the inclusion of the intersecting vertical and horizontal cracks in the maximum dam section, the dam was found to be stable.
Whilst the FEA analysis concluded that the cross valley cracks were unlikely to propagate upwards through the RCC to the downstream face of the dam, remedial measures were still applied to further reduce the likelihood of this occurring.
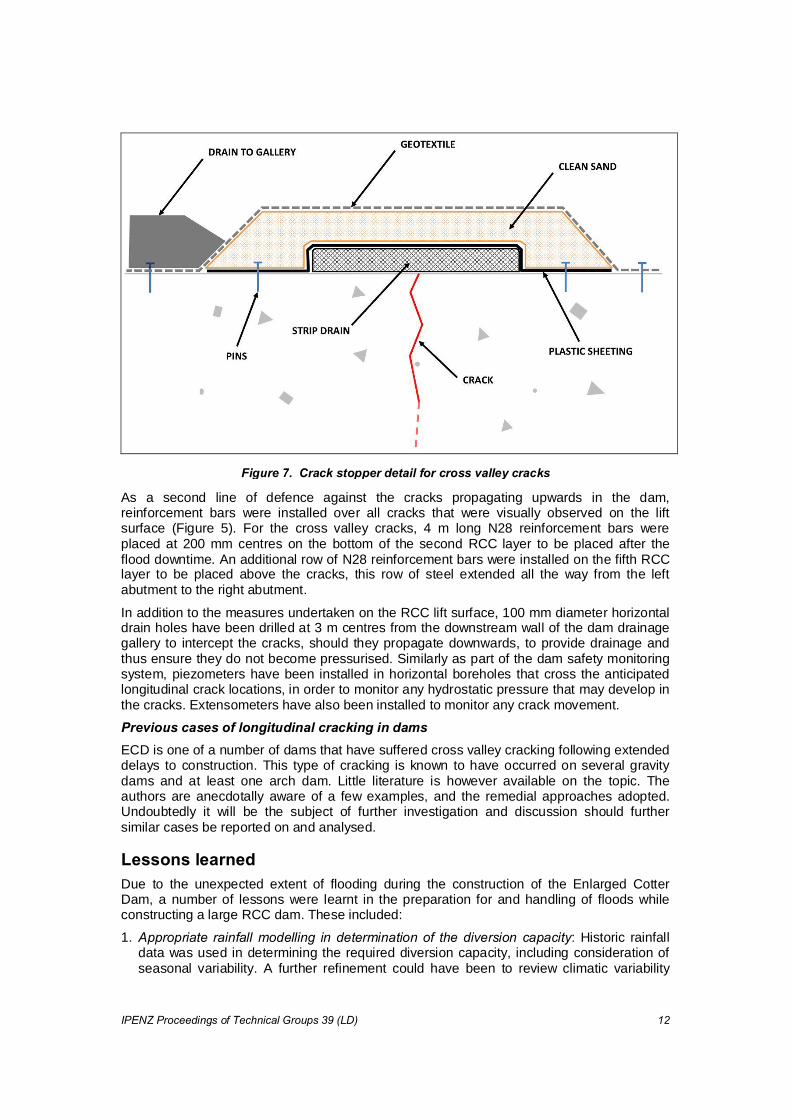
The cracks observed on the RCC lift surface were covered with a 0.3 m wide proprietary strip drain, which was covered with plastic sheeting that extended 0.5 m either side of the cracks. A 50 mm sand layer was then placed on the plastic sheeting, which was covered with geofabric, pinned down to hold the whole arrangement in place. This is shown in Figure 7. The plastic sheeting debonds the RCC layer above from the lift surface below, and combined with the sand serves to distribute any strain associated with the movement of the dam monolith below over a larger area therefore reducing the stress at the crack tip. The strip drains installed were all connected to the dam drainage gallery and will relieve any hydrostatic pressures that may build up in the cracks.
As a second line of defence against the cracks propagating upwards in the dam, reinforcement bars were installed over all cracks that were visually observed on the lift surface (Figure 5). For the cross valley cracks, 4 m long N28 reinforcement bars were placed at 200 mm centres on the bottom of the second RCC layer to be placed after the flood downtime. An additional row of N28 reinforcement bars were installed on the fifth RCC layer to be placed above the cracks, this row of steel extended all the way from the left abutment to the right abutment.
In addition to the measures undertaken on the RCC lift surface, 100 mm diameter horizontal drain holes have been drilled at 3 m centres from the downstream wall of the dam drainage gallery to intercept the cracks, should they propagate downwards, to provide drainage and thus ensure they do not become pressurised. Similarly as part of the dam safety monitoring system, piezometers have been installed in horizontal boreholes that cross the anticipated longitudinal crack locations, in order to monitor any hydrostatic pressure that may develop in the cracks. Extensometers have also been installed to monitor any crack movement.
ECD is one of a number of dams that have suffered cross valley cracking following extended delays to construction. This type of cracking is known to have occurred on several gravity dams and at least one arch dam. Little literature is however available on the topic. The authors are anecdotally aware of a few examples, and the remedial approaches adopted. Undoubtedly it will be the subject of further investigation and discussion should further similar cases be reported on and analysed.
Due to the unexpected extent of flooding during the construction of the Enlarged Cotter Dam, a number of lessons were learnt in the preparation for and handling of floods while constructing a large RCC dam. These included:
1. : Historic rainfall data was used in determining the required diversion capacity, including consideration of seasonal variability. A further refinement could have been to review climatic variability

relating to the Southern Oscillation index. The likelihood of above average rainfall increases during La Niña events, which happened to coincide with the dams construction.
2. : When using a risk-based approach to sizing a diversion it is important that all the inputs are calculated as accurately as possible. For all three flood events which delayed the works, the actual required time for the clean-up exceeded what had been modelled. If longer construction delays were assumed, this may have influenced the outcome of the analysis. Ultimately, the risk assessment is only a tool and the spread of possible outcomes is quite broad, given the variable nature of rainfall. Other drivers may, in the end, influence the final sizing of the diversion.
3. : Amongst many other factors, the consequences of inundation should be considered when designing the temporary works. Often the diversion is designed to provide adequate protection to the partially constructed permanent works. However damage to critical temporary works can have significant impacts on the overall progress of the project.
In the case of the ECD the consequences of overtopping could have been significantly reduced if drive on/off access was available. Similarly, tower cranes are relatively vulnerable to inundation. This is not to say that what was provided at ECD was inappropriate (as there were several other drivers to consider), rather these factors are worthy of consideration in construction planning.
4. : The construction of the ECD was fortunate in that it was possible to change the diversion strategy part way through the works. Had the changes not been made, the works would have been delayed considerably longer than it was.
5. : The longitudinal cracking of the dam occurred during the extended delay following the March 2012 flood. If the surface had been protected from the low overnight temperatures then this cracking may not have occurred. There was however practical constraints that affected the ability to implement such measures at ECD. Access immediately after the flood was limited (including crane support); similarly clean-up operations required numerous plant and personnel movements over the RCC surface in preparation for placement to recommence. Nonetheless, the occurrence of cross valley cracks at ECD emphasises the need for surface insulation to be installed during extended delays to RCC placement, where possible.
6. : There is little available literature on the phenomenon of longitudinal cracking of mass concrete dams, although it is known to have occurred on numerous dams under different conditions. It would have been useful to have access to other dam experience in longitudinal cracking in assessing the conditions at ECD and in developing remedial actions. The industry would benefit from further research and further publication of project experience in this area.
The Enlarged Cotter Dam, the highest RCC dam in Australia, was constructed during a period of above average rainfall including three floods which inundated the works and caused notable delays. The original diversion strategy was based on historical rainfall records, which were representative of the long-term average rainfall. However during construction it was recognised that the diversion capacity was not sufficient to provide suitable protection to the works, given the above average rainfall. The decision was made to redesign the diversion to significantly increase its capacity. Although this came at a cost of $3 million dollars and associated program delays, it proved to be worthwhile as it reduced the delays to the works by an estimated 6 months, compared to retaining the original diversion design.
One of the consequences of the flood delays was the formation of longitudinal cracking due to thermal shock. This was analysed extensively to determine if the cracks were likely to propagate and compromise the stability of the dam. Although the analysis indicated that they would not propagate, a series of defensive measures were included in the dam to further reduce this possibility.
Despite the challenging conditions during construction, the dam began impounding water in March 2013 with the closure of the diversion, and construction was successfully completed in early September 2013.
We acknowledge the permission granted by ACTEW Water and the BWA* partners for permitting publication of this paper.
*The Bulk Water Alliance comprises of ACTEW Water, the owner, the designer GHD and Abigroup and John Holland, the constructors.
BOM 2012. Bureau of Meteorology - Record Breaking La Niña Events. Melbourne 2012.
BWA 2009. Bulk Water Alliance (BWA) Enlarged Cotter Dam – Design Criteria Report. Canberra 2009.
Messer, C; Lopez, F; Laxman, M. 2011. Finite Element Transient Thermal Analysis of the Enlarged Cotter Dam. ANCOLD 2011.
Nitzsche, F. 2012. Enlarged Cotter Dam Diversion Gate Design – The Challenge and the Test. ANCOLD 2012.