Embed Size (px)
Citation preview

1
Category-Independent Object Proposals withDiverse Ranking
Ian Endres, Student Member, IEEE, and Derek Hoiem, Member, IEEE
Abstract—We propose a category-independent method to produce a bag of regions and rank them, such that top-ranked regionsare likely to be good segmentations of different objects. Our key objectives are completeness and diversity: every object should haveat least one good proposed region, and a diverse set should be top-ranked. Our approach is to generate a set of segmentations byperforming graph cuts based on a seed region and a learned affinity function. Then, the regions are ranked using structured learningbased on various cues. Our experiments on BSDS and Pascal VOC 2011 demonstrate our ability to find most objects within a smallbag of proposed regions.
Index Terms—Vision and Scene Understanding, Segmentation, Object Recognition
F
1 INTRODUCTION
HUMANS have an amazing ability to localize objectswithout recognizing them. This ability is crucial
because it enables us to quickly and accurately identifyobjects and to learn more about those we cannot recog-nize.
In this paper, we propose an approach to give com-puters this same ability for category-independent local-ization. Our goal is to automatically generate a smallnumber of regions in an image, such that each object iswell-represented by at least one region. If we succeed,object recognition algorithms would be able to focuson plausible regions in training and improve robustnessto highly textured background regions. The recognitionsystems may also benefit from improved spatial support,possibly leading to more suitable coordinate frames thana simple bounding box. Methods are emerging thatcan provide descriptions for unknown objects [1], [2],but they rely on being provided the object’s location.The ability to localize unknown objects in an imagewould be the first step toward having a vision systemautomatically discover new objects.
Clearly, the problem of category-independent objectlocalization is extremely challenging. Objects are some-times composed of heterogeneous colors and textures;they vary widely in shape and may be heavily oc-cluded. Yet, we have some cause for hope. Studies ofthe human visual system suggest that a functioningobject localization system can exist in the absence of afunctioning object identification system. Humans withdamage to temporal cortex frequently exhibit a profoundinability to name objects presented to them, and yetperform similar to healthy controls in tasks that requirethem to spatially manipulate objects [3]. Many objects
• I. Endres and D. Hoiem are at the Department of Computer Science,University of Illinois at Urbana-Champaign.
are roughly homogeneous in appearance, and recentwork [4] demonstrates that estimated geometry andedges can often be used to recover occlusion boundariesfor free-standing objects. While we cannot expect tolocalize every object, perhaps we can at least producea small bag of proposed regions that include most ofthem.
Our strategy is to guide each step of the localizationprocess with estimated boundaries, geometry, color, andtexture. First, we create seed regions based on the hi-erarchical occlusion boundaries segmentation [4]. Then,using these seeds and varying parameters, we generatea diverse set of regions that are guided toward objectsegmentations by learned affinity functions. Finally, wetake a structured learning approach to rank the regionsso that the top-ranked regions are likely to correspond todifferent objects. We train our method on segmented ob-jects from the Berkeley Segmentation Dataset (BSDS) [5],and test it on BSDS and the Pascal 2011 segmentationdataset [6], [7]. Our experiments demonstrate our sys-tem’s ability for category-independent localization in away that generalizes across datasets. We also evaluatethe usefulness of various features for generating pro-posals and the effectiveness of our structured learningmethod for ranking.
2 RELATED WORK
Category-Dependent Models: By far, the most commonapproach to object localization is to evaluate a largenumber of windows (e.g., [8], [9]), which are foundby searching naively over position and scale or byvoting from learned codewords [10], [11], distinctivekeypoints [12], [13], or regions [14]. These methodstend to work well for objects that can be well-definedaccording to a bounding box coordinate frame whensufficient examples are present. However, this approachhas some important drawbacks. First, it is applicable

2
only to trained categories, so it does not allow thecomputer to ask “What is this?” Second, each newdetector must relearn to exclude a wide variety oftextured background patches and, in evaluation, mustrepeatedly search through them. Third, these methodsare less suited to highly deformable objects becauseefficient search requires a compact parameterization ofthe object. Finally, the proposed bounding boxes do notprovide information about occlusion or which pixelsbelong to the object. These limitations of the category-based, window-based approach supply some of the mo-tivation for our own work. We aim to find likely objectcandidates, independent of their category, which canthen be used by many category models for recognition.Our proposed segmented regions provide more detail toany subsequent recognition process and are applicablefor objects with arbitrary shapes.
Segmentation and Bags of Regions: Segmentation haslong been proposed as a pre-process to image analy-sis. Current algorithms to provide a single bottom-upsegmentation (e.g., [15], [16]) are not yet reliable. Forthis reason, many have proposed creating hierarchicalsegmentations (e.g., [17], [4], [18]) or multiple overlap-ping segmentations (e.g., [19], [20], [21], [22]). Even thesetend not to reliably produce good object regions, soMalisiewicz et al. [20] propose to merge pairs and tripletsof adjacent regions, at the cost of producing hundredsof thousands of regions. In our case, the goal is tosegment only objects, such as cars, people, mugs, andanimals, which may be easier than producing perceptu-ally coherent or semantically valid partitionings of theentire image. This focus enables a learning approach,in which we guide segmentation and proposal rankingwith trained classifiers.
An alternative approach is to attempt to segmentpixels of foreground objects [23] or salient regions [24],[25]. However, these approaches may not be suitable forlocalizing individual objects in cluttered scenes, becausea continuous foreground or salient region may containmany objects.
Two concurrent works have also considered gener-ating object proposals as a preprocess for subsequentstages of object recognition. First, Alexe et al. [26] con-sider an “objectness” measure over bounding boxes,which they use to bias a sampling procedure for poten-tial object bounding boxes. This method aims to be fast,on the order of several seconds per image, which restrictsthem to a less expressive bounding-box based repre-sentation. Alternatively, Carreira and Sminchisescu [27]consider a similar region proposal and ranking pipelineto ours. Regions are proposed by sampling points from agrid on the image which are used to seed the foregroundcolor model of a segmentation. The border of the imageis used to seed the background, and a per-pixel segmen-tation is generated with a graph-cut over simple colorcues. The resulting regions are ranked through classi-fication based on gestalt cues with a simple diversitymodel. Our approach instead guides segmentation with
a learned affinity function, rather than setting the imageborder to background. We also differ in our structuredlearning approach to diverse ranking.
To summarize our contributions: 1) we incorporateboundary and shape cues, in addition to low-level cuesto generate diverse category-independent object regionproposals, and 2) introduce a trained ranking procedurethat produces a small diverse set of proposals that aimto cover all objects in an image. We thoroughly evaluateeach stage of the process, and demonstrate that it cangeneralize well across datasets for a variety of objectcategories.
3 OVERVIEW OF APPROACHSince our goal is to propose candidates for any objectin an image, each stage of our process must encouragediversity among the proposals, while minimizing thenumber of candidates to consider. Our procedure is sum-marized in Figure 1. To generate proposals for objects ofarbitrary shape and size, we adopt a segmentation basedproposal mechanism that is encouraged to only proposeregions from objects.
Rather than considering only local color, texture, andboundary cues, we include long range interactions be-tween regions of an image. We do this by consideringthe affinity for pairs of regions to lie on the same object.This set of regions is chosen from a hierarchical segmen-tation computed over occlusion boundaries. To generatea proposal, we choose one of these regions to seed thesegmentation, and compute the probability that eachother region belongs to the same object as this seed. Theaffinities are then transferred to a graph over superpixelsfrom which we compute segmentations with a variety ofparameters. By computing the affinities over regions firstand then transferring them to superpixels, we get thebenefit of more reliable predictions from larger regionswhile maintaining the flexibility of a superpixel basedsegmentation. After repeating this process for all seedregions, we obtain an initial bag of proposals.
In our effort to discover a diverse set of objects,our proposal mechanism may generate many redun-dant or unlikely object candidates. In both cases, wewould like to suppress undesirable proposals, allowingus to consider better candidates first. This motivatesa ranking procedure that provides an ordering for abag of proposals which simultaneously suppresses bothredundant and unlikely candidates. We can then uncovera diverse set of the good object proposals with far fewercandidates.
Our ranker incrementally adds proposals, from best toworst, based on the combination of an object appearancescore and a penalty for overlapping with previouslyadded proposals. By taking into account the overlapwith higher ranked proposals, our ranker ensures that re-dundant regions are suppressed, forcing the top rankedregions to be diverse. This is especially important inimages with one dominant object and several “auxiliary”objects.

3
Input Image Hierarchical Segmentation Proposed Regions Ranked Regions
Fig. 1. Our pipeline: compute a hierarchical segmentation, generate proposals, and rank proposed regions. At eachstage, we train classifiers to focus on likely object regions and encourage diversity among the proposals, enabling thesystem to localize many types of objects. See section 3 for a more detailed overview.
4 PROPOSING REGIONS
We first generate a large and diverse bag of proposalsthat are directed to be more likely to be object regions.Each proposal is generated from a binary segmentation,which is seeded with a subregion of the image. This seedis assumed to be foreground, and a segmenter selectspixels likely to belong to the same foreground object asthe seed.
4.1 Hierarchical SegmentationWe use regions and superpixels from a hierarchicalsegmentation as the building blocks for our proposalmechanism. To generate the hierarchical segmentation,we use the output of the occlusion boundary algorithmfrom Hoiem et al. [4]. The occlusion boundary algorithmoutputs four successively coarser segmentations, withprobabilities for occlusion and figure/ground for eachboundary in the segmentation. From each segmentation,we compute a probability of boundary pixel map and afigure/ground probability pixel map, and then averageover the segmentations. Then, we create our hierarchicalsegmentation with agglomerative grouping based onboundary strength, as in [17], and we use the boundarystrength and figure/ground likelihoods as features.
4.2 SeedingA seed serves as the starting point for an object proposal.The appearance and boundaries around the seed areused to identify other regions that might belong to thesame object. Seeds are chosen from the hierarchical seg-mentation such that they are large enough to computereliable color and texture distributions (≥ 20 ∗ 20 pixels).This results in about 300 seed regions per image. Also,we remove regions with boundaries weaker than 0.005, since these are likely to just be a portion of a largerregion. Stronger boundaries also facilitate the use ofboundary cues to determine the layout of the object withrespect to the regions.
4.3 Generating SegmentationsTo generate a proposal, we infer a foreground / back-ground labeling l, li ∈ {0, 1} over superpixels. Givena seed region, defined by a set of superpixels S, we
construct a CRF that takes into account each superpixel’saffinity for the seed region and the probability of bound-aries between adjacent superpixels:
P (l|X,S, γ, β) ∝ exp
(∑i
f(li;S,X, γ)
+ β∑{i,j}∈N
g(li, lj ;X)
)(1)
Here, f(li;S,X, γ) is the superpixel affinity term, in-ferred from image features X , and g(li, lj ;X) is the edgecost between adjacent superpixels (defined by set ofneighbors N ). This CRF is parametrized by the fore-ground bias γ and the affinity/edge trade-off β. Byvarying these parameters for each seed, we can producea more diverse set of proposals. We choose seven γvalues uniformly from [−2, 1], and eight β values spacedlogarithmically from [0, 10]. These ranges were selectedon the training set to give the best tradeoff between max-imizing recall and minimizing the number of proposalsgenerated.
4.3.1 Region Affinity
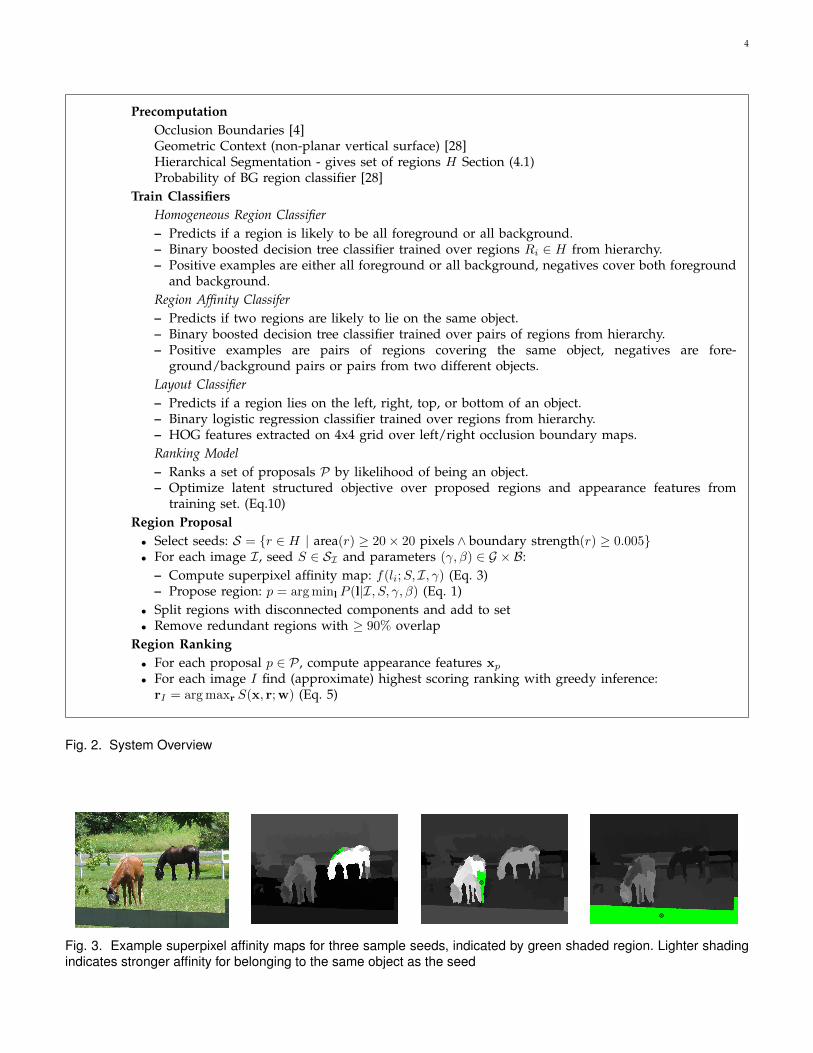
To compute the superpixel affinity f(li;S, I, γ), we firstcompute the affinity between the seed S and each regionR in the hierarchical segmentation, and then transferthese region predictions to individual superpixels. Forexamples of superpixel affinities for different seeds, seeFigure 3. We learn the probability that region R andseed S lie on the same object (P (lR|S, I)) with a boosteddecision tree classifier. Positive training examples aregenerated from pairs of regions that lie on the sameobject. Negative examples use pairs with one regionlying on an object, and the other region lying on anotherobject or the background.
Features: The classifier uses features for cohesion,boundary, and layout, as summarized in Table 1. Cohe-sion is encoded by the histogram intersection distancesof color and texture (P1). Boundary cues are encoded byconsidering the cost to pass across boundaries from oneregion to the other. This path across boundaries is thestraight line between their centers of mass (P2).
We also introduce a new layout feature. Given occlu-sion boundaries and figure/ground labels, we predict
4
PrecomputationOcclusion Boundaries [4]Geometric Context (non-planar vertical surface) [28]Hierarchical Segmentation - gives set of regions H Section (4.1)Probability of BG region classifier [28]
Train ClassifiersHomogeneous Region Classifier– Predicts if a region is likely to be all foreground or all background.– Binary boosted decision tree classifier trained over regions Ri ∈ H from hierarchy.– Positive examples are either all foreground or all background, negatives cover both foreground
and background.Region Affinity Classifer– Predicts if two regions are likely to lie on the same object.– Binary boosted decision tree classifier trained over pairs of regions from hierarchy.– Positive examples are pairs of regions covering the same object, negatives are fore-
ground/background pairs or pairs from two different objects.Layout Classifier– Predicts if a region lies on the left, right, top, or bottom of an object.– Binary logistic regression classifier trained over regions from hierarchy.– HOG features extracted on 4x4 grid over left/right occlusion boundary maps.Ranking Model– Ranks a set of proposals P by likelihood of being an object.– Optimize latent structured objective over proposed regions and appearance features from
training set. (Eq.10)Region Proposal• Select seeds: S = {r ∈ H | area(r) ≥ 20× 20 pixels ∧ boundary strength(r) ≥ 0.005}• For each image I, seed S ∈ SI and parameters (γ, β) ∈ G × B:
– Compute superpixel affinity map: f(li;S, I, γ) (Eq. 3)– Propose region: p = arg minl P (l|I, S, γ, β) (Eq. 1)
• Split regions with disconnected components and add to set• Remove redundant regions with ≥ 90% overlap
Region Ranking• For each proposal p ∈ P , compute appearance features xp• For each image I find (approximate) highest scoring ranking with greedy inference:
rI = arg maxr S(x, r; w) (Eq. 5)
Fig. 2. System Overview
Fig. 3. Example superpixel affinity maps for three sample seeds, indicated by green shaded region. Lighter shadingindicates stronger affinity for belonging to the same object as the seed

5
TABLE 1Features computed for pairs of regions for predicting thelikelihood that the pair belongs to the same object. These
features can capture non-local interactions betweenregions, producing better segmentations.
Feature Description LengthP1. Color,Texture histogram intersection 2P2. Sum,Max boundary strength between centers of mass 2L1. Left+Right layout agreement 1L2. Top+Bottom layout agreement 1L3. Left+Right+Top+Bottom layout agreement 1
whether a particular region is on the left, right, top, bot-tom, or center of the object. These predictions are madeby logistic regression classifiers based on histograms ofocclusion boundary orientations, weighted by the pre-dicted probabilities. Separate histograms are computedfor figure and ground predictions. As a feature, wemeasure whether the layout predictions for two regionsare consistent with them being on the same object. Forexample, if one region predicts that it is on the left ofthe object and a second region to the right of the firstpredicts that it is on the right side of the object, thoseregions are consistent. We construct a layout score forhorizontal, vertical, and overall agreement (L1-L3).
Computing Superpixel Scores: Since the CRF is de-fined over superpixels, the region affinity probabilitiesare transferred to each superpixel i by averaging overthe regions that contain it. The terms of this averageare weighted by the probability that each region Ris homogeneous (P (HR)), which is predicted from theappearance features in Table 2:
P (li = 1|S, I) =
∑{R|i∈R} P (HR) · P (lR = 1|S, I)∑
{R|i∈R} P (HR). (2)
Note that we now have labels for superpixels (li) andfor regions (lR). We use P (li|S, I) to compute the finalaffinity term f(li;S, I, γ):
f(li;S, I, γ) =
0 : li = 1, i ∈ S∞ : li = 0, i ∈ Sln(P (li=1|I)P (li=0|I)
)+ γ : li = 1, i 6∈ S
(3)
The first two terms ensure that superpixels belongingto the seed are labeled foreground.
4.3.2 Edge CostThe edge cost enforces a penalty for assigning differentlabels to adjacent superpixels when their separatingboundary is weak. This boundary strength is computedfrom the occlusion boundary estimates for each pair ofadjacent superpixels i, j: P (Bi,j |I).
g(li, lj ; I) =
{0 : li = lj− lnP (Bi,j |I) : li 6= lj
(4)
This edge cost produces a submodular CRF, so ex-act inference can be computed quickly with a singlegraph-cut [29] for each seed and parameter combination.
Proposals with disconnected components are split andthe new components are added to the set, and highlyoverlapping (≥ 90%) proposals are pruned. Further non-maximum suppression is handled in the ranking stage.
5 RANKING PROPOSALS
We now introduce a ranker that attempts to order pro-posals, such that each object has a highly ranked pro-posal. This ranker encourages diversity in the proposalsallowing us to achieve our goal of discovering all ofthe objects in the image. Below, we detail our objec-tive function, which encourages top-ranked regions tocorrespond to different objects and more accurate objectsegmentations to be ranked higher. Then, we explain theimage features that we use to rank the regions. Finally,we describe the structured learning method for trainingthe ranker.
5.1 Formulation
By writing a scoring function S(x, r; w) over the set ofproposals x and their ranking r, we cast the rankingproblem as a joint inference problem, allowing us to takeadvantage of structured learning. The goal is to find theparameters w such that S(x, r; w) gives higher scoresto rankings that place proposals for all objects in highranks.
S(x, r; w) =∑i
α(ri) ·(
wTaΨ(xi)−wT
p Φ(ri)
)(5)
The score is a combination of appearance features Ψ(x)and overlap penalty terms Φ(r), where r indicates therank of a proposal, ranging from 1 to the number ofproposals M . This allows us to jointly learn the appear-ance model and the trade-off for overlapping regions.Φ(r) is the concatenation of two vectors Φ1(r),Φ2(r):Φ1(r) penalizes regions with high overlap with previ-ously ranked proposals, and Φ2(r) further suppressesproposals that overlap with multiple higher ranked re-gions. The second penalty is necessary to continue toenforce diversity after many proposals have at least oneoverlapping proposal. Since the strength of the penaltyshould depend on the amount of overlap (regions with90% overlap should be suppressed more than regionswith 50%) we want to learn overlap specific weights. Todo this, we quantize the overlaps into bins of 10% andmap the values to a 10 dimensional vector q(ov) with 1for the bin it falls into and 0 for all other bins.
Φ1(ri) = q
(max
{j|rj<ri}ov(i, j)
)(6)
Φ2(ri) =∑
{j|rj<ri}
q (ov(i, j)) (7)
The overlap score between two regions is computedas the area of their intersection divided by their union,

6
TABLE 2Features used to describe the appearance of a proposal
region. It is important that each of these featuresgeneralize across all object categories, including ones
never seen during training.
Feature Description LengthB1. Mean,max probability that exterior occludes 2B2. Mean,max probability of exterior being occluded 2B3. Mean,max probability of exterior boundary 2B4. Mean,max probability of interior boundary 2S1. Min,mean,max,max-min background probability 4S2. Min,mean,max,max-min geometric context probabilities 16S3. Color,texture background hist. intersection (local) 2S4. Color,texture background hist. intersection (global) 2
with Ai indicating the set of pixels belonging to regioni:
ov(i, j) =|Ai ∩Aj ||Ai ∪Aj |
(8)
Each proposal’s score is weighted by α(r), a monotoni-cally decreasing function. Because higher ranked propos-als are given more weight, they are encouraged to havehigher scores. We found that the specific choice of α(r)is not particularly important, as long as it falls to zerofor a moderate rank value. We use α(r) = exp
((r−1)2σ2
),
with σ = 100.Computing maxr S(x, r; w) cannot be solved exactly,
so we use a greedy approximation that incrementallyadds the proposal with the maximum marginal gain. Wefound that this works well for a test problem where fullenumeration is feasible, especially when ov(·, ·) is sparse,which is true for this ranking problem.
5.2 Region Representation
The appearance features Ψ(x) characterize general prop-erties for typical object regions, as summarized in Ta-ble 2. Since this is a category-independent ranker, wecannot rely on finely tuned category-dependent shapeand appearance models. However, we can expect ob-ject boundaries to respect occlusion boundaries, so weencode the probability that the exterior is occluded by(B1) or occluding another region (B2), and the overallboundary strength (B3). We also encode the probabilityof interior boundaries (B4), which we expect to be small.
Additionally, certain “stuff-like” regions can bequickly identified as background, such as grass andsidewalks, so we learn a pixel based probability ofbackground classifier on LabelMe [30], and characterizethe response within the region (S1). This is learned usingthe region based classifiers from [28]. We also use theconfidence of the vertical, porous, solid, and sky geo-metric classes using trained classifiers from [28], whichis noted to often correspond to object and backgroundclasses (S2).
Finally, we encode the differences between color andtexture distributions between the object and background.We compute the difference in histograms between the
object and two regions: the local background regionsurrounding the object (S3) and the entire background(S4). The local background is defined by any superpixelsthat are at most two superpixels away from the proposedregion.
5.3 LearningTo solve the structured learning problem, we use themargin-rescaled formulation of latent max-margin struc-tured learning [31]. Here the objective is find a linearweighting w such that the highest scoring zero-loss rank-ing for each image scores higher than every incorrectranking by a margin defined by the loss L. Below theobjective is written in unconstrained form:
minw
1
2||w||2 + C
∑n
maxr̂∈P (n)
S(x(n), r̂; w
)+ L(O(n), r̂)
− C∑n
maxr∈P (n):
L(O(n),r)=0
S(x(n), r; w
)(9)
s.t. wp ≥ 0
Here, for image n, O(n) defines the set of ground truthregions for each image, P (n) is the set of valid labelings(the set of permutations over regions), r defines thehighest scoring correct (zero-loss) ranking, and r̂ is thehighest scoring incorrect ranking.
Loss: The loss L requires that each object o in the setof objects O should have high overlap with a highlyranked proposal. The loss has penalties for several levelsof overlap τ , ranging from 50% to 100% in intervals of5%. Since this loss is cumulative, i.e. a proposal with100% overlap will contribute to the loss for every τ , itencourages the highest quality region for each object tohave the highest rank:
L(O, r̂) =1
|O||T |∑τ∈T
∑o∈O
min{i|ov(i,o)≥τ}
ri −KO. (10)
The constant KO is subtracted so that the lowest possibleloss for a given ground truth is zero.
To learn this latent structured model, we iterate be-tween finding the highest scoring zero-loss ranking foreach image, and solving the structured learning prob-lem with the fixed ground truth structure. To learn thestructured subproblem we use a cutting-plane basedoptimization with alternates between finding the mostviolate constraint and updating w with the new con-straints, and repeat until the change in w is small.
Initialization: Since the structured learning problemhas latent variables (i.e. which zero loss ranking touse), the resulting objective function is non-convex andrequires a strong initialization to perform well. To ini-tialize, we first train a binary classifier over appearancefeatures Ψ using a sampling of good regions (≥ 65%overlap) and bad regions (≤ 33% overlap). We then do acoordinate descent search for the weight of each bin of

7
Fig. 4. Sample object annotations for BSDS. Each solidcolor corresponds to a distinct annotated object. All otherpixels are considered background.
the penalty term that minimizes the loss. We do a singlepass through the variables ordered in ascending bin size.
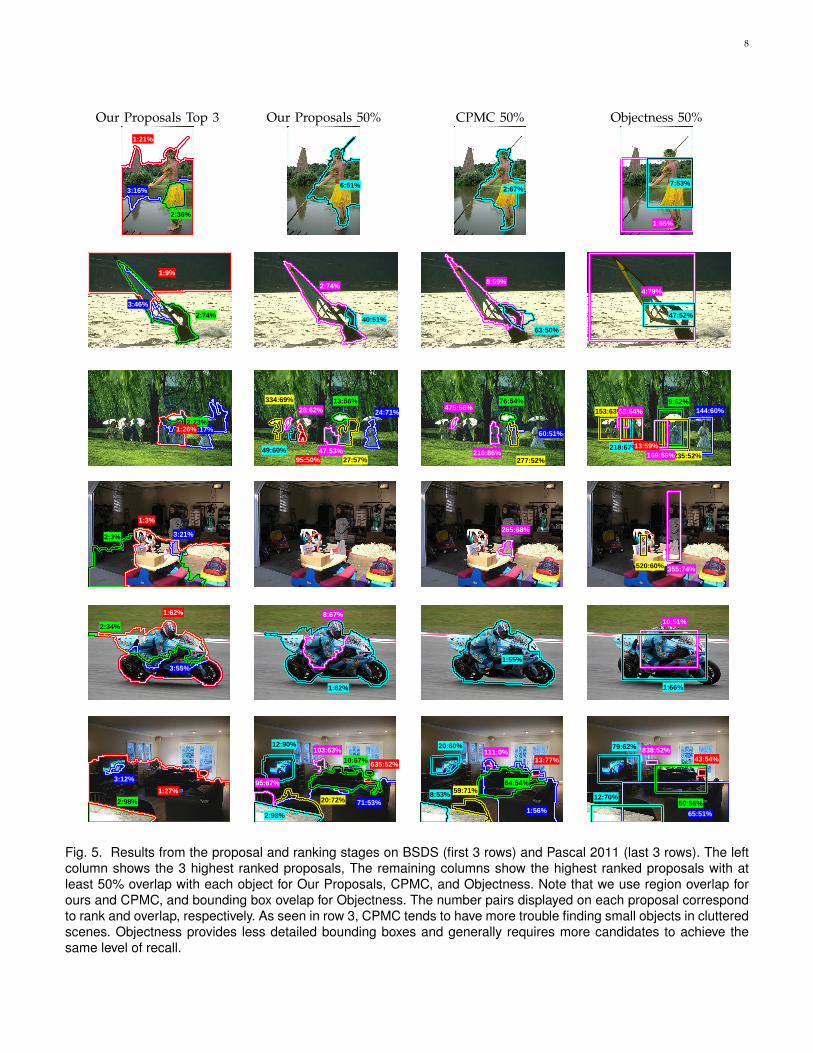
6 EXPERIMENTS AND RESULTSWe perform experiments on the Berkeley SegmentationDataset (BSDS) [5] and Pascal VOC 2011 [6]. All trainingand parameter selection is performed on the BSDS train-ing set, unless otherwise noted, and results are evaluatedon BSDS test and the Pascal validation set. Qualitativeproposal results from both Pascal and BSDS are sampledin Figure 5.
Annotation: For both datasets, a ground truth seg-mentation is provided for each object. For BSDS, welabel object regions by merging the original groundtruth segments so that they correspond to objects. Objectmasks are non-overlapping subregions of the image thatcorrespond to “things” with a definite shape, while“stuff”-type regions with indeterminate shape, such assky and grass, are excluded. Regions such as buildingsand trees are excluded since they are typically part of thebackground scene rather than distinct elements withinit. There are an average of 2.6 annotated objects ineach BSDS image. See Figure 4 for sample annotations.Note that since annotations are derived directly from theboundaries of BSDS, small objects without boundariescannot be annotated, such as the cars in the street scene.
6.1 BaselinesWe compare our method with two sets of baselines.First, we compare to the bottom-up hierarchical segmen-
TABLE 3Comparison of features for generating proposals: affinity
classification (AUC), recall @ 50% overlap, and bestsegment score (BSS).
BSDS Pascal 2011Feature AUC Recall BSS AUC Recall BSSColor, Texture (P1) 75.0 77.0 65.7 71.5 74.9 63.8C,T + Boundary (P1,P2) 79.8 80.2 66.3 78.0 75.7 64.5C,T + Layout (P1,L1-L3) 77.5 83.4 67.2 72.6 77.2 65.4All (P1,P2,L1,L2,L3) 80.2 79.7 66.2 77.2 76.2 64.9
tations generated in Section 4.1. Second, we compareto the contemporary methods from [26] (Objectness)and [27] (CPMC). Since the Objectness method uses abounding box representation, we repeat the comparisonexperiments using bounding box overlap on the largerVOC2011 Main val dataset.
6.2 Proposal GenerationTo measure the quality of a set of proposals, we find thebest segmentation overlap score for each object (BSS).From this, we can characterize the overall quality ofsegments with the mean BSS over objects, or computethe number of objects recalled with a BSS above somethreshold. For our experiments, we set the thresholdto 50% unless otherwise noted. A pixel-wise overlapthreshold of 50% is typically, but not always, morestringent than a 50% bounding box overlap.
Features: The most commonly used features for seg-mentation are color and texture similarity, so we usethis as a baseline. We then add the boundary crossingand layout features individually to see their impact.Finally, we combine all of the features to obtain our finalmodel. To measure the performance of each feature, weconsider the area under the ROC curve (AUC) for affinityclassification, the best segment score, and recall at 50%.The results are shown in Table 3.
The first thing to note is that the addition of boththe boundary and layout features are helpful for bothdatasets. In addition, we find that the affinity clas-sification performance cannot fully predict a feature’simpact on proposal performance. It is important to alsoconsider how well the features facilitate producing adiverse set of proposals. Features that cause predictionto be more dependent on the seed region will producea more diverse set of proposals. For the remainderof the experiments we use the color+layout features,since they create a more diverse set of proposals thancolor+boundaries+layout. The boundary cues are stillcaptured with the pairwise term of the MRF.
Proposal Quality: We begin by considering similarbaselines to [20]. The first baseline is to use each regionfrom the hierarchical segmentation as an object proposal.The second baseline is to merge all pairs of adjacentregions, which achieves higher recall but with manymore proposals. We can also measure the upper boundon performance by choosing the best set of superpixelsfor each object region.
8
Our Proposals Top 3 Our Proposals 50% CPMC 50% Objectness 50%
3:16%
2:36%
1:21%
6:51% 2:67%
1:65%
7:53%
3:46%
2:74%
1:9%
2:74%
40:51%
8:59%
63:50%
4:79%
47:52%
3:17%2:23%
1:26%
334:69%28:62%
49:60%95:50%
24:71%
13:56%
27:57%47:53%
475:56%
60:51%
76:54%
277:52%210:86%
153:63%53:64%
218:67%13:59%
144:60%9:62%
235:52%169:59%
3:21%2:3%
1:3%265:68%
520:60% 355:74%
3:55%
2:34%
1:62% 8:67%
1:62%
1:55%
10:51%
1:66%
3:12%
2:98%
1:27%
103:63%12:90%
635:52%
71:53%
10:67%
20:72%
95:67%
2:98%
111:0%20:60%
13:77%
1:56%
64:54%59:71%8:53%
838:52%79:62%
43:54%
65:51%
50:56%12:70%
Fig. 5. Results from the proposal and ranking stages on BSDS (first 3 rows) and Pascal 2011 (last 3 rows). The leftcolumn shows the 3 highest ranked proposals, The remaining columns show the highest ranked proposals with atleast 50% overlap with each object for Our Proposals, CPMC, and Objectness. Note that we use region overlap forours and CPMC, and bounding box ovelap for Objectness. The number pairs displayed on each proposal correspondto rank and overlap, respectively. As seen in row 3, CPMC tends to have more trouble finding small objects in clutteredscenes. Objectness provides less detailed bounding boxes and generally requires more candidates to achieve thesame level of recall.

9
0.5 0.55 0.6 0.65 0.7 0.75 0.8 0.85 0.9 0.95 10
0.1
0.2
0.3
0.4
0.5
0.6
0.7
0.8
0.9
1
Segmentation Overlap %
Rec
all @
Ove
rlap
UpperboundOur MethodMerged HierarchicalHierarchical
(a) Region: BSDS
0.5 0.55 0.6 0.65 0.7 0.75 0.8 0.85 0.9 0.95 10
0.1
0.2
0.3
0.4
0.5
0.6
0.7
0.8
0.9
1
Segmentation Overlap %
Rec
all @
Ove
rlap
UpperboundOur MethodMerged HierarchicalHierarchical
(b) Region: Pascal VOC2011 Segmentation val
Fig. 6. Recall vs. Region Overlap: The percentage ofobjects recalled as a function of best overlap with groundtruth. For BSDS, we generate better proposals for alllevels of overlap. For Pascal, we outperform the baselinesfor higher recall levels and are still comparable at 50%overlap. Note that we use 20-30 times fewer regions thanthe baselines.
It is clear from Figure 6 that the initial hierarchicalsegmentation is not well suited for proposing objectcandidates. After merging proposals, the segmentationquality is comparable to our method, but as Figure 7shows, it produces more than an order of magnitudemore proposals. For both datasets, our method producesmore high quality proposals for overlaps greater than65%.
6.3 Ranking Performance
We compare our ranking method to three baselines. Thefirst method scores each proposal independently, and theranking is produced by sorting these scores from high tolow. Positive examples are chosen from a pool proposalswith at least 50% overlap with some object and negativeexamples have no more than 35% overlap with anyobject. The second baseline includes the overlap penaltyof our method, but learns the appearance model andtrade-off terms separately, as in [27]. The final baselinesimply assigns random ranks to each proposal. This
100
101
102
103
104
105
0
0.1
0.2
0.3
0.4
0.5
0.6
0.7
0.8
0.9
1
Mean Proposals/Image
Rec
all a
t 50%
Ove
rlap
Full Model
Classifier + Overlap
Random
Classifier
Merged Regions
Hierarchical Segmentation
(a) Region: BSDS
100
101
102
103
104
105
0
0.1
0.2
0.3
0.4
0.5
0.6
0.7
0.8
0.9
1
Mean Proposals/Image
Rec
all a
t 50%
Ove
rlap
Full Model
Classifier + Overlap
Random
Classifier
Merged Regions
Hierarchical Segmentation
(b) Region: Pascal VOC 2011 Segmentation val
Fig. 7. Recall vs. number of proposals per image: Whenconsidering recall for more than 50 proposals per image,enforcing diversity (Random) is a more important thanobject appearance (Classifier). Combining diversity andappearance (Classifier + Overlap) improves performancefurther, and jointly learning both (Full model) gives evenfurther gains.
can be seen as encouraging diversity without takinginto account appearance. To evaluate the quality of ourranker, we measure the number of objects recalled whenwe threshold each image’s bag at a certain size. Theresults are presented in Figure 7.
We find that by jointly learning the appearance andsuppression models, our method outperforms each ofthe baselines. Because the independent classifier doesnot encourage diversity, only the first object or object-likeregion is given a high rank, and the number of proposalsrequired to recall the remaining objects can be quitehigh. In fact, when considering more than 50 proposals,the random ranker quickly outperforms the independentclassifier. This emphasizes the importance of encourag-ing diversity. However, both models that include bothappearance models and overlap terms outperform therandom ranker. Finally, by learning with an appropriateloss and jointly learning all of the parameters of themodel with structured learning, we achieve small butnoticeable gains over the baseline with an overlap term.
In Figure 8 we isolate the influence of each of the

10
100
101
102
103
104
0
0.1
0.2
0.3
0.4
0.5
0.6
0.7
0.8
0.9
1
Mean Proposals/Image
Rec
all a
t 50%
Ove
rlap
Max
Binned Max
Binned Max + Binned Sum
(a) Region: BSDS
100
101
102
103
104
0
0.1
0.2
0.3
0.4
0.5
0.6
0.7
0.8
0.9
1
Mean Proposals/Image
Rec
all a
t 50%
Ove
rlap
Max
Binned Max
Binned Max + Binned Sum
(b) Region: Pascal VOC 2011 Segmentation val
Fig. 8. Effects of Ranker Scoring Function: The baseline(Max) only uses the maximum overlap with a higherranked proposal. Results are improved incrementally byboth binning the overlaps (Binned Max) and adding thesum of higher ranked overlaps (Binned Max + BinnedSum). The latter is used in the final system.
components of the ranker’s scoring function. First, weconsider the most basic overlap penalty term as usedin [27], consisting of the maximum overlap with a higherranked proposal (Max, i.e. the unbinned version of Φ1
in eq. 6). Next, we binning the output of the maxfunction, withouth the sum (Binned Max). Although itis difficult to discern the benefit on BSDS, there is aclear improvment on Pascal. Finally, by adding the sumof the binned overlaps (Binned Max + Binned Sum),which is representative of the final ranking procedureused throughout the paper, we get further improvementson Pascal. Note that each method is trained using the fullstructured learning process.
Finally, we provide a breakdown of recall for individ-ual categories of the Pascal VOC 2011 dataset in Figure 9.These results are especially promising, because many ofthe categories with high recall, such as dog and cat,are difficult for standard detectors to locate. The lowperformance for categories like car and sheep is mainlydue to the difficulty of proposing small regions (< 0.5%of the image area, or < 1000 pixel area), especiallywhen the objects are in crowded scenes. The dependence
100
101
102
103
104
0
0.1
0.2
0.3
0.4
0.5
0.6
0.7
0.8
0.9
1
Mean Proposals/Image
Rec
all
VOC2011 Train 50%
BSDS Train 50%
VOC2011 Train 75%
BSDS Train 75%
(a) Region: BSDS
100
101
102
103
104
0
0.1
0.2
0.3
0.4
0.5
0.6
0.7
0.8
0.9
1
Mean Proposals/Image
Rec
all
VOC2011 Train 50%
BSDS Train 50%
VOC2011 Train 75%
BSDS Train 75%
(b) Region: Pascal VOC 2011 Segmentation val
Fig. 10. Cross-Dataset comparison: Our method istrained on VOC2011 (blue) and trained on BSDS (green).Note that recall at both 50% and 75% overlap is quitecomparable at all ranks. There is only a small advantagewhen training on the same set as testing, showing thatour method generalizes well and need not be retrainedfor every new dataset.
of recall on area is shown in Figure 13. The highlydetailed ground truth pixel masks for bicycles makesthem extremely difficult to recall for our method.
6.4 Cross-Dataset Comparison
To explore our method’s ability to generalize to newdatasets, we compare the overall proposal performancewhen trained and tested on the same set and acrossdatasets. In Figure 10, we find that training on BSDSand testing on BSDS gives a slight gain over trainingon Pascal. The greater diversity of objects in BSDS mayexplain this advantage. In contrast, there is no significantdifference between training on BSDS or Pascal whentesting on Pascal. This result suggests that diversity oftraining examples, rather than quantity, is more impor-tant for our method to generalize. It also confirms thatour method generalizes well and does not need to beretrained for each new dataset.

11
0
0.1
0.2
0.3
0.4
0.5
0.6
0.7
0.8
0.9
1
cat
dog
sofa
mot
orbi
ke
tvm
onito
r
bird
trai
n
bus
hors
e
cow
dini
ngta
ble
aero
plan
e
boat
shee
p
pers
on
potte
dpla
nt car
bottl
e
chai
r
bicy
cle
Rec
allp@
p50%
pOve
rlap
10pProposals
25pProposals
100pProposals
300pProposals
AllpProposals
Fig. 9. Recall for each object category in Pascal with region overlap. These results are quite promising because manyof the categories with high recall are difficult for standard object detectors to recognize. For many categories, most ofthe instances can be discovered in the first 100 proposals.
6.5 Comparison to Objectness,CPMC
Next, we compare to the Objectness [26] and CPMC [27]methods.
Proposal Quality: Figure 11 compares the recall atdifferent overlap thresholds. With the region overlapcriteria, CPMC recalls more objects at higher overlaps,especially when considering fewer proposals for eachimage. Their pixelwise segmentation is able to givemore detailed segmentations. However, their proposalshave less diversity which limits recall when using lowerregion overlap thresholds or the bounding box overlapcriteria. The Objectness method gives comparable levelsof recall at 50% bounding box overlap for both datasets,but their aggressive non-maximum suppression proce-dure causes recall to quickly drop for higher overlapthresholds.
Ranking: Figure 12 compares the quality of the rank-ing by showing the recall for different numbers ofproposals for each image. At 50% region overlap, ourmethod slightly outperforms CPMC at all ranks. How-ever, at 75% overlap, their higher quality per-pixel maskshave higher recall for more than 30 proposals per image.With bounding box overlap, our method and CPMCperform comparably on BSDS, and our method has 5%higher recall for most ranks on Pascal.
The Objectness ranking has a lower recall than bothmethods for less than a few hundred proposals perimage. It performs comparably to our method at 500proposals per image for BSDS and 2000 proposals forPascal.
Area: Figure 13 show the dependence of each methodon region or bounding-box area as a fraction of imagepixels. All of the methods excel with 90%− 100% recallfor regions which cover greater than 5% of the image.However, both CPMC and Objectness appear to be moresensitive to smaller objects. Our superpixel based repre-
sentation appears to give a good balance between givingdetailed segmentations while reducing the search spacefor candidate objects.
7 CONCLUSION
We have introduced a procedure that generates a small,but diverse set of category-independent object proposals.By incorporating the affinity predictions, we can directthe search for segmentations to produce good candidateregions with far fewer proposals than standard segmen-tations. Our ranking can further reduce the number ofproposals, while still maintaining high diversity. Ourexperiments show that this procedure generalizes welland can be applied for many categories.
The results on Pascal are especially encouraging, be-cause with as few as 100 proposals per image, we canobtain high recall for many categories that standardscanning window detectors find difficult. This is quiteamazing, considering that the system had never seenmost of the Pascal categories during training!
Beyond categorization, our proposal mechanism canbe incorporated in applications where category modelsare not available. When presented with images of newobjects, our proposals can be used in an active learningframework to learn about unfamiliar objects. Alterna-tively, they can be used for automatic object discoverymethods such as [21]. Combined with the descriptionbased recognition methods [1], [2], we could locate anddescribe new objects.
While this method performs well in general, it hasdifficulty in cases where the occlusion boundary predic-tions fail and for small objects. These are cases wherehaving some domain knowledge, such as appearanceor shape models can complement a generic proposalmechanism. This suggests a joint approach in whichbottom-up region proposals are complemented by part

12
0.5 0.55 0.6 0.65 0.7 0.75 0.8 0.85 0.9 0.95 10
0.1
0.2
0.3
0.4
0.5
0.6
0.7
0.8
0.9
1
Segmentation Overlap %
Rec
all @
% O
verla
p
Proposals 1000Proposals 300CPMC 1000CPMC 300
(a) Region: BSDS
0.5 0.55 0.6 0.65 0.7 0.75 0.8 0.85 0.9 0.95 10
0.1
0.2
0.3
0.4
0.5
0.6
0.7
0.8
0.9
1
Segmentation Overlap %
Rec
all @
% O
verla
p
Proposals 1000Proposals 300CPMC 1000CPMC 300Objectness 1000Objectness 300
(b) Box: BSDS
0.5 0.55 0.6 0.65 0.7 0.75 0.8 0.85 0.9 0.95 10
0.1
0.2
0.3
0.4
0.5
0.6
0.7
0.8
0.9
1
Segmentation Overlap %
Rec
all @
% O
verla
p
Proposals 1000Proposals 300CPMC 1000CPMC 300
(c) Region: Pascal VOC 2011 Segmentation val
0.5 0.55 0.6 0.65 0.7 0.75 0.8 0.85 0.9 0.95 10
0.1
0.2
0.3
0.4
0.5
0.6
0.7
0.8
0.9
1
Segmentation Overlap %
Rec
all @
% O
verla
p
Proposals 1000Proposals 300CPMC 1000CPMC 300Objectness 1000Objectness 300
(d) Box: Pascal VOC 2011 Main val
Fig. 11. Recall at different overlap thresholds for our method, Objectness, and CPMC. Solid lines indicate recall with1000 regions per image, dashed lines for 300 regions.
or category detectors that incorporate domain knowl-edge.
REFERENCES[1] A. Farhadi, I. Endres, D. Hoiem, and D. Forsyth, “Describing
objects by their attributes,” in CVPR, 2009.[2] C. H. Lampert, H. Nickisch, and S. Harmeling, “Learning to
detect unseen object classes by between-class attribute transfer,”in CVPR, 2009.
[3] M. A. Goodale, A. D. Milner, L. S. Jakobson, and D. P. Carey., “Aneurological dissociation between perceiving objects and graspingthem,” Nature, vol. 349, pp. 154–156, Jan 2000.
[4] D. Hoiem, A. A. Efros, and M. Hebert, “Recovering occlusionboundaries from an image,” Int. J. Comput. Vision, vol. 91,no. 3, pp. 328–346, Feb. 2011. [Online]. Available: http://dx.doi.org/10.1007/s11263-010-0400-4
[5] D. Martin, C. Fowlkes, and J. Malik, “Learning to find brightnessand texture boundaries in natural images,” NIPS, 2002.
[6] M. Everingham, L. Van Gool, C. K. I. Williams, J. Winn,and A. Zisserman, “The PASCAL Visual Object ClassesChallenge 2011 (VOC2011) Results,” http://www.pascal-network.org/challenges/VOC/voc2011/workshop/index.html.
[7] ——, “The pascal visual object classes (voc) challenge,” Interna-tional Journal of Computer Vision, vol. 88, no. 2, pp. 303–338, Jun.2010.
[8] P. Viola and M. J. Jones, “Robust real-time face detection,” IJCV,vol. 57, no. 2, 2004.
[9] P. Felzenszwalb, R. Girshick, D. McAllester, and D. Ramanan,“Object detection with discriminatively trained part-based mod-els,” PAMI, 2010.
[10] B. Leibe, A. Leonardis, and B. Schiele, “Robust object detectionwith interleaved categorization and segmentation,” InternationalJournal of Computer Vision, vol. 77, no. 1-3, pp. 259–289, May 2008.
[11] S. Maji and J. Malik, “Object detection using a max-marginhough transform,” Computer Vision and Pattern Recognition, IEEEComputer Society Conference on, vol. 0, pp. 1038–1045, 2009.
[12] O. Chum and A. Zisserman, “An exemplar model for learningobject classes,” in CVPR, 2007.
[13] A. Vedaldi, V. Gulshan, M. Varma, and A. Zisserman, “Multiplekernels for object detection,” in Proceedings of the InternationalConference on Computer Vision (ICCV), 2009.
[14] C. Gu, J. Lim, P. Arbelaez, and J. Malik, “Recognition usingregions,” Computer Vision and Pattern Recognition, IEEE ComputerSociety Conference on, pp. 1030–1037, 2009.
[15] J. Shi and J. Malik, “Normalized cuts and image segmentation,”IEEE Trans. PAMI, vol. 22, no. 8, August 2000.
[16] P. Felzenszwalb and D. Huttenlocher, “Efficient graph-based im-age segmentation,” IJCV, vol. 59, no. 2, 2004.
[17] P. Arbelaez, M. Maire, C. Fowlkes, and J. Malik, “Contour detec-tion and hierarchical image segmentation,” Pattern Analysis andMachine Intelligence, IEEE Transactions on, vol. 33, no. 5, pp. 898–916, 2011.
[18] E. Sharon, M. Galun, D. Sharon, R. Basri, and A. Brandt., “Hi-erarchy and adaptivity in segmenting visual cues,” Nature, June2006.
[19] D. Hoiem, A. A. Efros, and M. Hebert, “Geometric context froma single image,” in ICCV, 2005.
[20] T. Malisiewicz and A. A. Efros, “Improving spatial support forobjects via multiple segmentations,” in BMVC, 2007.
[21] B. C. Russell, A. A. Efros, J. Sivic, W. T. Freeman, and A. Zisser-man, “Using multiple segmentations to discover objects and theirextent in image collections,” in CVPR, 2006.
[22] A. Stein, T. Stepleton, and M. Hebert, “Towards unsupervisedwhole-object segmentation: Combining automated matting withboundary detection,” in IEEE Conference on Computer Vision andPattern Recognition (CVPR), June 2008.

13
100
101
102
103
104
0
0.1
0.2
0.3
0.4
0.5
0.6
0.7
0.8
0.9
1
Mean Proposals/Image
Rec
all
Proposals 50%
Proposals 75%
CPMC 50%
CPMC 75%
(a) Region: BSDS
100
101
102
103
104
0
0.1
0.2
0.3
0.4
0.5
0.6
0.7
0.8
0.9
1
Number of proposals per image
Rec
all
Proposals 50%
Proposals 75%
CPMC 50%
CPMC 75%
Objectness 50%
Objectness 75%
(b) Box: BSDS
100
101
102
103
104
0
0.1
0.2
0.3
0.4
0.5
0.6
0.7
0.8
0.9
1
Mean Proposals/Image
Rec
all
Proposals 50%
Proposals 75%
CPMC 50%
CPMC 75%
(c) Region: Pascal VOC 2011 Segmentation val
100
101
102
103
104
0
0.1
0.2
0.3
0.4
0.5
0.6
0.7
0.8
0.9
1
Number of proposals per image
Rec
all
Proposals 50%
Proposals 75%
CPMC 50%
CPMC 75%
Objectness 50%
Objectness 75%
(d) Box: Pascal VOC 2011 Main val
Fig. 12. Recall at different numbers of proposals per image for our method, Objectness, and CPMC. Solid linesindicate 50% overlap, dashed lines for 75% overlap.
[23] S. Gould, R. Fulton, and D. Koller, “Decomposing a scene intogeometric and semantically consistent regions,” in ICCV, 2009.
[24] D. Walther and C. Koch, “2006 special issue: Modeling attentionto salient proto-objects,” Neural Networks, vol. 19, no. 9, pp. 1395–1407, 2006.
[25] T. Liu, J. Sun, N. ning Zheng, X. Tang, and H. yeung Shum,“Learning to detect a salient object,” in in: Proceedings of IEEEComputer Society Conference on Computer and Vision Pattern Recog-nition (CVPR. CVPR, 2007, pp. 1–8.
[26] B. Alexe, T. Deselaers, and V. Ferrari, “Measuring the objectnessof image windows,” Pattern Analysis and Machine Intelligence, IEEETransactions on, vol. 34, no. 11, pp. 2189–2202, 2012.
[27] J. Carreira and C. Sminchisescu, “Cpmc: Automatic object seg-mentation using constrained parametric min-cuts,” Pattern Anal-ysis and Machine Intelligence, IEEE Transactions on, vol. 34, no. 7,pp. 1312–1328, 2012.
[28] D. Hoiem, A. A. Efros, and M. Hebert, “Recovering surface layoutfrom an image,” IJCV, vol. 75, no. 1, pp. 151–172, 2007.
[29] C. Rother, V. Kolmogorov, and A. Blake, “”grabcut”: interactiveforeground extraction using iterated graph cuts,” ACM Trans.Graph., vol. 23, no. 3, pp. 309–314, 2004.
[30] B. C. Russell, A. Torralba, K. Murphy, and W. T. Freeman, “La-belme: A database and web-based tool for image annotation,”International Journal of Computer Vision, vol. 77, no. 1-3, pp. 157–173, 2008.
[31] I. Tsochantaridis, T. Joachims, T. Hofmann, and Y. Altun, “Largemargin methods for structured and interdependent output vari-ables,” Journal of Machine Learning Research, vol. 6, pp. 1453–1484,2005.
PLACEPHOTOHERE
Ian Endres received the BS degree in computerscience from University of Illinois at Urbana-Champaign in 2008. He is currently pursuingthe Ph.D. degree in at University of Illinois atUrbana-Champaign. He is the recipient of theRichard T. Cheng Fellowship.
PLACEPHOTOHERE
Derek Hoiem is an assistant professor in Com-puter Science at the University of Illinois atUrbana-Champaign. He received his PhD inRobotics from Carnegie Mellon University in2007. Dereks research in visual scene under-standing and object recognition has been recog-nized with an ACM Doctoral Dissertation Awardhonorable mention, CVPR best paper award,NSF CAREER grant, Intel Early Career Facultyaward, and Sloan Fellowship.

14
10−3
10−2
10−1
100
0
0.1
0.2
0.3
0.4
0.5
0.6
0.7
0.8
0.9
1
Region Area (% of image area)
Rec
all @
50%
ove
rlap
Proposals Recall
CPMC Recall
Example Distribution (% of dataset)
(a) Region: BSDS
10−3
10−2
10−1
100
0
0.1
0.2
0.3
0.4
0.5
0.6
0.7
0.8
0.9
1
BBOX Area (% of image area)
Rec
all @
50%
ove
rlap
Proposals Recall
CPMC Recall
Objectness Recall
Example Distribution (% of dataset)
(b) Box: BSDS
10−3
10−2
10−1
100
0
0.1
0.2
0.3
0.4
0.5
0.6
0.7
0.8
0.9
1
Region Area (% of image area)
Rec
all @
50%
ove
rlap
Proposals Recall
CPMC Recall
Example Distribution (% of dataset)
(c) Region: Pascal VOC 2011 Segmentation val
10−3
10−2
10−1
100
0
0.1
0.2
0.3
0.4
0.5
0.6
0.7
0.8
0.9
1
BBOX Area (% of image area)
Rec
all @
50%
ove
rlap
Proposals Recall
CPMC Recall
Objectness Recall
Example Distribution (% of dataset)
(d) Box: Pascal VOC 2011 Main val
Fig. 13. Recall vs. object size: The plot shows the percentage of recalled objects based on their area, relative tothe image size. Histogram bin edges are indicated by solid vertical lines. This demonstrates that uncovering smallerobjects is more difficult than larger objects, but for each dataset, more than 60% of objects between 0.3% and 1.1%of the image are still recovered. This is due to weaker object cues and because the region overlap criteria is moresensitive to individual pixel errors for smaller objects. The dashed lines also show the proportions of the dataset foreach object size.