Embed Size (px)
Citation preview

AGRICULTURAL ECONOMICS
ByPieter Taljaard
Unit for Livestock and Wildlife Economics,Department of Agricultural Economics,
University of the Free State, Bloemfontein,
Republic of South Africa
Cattle Feedlotting in South AfricaAssocon/Cepea Interconf conference
September 2009
AGRICULTURAL ECONOMICS
Outline
1. Introduction2. Background on cattle farming and
beef consumption in RSA3. The feedlot industry4. Challenges5. Summary
AGRICULTURAL ECONOMICS
1. Introduction• Market liberalization, deregulation of ag markets as well as
political change in mid 90’s• SA produces top quality meat• Imports typically supplement cheaper protein to supply
the mass consumer market• SA competes in the global market for these proteins• Imports are affected by currency fluctuations• High protectionist import duties (40%)• Chicken is stealing red meat meals (global trend –
changing? USA, Aus, RSA)• South Africa consumes more red meat than it produces
(last 40 years)
AGRICULTURAL ECONOMICS
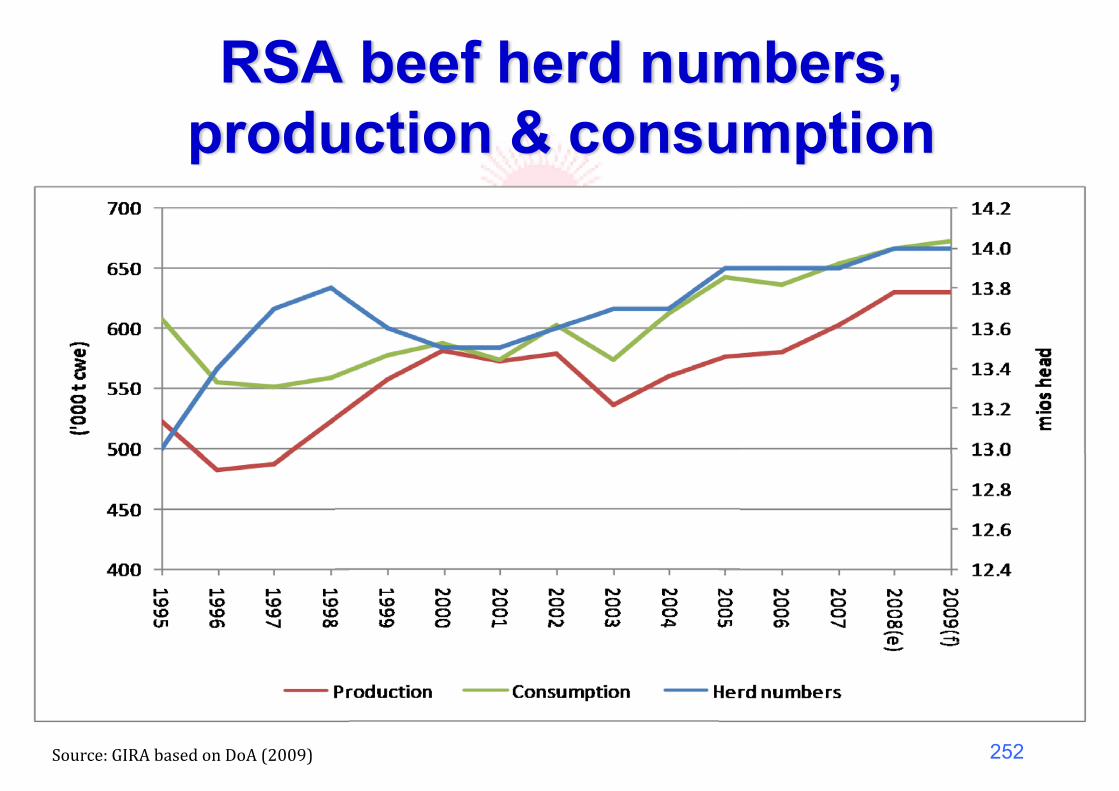
RSA beef herd numbers, production & consumption
252����������� ������������������
AGRICULTURAL ECONOMICS
253
1. Introduction….• SA produces 17,3% of the total meat produced
on the continent of Africa and 1% of global meat production
• From 1995/96 to 2005/06 the contribution of meat to the total gross value of agricultural products has increased from 25.4% to 33.8%
AGRICULTURAL ECONOMICS
2. Background on cattle farming and beef consumption in RSA
AGRICULTURAL ECONOMICS
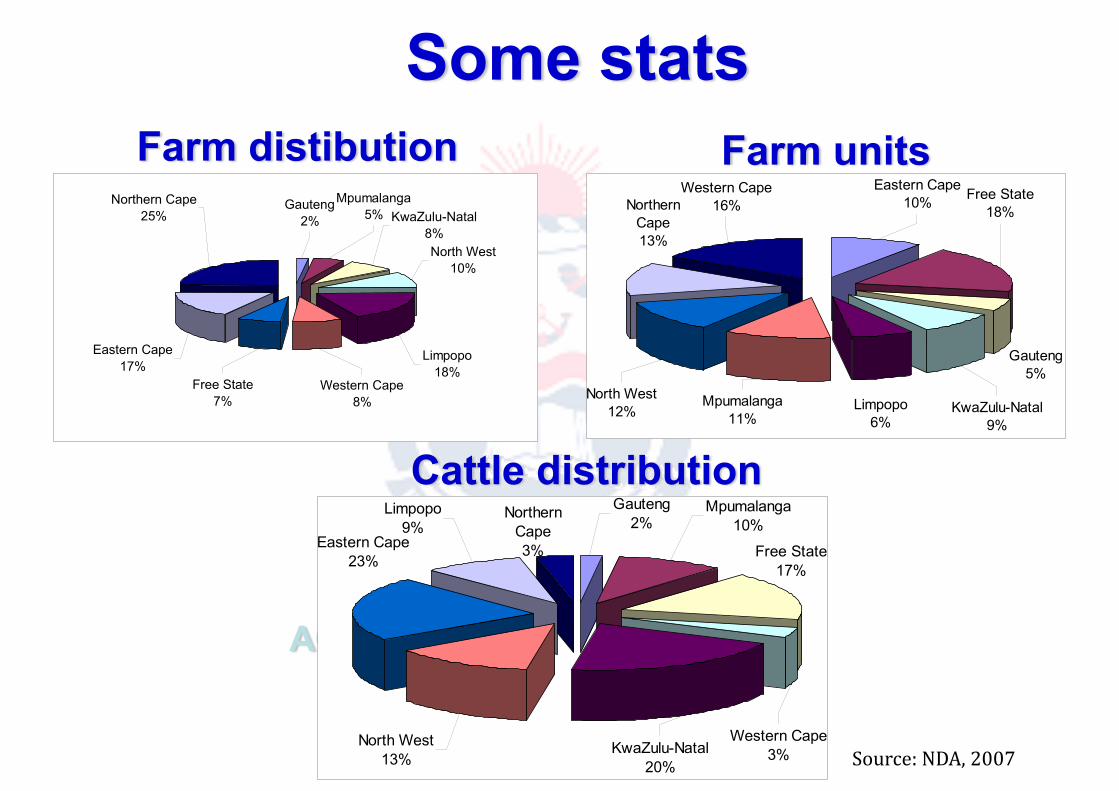
Farm distibution
Free State7%
Eastern Cape17%
Northern Cape25%
Gauteng2%
Mpumalanga5% KwaZulu-Natal
8%North West
10%
Limpopo18%
Western Cape8%
Western Cape16%
Eastern Cape10% Free State
18%
Gauteng5%
KwaZulu-Natal9%
Limpopo6%
Mpumalanga11%
North West12%
Northern Cape13%
Farm units
Some stats
Cattle distributionEastern Cape
23%
Limpopo9%
Gauteng2%
Northern Cape3%
Mpumalanga10%
Free State17%
KwaZulu-Natal20%
Western Cape3%
North West13% �����������������

AGRICULTURAL ECONOMICS
256
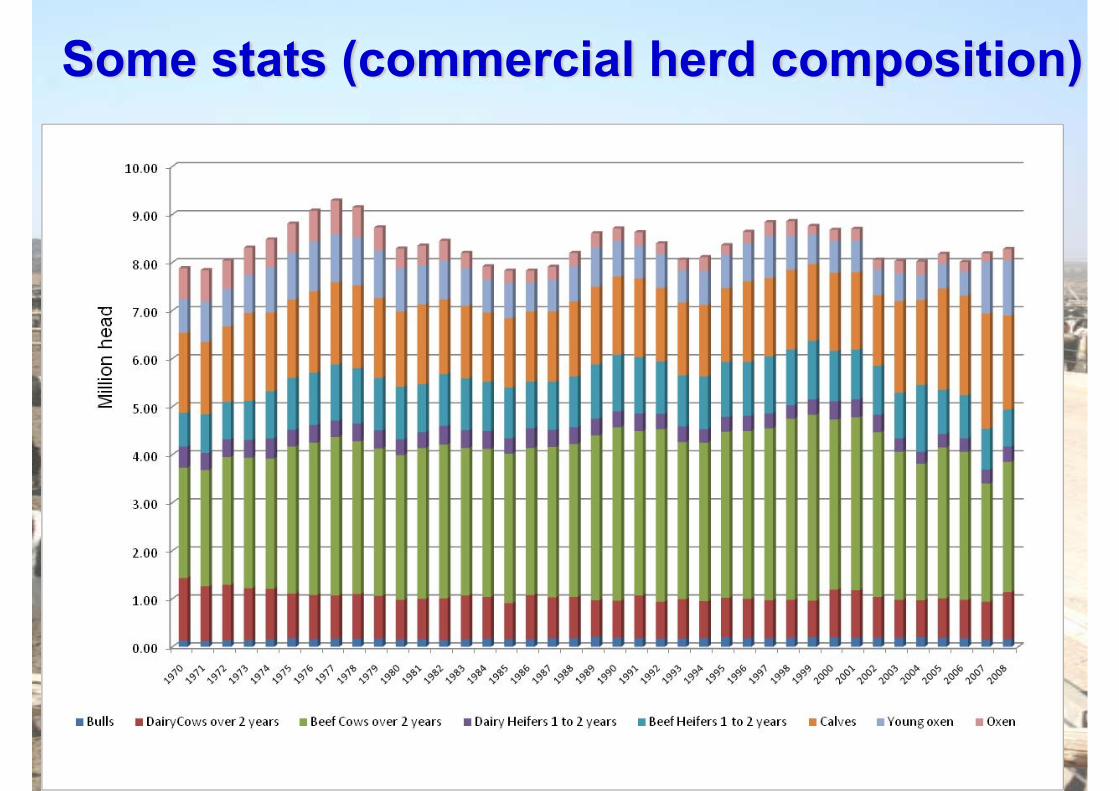
Some stats…• Herd size
– Moving between 13.5 and 13.8 million over last 5 years
– 30 to 40 % in the non-commercial sector
AGRICULTURAL ECONOMICS
Some stats (commercial herd composition)
AGRICULTURAL ECONOMICS
258
Some stats…• Net importer of beef
– Before liberalisation – largely Ireland– After liberalisation – largely Mercosur– Currently 40% import tariff
• Production systems– Extensive pastures– Feedlotting– Subsistence

AGRICULTURAL ECONOMICS
259
Some stats…��������������������������������� ��!������"��#���������
�������
$��%�� �������&��
$����������'����( )�*
���+�����������'�,��( -�*�
.//+��0��������
$����������'��-�( �1*
���+�����������'���( 2�*
,1�$������ ���������������������( �����/�����&
3�4����"��/�5������������������������#������� ������&��( �#�#�
��������
AGRICULTURAL ECONOMICS
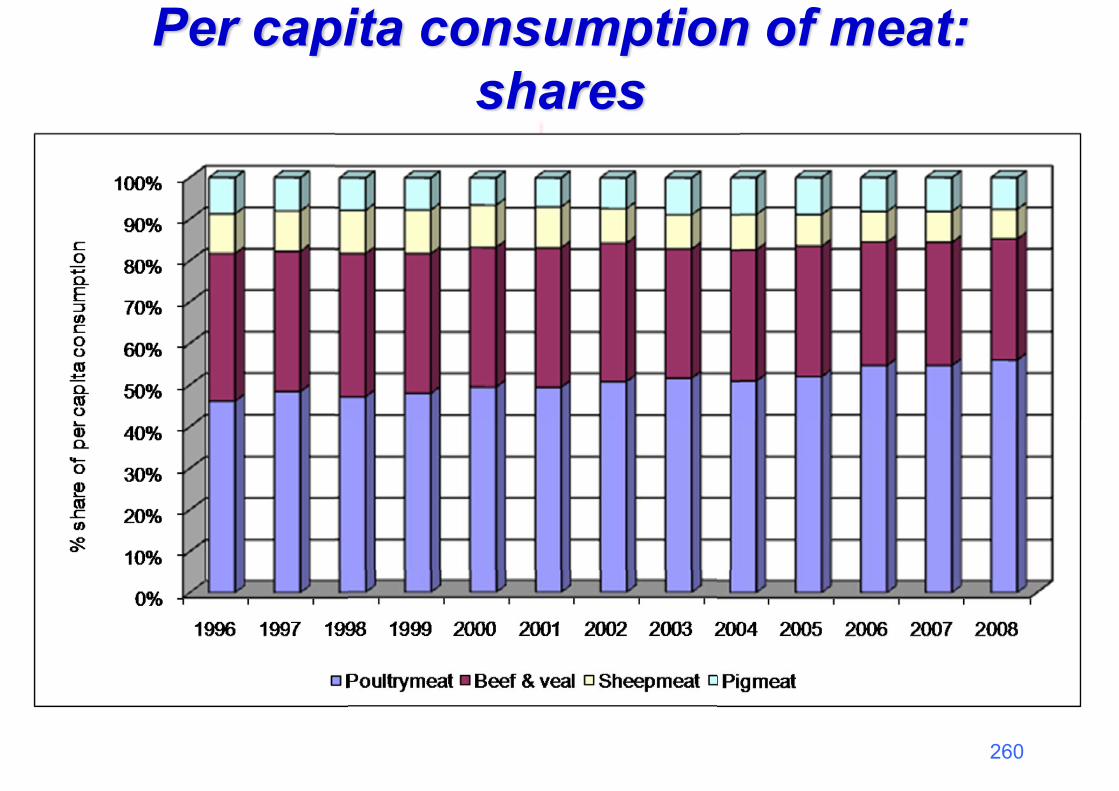
Per capita consumption of meat: shares
260
AGRICULTURAL ECONOMICS
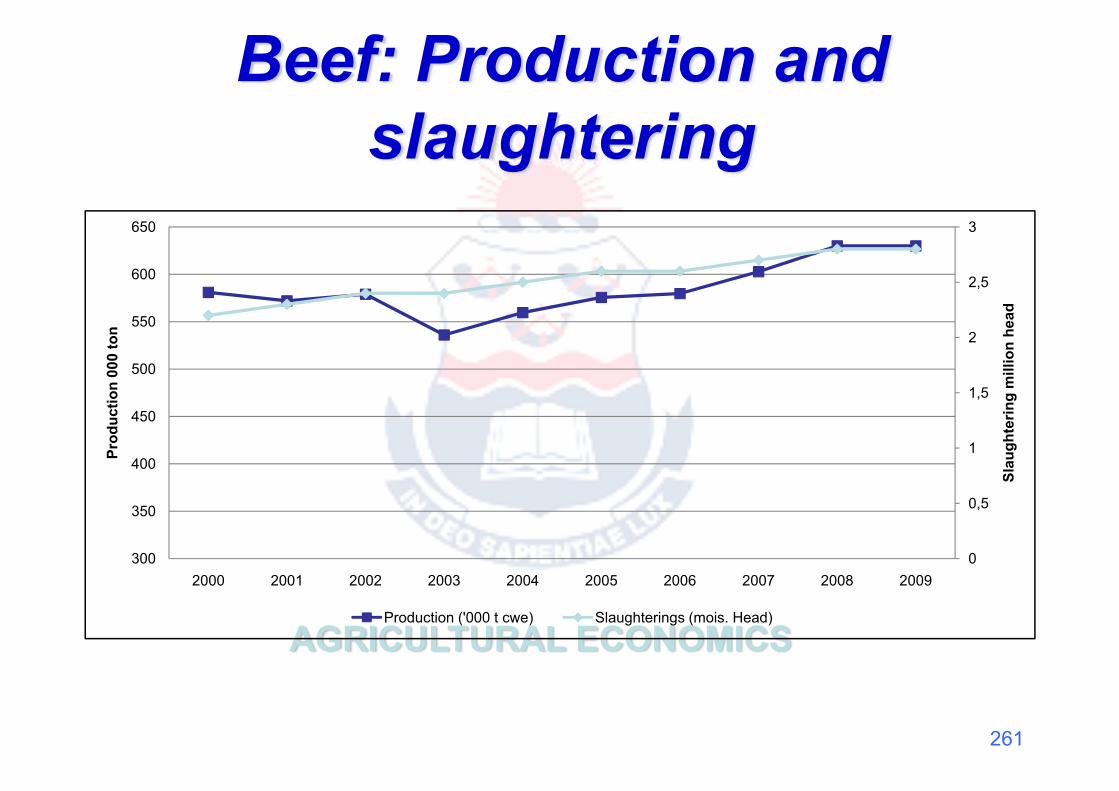
Beef: Production and slaughtering
261
0
0,5
1
1,5
2
2,5
3
300
350
400
450
500
550
600
650
2000 2001 2002 2003 2004 2005 2006 2007 2008 2009
Slau
ghte
ring
mill
ion
head
Prod
uctio
n 00
0 to
n
Production ('000 t cwe) Slaughterings (mois. Head)
AGRICULTURAL ECONOMICS
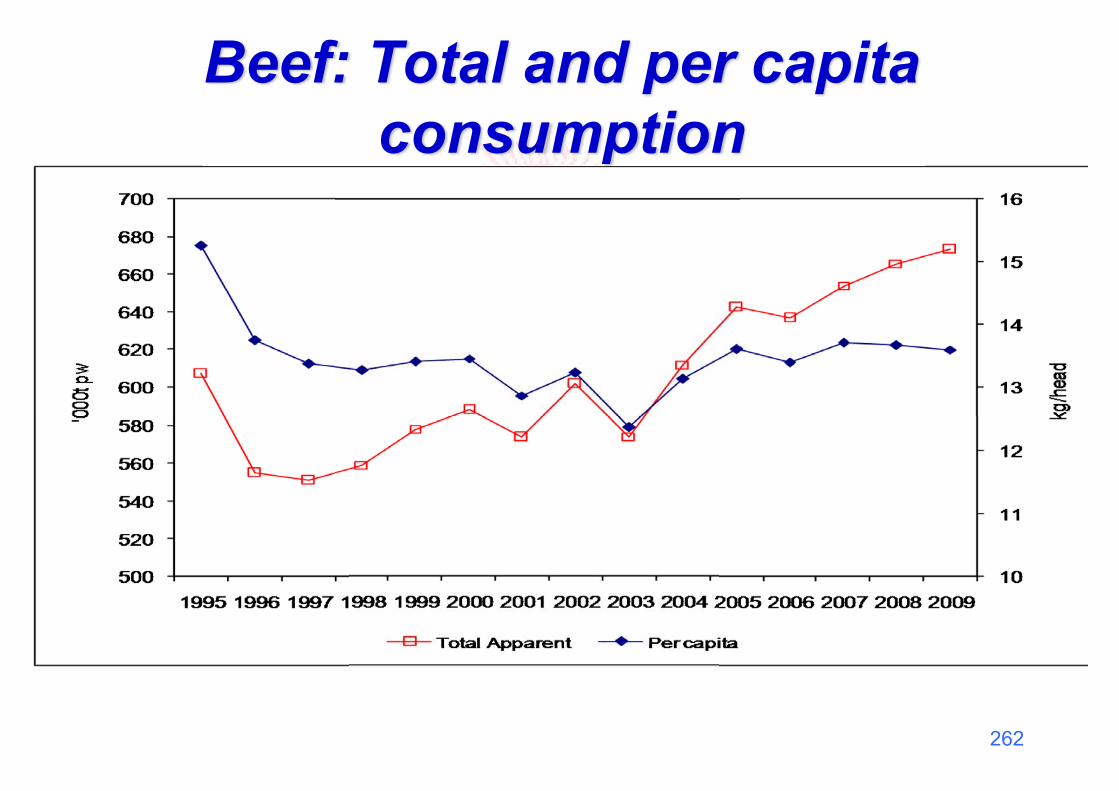
Beef: Total and per capita consumption
262
AGRICULTURAL ECONOMICS
263

AGRICULTURAL ECONOMICS
264
AGRICULTURAL ECONOMICS
AGRICULTURAL ECONOMICS
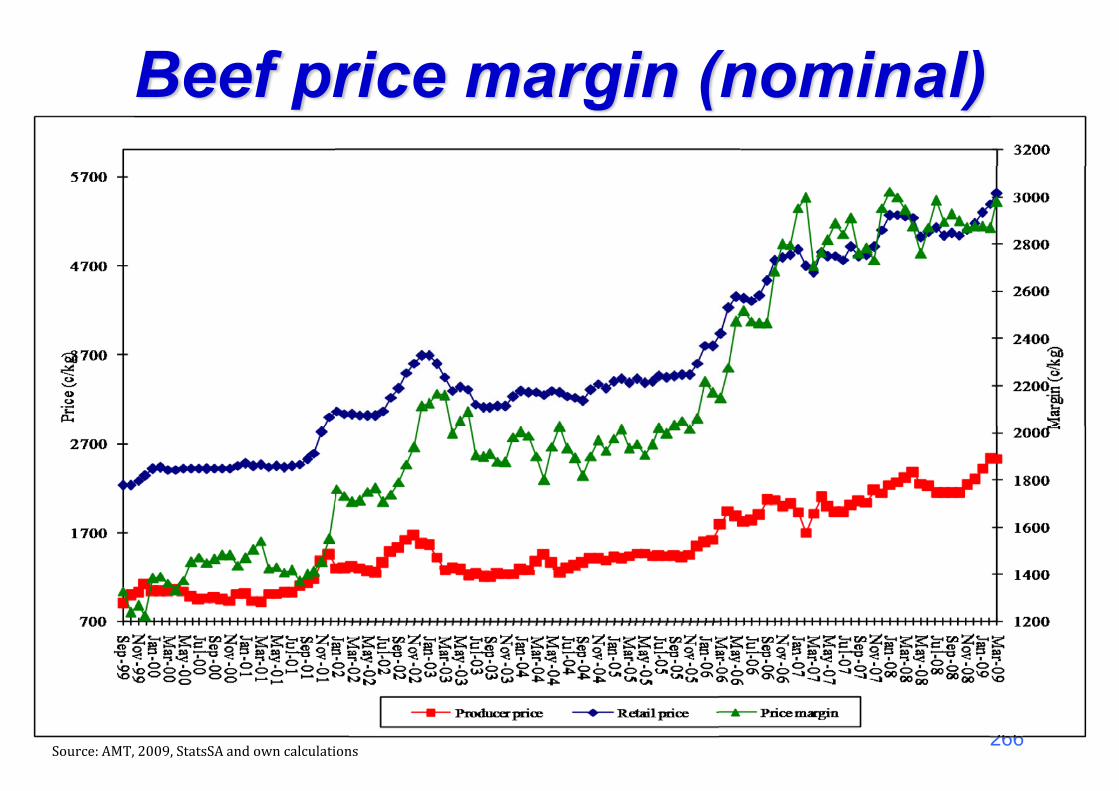
Beef price margin (nominal)
266222222666666666666���������36���������������������7��������������

AGRICULTURAL ECONOMICS
Regional price (weekly)
AGRICULTURAL ECONOMICS
3. The feedlot industry• Grainfed to achieve the best quality objectives
that satisfy consumer preferences.• SA Feedlot industry started during the 1960’s by
a few entrepreneur cattle farmers in the grain producing areas that were forced by a lack of grazing to "over winter" their stock on grain and/or potato by products and hay of inferior quality.
• SA Feedlot Association in the early 1970's (www.safeedlot.co.za)
• Represented up to 96 % of all cattle on feed at a stage

AGRICULTURAL ECONOMICS
3. The feedlot industry• Approximately 75 % of all beef produced in South
Africa comes from feedlots, 1,35 million head per annum with a one time standing capacity of approx 420 000 head.
• Basically 3 types of feeders– Farmer feeders– Seasonal feeders (e.g. grain farmers)– Commercial feeders (>100 000 standing capacity)
• Feedlots largely located close to Gauteng market and grain areas

AGRICULTURAL ECONOMICS
AGRICULTURAL ECONOMICS
3. The feedlot industry• Since deregulation of the SA Meat Industry - the
larger feedlots integrated vertically into:– Abattoirs as well as by-product processing (leather)– Wholesaling and – Even retailing of their own branded quality beef products
• I.e. profitability not only dependent on feeding and price margins
AGRICULTURAL ECONOMICS
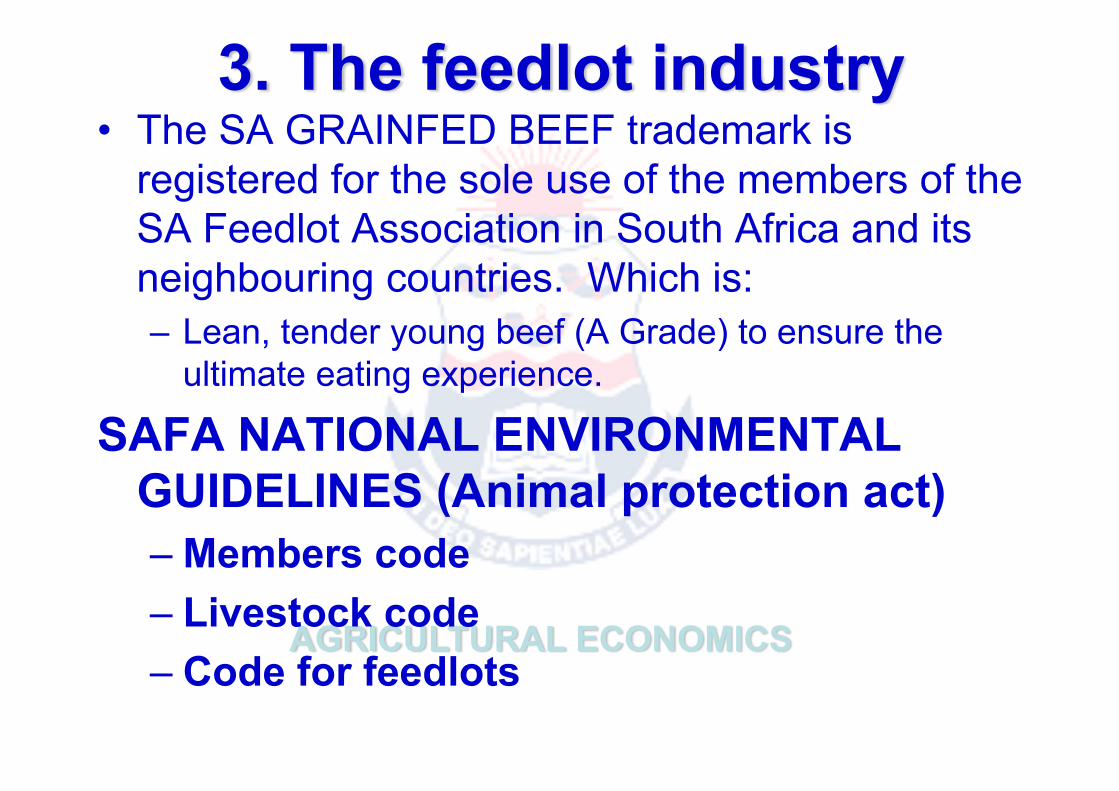
3. The feedlot industry• The SA GRAINFED BEEF trademark is
registered for the sole use of the members of the SA Feedlot Association in South Africa and its neighbouring countries. Which is:– Lean, tender young beef (A Grade) to ensure the
ultimate eating experience.
SAFA NATIONAL ENVIRONMENTAL GUIDELINES (Animal protection act)– Members code– Livestock code– Code for feedlots

AGRICULTURAL ECONOMICS
SAFA guidelines• Members code:
– Promote the image and the standing of the Association at all times – Conduct business in an ethical and honest manner – Implement fair and proper employment practice – Promote a positive attitude towards fellow members in all dealings – Further the aims and objectives of all members when representing the
Association – Practice humane production systems that are compatible with the environment.
• Livestock code (5 rights of animals)– Freedom of Movement– Free Access to Fresh Feed and Water at all times– Appropriate Health Care– Freedom from Injury and Suffering– Freedom from Harassment
AGRICULTURAL ECONOMICS
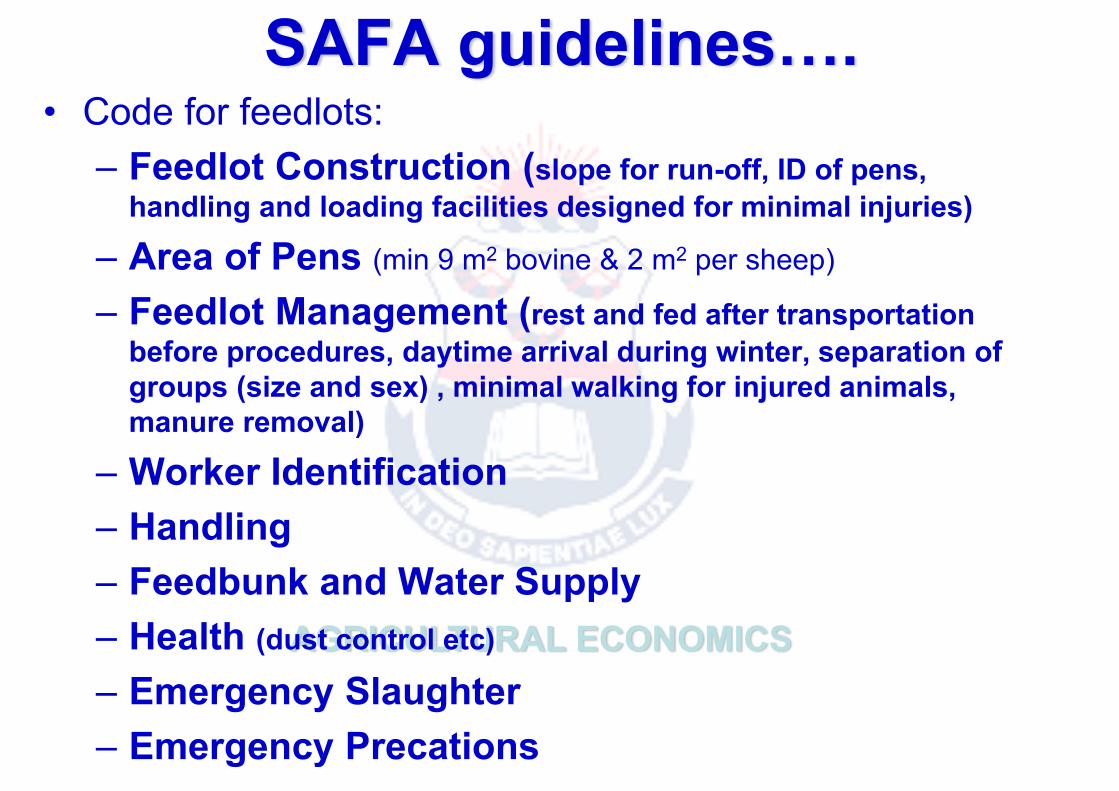
SAFA guidelines….• Code for feedlots:
– Feedlot Construction (slope for run-off, ID of pens, handling and loading facilities designed for minimal injuries)
– Area of Pens (min 9 m2 bovine & 2 m2 per sheep)
– Feedlot Management (rest and fed after transportation before procedures, daytime arrival during winter, separation of groups (size and sex) , minimal walking for injured animals, manure removal)
– Worker Identification– Handling– Feedbunk and Water Supply– Health (dust control etc)
– Emergency Slaughter– Emergency Precations

AGRICULTURAL ECONOMICS
3. The feedlot industry• Economies of scale hampered by
– Procurement of calves (longer distances)– Availability of fresh drinking water– Feed and roughage availability
• Hedging– Backgrounding of light weaners (availability
of veldt) especially during weaning time (low prices)
– Forward pricing of grain – to limited extend
AGRICULTURAL ECONOMICS
3. The feedlot industry• Beef-up Campaign (funded by membership
funds) – national TV
• Educate, persuade and assure consumers of the hygiene and wholesomeness of South African Beef as well as its health and nutritional value, appetite appeal, versatility and affordability.
AGRICULTURAL ECONOMICS

AGRICULTURAL ECONOMICS
3. The feedlot industry
AGRICULTURAL ECONOMICS
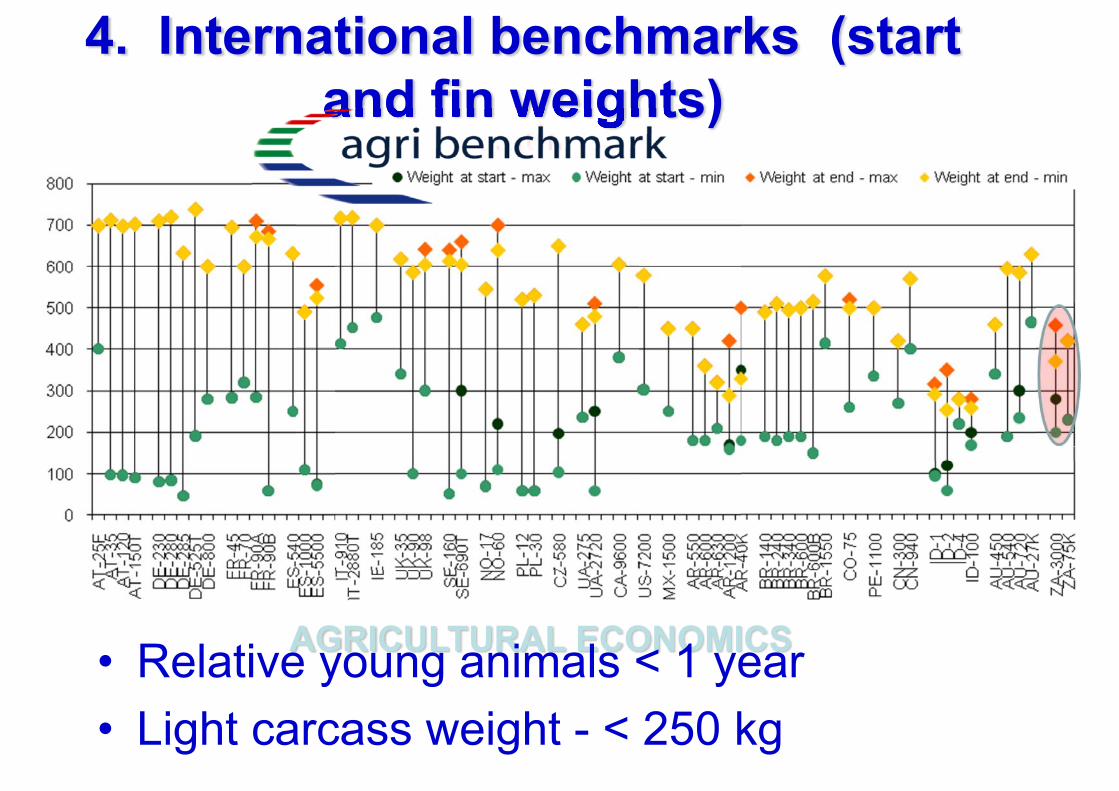
4. International benchmarks (start and fin weights)
• Relative young animals < 1 year• Light carcass weight - < 250 kg
AGRICULTURAL ECONOMICS
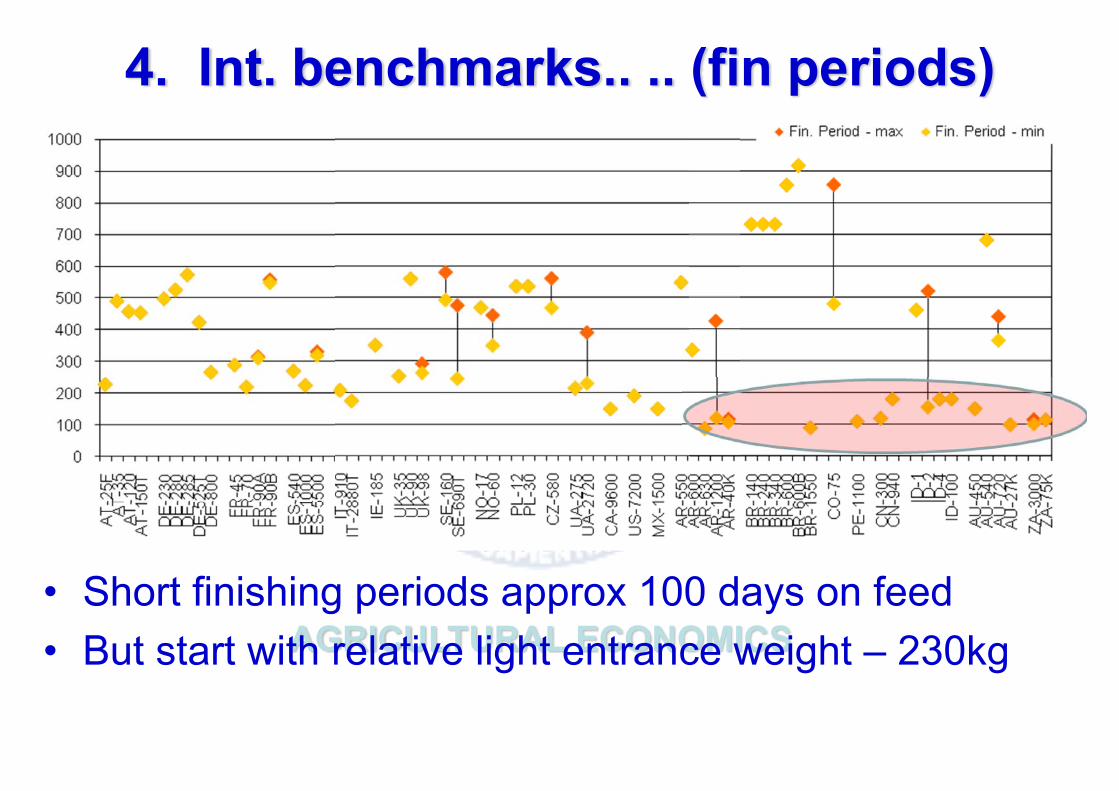
4. Int. benchmarks.. .. (fin periods)
• Short finishing periods approx 100 days on feed• But start with relative light entrance weight – 230kg
AGRICULTURAL ECONOMICS
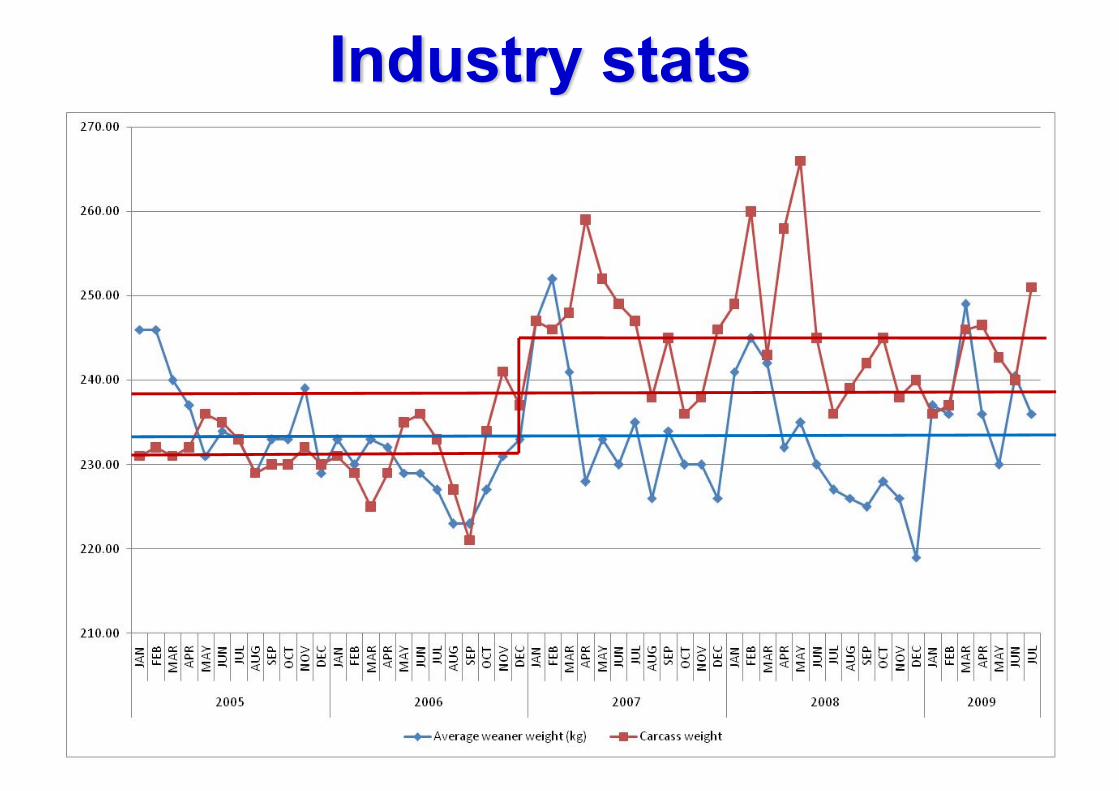
Industry stats

AGRICULTURAL ECONOMICS
Industry stats…
AGRICULTURAL ECONOMICS
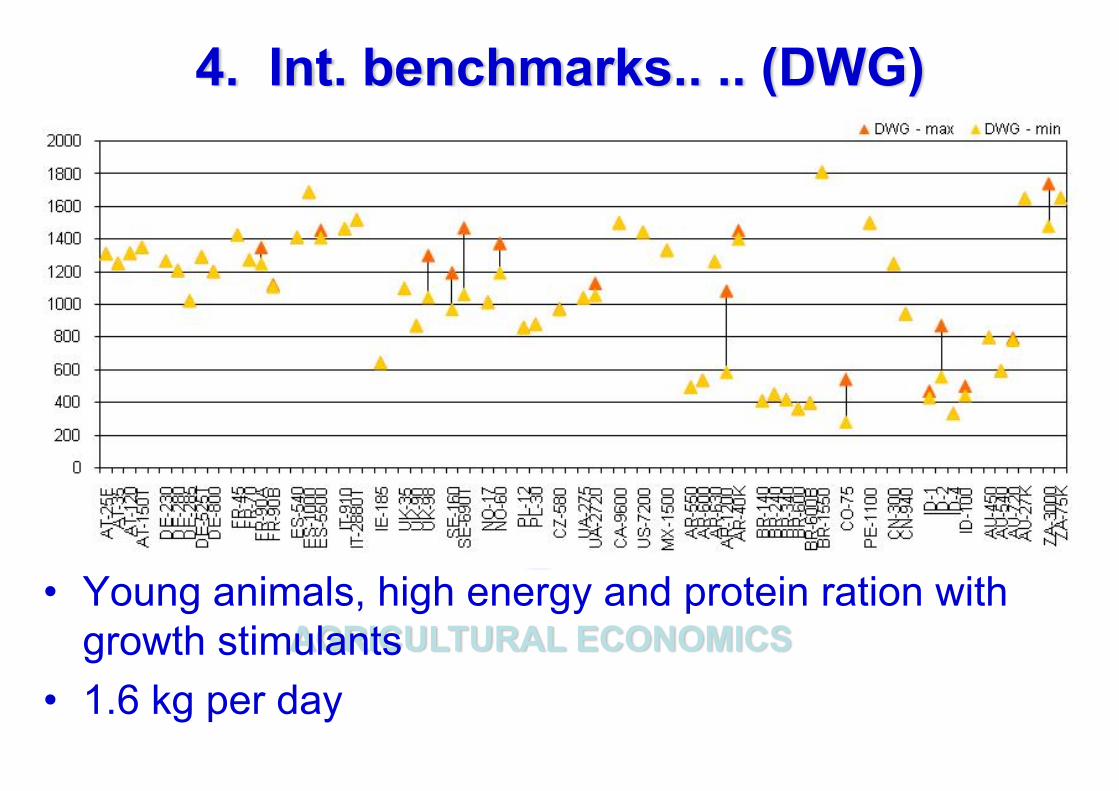
4. Int. benchmarks.. .. (DWG)
• Young animals, high energy and protein ration with growth stimulants
• 1.6 kg per day
AGRICULTURAL ECONOMICS
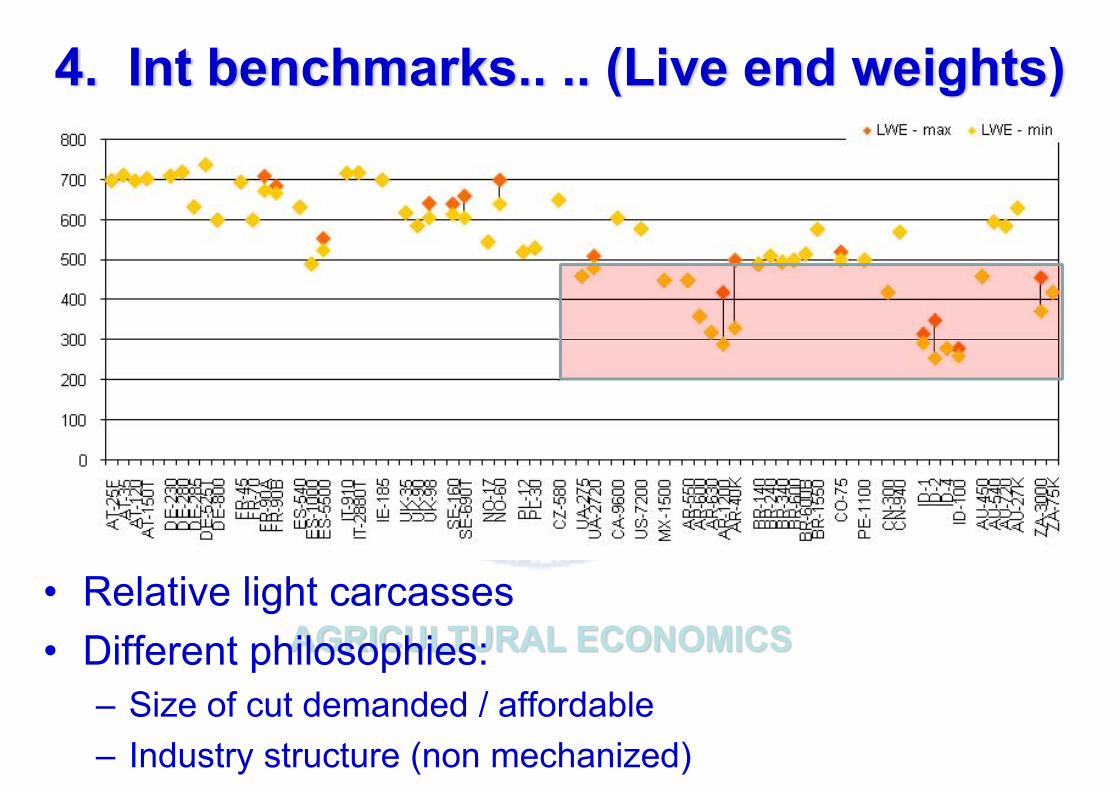
4. Int benchmarks.. .. (Live end weights)
• Relative light carcasses • Different philosophies:
– Size of cut demanded / affordable– Industry structure (non mechanized)
AGRICULTURAL ECONOMICS
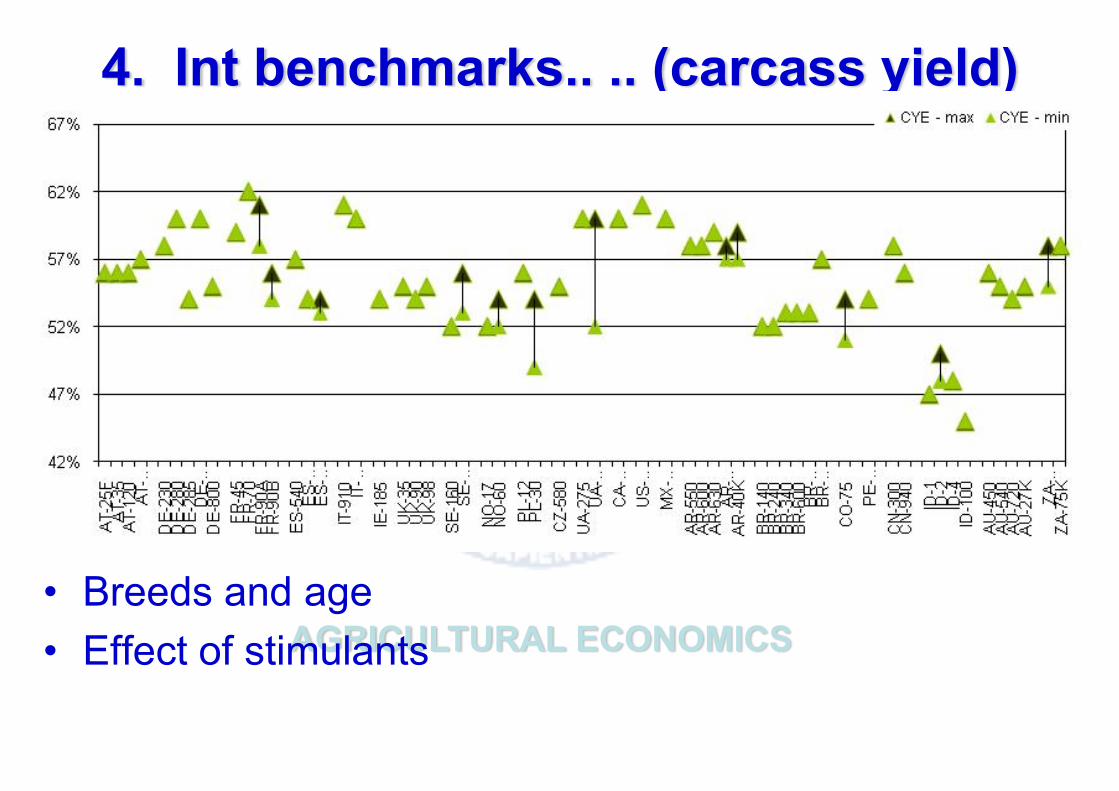
4. Int benchmarks.. .. (carcass yield)
• Breeds and age• Effect of stimulants

AGRICULTURAL ECONOMICS
286
4. Challenges
• Accurate and timely information flow• Trade issues• The impact of the informal trade
– Application of regulations (e.g. Food Safety)– Payment of taxes (e.g. VAT)
• Traceability • Farmer development• Disease control• Hormone debate – consumer preferences• Product development and innovation
AGRICULTURAL ECONOMICS
287
4. Challenges…..
• Production scope – significant beef exports in future??– Low levels of productivity in communal sector– Light carcass weights
• I.e. possible, but not likely

AGRICULTURAL ECONOMICS
5. Summary• Strong demand – short term crisis• Increased supply – how and from where• Relative meat/protein prices – food
inflation• Quality meat – affordable and value for
money• Integrated value chain approach