Embed Size (px)
Citation preview

8/3/2019 Causal Forecasting Final
http://slidepdf.com/reader/full/causal-forecasting-final 1/29

8/3/2019 Causal Forecasting Final
http://slidepdf.com/reader/full/causal-forecasting-final 2/29
What will be covered?What will be covered?
What is forecasting?What is forecasting?
Methods of forecastingMethods of forecasting What is Causal Forecasting?What is Causal Forecasting?
When is Causal Forecasting Used?When is Causal Forecasting Used?
Methods of Causal ForecastingMethods of Causal Forecasting Example of Causal ForecastingExample of Causal Forecasting

8/3/2019 Causal Forecasting Final
http://slidepdf.com/reader/full/causal-forecasting-final 3/29
What is Forecasting?What is Forecasting?
Forecasting is a process of estimatingForecasting is a process of estimatingthe unknownthe unknown

8/3/2019 Causal Forecasting Final
http://slidepdf.com/reader/full/causal-forecasting-final 4/29
Business ApplicationsBusiness Applications
Basis for most Basis for most planning decisions planning decisions
± ± SchedulingScheduling ± ± InventoryInventory
± ± ProductionProduction
± ± Facility LayoutFacility Layout
± ± Workforce
Workforce
± ± Distr i butionDistr i bution
± ± PurchasingPurchasing
± ± SalesSales

8/3/2019 Causal Forecasting Final
http://slidepdf.com/reader/full/causal-forecasting-final 5/29
Methods of ForecastingMethods of Forecasting
Time Series MethodsTime Series Methods
Causal Forecasting MethodsCausal Forecasting Methods
Qualitative MethodsQualitative Methods

8/3/2019 Causal Forecasting Final
http://slidepdf.com/reader/full/causal-forecasting-final 6/29
What is Causal Forecasting?What is Causal Forecasting?
Causal forecasting methodsCausal forecasting methods are based on theare based on the
relationshi p between the var ia ble to berelationshi p between the var ia ble to beforecasted and an independent var ia ble.forecasted and an independent var ia ble.

8/3/2019 Causal Forecasting Final
http://slidepdf.com/reader/full/causal-forecasting-final 7/29
When Is Causal ForecastingWhen Is Causal Forecasting
Used?Used?
K now or believe something causedK now or believe something causeddemand to act a certain waydemand to act a certain way
Demand or sales patterns that varyDemand or sales patterns that varydrastically with planned or unplanneddrastically with planned or unplannedeventsevents
8/3/2019 Causal Forecasting Final
http://slidepdf.com/reader/full/causal-forecasting-final 8/29
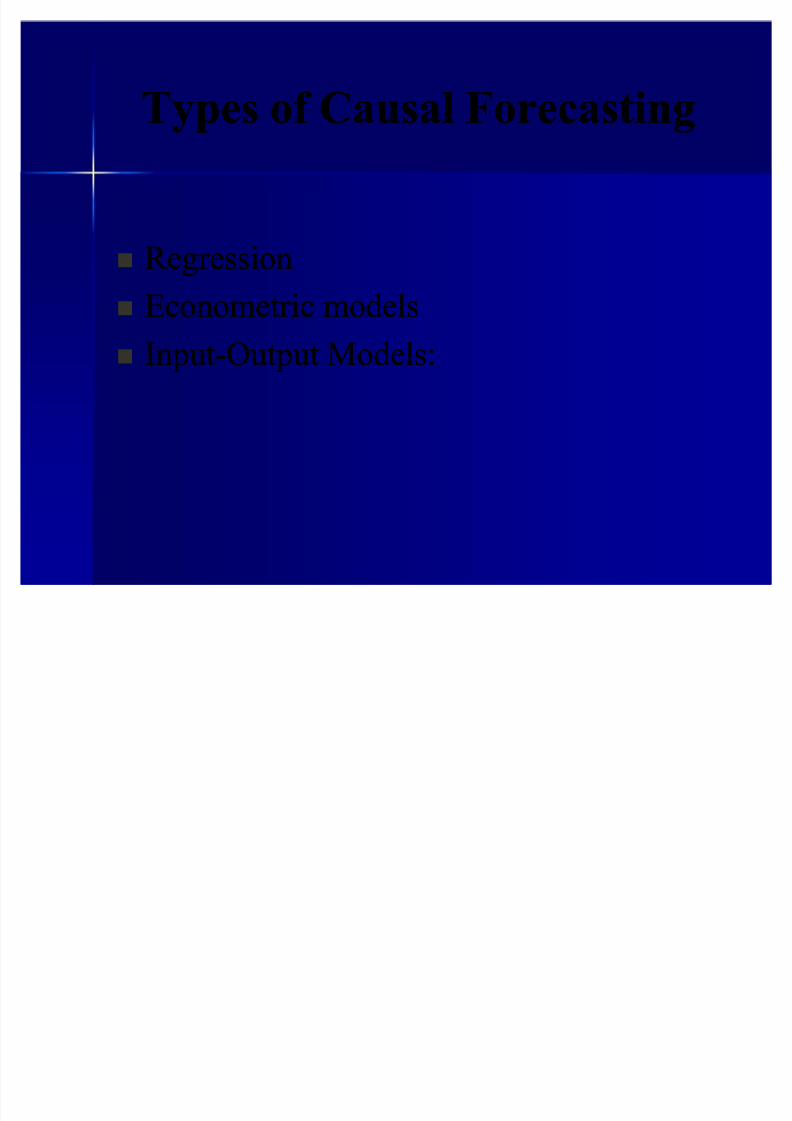
Types of Causal ForecastingTypes of Causal Forecasting
R egressionR egression
Econometr ic modelsEconometr ic models
InputInput--Out put Models:Out put Models:

8/3/2019 Causal Forecasting Final
http://slidepdf.com/reader/full/causal-forecasting-final 9/29
R egression Analysis ModelingR egression Analysis Modeling
ProsPros Increased accuraciesIncreased accuracies
ReliabilityReliability Look at multiple factors of demandLook at multiple factors of demand
ConsCons Difficult to interpret Difficult to interpret Complicated mathComplicated math

8/3/2019 Causal Forecasting Final
http://slidepdf.com/reader/full/causal-forecasting-final 10/29
Linear RegressionLinear Regression
Line FormulaLine Formula
y = a + bxy = a + bx
y = the dependent variabley = the dependent variable
a = the intercept a = the intercept b = the slope of the lineb = the slope of the line
x = the independent variablex = the independent variable

8/3/2019 Causal Forecasting Final
http://slidepdf.com/reader/full/causal-forecasting-final 11/29
Linear RegressionLinear Regression
FormulasFormulas
a = Y a = Y bX bX b =b = xyxy nXY nXY
x²x² -- nX²nX²
a = intercept a = intercept
b = slope of the lineb = slope of the line
X =X = xx = mean of x= mean of xn the x datan the x data
Y = Y = yy = mean of y= mean of y
n the y datan the y data
n = number of periodsn = number of periods

8/3/2019 Causal Forecasting Final
http://slidepdf.com/reader/full/causal-forecasting-final 12/29
CorrelationCorrelation
Measures the strength of theMeasures the strength of therelationship between the dependent relationship between the dependent and independent variableand independent variable

8/3/2019 Causal Forecasting Final
http://slidepdf.com/reader/full/causal-forecasting-final 13/29
Correlation CoefficientCorrelation Coefficient
FormulaFormula
r =r = ______nxy ______nxy -- xy______xy______
[nx²[nx² -- (x)²][ny²(x)²][ny² -- (y)²](y)²]
______________________________________ ______________________________________
r = correlation coefficient r = correlation coefficient
n = number of periodsn = number of periodsx = the independent variablex = the independent variable
y = the dependent variabley = the dependent variable

8/3/2019 Causal Forecasting Final
http://slidepdf.com/reader/full/causal-forecasting-final 14/29
Coefficient ofCoefficient of
DeterminationDetermination A nother measure of the relationship A nother measure of the relationship
between the dependant andbetween the dependant and
independent variableindependent variable Measures the percentage of variationMeasures the percentage of variation
in the dependent (y) variable that isin the dependent (y) variable that isattributed to the independent (x)attributed to the independent (x)variablevariable
r = r²r = r²
8/3/2019 Causal Forecasting Final
http://slidepdf.com/reader/full/causal-forecasting-final 15/29

8/3/2019 Causal Forecasting Final
http://slidepdf.com/reader/full/causal-forecasting-final 16/29
Example of LinearExample of Linear
RegressionRegression# of # of Yards of Yards of
WeekWeek Housing startsHousing starts Concrete OrderedConcrete Orderedxx yy xyxy x²x² y²y²
11 1111 225225 24752475 121121 5062550625
22 1515 250250 37503750 225225 625006250033 2222 336336 73927392 484484 11289611289644 1919 310310 58905890 361361 961009610055 1717 325325 55255525 289289 10562510562566 2626 463463 1203812038 676676 21436921436977 1818 249249 44824482 324324 620016200188 1818 267267 48064806 324324 7128971289
99 2929 379379 1099110991 841841 1436411436411010 1616 300300 48004800 256256 9000090000TotalTotal 191191 31043104 62149 390162149 3901 10090461009046

8/3/2019 Causal Forecasting Final
http://slidepdf.com/reader/full/causal-forecasting-final 17/29
Example of LinearExample of Linear
RegressionRegressionX = 191/10 = 19.10X = 191/10 = 19.10
Y = 3104/10 = 310.40 Y = 3104/10 = 310.40
b =b = xyxy nxynxy == (62149)(62149) (10)(19.10)(310.40)(10)(19.10)(310.40)
x²x² --nx² (3901)nx² (3901) (10)(19.10)²(10)(19.10)²
b = 11.3191b = 11.3191
a = Y a = Y -- bX = 310.40bX = 310.40 11.3191(19.10)11.3191(19.10)
a = 94.2052a = 94.2052

8/3/2019 Causal Forecasting Final
http://slidepdf.com/reader/full/causal-forecasting-final 18/29
Example of LinearExample of Linear
RegressionRegressionRegression EquationRegression Equation
y = a + bxy = a + bx
y = 94.2052 + 11.3191(x)y = 94.2052 + 11.3191(x)
Concrete ordered for 25 new housing startsConcrete ordered for 25 new housing starts
y = 94.2052 + 11.3191(25)y = 94.2052 + 11.3191(25)y = 377 yardsy = 377 yards

8/3/2019 Causal Forecasting Final
http://slidepdf.com/reader/full/causal-forecasting-final 19/29
Correlation CoefficientCorrelation Coefficient
FormulaFormula
r =r = ______nxy ______nxy -- xy______xy______
[nx²[nx² -- (x)²][ny²(x)²][ny² -- (y)²](y)²] ______________________________________ ______________________________________
r = correlation coefficient r = correlation coefficient
n = number of periodsn = number of periodsx = the independent variablex = the independent variable
y = the dependent variabley = the dependent variable

8/3/2019 Causal Forecasting Final
http://slidepdf.com/reader/full/causal-forecasting-final 20/29

8/3/2019 Causal Forecasting Final
http://slidepdf.com/reader/full/causal-forecasting-final 21/29

8/3/2019 Causal Forecasting Final
http://slidepdf.com/reader/full/causal-forecasting-final 22/29
Excel Regression ExampleExcel Regression Example
# of Housing # of Yards
Week Starts of ConcreteOrdered
x y1 11 225
2 15 250
3 22 336
4 19 310
5 17 325
6 26 463
7 18 249
8 18 2679 29 379
10 16 300
8/3/2019 Causal Forecasting Final
http://slidepdf.com/reader/full/causal-forecasting-final 23/29
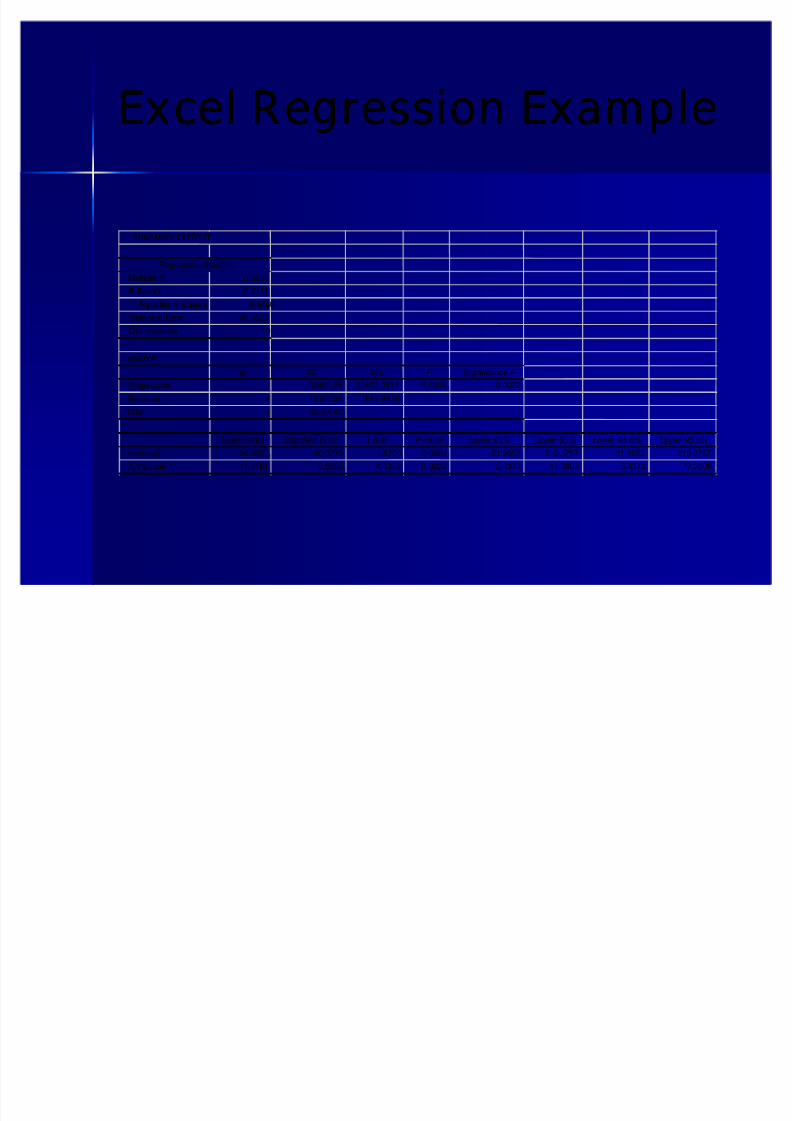
Excel Regression ExampleExcel Regression Example
SUMMARY OUTPUT
Regression Statistics
Multiple R 0.8433R Square 0.7111
Adjusted R Square 0.6750
Standard Error 40.5622
Observations 10
ANOVA
df SS MS F Significance F
Regression 1 32402.05 32402.0512 19.6938 0.0022
Residual 8 13162.35 1645.2936
Total 9 45564.40
Coefficients Standard Error t Stat P-value Lower 95% Upper 95% Lower 95.0% Upper 95.0%
Intercept 94.2052 50.3773 1.8700 0.0984 -21.9652 210.3757 -21.9652 210.3757
X Variable 1 11.3191 2.5506 4.4378 0.0022 5.4373 17.2009 5.4373 17.2009

8/3/2019 Causal Forecasting Final
http://slidepdf.com/reader/full/causal-forecasting-final 24/29
Excel Regression ExampleExcel Regression Example
SUMMARY OUTPUT
Regression Statistics
Multiple R 0.8433
R Square 0.7111
Adjusted R Square 0.6750
Standard Error 40.5622
Observations 10
ANOVA
df
Regression 1
Residual 8
Total 9
Coefficients
Intercept 94.2052
X Variable 1 11.3191

8/3/2019 Causal Forecasting Final
http://slidepdf.com/reader/full/causal-forecasting-final 25/29
Compare Excel to ManualCompare Excel to Manual
RegressionRegressionManual ResultsManual Results
a = 94.2052a = 94.2052
b = 11.3191b = 11.3191y = 94.2052 +y = 94.2052 +
11.3191(25)11.3191(25)
y = 377y = 377
Excel ResultsExcel Results
a = 94.2052a = 94.2052
b = 11.3191b = 11.3191y = 94.2052 +y = 94.2052 +
11.3191(25)11.3191(25)
y = 377y = 377

8/3/2019 Causal Forecasting Final
http://slidepdf.com/reader/full/causal-forecasting-final 26/29
Excel Correlation andExcel Correlation and
Coefficient of DeterminationCoefficient of Determination
Multiple R 0.8433
R Square 0.7111
Regression Statistics

8/3/2019 Causal Forecasting Final
http://slidepdf.com/reader/full/causal-forecasting-final 27/29
Compare Excel to ManualCompare Excel to Manual
RegressionRegression Manual ResultsManual Results
r = .8344r = .8344r² = .7111r² = .7111
Excel ResultsExcel Results
r = .8344r = .8344r² = .7111r² = .7111

8/3/2019 Causal Forecasting Final
http://slidepdf.com/reader/full/causal-forecasting-final 28/29
ConclusionConclusion
Causal forecasting is accurate andCausal forecasting is accurate andefficient efficient
When strong correlation exists theWhen strong correlation exists themodel is very effectivemodel is very effective
No forecasting method is 100%No forecasting method is 100%
effectiveeffective
8/3/2019 Causal Forecasting Final
http://slidepdf.com/reader/full/causal-forecasting-final 29/29
Reading ListReading List
Lapide, Larry,Lapide, Larry, New Developments in BusinessNew Developments in BusinessForecasting,Forecasting, Journal of Business ForecastingJournal of Business ForecastingMethods & Systems, Summer 99, Vol. 18, Issue 2Methods & Systems, Summer 99, Vol. 18, Issue 2
http://morris.wharton.upenn.edu/forecast http://morris.wharton.upenn.edu/forecast ,,Principles of Forecasting, A Handbook forPrinciples of Forecasting, A Handbook forResearchers and Practitioners,Researchers and Practitioners, Edited by J. Scott Edited by J. Scott A rmstrong, University of Pennsylvania A rmstrong, University of Pennsylvania
www.uoguelph.ca/~dsparlin/forecast.htmwww.uoguelph.ca/~dsparlin/forecast.htm,,ForecastingForecasting