Embed Size (px)
Citation preview
1
COCA-COLA AMATIL LIMITED ABN 26 004 139 397
ASX Announcement
7 November 2013
CCA HOSTS INVESTOR TOUR
Coca-Cola Amatil Limited is hosting investors on a tour of its beverage production and warehousing facilities in Jakarta, Indonesia. Attached is a copy of the management presentations that will be made as part of the two day trip.
For further information, please contact: Media Analysts Sally Loane Kristina Devon Ph: +61 2 9259 6797 Ph: +61 2 9259 6185 [email protected] [email protected]
2
COCA-COLA AMATIL LIMITED ABN 26 004 139 397
THIS PAGE INTENTIONALLY LEFT BLANK
11
CCA Strategy ReviewIndonesia Investor Tour
Nov 7-8, 2013
Terry Davis Group Managing Director
2
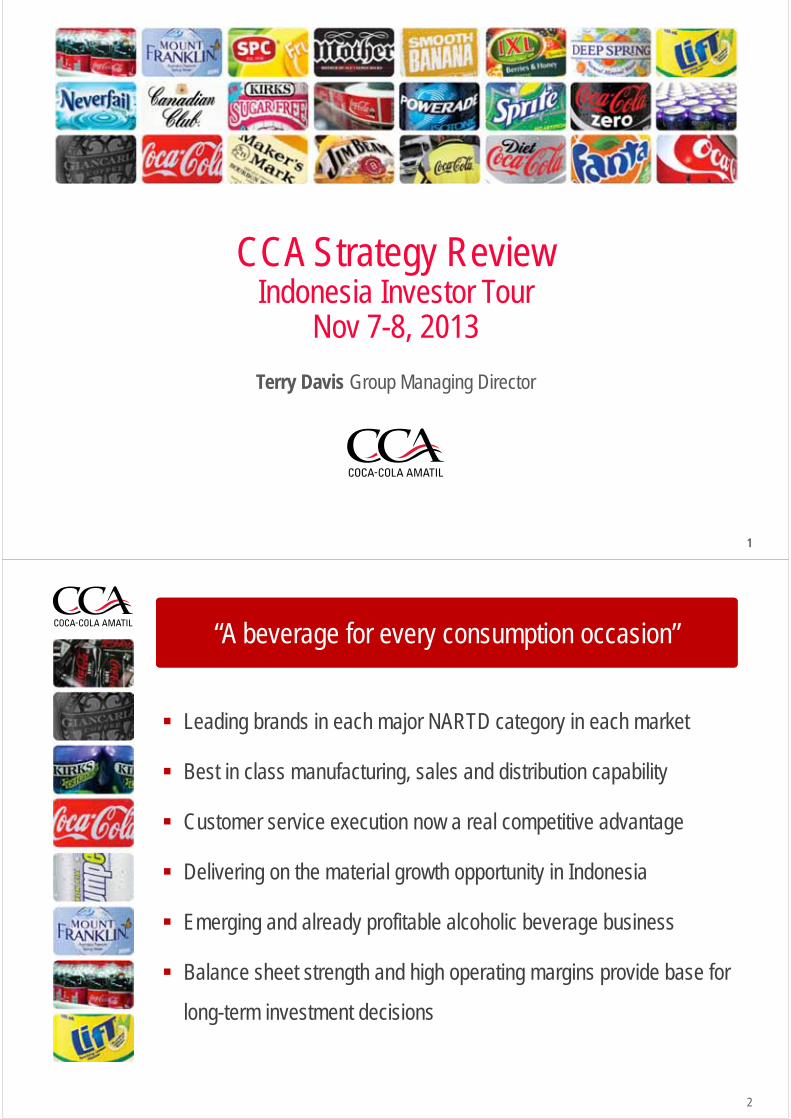
Leading brands in each major NARTD category in each market
Best in class manufacturing, sales and distribution capability
Customer service execution now a real competitive advantage
Delivering on the material growth opportunity in Indonesia
Emerging and already profitable alcoholic beverage business
Balance sheet strength and high operating margins provide base for
long-term investment decisions
“A beverage for every consumption occasion”
3
Key Business Drivers
Continue to grow the core Australian & New Zealand businesses
Continue to strengthen market leadership position with innovative new products and packages
Accelerate the cold drink cooler placement programme to drive greater availability and sales of cold
beverages
Deliver efficiency gains by leveraging the investments made over the past few years on state-of-the-art
production and IT infrastructure
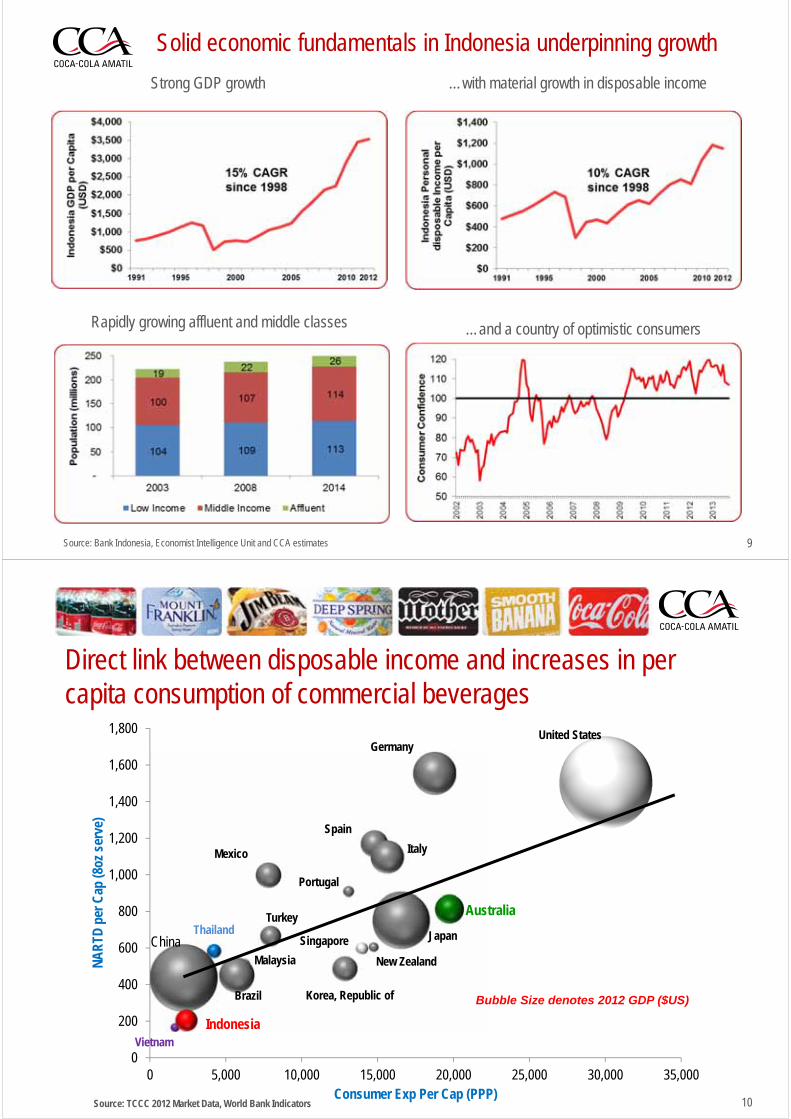
Accelerate the growth of the Indonesian business
Expand the brand portfolio to meet the needs of the growing “middle class” population
Develop lower priced entry packs through returnable-glass and small PET bottles to increase per
capita consumption of the C/D consumer groups
Further increase in production capacity, cold drink cooler footprint and sales & distribution capability to
keep pace with rapidly growing demand
Leverage best in class sales, distribution and logistics to grow premium alcoholic
beverages in Australia and New Zealand
Proven track record in adding significant value to premium alcoholic beverage brands
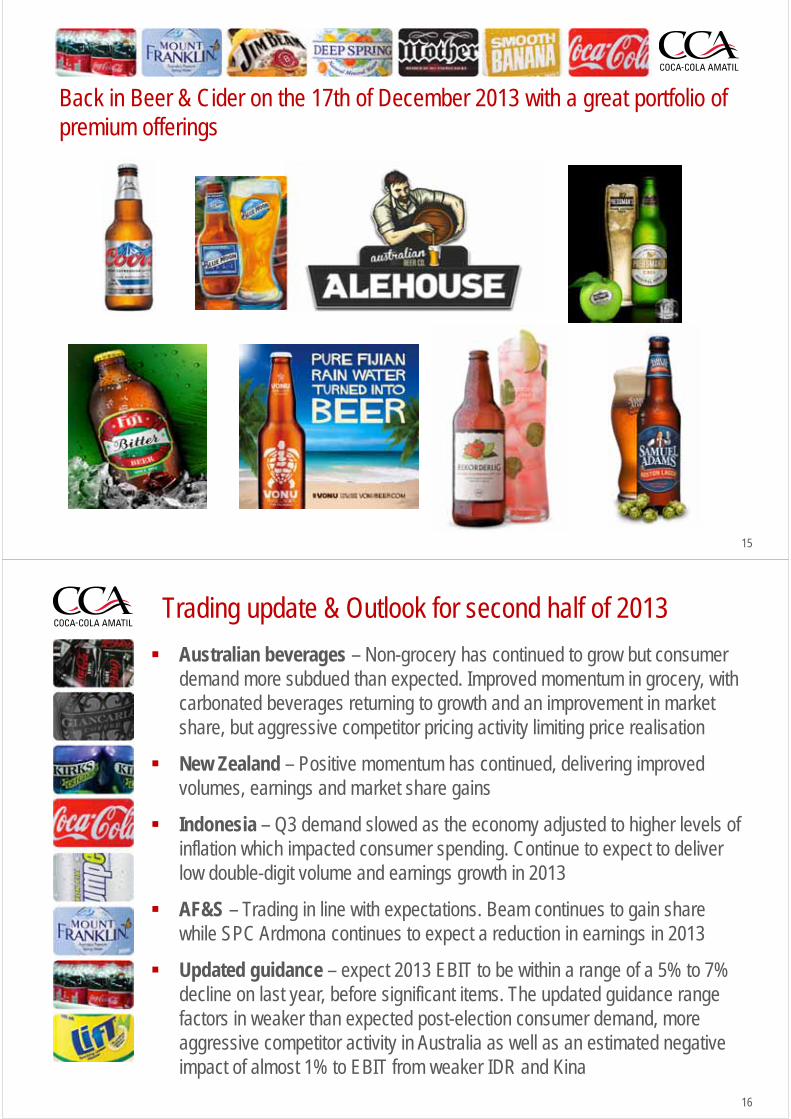
Back in beer and cider in Australia in December 2013 with leading international premium brands
including a range of Molson Coors and Samuel Adams beers, Rekorderlig cider and a portfolio of
Australian premium and craft beers
4
2,300
2,400
2,500
2,600
2,700
2,800
2,900
3,000
230
240
250
260
270
280
290
2004 2006 2008 2010 2012
Con
sum
ptio
n U
nit S
ales
(m)
Volu
me
Uni
t Cas
es (m
)
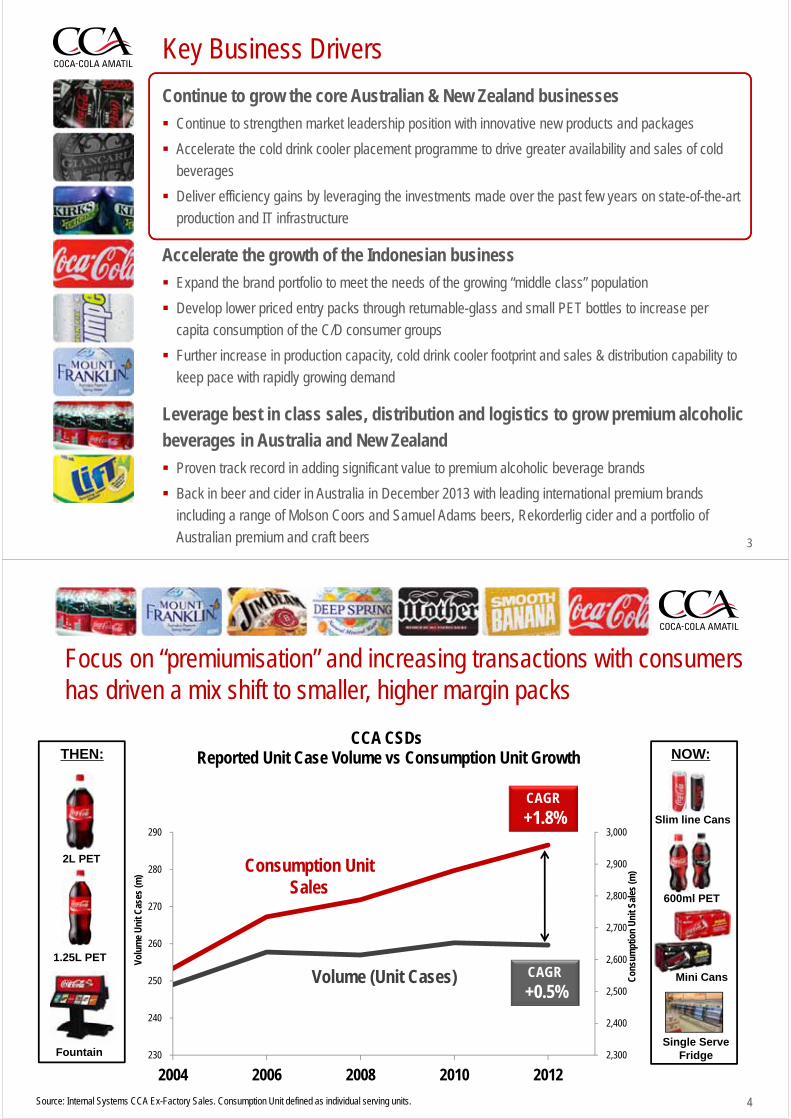
CCA CSDsReported Unit Case Volume vs Consumption Unit Growth
Volume (Unit Cases)
Consumption Unit Sales
CAGR
+0.5%
CAGR
+1.8%
Source: Internal Systems CCA Ex-Factory Sales. Consumption Unit defined as individual serving units.
2L PET
Mini Cans
THEN: NOW:
1.25L PET
Fountain
600ml PET
Slim line Cans
Single Serve Fridge
Focus on “premiumisation” and increasing transactions with consumers has driven a mix shift to smaller, higher margin packs
5
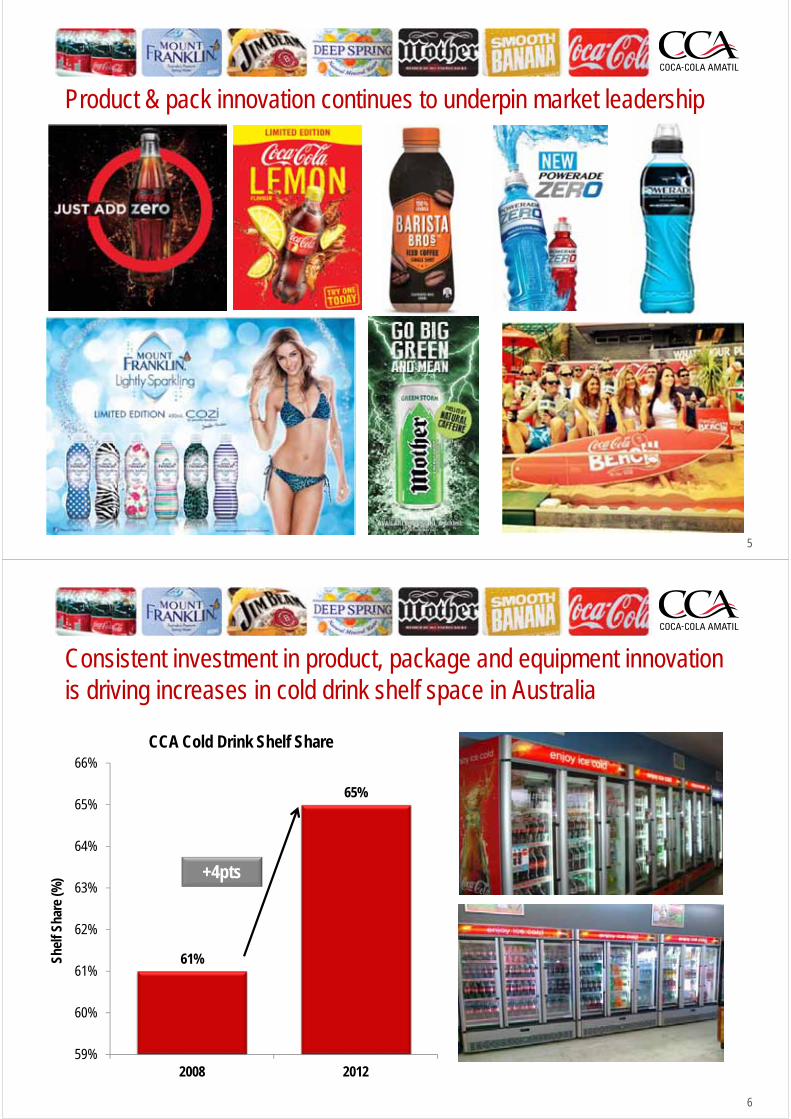
Product & pack innovation continues to underpin market leadership
6
Consistent investment in product, package and equipment innovation is driving increases in cold drink shelf space in Australia
61%
65%
59%
60%
61%
62%
63%
64%
65%
66%
2008 2012
Shel
f Sha
re (%
)
CCA Cold Drink Shelf Share
+4pts
7
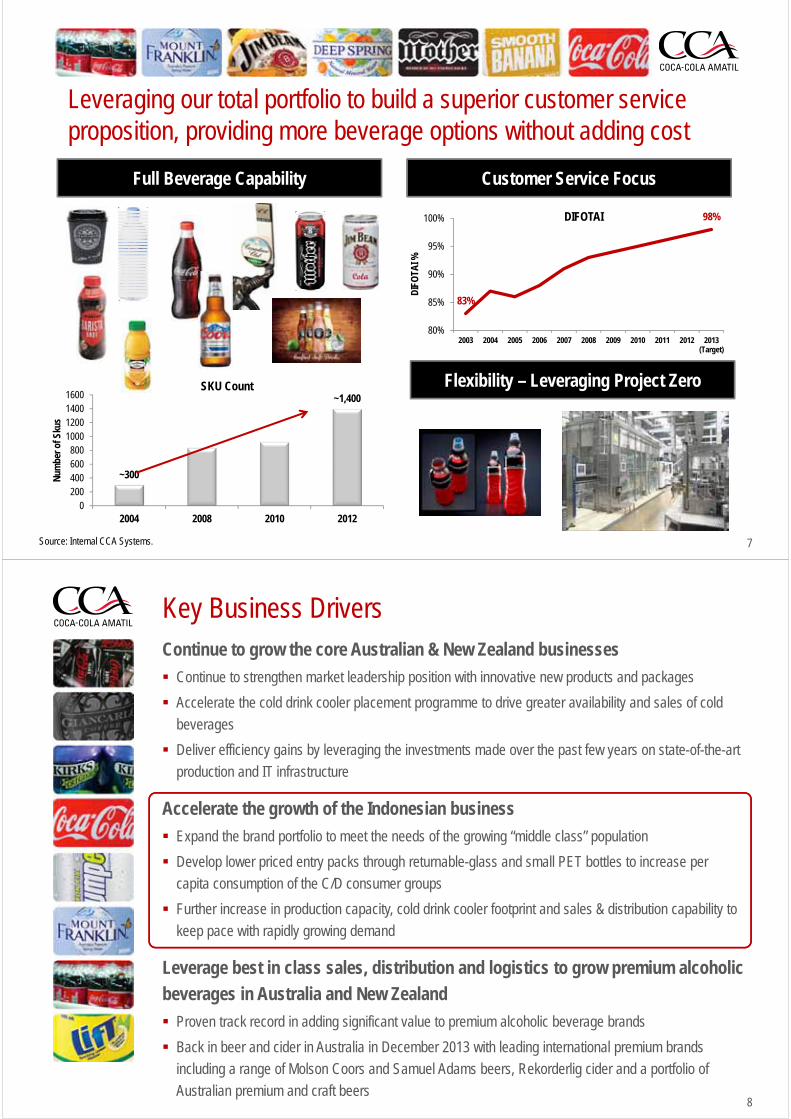
Flexibility – Leveraging Project Zero
Customer Service FocusFull Beverage Capability
83%
98%
80%
85%
90%
95%
100%
2003 2004 2005 2006 2007 2008 2009 2010 2011 2012 2013(Target)
DIF
OTA
I %
DIFOTAI
~300
~1,400
0200400600800
1000120014001600
2004 2008 2010 2012
Num
ber o
f Sku
s
SKU Count
Source: Internal CCA Systems.
Leveraging our total portfolio to build a superior customer service proposition, providing more beverage options without adding cost
8
Key Business DriversContinue to grow the core Australian & New Zealand businesses
Continue to strengthen market leadership position with innovative new products and packages
Accelerate the cold drink cooler placement programme to drive greater availability and sales of cold
beverages
Deliver efficiency gains by leveraging the investments made over the past few years on state-of-the-art
production and IT infrastructure
Accelerate the growth of the Indonesian business
Expand the brand portfolio to meet the needs of the growing “middle class” population
Develop lower priced entry packs through returnable-glass and small PET bottles to increase per
capita consumption of the C/D consumer groups
Further increase in production capacity, cold drink cooler footprint and sales & distribution capability to
keep pace with rapidly growing demand
Leverage best in class sales, distribution and logistics to grow premium alcoholic
beverages in Australia and New Zealand
Proven track record in adding significant value to premium alcoholic beverage brands
Back in beer and cider in Australia in December 2013 with leading international premium brands
including a range of Molson Coors and Samuel Adams beers, Rekorderlig cider and a portfolio of
Australian premium and craft beers
9
Solid economic fundamentals in Indonesia underpinning growth
Strong GDP growth
Rapidly growing affluent and middle classes …and a country of optimistic consumers
…with material growth in disposable income
Source: Bank Indonesia, Economist Intelligence Unit and CCA estimates
10
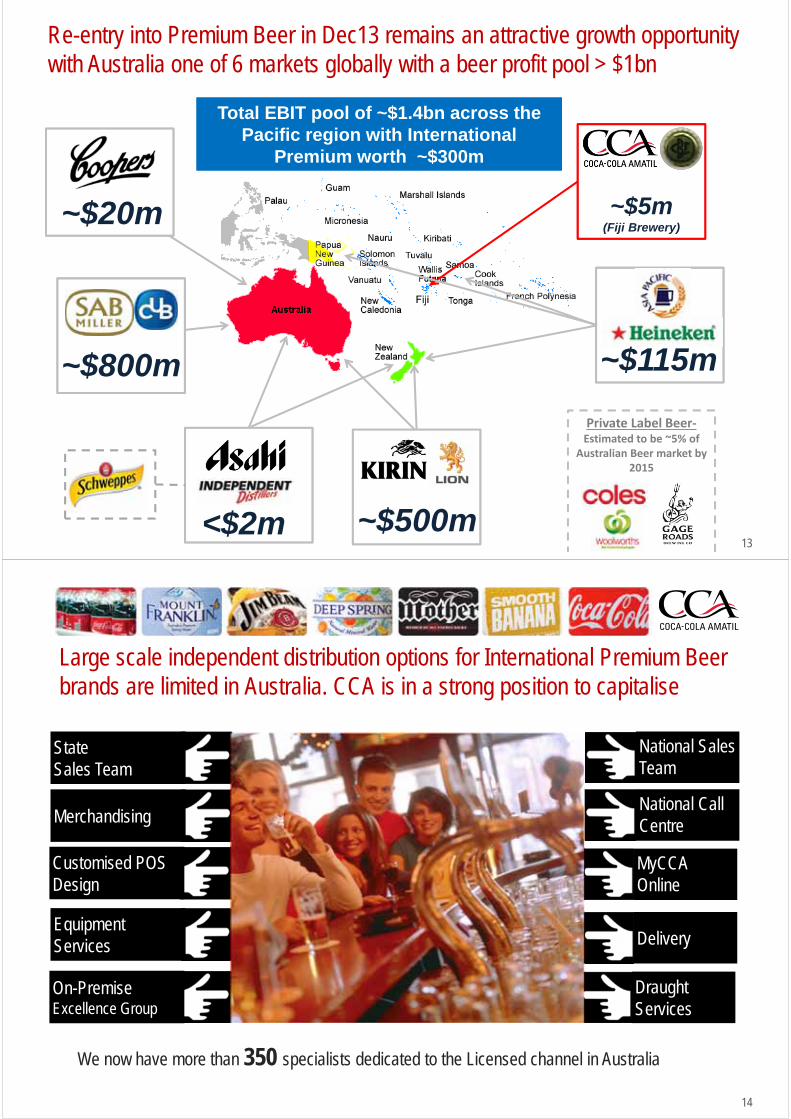
Direct link between disposable income and increases in per capita consumption of commercial beverages
Vietnam
China
Indonesia
Thailand
Malaysia
Brazil
Mexico
Turkey
Korea, Republic of
Portugal
Singapore
Australia
New Zealand
Spain
Japan
Italy
GermanyUnited States
0
200
400
600
800
1,000
1,200
1,400
1,600
1,800
0 5,000 10,000 15,000 20,000 25,000 30,000 35,000
NA
RTD
per
Cap
(8oz
ser
ve)
Consumer Exp Per Cap (PPP)
Bubble Size denotes 2012 GDP ($US)
Source: TCCC 2012 Market Data, World Bank Indicators

11
Indonesia & PNG track record to date has been excellent, achieving good operational leverage as volumes grow
12
Key Business DriversContinue to grow the core Australian & New Zealand businesses
Continue to strengthen market leadership position with innovative new products and packages
Accelerate the cold drink cooler placement programme to drive greater availability and sales of cold
beverages
Deliver efficiency gains by leveraging the investments made over the past few years on state-of-the-art
production and IT infrastructure
Accelerate the growth of the Indonesian business
Expand the brand portfolio to meet the needs of the growing “middle class” population
Develop lower priced entry packs through returnable-glass and small PET bottles to increase per
capita consumption of the C/D consumer groups
Further increase in production capacity, cold drink cooler footprint and sales & distribution capability to
keep pace with rapidly growing demand
Leverage best in class sales, distribution and logistics to grow premium alcoholic
beverages in Australia and New Zealand
Proven track record in adding significant value to premium alcoholic beverage brands
Back in beer and cider in Australia in December 2013 with leading international premium brands
including a range of Molson Coors and Samuel Adams beers, Rekorderlig cider and a portfolio of
Australian premium and craft beers
13
Re-entry into Premium Beer in Dec13 remains an attractive growth opportunity with Australia one of 6 markets globally with a beer profit pool > $1bn
Private Label Beer‐Estimated to be ~5% of
Australian Beer market by 2015
~$20m
~$115m
~$500m
~$800m
<$2m
~$5m(Fiji Brewery)
Total EBIT pool of ~$1.4bn across the Pacific region with International
Premium worth ~$300m
Total EBIT pool of ~$1.4bn across the Pacific region with International
Premium worth ~$300m
14
Large scale independent distribution options for International Premium Beer brands are limited in Australia. CCA is in a strong position to capitalise
National Sales Team
National Call Centre
StateSales Team
Merchandising
Customised POS Design
Equipment Services
MyCCA Online
On-Premise Excellence Group
Delivery
Draught Services
We now have more than 350 specialists dedicated to the Licensed channel in Australia
Licensed picture ????
15
Back in Beer & Cider on the 17th of December 2013 with a great portfolio of premium offerings
16
Trading update & Outlook for second half of 2013
Australian beverages – Non-grocery has continued to grow but consumer demand more subdued than expected. Improved momentum in grocery, with carbonated beverages returning to growth and an improvement in market share, but aggressive competitor pricing activity limiting price realisation
New Zealand – Positive momentum has continued, delivering improved volumes, earnings and market share gains
Indonesia – Q3 demand slowed as the economy adjusted to higher levels of inflation which impacted consumer spending. Continue to expect to deliver low double-digit volume and earnings growth in 2013
AF&S – Trading in line with expectations. Beam continues to gain share while SPC Ardmona continues to expect a reduction in earnings in 2013
Updated guidance – expect 2013 EBIT to be within a range of a 5% to 7% decline on last year, before significant items. The updated guidance range factors in weaker than expected post-election consumer demand, more aggressive competitor activity in Australia as well as an estimated negative impact of almost 1% to EBIT from weaker IDR and Kina
1717
DisclaimerCCA advises that these presentation slides contain forward looking statements which may be subject to significant uncertainties outside of CCA’s control.
No representation is made as to the accuracy or reliability of forward looking statements or the assumptions on which they are based.
Actual future events may vary from these forward looking statements and you are cautioned not to place undue reliance on any forward looking statement.

11
Nessa O’Sullivan Group Chief Financial Officer
Financial & Sustainability ReviewIndonesia Investor Tour
Nov 7-8, 2013
2
Key Financial Objectives
Sustainably driving shareholder value creation through Earnings – achieving the right balance between price, volume, mix and efficiency
gains to deliver sustainable shareholder returns
Dividends – rewarding shareholders along the way with ordinary dividend payout ratio between 70-80% of earnings
Disciplined investment supporting growth objectives – delivering returns well above cost of capital, supporting innovation and productivity gains as well as increasing capacity and competitive advantages
Maintain balance sheet strength and ability to fund investment to develop growth opportunities Conservative debt level and maturity profile supporting A3/A- credit ratings. Debt
maturities fully funded to mid 2015
Capital investment of ~$410m in 2013, with an expectation of reducing capital investment to $325-$350m in 2014 and 2015
Disciplined allocation of Group capital – investment returns remain well above cost of capital – ROCE maintained >20%
3
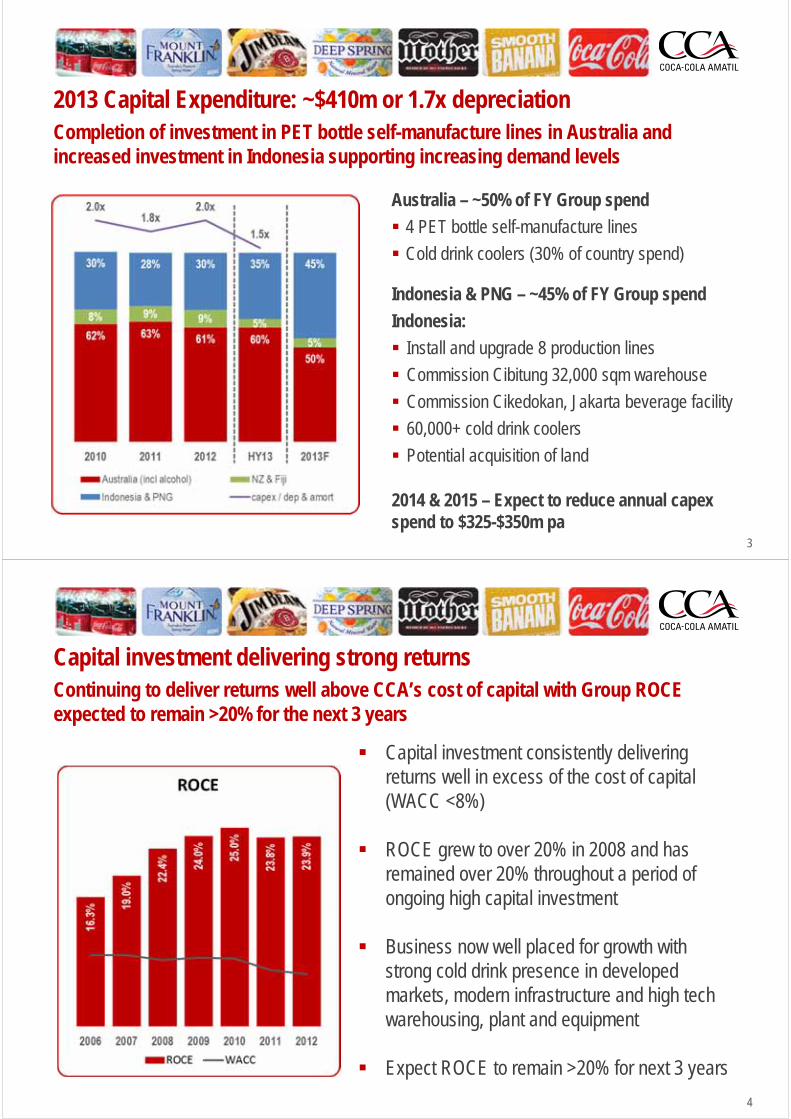
2013 Capital Expenditure: ~$410m or 1.7x depreciationCompletion of investment in PET bottle self-manufacture lines in Australia and increased investment in Indonesia supporting increasing demand levels
Australia – ~50% of FY Group spend
4 PET bottle self-manufacture lines
Cold drink coolers (30% of country spend)
Indonesia & PNG – ~45% of FY Group spend
Indonesia:
Install and upgrade 8 production lines
Commission Cibitung 32,000 sqm warehouse
Commission Cikedokan, Jakarta beverage facility
60,000+ cold drink coolers
Potential acquisition of land
2014 & 2015 – Expect to reduce annual capexspend to $325-$350m pa
4
Capital investment delivering strong returnsContinuing to deliver returns well above CCA’s cost of capital with Group ROCE expected to remain >20% for the next 3 years
Capital investment consistently delivering returns well in excess of the cost of capital (WACC <8%)
ROCE grew to over 20% in 2008 and has remained over 20% throughout a period of ongoing high capital investment
Business now well placed for growth with strong cold drink presence in developed markets, modern infrastructure and high tech warehousing, plant and equipment
Expect ROCE to remain >20% for next 3 years
5
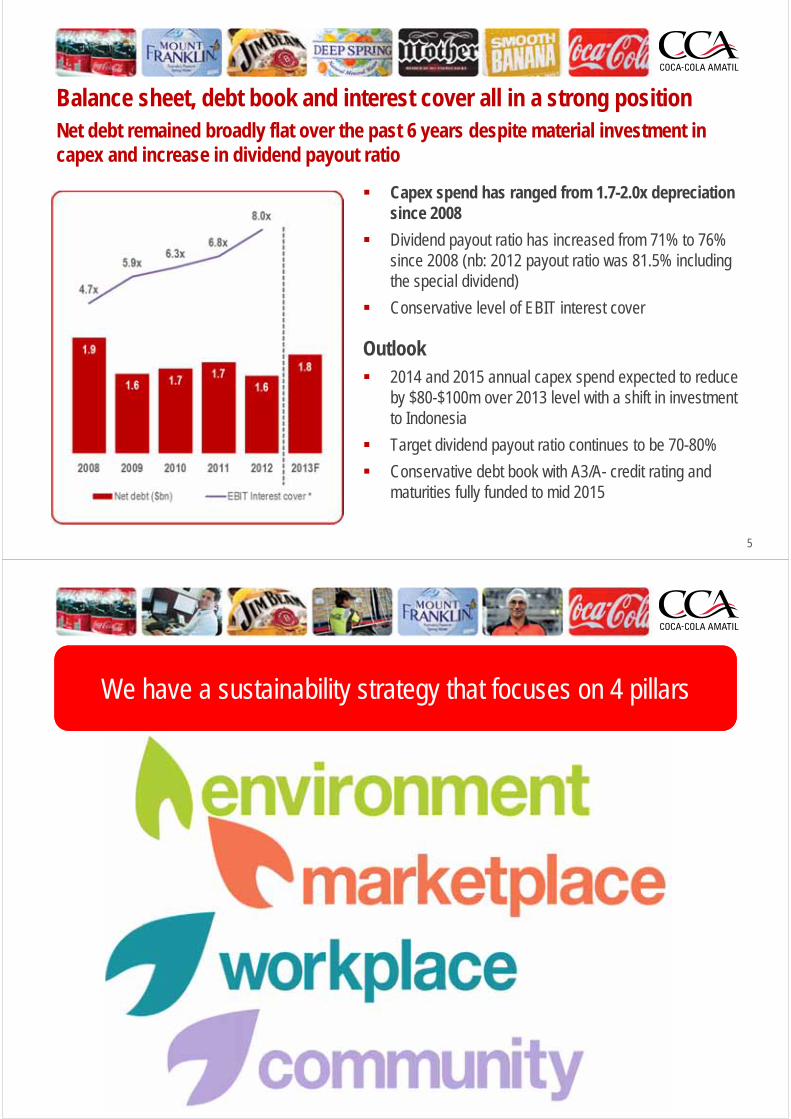
Balance sheet, debt book and interest cover all in a strong positionNet debt remained broadly flat over the past 6 years despite material investment in capex and increase in dividend payout ratio
Capex spend has ranged from 1.7-2.0x depreciation since 2008
Dividend payout ratio has increased from 71% to 76% since 2008 (nb: 2012 payout ratio was 81.5% including the special dividend)
Conservative level of EBIT interest cover
Outlook 2014 and 2015 annual capex spend expected to reduce
by $80-$100m over 2013 level with a shift in investment to Indonesia
Target dividend payout ratio continues to be 70-80%
Conservative debt book with A3/A- credit rating and maturities fully funded to mid 2015
We have a sustainability strategy that focuses on 4 pillarsWe have a sustainability strategy that focuses on 4 pillars
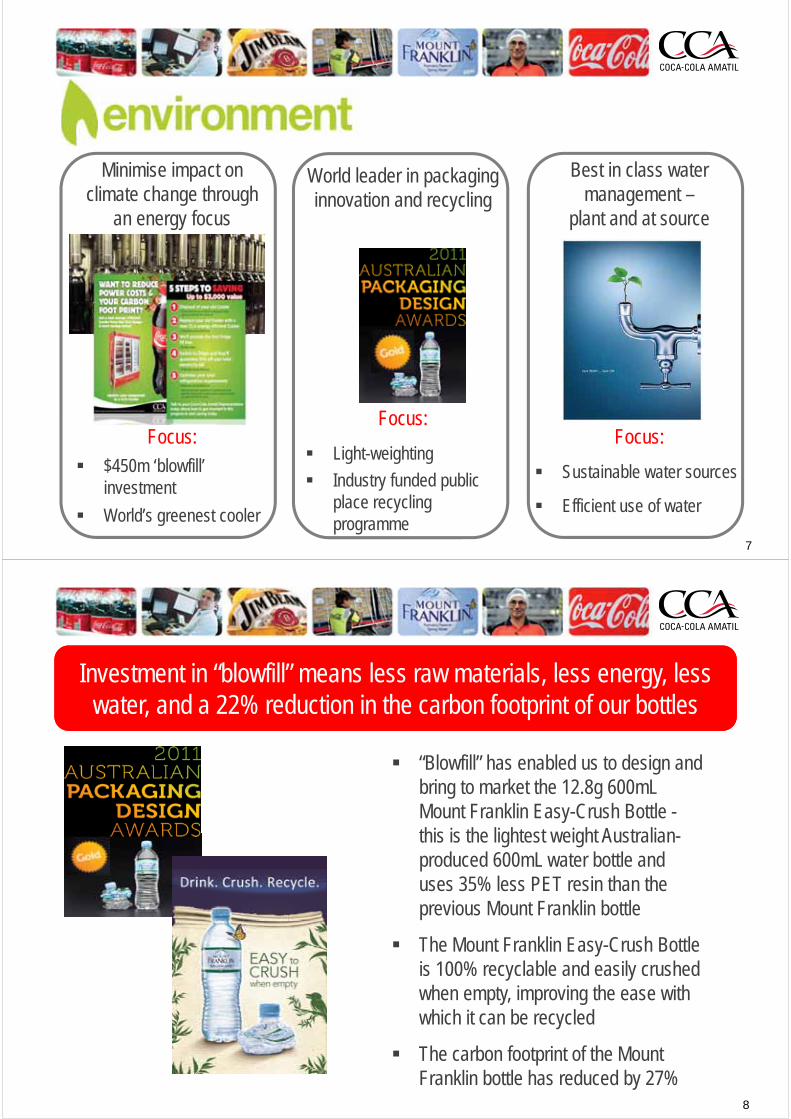
World leader in packaging innovation and recycling
Focus:
Light-weighting
Industry funded public place recycling programme
Minimise impact on climate change through
an energy focus
Focus: $450m ‘blowfill’
investment
World’s greenest cooler
Best in class water management –
plant and at source
Focus:
Sustainable water sources
Efficient use of water
7
Investment in “blowfill” means less raw materials, less energy, less water, and a 22% reduction in the carbon footprint of our bottles
Investment in “blowfill” means less raw materials, less energy, less water, and a 22% reduction in the carbon footprint of our bottles
“Blowfill” has enabled us to design and bring to market the 12.8g 600mL Mount Franklin Easy-Crush Bottle -this is the lightest weight Australian-produced 600mL water bottle and uses 35% less PET resin than the previous Mount Franklin bottle
The Mount Franklin Easy-Crush Bottle is 100% recyclable and easily crushed when empty, improving the ease with which it can be recycled
The carbon footprint of the Mount Franklin bottle has reduced by 27%
8
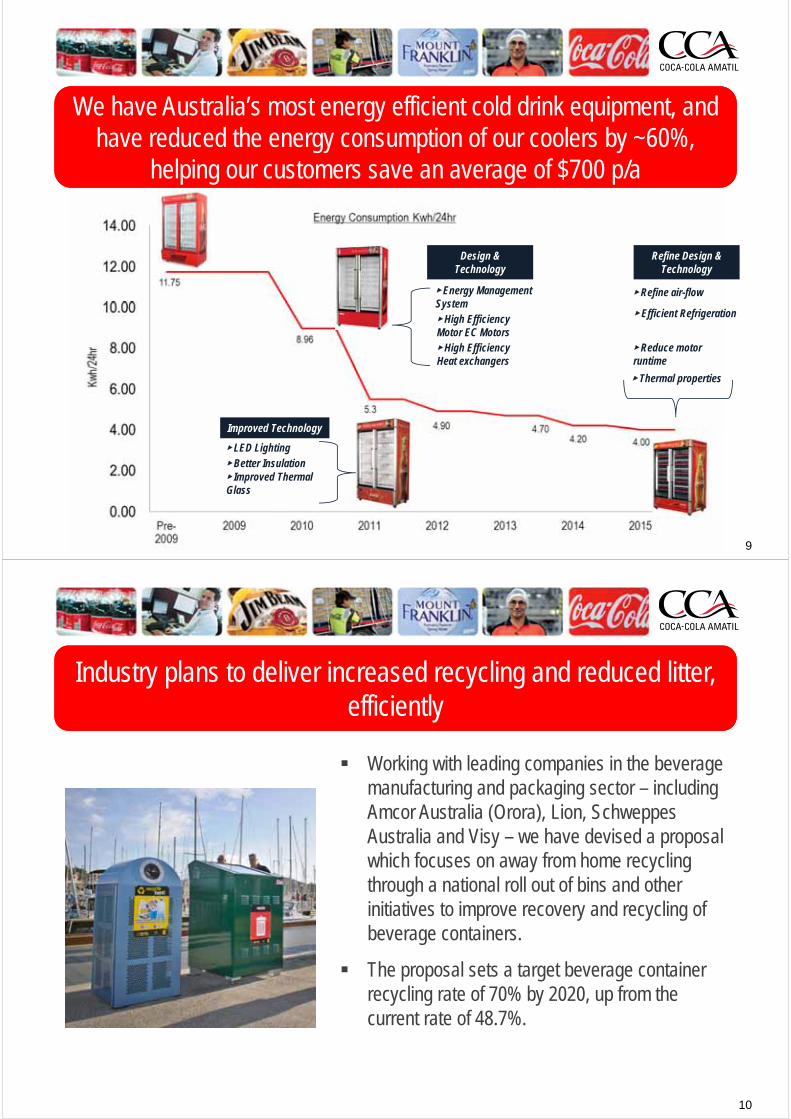
Case study- CCA coolers
► High Efficiency Motor EC Motors
Design & Technology
► High Efficiency Heat exchangers
► Energy Management System
Refine Design & Technology
► Efficient Refrigeration
► Refine air-flow
► Reduce motor runtime
► Thermal properties
Improved Technology
► LED Lighting► Better Insulation► Improved Thermal Glass
We have Australia’s most energy efficient cold drink equipment, and have reduced the energy consumption of our coolers by ~60%,
helping our customers save an average of $700 p/a
We have Australia’s most energy efficient cold drink equipment, and have reduced the energy consumption of our coolers by ~60%,
helping our customers save an average of $700 p/a
9
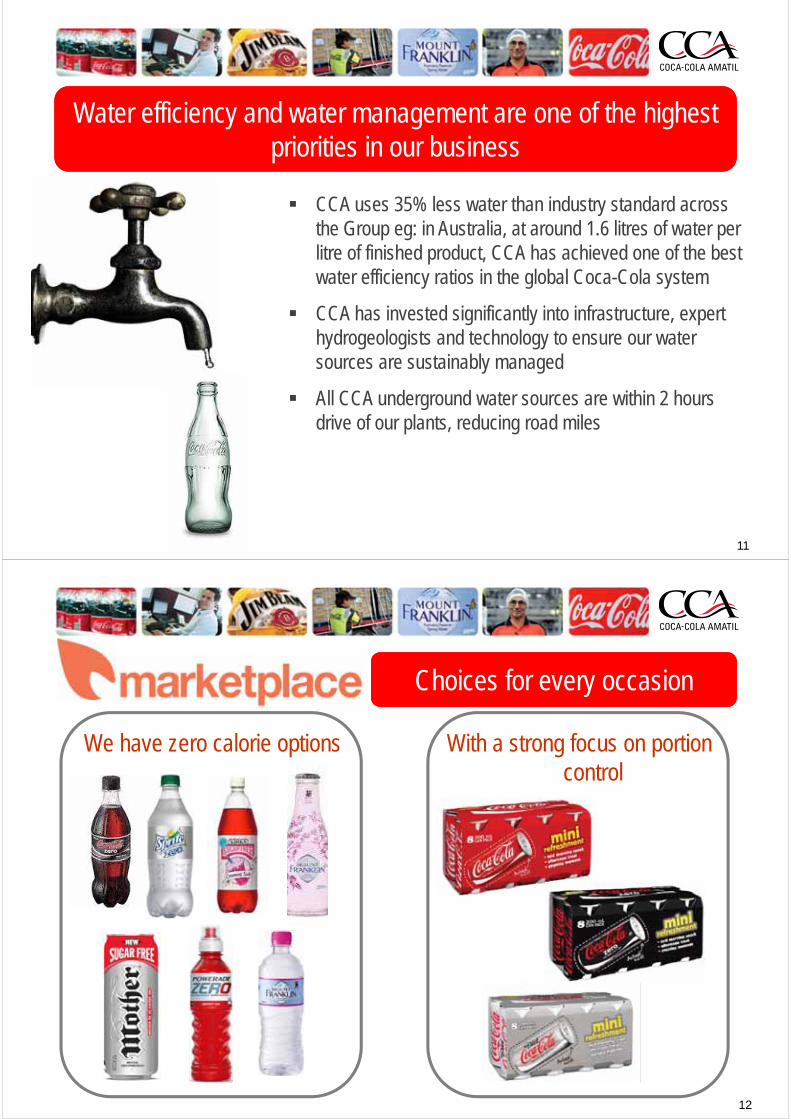
Industry plans to deliver increased recycling and reduced litter, efficiently
Industry plans to deliver increased recycling and reduced litter, efficiently
Working with leading companies in the beverage manufacturing and packaging sector – including Amcor Australia (Orora), Lion, Schweppes Australia and Visy – we have devised a proposal which focuses on away from home recycling through a national roll out of bins and other initiatives to improve recovery and recycling of beverage containers.
The proposal sets a target beverage container recycling rate of 70% by 2020, up from the current rate of 48.7%.
10
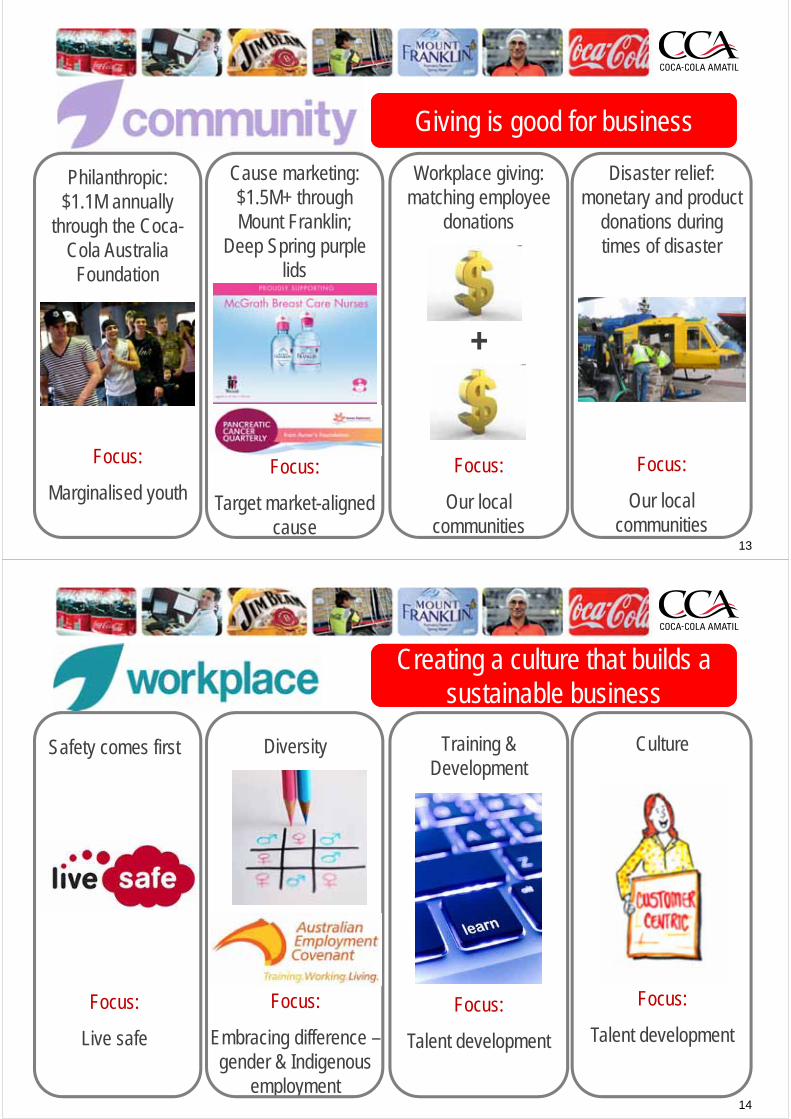
Water efficiency and water management are one of the highest priorities in our business
Water efficiency and water management are one of the highest priorities in our business
CCA uses 35% less water than industry standard across the Group eg: in Australia, at around 1.6 litres of water per litre of finished product, CCA has achieved one of the best water efficiency ratios in the global Coca-Cola system
CCA has invested significantly into infrastructure, expert hydrogeologists and technology to ensure our water sources are sustainably managed
All CCA underground water sources are within 2 hours drive of our plants, reducing road miles
11
We have zero calorie options
Choices for every occasionChoices for every occasion
With a strong focus on portion control
12
Philanthropic: $1.1M annually
through the Coca-Cola Australia
Foundation
Focus:
Marginalised youth
Cause marketing: $1.5M+ through Mount Franklin;
Deep Spring purple lids
Focus:
Target market-aligned cause
Disaster relief: monetary and product
donations during times of disaster
Focus:
Our local communities
Workplace giving: matching employee
donations
+
Focus:
Our local communities
Giving is good for businessGiving is good for business
13
Safety comes first
Focus:
Live safe
Culture
Focus:
Talent development
Diversity
Focus:
Embracing difference –gender & Indigenous
employment
Training & Development
Focus:
Talent development
Creating a culture that builds a sustainable business
Creating a culture that builds a sustainable business
14

1515
DisclaimerCCA advises that these presentation slides contain forward looking statements which may be subject to significant uncertainties outside of CCA’s control.
No representation is made as to the accuracy or reliability of forward looking statements or the assumptions on which they are based.
Actual future events may vary from these forward looking statements and you are cautioned not to place undue reliance on any forward looking statement.
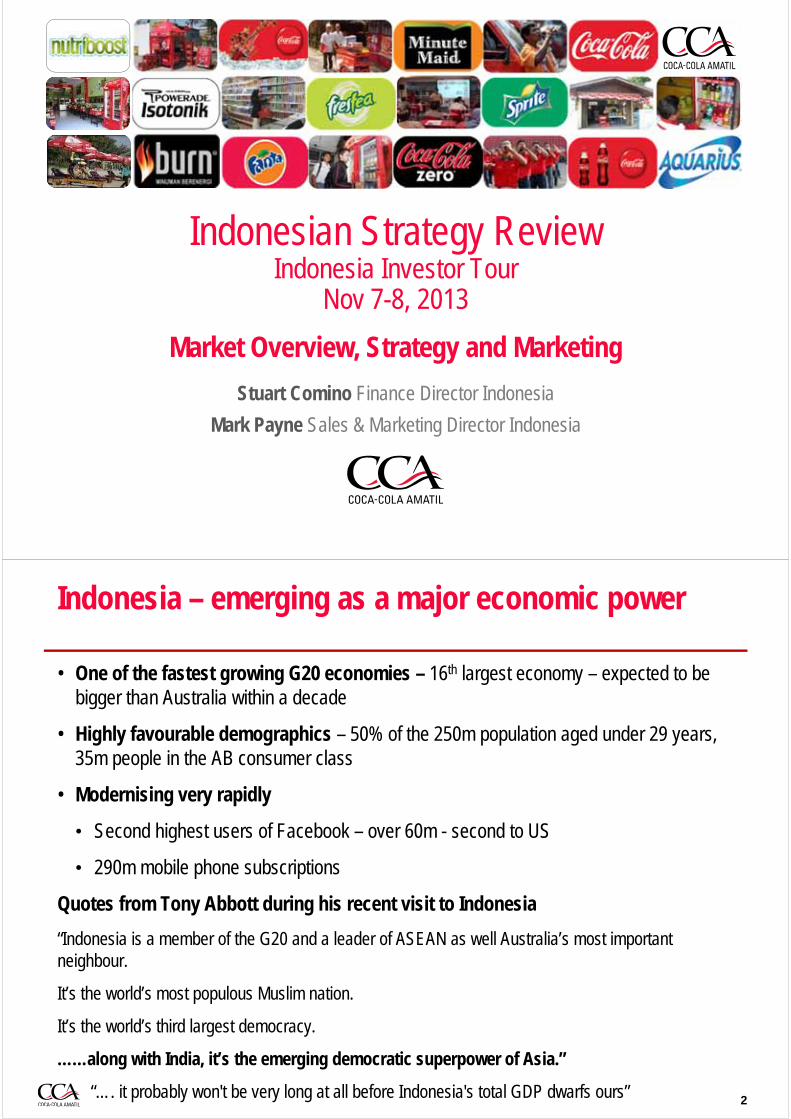
Indonesian Strategy ReviewIndonesia Investor Tour
Nov 7-8, 2013
Market Overview, Strategy and Marketing
Stuart Comino Finance Director Indonesia
Mark Payne Sales & Marketing Director Indonesia
Indonesia – emerging as a major economic power
• One of the fastest growing G20 economies – 16th largest economy – expected to be bigger than Australia within a decade
• Highly favourable demographics – 50% of the 250m population aged under 29 years, 35m people in the AB consumer class
• Modernising very rapidly
• Second highest users of Facebook – over 60m - second to US
• 290m mobile phone subscriptions
Quotes from Tony Abbott during his recent visit to Indonesia
“Indonesia is a member of the G20 and a leader of ASEAN as well Australia’s most important neighbour.
It’s the world’s most populous Muslim nation.
It’s the world’s third largest democracy.
……along with India, it’s the emerging democratic superpower of Asia.”
“…. it probably won't be very long at all before Indonesia's total GDP dwarfs ours” 2
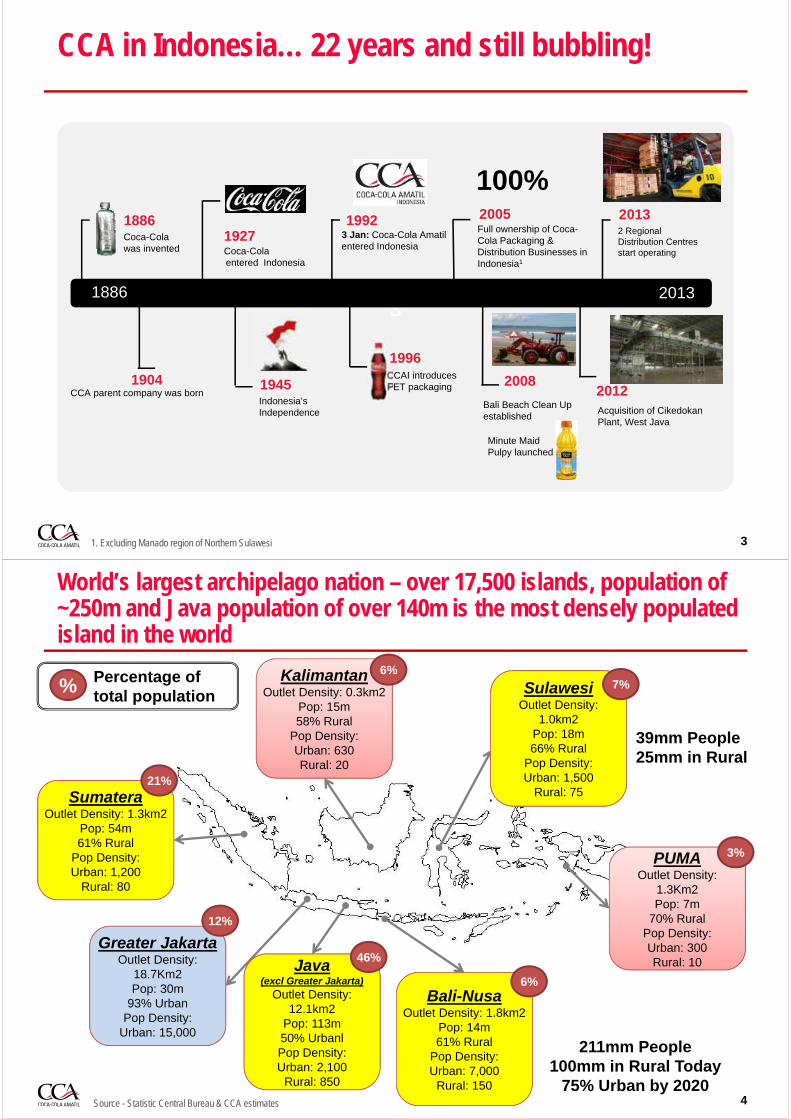
CCA in Indonesia… 22 years and still bubbling!
31. Excluding Manado region of Northern Sulawesi
s
Coca-Cola was invented
1886
1904Indonesia’s Independence
1886
2 Regional Distribution Centresstart operating
CCAI introduces PET packaging
2013
Coca-Cola entered Indonesia
1927
1945
3 Jan: Coca-Cola Amatilentered Indonesia
1992
1996
Full ownership of Coca-Cola Packaging & Distribution Businesses in Indonesia1
2005 2013
2012Acquisition of CikedokanPlant, West Java
CCA parent company was born2008
Bali Beach Clean Up established
100%
Minute Maid Pulpy launched
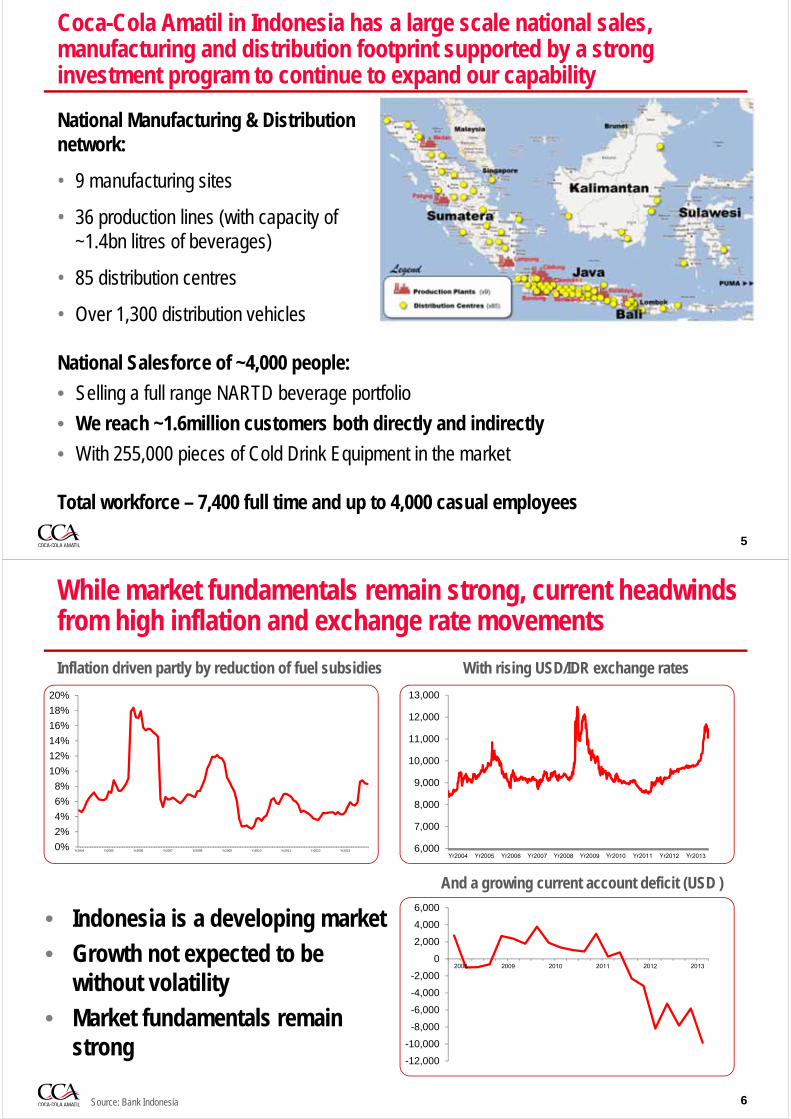
World’s largest archipelago nation – over 17,500 islands, population of ~250m and Java population of over 140m is the most densely populated island in the world
4Source - Statistic Central Bureau & CCA estimates
Greater JakartaOutlet Density:
18.7Km2Pop: 30m
93% UrbanPop Density:
Urban: 15,000
SumateraOutlet Density: 1.3km2
Pop: 54m61% Rural
Pop Density:Urban: 1,200
Rural: 80
KalimantanOutlet Density: 0.3km2
Pop: 15m58% Rural
Pop Density:Urban: 630Rural: 20
Java (excl Greater Jakarta)
Outlet Density: 12.1km2
Pop: 113m50% UrbanlPop Density:Urban: 2,100
Rural: 850
Bali-NusaOutlet Density: 1.8km2
Pop: 14m61% Rural
Pop Density:Urban: 7,000
Rural: 150
SulawesiOutlet Density:
1.0km2Pop: 18m66% Rural
Pop Density:Urban: 1,500
Rural: 7521%
12%
46%
6%
6%7%
PUMAOutlet Density:
1.3Km2Pop: 7m
70% RuralPop Density:Urban: 300Rural: 10
3%
39mm People25mm in Rural
211mm People100mm in Rural Today
75% Urban by 2020
% Percentage of total population
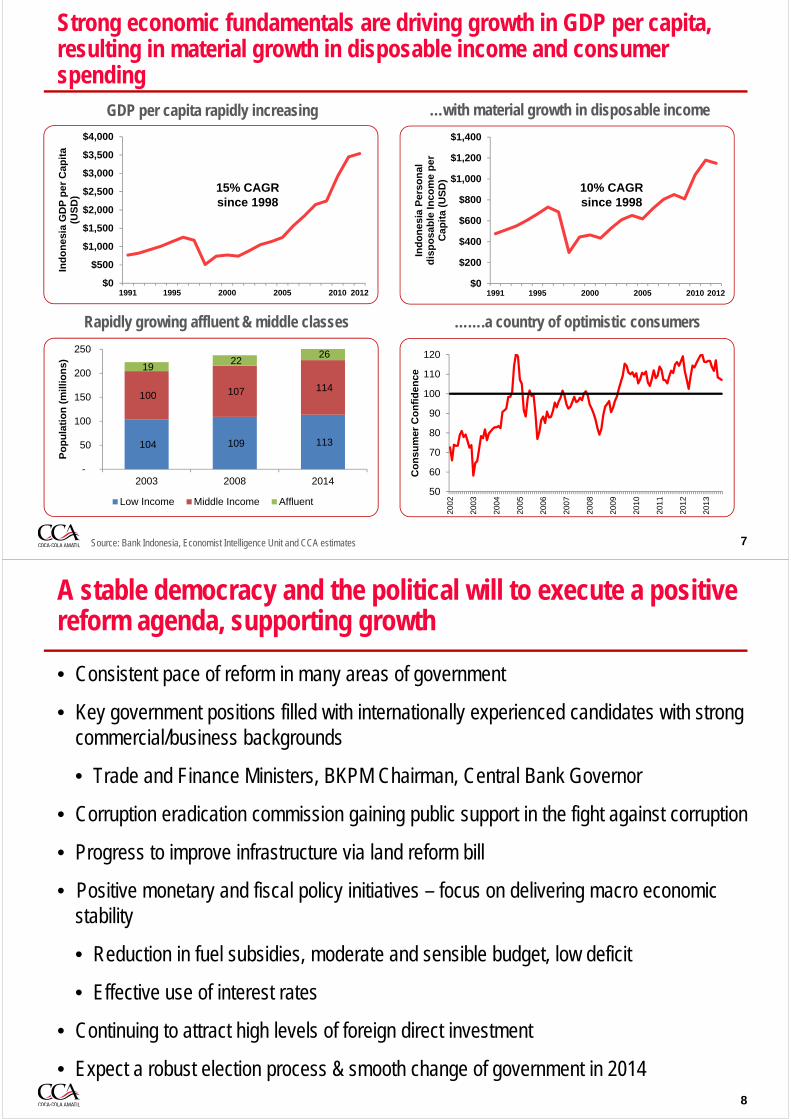
Coca-Cola Amatil in Indonesia has a large scale national sales, manufacturing and distribution footprint supported by a strong investment program to continue to expand our capability
National Manufacturing & Distribution network:
• 9 manufacturing sites
• 36 production lines (with capacity of ~1.4bn litres of beverages)
• 85 distribution centres
• Over 1,300 distribution vehicles
5
National Salesforce of ~4,000 people:
• Selling a full range NARTD beverage portfolio
• We reach ~1.6million customers both directly and indirectly
• With 255,000 pieces of Cold Drink Equipment in the market
Total workforce – 7,400 full time and up to 4,000 casual employees
While market fundamentals remain strong, current headwinds from high inflation and exchange rate movements
6
0%
2%
4%
6%
8%
10%
12%
14%
16%
18%
20%
Yr2004 Yr2005 Yr2006 Yr2007 Yr2008 Yr2009 Yr2010 Yr2011 Yr2012 Yr2013
Inflation driven partly by reduction of fuel subsidies
6,000
7,000
8,000
9,000
10,000
11,000
12,000
13,000
With rising USD/IDR exchange rates
-12,000
-10,000
-8,000
-6,000
-4,000
-2,000
0
2,000
4,000
6,000
And a growing current account deficit (USD )
Source: Bank Indonesia
• Indonesia is a developing market
• Growth not expected to be without volatility
• Market fundamentals remain strong
Strong economic fundamentals are driving growth in GDP per capita, resulting in material growth in disposable income and consumer spending
7
Rapidly growing affluent & middle classes …….a country of optimistic consumers
…with material growth in disposable income
50
60
70
80
90
100
110
120
2002
2003
2004
2005
2006
2007
2008
2009
2010
2011
2012
2013
Co
nsu
mer
Co
nfi
den
ce
Source: Bank Indonesia, Economist Intelligence Unit and CCA estimates
GDP per capita rapidly increasing
$0
$500
$1,000
$1,500
$2,000
$2,500
$3,000
$3,500
$4,000
1991 1995 2000 2005 2010 2012
Ind
on
esia
GD
P p
er C
apit
a (U
SD
)
$0
$200
$400
$600
$800
$1,000
$1,200
$1,400
1991 1995 2000 2005 2010 2012
Ind
on
esia
Per
son
al
dis
po
sab
le I
nco
me
per
C
apit
a (U
SD
)
15% CAGR since 1998
10% CAGR since 1998
104 109 113
100 107 114
19 22
26
-
50
100
150
200
250
2003 2008 2014
Po
pu
lati
on
(m
illio
ns)
Low Income Middle Income Affluent
A stable democracy and the political will to execute a positive reform agenda, supporting growth
• Consistent pace of reform in many areas of government
• Key government positions filled with internationally experienced candidates with strong commercial/business backgrounds
• Trade and Finance Ministers, BKPM Chairman, Central Bank Governor
• Corruption eradication commission gaining public support in the fight against corruption
• Progress to improve infrastructure via land reform bill
• Positive monetary and fiscal policy initiatives – focus on delivering macro economic stability
• Reduction in fuel subsidies, moderate and sensible budget, low deficit
• Effective use of interest rates
• Continuing to attract high levels of foreign direct investment
• Expect a robust election process & smooth change of government in 20148
Vietnam
China
Indonesia
Thailand
Malaysia
Brazil
Mexico
Turkey
Korea, Republic of
Portugal
Singapore
Australia
New Zealand
Spain
Japan
Italy
GermanyUnited States
0
200
400
600
800
1,000
1,200
1,400
1,600
1,800
0 5,000 10,000 15,000 20,000 25,000 30,000 35,000
NA
RT
D p
er C
ap (
8oz
serv
e)
Consumer Exp Per Cap (PPP)
In the medium to long term, the strong link between consumer spending and per capita consumption of commercial beverages is a very positive indicator of growth prospects
9
Bubble Size denotes 2012 GDP ($US)
Source: TCCC 2012 Market Data, World Bank Indicators
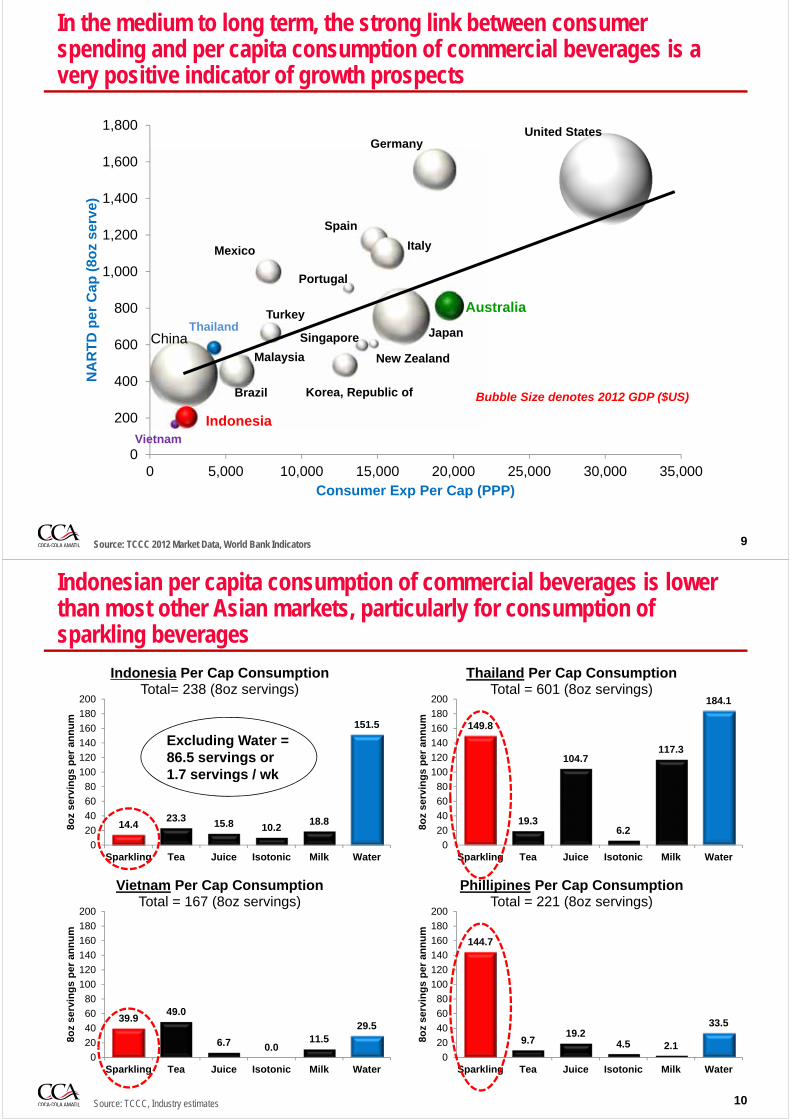
Indonesian per capita consumption of commercial beverages is lower than most other Asian markets, particularly for consumption of sparkling beverages
10
14.423.3 15.8 10.2
18.8
151.5
0
20
40
60
80
100
120
140
160
180
200
Sparkling Tea Juice Isotonic Milk Water
8oz
serv
ing
s p
er a
nn
um
Indonesia Per Cap ConsumptionTotal= 238 (8oz servings)
Source: TCCC, Industry estimates
149.8
19.3
104.7
6.2
117.3
184.1
0
20
40
60
80
100
120
140
160
180
200
Sparkling Tea Juice Isotonic Milk Water
8oz
serv
ing
s p
er a
nn
um
Thailand Per Cap ConsumptionTotal = 601 (8oz servings)
39.949.0
6.7 0.011.5
29.5
0
20
40
60
80
100
120
140
160
180
200
Sparkling Tea Juice Isotonic Milk Water
8oz
serv
ing
s p
er a
nn
um
Vietnam Per Cap ConsumptionTotal = 167 (8oz servings)
144.7
9.719.2
4.5 2.1
33.5
0
20
40
60
80
100
120
140
160
180
200
Sparkling Tea Juice Isotonic Milk Water
8oz
serv
ing
s p
er a
nn
um
Phillipines Per Cap ConsumptionTotal = 221 (8oz servings)
Excluding Water = 86.5 servings or 1.7 servings / wk
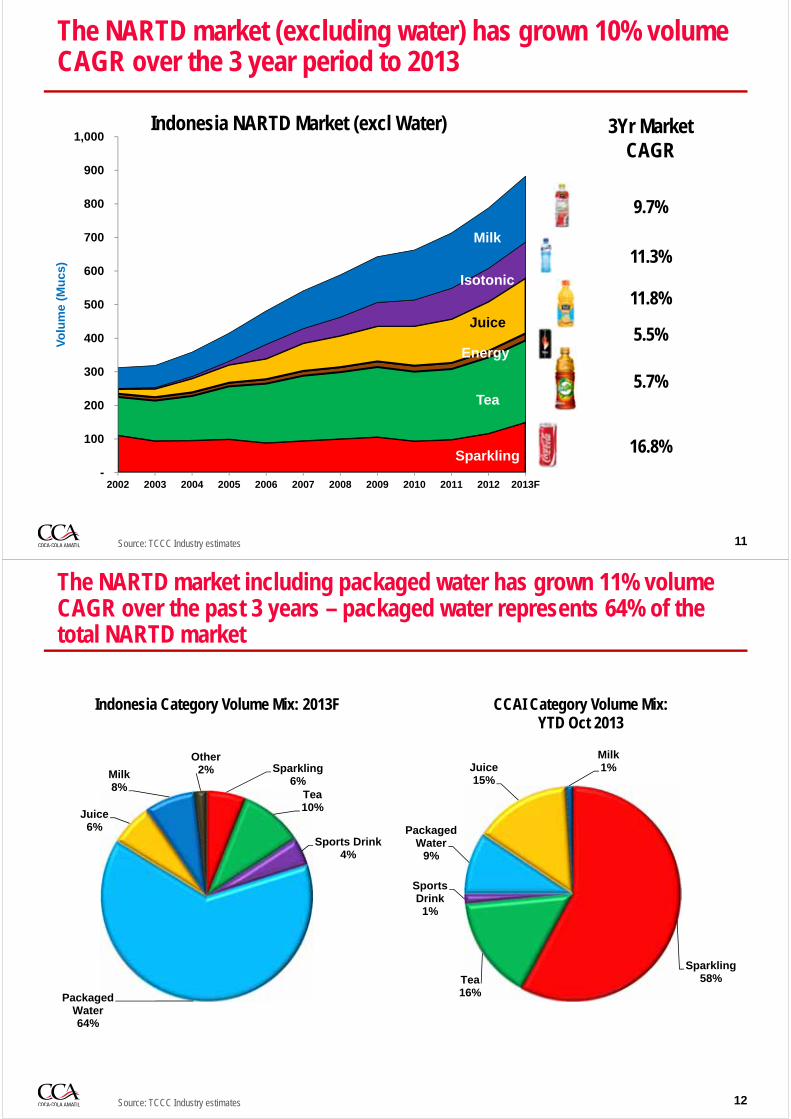
The NARTD market (excluding water) has grown 10% volume CAGR over the 3 year period to 2013
11
-
100
200
300
400
500
600
700
800
900
1,000
2002 2003 2004 2005 2006 2007 2008 2009 2010 2011 2012 2013F
Vo
lum
e (M
ucs
)
Indonesia NARTD Market (excl Water) 3Yr MarketCAGR
9.7%
11.3%
11.8%
5.5%
5.7%
16.8%
Milk
Isotonic
Juice
Energy
Tea
Sparkling
Source: TCCC Industry estimates
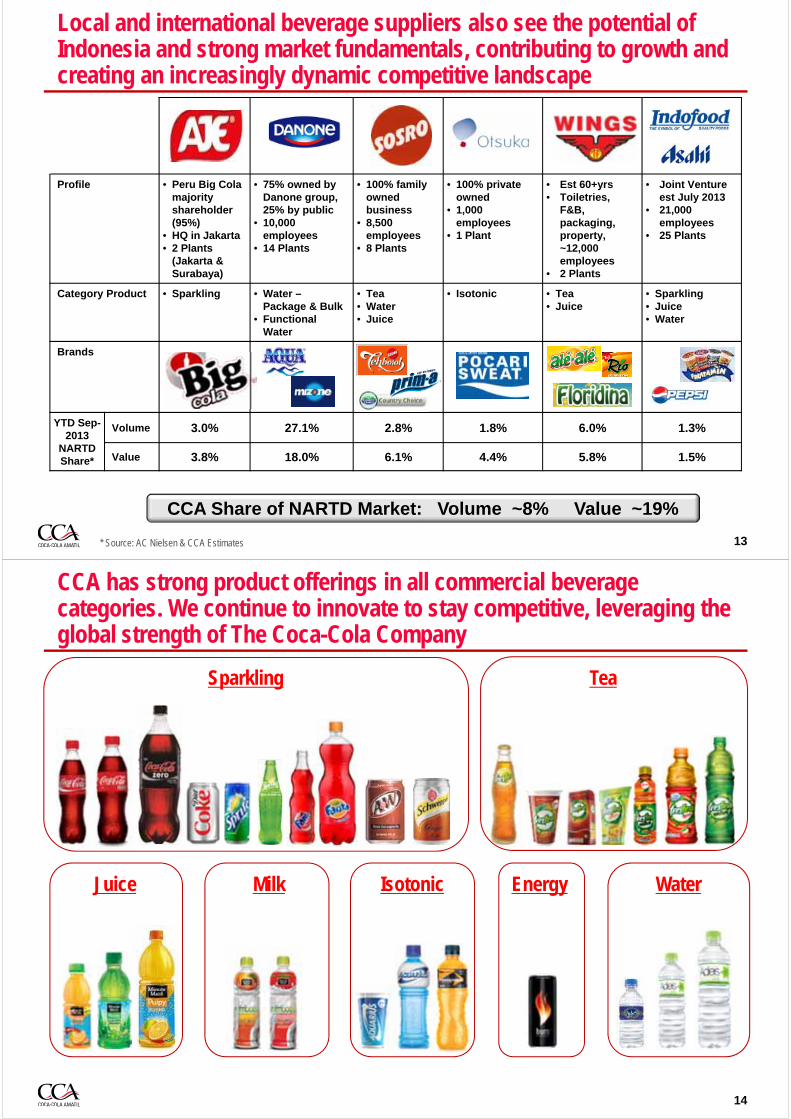
The NARTD market including packaged water has grown 11% volume CAGR over the past 3 years – packaged water represents 64% of the total NARTD market
12
Sparkling6%
Tea10%
Sports Drink4%
Packaged Water64%
Juice6%
Milk8%
Other2%
Indonesia Category Volume Mix: 2013F
Sparkling58%Tea
16%
Sports Drink
1%
Packaged Water
9%
Juice15%
Milk1%
CCAI Category Volume Mix: YTD Oct 2013
Source: TCCC Industry estimates
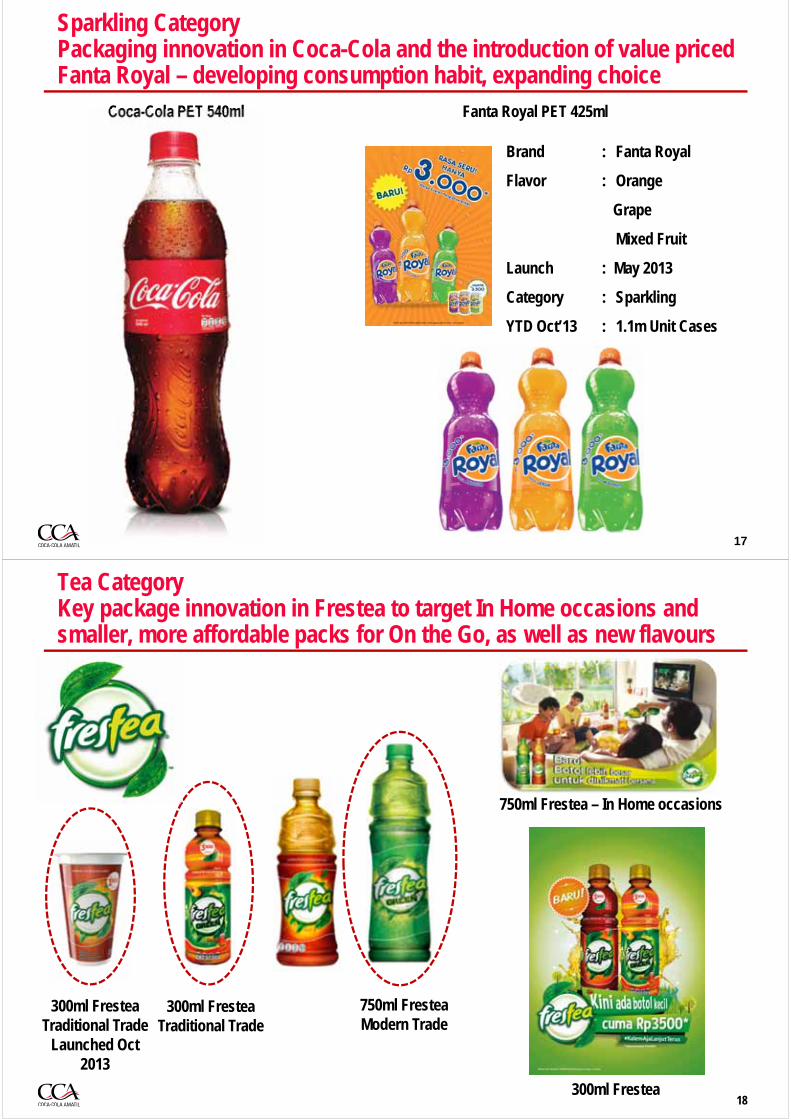
Local and international beverage suppliers also see the potential of Indonesia and strong market fundamentals, contributing to growth and creating an increasingly dynamic competitive landscape
13
Profile • Peru Big Cola majority shareholder (95%)
• HQ in Jakarta • 2 Plants
(Jakarta & Surabaya)
• 75% owned by Danone group, 25% by public
• 10,000 employees
• 14 Plants
• 100% family owned business
• 8,500 employees
• 8 Plants
• 100% privateowned
• 1,000 employees
• 1 Plant
• Est 60+yrs• Toiletries,
F&B, packaging, property, ~12,000 employees
• 2 Plants
• Joint Venture est July 2013
• 21,000 employees
• 25 Plants
Category Product • Sparkling • Water –Package & Bulk
• Functional Water
• Tea• Water• Juice
• Isotonic • Tea• Juice
• Sparkling• Juice• Water
Brands
YTD Sep-2013
NARTD Share*
Volume 3.0% 27.1% 2.8% 1.8% 6.0% 1.3%
Value 3.8% 18.0% 6.1% 4.4% 5.8% 1.5%
* Source: AC Nielsen & CCA Estimates
CCA Share of NARTD Market: Volume ~8% Value ~19%
CCA has strong product offerings in all commercial beverage categories. We continue to innovate to stay competitive, leveraging the global strength of The Coca-Cola Company
Sparkling
WaterEnergyJuice
Tea
Isotonic
14
Milk

The shift to One Way Packs continues, reflecting consumer preference – our innovation platform is targeted at leveraging this preference in all categories – RGB will continue to be a key recruitment package
15
CC
A Vo
lum
e Sp
lit (U
C)
69% 67%62% 57% 55%
48%40%
31%25%
20%14%
31% 33%38% 43% 45%
52%60%
69%75%
80%86%
2003 2004 2005 2006 2007 2008 2009 2010 2011 2012 2013F
Returnable Glass Bottle One Way Pack (PET Bottles & CANs)Source: Internal CCA systems
Sparkling CategoryWe are actively developing sparkling culture using locally developed and international campaigns that are relevant to Indonesians
16
Partnering with the Indonesian Badminton Association
Planning underway for the World Cup Trophy Tour and World Cup in 2014
Ramadhan‘festive
message’ bottles
Local Ramadhan advertising
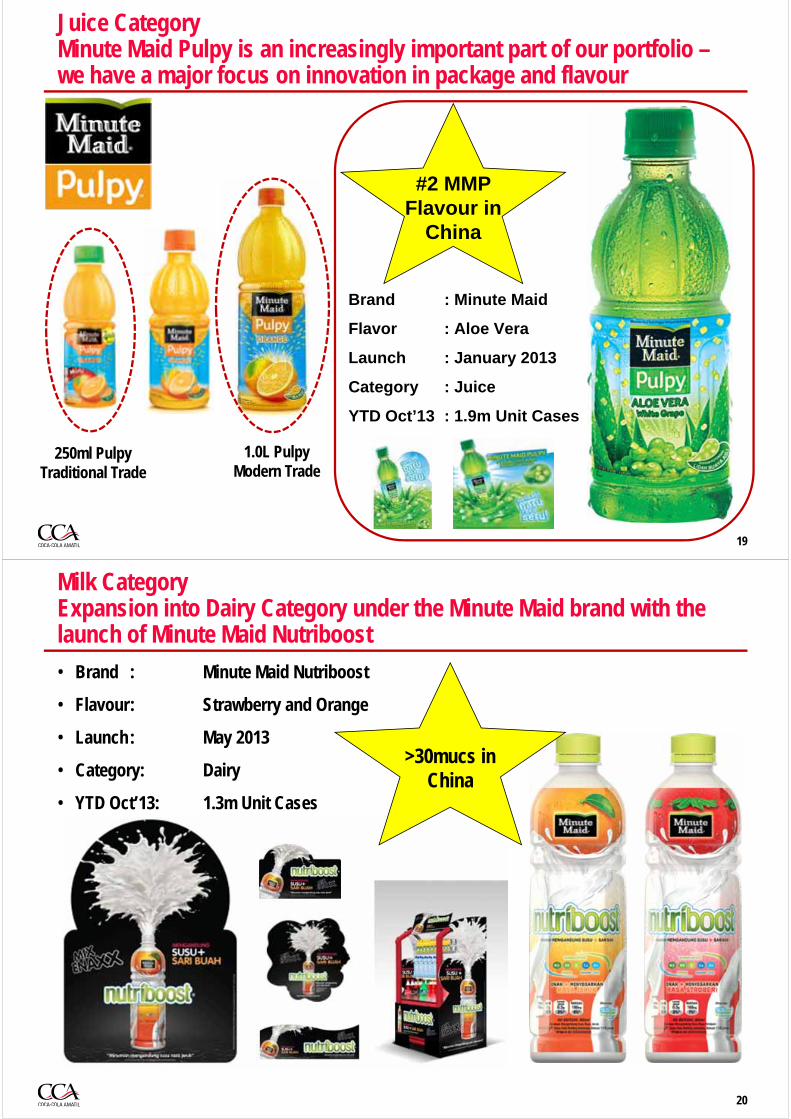
Sparkling CategoryPackaging innovation in Coca-Cola and the introduction of value priced Fanta Royal – developing consumption habit, expanding choice
Brand : Fanta Royal
Flavor : Orange
Grape
Mixed Fruit
Launch : May 2013
Category : Sparkling
YTD Oct’13 : 1.1m Unit Cases
17
Fanta Royal PET 425mlCoca-Cola PET 540ml
Tea CategoryKey package innovation in Frestea to target In Home occasions and smaller, more affordable packs for On the Go, as well as new flavours
18
300ml FresteaTraditional Trade
750ml FresteaModern Trade
300ml FresteaTraditional Trade
Launched Oct 2013
750ml Frestea – In Home occasions
300ml Frestea
Juice CategoryMinute Maid Pulpy is an increasingly important part of our portfolio –we have a major focus on innovation in package and flavour
19
Brand : Minute Maid
Flavor : Aloe Vera
Launch : January 2013
Category : Juice
YTD Oct’13 : 1.9m Unit Cases
#2 MMP Flavour in
China
250ml PulpyTraditional Trade
1.0L PulpyModern Trade
Milk CategoryExpansion into Dairy Category under the Minute Maid brand with the launch of Minute Maid Nutriboost
• Brand : Minute Maid Nutriboost
• Flavour: Strawberry and Orange
• Launch: May 2013
• Category: Dairy
• YTD Oct’13: 1.3m Unit Cases
20
>30mucs in China
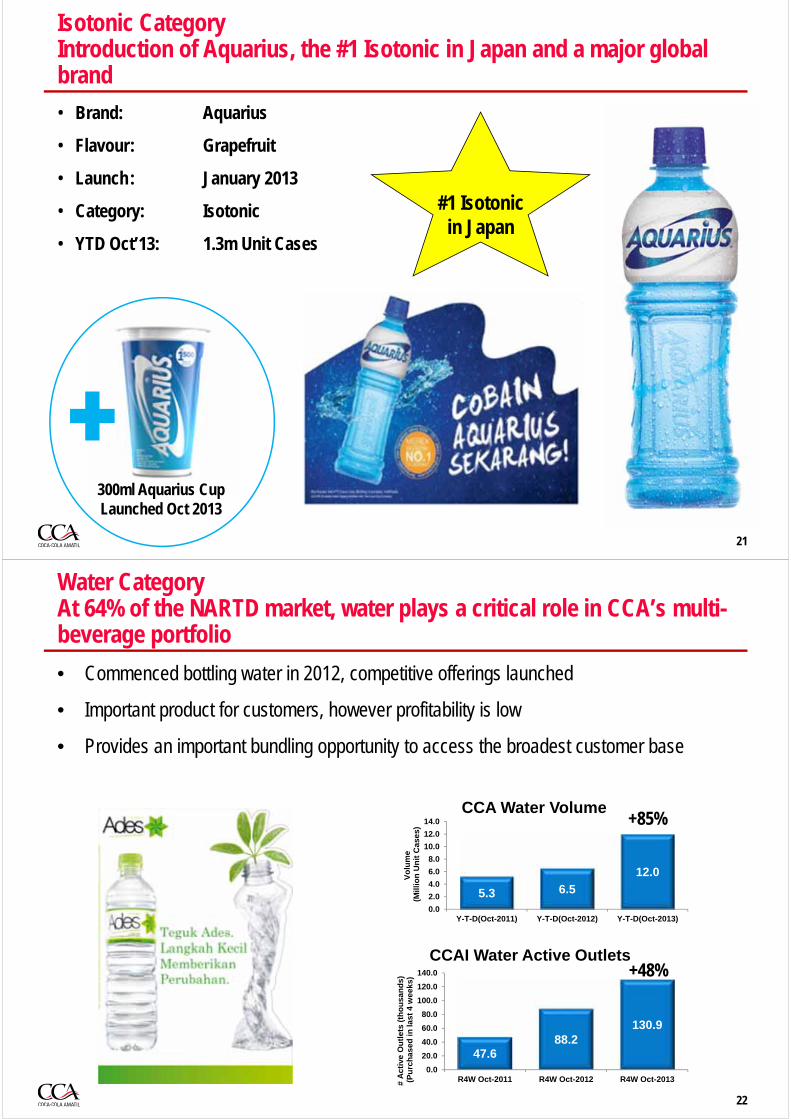
Isotonic CategoryIntroduction of Aquarius, the #1 Isotonic in Japan and a major global brand
• Brand: Aquarius
• Flavour: Grapefruit
• Launch: January 2013
• Category: Isotonic
• YTD Oct’13: 1.3m Unit Cases
21
#1 Isotonic in Japan
300ml Aquarius CupLaunched Oct 2013
Water CategoryAt 64% of the NARTD market, water plays a critical role in CCA’s multi-beverage portfolio
• Commenced bottling water in 2012, competitive offerings launched
• Important product for customers, however profitability is low
• Provides an important bundling opportunity to access the broadest customer base
22
5.3 6.5
12.0
0.0
2.0
4.0
6.0
8.0
10.0
12.0
14.0
Y-T-D(Oct-2011) Y-T-D(Oct-2012) Y-T-D(Oct-2013)
Vo
lum
e(M
illio
n U
nit
Cas
es)
CCA Water Volume
47.688.2
130.9
0.0
20.0
40.0
60.0
80.0
100.0
120.0
140.0
R4W Oct-2011 R4W Oct-2012 R4W Oct-2013# A
ctiv
e O
utl
ets
(th
ou
san
ds)
(Pu
rch
ased
in la
st 4
wee
ks)
CCAI Water Active Outlets
+85%
+48%

Cold Drink EquipmentIncreasing cold availability via continued aggressive cold drink placement is a major driver of increased per capita consumption
• 255,000 CCA coolers in the market
• Supported by a complete beverage portfolio vs competitors
• Space in outlet and electricity challenges - equipment innovation has delivered optimal coolers for Indonesian market, using half the electricity of competitor coolers
23
10.68.2
0.0
5.0
10.0
15.0
20.0
25.0
30.0
35.0
SouthKorea
Philippines Thailand Indonesia2013
Indonesia2012
China India Vietnam
Co
ole
rs p
er 1
0k p
op
ula
tio
n
Cooler Units per 10k Population
+28% in 2013
People Capability – Critical to Support the Growth AgendaOur long term success will be driven by exceptional people capability –education and diversity are key for developing local leadership talent
We continue to develop local talent in key leaderships roles
• Active talent identification, development and retention programs
• Highly educated leadership team……73% of junior management and above are University Degree qualified and fluent English speakers
• Young leadership team……..80% of junior management ranging in age from 23 to 40 years of age
• Females already account for 24% of management
Material ongoing investment in training – averaging ~40hrs training per employee per year –throughout the organisation
24
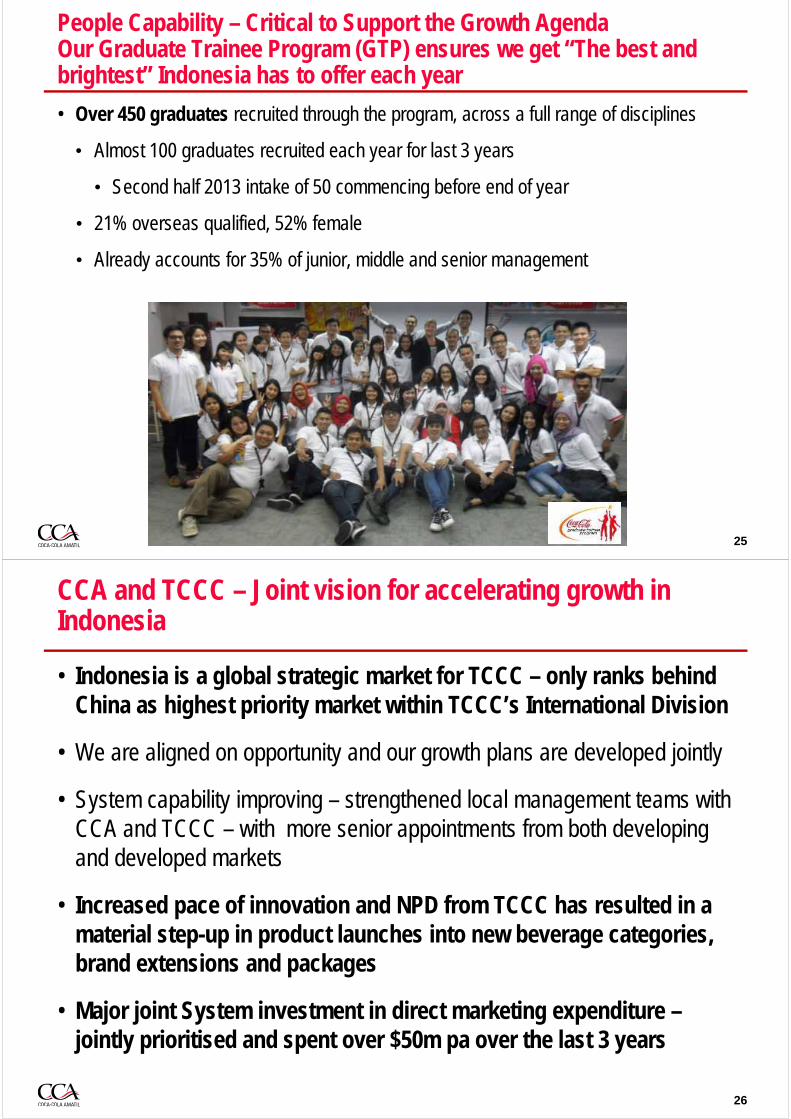
People Capability – Critical to Support the Growth AgendaOur Graduate Trainee Program (GTP) ensures we get “The best and brightest” Indonesia has to offer each year
• Over 450 graduates recruited through the program, across a full range of disciplines
• Almost 100 graduates recruited each year for last 3 years
• Second half 2013 intake of 50 commencing before end of year
• 21% overseas qualified, 52% female
• Already accounts for 35% of junior, middle and senior management
25
CCA and TCCC – Joint vision for accelerating growth in Indonesia
• Indonesia is a global strategic market for TCCC – only ranks behind China as highest priority market within TCCC’s International Division
• We are aligned on opportunity and our growth plans are developed jointly
• System capability improving – strengthened local management teams with CCA and TCCC – with more senior appointments from both developing and developed markets
• Increased pace of innovation and NPD from TCCC has resulted in a material step-up in product launches into new beverage categories, brand extensions and packages
• Major joint System investment in direct marketing expenditure –jointly prioritised and spent over $50m pa over the last 3 years
26
Mark Payne Sales & Marketing Director Indonesia
Indonesian Market Place
Approx 5,000kms
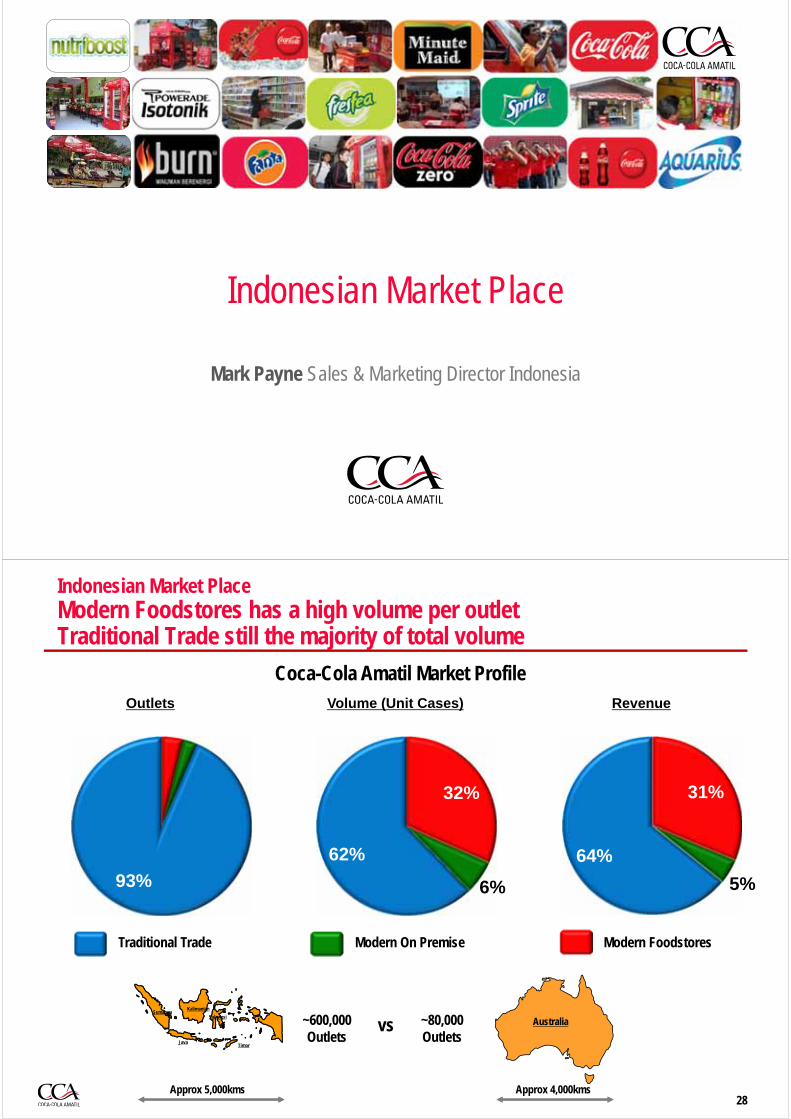
Indonesian Market PlaceModern Foodstores has a high volume per outletTraditional Trade still the majority of total volume
28
Coca-Cola Amatil Market Profile
93%
Outlets
32%
6%
62%
Volume (Unit Cases)
31%
5%
64%
Revenue
Australia~600,000 Outlets
~80,000 Outlets
vs
Approx 4,000kms
Sumatera
JavaTimor
Sulawesi
Kalimantan
Modern FoodstoresModern On PremiseTraditional Trade
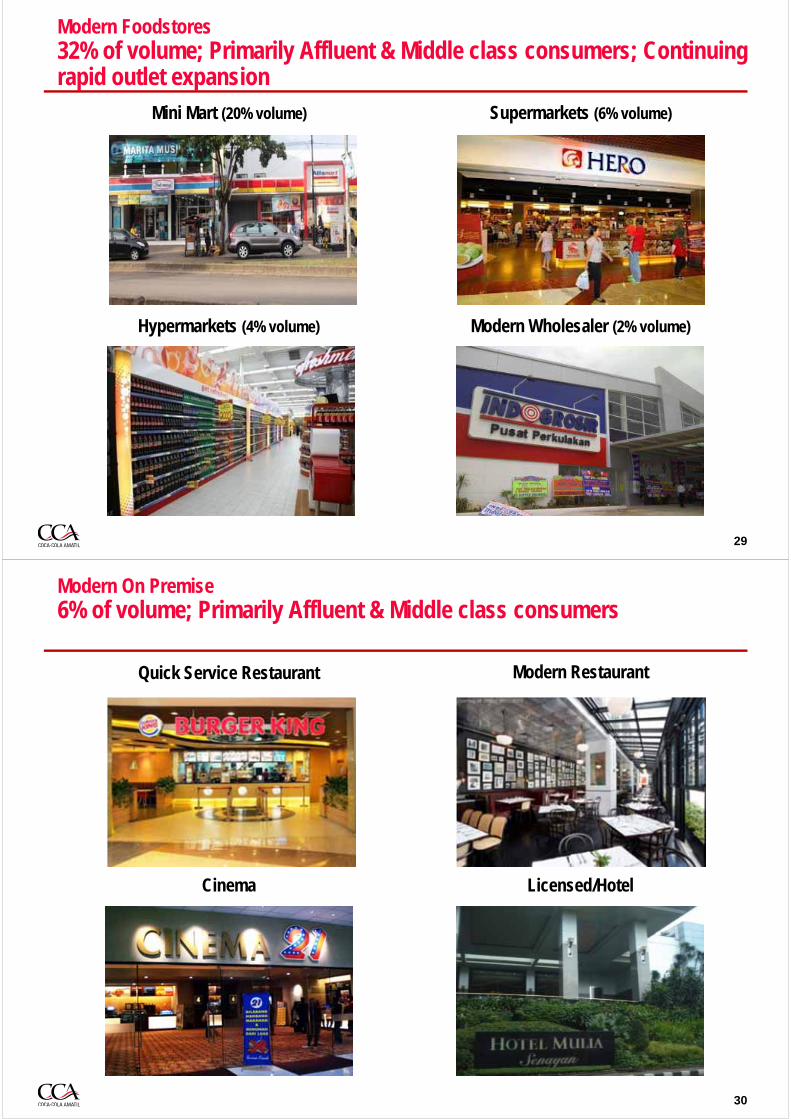
Hypermarkets (4% volume)
Mini Mart (20% volume) Supermarkets (6% volume)
Modern Foodstores32% of volume; Primarily Affluent & Middle class consumers; Continuing rapid outlet expansion
29
Modern Wholesaler (2% volume)
Modern On Premise6% of volume; Primarily Affluent & Middle class consumers
30
Modern RestaurantQuick Service Restaurant
Cinema Licensed/Hotel
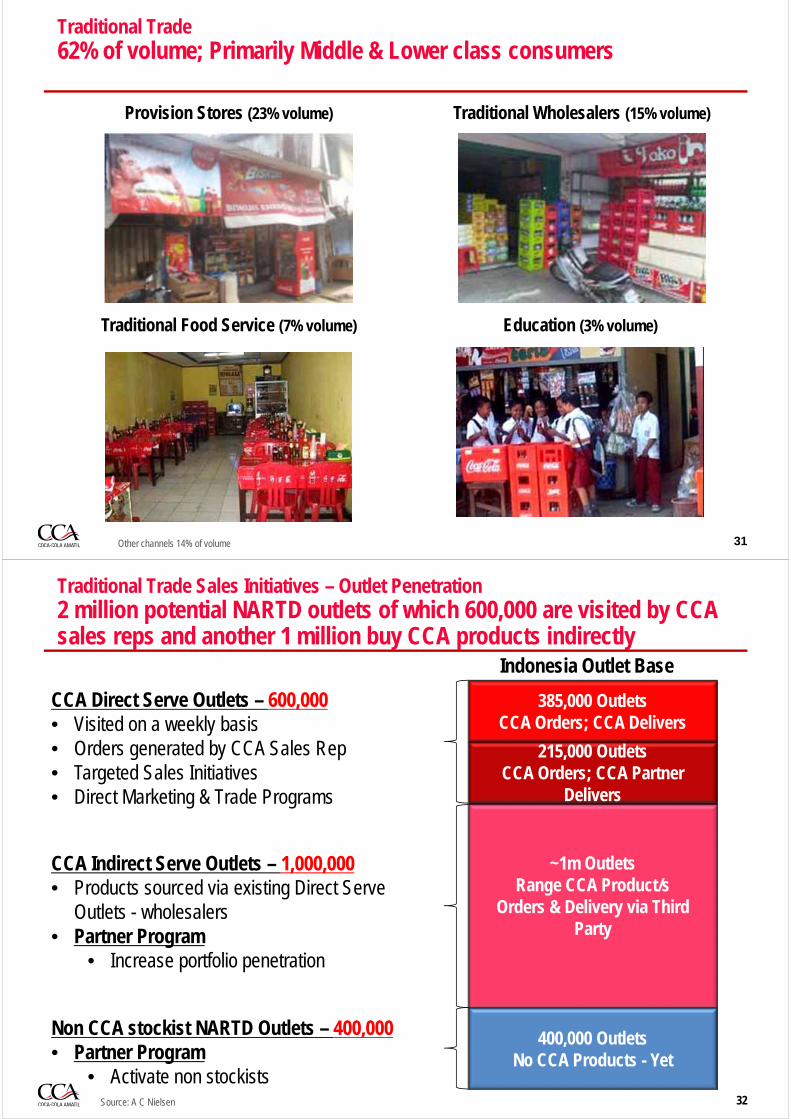
Traditional Trade62% of volume; Primarily Middle & Lower class consumers
31
Provision Stores (23% volume)
Education (3% volume)Traditional Food Service (7% volume)
Traditional Wholesalers (15% volume)
Other channels 14% of volume
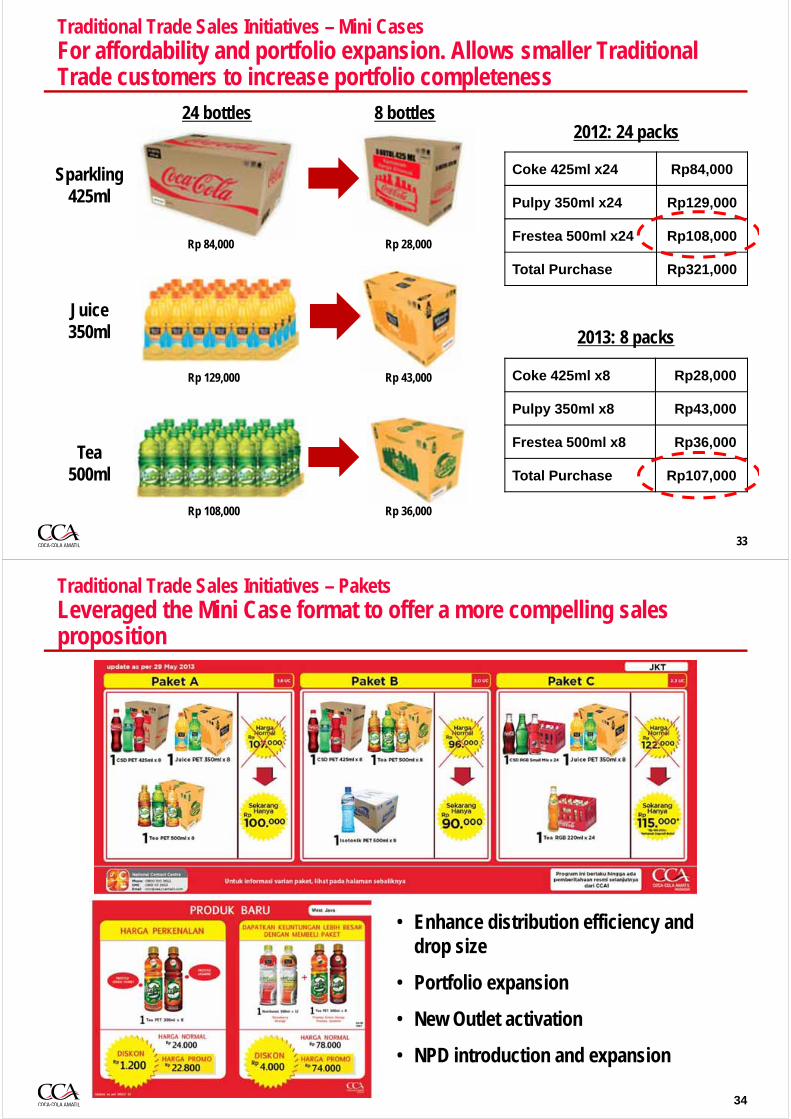
Traditional Trade Sales Initiatives – Outlet Penetration2 million potential NARTD outlets of which 600,000 are visited by CCA sales reps and another 1 million buy CCA products indirectly
32Source: A C Nielsen
~1m OutletsRange CCA Product/s
Orders & Delivery via Third Party
400,000 OutletsNo CCA Products - Yet
385,000 OutletsCCA Orders; CCA Delivers
215,000 OutletsCCA Orders; CCA Partner
Delivers
CCA Indirect Serve Outlets – 1,000,000• Products sourced via existing Direct Serve
Outlets - wholesalers• Partner Program
• Increase portfolio penetration
CCA Direct Serve Outlets – 600,000• Visited on a weekly basis• Orders generated by CCA Sales Rep• Targeted Sales Initiatives• Direct Marketing & Trade Programs
Non CCA stockist NARTD Outlets – 400,000• Partner Program
• Activate non stockists
Indonesia Outlet Base
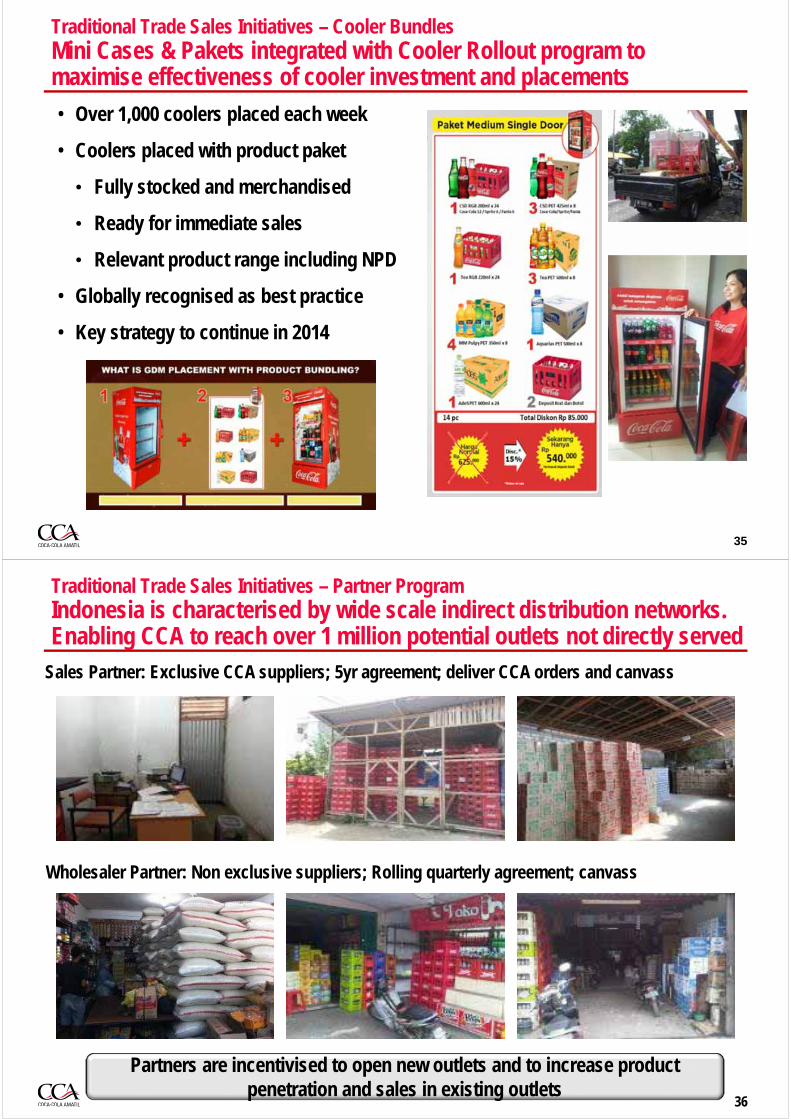
Traditional Trade Sales Initiatives – Mini CasesFor affordability and portfolio expansion. Allows smaller Traditional Trade customers to increase portfolio completeness
33
Rp 28,000Rp 84,000
Coke 425ml x24 Rp84,000
Pulpy 350ml x24 Rp129,000
Frestea 500ml x24 Rp108,000
Total Purchase Rp321,000
Coke 425ml x8 Rp28,000
Pulpy 350ml x8 Rp43,000
Frestea 500ml x8 Rp36,000
Total Purchase Rp107,000
Rp 108,000 Rp 36,000
Rp 129,000 Rp 43,000
24 bottles 8 bottles
Sparkling425ml
Juice350ml
Tea500ml
2012: 24 packs
2013: 8 packs
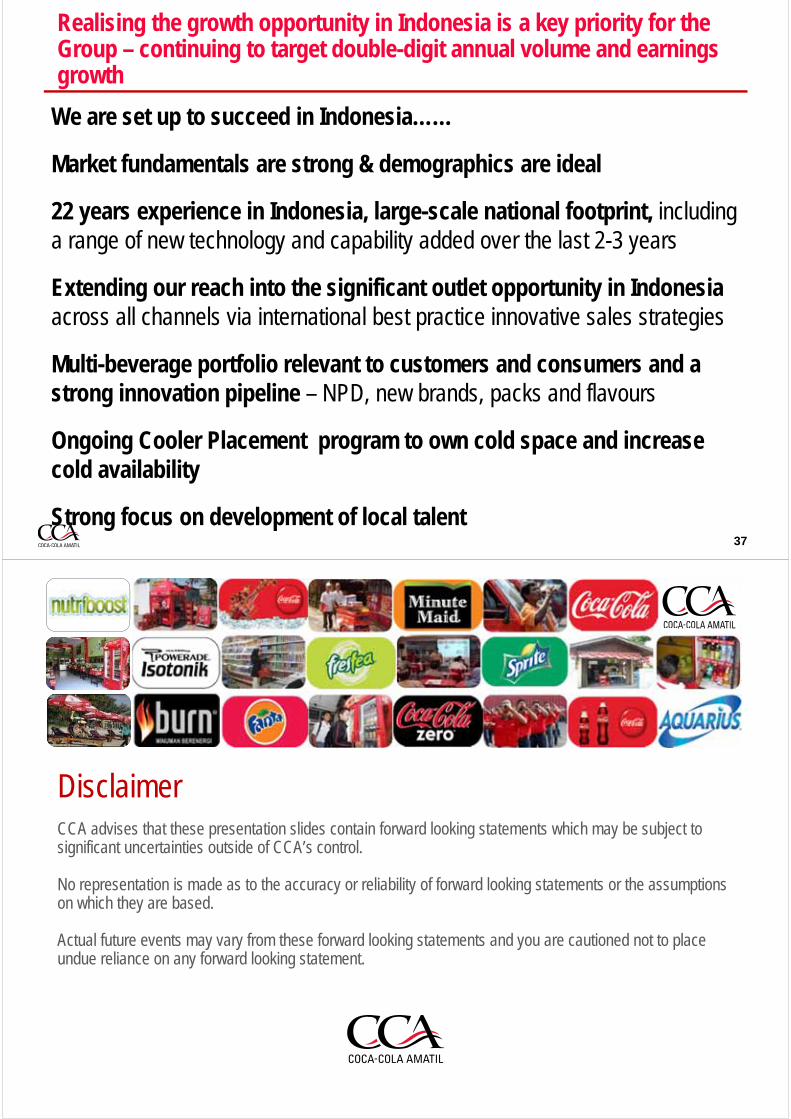
Traditional Trade Sales Initiatives – PaketsLeveraged the Mini Case format to offer a more compelling sales proposition
• Enhance distribution efficiency and drop size
• Portfolio expansion
• New Outlet activation
• NPD introduction and expansion
34
Traditional Trade Sales Initiatives – Cooler BundlesMini Cases & Pakets integrated with Cooler Rollout program to maximise effectiveness of cooler investment and placements
• Over 1,000 coolers placed each week
• Coolers placed with product paket
• Fully stocked and merchandised
• Ready for immediate sales
• Relevant product range including NPD
• Globally recognised as best practice
• Key strategy to continue in 2014
35
Traditional Trade Sales Initiatives – Partner ProgramIndonesia is characterised by wide scale indirect distribution networks. Enabling CCA to reach over 1 million potential outlets not directly served
36
Sales Partner: Exclusive CCA suppliers; 5yr agreement; deliver CCA orders and canvass
Wholesaler Partner: Non exclusive suppliers; Rolling quarterly agreement; canvass
Partners are incentivised to open new outlets and to increase product penetration and sales in existing outlets
Realising the growth opportunity in Indonesia is a key priority for the Group – continuing to target double-digit annual volume and earnings growth
We are set up to succeed in Indonesia……
Market fundamentals are strong & demographics are ideal
22 years experience in Indonesia, large-scale national footprint, including a range of new technology and capability added over the last 2-3 years
Extending our reach into the significant outlet opportunity in Indonesia across all channels via international best practice innovative sales strategies
Multi-beverage portfolio relevant to customers and consumers and a strong innovation pipeline – NPD, new brands, packs and flavours
Ongoing Cooler Placement program to own cold space and increase cold availability
Strong focus on development of local talent37
DisclaimerCCA advises that these presentation slides contain forward looking statements which may be subject to significant uncertainties outside of CCA’s control.
No representation is made as to the accuracy or reliability of forward looking statements or the assumptions on which they are based.
Actual future events may vary from these forward looking statements and you are cautioned not to place undue reliance on any forward looking statement.

Indonesian Supply ChainIndonesia Investor Tour
Nov 7-8, 2013
Bruce Herbert Group Supply Chain DirectorEdward Walters Logistics Director
Gigy Philip Operations Director
CCAI is now a world leader in PET packaging
innovationDIFOTAI now 94%
We are investing in capability and capacity
ahead of the growth curve
Project Zero is delivering an expanding product portfolio
at lower cost
Significant increase in one way pack capacity
Our manufacturing platform is enabling product and packaging innovation
CCAI is building a pre-eminent Supply Chain capability to drive complete market leadership in NARTDs in Indonesia
CAPACITY EFFICIENCY INNOVATION
2
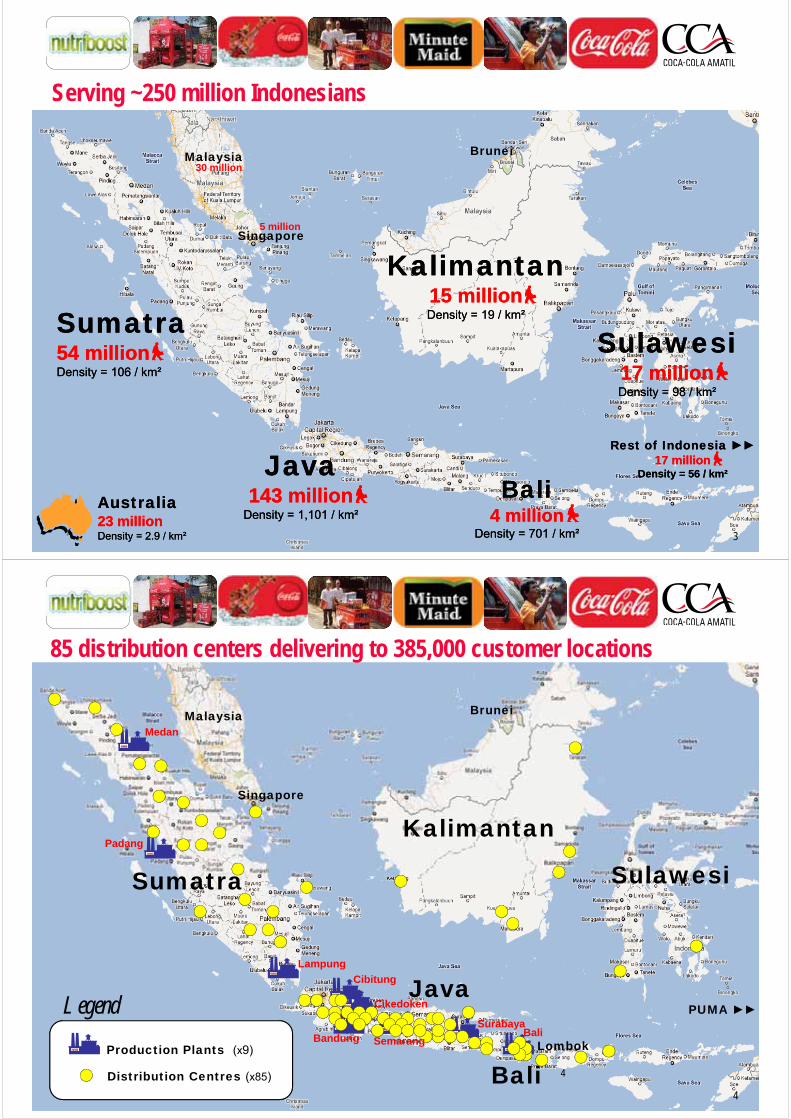
Kalimantan15 millionDensity = 19 / km²
Kalimantan15 millionDensity = 19 / km²Sumatra
54 million Density = 106 / km²
Sumatra54 million Density = 106 / km²
Java143 million
Density = 1,101 / km²
Java143 million
Density = 1,101 / km²
Bali4 million
Density = 701 / km²
Bali4 million
Density = 701 / km²
Sulawesi17 millionDensity = 98 / km²
Sulawesi17 millionDensity = 98 / km²
Rest of Indonesia ►►17 million
Density = 56 / km²
Rest of Indonesia ►►17 million
Density = 56 / km²
Singapore
Malaysia Brunei
Serving ~250 million Indonesians
30 million
5 million
Australia23 millionDensity = 2.9 / km²
Australia23 millionDensity = 2.9 / km² 3
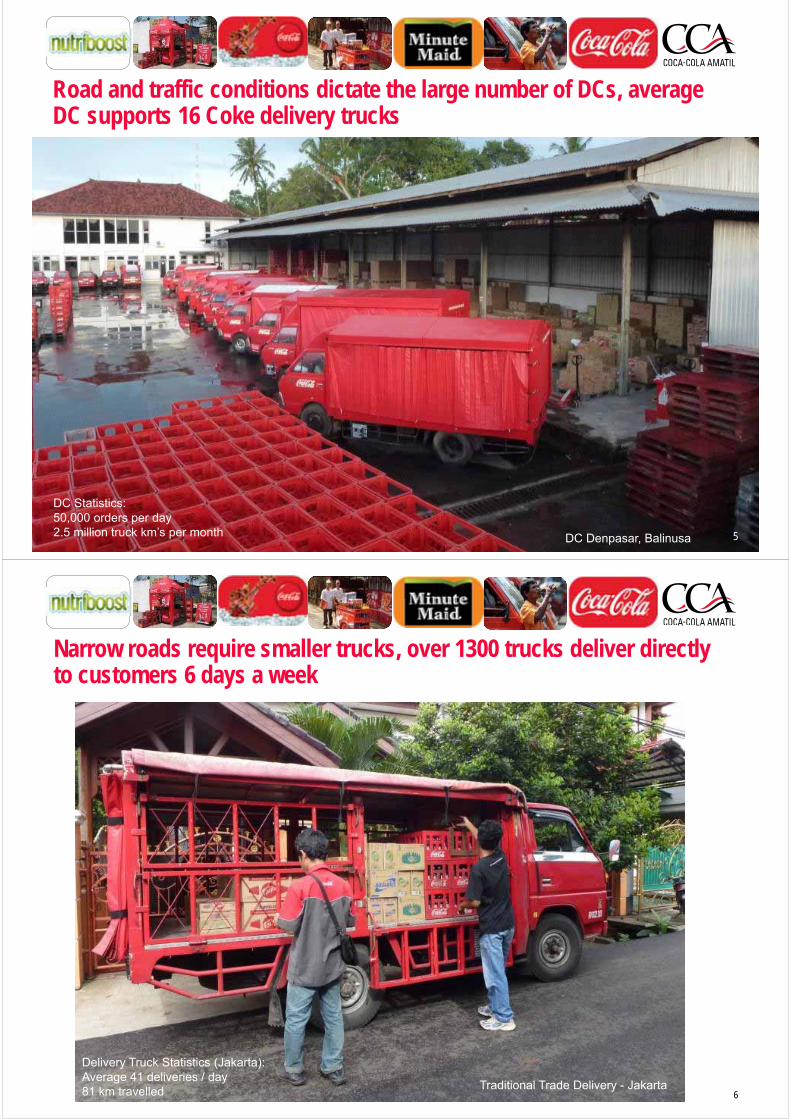
Production Plants (x9)
Distribution Centres (x85)
Legend
4
Kalimantan
Sumatra
Java
Bali
Sulawesi
Lombok
PUMA ►►
Singapore
Malaysia
Thailand
Brunei
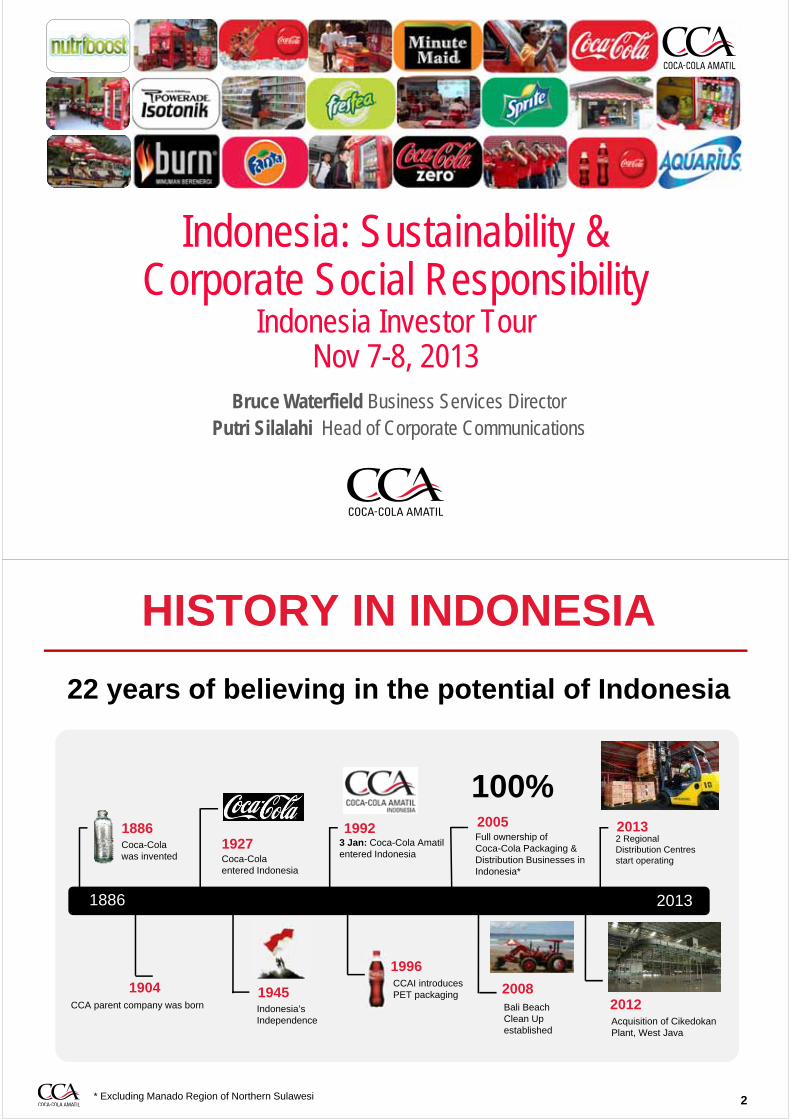
85 distribution centers delivering to 385,000 customer locations
Medan
Padang
Lampung
Cibitung
Bandung Semarang
SurabayaBali
Cikedoken
4
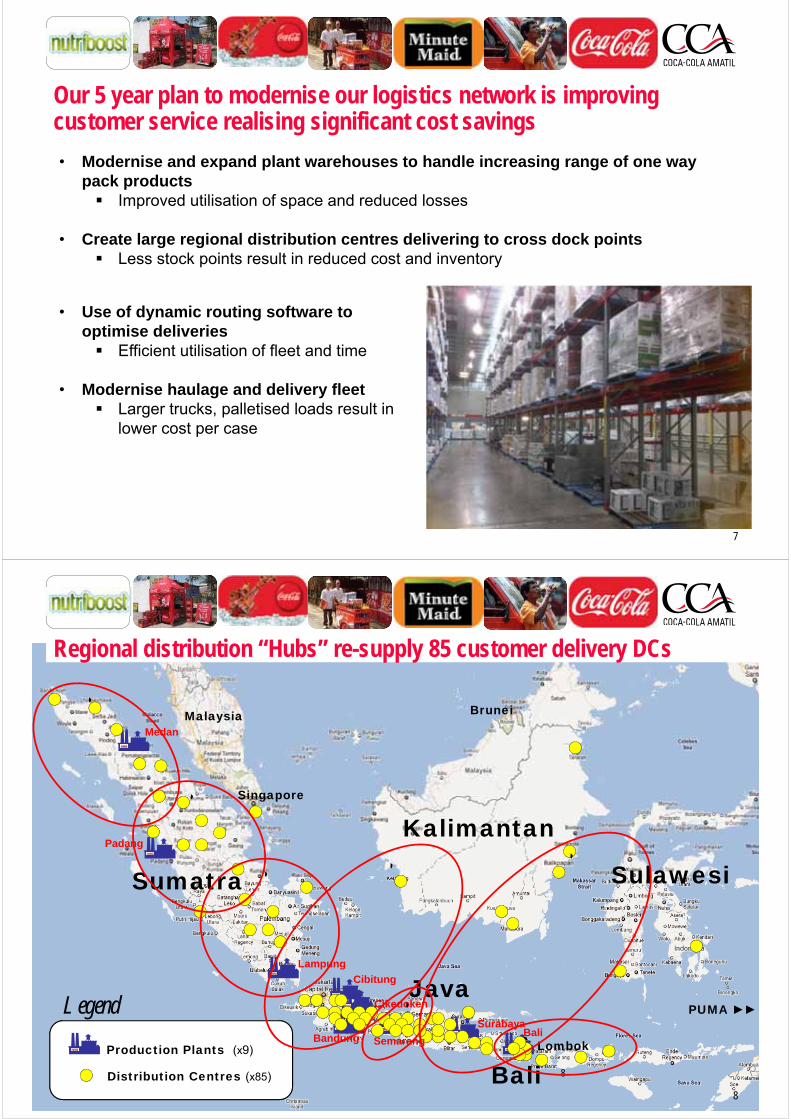
Road and traffic conditions dictate the large number of DCs, average DC supports 16 Coke delivery trucks
DC Denpasar, Balinusa 5
DC Statistics: 50,000 orders per day2.5 million truck km’s per month
6
Narrow roads require smaller trucks, over 1300 trucks deliver directly to customers 6 days a week
Traditional Trade Delivery - Jakarta
Delivery Truck Statistics (Jakarta): Average 41 deliveries / day81 km travelled
Our 5 year plan to modernise our logistics network is improving customer service realising significant cost savings
• Modernise and expand plant warehouses to handle increasing range of one way pack products Improved utilisation of space and reduced losses
• Create large regional distribution centres delivering to cross dock points Less stock points result in reduced cost and inventory
• Use of dynamic routing software to optimise deliveries Efficient utilisation of fleet and time
• Modernise haulage and delivery fleet Larger trucks, palletised loads result in
lower cost per case
7
Production Plants (x9)
Distribution Centres (x85)
Legend
8
Kalimantan
Sumatra
Java
Bali
Sulawesi
Lombok
PUMA ►►
Singapore
Malaysia
Thailand
Brunei
Regional distribution “Hubs” re-supply 85 customer delivery DCs
Medan
Padang
Lampung
Cibitung
Bandung Semarang
SurabayaBali
Cikedoken
`
8
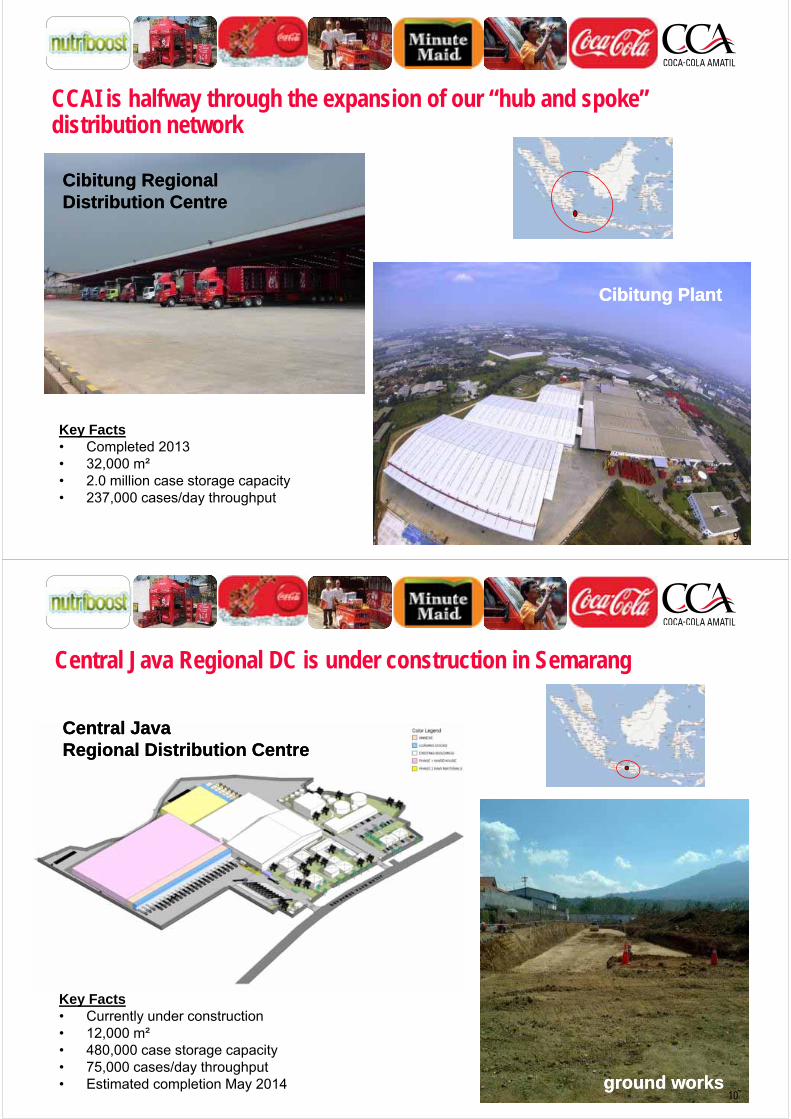
CCAI is halfway through the expansion of our “hub and spoke” distribution network
Key Facts• Completed 2013• 32,000 m²• 2.0 million case storage capacity• 237,000 cases/day throughput
Cibitung PlantCibitung Plant
Cibitung Regional Distribution CentreCibitung Regional Distribution Centre
9
Central Java Regional DC is under construction in Semarang
Key Facts• Currently under construction• 12,000 m²• 480,000 case storage capacity• 75,000 cases/day throughput• Estimated completion May 2014
Central JavaRegional Distribution CentreCentral JavaRegional Distribution Centre
ground worksground works10
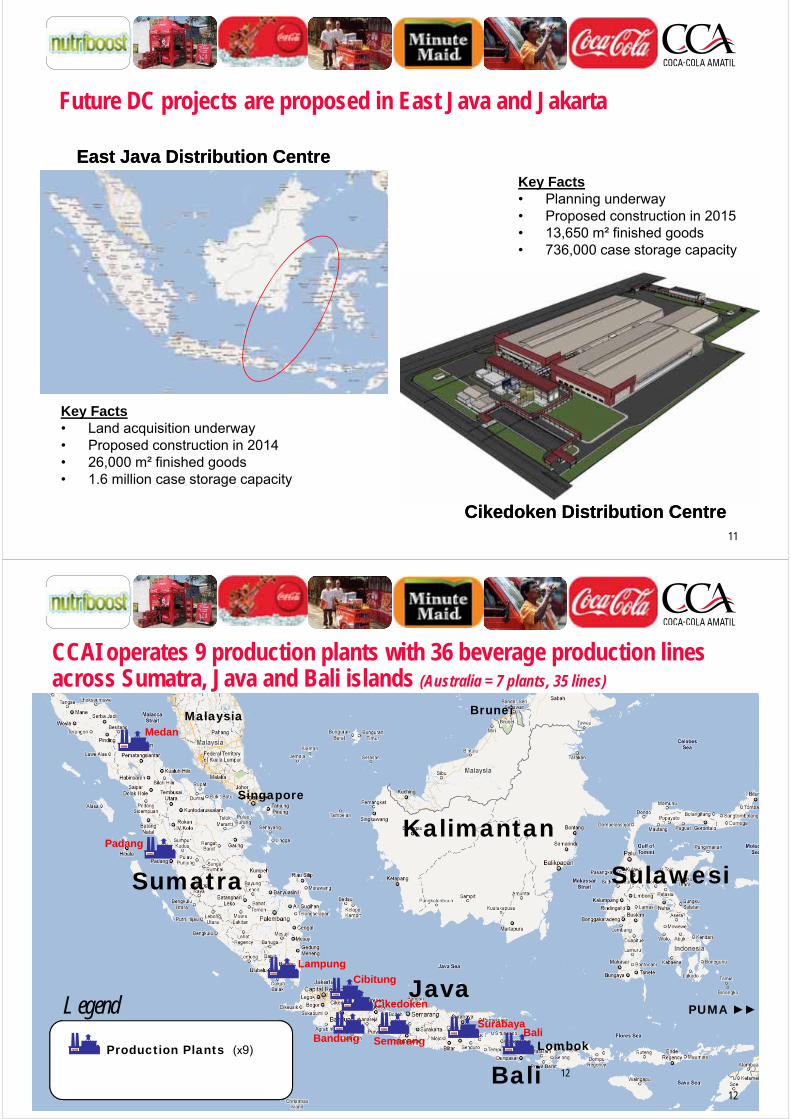
Future DC projects are proposed in East Java and Jakarta
Cikedoken Distribution CentreCikedoken Distribution Centre
Key Facts• Land acquisition underway• Proposed construction in 2014• 26,000 m² finished goods• 1.6 million case storage capacity
East Java Distribution CentreEast Java Distribution CentreKey Facts• Planning underway• Proposed construction in 2015• 13,650 m² finished goods• 736,000 case storage capacity
11
Production Plants (x9)
Legend
12
Kalimantan
Sumatra
Java
Bali
Sulawesi
Lombok
PUMA ►►
Singapore
Malaysia Brunei
Medan
Padang
Lampung
Cibitung
Bandung Semarang
SurabayaBali
Cikedoken
CCAI operates 9 production plants with 36 beverage production lines across Sumatra, Java and Bali islands (Australia = 7 plants, 35 lines)
12
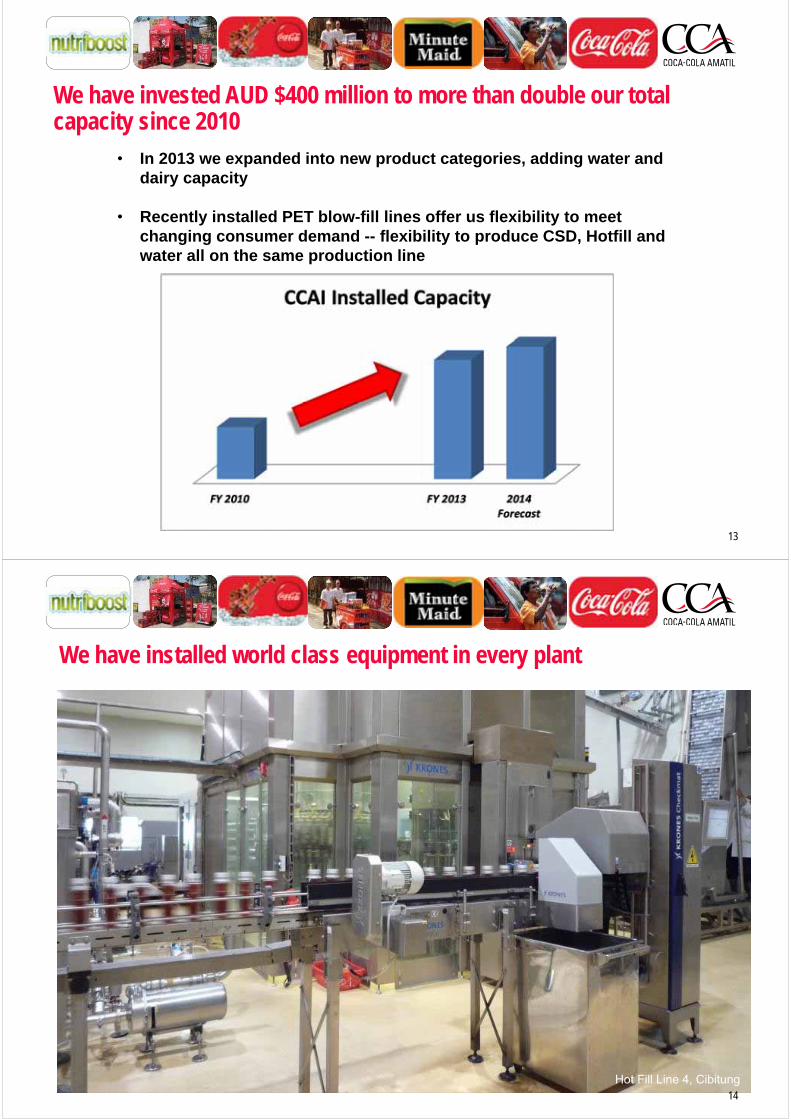
We have invested AUD $400 million to more than double our total capacity since 2010
• In 2013 we expanded into new product categories, adding water and dairy capacity
• Recently installed PET blow-fill lines offer us flexibility to meet changing consumer demand -- flexibility to produce CSD, Hotfill and water all on the same production line
13
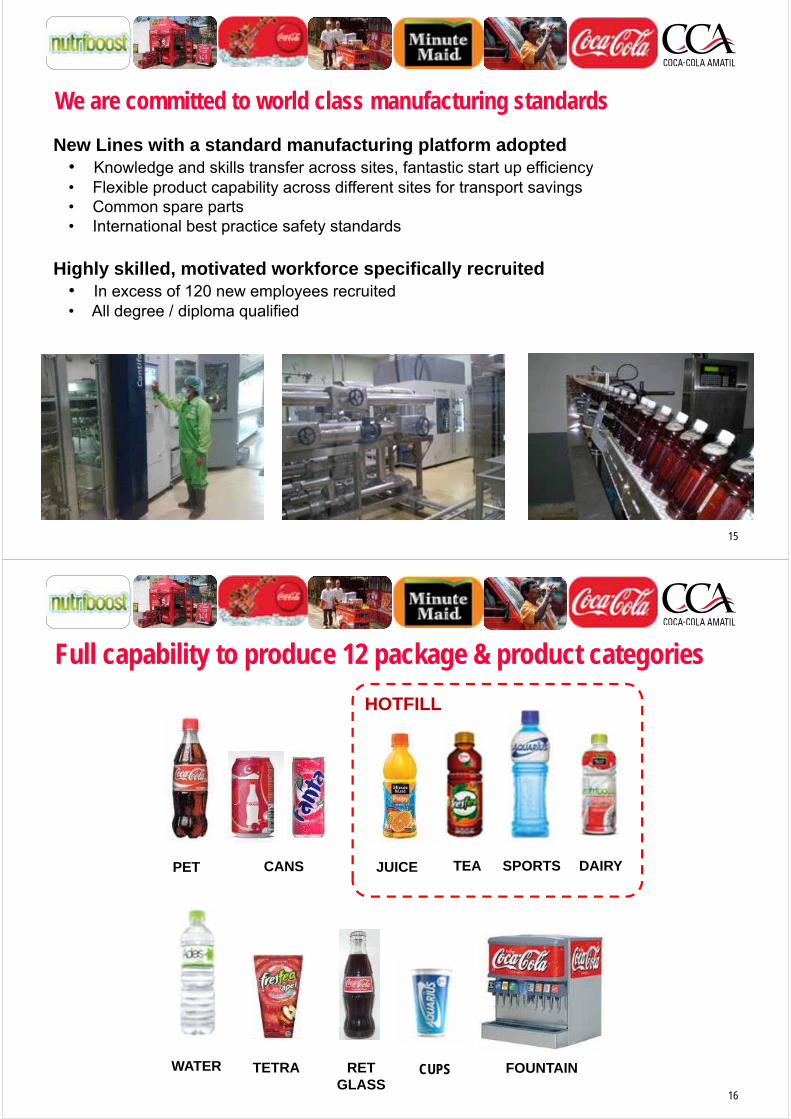
We have installed world class equipment in every plant
Hot Fill Line 4, Cibitung14
We are committed to world class manufacturing standards
New Lines with a standard manufacturing platform adopted• Knowledge and skills transfer across sites, fantastic start up efficiency• Flexible product capability across different sites for transport savings • Common spare parts • International best practice safety standards
Highly skilled, motivated workforce specifically recruited• In excess of 120 new employees recruited • All degree / diploma qualified
15
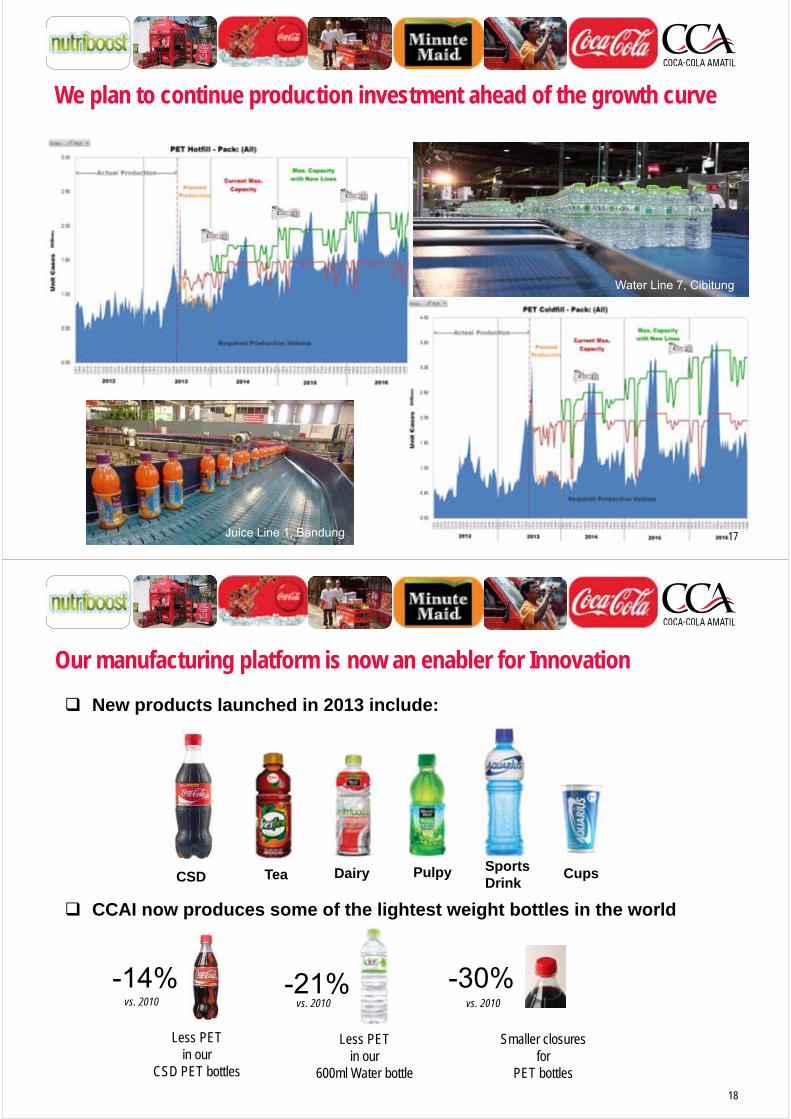
Full capability to produce 12 package & product categories
PET TEAJUICE
RET GLASS
CANS
TETRA
DAIRY
WATER
SPORTS
FOUNTAIN
HOTFILL
16
CUPS
We plan to continue production investment ahead of the growth curve
17
Water Line 7, Cibitung
Juice Line 1, Bandung
Our manufacturing platform is now an enabler for Innovation
CCAI now produces some of the lightest weight bottles in the world
-21%-14% -30%
Less PETin our
CSD PET bottles
Smaller closures for
PET bottles
Less PETin our
600ml Water bottle
New products launched in 2013 include:
CSD Tea Dairy Pulpy Sports Drink
18
Cups
vs. 2010 vs. 2010 vs. 2010
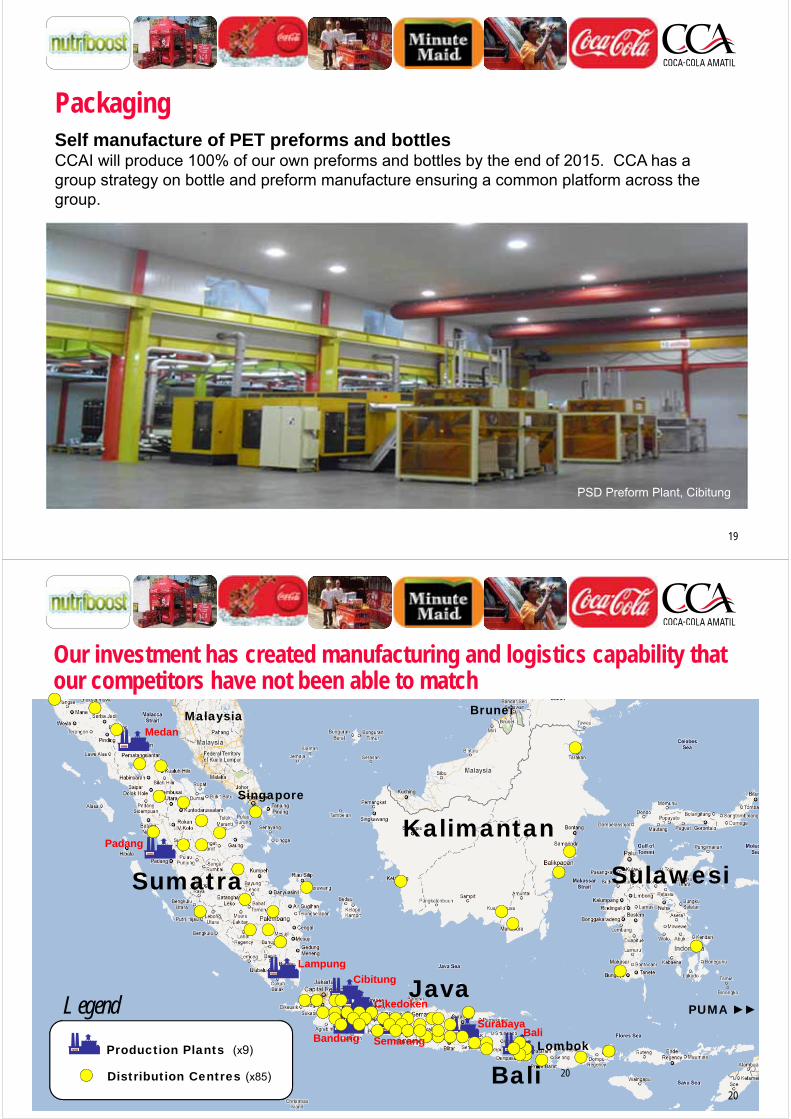
PackagingSelf manufacture of PET preforms and bottlesCCAI will produce 100% of our own preforms and bottles by the end of 2015. CCA has a group strategy on bottle and preform manufacture ensuring a common platform across the group.
PSD Preform Plant, Cibitung
19
Production Plants (x9)
Distribution Centres (x85)
Legend
20
Kalimantan
Sumatra
Java
Bali
Sulawesi
Lombok
PUMA ►►
Singapore
Malaysia
Thailand
Brunei
Our investment has created manufacturing and logistics capability that our competitors have not been able to match
Medan
Padang
Lampung
Cibitung
Bandung Semarang
SurabayaBali
Cikedoken
20

DisclaimerCCA advises that these presentation slides contain forward looking statements which may be subject to significant uncertainties outside of CCA’s control.
No representation is made as to the accuracy or reliability of forward looking statements or the assumptions on which they are based.
Actual future events may vary from these forward looking statements and you are cautioned not to place undue reliance on any forward looking statement.
Indonesia: Sustainability & Corporate Social Responsibility
Indonesia Investor TourNov 7-8, 2013
Bruce Waterfield Business Services DirectorPutri Silalahi Head of Corporate Communications
HISTORY IN INDONESIA
22 years of believing in the potential of Indonesia
2
s
Coca-Cola was invented
1886
1904Indonesia’s Independence
1886
2 Regional Distribution Centresstart operating
CCAI introduces PET packaging
2013
Coca-Cola entered Indonesia
1927
1945
3 Jan: Coca-Cola Amatilentered Indonesia
1992
1996
Full ownership of Coca-Cola Packaging & Distribution Businesses in Indonesia*
2005 2013
2012Acquisition of CikedokanPlant, West Java
CCA parent company was born
2008Bali Beach Clean Up established
100%
* Excluding Manado Region of Northern Sulawesi

DEVELOPMENT OF SUSTAINABILITY IN THE COUNTRY
We have a long history of corporate social responsibility in Indonesia through significant infrastructure investments, job creation, community development and support for the
livelihoods of workers and their families
3
Distribution in 1996 Semarang Plant Mosque Polyclinic Cibitung Idul Adha Medan in 2013
COCA-COLA FOUNDATION INDONESIA
4
Mi Classified - Restricted
Raising quality of education and improving
social welfare & community development:
• ‘Small Drops’ supported by local shared
funding with the Coca-Cola Company
• ‘Large Drops’ programs funded by
international donors such, as the Gates
Foundation
• Library Programs
• Scholarship Programs
• Water Programs
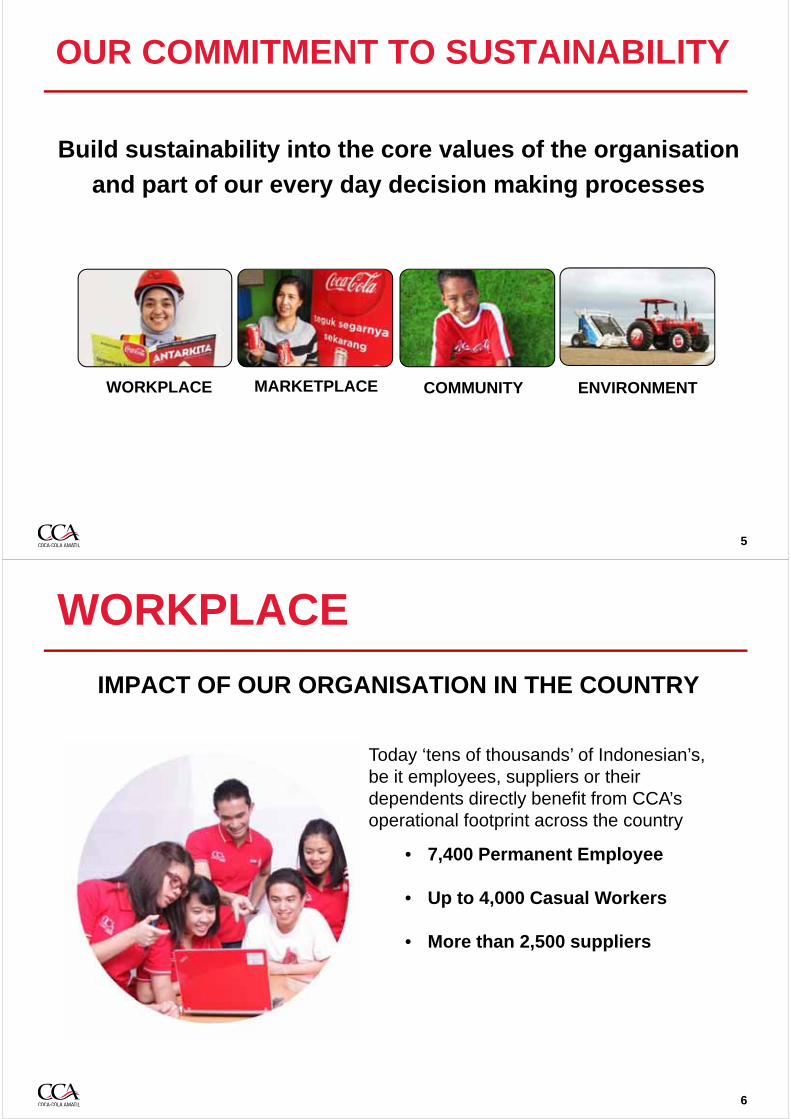
OUR COMMITMENT TO SUSTAINABILITY
Build sustainability into the core values of the organisation
and part of our every day decision making processes
5
WORKPLACE MARKETPLACE COMMUNITY ENVIRONMENT
WORKPLACE
IMPACT OF OUR ORGANISATION IN THE COUNTRY
6
Today ‘tens of thousands’ of Indonesian’s, be it employees, suppliers or their dependents directly benefit from CCA’s operational footprint across the country
• 7,400 Permanent Employee
• Up to 4,000 Casual Workers
• More than 2,500 suppliers
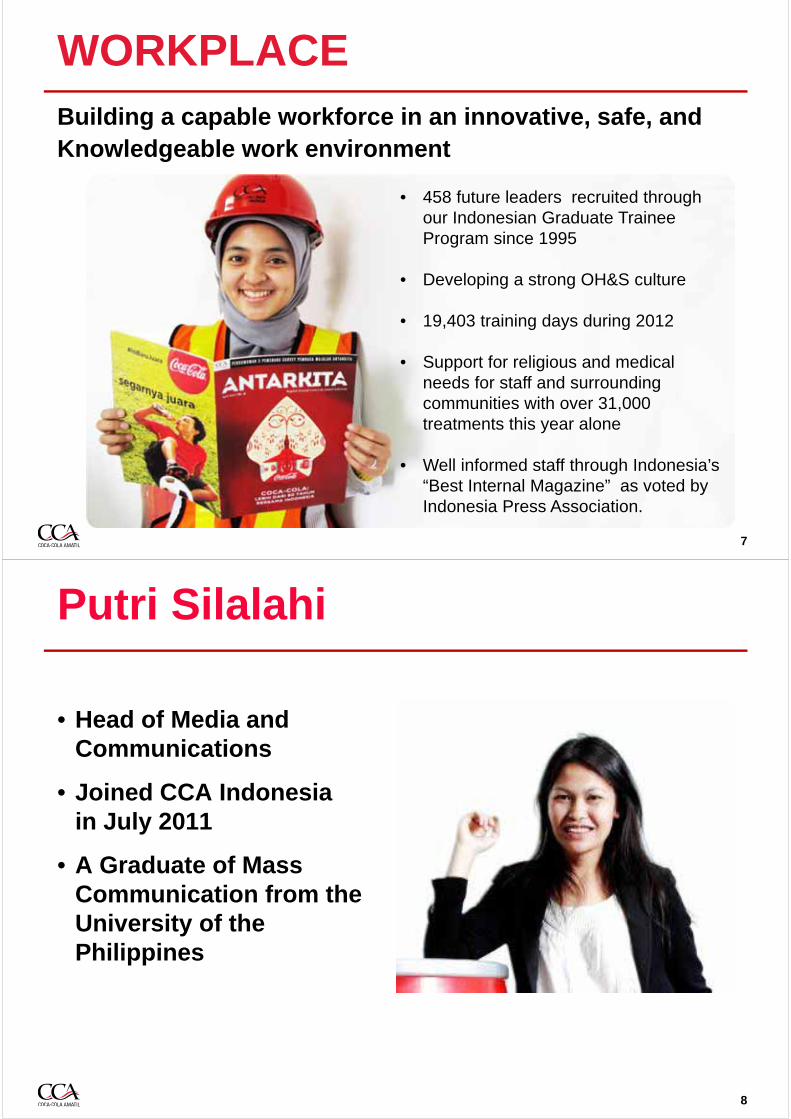
WORKPLACEBuilding a capable workforce in an innovative, safe, and Knowledgeable work environment
7
Mi Classified - Restricted
• 458 future leaders recruited through our Indonesian Graduate Trainee Program since 1995
• Developing a strong OH&S culture
• 19,403 training days during 2012
• Support for religious and medical needs for staff and surrounding communities with over 31,000 treatments this year alone
• Well informed staff through Indonesia’s “Best Internal Magazine” as voted by Indonesia Press Association.
Putri Silalahi
• Head of Media and Communications
• Joined CCA Indonesia in July 2011
• A Graduate of Mass Communication from the University of the Philippines
8

MARKETPLACE
9
• CCAI currently servicing 600,000 customers in the market
• Partnering with TCCC in the 5by20 program which will commence in November 2013
• CCAI plays an active leadership role in economic and industry associations:
• Indonesian Soft Drink Association (ASRIM)
• Indonesian Food & Beverage Association (GAPMMI)
• Indonesian Chamber of Commerce (KADIN)
• Indonesian-Australian Business Council (IABC)
• Indonesian Business Council for Sustainable Development (IBCSD)
Mi Classified - Restricted
MARKETPLACE
A Brand Portfolio that offers choice
10
Mi Classified -Restricted
SPARKLING LOW CALORIES / NO SUGAR
FUNCTIONAL WATERJUICETEADAIRY
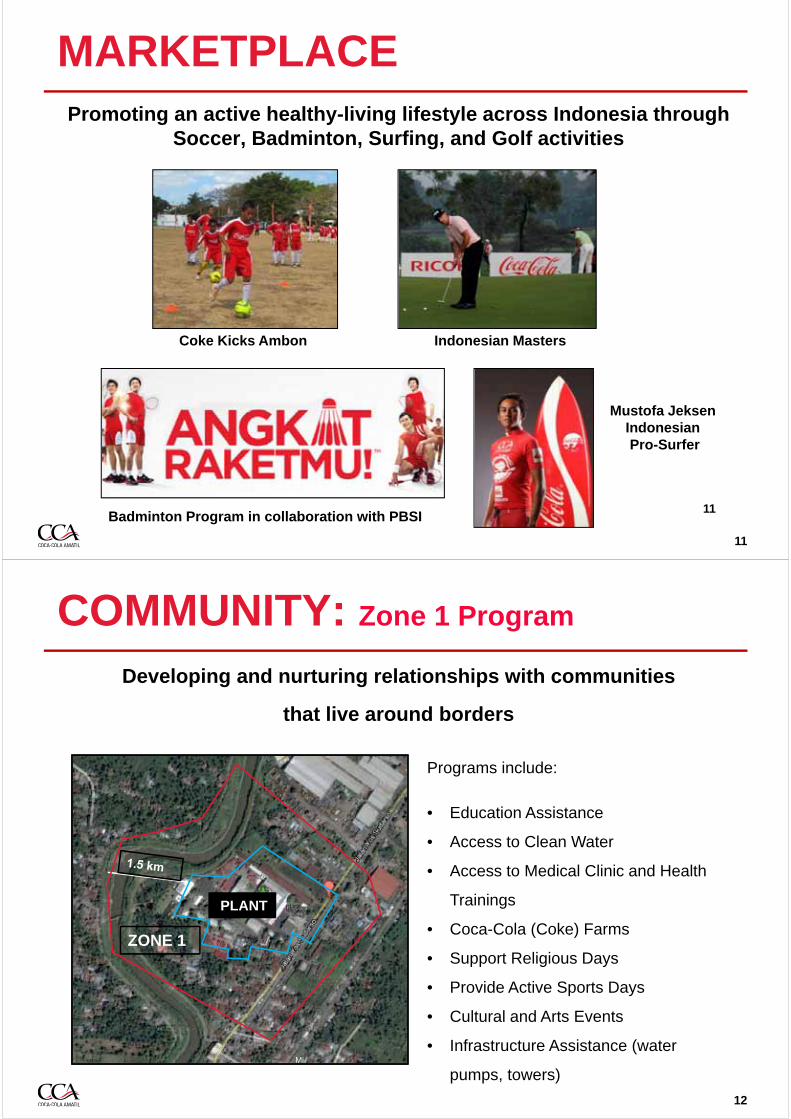
MARKETPLACEPromoting an active healthy-living lifestyle across Indonesia through
Soccer, Badminton, Surfing, and Golf activities
11
11Mi Classified - Restricted
Coke Kicks Ambon Indonesian Masters
Mustofa JeksenIndonesianPro-Surfer
Badminton Program in collaboration with PBSI
COMMUNITY: Zone 1 Program
Developing and nurturing relationships with communities
that live around borders
12
PLANT
ZONE 1
Mi Classified - Restricted
Programs include:
• Education Assistance
• Access to Clean Water
• Access to Medical Clinic and Health
Trainings
• Coca-Cola (Coke) Farms
• Support Religious Days
• Provide Active Sports Days
• Cultural and Arts Events
• Infrastructure Assistance (water
pumps, towers)
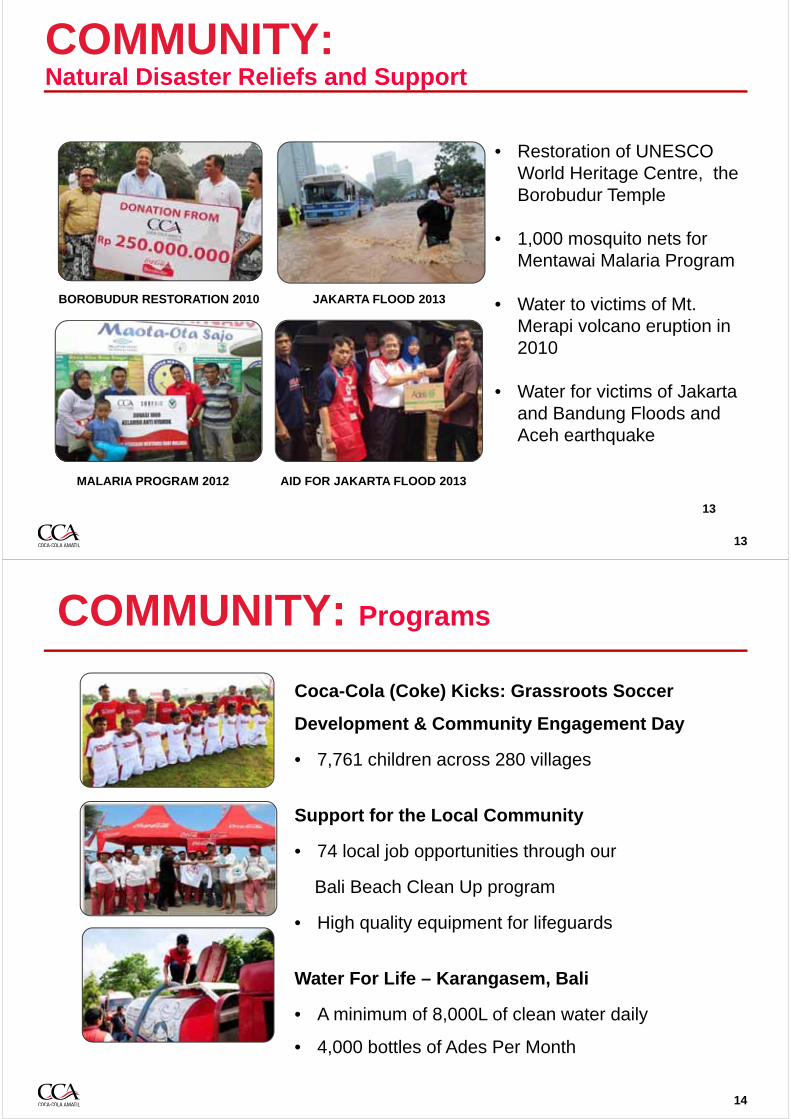
COMMUNITY:Natural Disaster Reliefs and Support
13
• Restoration of UNESCO World Heritage Centre, the Borobudur Temple
• 1,000 mosquito nets for Mentawai Malaria Program
• Water to victims of Mt. Merapi volcano eruption in 2010
• Water for victims of Jakarta and Bandung Floods and Aceh earthquake
13
MALARIA PROGRAM 2012 AID FOR JAKARTA FLOOD 2013
JAKARTA FLOOD 2013BOROBUDUR RESTORATION 2010
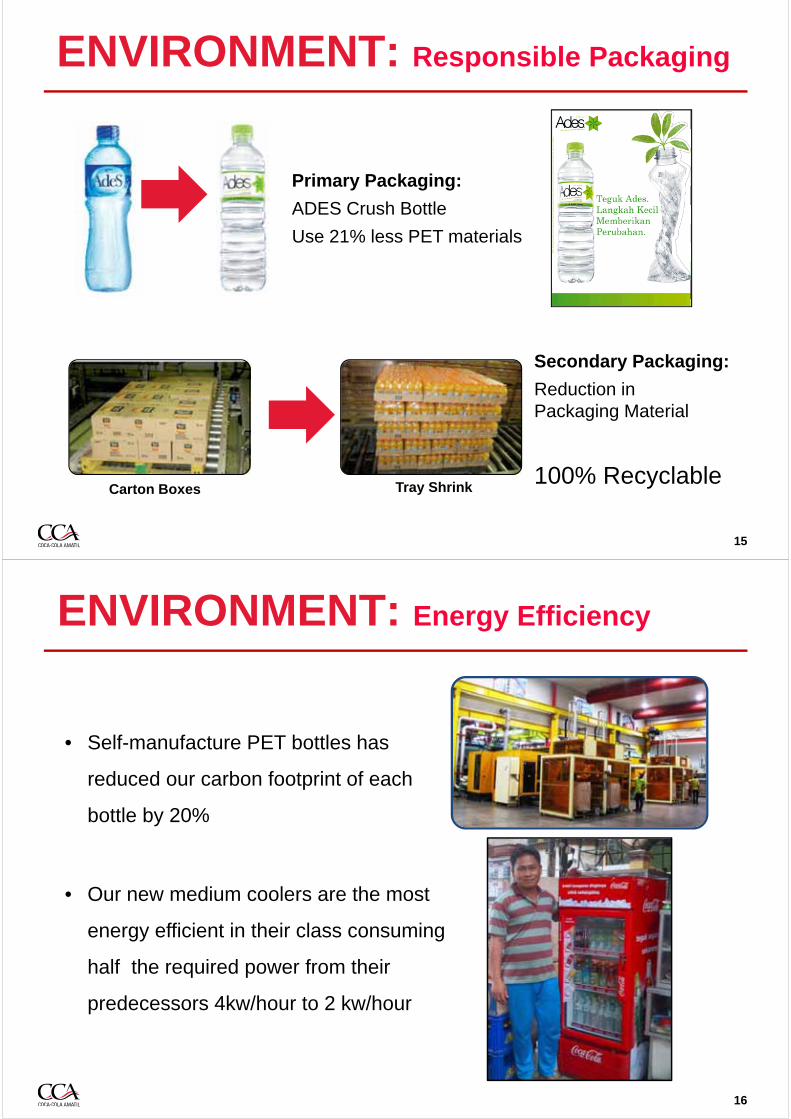
COMMUNITY: Programs
14
Coca-Cola (Coke) Kicks: Grassroots Soccer
Development & Community Engagement Day
• 7,761 children across 280 villages
Support for the Local Community
• 74 local job opportunities through our
Bali Beach Clean Up program
• High quality equipment for lifeguards
Water For Life – Karangasem, Bali
• A minimum of 8,000L of clean water daily
• 4,000 bottles of Ades Per Month
Mi Classified - Restricted
ENVIRONMENT: Responsible Packaging
15
Primary Packaging:
ADES Crush Bottle
Use 21% less PET materials
Secondary Packaging:
Reduction in Packaging Material
100% RecyclableCarton Boxes Tray Shrink
ENVIRONMENT: Energy Efficiency
16
• Self-manufacture PET bottles has
reduced our carbon footprint of each
bottle by 20%
• Our new medium coolers are the most
energy efficient in their class consuming
half the required power from their
predecessors 4kw/hour to 2 kw/hour
Mi Classified - Restricted
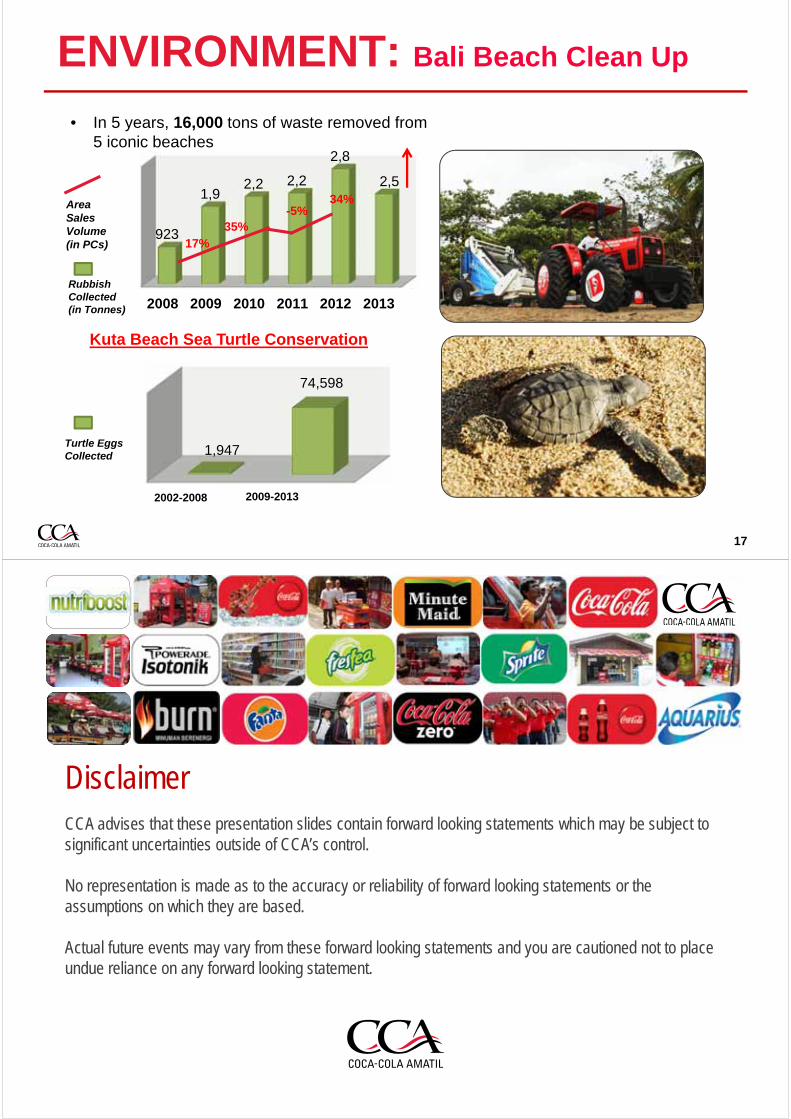
ENVIRONMENT: Bali Beach Clean Up
17
2008 2009 2010 2011 2012 2013
923
1,92,2 2,2
2,8
2,5
• In 5 years, 16,000 tons of waste removed from 5 iconic beaches
Mi Classified - Restricted
Rubbish Collected (in Tonnes)
Area Sales Volume (in PCs) 17%
35%-5%
34%
1,947
74,598
2002-2008 2009-2013
Turtle Eggs Collected
Kuta Beach Sea Turtle Conservation
DisclaimerCCA advises that these presentation slides contain forward looking statements which may be subject to significant uncertainties outside of CCA’s control.
No representation is made as to the accuracy or reliability of forward looking statements or the assumptions on which they are based.
Actual future events may vary from these forward looking statements and you are cautioned not to place undue reliance on any forward looking statement.
11
Australasian Strategy ReviewIndonesia Investor Tour
Nov 7-8, 2013
Warwick White Managing Director Australasia
2
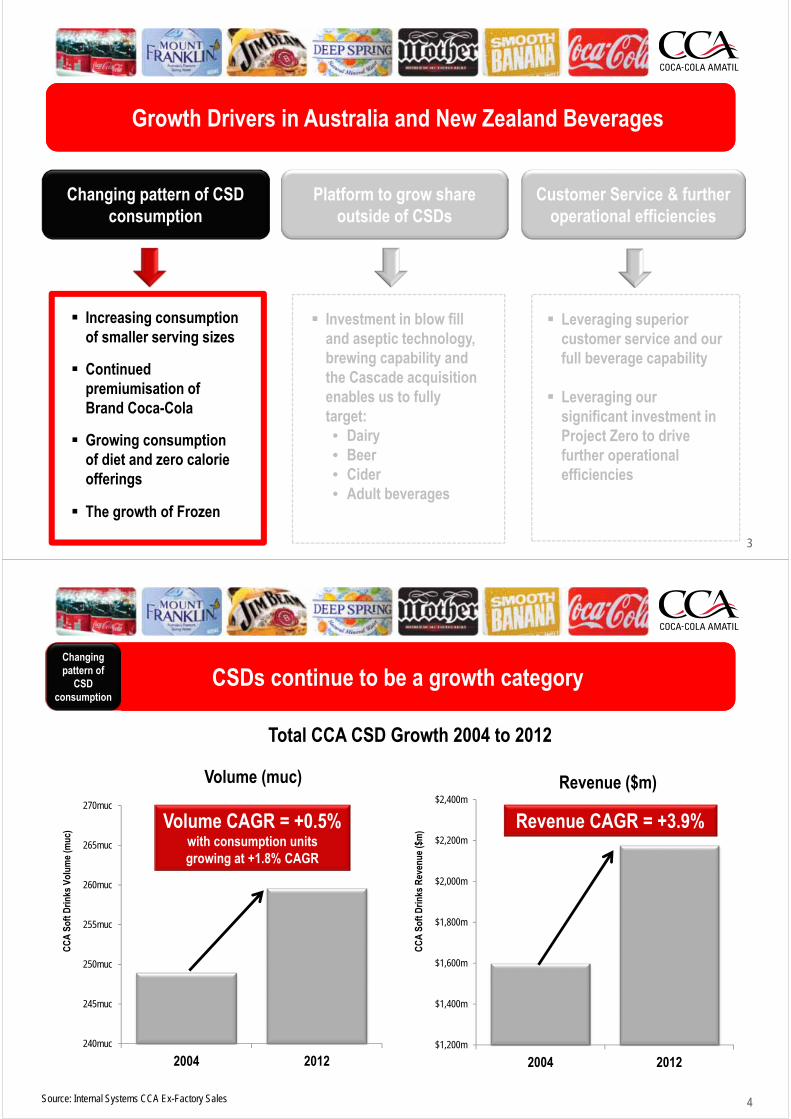
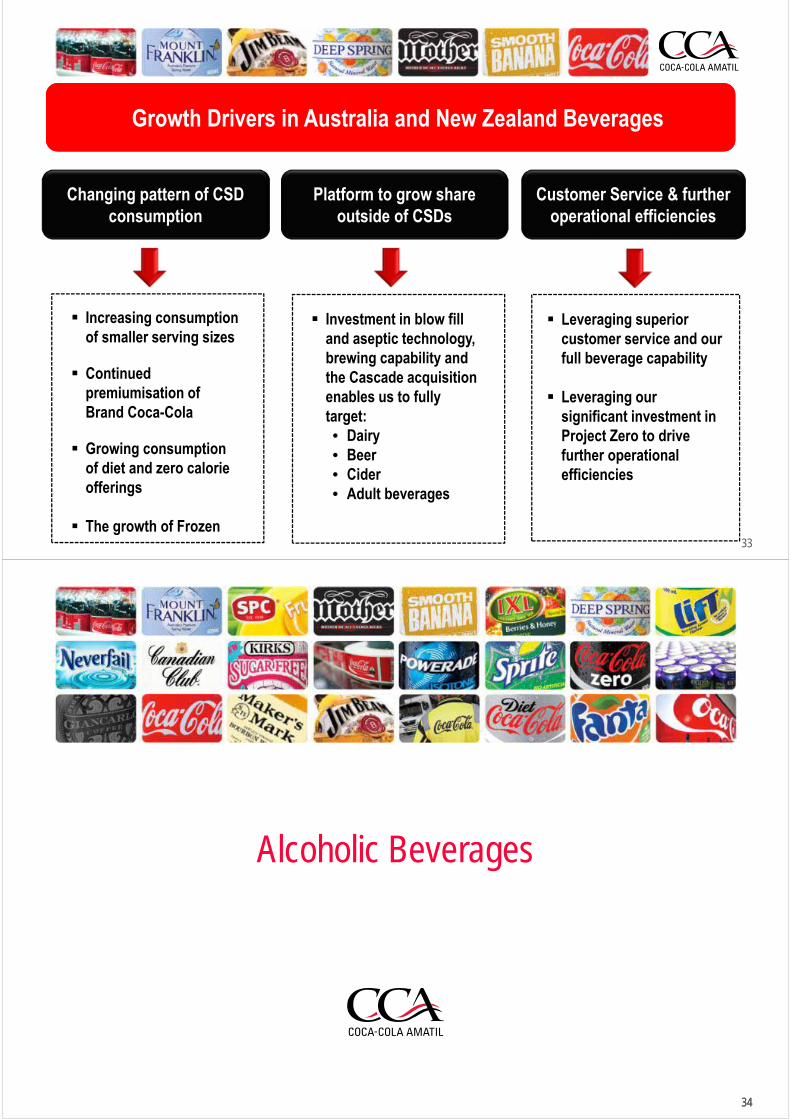
Growth drivers in Australia and New Zealand BeveragesGrowth drivers in Australia and New Zealand Beverages
Changing pattern of CSD consumption
Platform to grow share outside of CSDs
Customer Service & further operational efficiencies
Increasing consumption of smaller serving sizes
Continued premiumisation of Brand Coca-Cola
Growing consumption of diet and zero calorie offerings
The growth of Frozen
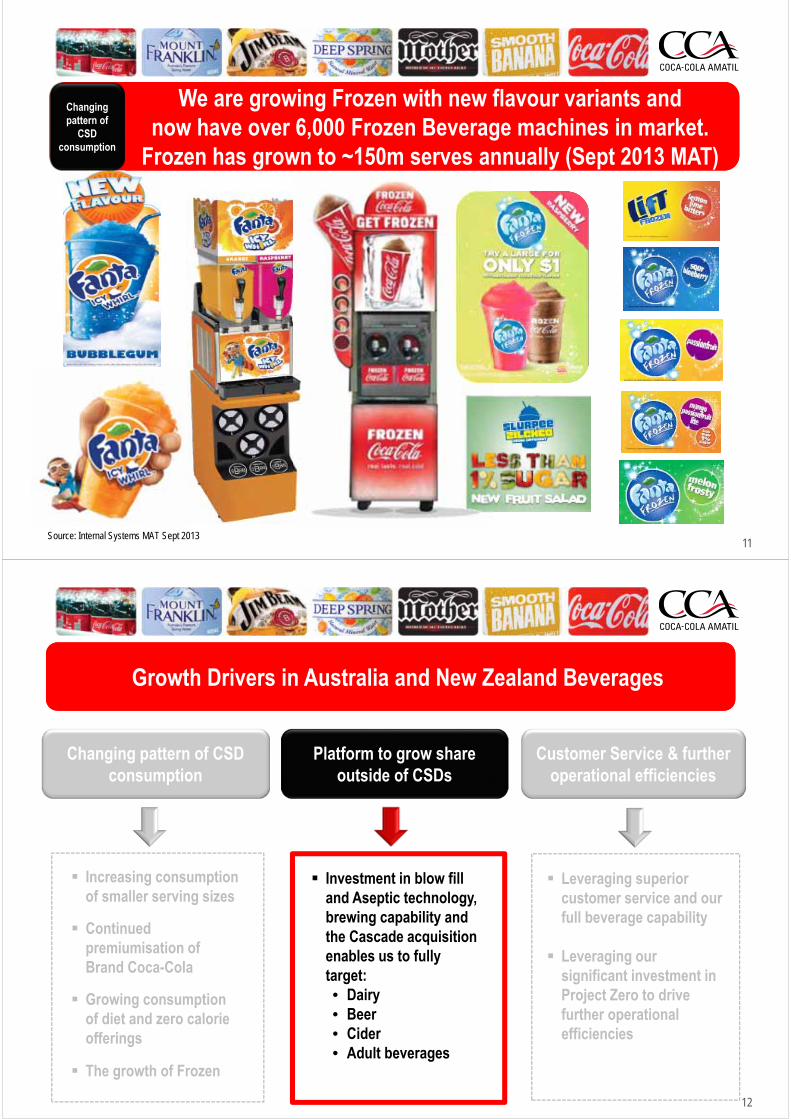
Investment in blow fill and aseptic technology, brewing capability and the Cascade acquisition enables us to fully target:• Dairy• Beer• Cider• Adult beverages
Leveraging superior customer service and our full beverage capability
Leveraging our significant investment in Project Zero to drive further operational efficiencies
3
Growth Drivers in Australia and New Zealand BeveragesGrowth Drivers in Australia and New Zealand Beverages
Changing pattern of CSD consumption
Platform to grow share outside of CSDs
Customer Service & further operational efficiencies
Investment in blow fill and aseptic technology, brewing capability and the Cascade acquisition enables us to fully target:• Dairy• Beer• Cider• Adult beverages
Leveraging superior customer service and our full beverage capability
Leveraging our significant investment in Project Zero to drive further operational efficiencies
Increasing consumption of smaller serving sizes
Continued premiumisation of Brand Coca-Cola
Growing consumption of diet and zero calorie offerings
The growth of Frozen
4
240muc
245muc
250muc
255muc
260muc
265muc
270muc
2004 2012
CC
A S
oft D
rinks
Vol
ume
(muc
)
Volume (muc)
$1,200m
$1,400m
$1,600m
$1,800m
$2,000m
$2,200m
$2,400m
2004 2012
CC
A S
oft D
rinks
Rev
enue
($m
)
Revenue ($m)
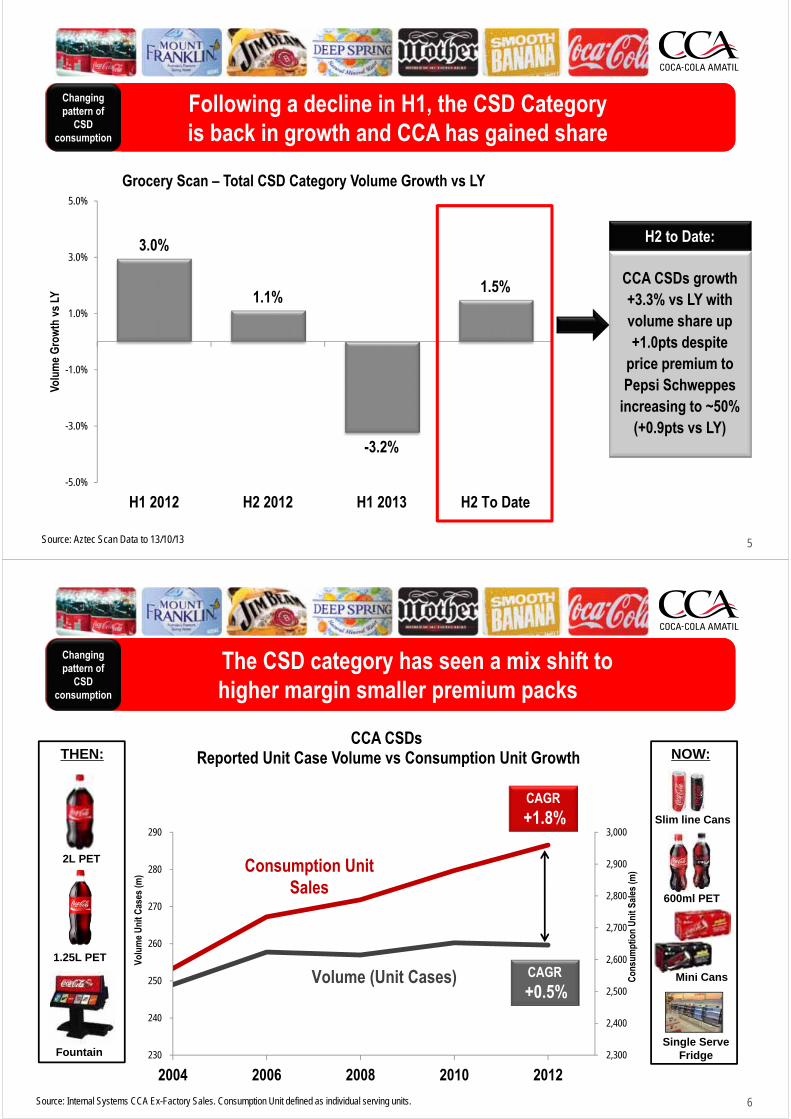
Volume CAGR = +0.5%with consumption units growing at +1.8% CAGR
CSDs continue to be a growth categoryCSDs continue to be a growth category
Revenue CAGR = +3.9%
Total CCA CSD Growth 2004 to 2012
Source: Internal Systems CCA Ex-Factory Sales
Changing pattern of
CSD consumption
5
3.0%
1.1%
-3.2%
1.5%
-5.0%
-3.0%
-1.0%
1.0%
3.0%
5.0%
H1 2012 H2 2012 H1 2013 H2 To Date
Volu
me
Gro
wth
vs
LY
Grocery Scan – Total CSD Category Volume Growth vs LY
Following a decline in H1, the CSD Category is back in growth and CCA has gained shareFollowing a decline in H1, the CSD Category is back in growth and CCA has gained share
Source: Aztec Scan Data to 13/10/13
Changing pattern of
CSD consumption
CCA CSDs growth +3.3% vs LY with volume share up +1.0pts despite
price premium to Pepsi Schweppes
increasing to ~50% (+0.9pts vs LY)
H2 to Date:
6
2,300
2,400
2,500
2,600
2,700
2,800
2,900
3,000
230
240
250
260
270
280
290
2004 2006 2008 2010 2012
Con
sum
ptio
n U
nit S
ales
(m)
Volu
me
Uni
t Cas
es (m
)
CCA CSDsReported Unit Case Volume vs Consumption Unit Growth
Volume (Unit Cases)
Consumption Unit Sales
The CSD category has seen a mix shift to higher margin smaller premium packsThe CSD category has seen a mix shift to higher margin smaller premium packs
CAGR
+0.5%
CAGR
+1.8%
Source: Internal Systems CCA Ex-Factory Sales. Consumption Unit defined as individual serving units.
2L PET
Mini Cans
Changing pattern of
CSD consumption
THEN: NOW:
1.25L PET
Fountain
600ml PET
Slim line Cans
Single Serve Fridge
7
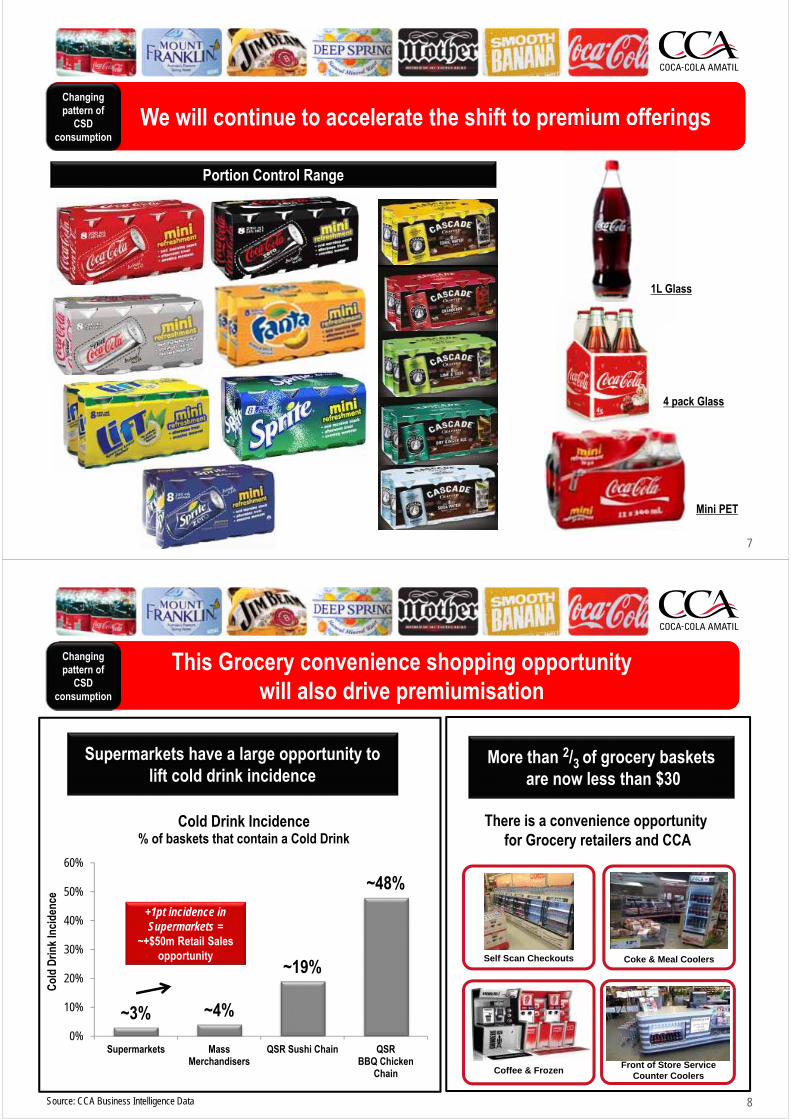
We will continue to accelerate the shift to premium offeringsWe will continue to accelerate the shift to premium offerings
Mini PET
1L Glass
4 pack Glass
Changing pattern of
CSD consumption
Portion Control Range
8
~3% ~4%
~19%
~48%
0%
10%
20%
30%
40%
50%
60%
Supermarkets MassMerchandisers
QSR Sushi Chain QSRBBQ Chicken
Chain
Col
d D
rink
Inci
denc
e
Cold Drink Incidence % of baskets that contain a Cold Drink
Supermarkets have a large opportunity to lift cold drink incidence
This Grocery convenience shopping opportunitywill also drive premiumisation
This Grocery convenience shopping opportunitywill also drive premiumisation
+1pt incidence in Supermarkets =
~+$50m Retail Sales opportunity
There is a convenience opportunityfor Grocery retailers and CCA
More than 2/3 of grocery basketsare now less than $30
Source: CCA Business Intelligence Data
Self Scan Checkouts Coke & Meal Coolers
Coffee & FrozenFront of Store Service
Counter Coolers
Changing pattern of
CSD consumption
9
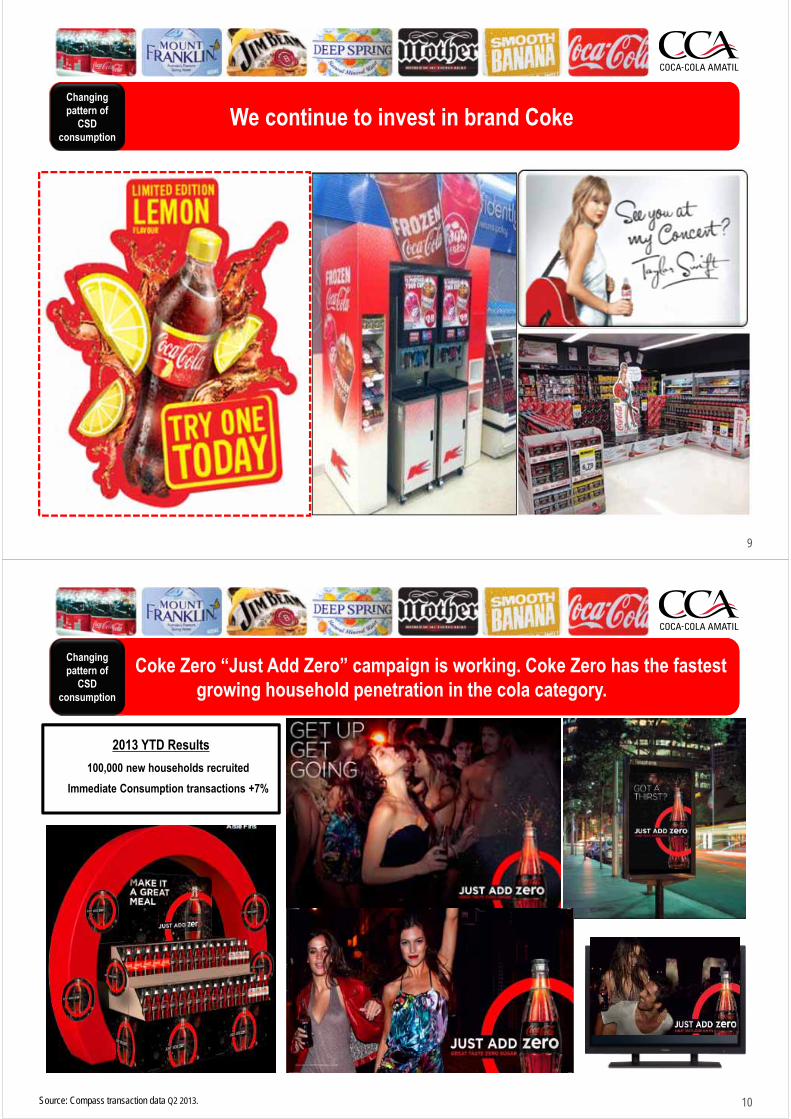
We continue to invest in brand CokeWe continue to invest in brand CokeChanging pattern of
CSD consumption
10
Coke Zero “Just Add Zero” campaign is working. Coke Zero has the fastest growing household penetration in the cola category.
Coke Zero “Just Add Zero” campaign is working. Coke Zero has the fastest growing household penetration in the cola category.
2013 YTD Results
100,000 new households recruited
Immediate Consumption transactions +7%
Changing pattern of
CSD consumption
Source: Compass transaction data Q2 2013.
11
We are growing Frozen with new flavour variants and now have over 6,000 Frozen Beverage machines in market.
Frozen has grown to ~150m serves annually (Sept 2013 MAT)
We are growing Frozen with new flavour variants and now have over 6,000 Frozen Beverage machines in market.
Frozen has grown to ~150m serves annually (Sept 2013 MAT)
Source: Internal Systems MAT Sept 2013
Changing pattern of
CSD consumption
12
Growth Drivers in Australia and New Zealand BeveragesGrowth Drivers in Australia and New Zealand Beverages
Changing pattern of CSD consumption
Platform to grow share outside of CSDs
Customer Service & further operational efficiencies
Investment in blow fill and Aseptic technology, brewing capability and the Cascade acquisition enables us to fully target:• Dairy• Beer• Cider• Adult beverages
Leveraging superior customer service and our full beverage capability
Leveraging our significant investment in Project Zero to drive further operational efficiencies
Increasing consumption of smaller serving sizes
Continued premiumisation of Brand Coca-Cola
Growing consumption of diet and zero calorie offerings
The growth of Frozen
13
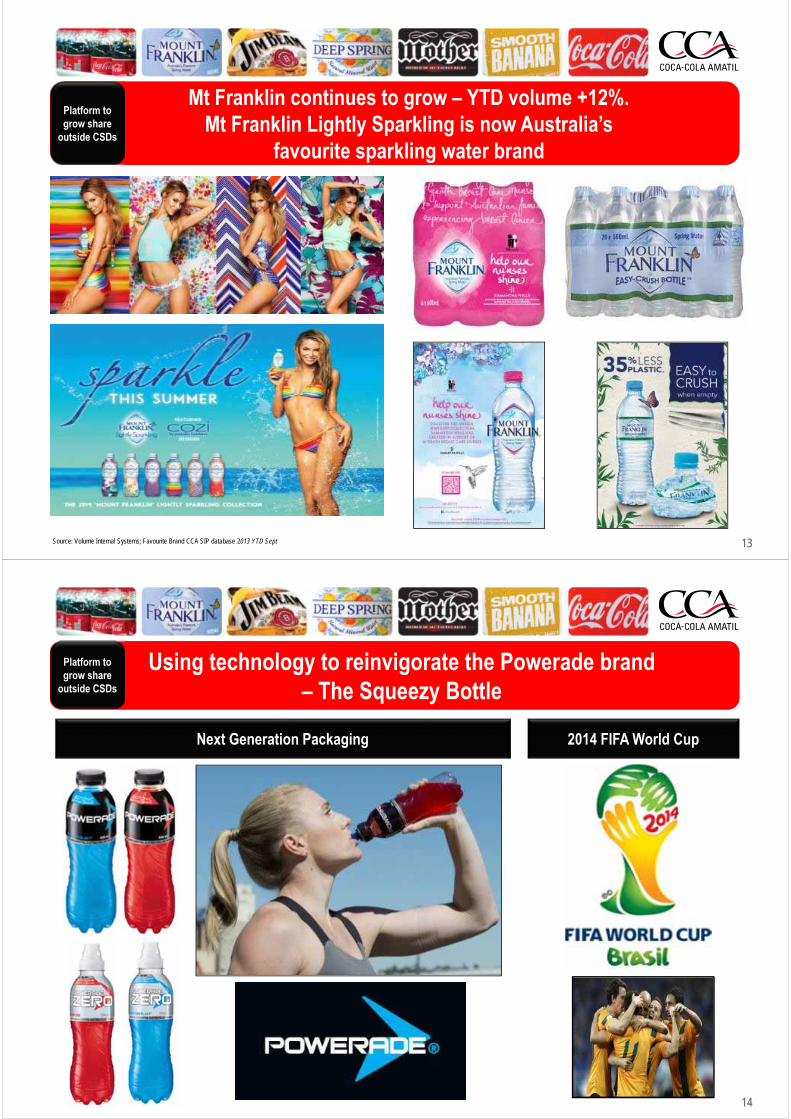
Mt Franklin continues to grow – YTD volume +12%. Mt Franklin Lightly Sparkling is now Australia’s
favourite sparkling water brand
Mt Franklin continues to grow – YTD volume +12%. Mt Franklin Lightly Sparkling is now Australia’s
favourite sparkling water brand
Source: Volume Internal Systems; Favourite Brand CCA SIP database 2013 YTD Sept
Platform to grow share
outside CSDs
14
Using technology to reinvigorate the Powerade brand – The Squeezy Bottle
Using technology to reinvigorate the Powerade brand – The Squeezy Bottle
2014 FIFA World CupNext Generation Packaging
Platform to grow share
outside CSDs
15
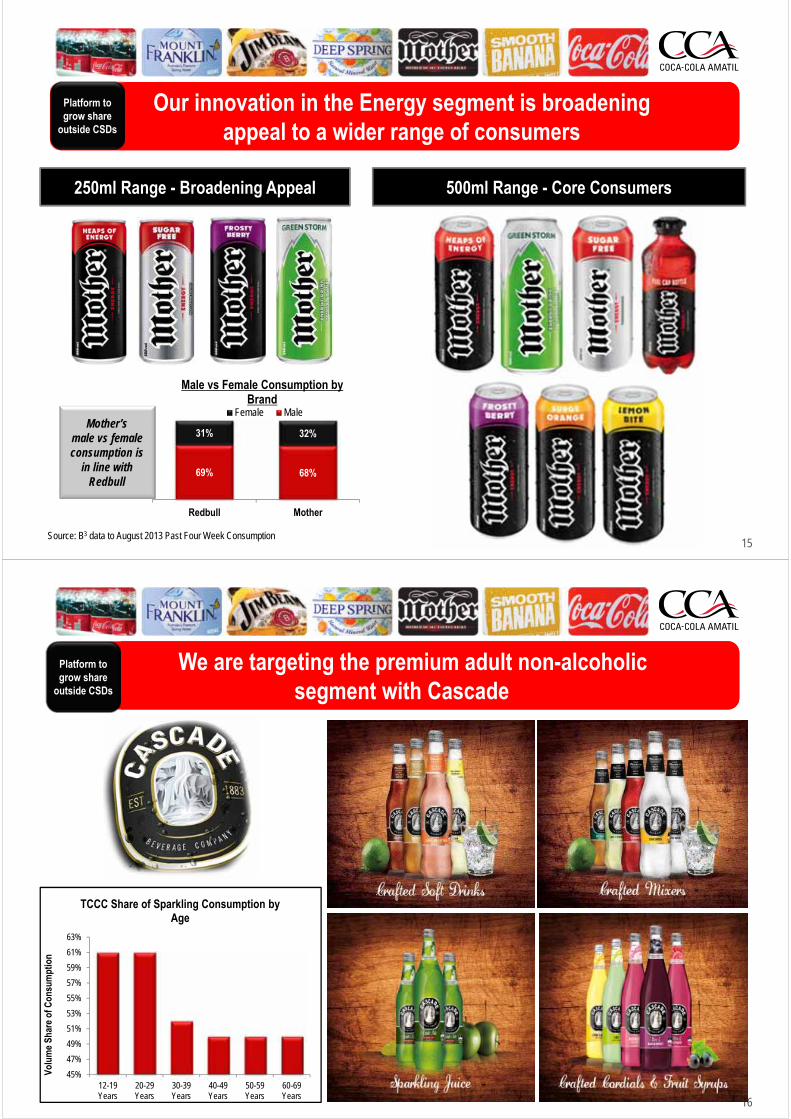
Our innovation in the Energy segment is broadening appeal to a wider range of consumers
Our innovation in the Energy segment is broadening appeal to a wider range of consumers
250ml Range - Broadening Appeal
Source: B3 data to August 2013 Past Four Week Consumption
69% 68%
31% 32%
Redbull Mother
Male vs Female Consumption by Brand
Female MaleMother’s
male vs female consumption is
in line with Redbull
500ml Range - Core Consumers
Platform to grow share
outside CSDs
16
We are targeting the premium adult non-alcoholic segment with Cascade
We are targeting the premium adult non-alcoholic segment with Cascade
Platform to grow share
outside CSDs
45%
47%
49%
51%
53%
55%
57%
59%
61%
63%
12-19Years
20-29Years
30-39Years
40-49Years
50-59Years
60-69Years
Volu
me
Shar
e of
Con
sum
ptio
n
TCCC Share of Sparkling Consumption by Age
17
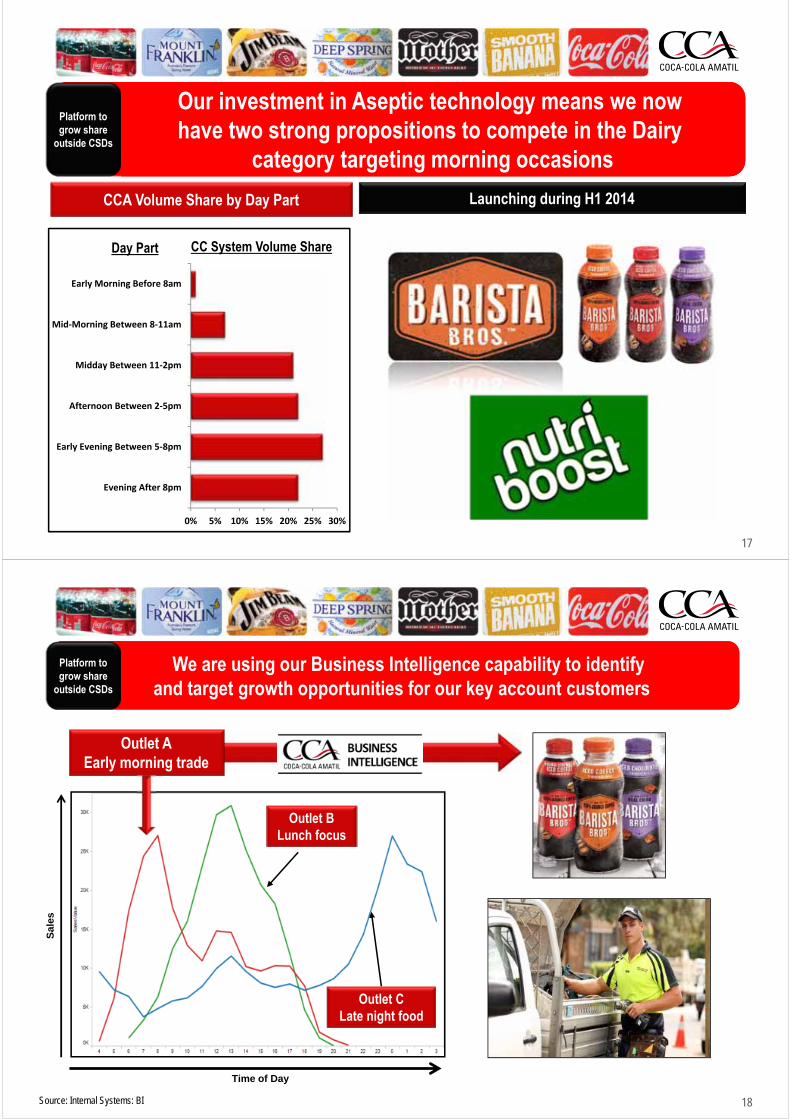
0% 5% 10% 15% 20% 25% 30%
Early Morning Before 8am
Mid‐Morning Between 8‐11am
Midday Between 11‐2pm
Afternoon Between 2‐5pm
Early Evening Between 5‐8pm
Evening After 8pm
Day Part CC System Volume Share
Our investment in Aseptic technology means we now have two strong propositions to compete in the Dairy
category targeting morning occasions
Our investment in Aseptic technology means we now have two strong propositions to compete in the Dairy
category targeting morning occasions
Platform to grow share
outside CSDs
Launching during H1 2014CCA Volume Share by Day Part
18
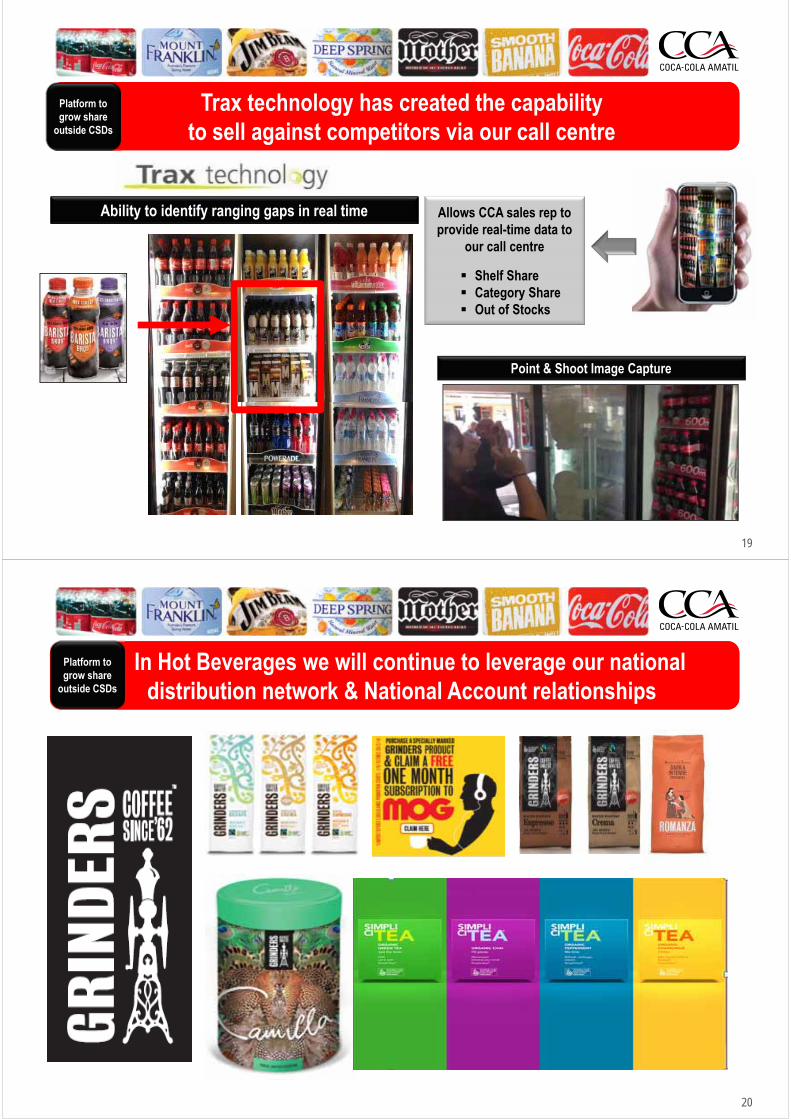
We are using our Business Intelligence capability to identify and target growth opportunities for our key account customers
We are using our Business Intelligence capability to identify and target growth opportunities for our key account customers
Platform to grow share
outside CSDs
Time of Day
Sal
es
Outlet CLate night food
Outlet BLunch focus
Outlet AEarly morning trade
Source: Internal Systems: BI
19
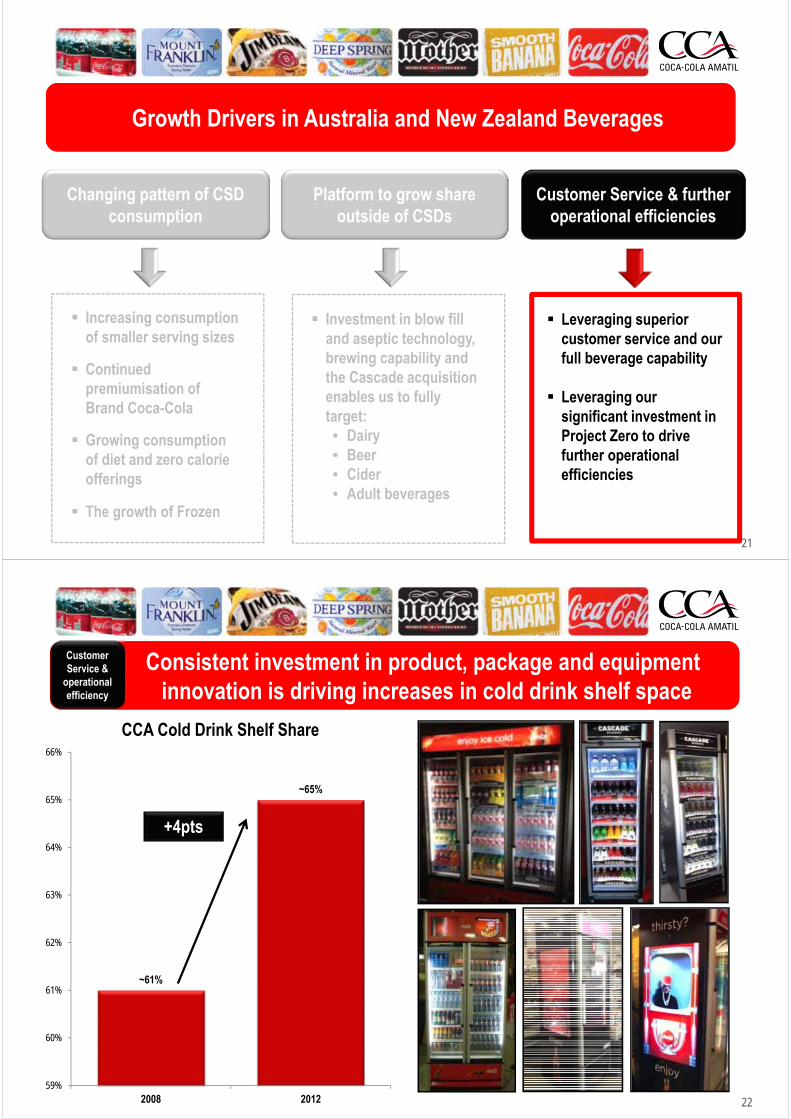
Trax technology has created the capability to sell against competitors via our call centre
Trax technology has created the capability to sell against competitors via our call centre
Ability to identify ranging gaps in real time Allows CCA sales rep to provide real-time data to
our call centre
Shelf Share Category Share Out of Stocks
Point & Shoot Image Capture
Platform to grow share
outside CSDs
20
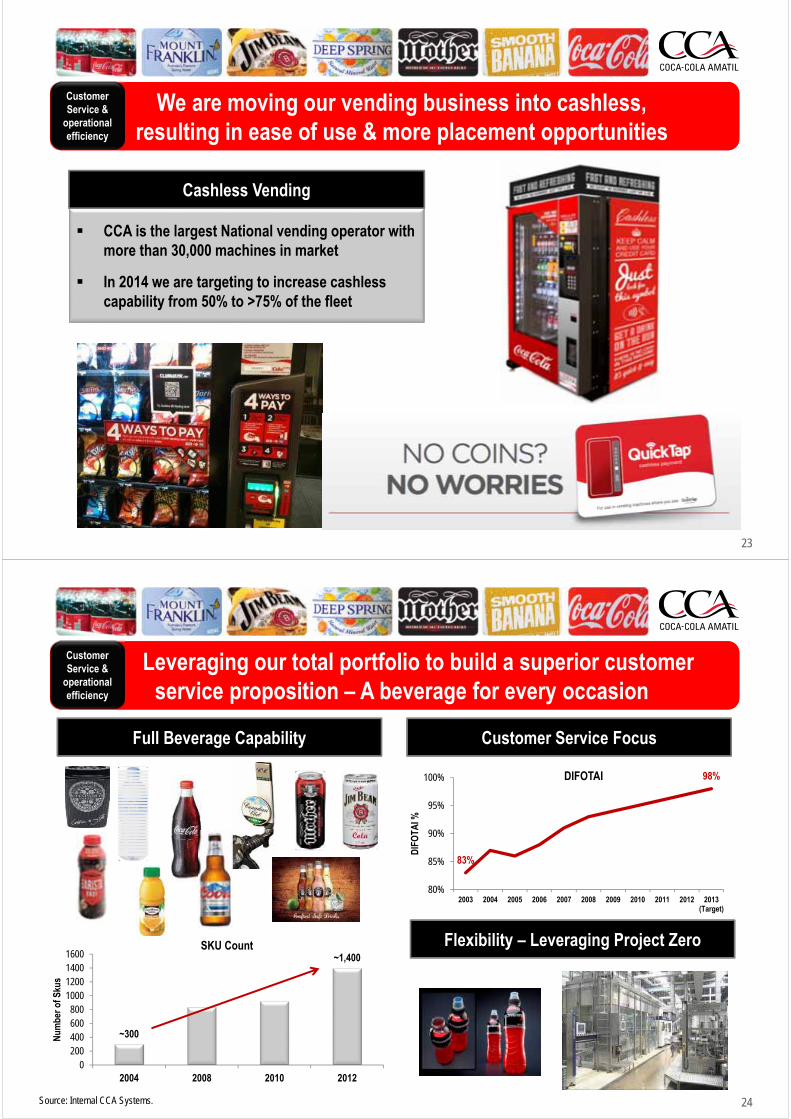
In Hot Beverages we will continue to leverage our national distribution network & National Account relationships
In Hot Beverages we will continue to leverage our national distribution network & National Account relationships
Platform to grow share
outside CSDs
21
Growth Drivers in Australia and New Zealand BeveragesGrowth Drivers in Australia and New Zealand Beverages
Changing pattern of CSD consumption
Platform to grow share outside of CSDs
Customer Service & further operational efficiencies
Investment in blow fill and aseptic technology, brewing capability and the Cascade acquisition enables us to fully target:• Dairy• Beer• Cider• Adult beverages
Leveraging superior customer service and our full beverage capability
Leveraging our significant investment in Project Zero to drive further operational efficiencies
Increasing consumption of smaller serving sizes
Continued premiumisation of Brand Coca-Cola
Growing consumption of diet and zero calorie offerings
The growth of Frozen
22
~61%
~65%
59%
60%
61%
62%
63%
64%
65%
66%
2008 2012
CCA Cold Drink Shelf Share
Consistent investment in product, package and equipment innovation is driving increases in cold drink shelf space
Consistent investment in product, package and equipment innovation is driving increases in cold drink shelf space
+4pts
Customer Service &
operational efficiency
23
We are moving our vending business into cashless, resulting in ease of use & more placement opportunities
We are moving our vending business into cashless, resulting in ease of use & more placement opportunities
CCA is the largest National vending operator with more than 30,000 machines in market
In 2014 we are targeting to increase cashless capability from 50% to >75% of the fleet
Cashless Vending
Customer Service &
operational efficiency
24
Leveraging our total portfolio to build a superior customer service proposition – A beverage for every occasion
Leveraging our total portfolio to build a superior customer service proposition – A beverage for every occasion
Flexibility – Leveraging Project Zero
Customer Service FocusFull Beverage Capability
83%
98%
80%
85%
90%
95%
100%
2003 2004 2005 2006 2007 2008 2009 2010 2011 2012 2013(Target)
DIF
OTA
I %
DIFOTAI
Customer Service &
operational efficiency
~300
~1,400
0200400600800
1000120014001600
2004 2008 2010 2012
Num
ber o
f Sku
s
SKU Count
Source: Internal CCA Systems.
25
We have a 3 year programme to leverage our significant investment in Project Zero to drive operational efficiencies
across all areas of our business
We have a 3 year programme to leverage our significant investment in Project Zero to drive operational efficiencies
across all areas of our business
Customer Service &
operational efficiency
myCCA Operational Excellence Capital Investments
Online platform which allows CCA Customers to place orders, pay invoices
& request assistance
A culture of innovation and efficiency within a structured framework
2626
New Zealand
27
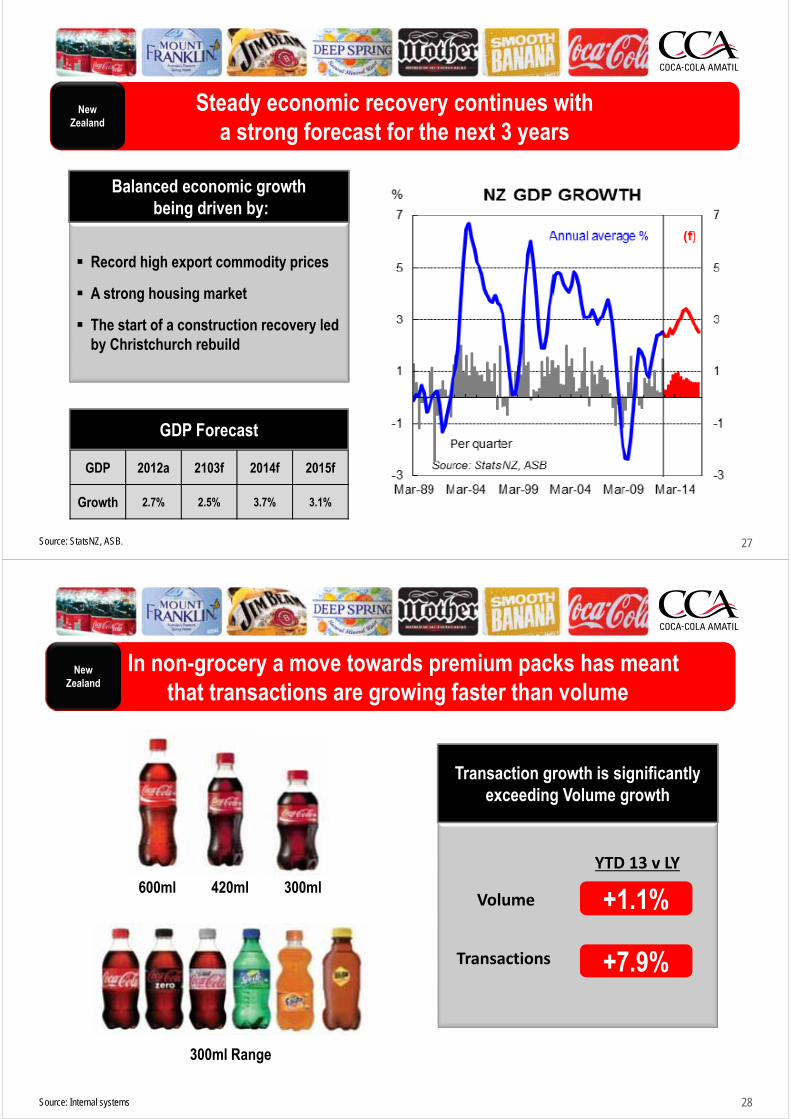
GDP 2012a 2103f 2014f 2015f
Growth 2.7% 2.5% 3.7% 3.1%
Steady economic recovery continues with a strong forecast for the next 3 years
Steady economic recovery continues with a strong forecast for the next 3 years
Record high export commodity prices
A strong housing market
The start of a construction recovery led by Christchurch rebuild
Balanced economic growthbeing driven by:
GDP Forecast
New Zealand
Source: StatsNZ, ASB.
28
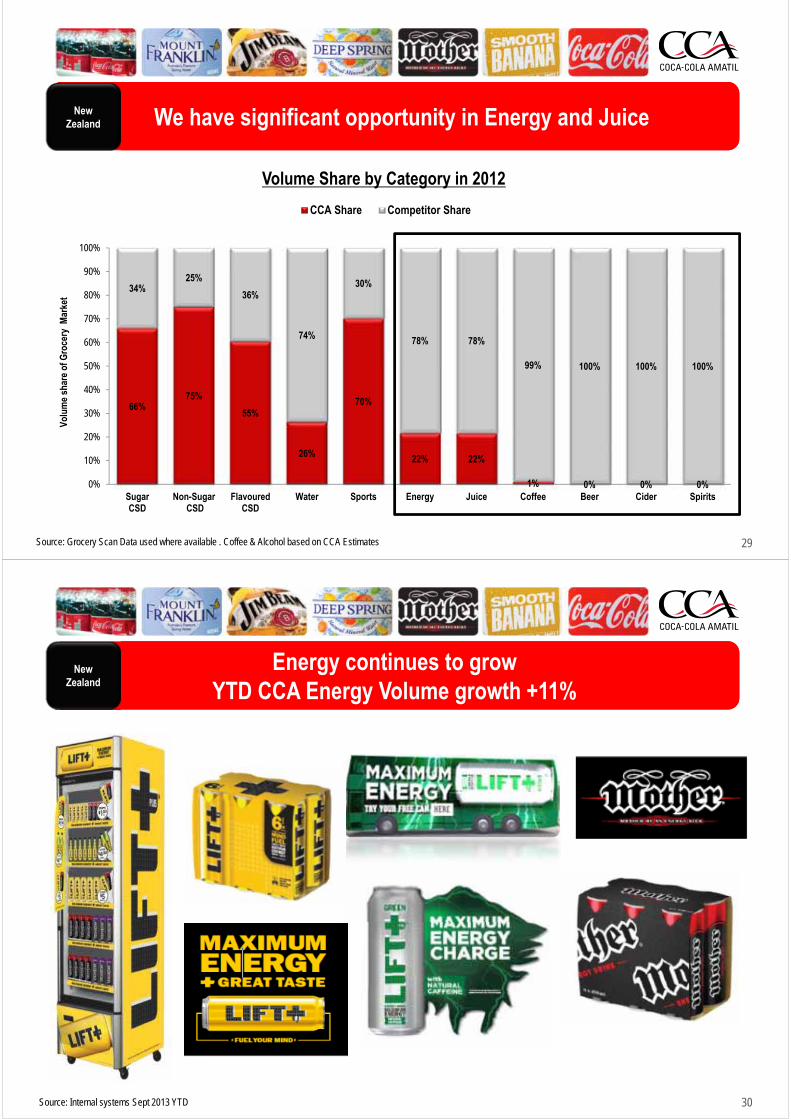
In non-grocery a move towards premium packs has meantthat transactions are growing faster than volume
In non-grocery a move towards premium packs has meantthat transactions are growing faster than volume
+1.1%
+7.9%
Volume
Transactions
YTD 13 v LY
Source: Internal systems
600ml 420ml 300ml
300ml Range
New Zealand
Transaction growth is significantly exceeding Volume growth
29
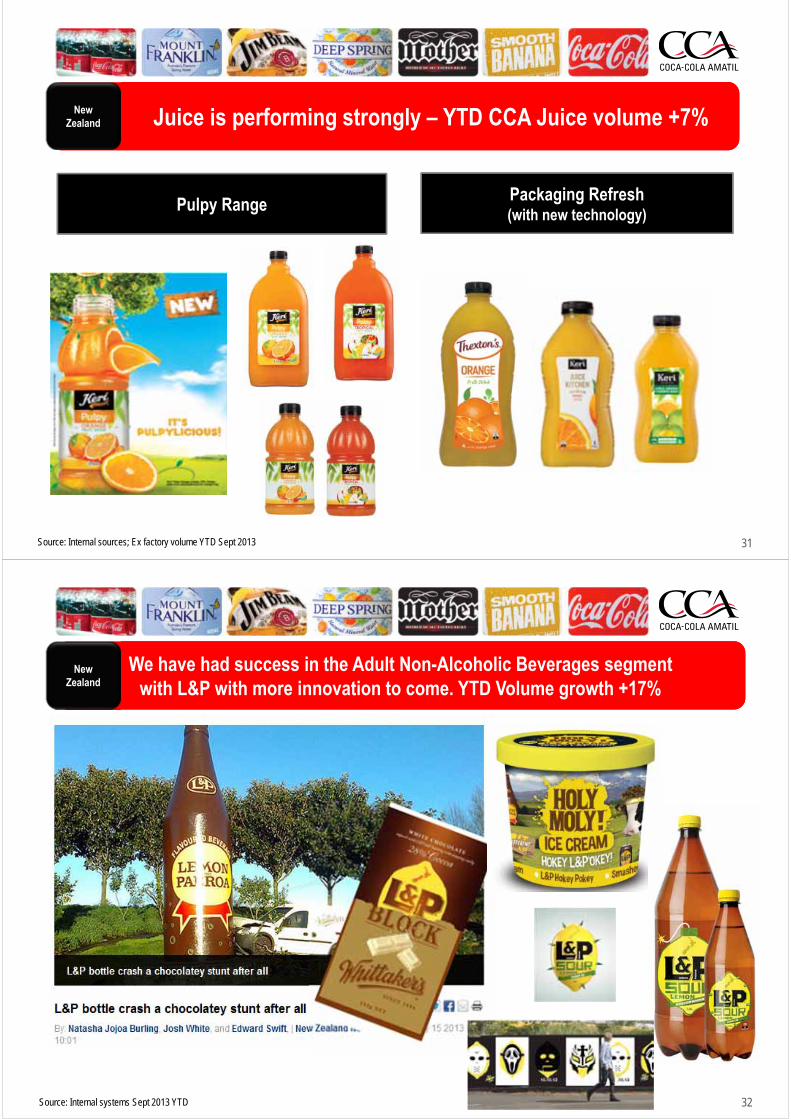
66%75%
55%
26%
70%
22% 22%
1% 0% 0% 0%
34%25%
36%
74%
30%
78% 78%
99% 100% 100% 100%
0%
10%
20%
30%
40%
50%
60%
70%
80%
90%
100%
SugarCSD
Non-Sugar CSD
FlavouredCSD
Water Sports Energy Juice Coffee Beer Cider Spirits
Volu
me
shar
e of
Gro
cery
Mar
ket
Volume Share by Category in 2012
CCA Share Competitor Share
We have significant opportunity in Energy and JuiceWe have significant opportunity in Energy and Juice
Source: Grocery Scan Data used where available . Coffee & Alcohol based on CCA Estimates
New Zealand
30
Energy continues to grow YTD CCA Energy Volume growth +11%
Energy continues to grow YTD CCA Energy Volume growth +11%
Source: Internal systems Sept 2013 YTD
New Zealand
31
Juice is performing strongly – YTD CCA Juice volume +7%Juice is performing strongly – YTD CCA Juice volume +7%
Source: Internal sources; Ex factory volume YTD Sept 2013
Packaging Refresh(with new technology)
Pulpy Range
New Zealand
32
We have had success in the Adult Non-Alcoholic Beverages segment with L&P with more innovation to come. YTD Volume growth +17%
We have had success in the Adult Non-Alcoholic Beverages segment with L&P with more innovation to come. YTD Volume growth +17%
New Zealand
Source: Internal systems Sept 2013 YTD
33
Growth Drivers in Australia and New Zealand BeveragesGrowth Drivers in Australia and New Zealand Beverages
Changing pattern of CSD consumption
Platform to grow share outside of CSDs
Customer Service & further operational efficiencies
Increasing consumption of smaller serving sizes
Continued premiumisation of Brand Coca-Cola
Growing consumption of diet and zero calorie offerings
The growth of Frozen
Investment in blow fill and aseptic technology, brewing capability and the Cascade acquisition enables us to fully target:• Dairy• Beer • Cider• Adult beverages
Leveraging superior customer service and our full beverage capability
Leveraging our significant investment in Project Zero to drive further operational efficiencies
3434
Alcoholic Beverages
35
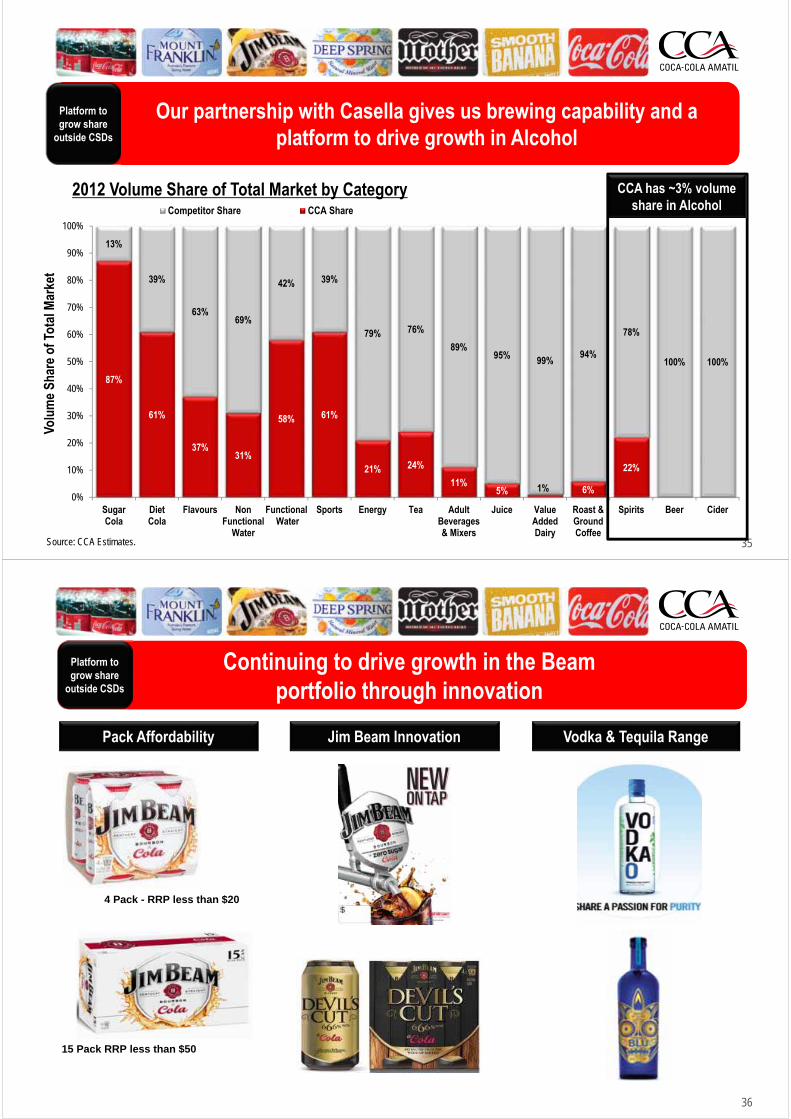
87%
61%
37%31%
58% 61%
21% 24%
11%5% 1% 6%
22%
13%
39%
63%69%
42% 39%
79% 76%
89%95% 99%
94%
78%
100% 100%
0%
10%
20%
30%
40%
50%
60%
70%
80%
90%
100%
SugarCola
DietCola
Flavours NonFunctional
Water
Functional Water
Sports Energy Tea AdultBeverages& Mixers
Juice ValueAddedDairy
Roast &GroundCoffee
Spirits Beer Cider
Volu
me
Shar
e of
Tot
al M
arke
t
2012 Volume Share of Total Market by CategoryCompetitor Share CCA Share
Our partnership with Casella gives us brewing capability and a platform to drive growth in Alcohol
Our partnership with Casella gives us brewing capability and a platform to drive growth in Alcohol
Platform to grow share
outside CSDs
CCA has ~3% volume share in Alcohol
Source: CCA Estimates.
36
Continuing to drive growth in the Beam portfolio through innovation
Continuing to drive growth in the Beam portfolio through innovation
Pack Affordability Jim Beam Innovation Vodka & Tequila Range
4 Pack - RRP less than $20
15 Pack RRP less than $50
Platform to grow share
outside CSDs
37
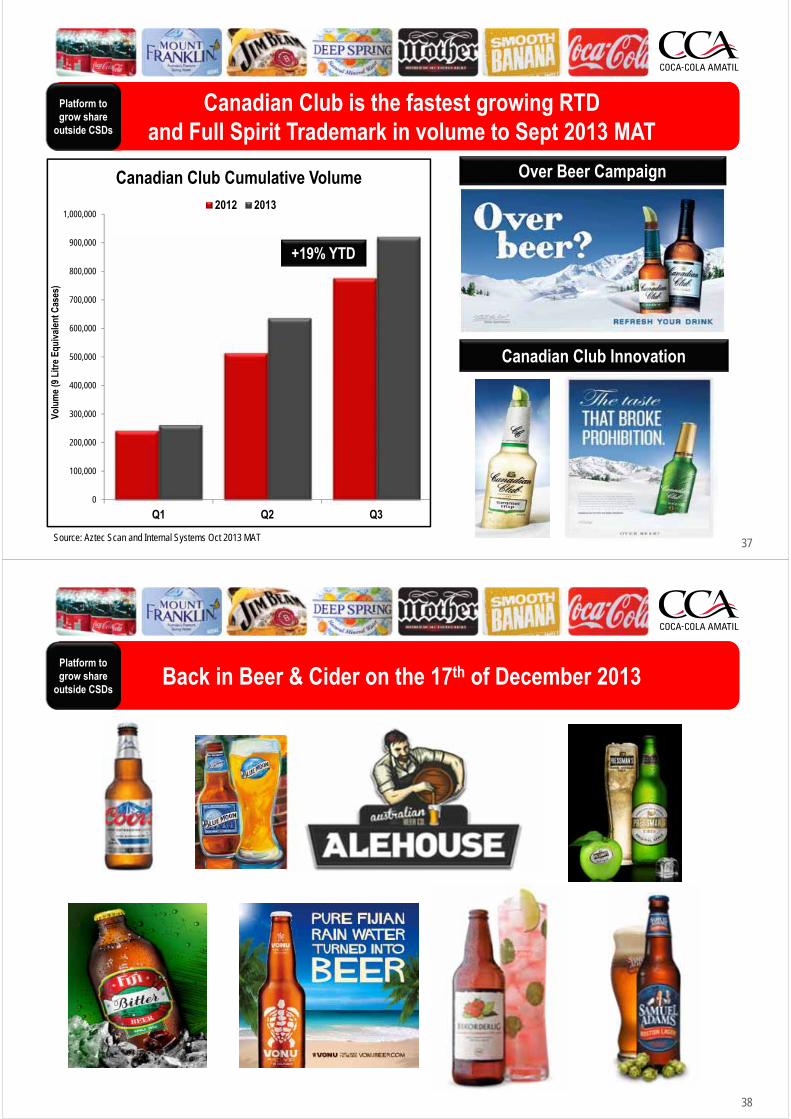
Canadian Club is the fastest growing RTD and Full Spirit Trademark in volume to Sept 2013 MAT
Canadian Club is the fastest growing RTD and Full Spirit Trademark in volume to Sept 2013 MAT
Platform to grow share
outside CSDs
Source: Aztec Scan and Internal Systems Oct 2013 MAT
0
100,000
200,000
300,000
400,000
500,000
600,000
700,000
800,000
900,000
1,000,000
Q1 Q2 Q3
Volu
me
(9 L
itre
Equi
vale
nt C
ases
)
Canadian Club Cumulative Volume2012 2013
+19% YTD
Over Beer Campaign
Canadian Club Innovation
38
Back in Beer & Cider on the 17th of December 2013Back in Beer & Cider on the 17th of December 2013Platform to grow share
outside CSDs
3939
SPC Ardmona
40
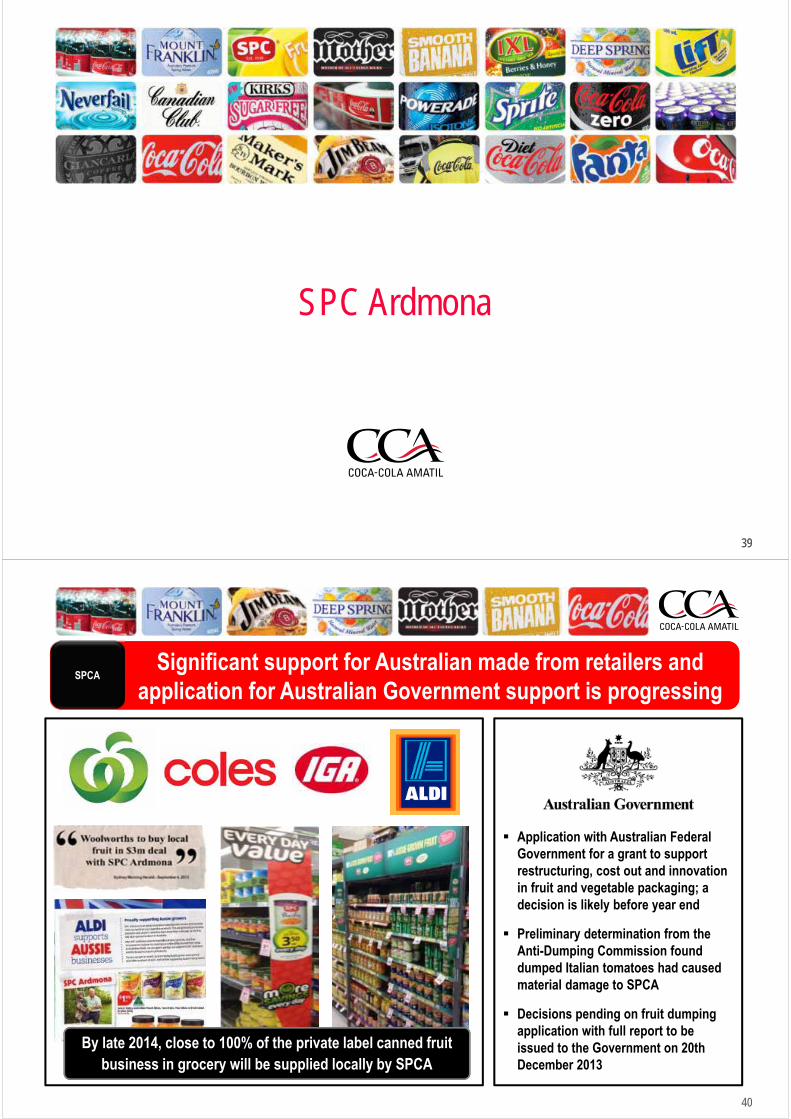
Significant support for Australian made from retailers and application for Australian Government support is progressing
Significant support for Australian made from retailers and application for Australian Government support is progressing
By late 2014, close to 100% of the private label canned fruit business in grocery will be supplied locally by SPCA
SPCA
Application with Australian Federal Government for a grant to support restructuring, cost out and innovation in fruit and vegetable packaging; a decision is likely before year end
Preliminary determination from the Anti-Dumping Commission found dumped Italian tomatoes had caused material damage to SPCA
Decisions pending on fruit dumping application with full report to be issued to the Government on 20th December 2013
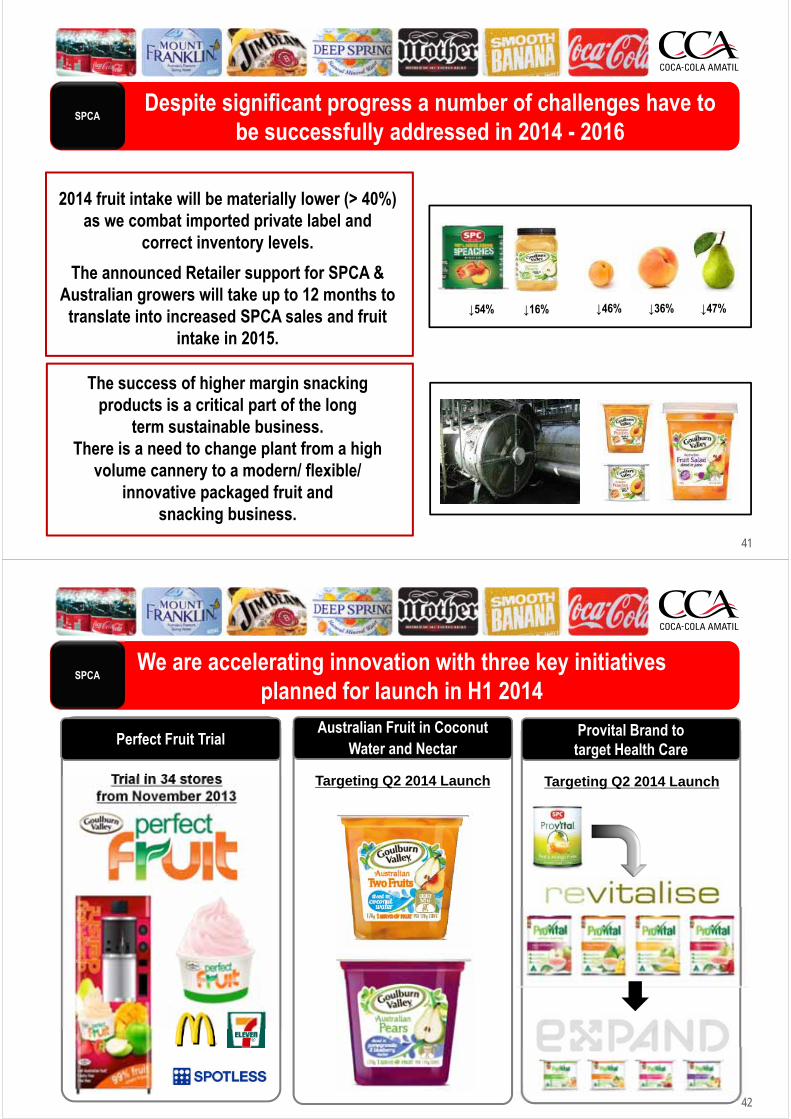
41
Despite significant progress a number of challenges have to be successfully addressed in 2014 - 2016
Despite significant progress a number of challenges have to be successfully addressed in 2014 - 2016
SPCA
2014 fruit intake will be materially lower (> 40%) as we combat imported private label and
correct inventory levels.
The announced Retailer support for SPCA & Australian growers will take up to 12 months to
translate into increased SPCA sales and fruit intake in 2015.
The success of higher margin snacking products is a critical part of the long
term sustainable business. There is a need to change plant from a high
volume cannery to a modern/ flexible/ innovative packaged fruit and
snacking business.
↓54% ↓16% ↓46% ↓36% ↓47%
42
We are accelerating innovation with three key initiatives planned for launch in H1 2014
We are accelerating innovation with three key initiatives planned for launch in H1 2014
42
Australian Fruit in CoconutWater and Nectar
Provital Brand to target Health Care
Perfect Fruit Trial
Targeting Q2 2014 Launch Targeting Q2 2014 LaunchTrial in 34 stores from November 2013
SPCA
4343
DisclaimerCCA advises that these presentation slides contain forward looking statements which may be subject to significant uncertainties outside of CCA’s control.
No representation is made as to the accuracy or reliability of forward looking statements or the assumptions on which they are based.
Actual future events may vary from these forward looking statements and you are cautioned not to place undue reliance on any forward looking statement.
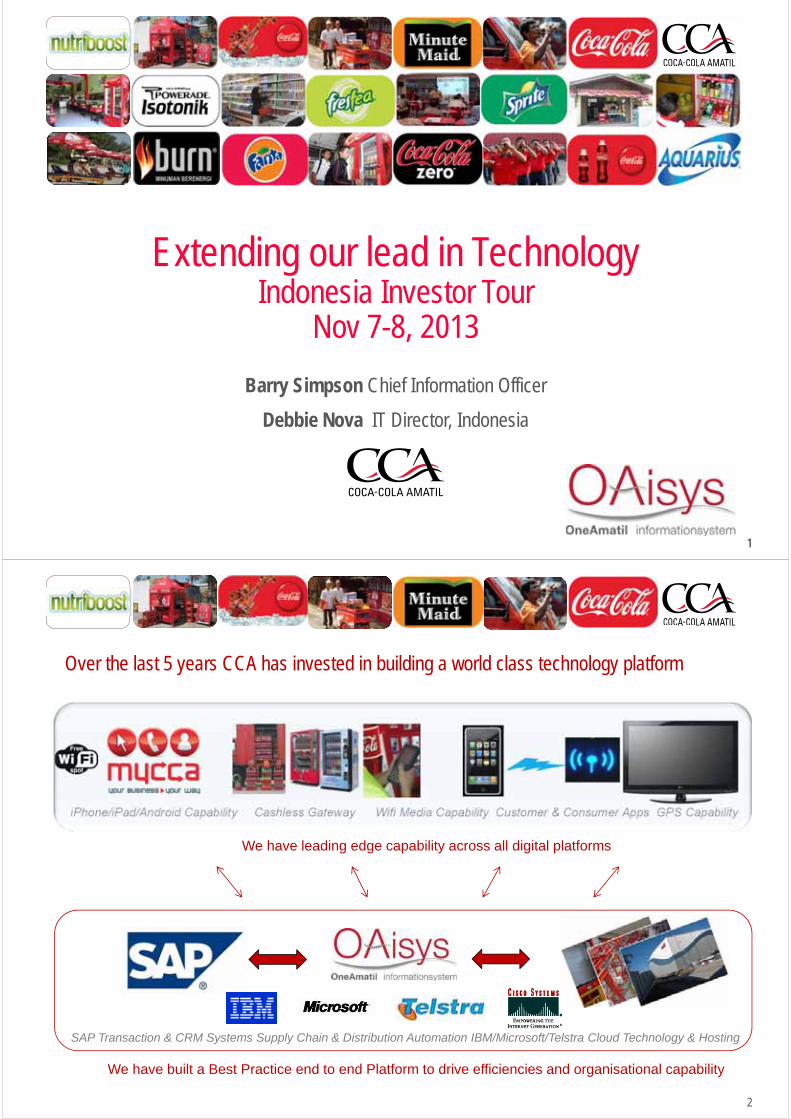
11
Barry Simpson Chief Information Officer
Extending our lead in TechnologyIndonesia Investor Tour
Nov 7-8, 2013
Debbie Nova IT Director, Indonesia
2
Over the last 5 years CCA has invested in building a world class technology platform
We have built a Best Practice end to end Platform to drive efficiencies and organisational capability
SAP Transaction & CRM Systems Supply Chain & Distribution Automation IBM/Microsoft/Telstra Cloud Technology & Hosting
iPhone/iPad/Android Capability Cashless Gateway Wifi Media Capability Customer & Consumer Apps GPS Capability
We have leading edge capability across all digital platforms
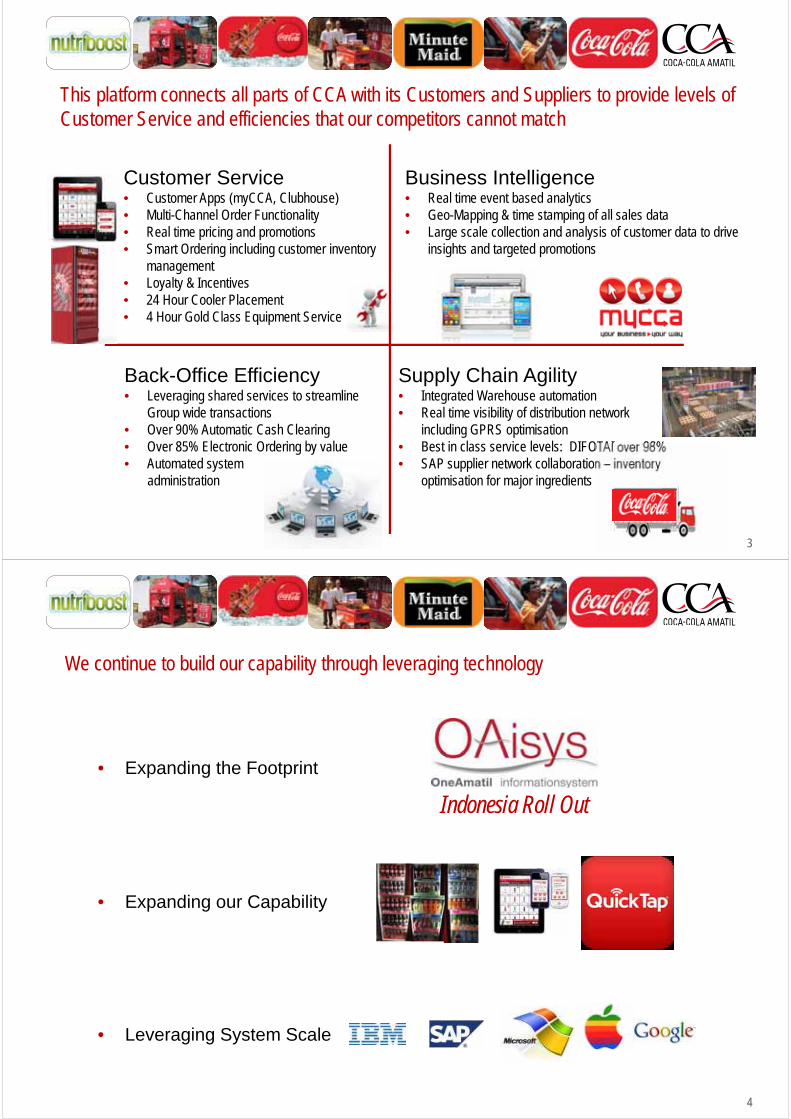
3
Customer Service• Customer Apps (myCCA, Clubhouse)• Multi-Channel Order Functionality• Real time pricing and promotions• Smart Ordering including customer inventory
management• Loyalty & Incentives• 24 Hour Cooler Placement• 4 Hour Gold Class Equipment Service
Business Intelligence• Real time event based analytics• Geo-Mapping & time stamping of all sales data• Large scale collection and analysis of customer data to drive
insights and targeted promotions
This platform connects all parts of CCA with its Customers and Suppliers to provide levels of Customer Service and efficiencies that our competitors cannot match
Supply Chain Agility• Integrated Warehouse automation• Real time visibility of distribution network
including GPRS optimisation• Best in class service levels: DIFOTAI over 98% • SAP supplier network collaboration – inventory
optimisation for major ingredients
Back-Office Efficiency• Leveraging shared services to streamline
Group wide transactions • Over 90% Automatic Cash Clearing• Over 85% Electronic Ordering by value• Automated system
administration
4
We continue to build our capability through leveraging technology
• Expanding the Footprint
• Expanding our Capability
• Leveraging System Scale
Indonesia Roll Out
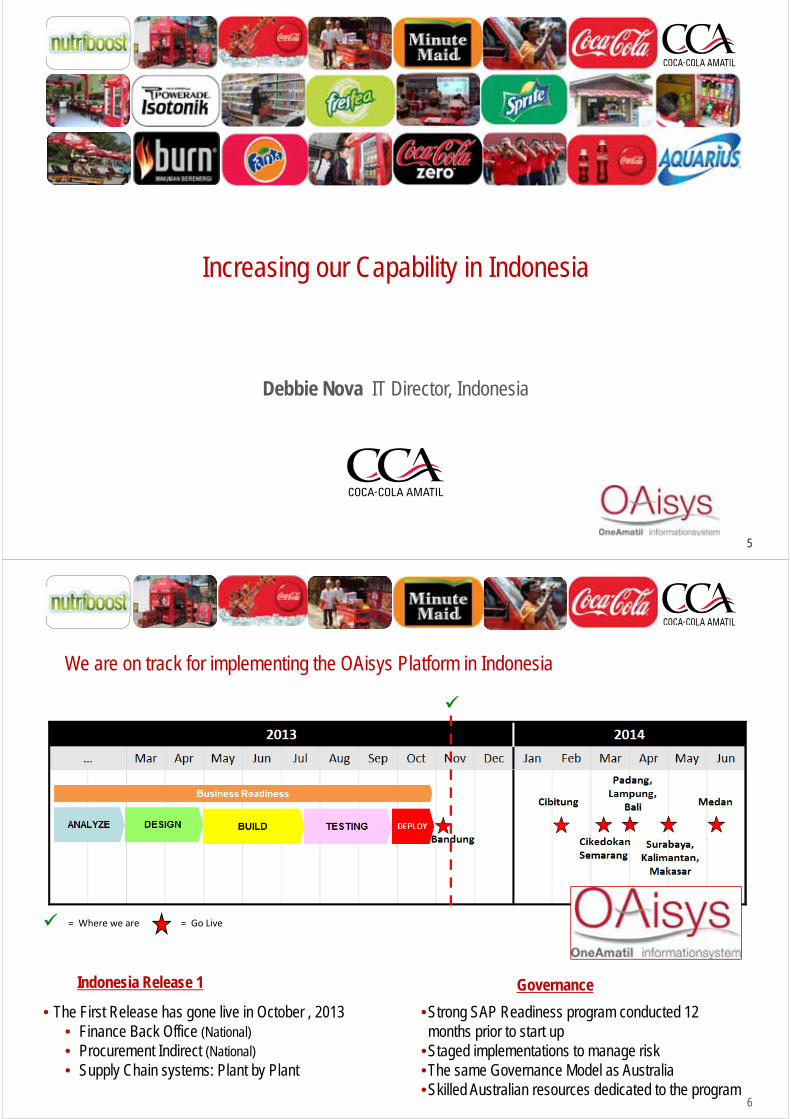
55
Debbie Nova IT Director, Indonesia
Increasing our Capability in Indonesia
6
We are on track for implementing the OAisys Platform in Indonesia
= Where we are = Go Live
• The First Release has gone live in October , 2013• Finance Back Office (National)• Procurement Indirect (National)• Supply Chain systems: Plant by Plant
Indonesia Release 1 Governance
•Strong SAP Readiness program conducted 12 months prior to start up
•Staged implementations to manage risk•The same Governance Model as Australia•Skilled Australian resources dedicated to the program
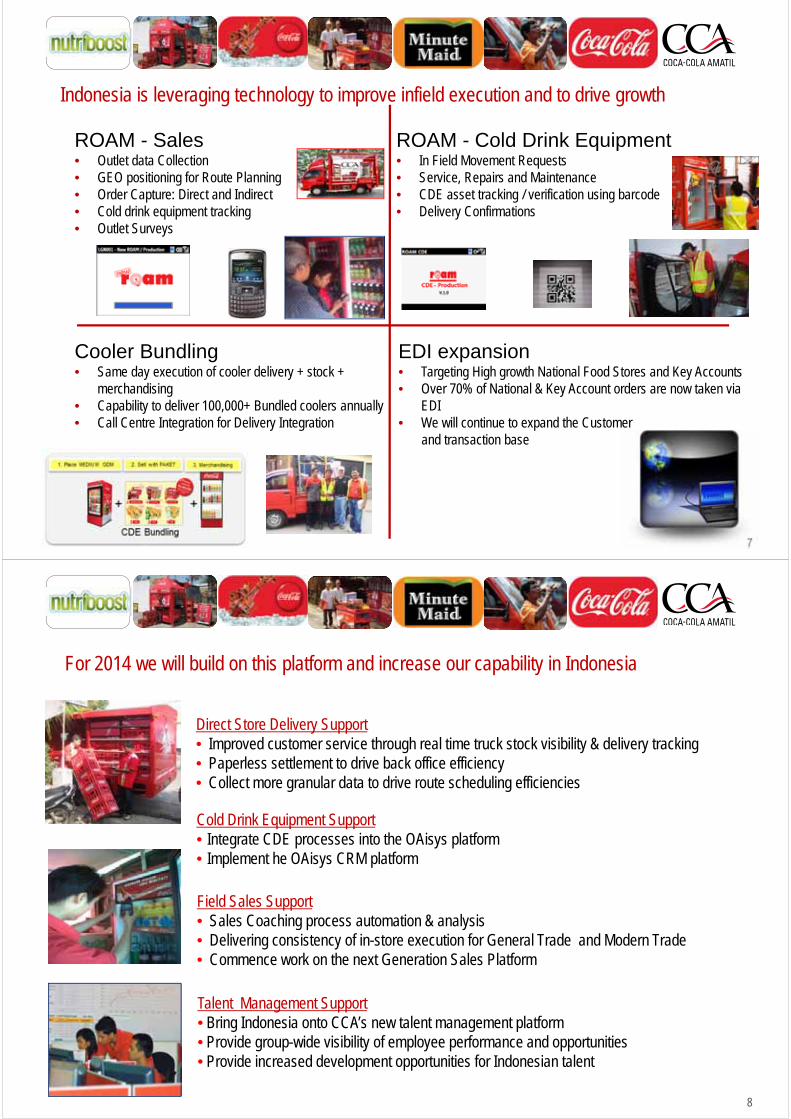
7
ROAM - Sales• Outlet data Collection• GEO positioning for Route Planning• Order Capture: Direct and Indirect• Cold drink equipment tracking• Outlet Surveys
ROAM - Cold Drink Equipment• In Field Movement Requests• Service, Repairs and Maintenance• CDE asset tracking / verification using barcode• Delivery Confirmations
Indonesia is leveraging technology to improve infield execution and to drive growth
EDI expansion• Targeting High growth National Food Stores and Key Accounts• Over 70% of National & Key Account orders are now taken via
EDI• We will continue to expand the Customer
and transaction base
Cooler Bundling• Same day execution of cooler delivery + stock +
merchandising• Capability to deliver 100,000+ Bundled coolers annually• Call Centre Integration for Delivery Integration
8
For 2014 we will build on this platform and increase our capability in Indonesia
Cold Drink Equipment Support• Integrate CDE processes into the OAisys platform• Implement he OAisys CRM platform
Field Sales Support• Sales Coaching process automation & analysis• Delivering consistency of in-store execution for General Trade and Modern Trade• Commence work on the next Generation Sales Platform
Direct Store Delivery Support• Improved customer service through real time truck stock visibility & delivery tracking• Paperless settlement to drive back office efficiency • Collect more granular data to drive route scheduling efficiencies
Talent Management Support• Bring Indonesia onto CCA’s new talent management platform• Provide group-wide visibility of employee performance and opportunities• Provide increased development opportunities for Indonesian talent
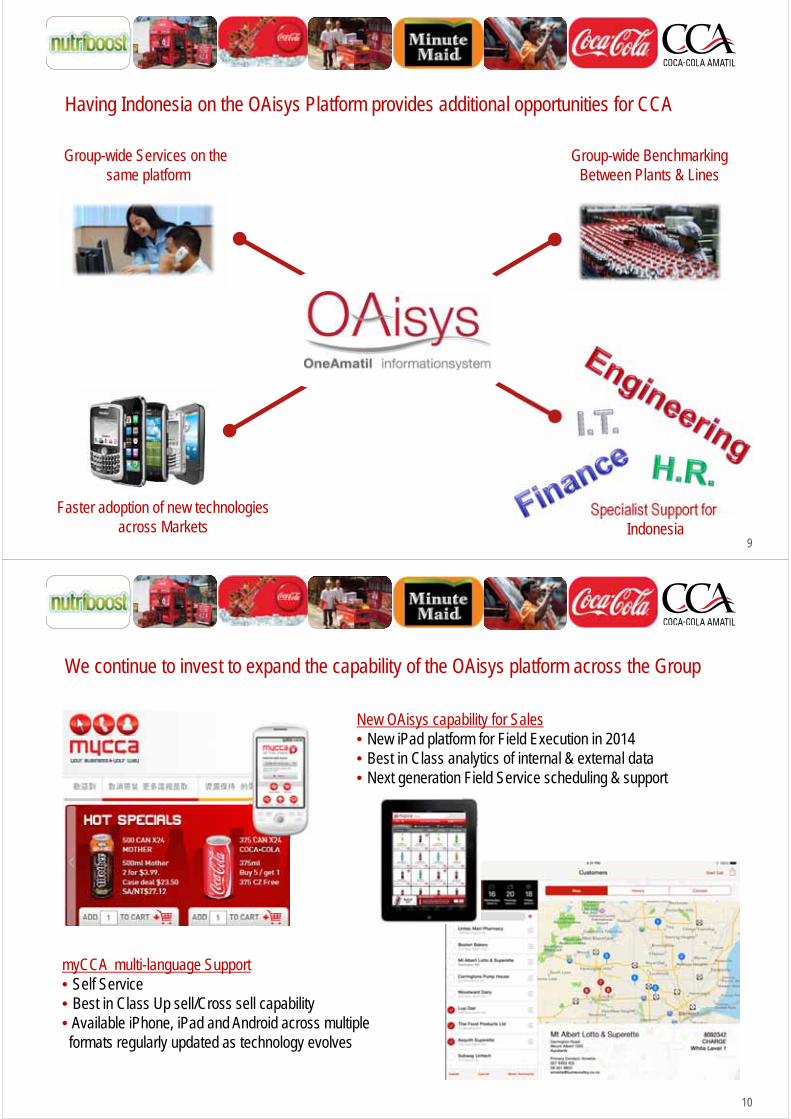
9
Having Indonesia on the OAisys Platform provides additional opportunities for CCA
Specialist Support for Indonesia
Faster adoption of new technologiesacross Markets
Group-wide Services on the same platform
Group-wide BenchmarkingBetween Plants & Lines
10
We continue to invest to expand the capability of the OAisys platform across the Group
myCCA multi-language Support• Self Service• Best in Class Up sell/Cross sell capability• Available iPhone, iPad and Android across multiple formats regularly updated as technology evolves
New OAisys capability for Sales• New iPad platform for Field Execution in 2014• Best in Class analytics of internal & external data• Next generation Field Service scheduling & support
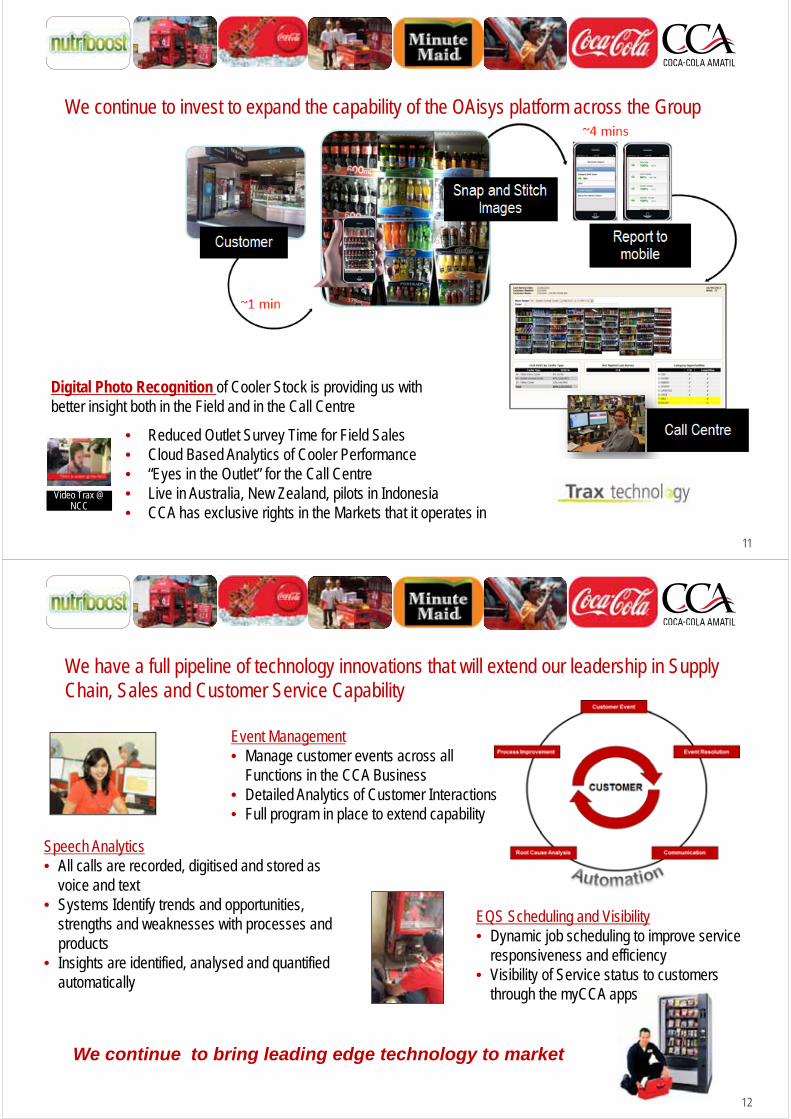
11
Video Trax @ NCC
Digital Photo Recognition of Cooler Stock is providing us with better insight both in the Field and in the Call Centre
We continue to invest to expand the capability of the OAisys platform across the Group
• Reduced Outlet Survey Time for Field Sales• Cloud Based Analytics of Cooler Performance• “Eyes in the Outlet” for the Call Centre• Live in Australia, New Zealand, pilots in Indonesia• CCA has exclusive rights in the Markets that it operates in
12
We have a full pipeline of technology innovations that will extend our leadership in Supply Chain, Sales and Customer Service Capability
Speech Analytics• All calls are recorded, digitised and stored as
voice and text • Systems Identify trends and opportunities,
strengths and weaknesses with processes and products
• Insights are identified, analysed and quantified automatically
Event Management• Manage customer events across all
Functions in the CCA Business• Detailed Analytics of Customer Interactions• Full program in place to extend capability
We continue to bring leading edge technology to market
EQS Scheduling and Visibility• Dynamic job scheduling to improve service
responsiveness and efficiency• Visibility of Service status to customers
through the myCCA apps
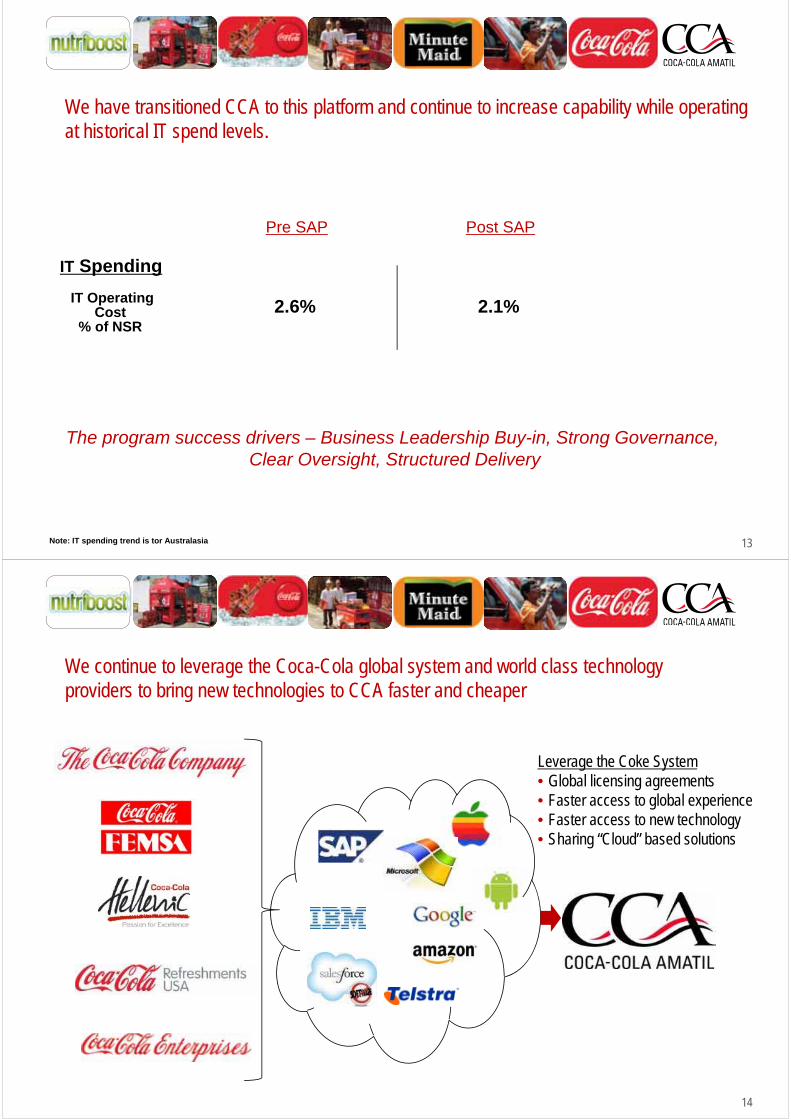
13
We have transitioned CCA to this platform and continue to increase capability while operating at historical IT spend levels.
IT Operating Cost
% of NSR
Note: IT spending trend is tor Australasia
2.6%
IT Spending
The program success drivers – Business Leadership Buy-in, Strong Governance, Clear Oversight, Structured Delivery
Pre SAP Post SAP
2.1%
14
We continue to leverage the Coca-Cola global system and world class technology providers to bring new technologies to CCA faster and cheaper
Leverage the Coke System• Global licensing agreements• Faster access to global experience• Faster access to new technology• Sharing “Cloud” based solutions
1515
DisclaimerCCA advises that these presentation slides contain forward looking statements which may be subject to significant uncertainties outside of CCA’s control.
No representation is made as to the accuracy or reliability of forward looking statements or the assumptions on which they are based.
Actual future events may vary from these forward looking statements and you are cautioned not to place undue reliance on any forward looking statement.