Embed Size (px)
DESCRIPTION
Tripadvisors
Citation preview

(NASDAQ: TRIP) Investor Presentation
Q3 2013

2
Safe Harbor Statement Forward-Looking Statements. Our presentation today, including the slides contained herein, contains "forward-looking statements" within the meaning of the Private Securities Litigation Reform Act of 1995. These statements are not historical facts or guarantees of future performance and are based on management's assumptions and expectations, which are inherently subject to difficult to predict uncertainties, risks and changes in circumstances. The use of words such as "intends,” “expects,” “may,” “believes,” “should,” “seeks,” “intends,” “plans,” “potential,” “will,” “projects,” “estimates,” “anticipates” or similar expressions generally identify forward-looking statements. However, these words are not the exclusive means of identifying such statements, and any statements that refer to expectations, beliefs, plans, predictions, projections, forecasts, objectives, assumptions, models, illustrations, profiles or other characterizations of future events or circumstances are forward-looking statements, including without limitation statements relating to future revenues, expenses, margins, performance, profitability, cash flows, net income/(loss), earnings per share, growth rates and other measures of results of operations (such as, among others, EBITDA or adjusted EBITDA) and future growth prospects for TripAdvisor’s business. Actual results and the timing and outcome of events may differ materially from those expressed or implied in the forward-looking statements for a variety of reasons, including, among others, those discussed in the “Risk Factors” section of the registration statement on Form S-4 (File No. 333-175828-1), which included a proxy statement for Expedia, Inc. (“Expedia”) and prospectus for Expedia and TripAdvisor (the “Prospectus/Proxy Statement”). Except as required by law, we undertake no obligation to update any forward-looking or other statements in this presentation, whether as a result of new information, future events or otherwise. Investors are cautioned not to place undue reliance on forward-looking statements. Non-GAAP Measures. This presentation also includes discussion of both GAAP and non-GAAP financial measures. Important information regarding TripAdvisor’s definition and use of these measures, as we as reconciliations of the non-GAAP financial measure to the most directly comparable GAAP financial measure are included in the press release reporting our fourth quarter 2012 financial results, which is available on the Investor Relations section of our website: www.tripadvisor.com. These non-GAAP measures are intended to supplement, not substitute for, GAAP comparable measures. Investors are urged to consider carefully the comparable GAAP measures and reconciliations. Industry / Market Data. Industry and market data used in this presentation have been obtained from industry publications and sources as well as from research reports prepared for other purposes. We have not independently verified the data obtained from these sources and cannot assure you of the data’s accuracy or completeness.

3
Our Mission

4
Business Overview

5
Headquartered in Newton, MA
34 countries; 21 languages
758K+ hotels & accommodation pages
1.7M restaurant & 335K attraction pages
Valuable lead source to OTAs & hoteliers
260M+ unique monthly visitors*
57M+ registered emailable members
125M+ user-generated reviews & opinions
80+ traveler contributions per minute
*Google Analytics, worldwide data, average monthly unique users during Q3 2013
$-
$200
$400
$600
$800
$1,000
FY09 FY10 FY11 FY12 YTD13
(Millions)
$-
$100
$200
$300
$400
FY09 FY10 FY11 FY12 YTD13
(Millions)
We are the World’s Largest Travel Website
Key Facts
Travel Community Stats
Revenues
Adjusted EBITDA

6
Global Scale and Robust Travel Platform
Key objectives: amplify brand and grow traffic through: Brand marketing (Content
Syndication, CRM, Offline)
Direct navigation
Organic search (SEO)
Paid search (SEM)
Partners / Referrals 4 new points-of-sale in Q3: Chile
Columbia
Peru
Venezuela
34 Points of
Sale
21 Different
Languages
75% International
Traffic

7
Valuable User-Generated Content
Help travelers around the world plan and have
the perfect trip
Conrad Maldives Rangali Island

8
Driving Powerful Network Effects
Content drives audience
Audience drives leads
Community drives content
Research
Community
On the trip
9
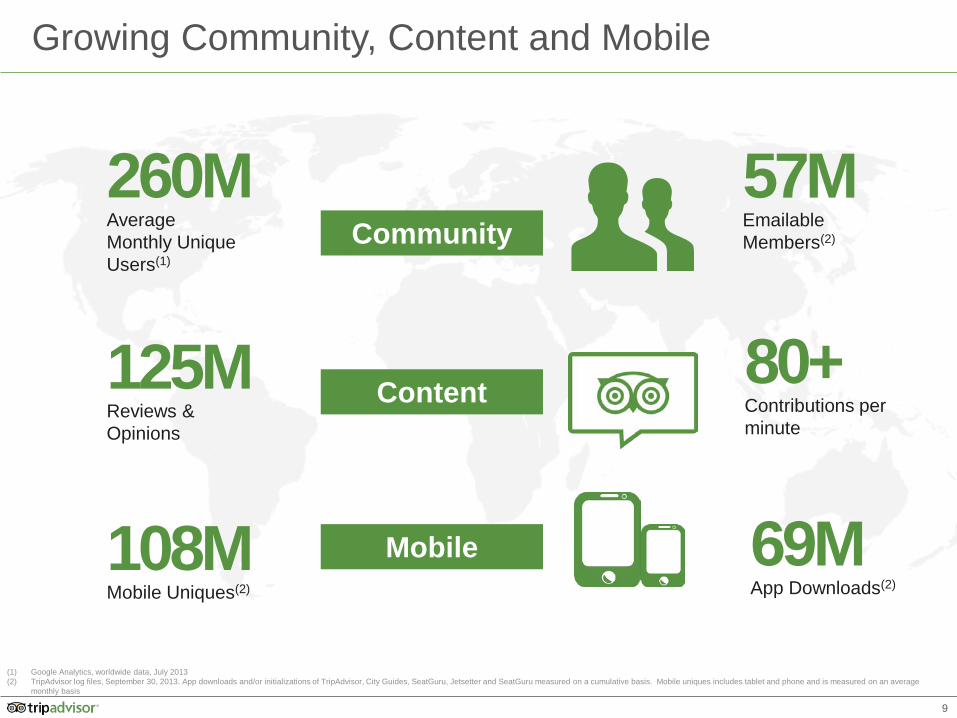
Growing Community, Content and Mobile
69M App Downloads(2)
260M Average Monthly Unique Users(1)
57M Emailable Members(2)
(1) Google Analytics, worldwide data, July 2013 (2) TripAdvisor log files, September 30, 2013. App downloads and/or initializations of TripAdvisor, City Guides, SeatGuru, Jetsetter and SeatGuru measured on a cumulative basis. Mobile uniques includes tablet and phone and is measured on an average
monthly basis
125M Reviews & Opinions
Community
Content
Mobile 108M Mobile Uniques(2)
80+ Contributions per minute
10
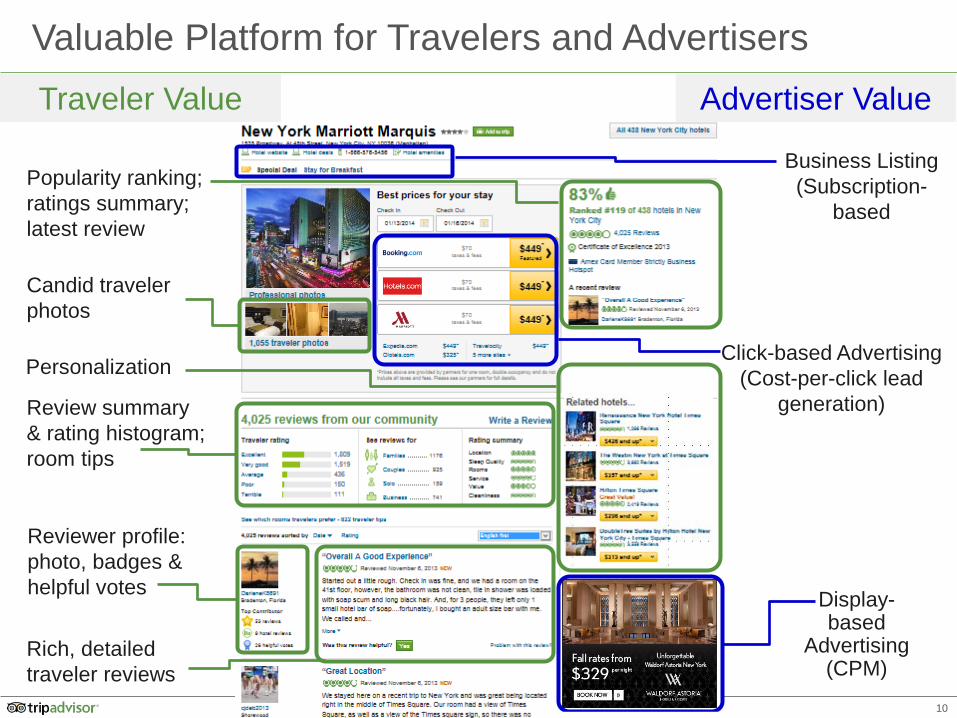
Advertiser Value Traveler Value
Valuable Platform for Travelers and Advertisers
Candid traveler photos
Review summary & rating histogram; room tips
Rich, detailed traveler reviews
Business Listing (Subscription-
based
Display-based
Advertising (CPM)
Click-based Advertising (Cost-per-click lead
generation)
Reviewer profile: photo, badges & helpful votes
Personalization
Popularity ranking; ratings summary; latest review
11
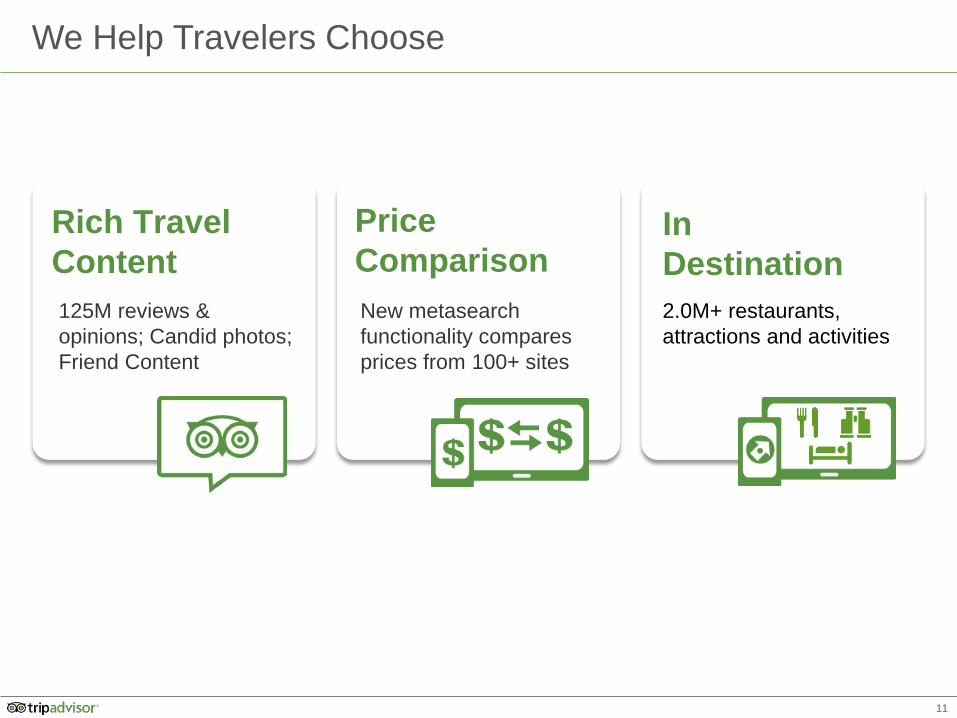
We Help Travelers Choose
Price Comparison New metasearch functionality compares prices from 100+ sites
Rich Travel Content 125M reviews & opinions; Candid photos; Friend Content
In Destination 2.0M+ restaurants, attractions and activities

12
We Help Clients Prosper
Audience Rich, fresh content on 2.7M+ businesses drives 260M+ UVs per month1
Leads Large source of qualified shoppers looking for flights, accommodations, restaurants & attractions
Profit CPC, Display and subscription /transaction opportunities drive profitable bookings
$ $
$ $

13
Key Operating Priorities – “Speed Wins”
Talent Attract, build and retain
a world class team
Technology Build flexible, scalable
architecture
Product Develop products
travelers love
Monetization Scale and optimize
profitable business lines for the long-term

14
Mobile

15
Mobile is a Powerful, Fast-growing, Platform Extension
21 Languages
69M App
Downloads
108M Monthly Uniques1
~40% % of Total
Traffic2
1 Average monthly unique users on mobile devices for Q3 2013, according to TripAdvisor log files 2 Includes tablet and smartphone traffic

16
New! Tablet App Refresh
More touch-friendly, immersive user experience
Larger photos
Hotel Price Comparison woven into research experience

17
Hotel and Flight Price Comparison
New! Native Apps on iOS and Android
Point-me-there; Near Me Now
Friend content via social tie-in with Facebook
Increased speed and functionality
2.0M Restaurant and attractions pages

18
Other Key Areas of Investment
• $85B vacation rental market in 2010 and growing(1); Highly fragmented and inefficient market
• We have a massive audience researching accommodations
• Subscription or Transaction-based listings gives flexibility for owners; 400K+ property listings and growing
• Online payment capability
• 758K+ hotels & accommodations in our database looking to access our global travel audience
• Enhanced exposure through special offers, announcements and mobile upgrade
• New TripConnect platform allows independents to bid and send automated post-stay review solicitation emails
Business Listings Vacation Rentals International / China
(1) Radius Global Market Research, Market Sizing Study, Nov 2011 (2) Boston Consulting Group, The Internet’s New Billion: Digital Consumers in Brazil, Russia, India, China and Indonesia, Sept 2010
• World’s 2nd largest economy after the US
• Online travel market growing 30% per year
• Expect >650M internet users by 2015 – still less than 50% penetration (2)
• Fast mobile adoption & attractive social component; no winners yet
• Widely varied travel pricing
TripConnect

19
Acquisitions-to-date
Acquisition Date Purpose
TinyPost March 2013 Social, Mobile
Jetsetter April 2013 Flash Sale, Mobile
CruiseWise May 2013 Cruise
Niumba May 2013 Vacation Rentals, International
GateGuru June 2013 Flights, Mobile
Oyster October 2013 Photos

20
Financial Overview

21
$-
$50
$100
$150
$200
$250
$300
$350
$400
2010 2011 2012 3Q12YTD
3Q13YTD
$-
$100
$200
$300
$400
$500
$600
$700
$800
$900
2010 2011 2012 3Q12YTD
3Q13YTD
Financial Overview: Track Record of Profitable Growth
(1) Reflects TripAdvisor Holdings, LLC Combined Statement of Operations as disclosed in Annex E of Amendment No. 4 to Expedia, Inc. Form S-4 filed November 1, 2011 with the SEC. Revenue includes intercompany revenues from Expedia, Inc. (2) Adjusted EBITDA is defined as Operating Income attributed to TripAdvisor Holdings, LLC plus: (1) depreciation of property and equipment, including internal use software and website development; (2) amortization of intangible assets; (3) stock-based compensation; and (4) non-recurring expenses related to the spin-off
Revenue(1) ($M) Adjusted EBITDA(2) ($M)
Adj. EBITDA Margin 54% 51% 46% 49% 45%
YoY growth 38% 31% 20% 19% 23%

22
Display 13%
Display 12%
Subscription Transaction / Other
13% Display 12%
Steady Revenue Diversification
Subscription Transaction / Other
8%
2011
Note: includes related-party revenue from Expedia. Reflects segment data as disclosed in the Expedia, Inc. Form S-4 filed November 1, 2011 as well as TripAdvisor’s quarterly filings with the SEC .
Subscription Transaction / Other
11%
2012 Revenue by product
Revenue by geography
3Q13 YTD
US 55% US 51%
Click-based 79%
Click-based 77%
$637M $763M $732M
Click-based 75%
$732M $763M $637M
North America
53%
North America
54%
North America
57%
LATAM 4%
LATAM 4%
LATAM 2% APAC
12% APAC 11%
APAC 7%
EMEA 31%
EMEA 34%
EMEA 32%
23
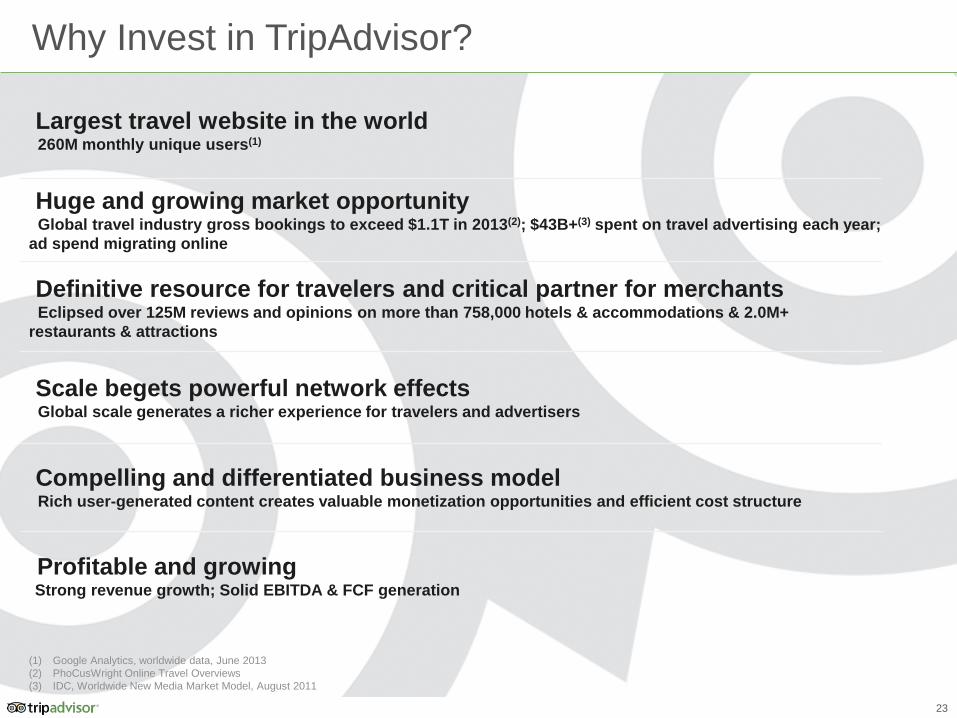
Why Invest in TripAdvisor?
Largest travel website in the world 260M monthly unique users(1)
Huge and growing market opportunity Global travel industry gross bookings to exceed $1.1T in 2013(2); $43B+(3) spent on travel advertising each year; ad spend migrating online
Definitive resource for travelers and critical partner for merchants Eclipsed over 125M reviews and opinions on more than 758,000 hotels & accommodations & 2.0M+ restaurants & attractions
Scale begets powerful network effects Global scale generates a richer experience for travelers and advertisers
Compelling and differentiated business model Rich user-generated content creates valuable monetization opportunities and efficient cost structure
(1) Google Analytics, worldwide data, June 2013 (2) PhoCusWright Online Travel Overviews (3) IDC, Worldwide New Media Market Model, August 2011
Profitable and growing Strong revenue growth; Solid EBITDA & FCF generation

24
Thank You

25
Non-GAAP Reconciliations
(in thousands) FY 2008 FY 2009 FY 2010 FY 2011 Q1 Q2 Q3 Q4 FY 2012 Q1 Q2 Q3 9 mos. 2013
Adjusted EBITDA and OIBA ReconciliationAdjusted EBITDA (1) 146,626$ 197,219$ 260,963$ 322,918$ 84,189$ 96,921$ 107,059$ 64,305$ 352,474$ 109,347$ 112,832$ 104,422$ 326,601$ Depreciation (2) 5,022 9,330 12,871 18,362 4,281 4,715 5,037 5,933 19,966$ 6,324 6,876 7,634 20,834 OIBA (3) 141,604$ 187,889$ 248,092$ 304,556$ 79,908$ 92,206$ 102,022$ 58,372$ 332,508$ 103,023$ 105,956$ 96,788$ 305,767$ Amortization of intangible assets 11,161 13,806 14,609 7,523 1,839 1,760 1,310 1,201 6,110$ 1,109 1,630 1,443 4,182 Stock-based compensation 5,560 5,905 7,183 17,344 4,692 6,768 8,463 10,179 30,102$ 13,611 10,208 11,651 35,470 Spin-off costs - - - 6,932 - - - - - - - - -
GAAP Operating Income 124,883$ 168,178$ 226,300$ 272,757$ 73,377$ 83,678$ 92,249$ 46,992$ 296,296$ 88,303$ 94,118$ 83,694$ 266,115$
Other interest income (expense), net (4,035) (978) (241) 391 (2,932) (2,405) (2,806) (2,728) (10,871) (2,406) (2,066) (2,087) (6,559) Other, net (1,738) (660) (1,644) (1,254) 696 (4,539) 1,367 (974) (3,450) (1,461) (2,150) 2,016 (1,595) Income before income taxes 119,110 166,540 224,415 271,894 71,141 76,734 90,810 43,290 281,975 84,436 89,902 83,623 257,961 Provision for income taxes 46,788 64,325 85,461 94,103 22,970 23,569 31,275 9,573 87,387 22,137 22,914 27,741 72,792 GAAP Net income 72,322 102,215 138,954 177,791 48,171 53,165 59,535 33,717 194,588 62,299 66,988 55,882 185,169 GAAP Net (income) loss attributable to noncontrolling interest 49 212 (178) (114) (60) (146) (175) (138) (519) - - - GAAP Net income attributable to TripAdvisor, Inc. 72,371$ 102,427$ 138,776$ 177,677$ 48,111$ 53,019$ 59,360$ 33,579$ 194,069$ 62,299$ 66,988$ 55,882$ 185,169$
Non-GAAP Net income ReconciliationNon-GAAP Net income 82,524$ 114,525$ 152,269$ 198,461$ 52,533$ 58,928$ 65,767$ 41,311$ 218,674$ 73,074$ 75,677$ 65,277$ 214,137$ Stock-based compensation 5,560 5,905 7,183 17,344 4,692 6,768 8,463 10,179 30,102 13,611 10,208 11,651 35,470 Amortization of intangible assets 11,161$ 13,806$ 14,609$ 7,523$ 1,839$ 1,760$ 1,310$ 1,201$ 6,110$ 1,109$ 1,630$ 1,443$ 4,182$ Spin-off costs - - - 6,932 - - - - - - - - - Income tax effect of non-GAAP adjustments (4) 6,568 7,613 8,299 11,015 2,109 2,619 3,366 3,648 11,607 3,945 3,149 3,699 10,684 GAAP Net income attributable to TripAdvisor, Inc. 72,371$ 102,427$ 138,776$ 177,677$ 48,111$ 53,019$ 59,360$ 33,579$ 194,069$ 62,299$ 66,988$ 55,882$ 185,169$
Non-GAAP Share Count ReconciliationNon-GAAP Dilited Shares Outstanding (MM) 133,461 133,461 133,461 135,551 136,805 142,336 144,218 144,148 141,878 145,067 146,487 146,253 145,936Additional restricted stock units - - - 686 647 599 561 334 537 412 823 799 678GAAP Diluted Shares Outstanding (MM) 133,461 133,461 133,461 134,865 136,158 141,737 143,657 143,814 141,341 144,655 145,664 145,454 145,258
Non-GAAP Earnings Per ShareDiluted Non-GAAP EPS 1.04$ 1.04$ 1.04$ 1.46$ 0.38$ 0.41$ 0.46$ 0.29$ 1.54$ 0.50$ 0.52$ 0.45$ 1.47$
Revenue growth ex-Foreign Exchange ReconciliationNon-GAAP Revenue growth - - - - - 19% 22% 24% - 24% 25% 18% 23%Foreign exchange impact - - - - - -3% -4% -1% - 1% 0% 2% 1%GAAP Revenue growth - - - - - 16% 18% 23% - 25% 25% 20% 23%
(1) Adjusted EBITDA is defined as net income (loss) plus: (i) provision for income taxes; (ii) other (income) expense, net; (iii) depreciation of property and equipment, including internal use software and website development; (iv) amortization of intangible assets; (v) stock-based compensation; and (vi) non-recurring expenses.
(2) Includes internal use software and website development amortization.
(3) Our primary operating metric prior to the Spin-Off for evaluating operating performance was Operating Income Before Amortization (“OIBA”), as reported on our Form S-4 filed on November 1, 2011. OIBA is defined as Operating income plus: (1) amortization of intangible assets and any related impairment; (2) stock-based compensation expense; and (3) non-recurring expenses incurred to effect the Spin-Off during the year ended December 31, 2011. This operating metric is no longer being used by our management to measure operating performance and is only being shown above to illustrate the financial impact given that we have converted to a new operating metric post Spin-Off.
(4) Represents the reduction in the income tax benefit recorded for all periods presented based on our effective tax rate, adjusted for non-GAAP items.
2012 2013