Embed Size (px)
Citation preview


iii
g{|á à{xá|á |á wxw|vtàxw àÉ `ç ÑtÜxÇàá? ã|yx tÇw wtâz{àxÜ
YÉÜ à{x|Ü \ÇÇâÅxÜtuÄx ÑÜtçxÜá? xÇvÉâÜtzxÅxÇà tÇw Ñtà|xÇvx

iv
ACKNOWLEDGEMENTS
My thanks and gratitude goes first to God, for his endless blessings. Then, I would
like to thank my advisor Dr. Mohammed Baluch, for his continued attention, guidance,
and support. I greatly appreciate Dr Baluch for the invaluable time that he spent with me
during my course as well as for the thesis work. I would like to express my sincere
gratitude to Dr. M.K. Rahman, my co-advisor, for his guidance, efforts and insights
throughout the study. I greatly appreciate him for his personal involvement in all phases
of the thesis work. I also would like to thank the thesis committee members, Dr. Ali H.
Al-Gadhib, Dr. Husain J. Al-Gahtani and Dr. Maher A. Bader, for their valuable
suggestions and comments.
I am grateful to KFUPM for all the support I received during my course. I am
thankful to all my professors who helped me to have a better understanding of the subject
which made me more confident and helped me to complete the course and thesis work.
I am also grateful to Zamil Steel, my employer, for the flexibility in timings which
made it possible to complete the course as a part time student.

v
TABLE OF CONTENTS
ACKNOWLEDGEMENTS ........................................................................................... IV
TABLE OF CONTENTS ................................................................................................ V
LIST OF TABLES .......................................................................................................... XI
LIST OF FIGURES ...................................................................................................... XII
NOMENCLATURE ....................................................................................................... XV
THESIS ABSTRACT .................................................................................................. XIX
رسالة ملخص .................................................................................................................. XX
CHAPTER 1 1
INTRODUCTION............................................................................................................. 1
1.1 BACKGROUND AND NEED OF THE RESEARCH ............................................. 1
1.2 OBJECTIVES OF THE RESEARCH ....................................................................... 2
1.3 SCOPE OF THE RESEARCH .................................................................................. 3
1.4 OVERVIEW OF TYPES OF CONCRETE SLABS ................................................. 4
1.5 WAFFLE SLAB SYSTEM (TWO WAY RIBBED SLAB) ...................................... 7
1.6 STRUT-AND-TIE MODELING (STM) ................................................................. 10
1.7 ORGANIZATION OF THESIS .............................................................................. 12
1.7.1 Section 1: Literature Review ........................................................................... 12
1.7.2 Section 2: Validation of Strut-and-Tie Model Using ANSYS......................... 13
1.7.3 Section 3: Develop Software STWAF ............................................................. 13
1.7.4 Section 4: Comparison of the STM Model to Other Design Methods ............ 13
1.7.5 Section 5: Parametric Study of Waffle Slabs Using SWAF ............................ 13

vi
CHAPTER 2 LITERATURE REVIEW ..................................................................... 14
2.1 ULTIMATE STRENGTH AND EXPERIMENTAL DATA
FOR WAFFLE SLABS ........................................................................................... 14
2.2 STRENGTH AND STRESS-STRAIN RELATIONSHIPS OF
CONCRETE AND REINFORCEMENT ............................................................... 17
2.2.1 Tension Capacity of Concrete .......................................................................... 17
2.2.2 Stress-Strain Relationships of Concrete ........................................................... 17
2.2.3 Compression Strength of Softened Concrete ................................................... 18
2.2.4 Stress-Strain Relationships of Reinforcement ................................................. 19
2.3 STRUT-AND-TIE MODELING OF CONCRETE ................................................. 21
2.3.1 Bernoulli’s Hypothesis and St.Venant’s Principle........................................... 21
2.3.2 Strut-and-Tie Model for Deep Beams and Mode of Failure ............................ 22
2.3.3 Truss Analogy for Design of B-Region ........................................................... 23
2.3.4 Compression Field Theory ............................................................................... 23
2.3.5 Modified Compression Field Theory ............................................................... 24
2.3.6 Components of Strut-and-Tie Model ............................................................... 26
2.3.6.1 Struts ......................................................................................................... 26
2.3.6.2 Ties ............................................................................................................ 27
2.3.6.3 Nodes......................................................................................................... 30
2.3.7 The Strut-and-Tie Method for Analysis and Design........................................ 33
2.4 CLASSICAL METHODS FOR DESIGN OF WAFFLE SLABS ........................... 38
2.4.1 Equivalent Thickness Method .......................................................................... 38
2.4.2 Orthotropic Plate Theory ................................................................................. 39
2.4.3 ACI Approach .................................................................................................. 40
2.4.4 Numerical Methods .......................................................................................... 41
2.5 DEFICIENCIES OF CURRENT METHODS FOR DESIGN OF
WAFFLE SLABS .................................................................................................... 41
2.5.1 Equivalent Thickness Method .......................................................................... 41
2.5.2 Orthotropic Plate Theory ................................................................................. 41
2.5.3 ACI Approach .................................................................................................. 41
2.5.4 Numerical Methods .......................................................................................... 42

vii
2.6 ACI PROVISIONS FOR DESIGN OF WAFFLE SLABS...................................... 42
2.6.1 General Provisions for Waffle Slab ................................................................. 42
2.6.2 Strength of Struts, Ties and Nodal Zones ........................................................ 43
2.6.2.1 Struts ......................................................................................................... 43
2.6.2.2 Ties ............................................................................................................ 44
2.6.2.3 Nodes......................................................................................................... 44
CHAPTER 3 STRUT-AND-TIE MODEL (STM) FOR SIMPLY SUPPORTED
WAFFLE SLAB ...................................................................................... 45
3.1 DEVELOPMENT OF TRUSS MODEL FOR WAFFLE SLAB ............................. 45
3.2 PROPOSED STRUT-AND-TIE MODEL FOR WAFFLE SLAB .......................... 47
3.3 CALCULATING PROPERTIES OF MEMBERS OF THE
PROPOSED MODEL .............................................................................................. 50
3.3.1 Top Chord ........................................................................................................ 50
3.3.2 Bottom Chord................................................................................................... 51
3.3.3 Vertical Members............................................................................................. 51
3.3.4 Diagonal Members ........................................................................................... 52
3.3.5 Bracing Members ............................................................................................. 52
3.4 APPLYING LOADS TO THE PROPOSED MODEL ............................................ 53
3.5 CALCULATING STRENGTH AND STRESS RATIO OF ELEMENTS
OF THE MODEL .................................................................................................... 53
3.5.1 Top Chord ........................................................................................................ 54
3.5.2 Bottom Chord................................................................................................... 54
3.5.3 Vertical Members............................................................................................. 54
3.5.4 Diagonal Members ........................................................................................... 55
3.5.5 Bracing Members ............................................................................................. 55
3.5.6 Nodes ............................................................................................................... 56

viii
CHAPTER 4 VALIDATION OF WAFFLE SLAB STM USING ANSYS ............. 57
4.1 EXPERIMENTAL DATA USED FOR VALIDATION OF
PROPOSED MODEL .............................................................................................. 57
4.1.1 Description of Waffle Slabs Used for Experiment by
Abdulwahab and Khalil .................................................................................... 57
4.1.2 Experimental Results ....................................................................................... 58
4.2 LINEAR MODEL TO FIND ALLOWABLE SAFE LOAD AS PER ACI-318 ...... 62
4.2.1 Element Type and Material Models ................................................................. 62
4.2.2 Application of Loads ........................................................................................ 63
4.2.2.1 Self Weight ................................................................................................ 63
4.2.2.2 Concentrated Load.................................................................................... 63
4.2.3 Results of Linear Analysis Using STAAD ...................................................... 63
4.3 PREDICTING ULTIMATE LOAD CAPACITY OF SLAB USING
NONLINEAR ANSYS MODEL ............................................................................. 65
4.3.1 Material Models Used for Non-linear Truss Model ........................................ 65
4.3.1.1 Concrete Used for Top Chord Members and Bracing .............................. 65
4.3.1.2 Concrete Used for Diagonal Members ..................................................... 67
4.3.1.3 Concrete used for Vertical Tension ties .................................................... 68
4.3.1.4 Steel Used as Bottom Chord Reinforcement ............................................. 68
4.3.1.5 Efficiency Factors Used for Non Linear Model ........................................ 70
4.3.2 Element Type and Element Property ............................................................... 70
4.3.3 Application of Loads ........................................................................................ 71
4.3.4 Deflected Shape and Force Distribution .......................................................... 71
4.4 COMPARING RESULTS FROM STRUT-AND-TIE MODELS WITH TEST
RESULTS ................................................................................................................ 74
4.4.1 Strength of Slabs .............................................................................................. 74
4.4.2 Mode of Failure................................................................................................ 77
4.4.3 Time-History Post Processing -Load Deflection Curves ................................. 81
4.4.4 Time-History Post Processing -Load Distribution between Ribs .................... 85
ix
CHAPTER 5 STWAF ANALYSIS AND DESIGN TOOL FOR WAFFLE SLABS 91
5.1 INTRODUCTION .................................................................................................. 91
5.1.1 Design Methodology Used in STWAF ............................................................ 91
5.1.2 Salient Features of STWAF ............................................................................. 92
5.2 USER INPUTS IN STWAF .................................................................................... 95
5.3 GENERATION OF 3D TRUSS MODEL AND ITS ANALYSIS ........................ 101
5.4 CALCULATING MAXIMUM FORCES, STRENGTH AND
STRESS RATIO FOR EACH MEMBER TYPE ................................................... 101
5.5 DESIGN OF ELEMENTS AND NODAL ZONES OF
STRUT-AND-TIE MODEL .................................................................................. 103
5.6 DEFLECTION OF WAFFLE SLABS .................................................................. 105
5.7 EXAMPLE OF STRENGTH PREDICTION PROCESS USING
PROPOSED STM .................................................................................................. 107
5.7.1 Details of Waffle slab Used as Example ........................................................ 108
5.7.2 Trial Values Assumed for Design .................................................................. 108
5.7.3 Calculation for Geometry of the Truss .......................................................... 108
5.7.4 Calculation of Size of Elements and Nodes of the 3D Truss Model ............. 109
5.7.4.1 Bottom Chord .......................................................................................... 109
5.7.4.2 Top Chord ............................................................................................... 109
5.7.4.3 Vertical Members .................................................................................... 110
5.7.4.4 Diagonal Members.................................................................................. 110
5.7.4.5 Bracing Members .................................................................................... 111
5.7.5 Load Distribution to Nodes of Truss Model .................................................. 111
5.7.6 Generation of STAAD Input and Output Files .............................................. 111
5.7.7 Calculation of Strength and Stress Ratio of Elements and Nodes ................. 112
5.7.7.1 Bottom Chord .......................................................................................... 113
5.7.7.2 Top Chord ............................................................................................... 113
5.7.7.3 Vertical Members .................................................................................... 113
5.7.7.4 Diagonal Members.................................................................................. 113
5.7.7.5 Bracing Members .................................................................................... 114
5.7.8 Results and Prediction of Mode of Failure .................................................... 114

x
CHAPTER 6 PROPOSED STM VERSUS OTHER DESIGN METHODS FOR
WAFFLE SLABS .................................................................................. 115
6.1 DETAILS OF THE 9M * 9M SLAB USED FOR COMPARISON OF
DESIGN METHODS ............................................................................................ 115
6.2 DESIGN OF 9M * 9M WAFFLE SLAB BY STRUT-AND-TIE METHOD
USING STWAF .................................................................................................... 117
6.3 DESIGN OF 9M * 9M WAFFLE SLAB WITH SAFE PROGRAM .................... 124
6.4 DESIGN OF 9M * 9M WAFFLE SLAB BY ORTHOTROPIC
PLATE THEORY .................................................................................................. 126
6.5 COMPARISON OF MAIN REINFORCEMENT FOR
DIFFERENT METHODS ..................................................................................... 133
CHAPTER 7 PARAMETRIC STUDY OF ACI PROVISIONS FOR WAFFLE
SLABS USING STWAF ....................................................................... 134
7.1 DETAILS OF THE 10M * 10M SLAB USED FOR PARAMETRIC STUDY ..... 134
7.2 EFFECT OF RIB SPACING ................................................................................. 134
7.3 EFFECT OF RIB DEPTH ..................................................................................... 137
7.4 EFFECT OF RIB THICKNESS ............................................................................ 140
7.5 EFFECT OF EFFECTIVE COVER ...................................................................... 143
CHAPTER 8 SUMMARY, CONCLUSIONS AND RECOMMENDATIONS ...... 147
8.1 SUMMARY .......................................................................................................... 147
8.2 CONCLUSIONS ................................................................................................... 148
8.3 RECOMMENDATIONS FOR FUTURE STUDY ............................................... 150
REFERENCES .............................................................................................................. 151
VITA ................................................................................................................. 156
xi
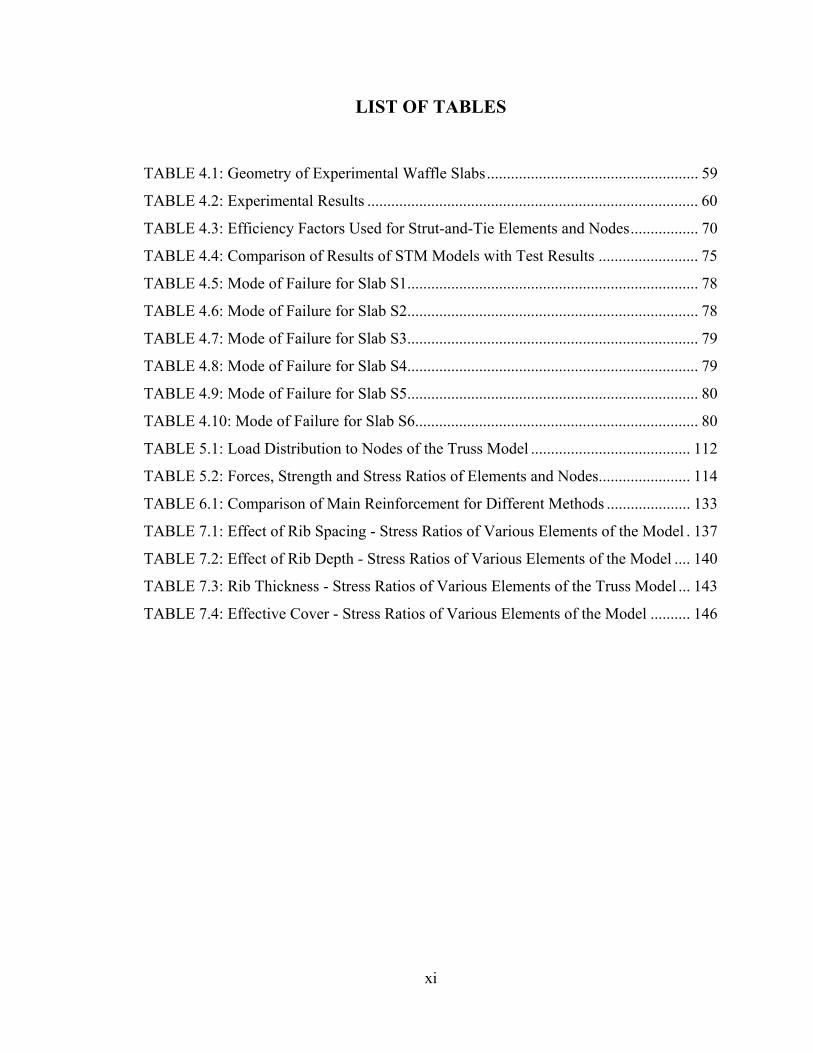
LIST OF TABLES
TABLE 4.1: Geometry of Experimental Waffle Slabs ..................................................... 59
TABLE 4.2: Experimental Results ................................................................................... 60
TABLE 4.3: Efficiency Factors Used for Strut-and-Tie Elements and Nodes ................. 70
TABLE 4.4: Comparison of Results of STM Models with Test Results ......................... 75
TABLE 4.5: Mode of Failure for Slab S1 ......................................................................... 78
TABLE 4.6: Mode of Failure for Slab S2 ......................................................................... 78
TABLE 4.7: Mode of Failure for Slab S3 ......................................................................... 79
TABLE 4.8: Mode of Failure for Slab S4 ......................................................................... 79
TABLE 4.9: Mode of Failure for Slab S5 ......................................................................... 80
TABLE 4.10: Mode of Failure for Slab S6....................................................................... 80
TABLE 5.1: Load Distribution to Nodes of the Truss Model ........................................ 112
TABLE 5.2: Forces, Strength and Stress Ratios of Elements and Nodes ....................... 114
TABLE 6.1: Comparison of Main Reinforcement for Different Methods ..................... 133
TABLE 7.1: Effect of Rib Spacing - Stress Ratios of Various Elements of the Model . 137
TABLE 7.2: Effect of Rib Depth - Stress Ratios of Various Elements of the Model .... 140
TABLE 7.3: Rib Thickness - Stress Ratios of Various Elements of the Truss Model ... 143
TABLE 7.4: Effective Cover - Stress Ratios of Various Elements of the Model .......... 146

xii
LIST OF FIGURES
Figure 1.1: Slab, Beam and Girder System......................................................................... 5
Figure 1.2: Flat Plate and Flat Slab ..................................................................................... 6
Figure 1.3: One-way Ribbed Slabs ..................................................................................... 6
Figure 1.4: Plastic Moulds for Waffle Slabs ....................................................................... 8
Figure 1.5: Waffle Slab Under Construction ...................................................................... 9
Figure 1.6: Waffle Slab After Construction ........................................................................ 9
Figure 1.7: Strut-and-Tie Model for Deep Beam .............................................................. 12
Figure 2.1: Typical Stress-Strain Curve for ASTM 615 Grade 60 steel ........................... 21
Figure 2.2: Mode of Failure of Deep Beams, (MacGregor, 1997) ................................... 22
Figure 2.3: Truss Analogy (MacGregor, 1997) ................................................................ 24
Figure 2.4: Stress-Strain Relationships for Cracked Concrete (Collins et al. 1996) ........ 26
Figure 2.5: Idealized Stress Fields in Struts: (a) Prismatic (b) Bottle-shaped
(c) Fan-shaped (Adapted from Schliach et al. 1987). ................................... 29
Figure 2.6: Typical Stress-Strain Relationship for Concrete in Uni-axial
Compression and the Idealization Used in the STM. .................................... 29
Figure 2.7: Effective Width of Tie .................................................................................... 30
Figure 2.8: Basic Node Types: a) CCC b) CCT c) CTT d) TTT ................................. 31
Figure 2.9: Examples of Shape Idealization of a Nodal Zone with Four Struts
Intersecting: a) Force Acting on the Node b) Simple Shape
c) Hydrostatic Shape d) Modified Hydrostatic Shape. .................................. 32
Figure 2.10: Effective Width of Slab (ACI-318, 2008) .................................................... 43
Figure 3.1: Test Slab – Finite Element Model .................................................................. 46
Figure 3.2: Proposed 3D strut-and-Tie Model .................................................................. 48
Figure 3.3: STM Model for Single Rib– Even and Odd Number of Waffle Openings .... 48
Figure 3.4: STM Model-Top Bracing ............................................................................... 49
Figure 3.5: Calculating Width of Strut for Diagonal Members ........................................ 53
Figure 4.1: Geometry of Waffle Slabs, Loading Arrangement, and
Reinforcement Details.................................................................................... 59
Figure 4.2: Crack Pattern for Experimental Slabs S1-S4 ................................................. 61

xiii
Figure 4.3: STAAD Model for Slab S2-Geometry ........................................................... 64
Figure 4.4: STAAD Model for Slab S2-Showing Axial Force Distribution in One Rib .. 64
Figure 4.5: Stress Strain Curve Used for Concrete in Top Chord Strut - Slab S1 ............ 67
Figure 4.6: Stress Strain Curve Used for Concrete in Diagonal Strut - Slab S1............... 68
Figure 4.7: Stress Strain Curve Used for Steel Reinforcement ........................................ 69
Figure 4.8: ANSYS Model for Slab S1-Showing Deflected Shape.................................. 72
Figure 4.9: ANSYS Model for Slab S1-Showing Force Distribution .............................. 73
Figure 4.10: Comparison of Results - STM with Test Results -Slabs S1 to S4
(Effect of Rib Spacing) ................................................................................. 76
Figure 4.11: Comparison of Results - STM with Test Results -Slabs S6, S2 and S5
(Effect of rib size) .......................................................................................... 76
Figure 4.12: Load-Deflection Curves for Slabs S1 ........................................................... 82
Figure 4.13: Load-Deflection Curves for Slabs S2 ........................................................... 82
Figure 4.14: Load-Deflection Curves for Slabs S3 ........................................................... 83
Figure 4.15: Load-Deflection Curves for Slabs S4 ........................................................... 83
Figure 4.16: Load-Deflection Curves for Slabs S5 ........................................................... 84
Figure 4.17: Load-Deflection Curves for Slabs S6 ........................................................... 84
Figure 4.18: Force in Bottom Reinforcement at Center of Ribs-Slab S1 ......................... 88
Figure 4.19: Force in Bottom Reinforcement at Center of Ribs-Slab S2 ......................... 88
Figure 4.20: Force in Bottom Reinforcement at Center of Ribs-Slab S3 ......................... 89
Figure 4.21: Force in Bottom Reinforcement at Center of Ribs-Slab S4 ......................... 89
Figure 4.22: Force in Bottom Reinforcement at Center of Ribs-Slab S5 ......................... 90
Figure 4.23: Force in Bottom Reinforcement at Center of Ribs-Slab S6 ......................... 90
Figure 5.1: Flow Chart for STWAF .................................................................................. 94
Figure 5.2: Main Window of STWAF .............................................................................. 96
Figure 5.3: General Input Window ................................................................................... 96
Figure 5.4: Input Window for Overall Size of Waffle Slab .............................................. 97
Figure 5.5: Input Window for Rib Size and Spacing ........................................................ 97
Figure 5.6: Window for Reinforcement Details and Depth of Compression Block ......... 99
Figure 5.7: Window for Load Input ................................................................................ 100
Figure 5.8: Display of Member Force for Bottom Chord in X-direction ....................... 102
xiv
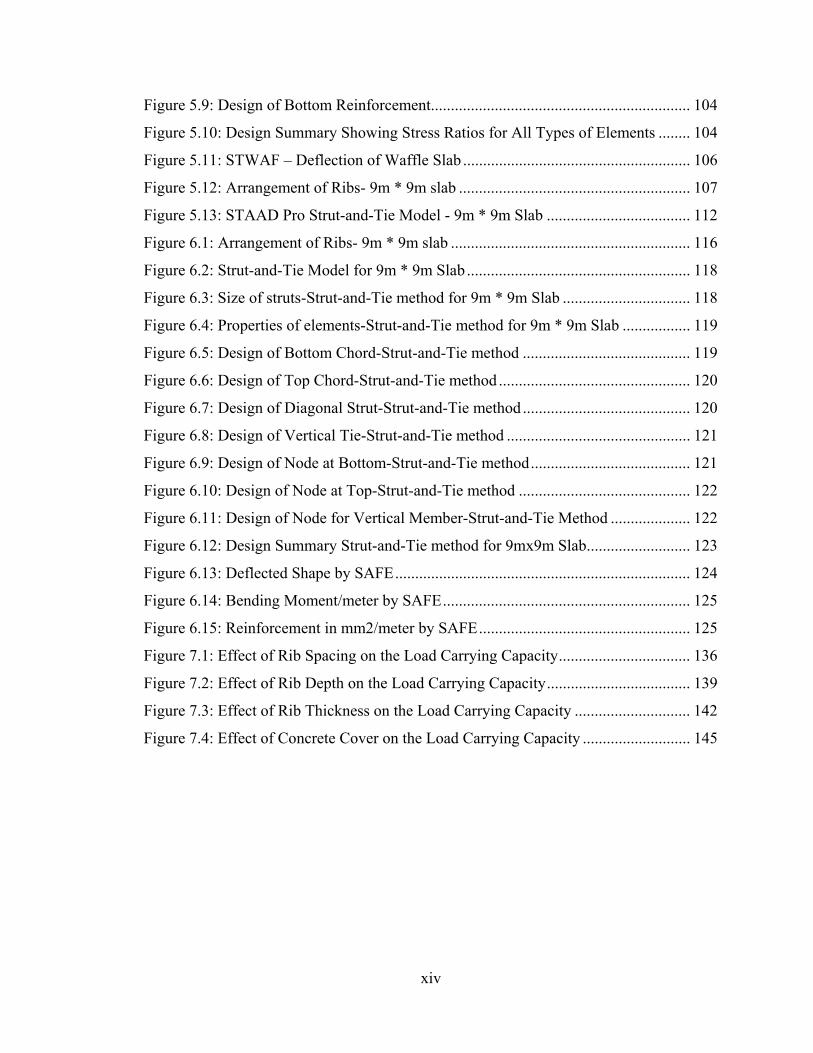
Figure 5.9: Design of Bottom Reinforcement................................................................. 104
Figure 5.10: Design Summary Showing Stress Ratios for All Types of Elements ........ 104
Figure 5.11: STWAF – Deflection of Waffle Slab ......................................................... 106
Figure 5.12: Arrangement of Ribs- 9m * 9m slab .......................................................... 107
Figure 5.13: STAAD Pro Strut-and-Tie Model - 9m * 9m Slab .................................... 112
Figure 6.1: Arrangement of Ribs- 9m * 9m slab ............................................................ 116
Figure 6.2: Strut-and-Tie Model for 9m * 9m Slab ........................................................ 118
Figure 6.3: Size of struts-Strut-and-Tie method for 9m * 9m Slab ................................ 118
Figure 6.4: Properties of elements-Strut-and-Tie method for 9m * 9m Slab ................. 119
Figure 6.5: Design of Bottom Chord-Strut-and-Tie method .......................................... 119
Figure 6.6: Design of Top Chord-Strut-and-Tie method ................................................ 120
Figure 6.7: Design of Diagonal Strut-Strut-and-Tie method .......................................... 120
Figure 6.8: Design of Vertical Tie-Strut-and-Tie method .............................................. 121
Figure 6.9: Design of Node at Bottom-Strut-and-Tie method ........................................ 121
Figure 6.10: Design of Node at Top-Strut-and-Tie method ........................................... 122
Figure 6.11: Design of Node for Vertical Member-Strut-and-Tie Method .................... 122
Figure 6.12: Design Summary Strut-and-Tie method for 9mx9m Slab .......................... 123
Figure 6.13: Deflected Shape by SAFE .......................................................................... 124
Figure 6.14: Bending Moment/meter by SAFE .............................................................. 125
Figure 6.15: Reinforcement in mm2/meter by SAFE ..................................................... 125
Figure 7.1: Effect of Rib Spacing on the Load Carrying Capacity ................................. 136
Figure 7.2: Effect of Rib Depth on the Load Carrying Capacity .................................... 139
Figure 7.3: Effect of Rib Thickness on the Load Carrying Capacity ............................. 142
Figure 7.4: Effect of Concrete Cover on the Load Carrying Capacity ........................... 145

xv
NOMENCLATURE
ABBREVIATIONS
AASHTO American Association of State Highway and Transportation Officials
ACI American Concrete Institute
ASTM American Society for Testing and Materials
CAST Computer Aided Strut-and-Tie
CRSI Concrete Reinforcing Steel Institute
LFRD Load and Resistance Factor Design
MCFT Modified Compression Field Theory
STM Strut-and-Tie Model
ENGLISH AND GREEK SYMBOLS
a Depth of equivalent stress block defined as per ACI-318
A cs Cross-sectional area of a strut
A nz Cross-sectional area of nodal zone at its face, perpendicular to line of action
of force
As Area of steel
Ats Area of tensile steel reinforcement
C Compressive force in concrete
d Effective depth of a waffle slab , measured from the extreme compression
fiber to the centroid of longitudinal tension reinforcement

xvi
E c Tangent or secant modulus of elasticity of concrete
E s Modulus of elasticity of steel
f Stress in concrete at a given strain ε
f0 28 days cylindrical compressive stress in concrete
f1 Average principal tensile stress in concrete
f2 Average principal compressive stress in concrete
f ce Effective compressive strength of concrete
f cr Cracking strength of concrete
f ct Direct tensile capacity of concrete
f cu stress limit of a strut known as effective strength
f tc Effective tensile strength of concrete
f tu effective capacity of a tie
f y Specified yield strength of reinforcement in tension or compression.
f ′c Specified compressive strength of concrete
f ′ce Softened compressive strength of concrete
Fn Nominal strength of STM element
Fnn Nominal compressive strength at face of nodal zone
Fns Nominal compressive strength of strut
Fnt Nominal strength of Tie
Fu Factored force acting in STM element
h Overall depth of waffle slab
he Equivalent thickness of a waffle slab as per CRSI recommendation

xvii
I Cross-sectional moment of inertia
Mn Nominal flexural strength
Pcrack Test load at which the first crack appear in waffle slab test specimen
Pu-Test Failure load reported in experiment for waffle slab test specimen
S Rib spacing of waffle slab
t Top slab thickness of waffle slab
Vc Nominal shear strength provided by concrete
W Rib thickness of waffle slab
Ws Width of strut
Wt Effective width of tie
α Angle of inclination of bracing member with X-axis
βt Strength reduction factor for tensile strength of concrete tie
βn Strength reduction factor to account for effect of cracking on effective
compressive strength of nodal zone
βs Strength reduction factor to account for effect of cracking on effective
compressive strength of strut
Δ Deflection of waffle slab at center of slab by Orthotropic plate theory
ε0 Strain at ultimate stress
ε1 Principal average tensile strain
ε2 Principal average compressive strain
εc Compressive strain in uniaxial compressive stress-strain curve of concrete,
also compressive strain in stress-strain curve of a strut

xviii
εcu Strain at ultimate in uniaxial compressive stress-strain curve of concrete
εu Strain at failure
φ Strength reduction factor
ν Effectiveness factor
θ Angle between the strut and the adjoining tie
Ω Over-strength factor for bottom reinforcement

xix
THESIS ABSTRACT
Full Name Sunil Kumar G Pillai Title of Study Design of Waffle Slabs
Using Strut-and-tie Model Major Field CIVIL ENGINEERING (STRUCTURES) Date of Degree January 2011
Multi storey buildings with waffle slabs as concrete floor and roof systems are very common in Saudi Arabia and in many parts of the world. Because of the complex geometry of intersecting ribs, the analysis and design of waffle slab is not easy. Current design methods neglect the existence of ribs and treat the slabs as solid slabs and are approximate in nature. Finite element based methods are also used for design of waffle slabs. Strut-and-tie model is being used increasingly for analysis and design of concrete structures with pronounced D-regions. With a grid of intersecting ribs, waffle slab essentially forms a D-region. This thesis presents a new approach based on strut-and-tie method for analysis and design of waffle slabs. A three dimensional strut-and-tie model is proposed for analysis and design of simply supported waffle slabs and to predict the strength and corresponding mode of failure. The result obtained from proposed method, generated in ANSYS software and analyzed using its nonlinear analysis features, is compared with experimental results from literature. The strut-and-tie model is in good agreement with experimental results for all configurations of simply supported waffle slabs, whether the mode of failure is flexural, shear or slip bond failure, and it can be employed for the design of waffle slabs. A Visual Basic based user friendly software “STWAF” has been developed for analysis of the 3D truss model using STAAD and for the design based on ACI-318-05 recommendations for waffle slabs using the proposed strut-and-tie method. Parametric studies conducted using STWAF shows that ACI code provisions for the rib dimensions and spacing of waffle slab is done in such a way that the slab fails under flexure in case of overloading for spans up to 12m.
MASTER OF SCIENCE KING FAHD UNIVERSITY OF PETROLEUM AND MINERALS
Dhahran, Saudi Arabia January 2011

xx
ملخص رسالة
جي بياليسونيل آومار االسم الكامل
البالطات الخرسانية ذات االعصابتصميم دراسةالعنوان
Strut-and-tieوباستخدام نموذج
)انشاءات( الهندسة المدنية التخصص
2011يناير تاريخ
آأرضية خرسانية ونظم سقف شائعة البالطات الخرسانية ذات االعصاب التى يستخدم فيها طوابقالالمتعددة المبانىبسبب العملية المعقدة اللضلوع المتقاطعة ، وتحليل .جدا في المملكة العربية السعودية وفي أجزاء آثيرة من العالم
وتتعامل مع وجود االضالع تهمل ةطرق التصميم الحالي .ليست سهلة البالطات الخرسانية ذات االعصابوتصميم أساس لتصميم العناصر المحدودةآما تستخدم أساليب .البالطات على انها بالطات مصمتة وهو افتراض تقريبى
نحو متزايد لتحليل وتصميم يتم استخدامه على Strut‐and‐tieنموذج .االعصابالبالطات الخرسانية ذات عرض مقاربة جديدة تهذه الرسالة .مع شبكة متقاطعة من أضالعه .المنشآت الخرسانية وضوحا مع مد المناطق
ثالثى االبعاد نموذج .البالطات الخرسانية ذات االعصابتحليل وتصميم ل Strut‐and‐tieنموذج تستند إلى Strut‐and‐tie بقوة التحمل وشكل االنهيار والتنبؤ تقديمه لتحليل و تصميم البالطات الخرسانية ذات االعصابيتم
، العناصر المحدودةوتحليلها باستخدام ANSYSالحصول على نتيجة من الطريقة المقترحة ، ولدت في برنامج .في اتفاق جيد مع النتائج التجريبية لجميع Strut‐and‐tieنموذج .وبالمقارنة مع النتائج التجريبية من األدب
هو طريقة االنحناء ، القص أو زلة فشل السندات ، االنهيار، ما إذا آان البالطات الخرسانية ذات االعصابتكوينات استنادا األساسي المستخدم البصرية البرمجيات ودية ) أ( .البالطات الخرسانية ذات االعصابوأنه يمكن أن يكون
"STWAF "باستخدام ثالثى االبعاد وقد وضعت لتحليل نموذج الجمالونSTAAD لتصميم وبناء على توصيات - . Strut‐and‐tieنموذج .باستخدام البالطات الخرسانية ذات االعصابالمجلس الدولي للمطارات 318-05
حكام قانون المجلس الدولي للمطارات لألبعاد الضلع يبين أن أ STWAFالدراسات المبدئية التي أجريت باستخدام في حالة الحمولة الثنىوالمباعدة بين الوالدات الهراء بالطة هو الحال في مثل هذه الطريقة أن فشل بالطة تحت
.متر 12الزائدة ليمتد حتى
ماجستير العلوم
جامعة الملك فهد للبترول والمعادن
الظهران ، المملكة العربية السعودية
2011يناير

CHAPTER 1
INTRODUCTION
1.1 BACKGROUND AND NEED OF THE RESEARCH
Multi storey buildings with waffle slabs as concrete floor and roof systems are very
common in Saudi Arabia and in many parts of the world. Because of the complex
geometry of intersecting ribs, the analysis and design of waffle slab is not easy. Current
design methods neglect the existence of ribs and treat the slabs as solid slabs and are
approximate in nature. Finite element based methods are also used for design of waffle
slabs. Strut-and-tie model is being used increasingly for analysis and design of concrete
structures with pronounced D-regions. With a grid of intersecting ribs, waffle slab
essentially forms a D-region. The need for this research can be summarized as follows:
1. Conventional methods for the design of waffle slabs consider behavior for waffle-
slab same as flat plate or flat slab. The effect of ribs, which are the primary load
carrying elements, is ignored in the analysis and its effect on rigidity of the slab is
arrived based on empirical formulae.
2. Empirical methods currently being used are not predicting the mode of failure of
waffle slab accurately. Instead it restrict the parameters of the waffle such as rib
spacing, rib depth, rib thickness etc. to bring the slab in a desirable range where
the empirical equations are more or less applicable.
2
3. Effect of concentrated loads is not well addressed in current methods. The
behavior of the waffle slab under load depends on the bearing area and location of
concentrated load and there will be a local stress concentration near the load.
4. Strut-and-tie method has been used efficiently for analysis and design of complex
structures with prominent D region.
5. Waffle slab is essentially a 3-D structure due to inter connectivity of the ribs in
both directions. The close spacing of the ribs make the entire waffle slab as a D-
region. Strut-and-tie method is widely used for structures with D-region where the
stress flow is not uniform.
6. Strut-and-tie model serve a dual purpose. They allow description of essential
aspects of structural behavior and at the same time provide useful tools for
detailing and dimensioning. Strut-and-tie models assist the designer in
determining size, the location, the distribution, and anchorage of main
reinforcement.
7. Strut-and-tie model is extensively used for members in which shear is governing.
For waffle slab also many configurations, such as larger depth of rib, larger
spacing of ribs and smaller rib thickness, will result in shear critical structure.
The main advantage of STM method is that it can handle all types of structures
whether it is bending critical or shear critical.
8. STM method is not yet proposed for waffle slabs.
1.2 OBJECTIVES OF THE RESEARCH
The main objective of this research is to develop a STM for waffle slab and to
develop user-friendly software for automated design of waffle slab using STM.

3
The specific objectives of this study include:
• Develop a three dimensional Strut-and-tie model for simply supported waffle
slab.
• Comparison of the results of the STM model with experimental results from
literature. Ultimate strength and mode of failure are of key interest.
• Compare results of STM method with conventional design methods for design of
waffle slab
• Verify ACI limitations on size and spacing of ribs for design of waffle slabs
with respect to strength and mode of failure predicted by the proposed method.
1.3 SCOPE OF THE RESEARCH
Primary scope of the research is to develop a new approach based on strut-and-tie
method for analysis and design of waffle slabs. A three dimensional strut-and-tie model is
proposed for analysis and design of simply supported waffle slabs and to predict the
strength and corresponding mode of failure. The proposed model, generated in ANSYS
software and analyzed using its nonlinear analysis features, is compared with
experimental results from literature to validate the STM method.
Scope include developing a Visual Basic based user friendly software “STWAF” for
analysis and design of the 3D truss model, considering ACI-318-05 recommendations for
waffle slabs, using the proposed strut-and-tie method. Scope also include conducting
parametric studies using STWAF for the rib dimensions and spacing of waffle slab and
compare with corresponding ACI code provisions.
4
1.4 OVERVIEW OF TYPES OF CONCRETE SLABS
Structural reinforced concrete floor systems are one of the most popular systems and
will effectively transfer vertical and lateral loads to the vertical supports. There are many
types of concrete floors. One way slab, two way slab, flat plate, flat slabs, one way ribbed
slabs and two way ribbed slabs or waffle slabs are the most common types. It is a normal
practice to construct beams monolithically with the slab. Figure 1.1 shows a typical
arrangement of this system. The main disadvantage of this system is the large depths of
members which limits the floor to floor heights.
Flat plates and flat slab construction is popular due to its architectural advantage and
smaller depth of structural members. However it can be used only for small spans due to
large deflections and punching shear. Since larger spans needs more slab thickness, it is
not economical. For larger spans, even with drop panel and column capital, as we provide
in flat slab, the shear exceeds allowable limits for concrete which result in shear
reinforcement at column slab connection. Figure 1.2 shows a typical arrangement of these
systems.
One-way ribbed slabs are used to make the slabs stiffer which reduce deflections and
can span more. Figure 1.3 shows a typical one way ribbed slab. This is widely used in
pre-cast construction as modules of single T section or double T sections. Since ribs are
spanning in one direction, size of ribs will be generally high and not as economical as
two way ribbed slabs. Lateral load distribution perpendicular to rib direction is poor and
is not good for seismic forces, with thin slabs.

5
Figure 1.1: Slab, Beam and Girder System

6
Figure 1.2: Flat Plate and Flat Slab
Figure 1.3: One-way Ribbed Slabs
7
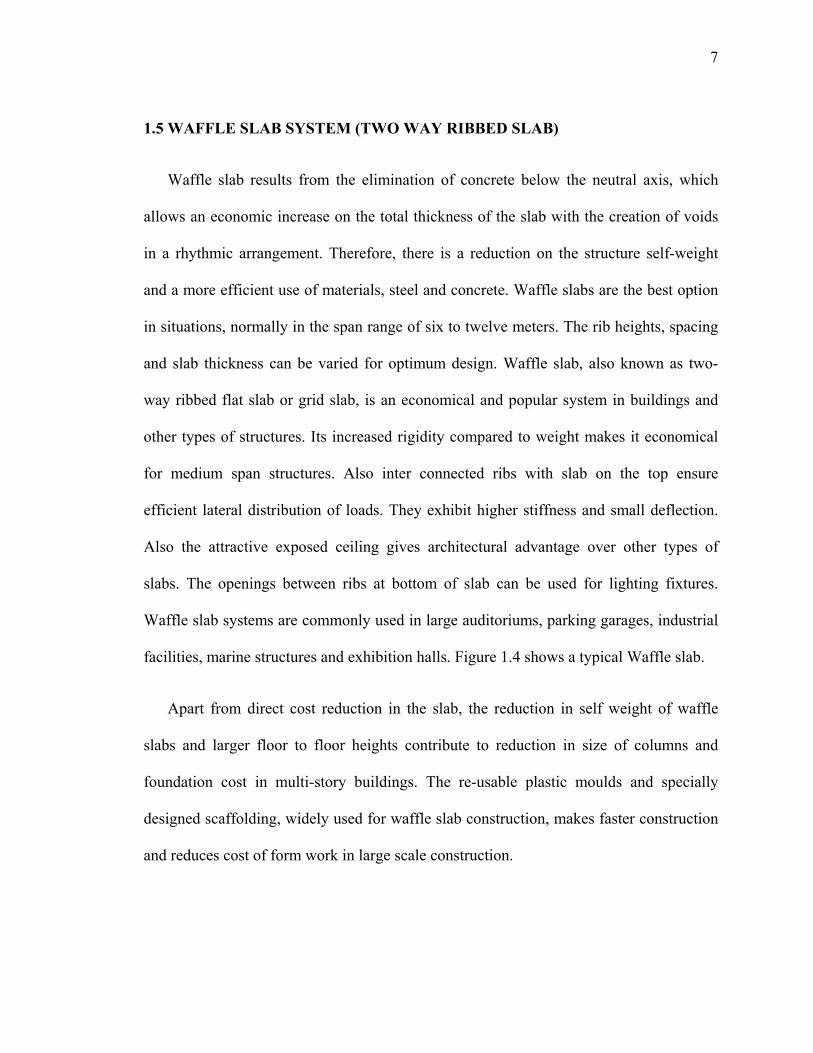
1.5 WAFFLE SLAB SYSTEM (TWO WAY RIBBED SLAB)
Waffle slab results from the elimination of concrete below the neutral axis, which
allows an economic increase on the total thickness of the slab with the creation of voids
in a rhythmic arrangement. Therefore, there is a reduction on the structure self-weight
and a more efficient use of materials, steel and concrete. Waffle slabs are the best option
in situations, normally in the span range of six to twelve meters. The rib heights, spacing
and slab thickness can be varied for optimum design. Waffle slab, also known as two-
way ribbed flat slab or grid slab, is an economical and popular system in buildings and
other types of structures. Its increased rigidity compared to weight makes it economical
for medium span structures. Also inter connected ribs with slab on the top ensure
efficient lateral distribution of loads. They exhibit higher stiffness and small deflection.
Also the attractive exposed ceiling gives architectural advantage over other types of
slabs. The openings between ribs at bottom of slab can be used for lighting fixtures.
Waffle slab systems are commonly used in large auditoriums, parking garages, industrial
facilities, marine structures and exhibition halls. Figure 1.4 shows a typical Waffle slab.
Apart from direct cost reduction in the slab, the reduction in self weight of waffle
slabs and larger floor to floor heights contribute to reduction in size of columns and
foundation cost in multi-story buildings. The re-usable plastic moulds and specially
designed scaffolding, widely used for waffle slab construction, makes faster construction
and reduces cost of form work in large scale construction.

8
Figure 1.4 shows a picture of plastic mould and specially designed scaffolding. Figure
1.5 shows picture of a waffle slab used for a parking garage under construction for
Project Promenade (Owner : Keppel Puravankara), JP Nagar, Bangalore, India and Figure
1.6 shows picture after construction.
Figure 1.4: Waffle slabs
Figure 1.4: Plastic Moulds for Waffle Slabs

9
Figure 1.5: Waffle Slab Under Construction
Figure 1.6: Waffle Slab After Construction
10
Cost of plastic moulds is generally high and hence is not economical for small scale
construction. The direct saving from material cost for waffle is partly nullified by the
additional cost of moulds and special form work in case of small scale construction. Also
for small spacing between columns as we do for residential buildings, there is not much
advantage for the waffle slabs. The savings are significant and waffle slab has clear
advantage over other types of slabs when we go for larger spans.
One of the reasons why designers hesitate to go for waffle slab is its complicated
design procedure. The parameters of the slabs are restricted by codes and few design
software’s have the capability to handle the design of waffle slab. Also current design
methods do not give a clear idea of the mode of failure.
1.6 STRUT-AND-TIE MODELING (STM)
Strut-and-tie Modeling is becoming an increasingly popular method for design and
detailing of concrete structural members. STM is adopted in ACI 318 [1] in 2002. This
method is proved to be very effective for structures with discontinuities where
conventional methods fail to predict the exact behavior and ultimate load. Currently STM
is widely used for a large number of structures like deep beams, corbels, pile caps etc.
However the full potential of this method is not utilized yet, since it can be applied for a
larger range of structures. In the current study, STM is applied for the design of waffle
slabs. The whole waffle slab is a D-region due to its geometry.
In strut-and-tie modeling discrete representations of actual stress fields, resulting
from the applied loads and support conditions, are considered and provides a static lower
bound solution. The load carrying mechanism of a structural member is approximated by

11
means of struts representing the flow of compressive stresses, ties representing the flow
of tensile stresses and nodal zones representing the point of intersection of struts and ties,
which are subjected to multi-axial state of stress (Schlaich and Schäfer 1987) [2].
A strut-and-tie model (STM) consists of elements in pure tension or compression.
Appropriate reinforcement must be provided in the portions of the structure where
tension is indicated by the strut-and-tie model or where additional strength, confinement,
or both, are required by the struts. By using a simple truss model, an estimation of
strength of a structural element can be made and, the element can be appropriately
detailed.
Even though Strut-and-tie modeling can be used for all portions of the structure, it is
most useful as a design tool when applied to structures, or portions of structures, in which
plane sections do not remain plane after the application of load. The behavior of such
elements is not dominated by flexural deformations. The difficulty in analyzing these
types of elements often arises from the inability to apply kinematic compatibility. STM
disregards kinematic constraints. Overall equilibrium and equilibrium of the nodes are
considered during the analysis stage. STM conforms to the lower bound theory of
plasticity, which requires that only equilibrium and yield conditions be satisfied.
The capacity of a structure as estimated by a lower bound method will be less than, or
at most equal to, the actual collapse load of the structure. The most appealing quality of a
lower bound theory is its inherent conservatism. Strut-and-tie model is considered a
rational and consistent basis for designing the cracked reinforced concrete structures. The
successful application of a strut-and-tie model depends on a reliable visualization of the

12
path of the force flows. In a typical strut-and-tie analysis, the force distribution is
visualized as compressive struts and tensile ties, respectively. Figure 1.7 provides a
simple strut-and-tie model applied to a simply supported deep beam. One of the main
advantages of the STM is its capacity to predict strength of shear critical structures.
Figure 1.7: Strut-and-Tie Model for Deep Beam
1.7 ORGANIZATION OF THESIS
The research program has five major sections.
1.7.1 Section 1: Literature Review
A literature search has been conducted to obtain recent information regarding similar
studies elsewhere. The literature search focused on the following areas:
• Experimental Data for simply supported waffle slabs
• Conventional methods for design of waffle slabs

13
• Strut-and-tie modeling of reinforced concrete elements
1.7.2 Section 2: Validation of Strut-and-Tie Model Using ANSYS
The important task in the thesis is to develop a strut-and-tie model for simply
supported waffle slabs which predict the strength and mode of failure of experimental
slabs from literature. The proposed strut-and-tie model is made in ANSYS [48],
incorporating nonlinear material models, and a nonlinear analysis is performed for each
of the experimental slabs. The results are compared with actual experimental data for
strength and mode of failure.
1.7.3 Section 3: Develop Software STWAF
Geometrically waffle slab is a complicated structure and the proposed three
dimensional STM consists of a large number of elements and nodes. Manual generation
of the truss is time consuming and will limit the usage of the method. Hence user-friendly
software dedicated for fully automatic generation of the 3D truss is developed.
1.7.4 Section 4: Comparison of the STM Model to Other Design Methods
Design of a 9m x 9m waffle slab is done with strut and tie method. The same slab is
designed using the conventional design methods. The results are compared for the main
bottom reinforcement at ribs keeping other parameters of the slab same.
1.7.5 Section 5: Parametric Study of Waffle Slabs Using SWAF
A parametric study is conducted using software STWAF for a 10m x 10m waffle slab
and find the contribution of rib spacing, depth of ribs, thickness of ribs and concrete
cover on strength and mode of failure. The ACI provisions on restriction of these
parameters are compared with that predicted by STWAF.
CHAPTER 2
LITERATURE REVIEW
Literature search was done on the following areas.
1. Ultimate strength of waffle slab and experimental programs conducted for waffle
slabs in the past to obtain test results.
2. Strength and stress-strain relations of concrete and steel
3. Strut-and-tie method for modelling concrete structures.
4. Design of waffle slabs by current design methods.
2.1 ULTIMATE STRENGTH AND EXPERIMENTAL DATA FOR WAFFLE
SLABS
Information on the strength and behavior of reinforced concrete waffle slabs is
very limited, but there have been a few theoretical and experimental investigations
of waffle plates and slabs mostly in the elastic range (Timoshenko and Woinowsky-
Krieger 1959 [3]; Bares and Massonnet 1966 [4]; Tebbet and Harrop 1979 [5];
Cusens and Pama 1981[6]; Kennedy and Iyengar 1982[7]).
Three load tests to destruction were made on the waffle slab roof of the
Rathskeller Building in the Belgian Village exhibit at the 1964-65 New York
World’s Fair. Each load test was conducted at different portion of the same building
to study the behavior of waffle slabs under gravity loads. The report published by

15
Magura and Corley, 1971[8 and 9] in ACI shows that the behavior of structure in
general was in accord with existing theories. Flexural capacity was not reached in
any of the test and structure failed in shear. Deflections were in good agreement
with that computed from equivalent frame analysis.
Deflection characteristics of waffle panels have been studied experimentally and
analytically by Xuerun Ji, Sheng-Jin Chen, Ti Huang, and Le-Wu Lu, 1986 [10].
Elastic finite element analysis was made to predict deflections. Large-scale tests
have also been carried out on a limited number of slab models as part of the study to
measure deflections under in plane and out of plane loading. However the study was
limited up to cracking of concrete and ignored reinforcement. Based on the study
they pointed out that the “equivalent thickness method”, recommended by the
Concrete Reinforcing Steel Institute Hand book (CRSI 1972), leads to over
estimation of the torsional rigidity and under estimation of deflection under vertical
loads. They recommends to reduce the equivalent thickness by 20 % to compensate
the over estimation.
Tests on a large-scale model (approximately 1:3) of six panel waffle slab
supported on twelve columns were conducted by Ajdukiewcz and Kliszczewicz,
1986 [11]. The results obtained from the test, location of the crack, mechanism of
failure and the magnitude of destructive load are considered. Tests indicate that the
main negative yield line is located comparatively far from the column face, and
depends on the solid region around the column and the extension of top
reinforcement. Recommendations on yield line patterns in waffle slab flat plate
structures are also discussed.

16
Seismic load tests conducted on two story waffle plate structure by Mario E.
Rodriguez, Sergio A. Santiago and Roberto Meli ,1995[12], proves the poor performance
of waffle slab structure under seismic loading. They confirm that a satisfactory seismic
behavior in terms of lateral stiffness and strength can be attained by the addition of
bracing or structural walls.
Experimental study conducted by Hashim M.S. Abdulwahab and Mohammad H.
Khalil , 2000 [13] on 1:4 scale specimens on waffle slabs with square lay-out of ribs
also give useful information. They studied the impact of slab thickness, rib spacing,
rib depth etc. on flexural rigidity and ultimate strength. The test results show that the
first crack appeared at around 25-30 % of the ultimate strength. Also the specimens
behave elastically for the first two stages, before and after the first crack appears.
They applied an alternate approximate design method called “elemental disc
analogy”, based on “effective modulus of elasticity” for waffle slabs also. However
they limited their study to simply supported waffle slabs.
A theoretical study was conducted by J Prasad, S. Chander and A.K. Ahuja
(2005)[14] on “Optimum dimensions of waffle slab for medium size floors” on
limited slab specimens, in the range of six to eight meter span. They used grid
analysis using a FORTRAN program for analysis. The optimum dimensions for
various configurations of waffle slabs were studied.
An experimental study conducted by P. F. Schwetz, F. P. S. L. Gastal and L. C.
P. Silva on “Numerical and experimental study of real scale waffle slab” (2009)[15].
The objective of this work was to analyze the adequacy of a design method widely
used in the modeling of waffle slabs, verifying if it represents the slab behavior

17
satisfactorily. A real scale waffle slab submitted to a load in a localized area was
instrumented with strain gages and deflection gages for measuring specific strain
and deflection in different points. The numerical analysis was made using a grid
model. Tests showed a linear behavior, even though residual results could indicate
cracking in some isolated sections. Numerically computed deflections presented a
good estimate to test results and the experimental strains defined the presence of
bending moments coincident with the forecasts of the theoretical model. However
the study was limited to a stress range of the actual safe designed loads.
2.2 STRENGTH AND STRESS-STRAIN RELATIONSHIPS OF CONCRETE
AND REINFORCEMENT
2.2.1 Tension Capacity of Concrete
Direct tensile strength of concrete is difficult to measure. Splitting tensile strength is
generally measured to find the tensile strength of concrete. ACI 318-2008 recommends
splitting tensile strength of normal weight concrete as 6.7(f’c)1/2 in psi units, which in
MPa units is 0.556(f’c)1/2 . Tensile strength of concrete is typically 8 to 15% of
compressive strength.
2.2.2 Stress-Strain Relationships of Concrete
Generally all the experiments for concrete are limited to find the compressive strength
of concrete, which is used for design of concrete structures. Because of various
influencing factors and different conditions in experimental approaches, a general
equation expressing the stress strain curve of concrete for all types of concrete has not
been proposed yet.

18
An attempt was made to evaluate the stress strain relationship for concrete under uni-
axial compression by Ali [16]. An experimental program was conducted to evaluate
various parameters involved. Simple equation in the form of a polynomial was proposed
as shown and was in good agreement with test results. This study does not consider
tension softening since all test specimens were cylindrical specimens.
Strain at Ultimate stress,
ε0 = 0.000875 (f 0)0.25 (2.1)
Strain at failure,
εu = 0.0078 / (f 0)0.25 (2.2)
Stress f, at a given strain ε is calculated by the formulae,
f = f 0 [2.1(ε/ε0) - 1.33(ε/ε0)2 + 0.2(ε/ε0)3] (2.3)
Where, f0 is the 28 days cylindrical compressive strength of concrete.
An experimental study on stress-strain curve of concrete considering localized failure
in compression was conducted by Watanabe [17]. One of the important factors for
compressive stress strain curves of concrete is localization of failure. The stress strain
curve of concrete strongly depends on the aspect ratio of concrete specimen and hence a
unique stress strain curve is not adequate to express the softening behavior of concrete.
To overcome the problem of localization of failure, a series of uni-axial compression tests
were conducted. An equation for envelop curve involving a characteristic of compressive
strength was also formulated.
2.2.3 Compression Strength of Softened Concrete
Cracked reinforced concrete can be treated as an orthotropic material with its
principal axes corresponding to the directions of the principal average tensile and

19
compressive strains. Cracked concrete subjected to high tensile strain in the direction
normal to the compression is observed to be softer than concrete in a standard cylindrical
test. The phenomenon of strength and stiffness reduction is commonly referred to as
compression softening. Park and Kuchma [18] conducted a study to predict shear strength
of Deep beams using Strut-and-tie Model Analysis. Applying this softening effect to
STM, it is recognized that the tensile straining perpendicular to the strut will reduce the
capacity of concrete strut to resist compressive stresses. The softened concrete strength
f’ce can be determined by
f’ce = υf’c (2.4)
Where, f’c is the specified compressive strength based on cylindrical compressive test and
υ is the efficiency factor of concrete.
ACI 318-2008 recommends the value of efficiency factor for bottle shaped struts
without stirrup reinforcement as 0.6 for normal weight concrete. In an experimental study
conducted to find the shear capacity of simply supported reinforced concrete deep beams
using strut-and-tie method, Arabzadeh [19] concludes that the shear strength based on
ACI strut-and-tie model is conservative.
2.2.4 Stress-Strain Relationships of Reinforcement
In the design of reinforced concrete steel structures, rebar properties do not need to be
exactly known. ASTM A615 [20] only requires that yield stress of grade 60 bars need to
exceed 60 ksi (414 Mpa). However for finite element analysis of the structure an actual
value of yield stress, ultimate stress and stress strain relation is required to predict exact
structural response.

20
Malvar and Crawford [21] conducted a study on Dynamic Increase Factors for Steel
reinforcing bars. As part of the study, they collected the experimental data from various
sources for different grades of steel for static properties of reinforcing steel. A typical
stress strain curve for grade 60 bars is as shown in Figure 2.1.
Mirza and MacGregor [22] conducted extensive experimental study on reinforcing
steel bars of different grades. Based on the study for US made Grade 60 (Fy = 60 ksi)
bars (1356 tests), they concluded that the average yield strength is 69 ksi and Ultimate
strength is 109 ksi. The average value of modulus of elasticity was 200 GPa.
ASTM A615 requires a minimum percentage elongation of 9% in 8 inches for small
bars (#3 to #6), 8% for #7 and #8 bars and 7% for larger bars (#9 to #18). However for
numerical applications, the value of strain at ultimate stress is of great importance to
know the stiffness of the elements. Test results by Cowell [23] on ASTM A432 grade 60
re-bars indicate percentage elongation at rupture as 21% and the average strain at
ultimate stress as 12%.

21
Figure 2.1: Typical Stress-Strain Curve for ASTM 615 Grade 60 steel
2.3 STRUT-AND-TIE MODELING OF CONCRETE
2.3.1 Bernoulli’s Hypothesis and St.Venant’s Principle
The Bernoulli hypothesis states “Plane sections remain plane after bending.” This
hypothesis is the basic assumption of flexural design of structural concrete by allowing
linear variation in strain over the depth of the cross section. According to the Bernoulli
hypothesis, any concrete structure may be subdivided into two regions. One is the B-
region in which the Bernoulli hypothesis is applicable, where the B stands for beam or
Bernoulli. Another is D-region in which the Bernoulli hypothesis is not applicable, where
the D stands for discontinuity or disturbed.
Based on the principle of St.Venant, the dimensions of the B and D regions are
obtained. St.Venant’s principle states “The local distribution of forces acting on a small
portion of a body subject to a stress field may be changed without changing the stress

22
field in the body at some distance away from the point where the distribution was made.”
This principle suggests that local disturbance extends about one member depth each way
from concentrated loads, reaction, or sudden changes in direction or section. Also B-
regions carry load by beam action and, D-regions carry load primarily by arch action
involving in-plane force- MacGregor 1997 [24]
2.3.2 Strut-and-Tie Model for Deep Beams and Mode of Failure
Figure 2.2 shows a deep beam with two-point loading. Load path is well defined by
the compression struts. Equilibrium at each node is ensured in the model. The type of
failure modes and corresponding crack formation is also shown in Figure 2.2.
Figure 2.2: Mode of Failure of Deep Beams, (MacGregor, 1997)

23
2.3.3 Truss Analogy for Design of B-Region
The truss analogy is the shear design approach for reinforced concrete. The truss
model introduced by Ritter in 1899 [25] has been developed and adopted by most design
specifications as the standard shear design method. The general design procedure for
concrete consists of selecting the concrete dimension, determining the size and the
placing of reinforcement, and finally checking the serviceability (Marti, 1985) [26]. In
the second step, the truss analogy is used to investigate the equilibrium of the external
loads and internal force in the concrete and reinforcement. The truss model approach
provides an excellent conceptual framework to show the internal forces that exist in a
cracked structural concrete member.
2.3.4 Compression Field Theory
This method is based on the lower-bound theorem of plasticity which states that “If
an equilibrium distribution of stresses can be found which balances the applied load and
is everywhere below yield or at yield, the structure will not collapse. Since the structure
can carry at least this applied load, it is a lower bound to the load-carrying capacity of the
structure.”
Inclined cracks in the reinforced concrete develop a vertical tension force in the
vertical reinforcements, horizontal tensile forces in the horizontal reinforcements, and
inclined compressive forces in the concrete between the cracks. These internal forces
form the indeterminate truss.
24
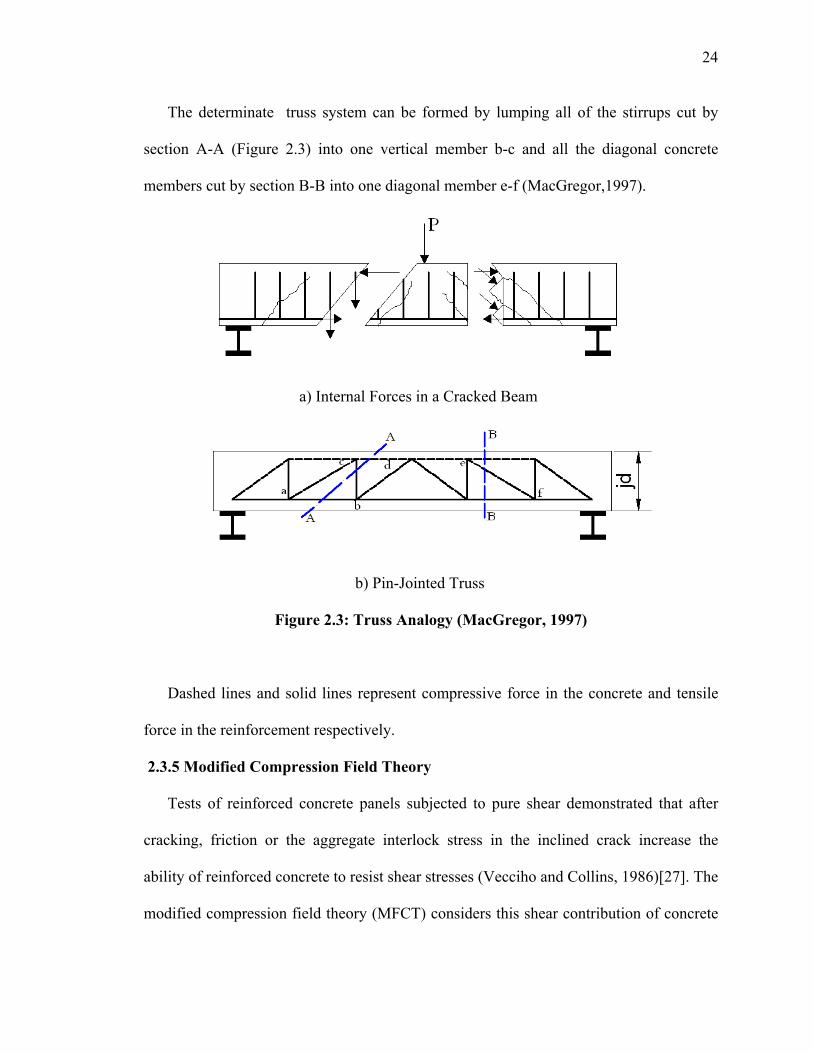
The determinate truss system can be formed by lumping all of the stirrups cut by
section A-A (Figure 2.3) into one vertical member b-c and all the diagonal concrete
members cut by section B-B into one diagonal member e-f (MacGregor,1997).
a) Internal Forces in a Cracked Beam
b) Pin-Jointed Truss
Figure 2.3: Truss Analogy (MacGregor, 1997)
Dashed lines and solid lines represent compressive force in the concrete and tensile
force in the reinforcement respectively.
2.3.5 Modified Compression Field Theory
Tests of reinforced concrete panels subjected to pure shear demonstrated that after
cracking, friction or the aggregate interlock stress in the inclined crack increase the
ability of reinforced concrete to resist shear stresses (Vecciho and Collins, 1986)[27]. The
modified compression field theory (MFCT) considers this shear contribution of concrete
25
(Vc) to the shear resistance. This design method introduced by Collins and Mitchell
(1996)[28] has been adopted by the AASHTO LRFD specification.[29]
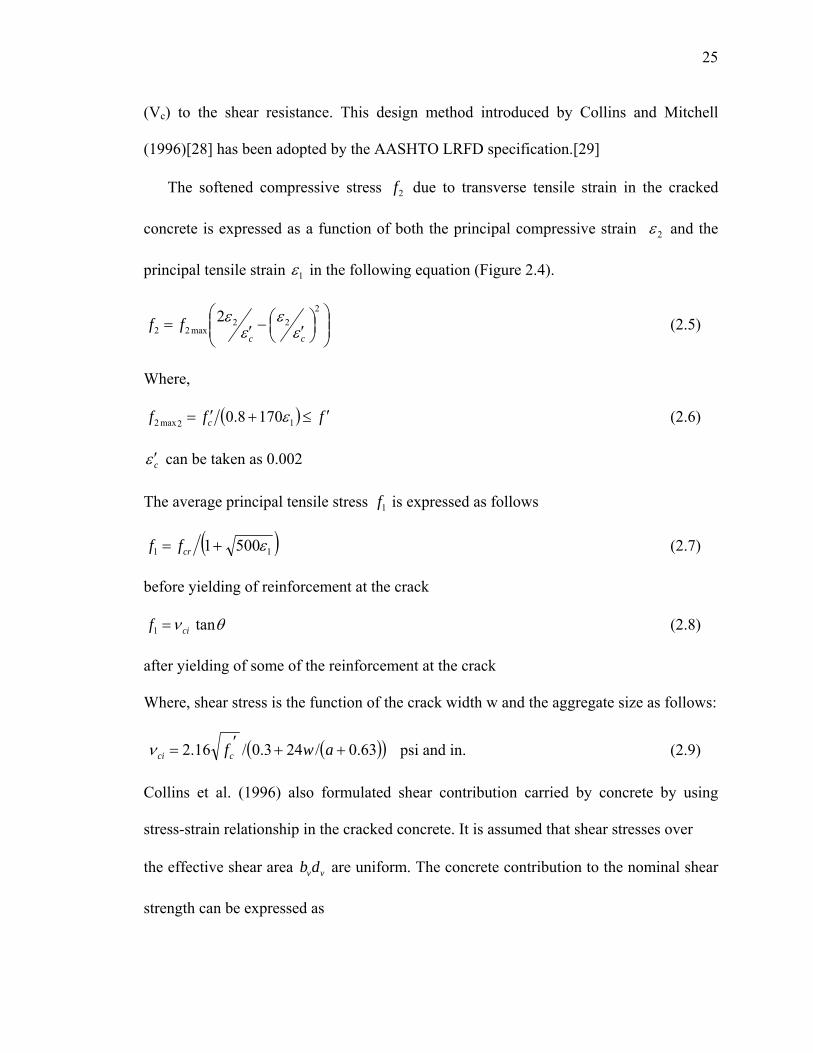
The softened compressive stress 2f due to transverse tensile strain in the cracked
concrete is expressed as a function of both the principal compressive strain 2ε and the
principal tensile strain 1ε in the following equation (Figure 2.4).
⎟⎟⎠
⎞⎜⎜⎝
⎛⎟⎠⎞⎜
⎝⎛
′−′=2
22max22
2cc
ff εε
εε (2.5)
Where,
( ) fff c ′≤+′= 12max2 1708.0 ε (2.6)
cε ′ can be taken as 0.002
The average principal tensile stress 1f is expressed as follows
( )11 5001 ε+= crff (2.7)
before yielding of reinforcement at the crack
θν tan1 cif = (2.8)
after yielding of some of the reinforcement at the crack
Where, shear stress is the function of the crack width w and the aggregate size as follows:
( )( )63.0/243.0/16.2 ++′= awfcciν psi and in. (2.9)
Collins et al. (1996) also formulated shear contribution carried by concrete by using
stress-strain relationship in the cracked concrete. It is assumed that shear stresses over
the effective shear area vvdb are uniform. The concrete contribution to the nominal shear
strength can be expressed as

26
vvvvc dbcfdbfV ′== βθcot1 (2.10)
Figure 2.4: Stress-Strain Relationships for Cracked Concrete (Collins et al. 1996)
2.3.6 Components of Strut-and-Tie Model
2.3.6.1 Struts
Struts represent concrete compressive stress fields whose principal stresses are
predominantly along the centerline of the struts. The shape of the strut stress field in
planar D-regions may be idealized as prismatic, bottle-shaped, or fan-shaped as shown in
Figure 2.5 (Schlaich et al, 1987). Struts may be strengthened by ordinary steel
reinforcement, and if, so, they are termed reinforced struts.
In general, the stress limit of a strut is not the same as the uni-axial concrete compressive
strength obtained from cylinder tests, cf ′ . It is defined as
′= cffcu ν , (2.11)

27
Where, =cuf stress limit of a strut, commonly referred to as effective strength, and =ν
effectiveness factor, also known as efficiency factor or disturbance factor (typically
between 0 and 1.0).
The effectiveness factor,ν , is an empirical factor that is used to justify the application of
limit analysis concept to structural concrete. It accounts for the difference in the post
yielding response between the uni axial compressive stress-strain curve used for deriving
the limit analysis theorem, namely the (rigid or elastic) perfectly plastic curve, and that of
typical concrete as shown in Figure 2.6. If the uniform stress distribution is selected, the
effective strut capacity is simply
,cuccu fAf = (2.12)
Where, cA is termed the effective cross-sectional area given by twA cc = . With the same
assumption, the effective capacity of reinforced concrete struts is
,yscuccu fAfAf += (2.13)
Where, sA and yf are the cross-sectional area and the compressive yield strength of
ordinary steel reinforcement, respectively.
2.3.6.2 Ties
Ties typically represent one or multiple layers of ordinary steel, in the form of
flexural reinforcement, stirrups, or hoops. Ties can occasionally represent a pre-stressing
steel or concrete stress field with principle tension predominant in the tie direction. The
effective capacity of a tie consisting only of non-pre-stressed reinforcement is given by
,ystu fAf = (2.14)

28
Where, sA = area of ordinary reinforcing steel, and yf = yield strength of ordinary steel
reinforcement in tension.
The tie reinforcement is usually assumed to be enclosed and uniformly distributed in
a prism of concrete (smeared reinforcement). Termed tie effective cross-sectional area,
the cross sectional area of the concrete prism, tA , where twA tt = , where tw is the tie
effective width as shown in Figure 2.7. The tie capacity given in Equation 3.14 can be
rewritten in terms of equivalent stress assumed to be uniformly distributed across the
effective cross- sectional area as
,ystu frf = (2.15)
Where, rs = As/At is geometrical ratio of non-pre-stressed reinforcement

29
Figure 2.5: Idealized Stress Fields in Struts: (a) Prismatic (b) Bottle-shaped (c) Fan-
shaped (Adapted from Schliach et al. 1987).
Figure 2.6: Typical Stress-Strain Relationship for Concrete in Uni-axial
Compression and the Idealization Used in the STM.

30
Figure 2.7: Effective Width of Tie
2.3.6.3 Nodes
Analogous to the joints in a structural steel truss, nodes represent regions in which
forces are transferred between struts and ties. These regions are usually called nodal
zones or nodal regions. Some literature (e.g. ACI 318-08) uses these terms slightly
differently; a node refers to the meeting point of the strut axes, tie axes, and body forces
acting on the node whereas a nodal zone or nodal region refers to the finite dimension of
a node.
Depending on the types of forces being connected, there are four basic types of nodes
with three members intersecting, namely CCC, CCT, CTT, and TTT, as illustrated in
Figure 2.8, where cF and tF in the figure denote strut and tie forces, respectively.
Originally used for nodes with three members framing the terms CCC, CCT, and TTT are
extended herein for convenience to include nodes with more than three members framing
as follows: CCC nodes are those in which all the framing members are struts, CCT nodes
are those in which one of the framing members is a tie, CCT nodes are those in which
two or more of the framing members are ties, and TTT nodes are those in which are those
in which all the framing members are ties.

31
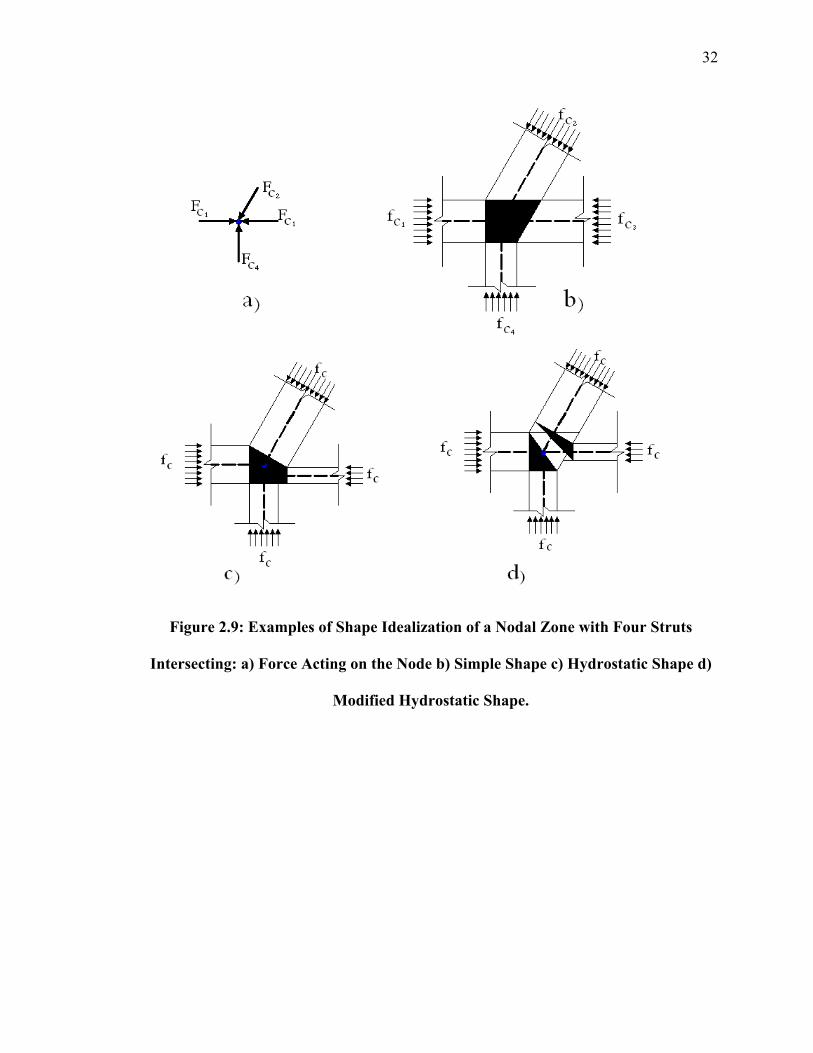
In 2-D design problems, the stresses in nodal zones are biaxial and are limited to the
yield criterion for plane stress problems. The stress distribution in a nodal region depends
on the idealized shape, which in turn depends on the effective width and direction of the
strut or tie stress field entering the node. An example of this construction for a nodal zone
with four struts intersecting is shown in Figure 2.9. The state of stress in these nodal
zones is typically complex and difficult to determine. Variants of constructing nodal zone
shapes have been proposed to simplify the stress distribution in these regions. These
include the hydrostatic approach (Figure 2.9(c)) (e.g. Marti 1985 and Nielson 1998) [30]
and modified hydrostatic approach (Figure 2.9 (d)) (Schlaich and Anagnostou 1990). [31]
Different effective bearing strength of nodes have been proposed to account for the
influencing factors, such as the number and type of intersecting truss members(struts or
ties), distribution of tie reinforcement, confinement and use of fibers, level of transverse
straining, volume and condition of surrounding concrete, and conditions of ties.
Figure 2.8: Basic Node Types: a) CCC b) CCT c) CTT d) TTT
32
Figure 2.9: Examples of Shape Idealization of a Nodal Zone with Four Struts
Intersecting: a) Force Acting on the Node b) Simple Shape c) Hydrostatic Shape d)
Modified Hydrostatic Shape.

33
2.3.7 The Strut-and-Tie Method for Analysis and Design
The strut-and-tie models have been widely used as effective tools for designing
reinforced concrete structures. The idea of a Strut-and-tie Model came from the truss
analogy method introduced independently by Ritter (1899) in the early 1900s for shear
design. This method employs the so-called Truss Models as its design basis. The model
was used to idealize the flow of force in a cracked concrete beam. In parallel with the
increasing availability of the experimental results and the development of limit analysis
in the plasticity theory, the truss analogy method has been validated and improved
considerably in the form of full-member or sectional design procedures. The Truss Model
has also been used as the design basis for torsion.
Schlaich and Weischede (1981)[32] introduced the concept of D-regions and B-
regions where D stands for discontinuity or disturbed regions and B stands for beam or
Bernoulli. In D-regions, extending a distance equal to the member depth away from
discontinuity such as a change in cross section or concentrated loads, the strain
distribution is significantly nonlinear.
Later, Schlaich et al. (1987) generalized the application of the truss analogy concept
to all parts of reinforced and pre-stressed concrete structures in the form of Strut-Tie
system and suggested using the Strut-Tie system as a primary load-carrying mechanism
in such regions. As a guideline for the development of a Strut-Tie model, they
recommended visualizing the internal forces flow according to a linearly elastic analysis
and orienting the struts and ties within 15 degrees of the elastically determined stresses.
Several theoretical and experimental studies had been carried out to analyze the shear
failure of reinforced concrete beams. During the past few years, design codes ACI 318-08

34
and AASHTO (2005) have adopted strut-and-tie principles for the design of deep beam
members.
Hwang et al. (2001) [33] have related the stress limits with the transverse strain
perpendicular to the stress direction so as to consider the softening effect of concrete
compressive strength. However, it may not be appropriate to apply the smeared crack
model concept to the D-region, that is, the disturbed region where the conventional plane-
section-remains-plane principle is not valid. Tan et al. (2001, 2003) [34, 35] have
developed a direct STM for simply supported deep beams, which can consider the effects
of different web reinforcement configurations (vertical, horizontal, or inclined), and pre-
stressing tendons.
Nielson et al. (1978) [36] have used the theory of plasticity for computation of the
inclination of compressive struts in the truss model. The reinforcement was assumed to
be rigid, perfectly plastic and unable to resist lateral forces.
Bakir and Boduroglu (2005) [37] discussed the application of the softened truss and
strut-and-tie models on short beams. The model has two important characteristics. The
first is the non-linear association of stress and strain. The second is the softening of
concrete in compression due to tensile strains in the perpendicular direction.
Young (2000) [38] presented an interactive computer graphics program for
implementing the nonlinear strut-tie model approach for the practical design and analysis
of disturbed regions in structural concrete. The design result showed that the nonlinear
strut-tie model, combined with the graphics program, produces simple and effective
solutions by providing accurate details on structural concrete.

35
Tjhin and Kuchma (2002) [39] developed a computer program CAST (Computer
Aided Strut-and-tie) for design and analysis of reinforced and pre-stressed concrete
members.
Hyo-Gyoung and Sang-Hoon (2006) [40] have introduced a method to determine
strut-and-tie models in reinforced concrete (RC) structures by using evolutionary
structural optimization (ESO). The introduced optimization procedure also showed the
availability of determining optimal strut-and-tie models of RC structures with
complicated geometry, such as corbel structures and deep beams with openings, for
which the classical strut-and-tie approach has limitations in application. However, the
availability of the proposed method for RC structures with complicated loadings should
be checked. Further theoretical research, including the effect of material property on the
optimal strut-and-tie models, as well as experimental verifications must be followed to
achieve a more rational design approach.
Alshegeir and Ramirez (1992) [41] have developed an iterative computer graphics
program implementing the strut-tie model approach for analysis and design of reinforced
and pre-stressed concrete members. The program provides the direction of principal
compressive stresses, which gives guidance in the development of strut-tie models.
Liang et al. (2006) [42] developed a strut-and-tie design methodology for three-
dimensional reinforced concrete structures. The unknown strut-and-tie model is realized
through the machinery of a refined evolutionary structural optimization method. Stiffness
of struts and ties is computed from an evolved topology of a finite element model to solve
statically indeterminate strut-and-tie problems. In addition, compressive strength for
struts and nodal zones is evaluated by using Ottosen’s four-parameter strength criterion.

36
Chun (2002) [43] developed a 3D indeterminate strut-and-tie model for the analysis
of the footing system. Five different levels of stiffness were used to cover the lower and
upper bounds for both cracked and un-cracked situations. By following the sequence of
construction, the model predicted the stresses of the members at different stages. Finite-
element solid modeling was also conducted to verify the strut-and-tie model.
Richard (1995) [44] has developed a strut-and-tie model for the punching shear
behavior of a concrete slab. This model provides a quick and simple approach to
punching shear behavior. It is applicable for both normal and high strength concrete
under symmetric and non-symmetric loading with and without shear reinforcement.
Strut-and-tie models are discrete representations of actual stress fields resulting from
the applied loads and support conditions and provide static lower bound solutions. These
models actually represent the load carrying mechanism of a structural member by
approximating the flow of internal forces by means of struts representing the flow of
compressive stresses and ties representing the flow of tensile stresses.
Strut-and-tie model serve a dual purpose. They allow description of essential aspects
of structural behavior and at the same time provide useful tools for detailing and
dimensioning. Strut-and-tie models assist the designer in determining size, the location,
the distribution, and anchorage of main reinforcement.
An accepted design philosophy in reinforced concrete is to produce members in
which the critical section exhibit ductile behavior under extreme over load. This is done
by ensuring that reinforcement yields before concrete fails and flexure controls the mode
of failure.

37
The strut-and-tie method of design has been incorporated in ACI 318 for the design of
concrete. It clearly explains the concept and gives allowable stresses in concrete struts
and nodal zones.
Tiller [45] proposes a strut-and-tie model for the punching shear of concrete slabs.
This model provides a quick and simple approach to punching shear behavior. It is
applicable for both normal and high strength concrete under symmetric and non-
symmetric loading.
STM has recently emerged as a consistent and rational method for the design of
discontinuity regions in structural concrete and is being incorporated in codes of practice.
While the STM provides a conceptually simple design methodology, its implementation
is usually complicated by the need to perform iterative and time consuming calculations.
CAST program developed by Tjhin and Kuchma (2004, 2007) [46, 47] solved many
problems in this regard for two dimensional strut-and-tie problems and made it possible
to explore the capabilities of STM. Although STM can be used for the design of all parts
of concrete structures, it is typically applied only to design of D-regions, which include
those parts which include those parts of concrete structures near abrupt changes in
geometry and near concentrated forces. The STM relies on the use of strut-and-tie models
as idealized flows of forces or internal load-carrying systems in the cracked body of
concrete at the ultimate limit state.
Due to the wide range of structures that can be designed by the STM, there is
significant uncertainty about what level of distributed reinforcement is needed to ensure
that the structure is sufficiently ductile to support the loads in the manner envisaged by
the designer. This added reinforcement also plays a significant role in controlling

38
cracking in struts and throughout the structure. By careful selection of the shape of the
internal load resisting truss, the need for distributed reinforcement can be reduced. This
can be accomplished by selecting the lines of action of primary struts and ties to be close
to the directions of principal compressive and tensile stresses as determined by linear
elastic finite element analyses.
2.4 CLASSICAL METHODS FOR DESIGN OF WAFFLE SLABS
2.4.1 Equivalent Thickness Method
The “equivalent thickness” concept that is recommended by the Concrete Reinforcing
Steel institute Handbook (CRSI 1972) is an approximate method to predict the deflection
of waffle slabs. Equivalent thickness is defined as the thickness of a uniform plate that
has the same bending stiffness as the waffle slab. For a slab under transverse load, the
equivalent thickness is obtained by averaging the gross moment of inertia.
h/
(2.16)
Where S = center-to-center distance between the ribs; and I = moment of inertia of the
flanged section including one rib and the top slab of width S.
In a study of the deflection characteristics of waffle slabs, Ji et al. (1986) tested one
specimen under gravity load and compared the results of the stiffness in the elastic range
with those obtained by the finite-element method and the equivalent thickness concept.
They concluded that the equivalent thickness method leads to overestimation of the
torsional rigidity and an underestimation of the deflection. To compensate for this, they
suggested that the equivalent thickness might be reduced by approximately 20%. Under

39
full service load (i.e., in the elastic-cracked range), they suggested that the effective
stiffness might be estimated as 40% of the initial (elastic-un-cracked) stiffness.
2.4.2 Orthotropic Plate Theory
Orthotropic plate theory originally developed for an ideal elastic material, such as
steel, was extended to reinforced concrete waffle slab design (Timoshenko and
Woinowsky-Krieger 1959; Bares and Massonnet 1966; Cusens and Pama 1975). To
predict accurately the elastic response of such structures to an applied load, it is essential
for designers to use realistic estimates of the various rigidities of the structure.
For an orthotropic plate under a given load distribution and for known boundary
conditions, the deflections, moments, and shears are determined by integration of the
differential equation (Timoshenko and Woinowsky-Krieger 1959; Cusens and Pama
1975)
Dx (δ4w/δx4) + 2H (δ4w/(δx2 δy2)) + Dy (δ4w/δy4) = P(x, y) (2.17)
Where, Dx and Dy = flexural rigidities; and 2H = total torsional rigidity that is the sum
of the torsional rigidities in the x-and y-directions, Dxy and Dyx, and the coupling
rigidities, D1 and D2, which represent the contribution of bending to the torsion of the
deck.
In the case of orthotropic plate theory, moment of inertia of ‘T’ section is calculated
based on rib spacing, rib thickness, thickness of slab and overall depth. Bending and
torsional rigidities are then calculated and analysis being done as a plate with uniform
thickness. Based on moments and shear obtained, T-sections are designed as per code
provisions.
40
2.4.3 ACI Approach
The empirical design methods recommended by ACI 318-2008 addresses all types of
two way slabs in the same manner under vertical loads. The direct design method or
equivalent frame method, applicable for two way flat plate and flat slabs, is also
applicable for waffle slabs. But neither experiments nor analytical investigations have
satisfactorily confirmed the appropriateness of such an approximation.
However there are significant difference in the behavior of the two types of the slabs;
the increased ratio of flexural to torsional rigidities in a waffle slab results in a substantial
reduction in the load that is transmitted by torsion of the slab elements. The difference is
significant, when there is less number of spans in any direction.
ACI recommends two methods for the design of multi-span waffle slabs: Direct
design method and Equivalent frame method. Both the methods are same as that used for
two way slabs. ACI restricts rib spacing, rib thickness and rib depth for the design of
waffle slab.
In Direct design method, the factored loads are calculated and slab is divided into
column strip and middle strip. Moments and shear at critical sections are calculated based
on coefficients. Finally design is done considering T-section. Punching shear is checked
and provisions for minimum reinforcement and spacing followed.
In Equivalent frame method, the difference is that the slab is divided into two
dimensional frames in each direction along column lines. Moments and shear are
obtained by the analysis of the frames.

41
2.4.4 Numerical Methods
Finite Element modeling is a more accurate method of predicting the behavior of
waffle slabs. However it needs specialized soft-wares for modeling. The cracking
behavior of concrete along with ductile behavior of steel necessitates sophisticated
material models, in order to trace the response of reinforced concrete structures in non-
linear post cracking and post yield stages.
2.5 DEFICIENCIES OF CURRENT METHODS FOR DESIGN OF WAFFLE
SLABS
2.5.1 Equivalent Thickness Method
Equivalent thickness is an approximate method, finding a thickness, by an empirical
formula, which give more or less same stiffness as that of waffle slabs. It concentrates
only on the deflection of the slab.
2.5.2 Orthotropic Plate Theory
Orthotropic plate theory is originally developed for ideal elastic material such as steel
and plates of uniform thickness. It involves solution of differential equations and is very
complicated for multi-span waffle slabs.
2.5.3 ACI Approach
ACI methods assume waffle slabs and solid slabs behave in the same manner under
load. The presence of ribs and its effect is not well addressed. Increased ratio of flexural
to torsional rigidity is ignored. The concept of shear and bending moment is more
complex to visualize than the flow of axial stresses as we do in strut-and-tie model.

42
2.5.4 Numerical Methods
Even though finite element methods predict the stress distribution in the elastic range
of slabs, it is difficult to obtain the ultimate strength of slab since the behavior changes
drastically after cracking of concrete. It needs dedicated software to model steel and
concrete separately with the nonlinearity in the material behavior well defined. Modeling
of waffle slab as a finite element model is difficult due to its geometry and the inter
connectivity of its ribs. Another drawback of numerical methods is that it is difficult to
correlate the detailing aspect of the slab with a given stress distribution.
2.6 ACI PROVISIONS FOR DESIGN OF WAFFLE SLABS
2.6.1 General Provisions for Waffle Slab
ACI includes waffle slab in joist construction and describes waffle slab as monolithic
combination of regularly spaced ribs and a top slab arranged to span in two orthogonal
directions. ACI-318-08 specifies recommendations for spacing of ribs, thickness of ribs
and maximum depth of ribs and slab thickness as follows:
Ribs shall be not less than 4 inch in width, and shall have a depth of not more than 3-1/2
times the minimum width of rib. Clear spacing between ribs shall not exceed 30 inch.
Slab thickness shall be not less than one-twelfth the clear distance between ribs and not
less than 2 inch.
Effective width of flange that can be considered as part of the rib is given by Figure
2.10 and is subjected to a maximum as center to center of ribs. Also minimum
reinforcement for ribs and slabs, maximum spacing of reinforcement and minimum
concrete cover are specified as per relevant sections.

43
2.6.2 Strength of Struts, Ties and Nodal Zones
As per ACI-318, design of struts, ties and nodal zones shall be based on
φ Fn > Fu where, (2.18)
Fn is the nominal strength of the respective element and Fu is the factored load.
Strength reduction factor, φ for all elements of Strut-and-tie models such as struts, ties,
nodal zones, and bearing areas is given as 0.75.
Figure 2.10: Effective Width of Slab (ACI-318, 2008)
2.6.2.1 Struts
Nominal compressive strength of strut is given by
Fns = fce * Acs (2.19)
Where, Acs is the area of cross section of the strut.
The effective compressive strength of the concrete, fce, in a strut shall be taken as
fce = 0.85 βs f’c where, (2.20)
βs = 1.0 for prismatic struts (struts of uniform cross sectional area over its
length)

44
= 0.75 for bottle shaped struts with reinforcement provided as per ACI
= 0.60 for bottle shaped struts without reinforcement for normal weight
concrete.
2.6.2.2 Ties
The nominal strength of a non pre-stressed Tie shall be taken as
Fnt = Ats * fy where, (2.21)
Ats = Area of tensile steel reinforcement
fy = Yield strength of steel reinforcement
2.6.2.3 Nodes
Nominal compressive strength of nodal zone is given by
Fnn = fce * Anz (2.22)
Where, Anz is the area of cross section of the nodal zone perpendicular to the line of
action of force.
The effective compressive strength of the concrete, fce, in a nodal zone shall be taken as
fce = 0.85 βn f’c where, (2.23)
βn = 1.0 for CCC nodal zones (Node anchoring struts / bearing plate)
= 0.80 for CCT nodal zones (Node anchoring only one tie)
= 0.60 for CTT nodal zones (Node anchoring more than one tie)

CHAPTER 3
STRUT-AND-TIE MODEL (STM) FOR SIMPLY SUPPORTED
WAFFLE SLAB
3.1 DEVELOPMENT OF TRUSS MODEL FOR WAFFLE SLAB
Waffle slab is modeled as a finite element model using STAAD-Pro in order to obtain
the distribution of stresses and to see the effect of ribs in waffle slabs. The whole slab is
modeled as an isotropic material. Stress distribution of the finite element model is shown
in Figure 3.1. The slab is simply supported on all four edges. Corner lifting is allowed.
It is clear from the model that ribs play the major role in the load carrying
mechanism. The local bending of slabs causes some variation in the stress distribution
and hence is different from two way slabs of uniform thickness. Additional stresses at
corners and more shear stresses near center of each side due to corner lifting are also
evident from the model.
The whole slab can be transformed to a series of T sections in orthogonal directions
which are acting together in the load carrying mechanism. The top slab helps to maintain
equilibrium and maintain the relative locations of the T beams under loads. Load transfer
takes place at each intersection for strain compatibility between ribs in both directions.
Generally slab thickness is very less for waffle slabs and its torsional stiffness is
negligible compared to the bending stiffness of the T-sections.
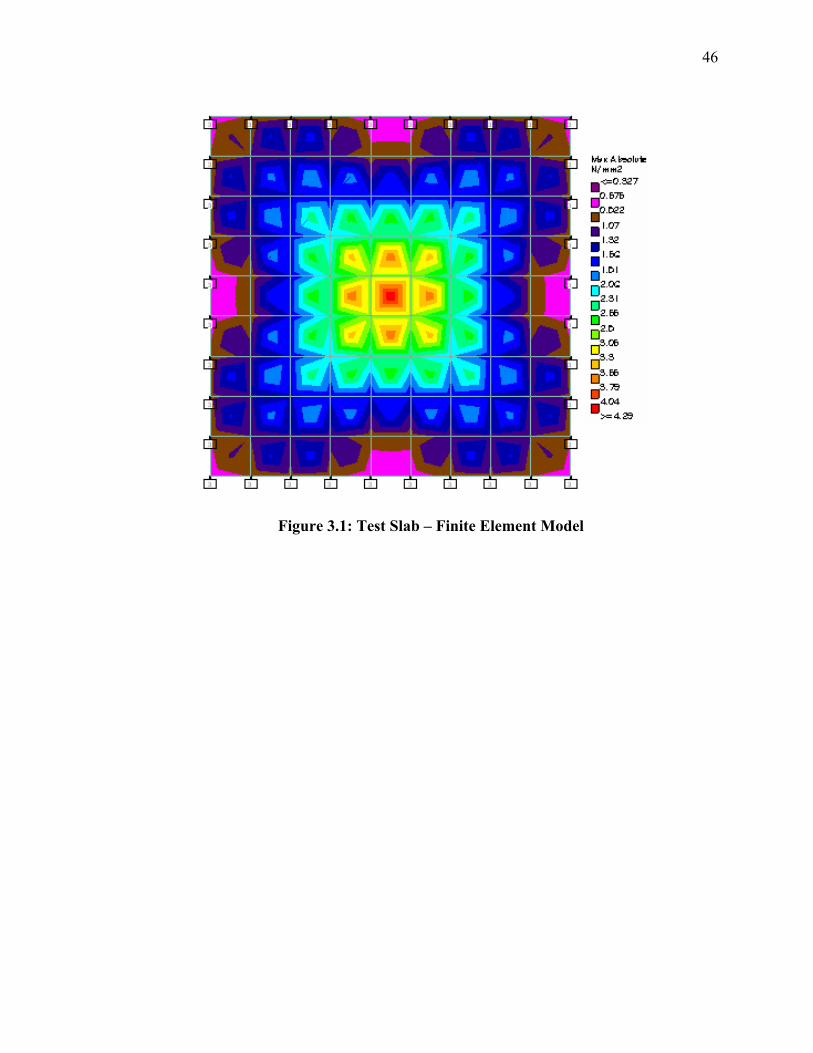
46
Figure 3.1: Test Slab – Finite Element Model

47
Waffle slab comprises a regular pattern of voids at the bottom which forms an
orthogonal grid of ribs. The intersecting ribs at close interval transform the whole waffle
slab as a D-region which means the conventional beam theory cannot be applied. Strut-
and-tie method is generally used for structures with D-regions. Waffle slab is inherently
3-D in nature and hence 3-D strut-and-tie model is required for the analysis and design.
3.2 PROPOSED STRUT-AND-TIE MODEL FOR WAFFLE SLAB
The proposed strut-and-tie model is developed for waffle slabs, simply supported on
all four edges. Corner lifting is allowed. Figure 3.2 shows the proposed model.
Compression only supports provided at peripheral nodes at bottom.
In the proposed strut-and-tie model, the waffle slab is modeled as a 3-D truss.
Individual ribs in each direction forms two dimensional trusses as shown in Figure 3.3.
Each truss is connected with perpendicular trusses at rib intersections. Cross bracing is
provided at top to simulate the action of concrete slab as shown in Figure 3.4.
Top chord consists of prismatic concrete strut which is within the top slab. Bottom
chord consists of the main reinforcement at the ribs. Vertical member corresponds to ties
which can be either stirrups or concrete tension ties, in case of waffle slabs without
stirrup reinforcement. Inclined members consist of bottle shaped concrete struts. The
intersection of struts and ties are represented by nodal zones.

48
Figure 3.2: Proposed 3D strut-and-Tie Model
Figure 3.3: STM Model for Single Rib– Even and Odd Number of Waffle Openings

49
Figure 3.4: STM Model-Top Bracing

50
3.3 CALCULATING PROPERTIES OF MEMBERS OF THE PROPOSED
MODEL
The member sizes for the proposed model are calculated as follows:
3.3.1 Top Chord
Top chord consists of prismatic concrete strut with thickness less than the slab
thickness. The temperature steel provided in the slab can be ignored. Generally in slabs,
the top chord does not govern and hence minimum thickness is recommended for
optimization. When the thickness is reduced, the truss depth increases and hence axial
forces in top chord and bottom chord reduce. However the thickness should be selected
such that it is sufficient to avoid compression failure for the top struts. It can be obtained
accurately by 2-3 trials. However for practical design purposes, a larger thickness like
half the slab thickness can be conservatively considered since its effect of member forces
is not significant.
The width of top chord is calculated based on ACI formulae for effective width of
flanges that can be considered along with web for “T” sections which is minimum of the
following: a) width of rib + 8 times slab thickness b) width of rib + 2 times clear height
of rib below slab c) center to center spacing of rib.
Area of top chord is calculated as thickness * width. Area calculated separately for
ribs in each direction if waffle spacing is different. Area of nodal zone for top chord is
same as area of top strut. Modulus of elasticity of concrete is calculated as per ACI
formula, based on the compressive strength of concrete, f’c. A linear stress strain curve is
used for concrete.

51
3.3.2 Bottom Chord
Bottom chord consists of steel reinforcement. Actual area of steel, based on number
of reinforcement bars and diameter of bars, is provided in the model. An idealized
bilinear stress strain curve is used for steel for calculating the ultimate load carrying
capacity of the test slabs. However for design purpose, a linear stress strain curve is
sufficient since stresses are not allowed beyond the yield point.
For checking allowable stress for nodal zones, the area of nodal zone is calculated as
width of nodal zone * thickness of nodal zone. Width of nodal zone is two times the
effective cover of bottom reinforcement. Thickness of nodal zone is same as rib
thickness.
3.3.3 Vertical Members
For waffle slabs with stirrups provided in the rib, vertical member consists of stirrup
reinforcement provided at the intersection of ribs. Stirrups provided in both directions can
be added. Actual area of steel, based on number of stirrup legs and diameter of bars, is
provided in the model. Modulus of elasticity of steel is used for slabs with stirrups.
For waffle slabs without stirrups, vertical member consists of concrete tension ties.
The concrete at intersection of ribs and a portion of concrete surrounding is effective. The
area of vertical member is calculated as Rib width * Rib width + Rib width * effective
depth. Modulus of elasticity of concrete is used for slabs without stirrups.

52
3.3.4 Diagonal Members
Diagonal member consists of bottle shaped concrete strut with thickness same as rib
thickness. The width of diagonal member is calculated separately at top and bottom ends
of the strut separately and minimum is used for the design.
Width of diagonal member = Rib width * sin θ + chord thickness * cos θ
The calculation at bottom end is as shown in Figure 3.5. lb is the rib thickness and wt
is the width of bottom tie. “θ " is the angle that diagonal strut makes with bottom tie.
Area of diagonal member is calculated as thickness * width. Area is calculated separately
for ribs in each direction if waffle spacing is different. Area of nodal zone for diagonal
strut is same as area of the strut. Modulus of elasticity of concrete is considered as was
considered for top strut.
3.3.5 Bracing Members
Bracing member consists of prismatic concrete strut with thickness same as slab
thickness. The width of bracing member is calculated as follows:
Width of bracing member = rib width * sin α + rib width * cos α Where,
α – angle of inclination of bracing with X-axis
Area of bracing member is calculated as thickness * width. Modulus of elasticity of
concrete considered for bracing also.
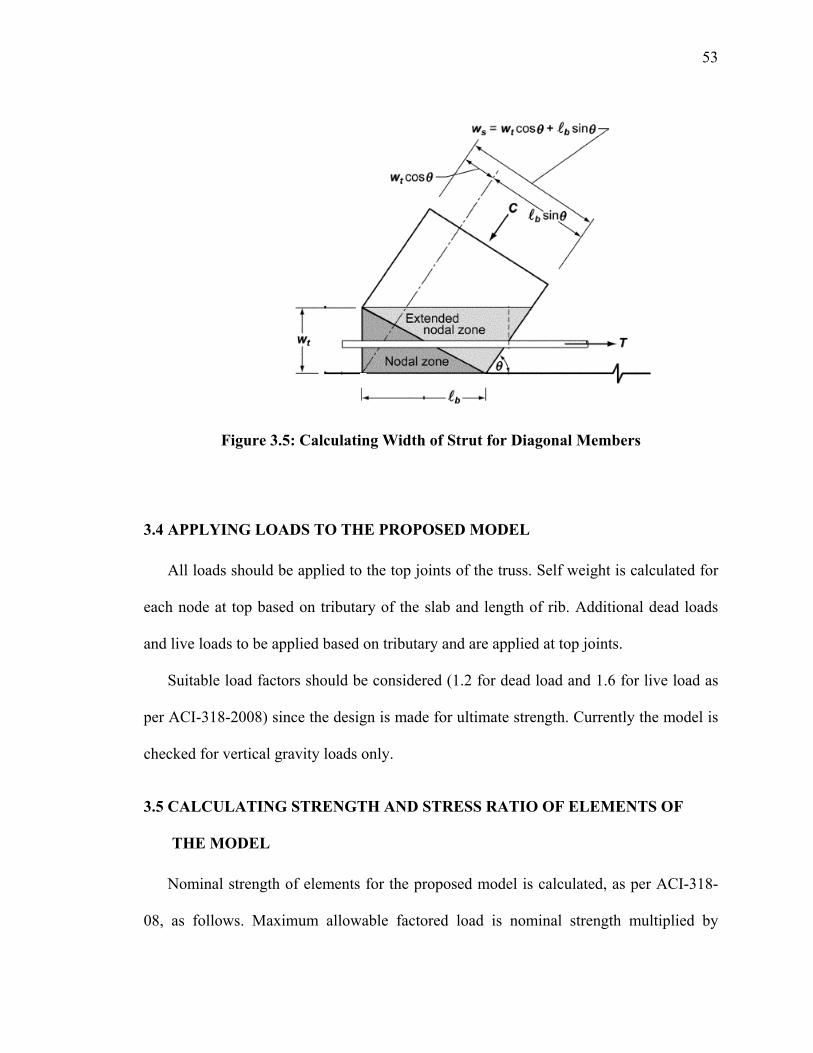
53
Figure 3.5: Calculating Width of Strut for Diagonal Members
3.4 APPLYING LOADS TO THE PROPOSED MODEL
All loads should be applied to the top joints of the truss. Self weight is calculated for
each node at top based on tributary of the slab and length of rib. Additional dead loads
and live loads to be applied based on tributary and are applied at top joints.
Suitable load factors should be considered (1.2 for dead load and 1.6 for live load as
per ACI-318-2008) since the design is made for ultimate strength. Currently the model is
checked for vertical gravity loads only.
3.5 CALCULATING STRENGTH AND STRESS RATIO OF ELEMENTS OF
THE MODEL
Nominal strength of elements for the proposed model is calculated, as per ACI-318-
08, as follows. Maximum allowable factored load is nominal strength multiplied by

54
strength reduction factor φ (= 0.75 for all elements as per ACI-318). Stress ratio is the
ratio of actual force in the member / Maximum allowable factored load.
3.5.1 Top Chord
Top chord is a prismatic concrete strut and nominal strength is calculates as
Fns = fce * Acs where, Acs is the area of cross section of the strut.
The effective compressive strength of the concrete, fce, in a strut shall be taken as
fce = 0.85 βs f’c where,
βs = 1.0
3.5.2 Bottom Chord
Bottom chord is steel reinforcement and nominal strength is calculated as
Fnt = Ω Ats fy where,
Ats = Area of tensile steel reinforcement
fy = Yield strength of steel reinforcement
Ω = Over strength factor of 1.25
Over strength factor considered for the bottom reinforcement, considering sharing of
loads between ribs as is done in other methods with strips.
3.5.3 Vertical Members
For waffle slabs with stirrups provided in the rib, vertical member is stirrup
reinforcement and nominal strength is calculates as
Fnt = Ats * fy where,
Ats = Area of tensile steel reinforcement (stirrups)
fy = Yield strength of steel reinforcement

55
For waffle slabs without stirrups, vertical member is concrete tension ties and nominal
strength is calculates as follows
Fnt = fte * Act
Where, Act is the area of cross section of the concrete tie.
The effective tensile strength of the concrete, fte, in the concrete tension tie shall be taken
as
fte = βt fct where,
βt = 0.6 (Considered for concrete tension tie)
Direct tension capacity of concrete, fct , is considered as 0.33 (f’c)1/2 (Mpa) and 4 (f’c)1/2
in psi.
3.5.4 Diagonal Members
Diagonal member consists of a bottle shaped concrete strut and nominal strength is
calculates as follows
Fns = fce * Acs where, Acs is the area of cross section of the strut.
The effective compressive strength of the concrete, fce, in a strut shall be taken as
fce = 0.85 βs f’c where,
βs = 0.75 with stirrups provided in the ribs
= 0.60 without stirrups in the ribs
3.5.5 Bracing Members
Bracing member is a prismatic concrete strut and nominal strength is calculates as
Fns = fce * Acs where, Acs is the area of cross section of the strut.
The effective compressive strength of the concrete, fce, in a strut shall be taken as
fce = 0.85 βs f’c where,

56
βs = 1.0
3.5.6 Nodes
All top nodes are CCT nodal zones since only one tie (vertical member) is anchored
by these nodes. All bottom nodes are CTT nodal zones since two ties (vertical member
and bottom tie) are anchored by these nodes. Nominal compressive strengths of nodal
zones are calculated as follows:
Fnn = fce * Anz where, Anz is the area of cross section of the nodal zone
perpendicular to the line of action of force.
The effective compressive strength of the concrete, fce, in a nodal zone shall be taken as
fce = 0.85 βn f’c where,
βn = 0.80 for CCT nodal zones (Top nodes)
= 0.60 for CTT nodal zones (Bottom nodes)

CHAPTER 4
VALIDATION OF WAFFLE SLAB STM USING ANSYS
4.1 EXPERIMENTAL DATA USED FOR VALIDATION OF PROPOSED
MODEL
4.1.1 Description of Waffle Slabs Used for Experiment by Abdulwahab and Khalil
An experimental study of reinforced concrete waffle slabs with a square layout of ribs
was conducted by Abdulwahab and Khalil [13]. Tests to failure were carried out on Six
large-scale (1/4-in. scale) models with varied rib spacing and rib depth. The test program
was designed to investigate the effect of the rib spacing and the rib depth on the flexural
rigidity and strength of waffle slabs. In all tests, the slabs were simply supported along
the edges, at spans of 1500mm. Slabs were subjected to a central ‘‘patch’’ load over an
area of 300 * 300 mm as shown in Figure 4.1.
Concrete for the specimens was normal weight, with a mix proportion of 1:1.5:3 of
ordinary Portland cement: fine aggregate of maximum size of 4.75 mm: course aggregate
of maximum size of 6.7 mm with a water: cement ratio of 0.47. It was designed to
achieve a concrete cylinder compressive strength of about 30 MPa at 28 days.
Flexural reinforcement consisted of 8-mm-diameter smooth steel bars with yield
strength of 398 MPa. The bars were placed in the ribs with a clear cover of 8 mm. As
temperature and crack control reinforcement, wire mesh with an average diameter of 0.7
mm and mesh size of 25 mm was used. It was placed at the middle of the topping of the
waffle slabs (10 mm from the top).

58
The load was applied in a series of increments of 2.5–5kN, and the deflections and
strain measurements were recorded. After cracking, the crack location and development
was also recorded. The loading was continued to destruction to determine the mechanism
of failure. Figure 4.1 and Table 4.1 shows geometry of waffle slabs, loading arrangement,
and reinforcement details.
4.1.2 Experimental Results
Table 4.2 shows cracking, ultimate loads and mode of failure for tested specimens S1
to S6. Flexural cracking was observed at about 25–30% of the ultimate load. Waffle slabs
S4 to S1 in order, which have the same thickness and rib reinforcement but vary in the
number of ribs from 5 (S4) to 11 (S1), the load capacity increased and deflections
reduced as the rib spacing is reduced. Also the mode of failure is noted to change from
shear failure to flexural failure. Figure 4.2 shows crack patterns at bottom of the slab for
specimens S1 to S4.
For waffle slabs S6, S2 and S5 in order, have the same number of bays and
reinforcement but vary in the size of the ribs. The load capacity increased and deflections
reduced as we increase the rib size. However the mode of failure changed from flexural
failure to shear failure.

59
Figure 4.1: Geometry of Waffle Slabs, Loading Arrangement, and Reinforcement
Details
S – Rib spacing
h – Overall Depth
t – Top slab thickness
d – Effective depth
W – Rib width
f’c – Concrete compressive strength
TABLE 4.1: Geometry of Experimental Waffle Slabs
Specimen
f'c Mpa
S mm
t mm
W mm
h mm
S1
S2
S3
S4
S5
S6
31.3
32.0
31.4
28.9
29.9
29.1
136
167
214
300
167
167
20
20
20
20
20
20
52
52
52
52
57
47
95
95
95
95
125
65
1540
1540
AA
AA
1500
h
S
SECTION-AA
REINFORCEMENT DETAILS
th
W
8
d
WIRE MESH
0.7 DIA x 25MM
8MM BAR
300

60
TABLE 4.2: Experimental Results
Specimen
Pcrack
kN Pu-Test
kN Mode of Failure
S1 30 105 Flexural failure; cracks extended
toward corners
S2 20 81 Flexural failure; cracks extended
toward corners
S3 20 65
Mainly flexural failure; cracks extended
toward corners and edges; some shear
cracks
S4 20 48 Sudden punching shear failure; flexural
and shear cracks were formed
S5 40 120 Sudden punching shear failure with
slip-bond failure
S6 20 48 Flexural failure; cracks extended
toward corners

61
Figure 4.2: Crack Pattern for Experimental Slabs S1-S4

62
4.2 LINEAR MODEL TO FIND ALLOWABLE SAFE LOAD AS PER ACI-318
Linear strut-and-tie models, for the experimental slabs of Reference [13], are
constructed using STAAD Pro to find the proposed safe load carrying capacity as per
ACI. All slabs were modeled with linear material models and a static analysis
performed. This gives an indication of the factor of safety involved in the design.
4.2.1 Element Type and Material Models
Since all the members are subjected to axial loads only, they are specified as truss
members in STAAD. All elements are modeled as prismatic elements and area of each
strut-and-tie element is calculated and input in the model.
Both steel and concrete are considered as linear elastic materials as per ACI. At
stress levels limited by ACI provisions, this approximation is reasonable and gives
conservative results.
Modulus of elasticity of concrete is calculated as
Ec = 57000(f’c)1/2
Where, f’c is the 28 days compressive strength of concrete in psi which is measured
separately for each specimen. Poisson’s ratio of concrete is considered as 0.20.
For steel, modulus of elasticity, Es is takes as 200000 Mpa. Yield strength of
steel is considered as 398 Mpa. Poisson’s ratio of concrete is considered as 0.3.

63
4.2.2 Application of Loads
4.2.2.1 Self Weight
Self weight is calculated and applied as structural nodal loads at top nodes of the
model.
4.2.2.2 Concentrated Load
To stimulate the load at center over an area of 300X300, equal concentrated loads
applied on the four central nodes at top. The value of the load is incrementally
increased till one of the elements of the truss model reached its safe capacity as per
ACI. Strength reduction factors and over strength factors are applied to find the
proposed ultimate load.
4.2.3 Results of Linear Analysis Using STAAD
Figure 4.3 shows the geometry of truss model in STAAD. Figure 4.4 shows the force
distribution of one of the ribs at the center of the truss model at safe ultimate load of one
of the slabs (S2). The middle two ribs in both directions are loaded more and the bottom
reinforcement in these ribs reaching the ultimate stress at the failure load. The mode of
failure is bending failure since all other elements of the truss model except the bottom
reinforcement do not reach their allowable capacity.
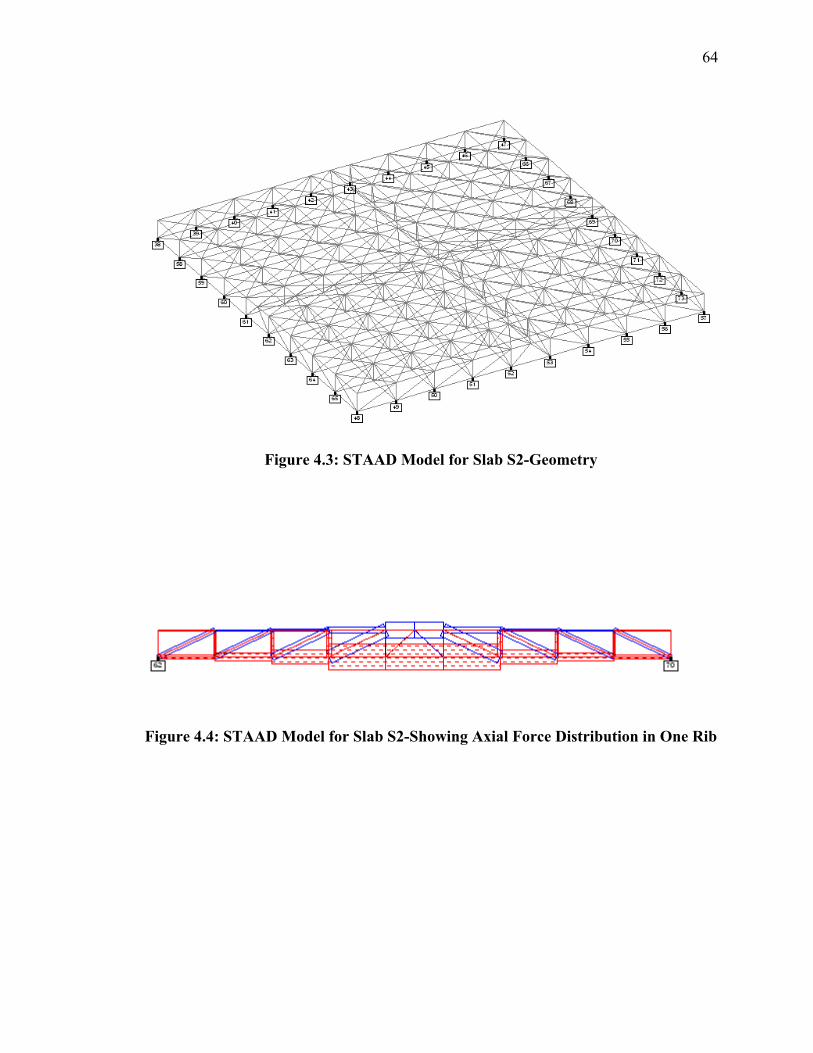
64
Figure 4.3: STAAD Model for Slab S2-Geometry
Figure 4.4: STAAD Model for Slab S2-Showing Axial Force Distribution in One Rib

65
4.3 PREDICTING ULTIMATE LOAD CAPACITY OF SLAB USING
NONLINEAR ANSYS MODEL
Nonlinear strut-and-tie models, for all the six experimental slabs, were constructed
using ANSYS software. The square slabs used in the experiments are simply supported
on four edges with corner lifting allowed. A load higher than the expected failure load is
applied. ANSYS analysis engine give converging solutions only up to failure load. It
gives the failure load as factor of the total load applied. Then the actual failure load is
applied instead of the higher load and stresses in various elements of the truss are plotted
using time-history post processing in ANSYS. The mode of failure can be predicted by
finding the type of element which reached the ultimate stress at this failure load.
4.3.1 Material Models Used for Non-linear Truss Model
For nonlinear strut-and-tie model, the basic constituents of reinforced concrete,
namely concrete and steel are modeled as nonlinear materials, since the slabs are loaded
up to failure. As the load is increased in the waffle slab, the stress in each element
increases. The distribution of loads on each element of the truss will be proportional to its
strain and its relative stiffness. However in a non-linear material model, since the
modulus of elasticity of both steel and concrete varies as the stress level is increased, the
relative stiffness of various elements in a model varies as the load is increased. This
results in redistribution of forces after each load increment.
4.3.1.1 Concrete Used for Top Chord Members and Bracing
Top chord members are prismatic struts and are in the compression zone of the
simply supported slab. This allows the concrete in these struts to reach its ultimate
compressive strength without any reduction for tension softening.
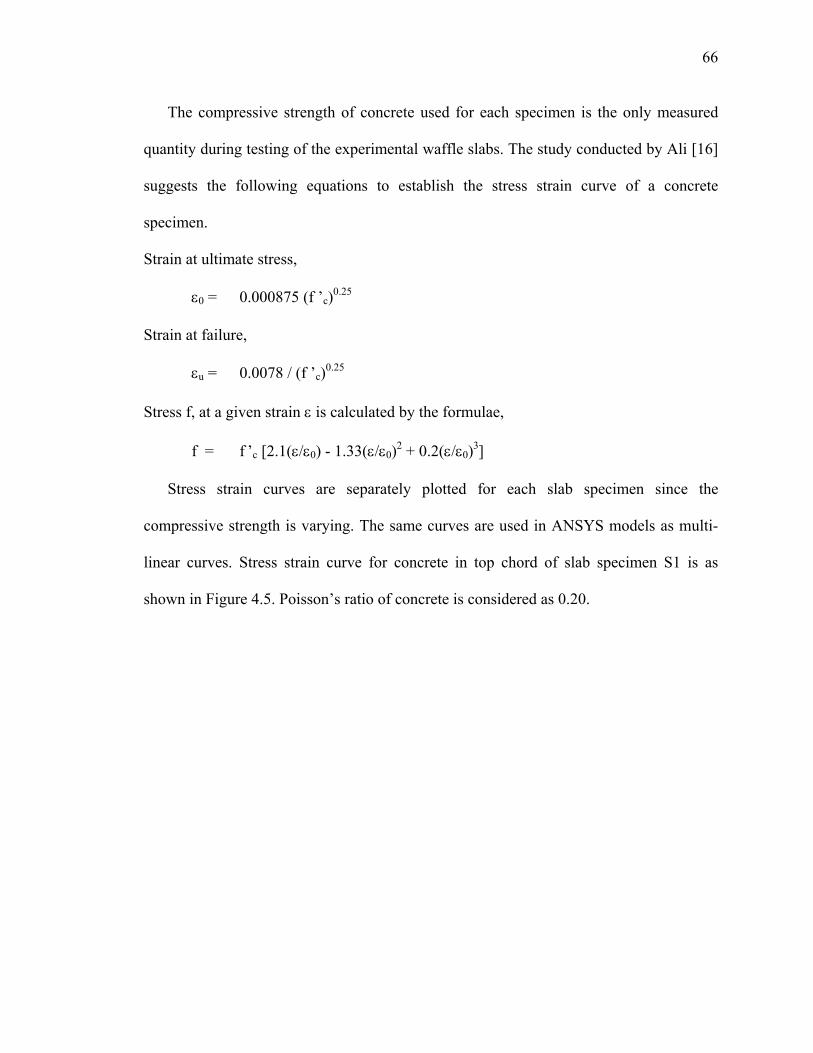
66
The compressive strength of concrete used for each specimen is the only measured
quantity during testing of the experimental waffle slabs. The study conducted by Ali [16]
suggests the following equations to establish the stress strain curve of a concrete
specimen.
Strain at ultimate stress,
ε0 = 0.000875 (f ’c)0.25
Strain at failure,
εu = 0.0078 / (f ’c)0.25
Stress f, at a given strain ε is calculated by the formulae,
f = f ’c [2.1(ε/ε0) - 1.33(ε/ε0)2 + 0.2(ε/ε0)3]
Stress strain curves are separately plotted for each slab specimen since the
compressive strength is varying. The same curves are used in ANSYS models as multi-
linear curves. Stress strain curve for concrete in top chord of slab specimen S1 is as
shown in Figure 4.5. Poisson’s ratio of concrete is considered as 0.20.

67
Figure 4.5: Stress Strain Curve Used for Concrete in Top Chord Strut - Slab S1
Bracing members are modeled for the stability of the 3-D truss and maintain
relative locations of the nodes at deformed shape. The forces on these members are
negligible compared to forces in other truss members and are not governing. Hence
concrete models used for top chord members are used for the bracing members also.
4.3.1.2 Concrete Used for Diagonal Members
Diagonal members are bottle shaped struts and the transverse tensile strains in the
concrete will develop cracks which results in reducing the compressive strength of
concrete near ultimate stage. An efficiency factor of 0.7 is used to account for the tension
softening. Stress strain curve for concrete in diagonal member of slab specimen S1 is as
shown in Figure 4.6. Poisson’s ratio of concrete is considered as 0.20.
0.0000
5.0000
10.0000
15.0000
20.0000
25.0000
30.0000
35.0000
0.00000
0.00050
0.00100
0.00150
0.00200
0.00250
0.00300
0.00350
S TRAIN
STRESS (MPa)

68
4.3.1.3 Concrete used for Vertical Tension ties
For the experimental slabs, since there is no stirrup reinforcements provided, the
concrete at intersection of ribs act as vertical tie. The direct tension capacity of concrete
is considered as 0.33 * (f’c)½ Mpa. (4 * (f’c)½ psi). A linear stress strain curve is used for
concrete in tension. Poisson’s ratio of concrete is considered as 0.20.
Figure 4.6: Stress Strain Curve Used for Concrete in Diagonal Strut - Slab S1
4.3.1.4 Steel Used as Bottom Chord Reinforcement
The steel used for the main reinforcement of the experimental slabs are with nominal
yield strength of 398 Mpa. This is of the range of grade 60 steel (414 Mpa). Based on the
experimental study conducted by Mirza and MacGregor [22] on Grade 60 (Fy = 60 ksi)
bars, they concluded that the average yield strength is 69 ksi and ultimate strength is 109
ksi. This in the order of 1.15 Fy for actual yield stress and 1.8 Fy for ultimate strength.
Also they found the average strain at ultimate stress as 0.12 and average strain at rupture
as 0.21.
0.0000
5.0000
10.0000
15.0000
20.0000
25.0000
0.00000 0.00050 0.00100
S TRAIN
STRESS (MPa)

69
For the steel used as bottom reinforcement, the actual yield strength is considered as
457.7 MPa and ultimate strength as 716.4 MPa. The average strain at ultimate stress and
rupture are considered as 0.12 and 0.21, respectively.
The following stress strain curve as shown in Figure 4.7 is used for reinforcement in
the nonlinear model for all specimens. Poisson’s ratio of steel is considered as 0.3.
Figure 4.7: Stress Strain Curve Used for Steel Reinforcement
Material model used for reinforcement is multi-linear model with modulus of
elasticity, Es = 200000 MPa up to yield point. For the nonlinear parts of the curve at
strain hardening and beyond ultimate strength is plotted based on a 3rd degree curve
derived from curve fitting as follows:
y = 0.2x3-1.33x2+2.13x where,
y = (σ-457.7)/(716.4-457.7)
0.00800, 457.7
0.12000, 716.4
0.0
100.0
200.0
300.0
400.0
500.0
600.0
700.0
800.0
0.00000 0.05000 0.10000 0.15000 0.20000 0.25000
Strain
Stre
ss (M
Pa)

70
x = (ε-0.008)/(0.12-0.008)
For any value of strain ε, beyond the perfect plastic region, the corresponding stress σ
can be evaluated using the above equation.
4.3.1.5 Efficiency Factors Used for Non Linear Model
Table 4.3 shows the efficiency factors considered for nonlinear material models of
struts and nodal zones which are used to calculate ultimate strength.
TABLE 4.3: Efficiency Factors Used for Strut-and-Tie Elements and Nodes
Element / Node Efficiency Factor
Node for Bottom Tie-CTT 0.70
Top strut - Prismatic strut 1.00
Top strut-Node -CCT 0.80
Diagonal strut - Bottle shaped 0.70
Diagonal strut- Node Top - CCT 0.80
Diagonal strut- Node Bottom - CTT 0.70
4.3.2 Element Type and Element Property
Since all the members are subjected to axial loads only, Link-8 elements which are
dedicated to 3-D axial elements in ANSYS used for modeling for all elements.
Area of each strut-and-tie element is calculated and input in the model as “real
constants” in ANSYS. Separate real constants are defined for each type of elements such
as top chord, bottom chord, vertical members, diagonal members and bracing members.

71
Material models are defined as multi-linear models as mentioned earlier for each type
of elements. Each member of the truss model is assigned with corresponding element
type, real constant and material model.
4.3.3 Application of Loads
Self weight is calculated and applied as structural nodal loads at top nodes of the
model. To stimulate the test load at center over an area of 300mm * 300mm, the load is
divided into 4 equal concentrated loads and applied on the four central nodes at top.
4.3.4 Deflected Shape and Force Distribution
Figure 4.8 shows the deflected shape of the truss model at ultimate failure load of one
of the slabs, S1. The deflected shape shows maximum deflection at center as expected
and corner lifting is evident.
Figure 4.9 shows the force distribution of the truss model at ultimate failure load the
slab S1. The middle two ribs in both directions are loaded more and the bottom
reinforcement in these ribs reaching the ultimate capacity at the failure load.

72
Figure 4.8: ANSYS Model for Slab S1-Showing Deflected Shape

73
Figure 4.9: ANSYS Model for Slab S1-Showing Force Distribution

74
4.4 COMPARING RESULTS FROM STRUT-AND-TIE MODELS WITH TEST
RESULTS
4.4.1 Strength of Slabs
Table 4.4 shows details of the slabs and a comparison between proposed load as per
ACI strut-and-tie recommendations (Load-ACI) , predicted load capacity as per non-
linear ANSYS model (Load-NL) and actual capacity of the slab under test (Test load).
The predicted loads as per Nonlinear Strut-and-tie models are in good agreement with the
actual test loads.
Waffle slabs S1 to S4, which have the same thickness and rib reinforcement but vary
in the number of ribs from 5 (S4) to 11 (S1), the load capacity increased as expected,
similar to test results as the spacing of ribs is reduced. Figure 4.10 shows the comparison
of allowable loads proposed as per ACI, predicted ultimate loads as per nonlinear model
and test results of slabs S1-S4. These curves show the effect of rib spacing on the
additional live load carrying capacity.
Waffle slabs S6, S2 and S5 in order, have the same number of bays and reinforcement
but vary in the size of the ribs. The load capacity increased as the rib size is increased, as
expected similar to test results. Figure 4.11 shows the comparison of allowable loads
proposed as per ACI, predicted ultimate loads as per nonlinear model and test results of
slabs S6, S2 and S5. These curves show the effect of rib size.

75
TABLE 4.4: Comparison of Results of STM Models with Test Results
Slab f'c Overall Rib Rib STM STM TEST Percentage Factor
Depth Width SpacingLoad-ACI
Load-NL Load Difference of
mm mm mm Pu in
kN kN kN ## Safety
S1 31.3 95.0 52.0 136.4 35.2 92.2 105.0 12.2 2.98
S2 32.0 95.0 52.0 166.7 31.0 79.1 81.0 2.3 2.61
S3 31.4 95.0 52.0 214.3 27.2 65.0 65.0 0.0 2.39
S4 28.9 95.0 52.0 300.0 23.6 47.8 48.0 0.4 2.03
S5 29.9 125.0 57.0 166.7 43.0 109.6 120.0 8.7 2.79
S6 29.1 65.0 47.0 166.7 19.0 47.7 48.0 0.7 2.53
## - Percentage difference between Test and ANSYS Strut-and-tie model.

76
Figure 4.10: Comparison of Results - STM with Test Results -Slabs S1 to S4
(Effect of Rib Spacing)
Figure 4.11: Comparison of Results - STM with Test Results -Slabs S6, S2 and S5
(Effect of rib size)
92.2
79.1
65.0
47.8
35.231.0
27.223.6
105.0
81.0
65.0
48.0
0.0
20.0
40.0
60.0
80.0
100.0
120.0
0.0 100.0 200.0 300.0 400.0
WAFF L E S PAC ING (MM)
LIVE LOAD (KN)
120.0
81.0
48.0
109.59
79.12
47.6843.0
31.0
19.0
0.0
20.0
40.0
60.0
80.0
100.0
120.0
140.0
0.0 50.0 100.0 150.0
DEP TH OF WAFF L E S L AB (MM)
LIVE LOAD (KN)

77
4.4.2 Mode of Failure
Mode of failure was predicted for experimental slabs S1 to S6 based on the non-linear
strut-and-tie model. Maximum force in each type of member is noted from the nonlinear
model under failure load. The ultimate capacity of each type of member and nodal zone is
evaluated. The ratio of the actual force to ultimate capacity will give the stress ratio.
Critical member or nodal zone responsible for failure is the one with stress ratio 1.0. All
other members will have stress ratio less than 1.0. Tables 4.5 to 4.10 show the forces in
each type of member and nodal zone, its ultimate strength and stress ratio for slabs S1 to
S6 respectively.
The type of member which is critical will predict the mode of failure. If the bottom
reinforcement is critical, the mode of failure is flexural failure. If the diagonal strut near
the support fails first, it is a flexural shear failure. If the diagonal strut near the
concentrated load fails first, it is a sudden punching shear failure. The bottom nodal zone
failure causes slip-bond failure.
Generally top chord failure will not occur unless a very small depth of compression
block is considered. This should be avoided by increasing the depth of compression block
and slab thickness if required. A vertical member failure is due to the shear forces and is
not recommended as well. Sufficient stirrup reinforcement to be provided in case this is
the failure mode.
As the waffle spacing is increased from S1 to S4, the mode of failure changes from
flexural to shear, as in the experimental results. For the slabs S1 and S2, failure of
reinforcement governs the strength as per the nonlinear model which indicates flexural
failure, as noted in the experimental results.

78
TABLE 4.5: Mode of Failure for Slab S1
Member Area Strength Forces Ratio Mode of mm2 (kN) (kN) Failure Diagonal Strut near Load 1794 -39.31 -23.25 0.59
Nodal Zone for Diagonal-
Top 1794 -44.92 -23.25 0.52
Nodal Zone for Diagonal-
Bottom 2426 -53.15 -23.25 0.44
Top Strut 1364 -42.68 -22.08 0.52
Nodal Zone for Top Strut 1364 -34.15 -22.08 0.65
Bottom Tie 50.26 36.00 36.00 1.00 Flexural
Nodal Zone for Bottom Tie 1248 27.34 20.20 0.74
Vertical Tie 10816 20.11 11.54 0.57
Expected mode of failure: Flexural Failure
TABLE 4.6: Mode of Failure for Slab S2
Member Area Strength Forces Ratio Mode
of mm2 (kN) (kN) Failure
Diagonal Strut near Load 1617 -36.22 -23.42 0.65
Nodal Zone for Diagonal-
Top 1617 -41.40 -23.42 0.57
Nodal Zone for Diagonal-
Bottom 2277 -50.99 -23.42 0.46
Top Strut 1667 -53.33 -23.66 0.44
Nodal Zone for Top Strut 1667 -42.67 -23.66 0.55
Bottom Tie 50.26 36.00 36.00 1.00 Flexural
Nodal Zone for Bottom Tie 1248 27.96 21.15 0.76
Vertical Tie 10816 20.34 9.91 0.49
Expected mode of failure: Flexural Failure

79
TABLE 4.7: Mode of Failure for Slab S3
Member Area Strength Forces Ratio Mode of mm2 (kN) (kN) Failure
Diagonal Strut near Load 1414 -31.07 -30.03 0.97 Punching Shear
Nodal Zone for Diagonal-
Top 1414 -35.51 -30.03 0.85
Nodal Zone for Diagonal-
Bottom 2098 -46.11 -30.03 0.65
Top Strut 2020 -63.43 -20.82 0.33
Nodal Zone for Top Strut 2020 -50.74 -20.82 0.41
Bottom Tie 50.26 36.00 36.00 1.00 Flexural
Nodal Zone for Bottom Tie 1248 27.43 16.36 0.60
Vertical Tie 10816 20.14 10.01 0.50
Expected mode of failure: Flexural Failure with punching shear cracks
TABLE 4.8: Mode of Failure for Slab S4
Member Area Strength Forces Ratio Mode of mm2 (kN) (kN) Failure
Diagonal Strut near Load 1184 -23.95 -23.94 1.00 Punching Shear
Nodal Zone for Diagonal-
Top 1184 -27.37 -23.94 0.87
Nodal Zone for Diagonal-
Bottom 1888 -38.20 -23.94 0.63
Top Strut 2020 -58.38 -18.41 0.32
Nodal Zone for Top Strut 2020 -46.70 -18.41 0.39
Bottom Tie 50.26 36.00 32.80 0.91
Nodal Zone for Bottom Tie 1248 25.25 23.20 0.92
Vertical Tie 10816 19.33 6.03 0.31
Expected mode of failure: Sudden Punching Shear Failure near Load
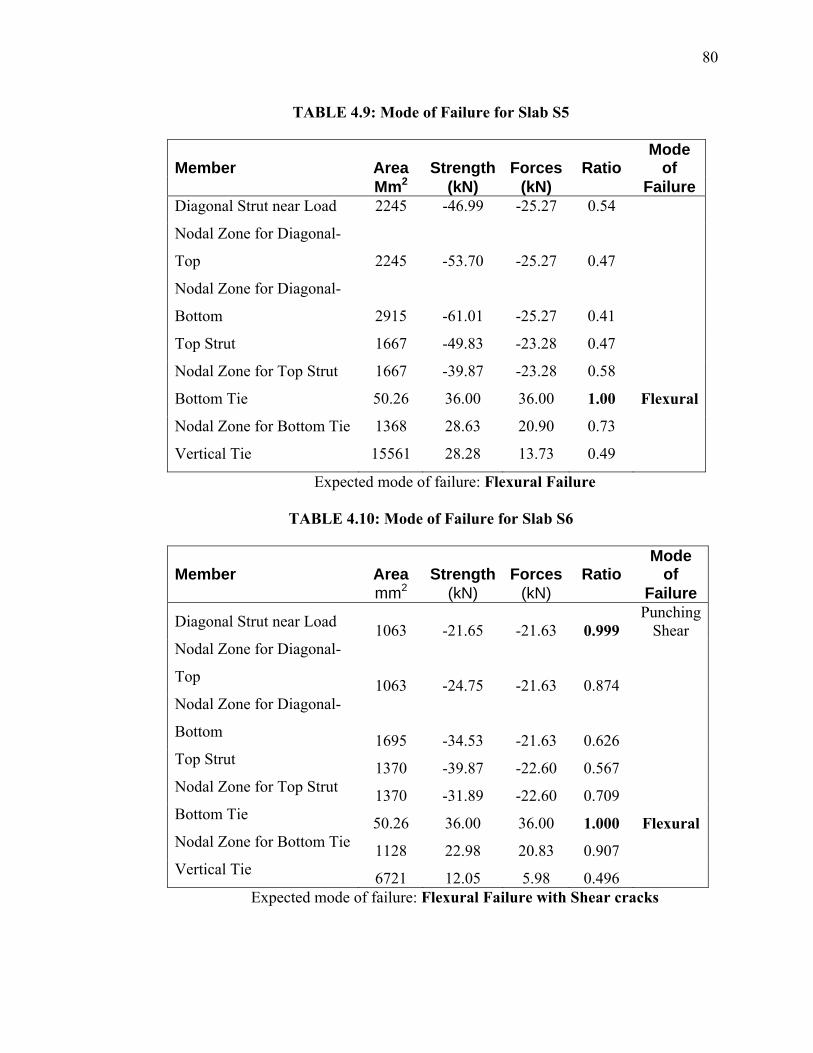
80
TABLE 4.9: Mode of Failure for Slab S5
Member Area Strength Forces Ratio Mode
of Mm2 (kN) (kN) Failure Diagonal Strut near Load 2245 -46.99 -25.27 0.54
Nodal Zone for Diagonal-
Top 2245 -53.70 -25.27 0.47
Nodal Zone for Diagonal-
Bottom 2915 -61.01 -25.27 0.41
Top Strut 1667 -49.83 -23.28 0.47
Nodal Zone for Top Strut 1667 -39.87 -23.28 0.58
Bottom Tie 50.26 36.00 36.00 1.00 Flexural
Nodal Zone for Bottom Tie 1368 28.63 20.90 0.73
Vertical Tie 15561 28.28 13.73 0.49
Expected mode of failure: Flexural Failure
TABLE 4.10: Mode of Failure for Slab S6
Member Area Strength Forces Ratio Mode
of mm2 (kN) (kN) Failure
Diagonal Strut near Load 1063 -21.65 -21.63 0.999 Punching
Shear Nodal Zone for Diagonal-
Top 1063 -24.75 -21.63 0.874 Nodal Zone for Diagonal-
Bottom 1695 -34.53 -21.63 0.626 Top Strut 1370 -39.87 -22.60 0.567 Nodal Zone for Top Strut 1370 -31.89 -22.60 0.709 Bottom Tie 50.26 36.00 36.00 1.000 Flexural Nodal Zone for Bottom Tie 1128 22.98 20.83 0.907 Vertical Tie 6721 12.05 5.98 0.496
Expected mode of failure: Flexural Failure with Shear cracks

81
For slabs S3, flexural failure is the predicted failure mode as obtained in actual test.
Also the diagonal strut is reaches a stress ratio of 0.97 which indicates occurrence of
shear cracks as obtained in the actual test.
For slab S4, failure of diagonal bottle shaped strut near the load limit the load
carrying capacity of the slab, which is a clear indication of a sudden punching shear
failure as obtained in experimental result.
The predicted mode of failure for slabs S5 is flexural failure as per nonlinear strut-
and-tie model. However the actual failure during test was reported as sudden failure due
to slip bond failure. Also in this slab, the second highest stress ratio was for bottom nodal
zone which represent slip bond failure. The difference may be due to higher strength of
actual reinforcement, more cover for reinforcement or a local failure occurred during the
test due to removal of some portion of concrete surrounding the reinforcement during
crack propagation.
For slabs S6, flexural failure is the predicted failure mode as obtained in actual test.
However the diagonal strut is reaching a stress ratio of 0.99 which indicates occurrence
of shear cracks as well which was not reported in the literature.
4.4.3 Time-History Post Processing -Load Deflection Curves
Using the time history post processing in ANSYS, load deflection curves are plotted
for experimental slabs S1 to S6. The sudden drop in the stiffness beyond 50 % of the
ultimate capacity gives a good indication of the safe range of loading and justifies the
factor of safety provided by ACI strut-and-tie provisions. Figure 4.12 to 4.17 shows load
–deflection curves for slabs S1 to S6 respectively. The value shows deflection in meters
and time shows the factor of failure load.

82
Figure 4.12: Load-Deflection Curves for Slabs S1
Figure 4.13: Load-Deflection Curves for Slabs S2

83
Figure 4.14: Load-Deflection Curves for Slabs S3
Figure 4.15: Load-Deflection Curves for Slabs S4

84
Figure 4.16: Load-Deflection Curves for Slabs S5
Figure 4.17: Load-Deflection Curves for Slabs S6

85
A sudden drop in stiffness of slab S4 is noted which has larger rib spacing and mode
of failure is shear failure. As the ribs are spaced closer, better redistribution of forces take
place after yielding of reinforcement and the load deflection curve will be a smooth
curve.
4.4.4 Time-History Post Processing -Load Distribution between Ribs
The time history post processing in ANSYS gives a good insight on the load carrying
mechanism and distribution of forces during each load increment. The force at bottom
reinforcement at center of each rib is plotted. It clearly shows the yield point of
reinforcement in each rib and the redistribution of forces after the yield point. Also the
distribution of forces till the first yielding of the middle rib is more or less proportional to
its distance from support, with center rib carrying the maximum forces. However after
yielding of main reinforcement, since the stiffness of the ribs drops significantly, the ribs
which are away from the center start taking a major contribution of the additional load
and finally at ultimate stages, the variation of forces shared by ribs reduces to a
minimum.
Figure 4.18 to 4.23 shows force in bottom reinforcement at center of rib for each rib
for slabs S1 to S6 respectively. Rib1 is the rib near center and Rib2 the next and so on.
Yield capacity of the reinforcement is 23 kN and its ultimate capacity is 36 kN.
Figure 4.18 shows force in bottom reinforcement at center of rib for slab S1. As the load
increases, the axial forces in bottom reinforcement of ribs increase for all the ribs.
However since the axial force in reinforcement of the rib near center of the slab (Rib-1) is
more and it is evident that it carries more load. The distribution to other ribs is
proportional to its distance from center up to yielding of the first rib.

86
The yielding of reinforcement in Rib 1 takes place at about 47% of the predicted
capacity. Since the stiffness of reinforcement drastically reduced after yielding, the
further increase in load is mainly shared by other ribs which are not yet yielded. This is
clear from the drastic reduction in slope for the curve for Rib 1 and increase in slope for
other ribs.
The yielding of reinforcement in Rib 2 takes place at about 58% of the predicted
capacity. Further increase in load is mainly shared by other ribs which are not yet
yielded. This is clear from the drastic reduction in slope for the curve for Rib 2 and
increase in slope for ribs 3 to 5.
Rib 3 and Rib4 of slab S1 reached the yield point almost at the same time at around
67% of the predicted capacity. At this point the only rib left is Rib5 without yielding and
which is away from the center concentrated load. The overall stiffness of the slab also
reduces drastically at this point. Since load needs to be transferred to the exterior ribs and
to supports, rib 1 to 4 share more load till the reinforcement in Rib 1 reaches its ultimate
strength which is the limit of strength for slab also.
Figure 4.18 clearly shows the redistribution of forces between ribs after yielding and
at the time of failure, force in reinforcement for ribs 2 to 4 are very close to ultimate.
Even in rib 5 which is away from the center, the force in reinforcement is yielded and
reached around 73% of the ultimate capacity.
Figures 4.19, 4.20 and 4.21 show the force in bottom reinforcement at center of ribs
for slabs S2, S3 and S4 respectively. The difference is that due to increase in rib spacing,
the number of ribs is less. Since the number of ribs are less and spaced apart, there is not

87
much scope for redistribution and resulted in a lower failure load as obtained by
experimental results as we increase rib spacing to a larger value.
Since the mode of failure is shear failure for slab S4, even the reinforcement at
middle rib directly under the load itself is not reached its ultimate capacity. The axial
stress in the diagonal member radiating away from the concentrated load reached its
ultimate strength at failure load, which indicates a sudden punching shear failure as
obtained in experiment.
For slabs S6, S2 and S5 in order, the number of ribs is same due to the same rib
spacing and load distribution to ribs is more or less same as can be seen in Figures 4.23,
4.19 and 4.23, respectively. However the capacity of the slab increased as the rib size is
increased, matching the experimental results.

88
Figure 4.18: Force in Bottom Reinforcement at Center of Ribs-Slab S1
Figure 4.19: Force in Bottom Reinforcement at Center of Ribs-Slab S2
0.00
5.00
10.00
15.00
20.00
25.00
30.00
35.00
40.00
0.00 0.20 0.40 0.60 0.80 1.00 1.20
LOAD FACTOR
LOA
D IN
REI
NFO
RC
EMEN
T (K
N)
Rib-1Rib-2Rib-3Rib-4Rib-5
0.00
5.00
10.00
15.00
20.00
25.00
30.00
35.00
40.00
0.00 0.20 0.40 0.60 0.80 1.00 1.20
LOAD FACTOR
LOA
D IN
RE
INFO
RCE
ME
NT (K
N)
Rib1
Rib2
Rib3
Rib4
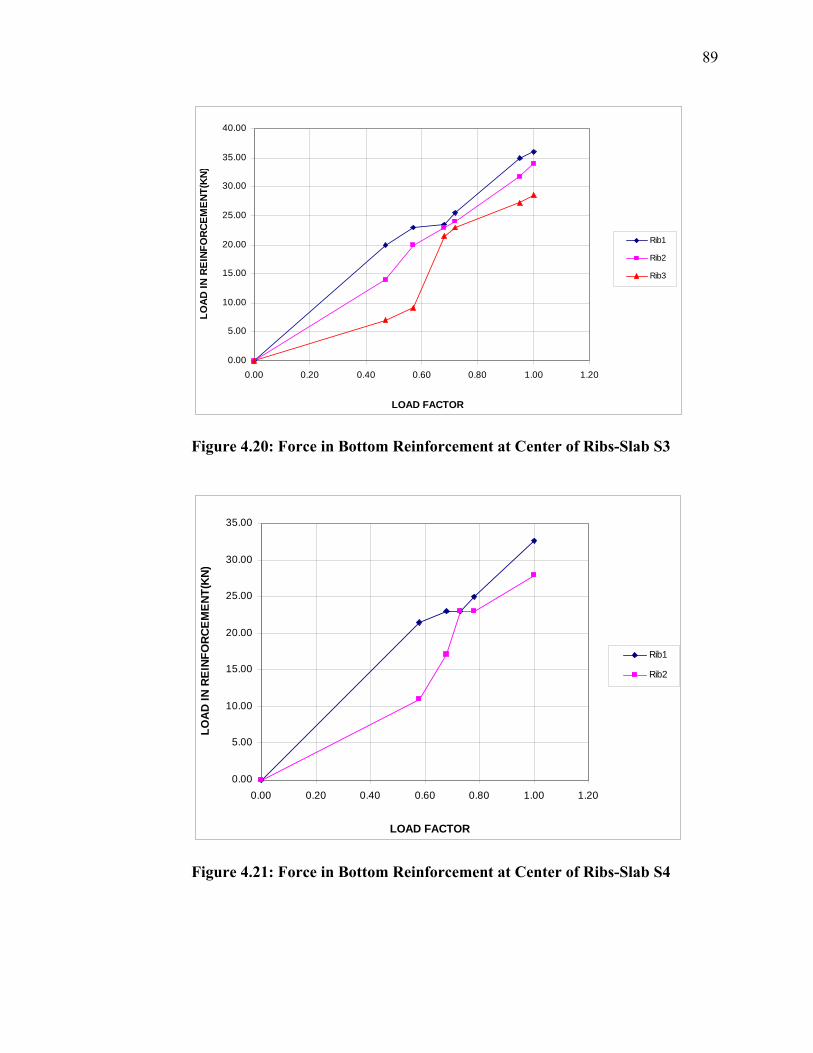
89
Figure 4.20: Force in Bottom Reinforcement at Center of Ribs-Slab S3
Figure 4.21: Force in Bottom Reinforcement at Center of Ribs-Slab S4
0.00
5.00
10.00
15.00
20.00
25.00
30.00
35.00
40.00
0.00 0.20 0.40 0.60 0.80 1.00 1.20
LOAD FACTOR
LOAD
IN R
EINF
ORC
EMEN
T(KN
)
Rib1
Rib2
Rib3
0.00
5.00
10.00
15.00
20.00
25.00
30.00
35.00
0.00 0.20 0.40 0.60 0.80 1.00 1.20
LOAD FACTOR
LOAD
IN R
EINF
ORC
EM
ENT(
KN)
Rib1
Rib2

90
Figure 4.22: Force in Bottom Reinforcement at Center of Ribs-Slab S5
Figure 4.23: Force in Bottom Reinforcement at Center of Ribs-Slab S6
0.00
5.00
10.00
15.00
20.00
25.00
30.00
35.00
40.00
0.00 0.20 0.40 0.60 0.80 1.00 1.20
LOAD FACTOR
LOAD
IN R
EIN
FORC
EM
ENT
(KN)
Rib1
Rib2
Rib3
Rib4
0.00
5.00
10.00
15.00
20.00
25.00
30.00
35.00
40.00
0.00 0.20 0.40 0.60 0.80 1.00 1.20
LOAD FACTOR
LOAD
IN R
EINF
ORC
EM
ENT(
KN)
Rib1
Rib2
Rib3
Rib4
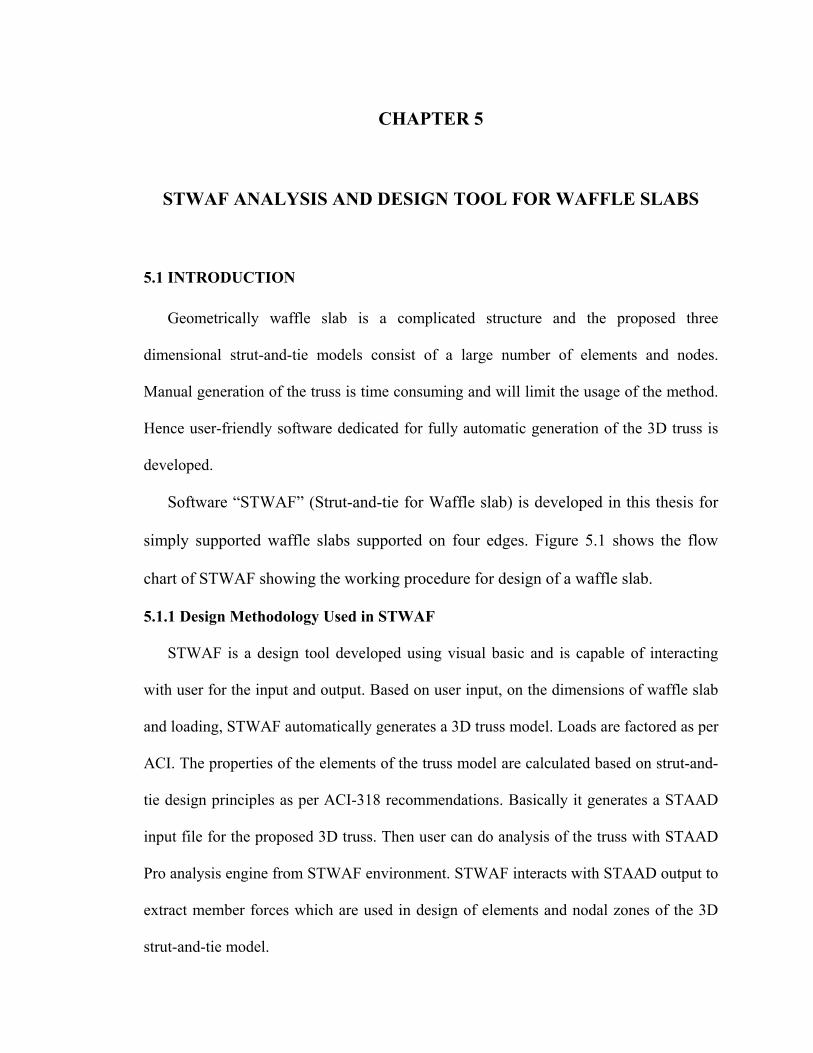
CHAPTER 5
STWAF ANALYSIS AND DESIGN TOOL FOR WAFFLE SLABS
5.1 INTRODUCTION
Geometrically waffle slab is a complicated structure and the proposed three
dimensional strut-and-tie models consist of a large number of elements and nodes.
Manual generation of the truss is time consuming and will limit the usage of the method.
Hence user-friendly software dedicated for fully automatic generation of the 3D truss is
developed.
Software “STWAF” (Strut-and-tie for Waffle slab) is developed in this thesis for
simply supported waffle slabs supported on four edges. Figure 5.1 shows the flow
chart of STWAF showing the working procedure for design of a waffle slab.
5.1.1 Design Methodology Used in STWAF
STWAF is a design tool developed using visual basic and is capable of interacting
with user for the input and output. Based on user input, on the dimensions of waffle slab
and loading, STWAF automatically generates a 3D truss model. Loads are factored as per
ACI. The properties of the elements of the truss model are calculated based on strut-and-
tie design principles as per ACI-318 recommendations. Basically it generates a STAAD
input file for the proposed 3D truss. Then user can do analysis of the truss with STAAD
Pro analysis engine from STWAF environment. STWAF interacts with STAAD output to
extract member forces which are used in design of elements and nodal zones of the 3D
strut-and-tie model.

92
Maximum force for each type of elements is calculated by STWAF from the output of
the analysis. Nominal strength of each type of element is calculated as per ACI-318-2008
based on cross sectional area, material properties and effective stress factors. Safe
ultimate loads are calculated by multiplying by strength reduction factor. Stress ratio for
each type of element is calculated as ratio of maximum force under factored loads in the
element to the safe ultimate load. Similarly stress ratios for nodal zones are also
calculated.
For a safe design, all stress ratios should be less than 1.0. Also by comparing the
stress ratios of each type of element, the mode of failure can be predicted. The data can
be revised partly or completely, till all elements are safe and desired mode of failure is
obtained for the slab.
5.1.2 Salient Features of STWAF
The main features of STWAF can be summarized as follows:
• User friendly input.
• ACI-318 Strut-and-tie provisions are incorporated in calculating sizes of
struts, ties and nodal zones.
• Fully automated generation of 3D truss.
• STWAF automatically interacts with STAAD Pro to generate STAAD
model.
• User interference is allowed on generated 3D truss model to apply
additional concentrated loads, if any.
• Analysis using STAAD Pro analysis engine.

93
• User can view analysis results directly from STAAD Pro graphic
environment, even though it is not needed for practical design.
• STWAF automatically extracts member forces from STAAD output for
the design of strut-and-tie elements and nodal zones.
• The member force for each type of element is displayed and maximum
governing force is reported.
• ACI-318 strut-and-tie provisions are incorporated in calculating strength
of struts, ties and nodal zones.
• Design of each type element and nodal zone can be obtained from
STWAF.
• A summary of stress ratios is reported for the ease of optimization process.
• The stress ratios of different types of elements and nodal zones indicate
the expected mode of failure.
• The whole design process is faster and will result in fully optimized design
with known mode of failure under overloading.
• Detailing aspects of the slab like min concrete cover, minimum thickness
of ribs etc. can be obtained by few trials.
• STWAF allows the designer with relatively small effort to gain a better
understanding of the likely performance of the structure and then to make
design changes to improve performance under ultimate loads.

94
Figure 5.1: Flow Chart for STWAF
START STWAF
INPUT PARAMETERS
OF WAFFLE
GENERATION OF 3D TRUSS MODEL
ANALYSIS USING STAAD
EXTRACT ANALYSIS RESULTS
CALCULATE ALLOWABLE STRENGTH FOR MEMBERS
AND NODAL ZONES
STRESS RATIO < 1.0 ?
NEED FURTHER OPTIMIZATION ?
EXIT STWAF
CALCULATE STRESS RATIO FOR MEMBERS
AND NODAL ZONES
YES
NO
NO
YES

95
5.2 USER INPUTS IN STWAF
The main window of the program contain drop down menu which gives access to all
windows for user inter face as shown in Figure 5.2.
The inputs are divided into different windows and are arranged in order for easy
access as shown in Figure 5.3 to 5.7. The material properties are specified in general
input window as shown in Figure 5.3. Dimensions of the waffle slab like slab thickness,
overall depth and span in X and Y directions are provided in second window as shown in
Figure 5.4.
Rib thickness and number of waffle openings in X and Y directions are specified in
next window as shown in Figure 5.5. The clear depth of ribs below slab and center to
center spacing of ribs will be calculated and displayed by the program. The rib thickness
is considered same for all ribs in X and Y directions. Rib spacing need not be same in
each direction and is calculated based on span and number of waffle openings.

96
Figure 5.2: Main Window of STWAF
Figure 5.3: General Input Window

97
Figure 5.4: Input Window for Overall Size of Waffle Slab
Figure 5.5: Input Window for Rib Size and Spacing
98
Reinforcement details and depth of compression block is specified in next window as
shown in Figure 5.6. The diameter and number of bars can be specified in each rib for
both directions separately. The area of reinforcement will be calculated and displayed
automatically.
For conventional methods, the slab is divided in to middle strip and column strip and
bending moment is calculated for the entire width of each strip. This bending moment is
equally distributed to all the ribs in the strip, which allows redistribution of forces. An
over strength factor is specified in STWAF for the bottom reinforcement and its default
value is 1.25. The user is able to edit this factor and can reduce it, in case he needs to be
conservative.
STWAF can handle waffle slabs with and without stirrup reinforcement. However the
default design is kept with reinforcement since it is a normal practice to provide stirrups
in the ribs. The diameter and number of stirrup legs in one rib can be specified. Same
stirrups are considered in both directions in current version of STWAF. The area of
reinforcement will be calculated and displayed automatically.
Effective cover of reinforcement is to be specified which is the sum of clear cover
and diameter of main reinforcement. The same effective cover is considered in both X
and Y directions to maintain the same depth for the entire 3D truss.
Depth of compression block to be specified which should be less than the slab
thickness. The thickness of top chord will be considered as this depth and a minimum
thickness is recommended for optimization. When this is reduced, the truss depth
increases and hence axial forces in top chord and bottom chord reduce. However the
depth should be selected such that it is sufficient to avoid compression failure for the top

99
struts. It can be obtained accurately by 2-3 trials. However for practical design purposes,
a larger depth like half the slab thickness can be conservatively considered since its effect
on truss depth is very less thereafter.
Figure 5.6: Window for Reinforcement Details and Depth of Compression Block

100
Current version of STWAF supports uniformly distributed loads as shown in Figure
5.7. The program is capable of calculating its self weight. However if the user wants to
input it as a uniformly distributed load (UDL) including weight of finishes etc, it is
possible as well. It is also possible to generate its self weight by program and give
additional dead load as uniformly distributed dead load. Live load is given as UDL. Load
factors will be considered by program as per ACI and displayed separately for deflection
and strength.
Figure 5.7: Window for Load Input

101
5.3 GENERATION OF 3D TRUSS MODEL AND ITS ANALYSIS
STAAD Pro analysis engine is used by STWAF for the linear analysis of the 3D
truss. Once the input is over, user can go to Analysis menu and click “Run STAAD”
command. This generates STAAD input file for the 3D truss and opens STAAD Pro
environment automatically, provided the STAAD Pro is installed in the System. Then
user can run analysis from STAAD Pro.
User can use all features of STAAD Pro to view input and output. Even some
additional concentrated loads can be added in the model but will be the responsibility of
the user on the accuracy of the load and its location. Also it should be in compatible units
of the existing loads.
Once analysis is over, user can close STAAD Pro. STWAF interacts with STAAD
output file automatically to extract member forces.
5.4 CALCULATING MAXIMUM FORCES, STRENGTH AND STRESS RATIO
FOR EACH MEMBER TYPE
Maximum force for each type of elements is calculated by STWAF from the output of
the analysis. The axial force for each type of element and maximum force can be
displayed from the program from Analysis menu similar to the one shown in Figure 5.8,
which is made for bottom chord members in X direction and is used for calculating
reinforcement for ribs in X direction. Similarly forces in all types of elements can be
displayed.

102
Figure 5.8: Display of Member Force for Bottom Chord in X-direction

103
5.5 DESIGN OF ELEMENTS AND NODAL ZONES OF STRUT-AND-TIE
MODEL
Nominal strength of each type of element is calculated as per ACI-318-2008 based on
cross sectional area, material properties and effective stress factors. Safe ultimate loads
are calculated by multiplying by strength reduction factor. In case of bottom
reinforcement, an additional over strength factor is used to distribute the stress to more
ribs. A dimensionless parameter termed stress ratio is introduced, given by ratio of
maximum force under factored loads in the element to its safe strength. Similarly stress
ratios for nodal zones are also calculated.
Figure 5.9 shows design of bottom chord, which is the main reinforcement. Design of
reinforcement in X and Y directions are shown in same window. Similarly design of
other elements and nodal zones can be displayed. Typical outputs of SWAF for design of
various elements and nodal zones are shown in Chapter 6.
A stress ratio greater than 1.0 indicates that the member or nodal zone is not having
the sufficient strength, as obtained by the code provisions, to resist the external load. For
a given external load and material properties, the size of member has to be increased to
keep all stress ratios less than 1.0 for safe design.
For ease of optimization the summary of design is displayed in a separate window.
Stress ratios for all elements and nodal zones are displayed in this window as shown in
Figure 5.10.

104
Figure 5.9: Design of Bottom Reinforcement
Figure 5.10: Design Summary Showing Stress Ratios for All Types of Elements

105
Also by comparing the stress ratios of each type of element, the mode of failure can
be predicted. The data can be revised partly or completely, till all elements are safe and
desired mode of failure is obtained for the slab.
5.6 DEFLECTION OF WAFFLE SLABS
Strut-and-tie method is used to predict the ultimate strength of waffle slab. The
deflection calculated using strut-and-tie is always more than actual deflection due to
many factors. The cracked concrete surrounding the reinforcement is contributing to the
stiffness even though its contribution on the strength is negligible. Also Strut-and-tie
model consider only the mechanism of the waffle slab at the failure load and ignores the
load path. To overcome this deficiency, in STWAF, a separate module is added to
calculate the deflection of simply supported waffle slabs using orthotropic plate theory as
shown in Figure 5.11. This helps to check serviceability requirements as well.

106
Figure 5.11: STWAF – Deflection of Waffle Slab

107
5.7 EXAMPLE OF STRENGTH PREDICTION PROCESS USING PROPOSED
STM
Design of a 9m * 9m simply supported slab, as shown in Figure 5.12, was done using
Strut-and-Tie method to illustrate the procedure adopted by STWAF for generation of
3D-truss model and to calculate strength and stress ratio of various elements of the strut-
and-tie model. The analysis of the truss is done using STAAD Pro.
Figure 5.12: Arrangement of Ribs- 9m * 9m slab

108
5.7.1 Details of Waffle slab Used as Example
Span of Waffle in X and Z direction = 9000 mm
Yield strength of Reinforcement, fy = 415 Mpa
Compressive strength of concrete, f'c = 20 Mpa
Density of concrete = 25 kN/m3
Spacing of ribs in each direction, S = 900 mm
Top slab Thickness, t = 60 mm
Waffle Rib thickness, W = 200 mm
Overall depth of waffle slab including top slab,
h = 500 mm
Effective cover of bottom reinforcement = 50 mm
Live load = 7 kN/m2
5.7.2 Trial Values Assumed for Design
Depth of compression block (< slab thickness),
a = 25 mm
Diameter of bottom reinforcement = 20 mm
Number of bars at bottom = 2 Nos
Area of bottom reinforcement = 628.32 mm2
Diameter of stirrup reinforcement = 8 mm
Number of legs per stirrup = 2 Nos
Area per stirrup = 100.531 mm2
5.7.3 Calculation for Geometry of the Truss
Depth of truss = h-(a/2)-effective cover

109
= 438 mm
Co-ordinates in X and Z directions are based on the rib spacing and in Y direction
based on depth of truss.
5.7.4 Calculation of Size of Elements and Nodes of the 3D Truss Model
Since slab is square and same rib spacing provided in X and Z directions, elements
sizes are same in both directions
5.7.4.1 Bottom Chord
Bottom chord consists of reinforcement and area is same as the area of reinforcement.
Area of Bottom chord = Area of bottom reinforcement = 628.32 mm2
Width of Nodal zone at bottom = 2 * Effective cover
= 100 mm
Thickness of nodal zone = Rib thickness
= 200 mm
Area of bottom chord nodal zone = 20000 mm2
5.7.4.2 Top Chord
Top chord is a concrete prismatic strut
Width of top chord is the minimum of the following:
a) Rib thickness + 8 * Thickness of top slab = 680 mm
b) Rib thickness + 2 * Projection of rib below slab = 1080 mm
c) Center to center spacing of ribs = 900 mm
Width of top chord = 680 mm
Depth of top chord = Depth of compression block (a)
= 25 mm

110
Area of top chord = 17000 mm2
Area of top chord nodal zone = Area of top chord
= 17000 mm2
5.7.4.3 Vertical Members
Vertical members consists of stirrup reinforcement and area is sum of the area of stirrups
in X and Y directions
Area of Vertical = 201.06 mm2
Area of Nodal zone = Rib thickness X * Rib thickness Y
= 200 * 200 = 40000 mm2
5.7.4.4 Diagonal Members
Diagonal members are concrete bottle shaped struts
Thickness of diagonal member = Rib thickness
= 200 mm
Width of diagonal member to be calculated at top and bottom and minimum is
considered.
Angle of diagonal strut with bottom reinforcement,
θ = 25.94 degree
Width of diagonal member at top
= Rib width * Sin θ + Top chord thickness * Cos θ
= 110.0 mm
Width of diagonal member at bottom
= Rib width * Sin θ + Bottom chord nodal zone width * Cos θ
= 177.4 mm

111
Width of diagonal = 110.0 mm
Area of diagonal member = 21992 mm2
Area of diagonal at nodal zone = Area of diagonal
= 21992 mm2
5.7.4.5 Bracing Members
Bracing members are concrete prismatic struts
Depth of bracing member = Slab thickness
= 60 mm
Width of bracing member to be calculated as follows
Angle of bracing strut with X axis α = 45.00 degree
Width of bracing member
= Rib thickness * Sin α + Rib thickness * Cos α
= 282.8 mm
Area of Bracing member = 16971 mm2
5.7.5 Load Distribution to Nodes of Truss Model
Dead load is calculated based on tributary of slab and length of rib in each direction.
Live load is calculated based on tributary. All loads are applied to nodes at top as shown
in Table 5.1.
5.7.6 Generation of STAAD Input and Output Files
Figure 5.13 shows the generated truss model in STAAD Pro. Factored loads are used
for design of various elements and nodal zones. Load combinations used as per ACI 318-
08 as, 1.2 Dead load + 1.6 Live load

112
The analysis is carried out to obtain the member forces, which is used to check the
stress ratios of the various elements and nodal zones of the truss.
TABLE 5.1: Load Distribution to Nodes of the Truss Model
Load Interior node Edge node Corner Node
kN kN kN Dead Load 4.735 3.358 2.284
Live Load 5.670 2.835 1.418
Figure 5.13: STAAD Pro Strut-and-Tie Model - 9m * 9m Slab
5.7.7 Calculation of Strength and Stress Ratio of Elements and Nodes
Allowable strength of Struts, Ties and Nodal zones are calculated based on ACI -318
Strut-and-tie provisions. Strength reduction Factor φ is considered as 0.75 for all
elements and nodal zones as per ACI.
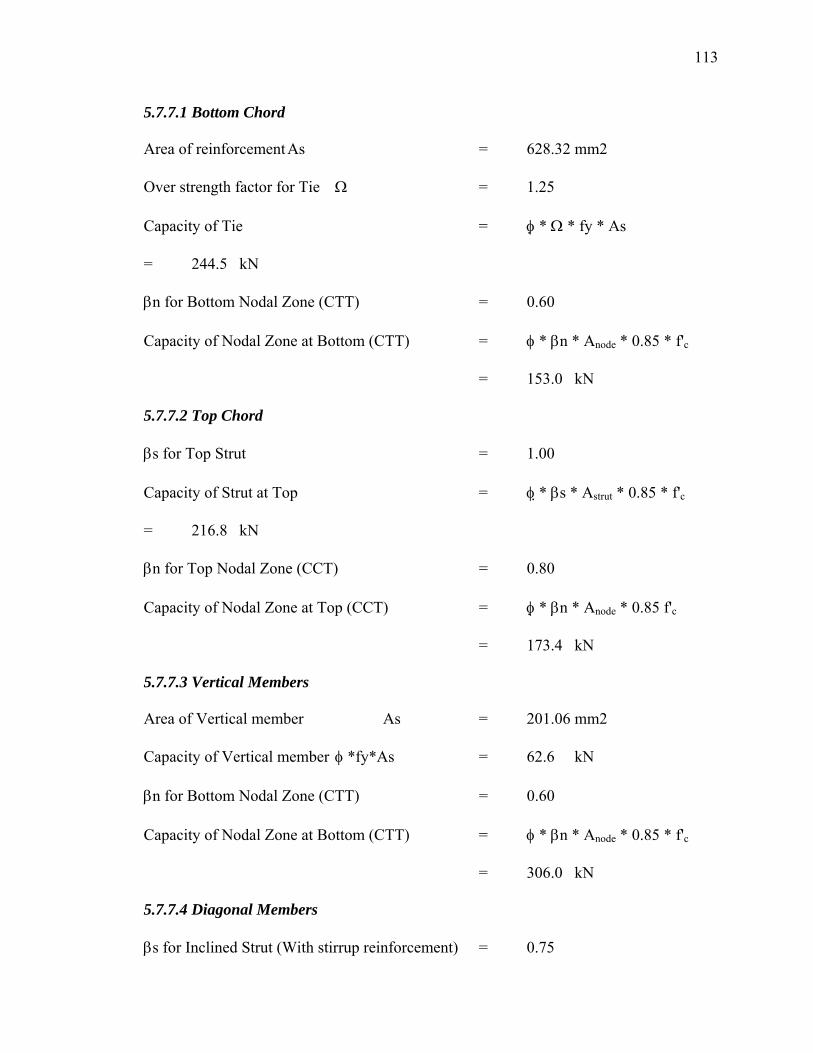
113
5.7.7.1 Bottom Chord
Area of reinforcement As = 628.32 mm2
Over strength factor for Tie Ω = 1.25
Capacity of Tie = φ * Ω * fy * As
= 244.5 kN
βn for Bottom Nodal Zone (CTT) = 0.60
Capacity of Nodal Zone at Bottom (CTT) = φ * βn * Anode * 0.85 * f'c
= 153.0 kN
5.7.7.2 Top Chord
βs for Top Strut = 1.00
Capacity of Strut at Top = φ * βs * Astrut * 0.85 * f'c
= 216.8 kN
βn for Top Nodal Zone (CCT) = 0.80
Capacity of Nodal Zone at Top (CCT) = φ * βn * Anode * 0.85 f'c
= 173.4 kN
5.7.7.3 Vertical Members
Area of Vertical member As = 201.06 mm2
Capacity of Vertical member φ *fy*As = 62.6 kN
βn for Bottom Nodal Zone (CTT) = 0.60
Capacity of Nodal Zone at Bottom (CTT) = φ * βn * Anode * 0.85 * f'c
= 306.0 kN
5.7.7.4 Diagonal Members
βs for Inclined Strut (With stirrup reinforcement) = 0.75

114
Capacity of Inclined Strut = φ * βs * Astrut * 0.85 * f'c
= 210.3 kN
βn for Bottom Nodal Zone (CTT) = 0.60
Capacity of Nodal Zone at Bottom (CTT) = φ * βn * Anode * 0.85 * f'c
= 168.2 kN
5.7.7.5 Bracing Members
βs for Bracing = 1.00
Capacity of Bracing = φ * βs * Astrut * 0.85 * f'c
= 216.4 kN
5.7.8 Results and Prediction of Mode of Failure
Table 5.2 shows the Factored forces from STAAD out put, the allowable strength
calculated as per ACI provisions and the stress ratio for various elements and nodal
zones. For bottom nodal zones the ultimate force for the design is the difference between
forces in adjacent ties as per ACI.
The output shows the stress ratio of bottom reinforcement as 0.98 which is very close
to 1.0 and stress ratios for all other elements are less which indicates the mode of failure
under overloading of the slab as flexural failure which is the desired behavior.
TABLE 5.2: Forces, Strength and Stress Ratios of Elements and Nodes
Bottom Tie Top Strut Inclined-Strut Vertical Tie
Member Node Member Node Member Node Member Node
Axial Force (kN) 240.5 99.9 75.4 75.4 111.2 111.2 32.4 32.4 Allowable Capacity (kN) 244.5 153.0 216.8 173.4 210.3 168.2 62.6 306.0
Stress Ratio 0.98 0.65 0.35 0.44 0.53 0.66 0.52 0.11

CHAPTER 6
PROPOSED STM VERSUS OTHER DESIGN METHODS FOR
WAFFLE SLABS
Design of a 9m * 9m simply supported slab was done using different design
methods to compare the results. The design was done using “SAFE” program, which
designs the slab using ACI methods. Also orthotropic plate theory was used to design
the waffle slab manually. Finally the design was carried out using Strut-and-tie
method using STWAF.
6.1 DETAILS OF THE 9M * 9M SLAB USED FOR COMPARISON OF DESIGN
METHODS
Span in X and Y directions are 9m. All four edges are simply supported and corner
lifting allowed. Grade of concrete considered as 20 MPa and grade of reinforcement as
415 Mpa. The details of the waffle slabs are shown in Fig 6.1. Slab is designed for a
uniformly distributed live load of 7.0 kN/m2. Self weight, of the slab is calculated as
5.846 kN/m2.

116
Effective Cover in
mm
Overall depth in
mm
Slab Thickness
in mm
Rib thickness
in mm
Rib Spacing in mm
50 500 60 200 900
Figure 6.1: Arrangement of Ribs- 9m * 9m slab

117
6.2 DESIGN OF 9M * 9M WAFFLE SLAB BY STRUT-AND-TIE METHOD
USING STWAF
STWAF is used for the design of the slab with strut-and-tie method. Figure 6.2 shows
the strut-and-tie model of the 9m * 9m waffle slab generated by STWAF.
The depth of compression block is considered as 25mm which is less than the slab
thickness of 60 mm and is sufficient to avoid failure of top strut and nodal zones. Figure
6.3 shows the calculation of strut sizes and Figure 6.4 shows properties of the elements of
the truss model calculated by STWAF.
Figure 6.5 to 6.11 shows the design of each type of elements and nodal zones of the
model. Strut-and-tie design provisions of ACI-318 are followed by STWAF.
Figure 6.12 shows the summary of the design which shows stress ratios of all types of
elements. The stress ratio of bottom chord (reinforcement) is the maximum and is the
governing element which restricts strength of the waffle slab. This means that the mode
of failure expected is flexural failure which is the desired mode of failure in case of
overloading. Also stress ratios of all other element are well within limits.

118
Figure 6.2: Strut-and-Tie Model for 9m * 9m Slab
Figure 6.3: Size of struts-Strut-and-Tie method for 9m * 9m Slab

119
Figure 6.4: Properties of elements-Strut-and-Tie method for 9m * 9m Slab
Figure 6.5: Design of Bottom Chord-Strut-and-Tie method

120
Figure 6.6: Design of Top Chord-Strut-and-Tie method
Figure 6.7: Design of Diagonal Strut-Strut-and-Tie method

121
Figure 6.8: Design of Vertical Tie-Strut-and-Tie method
Figure 6.9: Design of Node at Bottom-Strut-and-Tie method

122
Figure 6.10: Design of Node at Top-Strut-and-Tie method
Figure 6.11: Design of Node for Vertical Member-Strut-and-Tie Method
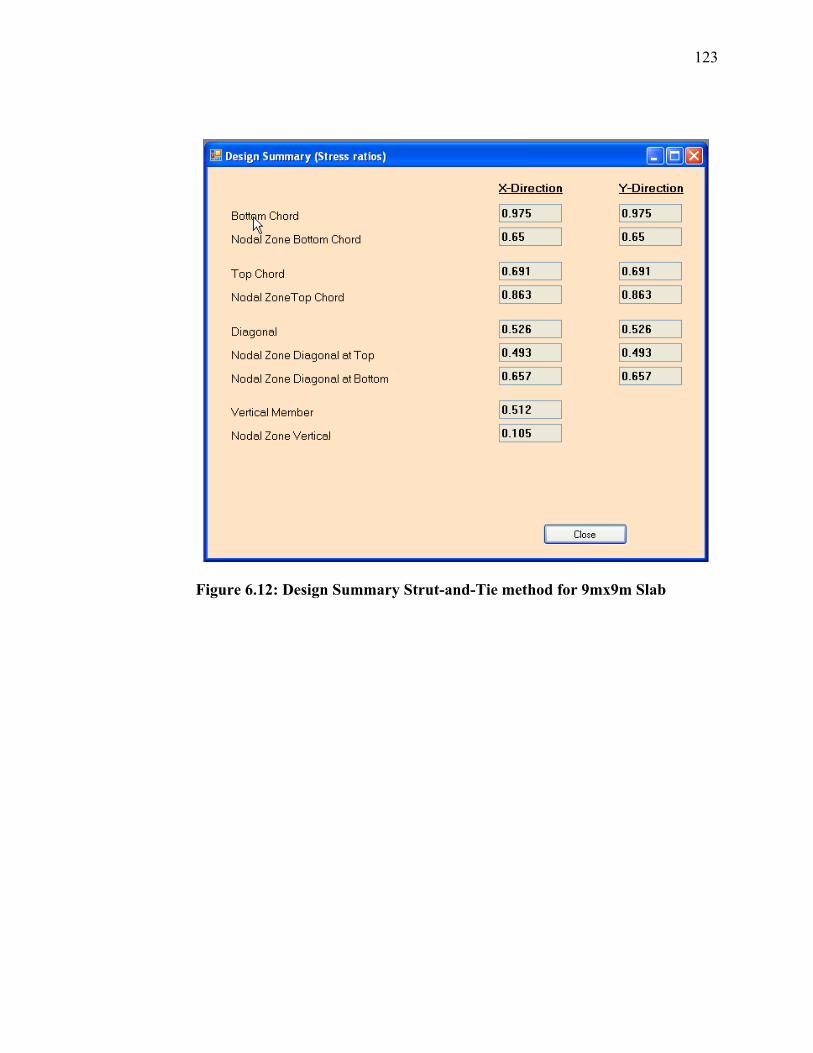
123
Figure 6.12: Design Summary Strut-and-Tie method for 9mx9m Slab

124
6.3 DESIGN OF 9M * 9M WAFFLE SLAB WITH SAFE PROGRAM
SAFE (Slab Analysis by Finite Element method) is a program developed by
Computers and Structures, Inc. SAFE design waffle slabs using the methods
recommended by ACI-318.
The deflected shape of the slab is shown in Fig 6.13. Maximum deflection under
service loads is 6.33mm at center. The distribution of bending moment per meter width is
shown in Fig 6.14. Maximum bending moment per meter width is 107.5 kNm. Since the
rib spacing is 900mm, the bending moment per rib is 96.75 kNm. The distribution of
required reinforcement per meter width is shown in Fig 6.15. Maximum reinforcement
per meter width is 709.1 mm2. Maximum reinforcement required per rib is 638.2 mm2.
Figure 6.13: Deflected Shape by SAFE

125
Figure 6.14: Bending Moment/meter by SAFE
Figure 6.15: Reinforcement in mm2/meter by SAFE
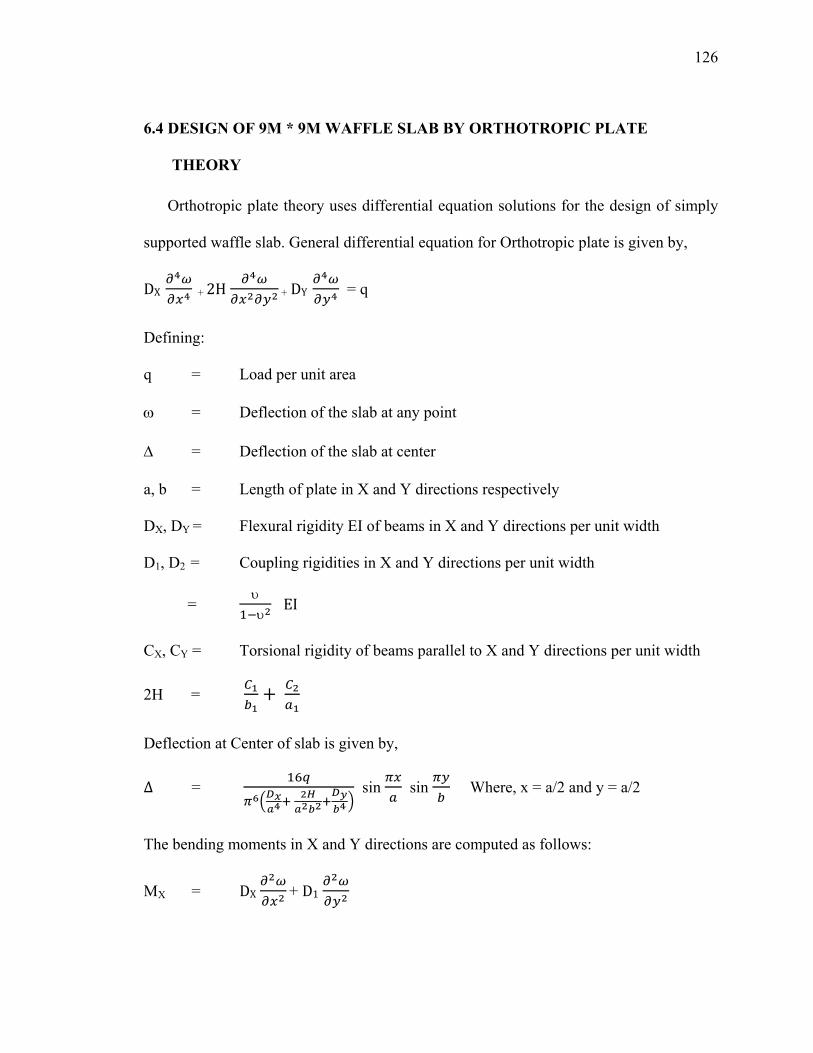
126
6.4 DESIGN OF 9M * 9M WAFFLE SLAB BY ORTHOTROPIC PLATE
THEORY
Orthotropic plate theory uses differential equation solutions for the design of simply
supported waffle slab. General differential equation for Orthotropic plate is given by,
DX + 2H + DY = q
Defining:
q = Load per unit area
ω = Deflection of the slab at any point
Δ = Deflection of the slab at center
a, b = Length of plate in X and Y directions respectively
DX, DY = Flexural rigidity EI of beams in X and Y directions per unit width
D1, D2 = Coupling rigidities in X and Y directions per unit width
= υυ EI
CX, CY = Torsional rigidity of beams parallel to X and Y directions per unit width
2H =
Deflection at Center of slab is given by,
∆ =
sin sin Where, x = a/2 and y = a/2
The bending moments in X and Y directions are computed as follows:
MX = DX + D1

127
= ∆ sin sin ∆ sin sin
MY = DY + D2
= ∆ sin sin ∆ sin sin
The Torsional moments in X and Y directions are computed as follows:
MXY = = ∆ cos cos
MYX = = ∆ cos cos
The Shear in X and Y directions are computed as follows:
QX = DX CY
= -∆ cos sin
QY = DY CX
= -∆ sin cos
For the 9m*9m slab, Forces are calculated as follows:
Compressive strength of concrete, f'c = 20 MPa = 2901 psi
Yield Strength of Steel reinforcement, Fy = 415 MPa = 60189 psi
Elasticity of concrete as per ACI-318-8.5.1,
Ec = 57000*(f'c)1/2 = 21167 MPa = 3070 ksi
Poisson’s ratio for concrete, υ = 0.2
Elasticity of Steel reinforcement, Es = 199955MPa = 29000 ksi

128
Span in X-direction = 9000 mm = 354.33 in
Spacing of waffles = 900 mm = 35.43 in
Span in Y-direction = 9000 mm = 354.33 in
Spacing of waffles = 900 mm
Thickness of slab (t) = 60 mm = 2.36 in
Overall depth of waffle slab (h) = 500 mm = 19.69 in
Depth of ribs = 440 mm
Thickness of waffle ribs (bw) = 200 mm = 7.87 in
Diameter of Bottom bar-X direction = 20 mm = 0.79 in
Diameter of Bottom bar-Y direction = 20 mm = 0.79 in
Effective depth = 450 mm = 17.72 in
Dead Load including self weight = 5.846 kN/m2
Live Load = 7.00 kN/m2
Factored Load (1.2 DL+1.6 LL) = 18.2152 kN/m2
Service Loads (1.0 DL+1.0 LL) = 12.846 kN/m2
Moment of Inertia of a flange beam about it's own centroidal axis is calculated as:
I = Where,
k = Q P
P = t/h , Q = bE/bw
bE is the effective width of flange calculated as per ACI-318
bE = 680 mm

129
P = t/h = 0.120
Q = bE/bw = 3.4
k = Q P
= 1.52
I = k*bw*h3/12
= 3174*106 mm4
If I1 and I2 are second moment of area of the T-section about the centroidal axis in the X
and Y directions,
Dx = E*I1
Dy = E*I2
Here I1 = I2 = I and
a1, b1 = Spacing of ribs in X and Y directions respectively
a1 = b1 = 900 mm
Dx = Dy = 3.527 *10-3 * E
D1= D2 = (υ/(1-υ 2))EI = 0.208 EI
= 0.7336 *10-3 * E
The Torsional Rigidity in X and Y directions are given by
J = Σ (1-0.63*x/y)*(x3*y/3) = 1026* 106 mm4
x1 y1 x2 y2 J
Case1) 60 680 200 440 883*106
Case2) 60 240 200 500 1026*106

130
C1 = C2 = J*G = J * (E/(2*(1+υ)) = 427.69 *106 * E mm4
= 0. 42769 *10-3 * E m4
2*H = = 0. 950417 *10-3 *E
Deflection at Center of slab for Service Loads is given by,
∆ =
sin sin Where, x = a/2 and y = a/2
q = 12.846 kN/m2
E = 21167 MPa = 21167*103 kN/m2
Dx/a4 = 5.37555*10-07 *E = 11.378
Dy/b4 = 5.37555 *10-07 *E = 11.378
2H/(a2b2) = 1.44859 *10-07 *E = 3.066
Deflection at center of plate = 0.0083 m (at x = a/2 and y = b/2)
= 8.3 mm
Assuming creep coefficient as 2.0, Ece = Ec / 3
Long term Deflection = 24.9 mm
Allowable Deflection = Short Span / 250
= 36 mm > 24.9 mm
Design moments and shear are calculated as follows using factored loads:
∆ =
sin sin Where, x = a/2 and y = a/2
Where, q = 18.2152 kN/m2
Δ ult = 0.0118 m

131
The bending moment, torsional moments and shear at various salient points are computed
as follows
MX = DX + D1
= ∆ sin sin ∆ sin sin
= 129.15 * sin sin
MY = DY + D2
= ∆ sin sin ∆ sin sin
= 129.15 * sin sin
MXY = = ∆ cos cos
= -14.40 * cos cos
MYX = = ∆ cos cos
= -14.40 * cos cos
QX = DX CY
= -∆ cos sin
= -42.35 * cos sin
QY = DY CX
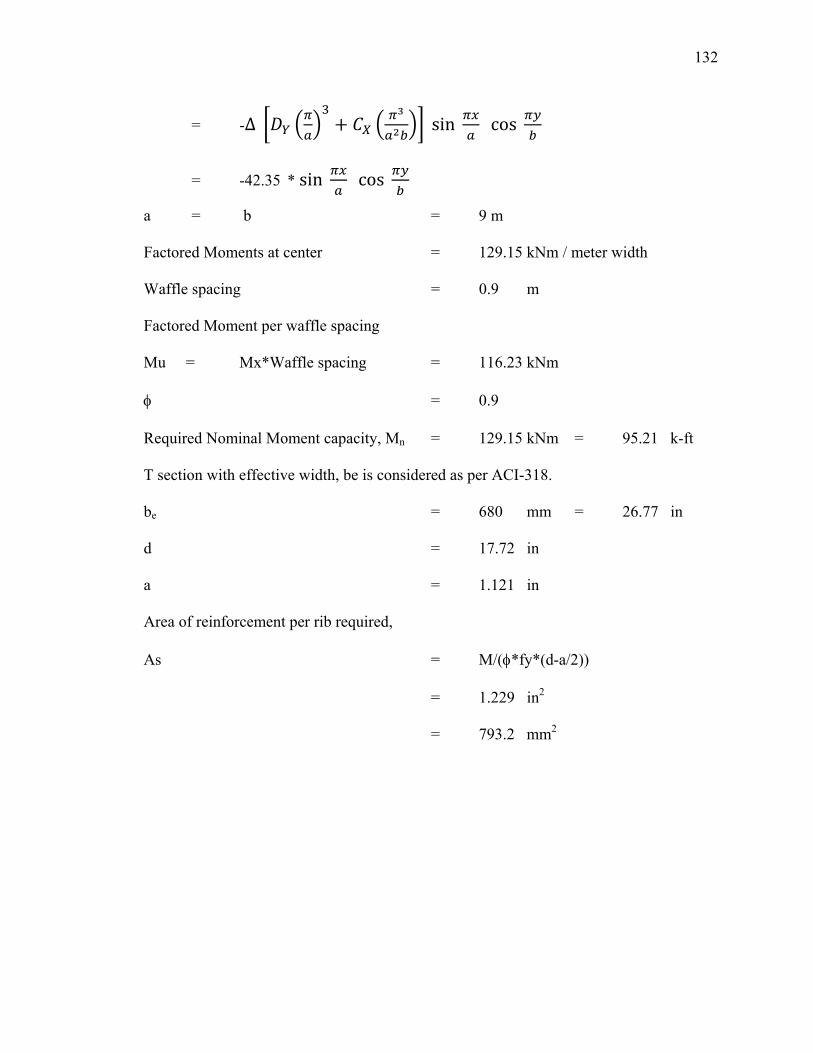
132
= -∆ sin cos
= -42.35 * sin cos
a = b = 9 m
Factored Moments at center = 129.15 kNm / meter width
Waffle spacing = 0.9 m
Factored Moment per waffle spacing
Mu = Mx*Waffle spacing = 116.23 kNm
φ = 0.9
Required Nominal Moment capacity, Mn = 129.15 kNm = 95.21 k-ft
T section with effective width, be is considered as per ACI-318.
be = 680 mm = 26.77 in
d = 17.72 in
a = 1.121 in
Area of reinforcement per rib required,
As = M/(φ*fy*(d-a/2))
= 1.229 in2
= 793.2 mm2

133
6.5 COMPARISON OF MAIN REINFORCEMENT FOR DIFFERENT
METHODS
Table 6.1 shows the comparison of main reinforcement required for the ribs. Required
reinforcement is more or less same between SAFE and STWAF with Ω =1.25.
TABLE 6.1: Comparison of Main Reinforcement for Different Methods
As by SAFE (mm2)
As by Plate Theory
(mm2)
As by STWAF(mm2)
Ω =1.25
As by STWAF(mm2)
Ω =1.00
639 793 629 770
Required reinforcement in the ribs is calculated without considering over strength
factor also in a similar way using STWAF, as shown in Table 6.1. It matches with
reinforcement calculated using orthotropic plate theory. However in this case the
reinforcement required is more than the conventional methods which consider
distribution of reinforcement over the entire strip.
As per ACI, ultimate moment is calculated for a strip of slab, consisting of many ribs,
and the moment is distributed equally for all the ribs at center. It is a reasonable
assumption since waffle slab consists of ribs at close spacing and loads are well
distributed due to inter connected ribs in both directions. To account for this distribution,
the over strength factor of 1.25 is applied to the design of bottom reinforcement. Since
this is applied along with strength design factor of 0.75, the total stress in reinforcement
at the center rib will be 0.94 times yield stress which is still less than the yield strength.

CHAPTER 7
PARAMETRIC STUDY OF ACI PROVISIONS FOR WAFFLE
SLABS USING STWAF
A 10m * 10m simply supported slab was selected to study the effect of rib
spacing, depth of rib, thickness of rib and reinforcement cover on the strength and
mode of failure of waffle slab. The design was carried out using strut-and-tie
simulation in STWAF environment.
7.1 DETAILS OF THE 10M * 10M SLAB USED FOR PARAMETRIC STUDY
Span in X and Y directions are 10m. All four edges are simply supported and corner
lifting allowed. Grade of concrete considered as 20 MPa and grade of reinforcement as
415 Mpa. Self weight is calculated and applied by STWAF. Live loads applied as
uniformly distributed loads. In each slab the additional live load capacity of the slab is
calculated.
7.2 EFFECT OF RIB SPACING
For the waffle slab used to study the effect of rib spacing, a slab thickness of 75 mm
considered and the overall depth of all slabs kept as 600mm. Rib thickness considered is
200mm and an effective cover of 50mm was used for all slabs. Area of main
reinforcement at bottom of rib is 942.48 mm2 and area of stirrups used is 100.53 mm2.

135
The slab is designed with 12 equal rib spacings to 5 equal rib spacings, keeping all
other parameters same and the additional live load carrying capacity is calculated and
reported, as shown in Figure 7.1.
As the rib spacing increases, moment of inertia and strength reduces as shown in
Figure 7.1. Table 7.1 shows the stress ratios of various elements of the strut-and-tie
model. For closer spacing of ribs, the bottom chord element, which is the reinforcement,
is the critical element that fails first, if the load is further increased. This means that mode
of failure is flexural failure and is due to yielding of reinforcement. A further increase in
rib spacing will make bottom nodal zone critical which results a slip bond failure. A large
spacing of ribs makes diagonal member fail which is a sudden punching shear failure.
Closer spacing of ribs is recommended since it makes flexural failure under
overloading. ACI recommends a maximum clear spacing of ribs as 30 inch. Only slabs 1
and 2 meets this criteria. For these two slabs, the mode of failure is flexural and ACI
recommendation is in line with behavior predicted by strut-and-tie method.
The nodal zone for bottom chord for all these specimens are seen with higher stress
ratios and this can be avoided by increasing the concrete cover. To have sufficient
warning under overloading, stress ratios of all elements and nodal zones other than
bottom reinforcement should be kept as low as possible.

136
Slab No
Rib Spacing
mm
Self weight kN/m2
Angle of
Strut
Live Load kN/m2
1 833 7.419 32.21 12.60
2 909 7.015 30.01 11.60
3 1000 6.600 27.70 9.60
4 1111 6.175 25.29 8.20
5 1250 5.739 22.78 5.80
6 1429 5.293 20.18 4.55
7 1667 4.836 17.48 2.70
8 2000 4.369 14.71 1.55
Figure 7.1: Effect of Rib Spacing on the Load Carrying Capacity
L IVE L OAD ‐ WAF F L E S PAC ING
5.80
4.55
2.70
1.55
12.60
11.60
9.60
8.20
0.00
2.00
4.00
6.00
8.00
10.00
12.00
14.00
0.0 500.0 1000.0 1500.0 2000.0 2500.0
WAFF L E S PAC ING (MM)
LIVE LOAD (KN/ M2)
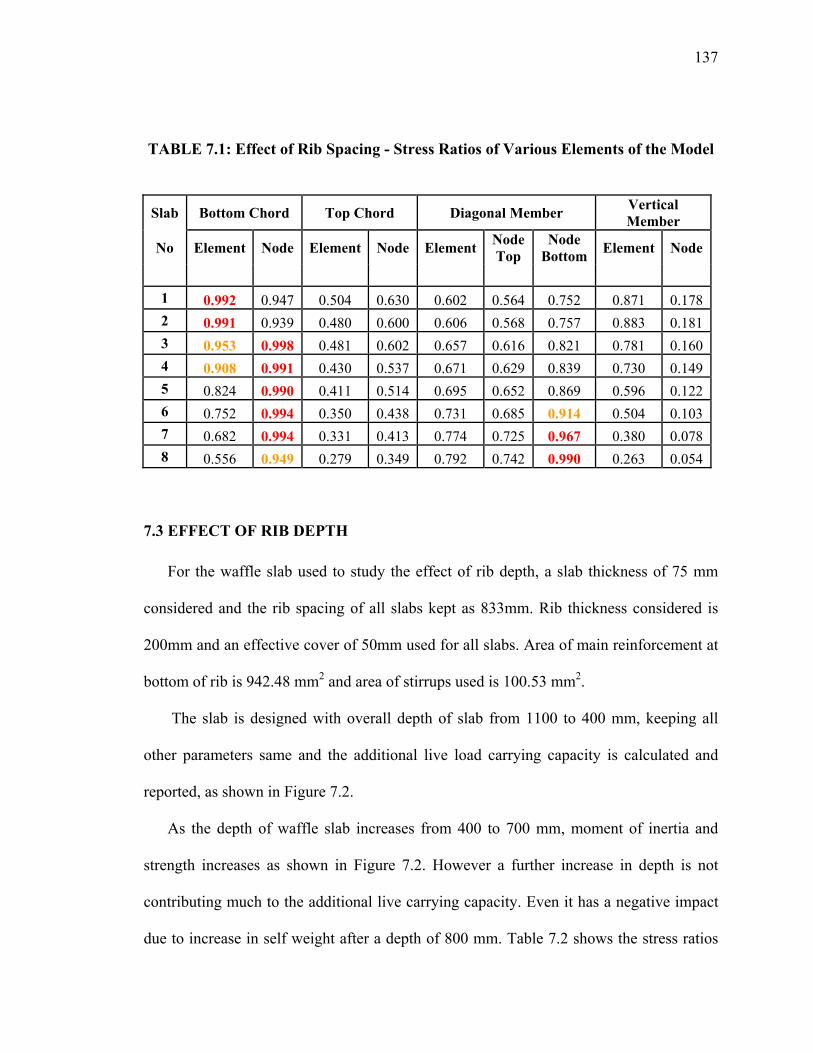
137
TABLE 7.1: Effect of Rib Spacing - Stress Ratios of Various Elements of the Model
Slab Bottom Chord Top Chord Diagonal Member Vertical Member
No Element Node Element Node Element Node Top
Node Bottom Element Node
1 0.992 0.947 0.504 0.630 0.602 0.564 0.752 0.871 0.178 2 0.991 0.939 0.480 0.600 0.606 0.568 0.757 0.883 0.181 3 0.953 0.998 0.481 0.602 0.657 0.616 0.821 0.781 0.160 4 0.908 0.991 0.430 0.537 0.671 0.629 0.839 0.730 0.149 5 0.824 0.990 0.411 0.514 0.695 0.652 0.869 0.596 0.122 6 0.752 0.994 0.350 0.438 0.731 0.685 0.914 0.504 0.103 7 0.682 0.994 0.331 0.413 0.774 0.725 0.967 0.380 0.078 8 0.556 0.949 0.279 0.349 0.792 0.742 0.990 0.263 0.054
7.3 EFFECT OF RIB DEPTH
For the waffle slab used to study the effect of rib depth, a slab thickness of 75 mm
considered and the rib spacing of all slabs kept as 833mm. Rib thickness considered is
200mm and an effective cover of 50mm used for all slabs. Area of main reinforcement at
bottom of rib is 942.48 mm2 and area of stirrups used is 100.53 mm2.
The slab is designed with overall depth of slab from 1100 to 400 mm, keeping all
other parameters same and the additional live load carrying capacity is calculated and
reported, as shown in Figure 7.2.
As the depth of waffle slab increases from 400 to 700 mm, moment of inertia and
strength increases as shown in Figure 7.2. However a further increase in depth is not
contributing much to the additional live carrying capacity. Even it has a negative impact
due to increase in self weight after a depth of 800 mm. Table 7.2 shows the stress ratios

138
of various elements of the strut-and-tie model. For smaller depth of waffle slab, the
bottom chord element, which is the reinforcement, is the critical element that fails first,
under overloading of the slabs. This means mode of failure is flexural failure and is due
to yielding of reinforcement. A further increase in depth will make bottom nodal zone fail
and diagonal member fail which results in a slip bond failure and a sudden punching
shear failure, respectively.
Smaller depth of rib is recommended since it leads to the desired flexural failure
under overloading. ACI recommends a maximum depth of rib as 3.5 times the rib
thickness. Only slab numbers 5 to 8 meet these criteria. For slabs with depth less than 700
mm, the mode of failure is flexural.
For the slab number 5 with 700 mm depth, since bottom nodal zone and diagonal
members are also equally critical, it will not give warning under overloading and is not
recommended. However 700 mm depth can be used with higher thickness of rib, which
makes the bottom nodal zone and diagonal member less critical and result in a flexural
failure under overloading.

139
Slab No
Overall Depth mm
Self weight kN/m2
Angle of
Strut
Live Load
kN/m2
1 1100 12.699 50.89 15.10
2 1000 11.643 47.99 15.30
3 900 10.587 44.71 15.40
4 800 9.531 41.02 15.40
5 700 8.475 36.87 14.70
6 600 7.419 32.21 12.60
7 500 6.363 27.02 10.00
8 400 5.307 21.31 7.20
Figure 7.2: Effect of Rib Depth on the Load Carrying Capacity
15.115.315.415.4
14.7
12.6
10.0
7.2
0.00
2.00
4.00
6.00
8.00
10.00
12.00
14.00
16.00
18.00
0 200 400 600 800 1000 1200WAFF L E S L AB DEP TH (MM)
LIVE LOAD (KN/ M2)

140
TABLE 7.2: Effect of Rib Depth - Stress Ratios of Various Elements of the Model
Slab Bottom Chord Top Chord Diagonal Member Vertical Member
No Element Node Element Node Element Node Top
Node Bottom Element Node
1 0.748 0.954 0.360 0.450 0.648 0.607 0.810 0.992 0.203 2 0.790 0.965 0.386 0.482 0.633 0.594 0.792 0.991 0.203 3 0.842 0.977 0.416 0.520 0.624 0.585 0.780 0.992 0.203 4 0.910 0.996 0.455 0.569 0.625 0.586 0.781 0.995 0.203 5 0.973 0.997 0.491 0.614 0.623 0.584 0.779 0.969 0.198 6 0.992 0.947 0.504 0.630 0.602 0.564 0.752 0.871 0.178 7 0.992 0.887 0.507 0.634 0.588 0.552 0.735 0.735 0.150 8 0.981 0.831 0.503 0.628 0.598 0.561 0.748 0.572 0.117
7.4 EFFECT OF RIB THICKNESS
For the waffle slab used to study the effect of rib thickness, a slab thickness of 75 mm
was considered and the overall depth of all slabs was kept as 600mm. Rib spacing of all
slabs was kept as 833mm and an effective cover of 50mm was used for all slabs. Area of
main reinforcement at bottom of rib was 942.48 mm2 and area of stirrups used was
100.53 mm2.
The slab is designed with a rib thickness from 100mm to 250mm, keeping all other
parameters same and the additional live load carrying capacity is calculated and reported,
as shown in Figure 7.3.
As the rib thickness increases from 100 to 200 mm, moment of inertia and strength
increases as shown in Figure 7.3. However a further increase in rib thickness has a
marginal negative impact on the additional live load carrying capacity due to increase in

141
self weight after a thickness of 200 mm. A thickness of 200 mm is sufficient to avoid
concrete failure in the structure.
Table 7.3 shows the stress ratios of various elements of the strut-and-tie model. For
thickness of ribs greater than or equal to 200mm, the bottom chord element, which is the
reinforcement, is the critical element that fails first, under overloading of the slabs. This
means mode of failure is flexural failure and is due to yielding of reinforcement. A
reduction in thickness of rib will make bottom nodal zone or diagonal member fail which
results in a slip bond failure or a sudden punching shear failure which is not a
recommended mode of failure.
An increased rib thickness will avoid concrete failure in structure. ACI recommends a
minimum rib thickness of 200 mm. Only slab numbers 1 and 2 meet this criteria. For
these two slabs, the mode of failure is flexural and ACI recommendation is in line with
behavior predicted by strut-and-tie method. However for waffle slabs with larger span
and loads, minimum rib thickness of 200 mm as recommended by ACI will not be
enough to avoid shear failure.
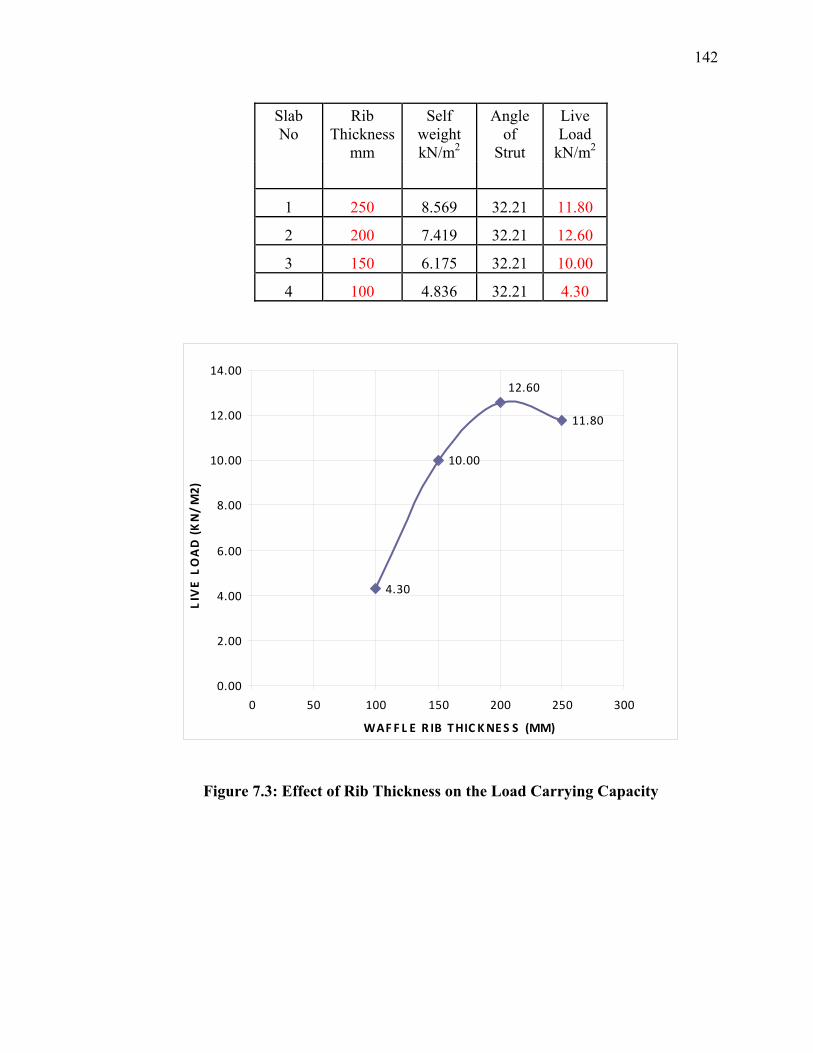
142
Slab No
Rib Thickness
mm
Self weight kN/m2
Angle of
Strut
Live Load
kN/m2
1 250 8.569 32.21 11.80
2 200 7.419 32.21 12.60
3 150 6.175 32.21 10.00
4 100 4.836 32.21 4.30
Figure 7.3: Effect of Rib Thickness on the Load Carrying Capacity
11.80
12.60
10.00
4.30
0.00
2.00
4.00
6.00
8.00
10.00
12.00
14.00
0 50 100 150 200 250 300
WAFF L E R IB THIC KNES S (MM)
LIVE LOAD (KN/ M2)

143
TABLE 7.3: Rib Thickness - Stress Ratios of Various Elements of the Truss Model
Slab Bottom Chord Top Chord Diagonal Member Vertical Member
No Element Node Element Node Element Node Top
Node Bottom Element Node
1 0.995 0.770 0.490 0.613 0.415 0.389 0.518 0.864 0.113 2 0.992 0.947 0.504 0.630 0.602 0.564 0.752 0.871 0.178 3 0.798 0.998 0.426 0.533 0.772 0.724 0.965 0.714 0.259 4 0.432 0.788 0.243 0.304 0.779 0.730 0.974 0.394 0.323
7.5 EFFECT OF EFFECTIVE COVER
For the waffle slab used to study the effect of effective cover for main reinforcement,
a slab thickness of 75 mm was considered and the overall depth of all slabs was kept as
600mm. Rib thickness considered was 200mm and rib spacing of all slabs was kept as
833mm. Area of main reinforcement at bottom of rib was 942.48 mm2 and area of
stirrups used was 100.53 mm2.
The slab is designed with an effective concrete cover from 30mm to 60mm, keeping
all other parameters same and the additional live load carrying capacity is calculated and
reported, as shown in Figure 7.4
As the effective cover increases from 30 to 50 mm, strength increases dramatically as
shown in Figure 7.4. This is due to the slip bond failure at bottom of the ribs due to less
concrete cover in ribs (as in the case of 30mm cover). The nodal zone for bottom
reinforcement has lesser area than required to transfer the tensile force in reinforcement
to the structure.

144
However a further increase in concrete cover has a marginal negative impact on the
additional live load carrying capacity due to reduction in effective depth. An effective
cover of 50 mm is sufficient for this configuration of waffle slab. This study shows the
importance of concrete cover for waffle slab and strut-and-tie method can find the
optimum cover.
Table 7.4 shows the stress ratios of various elements of the strut-and-tie model. For
effective concrete cover greater than or equal to 50mm, the bottom chord element, which
is the reinforcement, is the critical element that fails first, under overloading of the slabs.
This means mode of failure is flexural failure and is due to yielding of reinforcement. A
reduction in concrete cover will make bottom nodal zone fail which results in a slip bond
failure.
Minimum clear concrete cover specified by ACI for slabs and joists not exposed to
weather or not in contact with ground is only 0.75 inch (19mm) for bar diameter #11
(36mm) or less and 1.5 inch (38mm) for bar diameter #14 (43mm) and #18(57mm). ACI
specifies more cover only for structures exposed to weather or in contact with ground.
However strut-and-tie method proposes more concrete cover for all cases and
concrete cover is not just for the protection of steel reinforcement. It considers the load
transfer from reinforcement to the concrete. Basically strut-and-tie method defines a load
path and checks all elements and joints for the safe flow of stresses. It considers even the
detailing aspect of the waffle slab from the model itself.
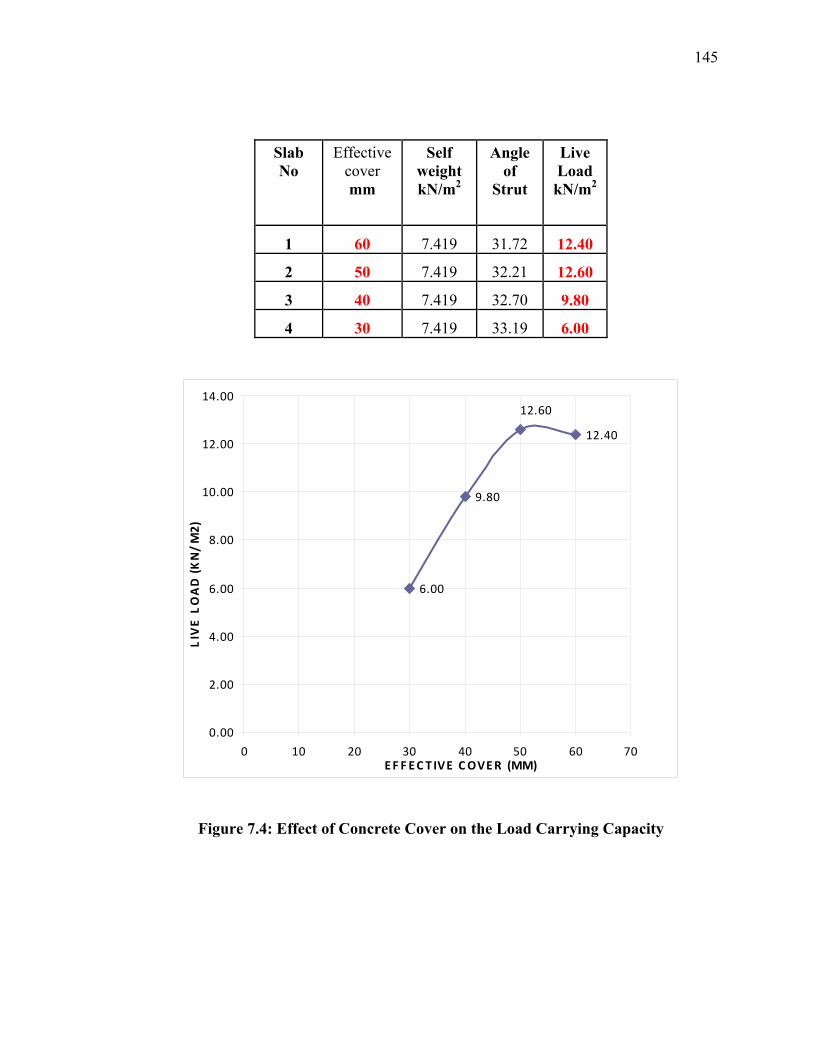
145
Slab No
Effective cover mm
Self weight kN/m2
Angle of
Strut
Live Load kN/m2
1 60 7.419 31.72 12.40
2 50 7.419 32.21 12.60
3 40 7.419 32.70 9.80
4 30 7.419 33.19 6.00
Figure 7.4: Effect of Concrete Cover on the Load Carrying Capacity
12.40
12.60
9.80
6.00
0.00
2.00
4.00
6.00
8.00
10.00
12.00
14.00
0 10 20 30 40 50 60 70EF F EC T IVE COVER (MM)
LIVE LOAD (KN/ M2)

146
TABLE 7.4: Effective Cover - Stress Ratios of Various Elements of the Model
Slab Bottom Chord Top Chord Diagonal Member Vertical Member
No Element Node Element Node Element Node Top
Node Bottom Element Node
1 0.999 0.790 0.508 0.635 0.604 0.566 0.755 0.865 0.177 2 0.992 0.947 0.504 0.630 0.602 0.564 0.752 0.871 0.178 3 0.824 0.990 0.418 0.523 0.502 0.470 0.627 0.734 0.150 4 0.609 0.983 0.309 0.386 0.373 0.349 0.466 0.550 0.113

CHAPTER 8
SUMMARY, CONCLUSIONS AND RECOMMENDATIONS
8.1 SUMMARY
Strut-and-tie method for simply supported waffle slabs is developed and proposed for
design of waffle slab. A user friendly design tool STWAF is developed for automatic
generation of the Strut-and-tie model. The method provides great flexibility to the
designer in terms rib spacing and rib dimensions.
Mode of failure can be predicted by the STM model. The type of member which is
critical will predict the mode of failure. If the bottom reinforcement is critical, the mode
of failure is flexural failure. If the diagonal strut near the support fails first, it is a flexural
shear failure. The failure of diagonal struts, near the concentrated load results in a sudden
punching shear failure. The bottom nodal zone failure causes slip-bond failure.
Based on the proposed STM model, out of the 6 experimental specimens (S1 to S6)
used in this study, 3 slabs (S1, S2 and S5) failed under pure flexure, one slab (S4) failed
under punching shear under the concentrated load. Slabs S3 and S6 failed mainly due to
flexure, but with punching shear cracks under the load.

148
8.2 CONCLUSIONS
Based on the study, the following conclusions can be drawn:
• Strut-and-tie method is an excellent method for design of waffle slabs and
handles major modes of failure like shear critical, bending critical and
even consider local failure due to large concentrated loads.
• A linear Strut-and-tie model as per ACI Strut-and-tie provisions is
sufficient for design of waffle slabs. However it cannot predict the
ultimate load carrying capacity of the slab since analysis is limited till the
reinforcement in center rib reaches a stress level of 0.75 times the yield
stress. It gives an indication of the mode of failure.
• A non linear Strut-and-tie model can very well predict the ultimate
strength and mode of failure of waffle slabs. The redistribution of forces
after yielding of reinforcement is well described in ANSYS nonlinear
model and hence the results are very close to experimental results and are
conservative.
• Based on the study an over strength factor of 1.25 is found appropriate for
the design of bottom reinforcement considering the capacity of the slab to
redistribute the forces between interconnected ribs.
• Based on the experimental data, the efficiency factor of 0.6 used for
diagonal struts without stirrup reinforcement and for nodal zones at
bottom, as per ACI provisions is found to be conservative. A factor of 0.7
is found more appropriate to predict mode of failure.

149
• Since STM is a method which consider an internal mechanism to take
loads at the ultimate stage and ignores the contribution of cracked concrete
on the stiffness of the waffle slab, STM cannot predict deflections
accurately. Code based design provisions for STM only address ultimate
limit state requirements. Hence Orthotropic plate theory is used for
calculating deflections of simply supported waffle slabs in STWAF.
• Based on the parametric study, it is clear that ACI recommendation on the
size and spacing of ribs is done in such a way that the slab fails under
flexure in case of overloading for normal range of spans from 6 to 12m.
However the concrete cover and thickness of ribs may not be sufficient for
larger spans.
150
8.3 RECOMMENDATIONS FOR FUTURE STUDY
Based on the study, the following recommendations are made for future study:
• Strut-and-tie model is developed for simply supported waffle slabs with
corner lifting allowed. Future study is recommended for slabs without
corner lifting and can be extended to multi-span cases as well. Since strut-
and-tie method can handle shear critical structure, the punching shear at
column locations can be effectively handled by this method. However
since the top chord near columns will be subjected to tensile stresses,
fixing the type of element needs multiple iterations.
• Currently all ribs are considered with equal sizes in both directions. Future
study is recommended to include wider beams along column lines and at
periphery.
• Experimental study need to be conducted on a large scale to evaluate the
efficiency factors for struts and nodal zones which play an important role
in evaluating the allowable strength.
• Study on STM for waffle slabs need to be conducted to predict deflections
under service loads considering nonlinear material model and the effect of
cracked concrete on the stiffness of the model.

REFERENCES
1. Building Code Requirements for Structural Concrete-ACI 318 -08 and Commentary, American concrete institute, Farmington Hills, Michigan, 2008.
2. Schlaich, J., Schafer, K. and Jennewein, M., “Toward a Consistent Design of Structural Concrete,” Prestressed Concrete Institute Journal, Vol. 32, No. 3, May 1987, pp. 74-150.
3. Timoshenko, S., and Woinowsky-Krieger, S. (1959). Theory of plates and shells,
2nd Ed., McGraw-Hill, New York, 364–377. 4. Bares, R., and Massonnet, C. (1966). Analysis of beam grids and ortho-tropic
plates. Lockwood, London, 241–256.
5. Tebbett, I. E., and Harrop, J. (1979). ‘‘Analytical design of ribbed flat slabs.’’ The Struct. Engr., London, 57(7), 223–230.
6. Cusens, A. R., and Pama, R. P. (1975). Bridge deck analysis, 1st Ed., Wiley,
England, 29–111.
7. Kennedy, J. B., and Iyengar, K. J. (1982). ‘‘Rigidities of non-orthogonally shaped waffle slabs.’’ J. Struct. Div., ASCE, 108(10), 2263–2278
8. Magura, D. D., and Corley, W. G. ‘‘Tests to destruction of multi-panel waffle slab
structure—1964–1965 New York World’s Fair.’’ ACI Journal, 68(9), 699–703, September 1, 1971.
9. Donald D. Magura and W. Gene Corlet, “ Test to destruction of a Multi panel
waffle slab structure – 1964-1965 New York’s World Fair ’’, ACI Journal Proceedings , 68(9). Sept. 1971.
10. Ji, X., Chen, S., Huang, T., and Lu, L. (1986). ‘‘Deflection of waffle slabs
under gravity and in-plane loads.’’ American Concrete Institute, Detroit, 283–294.
11. Ajdukiewicz, A. B., and Kliszczewicz, A. T. (1986). ‘‘Experimental analysis of limit states in a six panel waffle flat-plate structure.’’ ACI Journal, 83(6), 909–915.

152
12. Mario E. Rodriguez, Jacketing and Sergio A. Santiago, “Simulated Seismic Load
Tests on Two –Story Waffle Flat Plate structure Rehabilitated.” ACI Structural Journal, 95(2).
13. Hashim M.S. Abdul-Wahab and Mohammad H. Khalil, “Rigidity and strength of
orthotropic reinforced concrete waffle slabs”, Journal of Structural Engineering, February- 2000, Pages 219-227.
14. J. Prasad, S. Chander and A.K. Ahuja , Department of Civil Engineering, I.I.T.R.,
Roorkee, India. “Optimum Dimensions of Waffle slab for Medium Size Floors”, Asian Journal of Civil Engineering (Building and Housing) Vol.6, No.3 (2005), Pages 183-197.
15. P. F. Schwetz, F. P. S. L. Gastal and L. C. P. Silva on “Numerical and
experimental study of real scale waffle slab” , IBRACON Structures and Materials Journal,Volume 2, Number 4 (December, 2009) p. 380 – 403.
16. Anis Mohamad Ali, B.J. Farid and A.I.M. Al-Janabi, “ Stress-Strain Relationship
for Concrete in Compression Made of Local Materials”, Civil Engineering Department, University of Basrah, Iraq, Eng. Sci. Vol.2. pp 183-194, 1990.
17. Ken Watanabe, Junichiro Niwa, Hiroshi Yokota and Mitsuyasu Iwanami. “An
experimental study on stress-strain curve of concrete considering localized failure in compression”, Journal of Advanced Concrete Technology Vol.2, No.3,395-407, October 2004.
18. Jung-woong Park and Daniel Kuchma., “Strut-and-tie Model Analysis for
Strength Prediction of Deep beams”, ACI Structural Journal, Vol. 104, No.6, 2007. pp. 657-666.
19. A. Arabzadeh, A.R. Rahaie and R.Aghayari, “A Simple Strut-and-tie Model for
prediction of Ultimate Shear Strength of RC Deep beams”, International Journal of Civil Engineering. Vol.7, No.3, September 2009.
20. ASTM A615, “Standard Specification for Deformed and Plain Billet Steel bars
for concrete reinforcement” American Society for Testing and Materials.
21. Javier Malvar and John E. Crawford, “ Dynamic Increase Factors for Steel reinforcing Bars”, Twenty-Eighth DDESB Seminar, Orlando, FL, August 1998.

153
22. Mirza S.A., MacGregor J.G., “Variability of Mechanical properties of Reinforcing Bars”, Journal of Structural Division, Vol. 105, No.ST5, May 1979. pp. 921-937.
23. Cowell W.L., “Dynamic Tests on High Strength Steels”, Technical report N-427,
Naval Civil Engineering laboratory, Port Hueneme, CA, February 1962, 17 pp. 24. MacGregor, J.G., “Reinforced Concrete-Mechanics and Design,” 3rd edition,
Prentice Hal, 1997. 25. Ritter, W. “The Hennebique Design Method (Die Bauweise Hennebique),” 1899.
26. Marti, P., “Truss Model in Detailing,” Concrete International, December, 1985, pp 66-73.
27. Vecchio, F.J. and Collins, M.P., “Compression Response of Cracked Reinforced
Concrete,” Journal of Structural Engineering, Dec., 1986, pp. 3590-3611. 28. Collins, M.P. , Mitchell, D., Adebat, p. and Vecchio, F.J. “A General Shear
Design Method,” ACI Structural Journal , January-Febraury, 1996,pp36-45.
29. AASHTO, “LRFD Bridge Design Specifications,” 2nd ed., American Association of State Highway and Transportation Officials, Washington, D.C., 2005.
30. Nielson, M.P., Limit Analysis and Concrete Plasticity, 2nd Edition, CRC Press,
1998.
31. Schlaich, J. and Anagnostou, G., “Stress Fields for Nodes of Strut-and-Tie Models,” Journal of Structural Engineering, ASCE, Vol.116, No.1, January, 1990, pp. 13-23.
32. Schlaich, J. and Weischede, D., “Detailing Reinforced Concrete Structures,”
Canadian Structural Concrete Conference, Department of Civil Engineering, University of Toronto, Toronto, 1981, pp. 171-198.
33. Hwang, S.J., Fang, W.H., Lee, H.J., and Yu, H.W., “Analytical Model for
Predicting Shear Strength of Squat Walls,” Journal of Structural Engineering, Vol. 127, No. 1, 2001, pp. 43-50.
34. Tan, K.H., Tong, K., and Tang, C.Y., “Direct Strut-and-tie Model for Prestressed
Deep Beams,” Journal of Structural Engineering, Vol. 127, No. 9, 2001, pp. 1076-1084.

154
35. Tan, K.H., Tang, C.Y., and Tong, K., “A Direct Method for Deep Beams with Web Reinforcement,” Magazine of Concrete Research, Vol. 55, No. 1, 2003, pp. 53-63.
36. Nielson, M.P., Braestrup, M.W., and Bach, F., “Rational Analysis of Shear in
Reinforced Concrete Beams,” LABSE Periodic, Proceedings, P-15/78, No. 2, May 1978, p. 18.
37. Bakir, P.G. and Boduroglu, H.M., “Mechanical Behavior and Non-linear Analysis
of Short Beams Using Softened Truss and Direct Strut and Tie Models,” Engineering Structure Journal, Vol. 27, 2005, pp. 639-651.
38. Young, M.Y., “Computer Graphics for Nonlinear Strut-Tie Model Approach,”
Computing in Civil Engineering Journal, Vol. 14, No. 2, April 2000, pp. 127-133.
39. Tjhin, T.S. and Kuchma, D.A. “Computer-Based Tools for Design by Strut-Tie Method: Advances and Challenges,” ACI Structural Journal, September-October, 2002, pp. 586-594.
40. Hyo-Gyoung, K. and Sang-Hoon, N., “Determination of Strut-and-tie Models
Using Evolutionary Structural Optimization”, Engineering Structures Journal, Vol. 28, 2006, pp. 1440-1449.
41. Alshegeir, A., Ramirez, J., “Computer Graphics in Detailing Strut-Tie Models,”
Computing in Civil Engineering Journal, Vol. 6, No. 1, April 1992, pp. 220-231.
42. Liang, J.L., Chang, W.H., Chuin, S.C., and Ying, P.L., “Strut-and-tie Design Methodology for Three-Dimensional Reinforced Concrete Structures,” Structural Engineering Journal, Vol. 132, No. 6, 2006, pp. 929-938.
43. Chun, S.C., “Three-Dimensional Strut-and-tie Analysis for Footing
Rehabilitation,” Structural Engineering Journal, Vol. 7, No. 2, Feb. 2002, pp. 14-25.
44. Richard, W., “Strut-and-tie Model for Punching Shear of Concrete Slabs,”
M.S. Thesis, Civil Engineering Dept., University of Newfoundland, Aug. 1995.
45. Richard W.Tiller. “Strut-and-tie model for punching shear of concrete slabs”, thesis report submitted to Memorial University of Newfoundland, August 1995.
46. Tjen N. Tjhin , “Analysis and Design Tools for Structural Concrete Using Strut-
and-tie Models”. Dissertation submitted to University of Illinois, 2004.

155
47. Tjen N. Tjhin, Daniel A. Kuchma, “ Integrated Analysis and Design Tool for the Strut-and-tie Method”, Engineering Structures 29 (2007), 3042-3052.
48. ANSYS version-11, ANSYS Inc., Global Headquarters, South Pointe, 275 Technology Drive, Canonsburg, PA

VITA
NAME : Sunil Kumar G Pillai ADDRESS : Shaleena, Kaduvinal P.O.,
Vallikunnam, Alappuzha Dist, Kerala, India
E-MAIL : [email protected] / [email protected]
EDUCATIONAL QUALIFICATIONS
M.S Civil Engineering – Structures (April 2011)
King Fahd University of Petroleum and Minerals Dhahran, Saudi Arabia
B.Tech. -Civil Engineering (October 1995)
T.K.M. College of Engineering Kerala University, Kollam, Kerala, India
OTHER ACHIEVEMENTS
• Attended courses in C- programming and Visual Basic (VB.net) • Published paper in SEMC – South Africa on “Design of Waffle slabs
using Strut-and-tie Method”.
WORK EXPERIENCE
Currently working as Lead Structural engineer for one of the engineering groups, Engineering department, Pre-Engineered Building Division (PEB), Zamil Steel, Dammam, KSA since August 2009.
The past experience includes:
• Engineering Supervisor, in Engineering Department, United Steel Buildings, Al-Shuwayer group, Cochin, India, from August 2008 to June 2009.
• Senior Design Engineer and Design Checker in Engineering Department, Pre-Engineered Building Division (PEB), Zamil Steel, Dammam, KSA from September 1999 to August 2008.
157
• Assistant Engineer in Civil / Structural Engineering Department, Kvaerner Process India Limited, Bangalore, India from April 1997 to September 1999.
• Design Engineer (Structural), Silpi Design and Engineering Pvt. Ltd., Bangalore, India from December 1995 to April 1997.
Work includes analysis, design and checking of various onshore and offshore
steel structures. The experience includes design and checking of Pre-Engineered buildings as per international design codes such as AISC, BS, Euro code etc. and Loading codes like ASCE, MBMA, UBC, IBC, BS 6399, IS codes etc. Conversant with structural analysis programs like STAAD III, SAP, ANSIS and X-STEEL. The experience includes design of concrete buildings as well. Familiar with American, European and Indian design requirements and codes of practices.
The work also includes recruitment and training of design engineers, developing engineering standards, manuals and Design Tables. As part of the work, developed a number of engineering tools using Microsoft excel and Visual Basic.net.
Major Projects Involved
As part of the work in Zamil Steel, designed more than 200 steel buildings, for various countries and checked the design for more than 100 buildings. A few are mentioned below:
• Yarmouq Mall ( Riyadh , KSA )
• Dywidag Saudi Arabia Co. Ltd. ( Jubail , KSA , Client – Unicoil)
• Villagio ( Doha , Qatar)
• Al-Hokhair ( Riyadh , KSA)
The major projects handled before joining Zamil includes:
• BHN Revamp project , Bombay High, India , Client – ONGC
• DHDS project, Vizag Refinery, Client – HPCL, Contractor : Larsen and
Toubro Limited, Harp, Baroda, India
• Bayer Chlor-Alkali Project, Client - Kvaerner John Brown, Houston,
Texas, USA
• ARCO EB-1 New Front Project, Client – ARCO Chemical Company,
Channelview, Texas, USA
• Indo-gulf Copper Project, Client : MECON, Bangalore, India

![eÉÅxÉ tÇw ]âÄ|xàeÉÅxÉ tÇw ]âÄ|xà Oh yes, it's important to have a good husband: rich, handsome and kind. You will have happy days and happy nights... Juliet and L Capulet:](https://img.pdfslide.net/doc/110x75/5aa5f0327f8b9a2f048e1b24/ex-tw-xex-tw-x-oh-yes-its-important-to-have-a-good-husband-rich-handsome.jpg)