Embed Size (px)
Citation preview

doi:10.1182/blood-2007-06-097287 Prepublished online Feb 6, 2008;2008 111: 4403-4412
Yamamoto, Tomoko Sonoda, Yuka Mizue, Kohzoh Imai, Hiroyuki Tsutsumi and Yasuo Kokai Tsukasa Hori, Yasuyoshi Naishiro, Hitoshi Sohma, Nobuhiro Suzuki, Naoki Hatakeyama, Masaki
graft-versus-host diseaseCCL8 is a potential molecular candidate for the diagnosis of
http://bloodjournal.hematologylibrary.org/cgi/content/full/111/8/4403Updated information and services can be found at:
(1265 articles)Transplantation � collections: BloodArticles on similar topics may be found in the following
http://bloodjournal.hematologylibrary.org/misc/rights.dtl#repub_requestsInformation about reproducing this article in parts or in its entirety may be found online at:
http://bloodjournal.hematologylibrary.org/misc/rights.dtl#reprintsInformation about ordering reprints may be found online at:
http://bloodjournal.hematologylibrary.org/subscriptions/index.dtlInformation about subscriptions and ASH membership may be found online at:
. Hematology; all rights reservedCopyright 2007 by The American Society of 200, Washington DC 20036.semimonthly by the American Society of Hematology, 1900 M St, NW, Suite Blood (print ISSN 0006-4971, online ISSN 1528-0020), is published
For personal use only. at KOKUSAI SHOBO LTD on April 10, 2008. www.bloodjournal.orgFrom
TRANSPLANTATION
CCL8 is a potential molecular candidate for the diagnosis ofgraft-versus-host diseaseTsukasa Hori,1,2 Yasuyoshi Naishiro,1 Hitoshi Sohma,1 Nobuhiro Suzuki,2 Naoki Hatakeyama,2 Masaki Yamamoto,1,2
Tomoko Sonoda,3 Yuka Mizue,4 Kohzoh Imai, Hiroyuki Tsutsumi,2 and Yasuo Kokai1
1Department of Biomedical Engineering, 2Department of Pediatrics, and 3Department of Public Health, Sapporo Medical University School of Medicine,Sapporo; and 4Sapporo ImmunoDiagnostic Laboratory, Sapporo, Japan
Although graft-versus-host disease (GVHD)is a life-threatening complication of hemato-poietic stem-cell transplantation (HSCT), itscurrent diagnosis depends mainly on clini-cal manifestations and invasive biopsies.Specific biomarkers for GVHD would facili-tate early and accurate recognition of thisgrave condition. Using proteomics, wescreened for plasma proteins specific forGVHD in a mouse model. One peak with8972-Da molecular mass (m/z) retained adiscriminatory value in 2 diagnostic groups
(GVHD and normal controls) with increasedexpression in the disease and decreasedexpression during cyclosporin A treatment,and was barely detectable in syngeneictransplantation. Purification and mass ana-lysis identified this molecule as CCL8, amember of a large chemokine family. Inhuman samples, the serum concentration ofCCL8 correlated closely with GVHD sever-ity. All non-GVHD samples contained lessthan 48 pg/mL (mean � SE: 22.5 � 5.5 pg/mL, range: 12.6-48.0 pg/mL, n � 7). In sharp
contrast, CCL8 was highly up-regulated inGVHD sera ranging from 52.0 to 333.6 pg/mL (mean � SE: 165.0 � 39.8 pg/mL, n � 7).Strikingly, 2 patients with severe fatal GVHDhad extremely high levels of CCL8 (333.6and 290.4 pg/mL. CCL8 is a promising spe-cific serum marker for the early and accu-rate diagnosis of GVHD. (Blood. 2008;111:4403-4412)
© 2008 by The American Society of Hematology
Introduction
Hematopoietic stem-cell transplantation (HSCT) can be curativefor many hematologic, oncologic, metabolic, and immune disor-ders. However, despite 2 decades of great advances in posttransplan-tation immunosuppressive therapy, graft-versus-host disease(GVHD) remains a major life-threatening posttransplantation com-plication. Thirty to eighty percent of hematopoietic stem cell(HSC) transplant recipients develop GVHD, the risk depending onthe degree of histoincompatibility between donor and recipient, thetype of transplantation, the number of T cells in the graft, theunderlying disease, and the immunosuppressive treatment.1 Cur-rently the diagnosis of GVHD is mainly clinical, based on skinrash, hyperbilirubinemia, and diarrhea. A simple noninvasivemeans of early and more precise diagnosis of GVHD wouldfacilitate its early treatment and improve the outcome of HSCT.
Recent advances in proteomics have created new techniques toexamine the global expression of proteins in biologic fluids and toidentify novel biomarkers in disease or pathologic states. One suchtechnique is surface enhanced laser desorption/ionization time-of-flight mass spectrometry (SELDI-TOF MS), a high-throughput andsensitive proteomic approach to segregate proteins from complexbodily fluids such as plasma and to generate comparative proteinprofiles. In SELDI, proteins from complex biologic samples bindselectively to chemically modified affinity surfaces on a Protein-Chip (Ciphergen Biosystems, Fremont, CA), with nonspecificallybound impurities washed away. Captured proteins are then ana-lyzed by TOF-MS, producing spectra of the molecular mass (m/z)and relative concentration (intensity) of each protein. Recently this
technology has been successfully applied to the diagnosis of cancerand other diseases.2-5
Previous reports have described proteomic analysis of humanbiofluids in GVHD.6-8 However, in human clinical studies unavoid-able experimental artifacts related to genetic and environmentalfactors may confound the discovery of novel biomarkers. This isespecially true in patients undergoing HSCT, who have a widevariety of preexisting diseases, undergo diverse conditioningregimens and GVHD prophylaxis, and have other variables. Mousemodels provide an invaluable experimental system for studyinghuman GVHD pathogenesis. To reduce these confounding vari-ables, we looked first for diagnostic biomarkers for GVHD in amouse model. These experiments suggested several candidateproteins linked to GVHD. One peak with 8972 Da m/z clearlydiscriminated between GVHD mice and normal controls withincreased expression in the disease. Furthermore, administration ofcyclosporin A to overt GVHD mice decreased the plasma level ofthis peak. In syngeneic transplantation, the 8972-Da peak wasbarely detectable. Purification and mass spectrometric analysisidentified this molecule as CCL8, a member of a large chemokinefamily derived from a lineage of macrophages and other cell types.In human studies, we examined the serum concentration of CCL8in relation to GVHD severity. CCL8 proved to be highly up-regulated in GVHD serum and 2 patients with severe, eventuallyfatal, GVHD had extremely elevated serum levels of CCL8. Ourdata suggest that serum CCL8 might be a highly specific test for theearly and accurate clinical diagnosis of GVHD.
Submitted June 21, 2007; accepted January 31, 2008. Prepublished online asBlood First Edition paper, February 6, 2008; DOI 10.1182/blood-2007-06-097287.
The online version of this article contains a data supplement.
The publication costs of this article were defrayed in part by page chargepayment. Therefore, and solely to indicate this fact, this article is herebymarked ‘‘advertisement’’ in accordance with 18 USC section 1734.
© 2008 by The American Society of Hematology
4403BLOOD, 15 APRIL 2008 � VOLUME 111, NUMBER 8
For personal use only. at KOKUSAI SHOBO LTD on April 10, 2008. www.bloodjournal.orgFrom
Methods
Mice
Male C57BL/6(H-2b) mice and female BALB/c(H-2d) mice were obtainedfrom Sankyo Labo Service (Tokyo, Japan) and were bred in the Institute ofAnimal Experiment at Sapporo Medical University. Mouse ages rangedbetween 7 and 12 weeks at the start of experiments. The Sapporo MedicalUniversity Animal Experimental Ethics Committee approved the studies.
Reagents
All reagents were purchased from SIGMA/ALDRICH (Tokyo, Japan)unless otherwise indicated.
Bone marrow transplantation
On the day of bone marrow transplantation (BMT), donor mice (C57BL/6for allogeneic BMT; BALB/c for syngeneic BMT) were killed by cervicaldislocation. Donor bone marrow cells were collected into Dulbeccomodified Eagle medium with 2% fetal calf serum/1% penicillin-streptomycin by flushing the femurs and tibias, and a single-cell suspensionwas prepared. Cells were washed and resuspended with RPMI1640 medium for intravenous injection through the caudal vein. BMinoculum consisted of 2 � 107 BM cells for allogeneic and syngeneic BMT.Recipient BALB/c mice were fed with acidified water for at least 7 daysbefore BMT to prevent sepsis after lethal irradiation. Recipient mice weregiven 8.5 Gy total body irradiation at a rate of 0.34 Gy/min and injectedwith donor BM cells within 3 hours.
GVHD monitoring
Recipient mice were monitored daily for clinical manifestations of GVHDincluding weight loss, hunched posture, skin erythema, alopecia,and diarrhea.
Histopathologic analysis
Recipient mice were killed on day 7, day 14, day 21, or day 28 aftertransplantation. Skin, liver, and small intestine were removed, fixed in 10%buffered formalin, and stained with hematoxylin and eosin for microscopy.Histologic changes in representative organs considered compatible withGVHD were as follows: skin (mononuclear infiltration into the dermo-epidermal junction and injury to hair follicles or sebaceous glands); liver(periportal mononuclear infiltration and hepatocellular necrosis); and smallintestine (crypt cell apoptosis and dilatation or flattening of the villi).Findings were scored and given an overall interpretation of positive (�),indefinite (�), or negative (�) for GVHD.9,10 Representative histologicfindings are shown in Figure S1 (available on the Blood website; see theSupplemental Materials link at the top of the online article).
Treatment of GVHD with cyclosporin A
Cyclosporin A (CsA; Novartis Pharma AG, Wilmington, DE) was diluted to1.67 mg/mL with 0.9% NaCl. CsA 20 mg/kg daily was administeredintraperitoneally from day 8 through day 13 after transplantation.
Treatment of mice with lipopolysaccharide or poly(I:C)
BALB/c mice received a transplant of 2 � 107 syngeneic marrow cells. Onday 7 after transplantation, mice were injected intraperitoneally with either5 �g lipopolysaccharide (LPS, Escherichia coli) or 5 �g poly(I:C) (GEHealthcare BioSciences, Tokyo, Japan) plus 20 mg D-GalN.11 Four hoursafter injection, blood was collected. Doses of LPS or poly(I:C) weredetermined by preliminary experiments.
Mouse plasma samples
Plasma was sampled before BMT on day 0, and after BMT on days 7, 14,21, and 28. Blood was obtained from the tail vein of living mice using a
capillary tube coated with heparin and then centrifuged at 2400g for7 minutes within 30 minutes after bleeding. Aliquots of plasma were storedat �80°C until assayed.
SELDI protein chip array analysis
We added 20 �L of a solution containing 9 M/L urea and 10 g/L CHAPS in10 mM Tris-HCl, pH7.4, to 10 �L of each sample. The mixture wasvortex-mixed at 4°C for 15 minutes and diluted 1 to 40 in Tris-HCl.Eight-spot immobilized metal-affinity capture arrays (IMAC-30) wereactivated with 50 mM/L CuSO4. Diluted samples (50 �L) were applied toeach spot on the protein chip array and incubated for 1 hour on a shaker.After washing with the same Tris-HCl followed by a quick water rinse,0.5 �L saturated sinapinic acid (SPA) was applied twice to each spot andallowed to air-dry. Mass/charge (m/z) spectra of proteins bound to thechelated metal (through tryptophan, cysteine, histidine, or phosphorylatedamino acids) were generated in a Ciphergen Protein Biology System IITime-of-Flight mass spectrometer (PBS II; Ciphergen Biosystems). Datawere collected by averaging 65 laser shots with a laser intensity of 200 anda detector sensitivity of 8.
Statistical analysis of SELDI-TOF mass spectra
All spectra were compiled and we performed preliminary data analysisusing Ciphergen ProteinChip Software 3.2.0 (Ciphergen Biosystems). Them/z values less than 2.0 kDa, corresponding to the signal from the SPAmatrix, were omitted. Raw data were normalized and aligned by BiomarkerWizard (Ciphergen Biosystems). A classification tree was developed withBiomarker Pattern’s Software (BPS; Ciphergen Biosystems) as previouslydescribed.12-14 Briefly, classification trees split the data into 2 nodes, usingone rule at a time in the form of a question. The splitting decisions in thiscase were based on the normalized intensity levels of peaks or clustersidentified from the SELDI protein-expression profile. Each identified peakor cluster becomes a variable in the classification process. Splitting iscontinued until terminal nodes are reached, and further splitting gives nogain in data classification. Multiple classification trees were generated usingthis process, and the best performing tree was chosen.
Protein purification
The 3 most abundant plasma proteins (albumin, IgG, transferrin) in thepooled plasma were removed by immunodepletion chromatography (Mul-tiple Affinity Removal Column MS-3, 4.6 mmID � 50 mm; Agilent, Wil-mington, DE). Plasma (50 �L) was diluted 5-fold in Buffer-A (Agilent),then injected onto the immunodepletion column. The flow-through frac-tions were collected and further resolved by high-performance liquidchromatography (HPLC, PU-2089plus; JASCO Engineering, Tokyo, Ja-pan). The separation column used in HPLC was an Inertsil Ph column(5 �m, 4.6 mmID � 150 mm; GL Sciences, Tokyo, Japan). The elutiongradient profile was as follows: (1) elution solvent A: 2% ACN/0.1% TFA,solvent B: 80% ACN/ 0.1% TFA; (2) liner gradient: 0% to 100% for solventB for 50 minutes; flow rate: 1.0 mL/min. Fractions were collected every30 seconds and their composition was monitored by SELDI-TOF MS; 2 �Lof each fraction was applied on an Au chip (Ciphergen Biosystems) andprocessed with SPA matrix as described above. HPLC fractions containingcandidate markers were selected according to SELDI-TOF MS monitoring.The fractionated samples were lyophilized and dissolved in 200 �Lsolubilization buffer (7 M urea, 2 M thiourea, 50 mM DTT, 2% ampholine,3% CHAPS, 1% Triton X100). After sonication, sample solutions wereloaded onto an IPG gel strip (pH 3-11 NL, 11 cm long; GE HealthcareBioSciences, Piscataway, NJ), and the strip was rehydrated for 10 hours at30 V. The first-dimensional separation by isoelectric focusing (IEF) wascarried out using the IPGphor system (GE Healthcare BioSciences, Tokyo,Japan) at 20°C for a total of 12 kV/h. After IEF, the IPG strips wereequilibrated for 15 minutes in 50 mM Tris-HCl (pH 8.8) containing 6 Murea, 2% sodium dodecyl sulfate (SDS), 30% glycerol, 0.002% bromophe-nol blue, and 1% dithiothreitol and then re-equilibrated for 15 minutes inthe same buffer except 2.5% iodoacetamide replaced dithiothreitol. For thesecond-dimensional separation, SDS–polyacrylamide gel electrophoresis
4404 HORI et al BLOOD, 15 APRIL 2008 � VOLUME 111, NUMBER 8
For personal use only. at KOKUSAI SHOBO LTD on April 10, 2008. www.bloodjournal.orgFrom

(PAGE) was performed on homemade 8% to 20% gradient polyacrylamidegels and electrophoresed with a constant current of 40 mA/gel. After2-dimensional electrophoresis (2DE), proteins were visualized with a silverstaining kit (EzStain; ATTO, Tokyo, Japan).
Protein identification
Gel spots were washed with 100%ACN and 100 mM NH4HCO3, vacuum-dried,and then incubated in 5 �L trypsin solution (12.5 ng/�L in 50 mM NH4HCO3,5 mM CaCl2) for 16 hours at 37°C. The resultant peptides were extracted oncewith 20 �Lof 20 mM NH4HCO3 and 3 times with 20 �Lof 5% formic acid/50%ACN. The collected extracts were vacuum-dried to approximately 40 �L andthen analyzed by nanoflow HPLC-ESI-MS/MS. HPLC was performed using aDiNa system (KYA Technology, Tokyo, Japan), and tryptic digest samples wereseparated on a HiQsilC18W-3 column (75 �mID � 50 mm; KYA Technology).Elution solvent A was 0.1% formic acid, while solvent B was 70% ACN/0.1%formic acid. The gradient separation was 0% to 50% solvent B over 40 minutes ata flow rate of 200 nL/min. The separated peptides were characterized using aQSTAR XL Q-TOF mass spectrometer (Applied Biosystems, Foster City, CA).Data were acquired in information-dependent acquisition mode using AnalystApplied Biosystems, and only multiple charged ions were chosen for MS/MS.Each cycle was composed of 1-s MS and 2-s MS/MS. The acquired mass spectraldata were automatically processed and searched against the Swiss Prot databaseusing MASCOT software (Matrix Science, London, United Kingdom) andProteinPilot software (Applied Biosystems). The search parameters were asfollows: MS accuracy: 0.2 Da; MS/MS accuracy for the MASCOTsearch: 0.2 Da.
SELDI immunoassay (immunoSELDI)
PS20 (preactivated surface) ProteinChip surface (Ciphergen Biosystems) iscomposed of epoxides that form stable covalent linkages with amino groupsof biomolecules (such as Abs). Ab (0.1 �g) was added to each spot of aPS20 chip and incubated for 2 hours at room temperature. After blockingresidual active sites with 5 �L 1 M ethanolamine (pH 8.0) for 30 minutes,the spots were washed 3 times with 0.5% Triton X100 in PBS and twicewith PBS. Mouse plasma samples were diluted 1:75 and human sera 1:25with PBS and incubated for 2 hours under gentle mixing at roomtemperature. Each spot was washed twice with 0.5% Triton X100 in PBSand twice with PBS. After a rapid wash with 5 mM HEPES, SPA matrix wasadded and MS analysis performed using a PBS II ProteinChip reader.
Case reports
Fourteen patients underwent HSCT between April 1993 and December2005 in the Department of Pediatrics, Sapporo Medical University Hospi-tal. The median age was 8.9 years (range: 1-20 years, Table 3). The gradingof GVHD was based on that used by Przepiorka et al15 Detailed clinicalfeatures of the patients in Figure 6 were as follows.
Patient A. A 5-year-old boy with Fanconi anemia received a cord bloodstem-cell transplant from an unrelated donor. He received pretransplanta-tion conditioning composed of 3 Gy total body irradiation (TBI) with200 mg/m2 fludarabine (Flu) and 40 mg/kg cyclophosphamide (CY), andGVHD prophylaxis with CsA and mycofenolate mofetil. GVHD firstdeveloped on day 13 after HSCT with skin rash (stage 2, grade II GVHD),and on day 26 diarrhea increased (grade III GVHD). Methyl prednisolone(mPSL) was started on day 13 (Figure 6A).
Patient B. A 10-year-old boy with chronic myelogenous leukemiareceived a bone marrow transplant from an unrelated donor. He receivedpretransplantation conditioning composed of 12 Gy TBI with 120 mg/kgCY, and GVHD prophylaxis with tacrolimus and methotrexate. GVHDdeveloped on posttransplantation day 19 with skin rash (stage 2, grade IGVHD), and diarrhea increased on day 27 (stage 3, grade III GVHD).mPSL was started on day 19 (Figure 6B).
Patient C. A 3-year-old girl with acute lymphoblastic leukemia re-ceived a bone marrow transplant from an HLA-matched sister. Herpretransplantation conditioning was composed of 12 Gy TBI and 120 mg/kg CY, and her GVHD prophylaxis was methotrexate. She had no evidenceof GVHD throughout her course (Figure 6C).
Human sera
The Sapporo Medical University Ethics Committee approved human serastudies. All volunteers and patients provided written permission and foryoung children we obtained written permission from their parents inaccordance with the Declaration of Helsinki. Sera were aliquoted and storedat �80°C until assayed.
Enzyme-linked immunosorbent assay (ELISA) for human CCL8
Seven independent samples from 7 patients without GVHD and 7 from 7 patientswith GVHD (more than grade II) were assayed by ELISA in duplicate. AfterHSCT, sera were obtained at the time of clinical diagnosis of GVHD. Theconcentration of CCL8 was quantified using an ELISA kit for human CCL8.
Immunologic reagents
Polyclonal antibodies against mouse or human CCL8 were purchased fromPeprotech (London, United Kingdom). The human CCL8 ELISA kit waspurchased from RayBiotech (Norcross, GA) and the mouse IL-6 kit fromR&D Systems (Minneapolis, MN). These were used according to themanufacturer’s protocol. Plates were read with a plate reader (MultiskanJX; Thermo Labsystems, Helsinki, Finland) at 450 nm.
Statistical analysis
The results are expressed as the mean plus or minus SE. Statisticalsignificance analyses were performed by either paired or unpaired t test asindicated in the figure legends. A significant difference was set at P less than.05. The Bonferroni correction for multiple comparisons was applied. Theresults were representative data from a set of experiments.
Results
GVHD model
Acute GVHD was induced in BALB/c mice by injection of BMgrafts from C57BL/6. In these mice, clinical symptoms of acuteGVHD, such as diarrhea and ruffled fur, became apparent within7 days, and skin erythema and alopecia developed within 21 daysafter transplantation. For controls, an identical number of synge-neic grafts were transplanted. The recipient mice who receivedallogeneic marrow cells but not those given syngeneic cells hadpathologic evidence of GVHD at all time points after transplanta-tion (Table 1; Figure S1).
Table 1. Histologic findings of recipient mice
Group/days
Liver Intestine Skin
� �/� � � �/� � � �/� �
Syngeneic*
7 0 1 3 0 0 4 0 0 4
14 0 0 4 0 0 4 0 1 3
21 0 0 4 0 0 4 0 0 4
28 0 0 4 0 0 4 0 0 4
Allogeneic†
7 5 1 0 4 2 0 4 2 0
14 6 0 0 6 0 0 5 1 0
21 6 0 0 6 0 0 6 0 0
28 4 2 0 5 1 0 5 1 0
Formalin-fixed paraffin-embedded sections were stained with hematoxylin andeosin, randomized, and read blindly by an experienced pathologist (Y.K.). Findings,as mentioned in “Histopathologic analysis,” were scored and given an overallinterpretation of positive (�), indefinite (�/�), or negative (�) for GVHD.
Days indicates days after bone marrow transplantation; and no., number of miceanalyzed.
*n � 4.†n � 6.
CCL8 IS A BIOMARKER FOR GVHD 4405BLOOD, 15 APRIL 2008 � VOLUME 111, NUMBER 8
For personal use only. at KOKUSAI SHOBO LTD on April 10, 2008. www.bloodjournal.orgFrom

Protein profiling by SELDI-TOF MS
The peak intensity values of 169 differentially expressed peaksidentified in all samples from 2.0 to 200 kDa mass ranges wereused for further analysis. Classification trees were created using all169 peaks, and on analysis a single peak with average mass of8972 Da that distinguished GVHD plasma from normal plasmawas identified (Table 2; Figure S2).
Increase of 8972-Da peak in GVHD plasma
Figure 1A shows changes of intensity of the 8972-Da peak from anindividual mouse at each time point. Compared with day 0 (beforetransplantation), we first detected an apparent increase of the8972-Da peak on day 7 after BMT. The intensity of the 8972-Dapeak was 4.6 at day 0, which increased to 47.3, 51.4, 25.2, and 55.9on days 7, 14, 21, and 28, respectively. All increases in peakintensity of GVHD samples were significantly higher than those insyngeneic controls at posttransplantation sampling days 7, 14, 21, and28 (Figure 1B). The increase on days 7, 14, 21, and 28 of allogeneicsamples was also significantly higher than the day-0 samples.
CsA treatment decreased intensity of the 8972-Da peak inGVHD mice
Figure 2 shows the effects of CsA treatment on the 8972-Da peak. Itsintensity was 5.8 on day 0 and it increased to 69.4 on day 7. CsA wasadministered from day 8 to day 13, and the 8972-Da peak decreased to13.8, 15.7, and 14.3 on days 14, 21, and 28, respectively (Figure 2A).This decrease was statistically significant (Figure 2B).
LPS or poly(I:C) treatment did not increase the 8972-Da peak
Figure 3A shows the effect of LPS or poly(I:C) on the 8972-Dapeak in syngeneic BMT. Neither LPS nor poly(I:C) increased the
Table 2. Peaks detected by SELDI screening of mouse plasma
Up-regulated in GVHD Down-regulated in GVHD
m/z Fold* m/z Fold
2941 22.2 7487 �6.6
3222 12.3 7590 �7.1
4391 12.4 7917 �8.5
5085 6.1 15148 �5.5
8972† 12.3 15349 �6.5
9182 9.9 15799 �5.5
10561 8.3 15905 �5.5
11049 7.3 15989 �6.8
11279 9.6 31841 �6.2
12821 10.0 — —
*Change in relative intensity of each ion peak between GVHD and control plasmais shown.
†8972-Da peak selected for further study.
Figure 1. Increase of 8972-Da peak in mouse GVHD plasma. (A) Representative SELDI spectra of the 8972-Da peak at day 0 obtained from pretransplantation and GVHDplasma (days 7, 14, 21, and 28 after transplantation) from an individual mouse are shown. The m/z range of 6000 to 10 000 m/z is shown. The box highlights an 8972-Da peakthat is increased in intensity in GVHD plasma compared with day-0 samples. Number at the top and bottom of the figure indicates m/z. The left column indicates relativeintensity of the ion peak. The Peak intensity of 8972 Da is 4.6, 47.3, 51.4, 25.2, and 55.9 on days 0, 7, 14, 21, and 28, respectively. (B) Mean normalized intensity values for8972-Da peak in samples at each time point (day 0 is before transplantation; days 7, 14, 21, and 28 are after transplantation). The average intensity � SE is depicted (n � 9).All GVHD samples (closed column except day-0 samples) were significantly higher than that of syngeneic controls (open column) on posttransplantation days 7, 14, 21, and 28as judged by an unpaired t test. Increases on days 7, 14, 21, and 28 of allogeneic samples were also significantly higher than that of day-0 samples (before transplantation)(paired t test). Asterisk indicates P value.
4406 HORI et al BLOOD, 15 APRIL 2008 � VOLUME 111, NUMBER 8
For personal use only. at KOKUSAI SHOBO LTD on April 10, 2008. www.bloodjournal.orgFrom
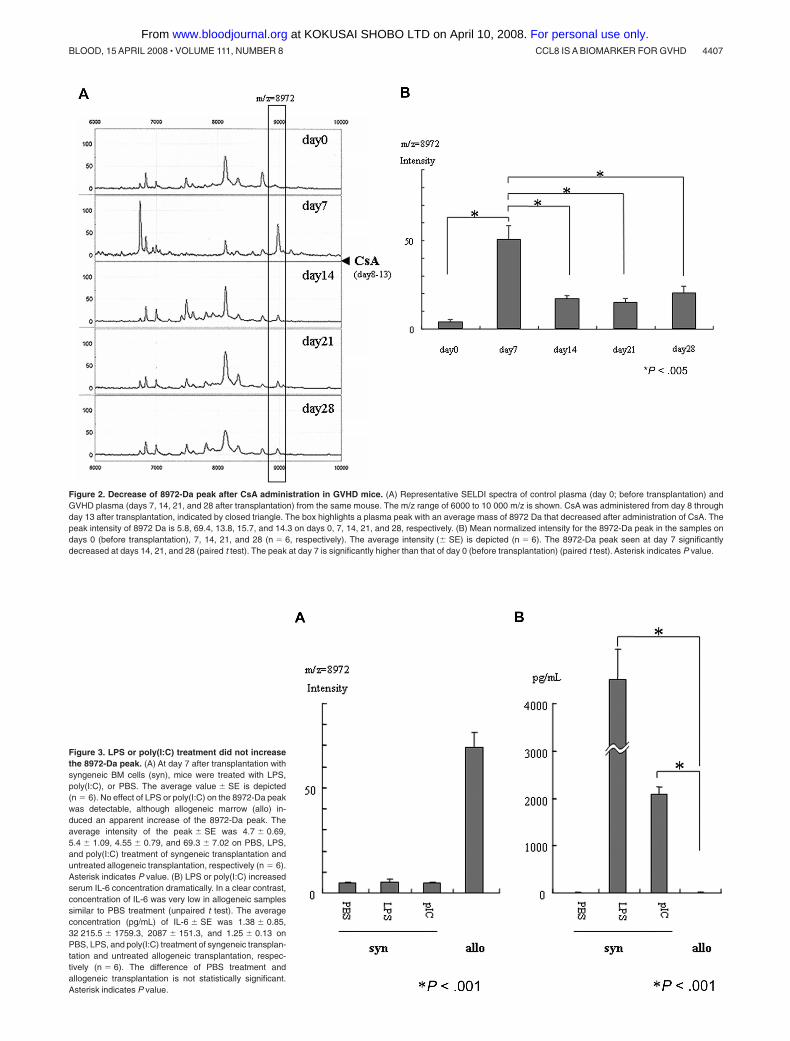
Figure 2. Decrease of 8972-Da peak after CsA administration in GVHD mice. (A) Representative SELDI spectra of control plasma (day 0; before transplantation) andGVHD plasma (days 7, 14, 21, and 28 after transplantation) from the same mouse. The m/z range of 6000 to 10 000 m/z is shown. CsA was administered from day 8 throughday 13 after transplantation, indicated by closed triangle. The box highlights a plasma peak with an average mass of 8972 Da that decreased after administration of CsA. Thepeak intensity of 8972 Da is 5.8, 69.4, 13.8, 15.7, and 14.3 on days 0, 7, 14, 21, and 28, respectively. (B) Mean normalized intensity for the 8972-Da peak in the samples ondays 0 (before transplantation), 7, 14, 21, and 28 (n � 6, respectively). The average intensity (� SE) is depicted (n � 6). The 8972-Da peak seen at day 7 significantlydecreased at days 14, 21, and 28 (paired t test). The peak at day 7 is significantly higher than that of day 0 (before transplantation) (paired t test). Asterisk indicates P value.
Figure 3. LPS or poly(I:C) treatment did not increasethe 8972-Da peak. (A) At day 7 after transplantation withsyngeneic BM cells (syn), mice were treated with LPS,poly(I:C), or PBS. The average value � SE is depicted(n � 6). No effect of LPS or poly(I:C) on the 8972-Da peakwas detectable, although allogeneic marrow (allo) in-duced an apparent increase of the 8972-Da peak. Theaverage intensity of the peak � SE was 4.7 � 0.69,5.4 � 1.09, 4.55 � 0.79, and 69.3 � 7.02 on PBS, LPS,and poly(I:C) treatment of syngeneic transplantation anduntreated allogeneic transplantation, respectively (n � 6).Asterisk indicates P value. (B) LPS or poly(I:C) increasedserum IL-6 concentration dramatically. In a clear contrast,concentration of IL-6 was very low in allogeneic samplessimilar to PBS treatment (unpaired t test). The averageconcentration (pg/mL) of IL-6 � SE was 1.38 � 0.85,32 215.5 � 1759.3, 2087 � 151.3, and 1.25 � 0.13 onPBS, LPS, and poly(I:C) treatment of syngeneic transplan-tation and untreated allogeneic transplantation, respec-tively (n � 6). The difference of PBS treatment andallogeneic transplantation is not statistically significant.Asterisk indicates P value.
CCL8 IS A BIOMARKER FOR GVHD 4407BLOOD, 15 APRIL 2008 � VOLUME 111, NUMBER 8
For personal use only. at KOKUSAI SHOBO LTD on April 10, 2008. www.bloodjournal.orgFrom
8972-Da peak, although allogeneic marrow transplantation appar-ently increased it. LPS or poly(I:C) increased serum IL-6 concentra-tion dramatically, although allogeneic marrow transplantation didnot increase serum IL-6 at day 7 after transplantation (Figure 3B).
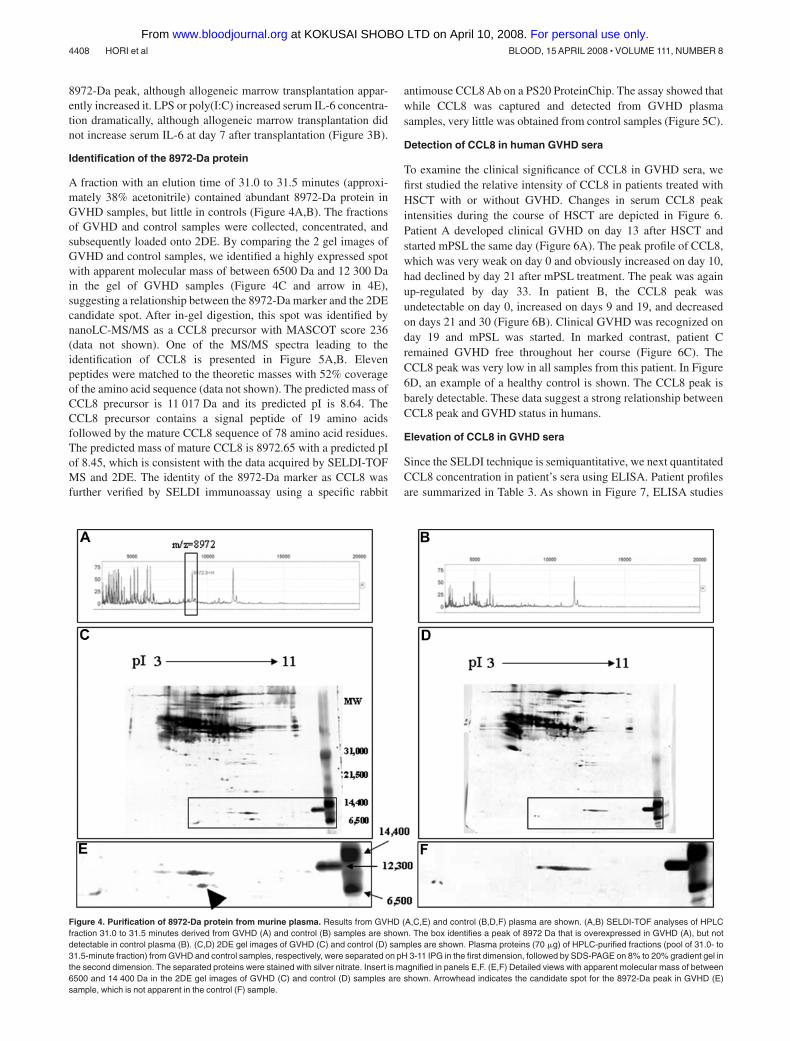
Identification of the 8972-Da protein
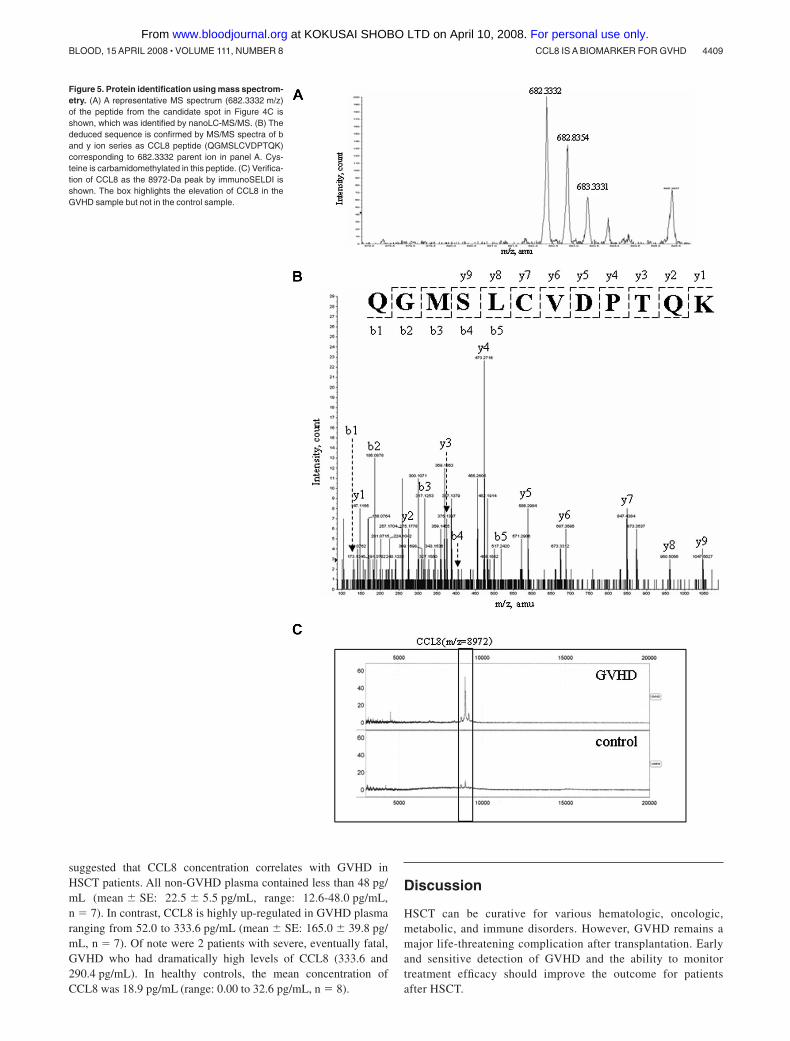
A fraction with an elution time of 31.0 to 31.5 minutes (approxi-mately 38% acetonitrile) contained abundant 8972-Da protein inGVHD samples, but little in controls (Figure 4A,B). The fractionsof GVHD and control samples were collected, concentrated, andsubsequently loaded onto 2DE. By comparing the 2 gel images ofGVHD and control samples, we identified a highly expressed spotwith apparent molecular mass of between 6500 Da and 12 300 Dain the gel of GVHD samples (Figure 4C and arrow in 4E),suggesting a relationship between the 8972-Da marker and the 2DEcandidate spot. After in-gel digestion, this spot was identified bynanoLC-MS/MS as a CCL8 precursor with MASCOT score 236(data not shown). One of the MS/MS spectra leading to theidentification of CCL8 is presented in Figure 5A,B. Elevenpeptides were matched to the theoretic masses with 52% coverageof the amino acid sequence (data not shown). The predicted mass ofCCL8 precursor is 11 017 Da and its predicted pI is 8.64. TheCCL8 precursor contains a signal peptide of 19 amino acidsfollowed by the mature CCL8 sequence of 78 amino acid residues.The predicted mass of mature CCL8 is 8972.65 with a predicted pIof 8.45, which is consistent with the data acquired by SELDI-TOFMS and 2DE. The identity of the 8972-Da marker as CCL8 wasfurther verified by SELDI immunoassay using a specific rabbit
antimouse CCL8 Ab on a PS20 ProteinChip. The assay showed thatwhile CCL8 was captured and detected from GVHD plasmasamples, very little was obtained from control samples (Figure 5C).
Detection of CCL8 in human GVHD sera
To examine the clinical significance of CCL8 in GVHD sera, wefirst studied the relative intensity of CCL8 in patients treated withHSCT with or without GVHD. Changes in serum CCL8 peakintensities during the course of HSCT are depicted in Figure 6.Patient A developed clinical GVHD on day 13 after HSCT andstarted mPSL the same day (Figure 6A). The peak profile of CCL8,which was very weak on day 0 and obviously increased on day 10,had declined by day 21 after mPSL treatment. The peak was againup-regulated by day 33. In patient B, the CCL8 peak wasundetectable on day 0, increased on days 9 and 19, and decreasedon days 21 and 30 (Figure 6B). Clinical GVHD was recognized onday 19 and mPSL was started. In marked contrast, patient Cremained GVHD free throughout her course (Figure 6C). TheCCL8 peak was very low in all samples from this patient. In Figure6D, an example of a healthy control is shown. The CCL8 peak isbarely detectable. These data suggest a strong relationship betweenCCL8 peak and GVHD status in humans.
Elevation of CCL8 in GVHD sera
Since the SELDI technique is semiquantitative, we next quantitatedCCL8 concentration in patient’s sera using ELISA. Patient profilesare summarized in Table 3. As shown in Figure 7, ELISA studies
Figure 4. Purification of 8972-Da protein from murine plasma. Results from GVHD (A,C,E) and control (B,D,F) plasma are shown. (A,B) SELDI-TOF analyses of HPLCfraction 31.0 to 31.5 minutes derived from GVHD (A) and control (B) samples are shown. The box identifies a peak of 8972 Da that is overexpressed in GVHD (A), but notdetectable in control plasma (B). (C,D) 2DE gel images of GVHD (C) and control (D) samples are shown. Plasma proteins (70 �g) of HPLC-purified fractions (pool of 31.0- to31.5-minute fraction) from GVHD and control samples, respectively, were separated on pH 3-11 IPG in the first dimension, followed by SDS-PAGE on 8% to 20% gradient gel inthe second dimension. The separated proteins were stained with silver nitrate. Insert is magnified in panels E,F. (E,F) Detailed views with apparent molecular mass of between6500 and 14 400 Da in the 2DE gel images of GVHD (C) and control (D) samples are shown. Arrowhead indicates the candidate spot for the 8972-Da peak in GVHD (E)sample, which is not apparent in the control (F) sample.
4408 HORI et al BLOOD, 15 APRIL 2008 � VOLUME 111, NUMBER 8
For personal use only. at KOKUSAI SHOBO LTD on April 10, 2008. www.bloodjournal.orgFrom
suggested that CCL8 concentration correlates with GVHD inHSCT patients. All non-GVHD plasma contained less than 48 pg/mL (mean � SE: 22.5 � 5.5 pg/mL, range: 12.6-48.0 pg/mL,n � 7). In contrast, CCL8 is highly up-regulated in GVHD plasmaranging from 52.0 to 333.6 pg/mL (mean � SE: 165.0 � 39.8 pg/mL, n � 7). Of note were 2 patients with severe, eventually fatal,GVHD who had dramatically high levels of CCL8 (333.6 and290.4 pg/mL). In healthy controls, the mean concentration ofCCL8 was 18.9 pg/mL (range: 0.00 to 32.6 pg/mL, n � 8).
Discussion
HSCT can be curative for various hematologic, oncologic,metabolic, and immune disorders. However, GVHD remains amajor life-threatening complication after transplantation. Earlyand sensitive detection of GVHD and the ability to monitortreatment efficacy should improve the outcome for patientsafter HSCT.
Figure 5. Protein identification using mass spectrom-etry. (A) A representative MS spectrum (682.3332 m/z)of the peptide from the candidate spot in Figure 4C isshown, which was identified by nanoLC-MS/MS. (B) Thededuced sequence is confirmed by MS/MS spectra of band y ion series as CCL8 peptide (QGMSLCVDPTQK)corresponding to 682.3332 parent ion in panel A. Cys-teine is carbamidomethylated in this peptide. (C) Verifica-tion of CCL8 as the 8972-Da peak by immunoSELDI isshown. The box highlights the elevation of CCL8 in theGVHD sample but not in the control sample.
CCL8 IS A BIOMARKER FOR GVHD 4409BLOOD, 15 APRIL 2008 � VOLUME 111, NUMBER 8
For personal use only. at KOKUSAI SHOBO LTD on April 10, 2008. www.bloodjournal.orgFrom

Recently, proteomics has emerged as a key technique to identifybiomarkers and disease targets. To discover novel biomarkers forGVHD, we used SELDI-TOF MS, which is one of severalhigh-throughput technologies able to generate peptide and proteinprofiles of complex biologic samples with high sensitivity, reproduc-ibility, and simplicity. Using the SELDI technique, we firstcompared plasma protein profiles between control and GVHDmice. Since human samples have intrinsic person-to-person variabil-ity that may obscure the discovery of new biomarkers, weconsidered that the relative simplicity of an animal model ofGVHD would give better analytic power including estimates ofspecificity and sensitivity. We selected an 8972-Da protein as apotential plasma biomarker for GVHD in mice and also determinedits expression in syngeneic transplantation, and after CsA, LPS, orpoly(I:C) treatment. The 8972-Da expression was not increased in
syngeneic combination mice, suggesting that it is not induced bypretreatment regimens given before bone marrow transplantationincluding radiation. Decrease of the 8972-Da peak expressionfollowing CsA administration in GVHD mice was strongly corre-lated with GVHD activity. Furthermore, neither LPS nor poly(I:C)induced an 8972-Da peak. These results suggest the probableexistence of a protein or proteins linked to the onset and severity ofGVHD at least in mouse plasma. We identified this peak as CCL8,one of the CC chemokines.
As observed in the mice, we found elevated serum levels ofCCL8 in humans with GVHD but not in non-GVHD patients whohad undergone HSCT. These results suggest that CCL8 is apotential biomarker for human GVHD. Human CCL8 has 2 forms:one has 76 amino acids (1-76) with biologic activity, and the otherhas 71 amino acids (6-76) and no activity.16 We detected a single
Figure 6. CCL8 expression in human serum after HSCT. Serum was obtained at several time points after HSCT. The results of immunoSELDI using antibody specific forhuman CCL8 are shown. Box highlights peak of human CCL8. The predicted molecular mass of mature human CCL8 is 8920 Da. (A) Patient A developed clinical GVHD on day13 after HSCT and methyl prednisolone (mPSL) was administered the same day. The peak profile of CCL8 was very weak on day 0 with an obvious increase on day 10. CCL8then declined on day 21 after mPSL treatment, but was again up-regulated on day 33. The peak intensity of 8920 Da was 9.6, 40.6, 19.5, and 52.5 on days 0, 10, 21, and 33,respectively. (B) In patient B, no CCL8 peak was detected on day 0, but was increased on days 9 and 19, and decreased on days 21 and 30. Clinical GVHD was overt on day 19and mPSL treatment was started. The peak intensity of 8920 Da is 2.1, 14.3, 41.4, 12.3, and 12.7 on days 0, 9, 19, 21, and 30, respectively. (C) No GVHD developed in patientC throughout the course. CCL8 peak was very low in all samples examined. The peak intensity of 8920 Da is 5.8, 12.8, 4.1, 6.5, 6.2, and 3.0 on days �7, �1, 10, 20, 34, and 38,respectively. (D) An example of CCL8 expression in a healthy control is shown. CCL8 peak is very low. The peak intensity of 8920 Da is 5.3.
4410 HORI et al BLOOD, 15 APRIL 2008 � VOLUME 111, NUMBER 8
For personal use only. at KOKUSAI SHOBO LTD on April 10, 2008. www.bloodjournal.orgFrom

peak with 8920 Da (average mass). Since the biologic role ofhuman CCL8 is not well characterized, it should be determinedwhether this peak is derived from 1-76 or 6-76 CCL8. Beforeconcluding that CCL8 is a valid biomarker for GVHD, we mustdetermine whether it differentiates GVHD from other complica-tions with overlapping clinical features, such as veno-occulusivedisease (VOD), or viral reactivation. In preliminary studies, wefound that CCL8 was not elevated in 2 cases of VOD (data notshown). A previous study demonstrated that CCL8 levels wereincreased in patients with Gram-positive sepsis.17 Additionalstudies with larger populations of human patients after HSCT arecurrently under way and are essential to verify the role of CCL8 asa biomarker for human GVHD.
Chemokines are predominantly small molecules (8 to 12 kDa)that bind to G protein–coupled receptors (chemokine receptors)and function primarily in leukocyte migration.18 The chemokinesuperfamily currently comprises more than 50 members subclassi-fied into 4 families based on the arrangement of their cysteineresidues: CXC, C, CX3C, and CC.19 CCL8 is also known asmonocyte chemoattractant protein-2 (MCP-2). CCL2/MCP-1,CCL7/MCP-3, CCL8/MCP-2, and CCL13/MCP4 constitute asmall subfamily within the CC chemokine group, which acts as amajor chemoattractant for monocytes, activated T cells, anddendritic cells.20,21 Chemokine and chemokine receptor interac-tions play a crucial role in donor T-cell migration in GVHD.22-27
However none of the above studies addressed the role of CCL8.
The only report connecting CCL8 to GVHD was by Sugerman et alwho showed up-regulated gene expression of CCL8 in mousecutaneous GVHD.28
GVHD is initiated by allogeneic activation of donor T cellsby host-derived antigen presenting cells (APCs).9 Dendriticcells (DCs) are professional APCs that activate naive T cellsmost efficiently, and CCL8 is one of the chemokines secreted bymature DCs. These findings are consistent with our demonstra-tion that CCL8 expression is up-regulated during GVHD.Although the complex interactions of chemokines involved inthe induction of GVHD remain poorly understood, CCL8 isthought to be pivotal. CCL8 as a biomarker may facilitateearly diagnosis of GVHD and assessment of treatment response,since it seems to be engaged in the development and progressionof GVHD.
Acknowledgments
We thank Dr Peter M. Olley for helpful discussion and Englishrevision of our paper.
This study was supported by grants from the Ministry of Health,Labor and Welfare of Japan and from the Ministry of Education,Culture, Sports, Science and Technology of Japan.
Authorship
Contribution: T.H., Y.N., H.S., and Y.M. performed research; T.S.performed statistical analysis; N.S., N.H., M.Y., K.I., and H.T.
Table 3. Patient characteristics
No.
N 14
Sex
Male 7
Female 7
Diagnosis
ALL 7
CML 1
Aplastic anemia 3
Fanconi anemia 1
CGD 1
HLH 1
Donor
Related 8
Unrelated 6
Conditioning regimen
TBI � CY 5
TBI � Flu 2
TBI � VP � CY 1
Flu � CY 3
VP � BU � CY 1
CA � BU � VP � L-PAM 1
TBI � L-PAM 1
GVHD prophylaxis
CsA � MTX 5
FK � MTX 3
CsA � MMF 2
CsA 1
MTX 2
CsA � MTX � mPSL 1
ALL indicates acute lymphoblastic leukemia; CML, chronic myelogenous leuke-mia; CGD, chronic granulomatous disease; HLH, hemophagocytic lymphohistiocyto-sis; TBI, total body irradiation; CY, cyclophosphamide; Flu, fludarabine; VP, etopo-side; BU, busulfan; L-PAM, melphalan; CsA, cyclosporin A; MTX, methotrexate; FK,tacrolimus; MMF, mycofenolate mofetil; and mPSL, methyl prednisolone.
Figure 7. Concentration of CCL8 in human sera. Concentration of CCL8 in humansera was determined by ELISA for human CCL8. All sera from those who did notdevelop GVHD after HSCT (non-GVHD/HSCT) contained less than 48 pg/mL(mean � SE: 22.5 � 5.5 pg/mL, range: 12.6-48.0 pg/mL, n � 7). CCL8 washighly up-regulated in GVHD plasma (GVHD/HSCT) ranging from 52.0 to333.6 pg/mL (mean � SE: 165.0 � 39.8 pg/mL, n � 7). Two patients with severe,eventually fatal, GVHD showed extremely high levels of CCL8 (ie, 333.6 and290.4 pg/mL). In healthy controls (donors), mean concentration of CCL8 was18.9 pg/mL (range: 0.00 to 32.6 pg/mL, n � 8). The difference in serum concentra-tion of CCL8 was statistically significant between non-GVHD and GVHD plasmaobtained from patients undergoing HSCT.
CCL8 IS A BIOMARKER FOR GVHD 4411BLOOD, 15 APRIL 2008 � VOLUME 111, NUMBER 8
For personal use only. at KOKUSAI SHOBO LTD on April 10, 2008. www.bloodjournal.orgFrom
contributed vital new reagents or analytic tools; Y.K. designedresearch; T.H. and Y.K. wrote the paper.
Conflict-of-interest disclosure: The authors declare no compet-ing financial interests.
Correspondence: Yasuo Kokai, Department of BiomedicalEngineering, Sapporo Medical University School of Medicine,S1W17, Chuo-ku, Sapporo, 060-8556, Japan; e-mail:[email protected].
References
1. Sullivan KM. Graft vs. host disease. In: BlumeKG, Forman SJ, Appelbaum FR, eds. Thomas’Hematopoietic Cell Transplantation. 3rd ed. Mal-den, MA: Blackwell Publishing; 2004:635-664.
2. Petricoin EF, Ardekani AM, Hitt BA, et al. Use ofproteomic patterns in serum to identify ovariancancer. Lancet. 2002;359:572-577.
3. Li J, Orlandi R, White CN, et al. Independent vali-dation of candidate breast cancer serum biomark-ers identified by mass spectrometry. Clin Chem.2005;51:2229-2235.
4. Malik G, Ward MD, Gupta SK, et al. Serum levelsof an isoform of apolipoprotein A-II as a potentialmarker for prostate cancer. Clin Cancer Res.2005;11:1073-1085.
5. Sundsten T, Eberhardson M, Goransson M, Berg-sten P. The use of proteomics in identifying differ-entially expressed serum proteins in humans withtype 2 diabetes. Proteome Sci. 2006;4:22-31.
6. Kaiser T, Kamal H, Rank A, et al. Proteomics ap-plied to the clinical follow-up of patients after allo-geneic hematopoietic stem cell transplantation.Blood. 2004;104:340-349.
7. Wang H, Clouthier SG, Galchev V, et al. Intact-protein-based high-resolution three-dimensionalquantitative analysis system for proteome profil-ing of biological fluids. Mol Cell Proteomics. 2005;4:618-625.
8. Srinivasan R, Daniels J, Fusaro V, et al. Accuratediagnosis of acute graft-versus-host disease us-ing serum proteomic pattern analysis. Exp Hema-tol. 2006;34:796-801.
9. Shlomchik WD, Couzens MS, Tang CB, et al.Prevention of graft versus host disease by inacti-vation of host antigen-presenting cells. Science.1999;285:412-415.
10. Teshima T, Ordemann R, Reddy P, et al. Acutegraft-versus-host disease does not require al-loantigen expression on host epithelium. NatMed. 2002;8:575-581.
11. Alexopoulou L, Holt AC, Medzhitov R, Falvell RA.Recognition of double-stranded RNA and activa-tion of NF-kB by Toll-like receptor 3. Nature.2001;413:732-738.
12. Schwegler EE, Cazares L, Steel LF, et al. SELDI-TOF MS profiling of serum for detection of theprogression of chronic hepatitis C to hepatocellu-lar carcinoma. Hepatology. 2005;41:634-642.
13. Wadsworth JT, Somers KD, Cazares LH, et al.Serum protein profiles to identify head and neckcancer. Clin Cancer Res. 2004;10:1625-1632.
14. Bertone P, Kluger Y, Lan N, et al. SPINE: an inte-grated tracking database and data mining ap-proach for identifying feasible targets in high-throughput structural proteomics. Nucleic AcidsRes. 2001;29:2884-2898.
15. Przepiorka D, Weidorf D, Martin P, et al. Consen-sus conference on acute GVHD grading. BoneMarrow Transplant. 1995;15:825-828.
16. Proost P, Struyf S, Couvreur M, et al. Posttransla-tional modulations affects the activity of the hu-man monocyte chemotactic proteins MCP-1 andMCP-2: identification of MCP-2(6-76) as a naturalchemokine inhibitor. J Immunol. 1998;160:4034-4041.
17. Bossink AW, Paemen L, Jansen PM, Hack CE,Thijs LG, Van Damme J. Plasma levels of thechemokines monocyte chemotactic proteins-1and -2 are elevated in human sepsis. Blood.1995;86:3841-3847.
18. Moser B, Wolf M, Walz A, Loetscher P. Chemo-
kines: multiple levels of leukocyte migration con-trol. Trends Immunol. 2004;25:75-84.
19. Rollins BJ. Chemokines. Blood. 1997;90:909-928.
20. Van Coillie E, Van Damme J, Opdenakker G. TheMCP/eotaxin subfamily of CC chemokines. Cyto-kine Growth Factor Rev. 1999;10:61-86.
21. Wain JH, Kirby JA, Ali S. Leucocyte chemotaxis:examination of mitogen-activated protein kinaseand phosphoinositide 3-kinase activation bymonocyte chemoattractant proteins-1, -2, -3 and-4. Clin Exp Immunol. 2002;127:436-444.
22. Reddy P. Pathophysiology of acute graft-versus-host disease. Hematol Oncol. 2003;21:149-161.
23. Ferrara JL, Reddy P. Pathophysiology of graft-versus-host disease. Semin Hematol. 2006;43:3-10.
24. Wysocki CA, Panoskaltsis-Mortari A, Blazar BR,Serody JS. Leukocyte migration and graft-versus-host disease. Blood. 2005;105:4191-4199.
25. Terwey TH, Kim TD, Kochman AA, et al. CCR2 isrequired for CD8-induced graft-versus-host dis-ease. Blood. 2005;106:3322-3330.
26. Murai M, Yoneyama H, Harada A, et al. Activeparticipation of CCR5(�)CD8(�) T lymphocytesin the pathogenesis of liver injury in graft-versus-host disease. J Clin Invest. 1999;104:49-57.
27. Murai M, Yoneyama H, Ezaki T, et al. Peyer’spatch is the essential site in initiating murineacute and lethal graft-versus-host reaction. NatImmunol. 2003;4:154-160.
28. Sugerman PB, Faber SB, Willis LM, et al. Kineticsof gene expression in murine cutaneous graft-versus-host disease. Am J Pathol. 2004;164:2189-2202.
4412 HORI et al BLOOD, 15 APRIL 2008 � VOLUME 111, NUMBER 8
For personal use only. at KOKUSAI SHOBO LTD on April 10, 2008. www.bloodjournal.orgFrom