Embed Size (px)
Citation preview
CCRS Quick Start Guide for Program Administrators September 2017
www.citihandlowy.pl Bank Handlowy w Warszawie S.A.
CitiManager Quick Start Guide for Program Administrators | Table of Contents
2
Table of Contents
Introduction………………………………………………………................................................................................................................................................................… 3
Basic Navigation………………………………………………………………………………………………………………………………………………………………………………….……………….….……... 4
Getting Started…….…………………………………………………………………………………………………………….………………………………………………………………………………….……….. 8
Access CCRS………………………………………………………………………………………………………………………………………………………………………………………………… .….…………... 12
Run Standard Reports Using a Template………………………………………………………………………………………………………………………………………………….….………….…….. 14
Edit a Report from the Report Viewer……………..……………………………………………………………………………………………………………………………………………..………...….. 17
Export a Report…………………………………………………………………………………………………………………………………………………………………………………………….……...…….…. 20
Add/View Report in the History List……………………………………………………………………………………………………………………………………………………………………..……….. 21
Subscribe to a Report………………………………………………………………………………………………………………………………………………………………………………………………….... 23
Save Report Templates — My Reports………………………………………………………………………………………………………………………………………………….………………….…... 27
Appendix…………………………………………………………….…………………………………………………………………………………………………………………………………………………..……. 29
Report Viewer Toolbars…………….…………………………………………………………………………………………………………………………………………………………………………….……. 29
Set User Preferences………………….………………………………………………………………………………………………………………………………………………………………………….……... 34
3
CCRS® — Quick Start Guide | Introduction
Introduction
The Citibank Custom Reporting System (CCRS) is a comprehensive online tool that captures and manages information related to your card
transactions, from line-item details to consolidated transaction data and everything in between.
CCRS provides the information you need to:
• negotiate with vendors;
• analyse business expenses;
• ensure compliance with organizational policies.
Comprehensive Data — Flexible Delivery
You can create dynamic queries and download data into spreadsheet, database or word processing formats. CCRS provides you with:
• online access to over 650 data elements;
• the ability to save customization for faster report setup;
• email notification so you can retrieve reports at your convenience;
• the ability to schedule reports to run when you need them.
Web-browser Compatibility
The following web-browser options may be used to access CCRS:
• Microsoft Internet Explorer 7.x, 8.x, 9.x, 10.x;
• Firefox 14.x – 19.x
• Google Chrome 20.x — 25.x;
• Safari 5.x, 6.x.
Update Frequency
CCRS is updated with the most recent account and transaction data beginning midnight Eastern Standard Time, Monday – Friday. The update can
take up to 12 hours to complete.
4
CCRS® — Quick Start Guide | Basic Navigation
Basic Navigation Home Screen
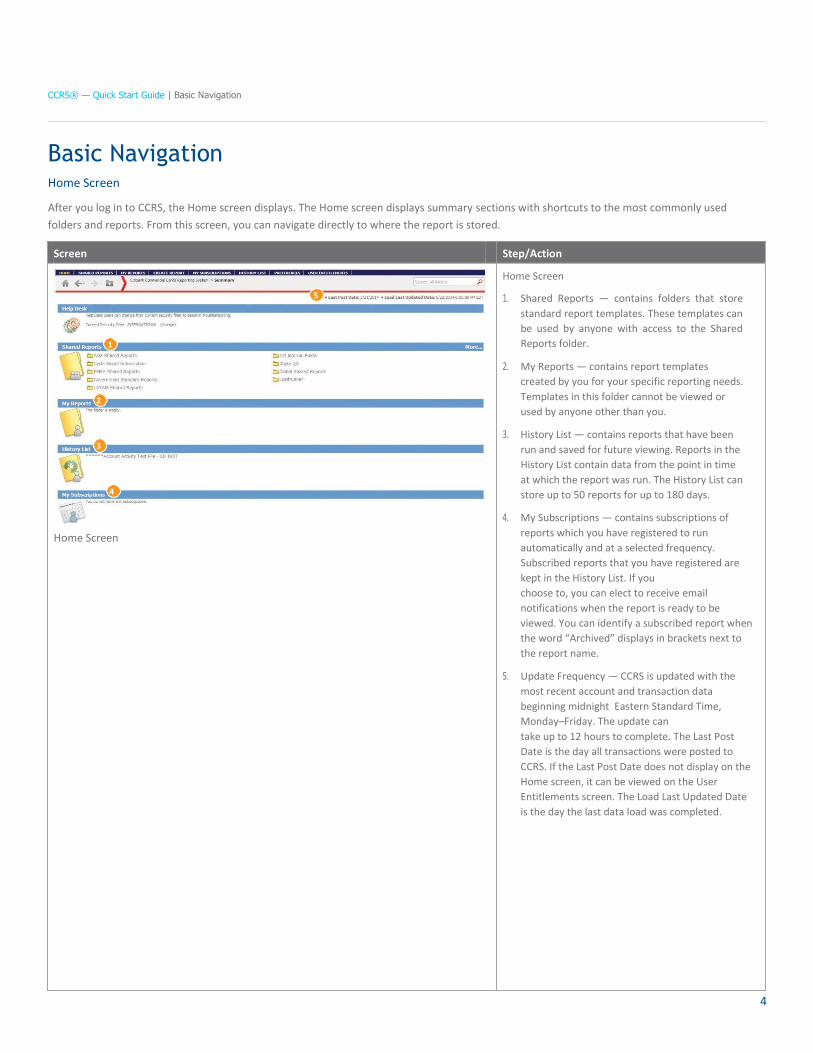
After you log in to CCRS, the Home screen displays. The Home screen displays summary sections with shortcuts to the most commonly used
folders and reports. From this screen, you can navigate directly to where the report is stored.
Screen Step/Action
5
1
2
3
4
Home Screen
Home Screen
1. Shared Reports — contains folders that store
standard report templates. These templates can
be used by anyone with access to the Shared
Reports folder.
2. My Reports — contains report templates
created by you for your specific reporting needs.
Templates in this folder cannot be viewed or
used by anyone other than you.
3. History List — contains reports that have been
run and saved for future viewing. Reports in the
History List contain data from the point in time
at which the report was run. The History List can
store up to 50 reports for up to 180 days.
4. My Subscriptions — contains subscriptions of
reports which you have registered to run
automatically and at a selected frequency.
Subscribed reports that you have registered are
kept in the History List. If you
choose to, you can elect to receive email
notifications when the report is ready to be
viewed. You can identify a subscribed report when
the word “Archived” displays in brackets next to
the report name.
5. Update Frequency — CCRS is updated with the
most recent account and transaction data
beginning midnight Eastern Standard Time,
Monday–Friday. The update can
take up to 12 hours to complete. The Last Post
Date is the day all transactions were posted to
CCRS. If the Last Post Date does not display on the
Home screen, it can be viewed on the User
Entitlements screen. The Load Last Updated Date
is the day the last data load was completed.
5
CCRS® — Quick Start Guide | Basic Navigation
Navigation Tabs and Buttons
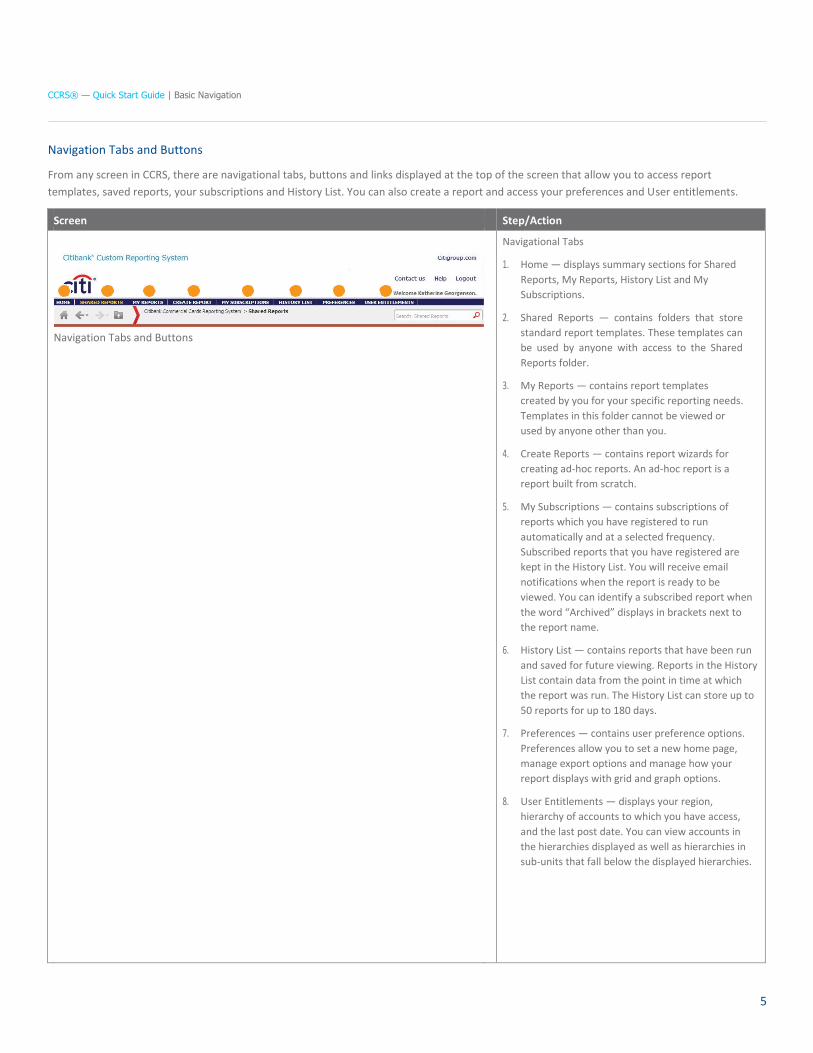
From any screen in CCRS, there are navigational tabs, buttons and links displayed at the top of the screen that allow you to access report
templates, saved reports, your subscriptions and History List. You can also create a report and access your preferences and User entitlements.
Screen Step/Action
1 2 3 4 5 6 7 8
Navigation Tabs and Buttons
Navigational Tabs
1. Home — displays summary sections for Shared
Reports, My Reports, History List and My
Subscriptions.
2. Shared Reports — contains folders that store
standard report templates. These templates can
be used by anyone with access to the Shared
Reports folder.
3. My Reports — contains report templates
created by you for your specific reporting needs.
Templates in this folder cannot be viewed or
used by anyone other than you.
4. Create Reports — contains report wizards for
creating ad-hoc reports. An ad-hoc report is a
report built from scratch.
5. My Subscriptions — contains subscriptions of
reports which you have registered to run
automatically and at a selected frequency.
Subscribed reports that you have registered are
kept in the History List. You will receive email
notifications when the report is ready to be
viewed. You can identify a subscribed report when
the word “Archived” displays in brackets next to
the report name.
6. History List — contains reports that have been run
and saved for future viewing. Reports in the History
List contain data from the point in time at which
the report was run. The History List can store up to
50 reports for up to 180 days.
7. Preferences — contains user preference options.
Preferences allow you to set a new home page,
manage export options and manage how your
report displays with grid and graph options.
8. User Entitlements — displays your region,
hierarchy of accounts to which you have access,
and the last post date. You can view accounts in
the hierarchies displayed as well as hierarchies in
sub-units that fall below the displayed hierarchies.
6
CCRS® — Quick Start Guide | Basic Navigation
Screen Step/Action
9 10 11
12 13 14 15
Navigation Tabs and Buttons
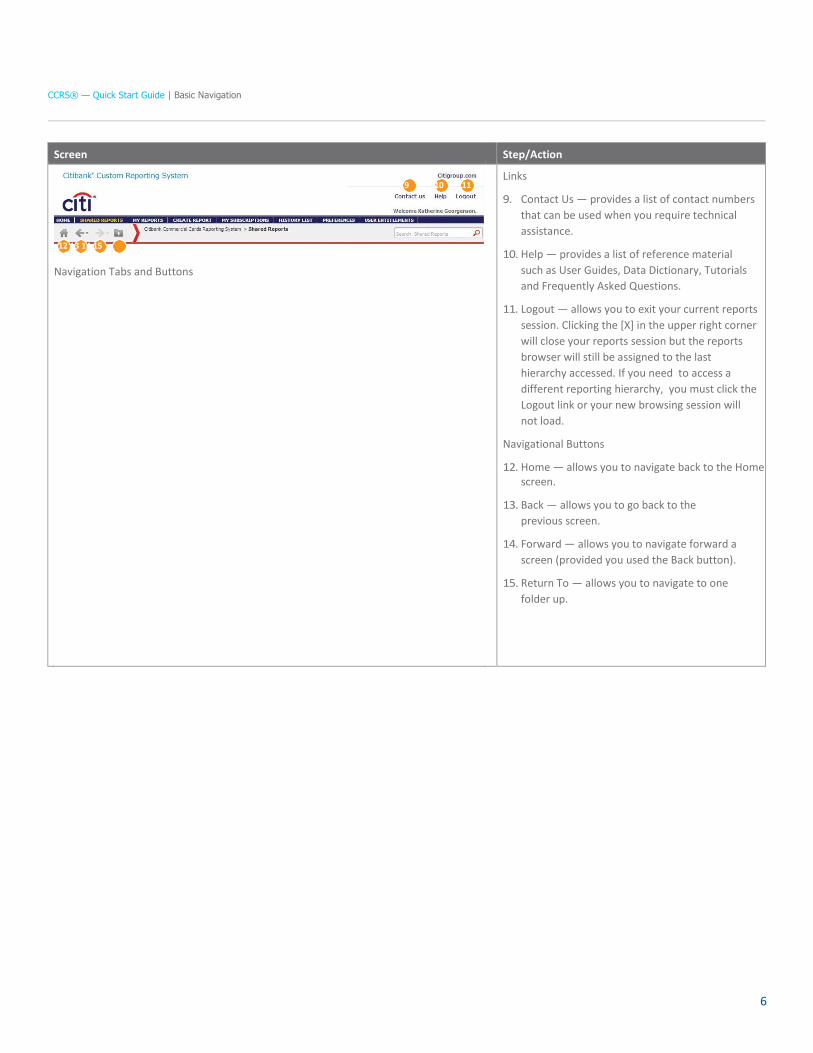
Links
9. Contact Us — provides a list of contact numbers
that can be used when you require technical
assistance.
10. Help — provides a list of reference material
such as User Guides, Data Dictionary, Tutorials
and Frequently Asked Questions.
11. Logout — allows you to exit your current reports
session. Clicking the [X] in the upper right corner
will close your reports session but the reports
browser will still be assigned to the last
hierarchy accessed. If you need to access a
different reporting hierarchy, you must click the
Logout link or your new browsing session will
not load.
Navigational Buttons
12. Home — allows you to navigate back to the Home screen.
13. Back — allows you to go back to the
previous screen.
14. Forward — allows you to navigate forward a
screen (provided you used the Back button).
15. Return To — allows you to navigate to one
folder up.
7
CCRS® — Quick Start Guide | Basic Navigation
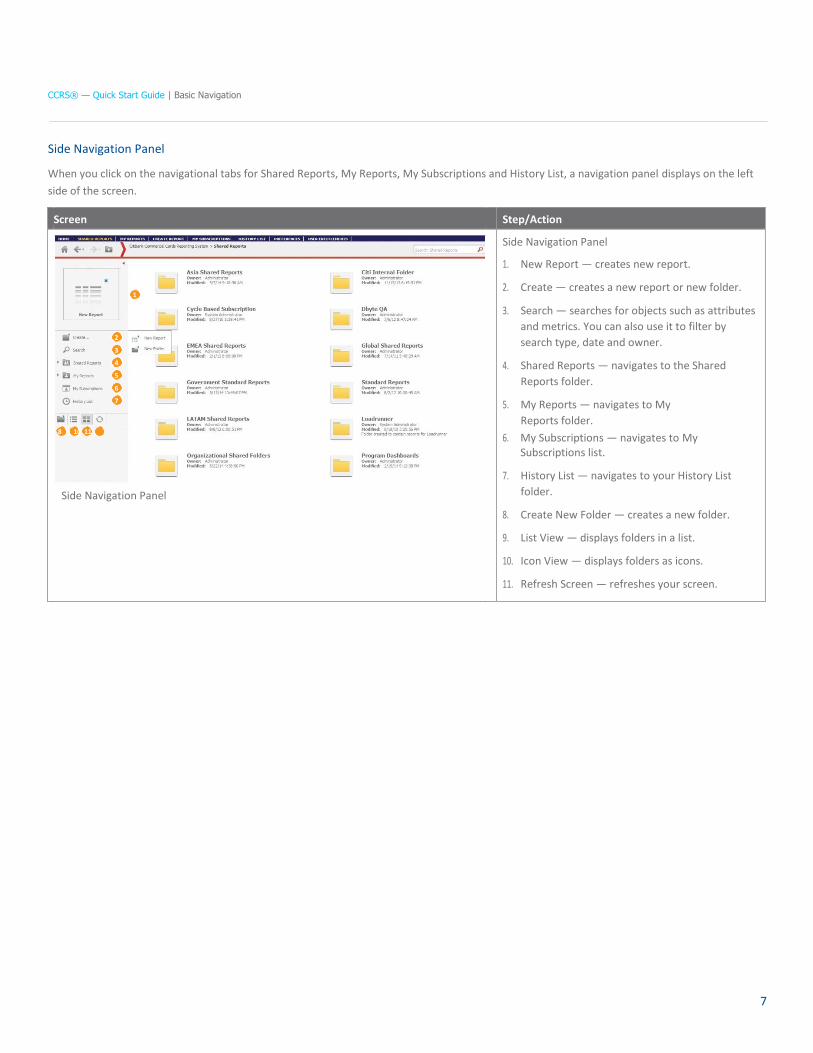
Side Navigation Panel
When you click on the navigational tabs for Shared Reports, My Reports, My Subscriptions and History List, a navigation panel displays on the left
side of the screen.
Screen Step/Action
1
2
3
4
5
6
7
8 9 10 11
Side Navigation Panel
Side Navigation Panel
1. New Report — creates new report.
2. Create — creates a new report or new folder.
3. Search — searches for objects such as attributes
and metrics. You can also use it to filter by
search type, date and owner.
4. Shared Reports — navigates to the Shared
Reports folder.
5. My Reports — navigates to My
Reports folder.
6. My Subscriptions — navigates to My Subscriptions list.
7. History List — navigates to your History List
folder.
8. Create New Folder — creates a new folder.
9. List View — displays folders in a list.
10. Icon View — displays folders as icons.
11. Refresh Screen — refreshes your screen.
8
CCRS® — Quick Start Guide| Getting Started
Getting Started Overview
While it is possible to create reports from scratch, a lot of your reporting requirements can be met by running reports from existing templates.
Once you select a report template, you may be required to complete prompts, which are filters for the report. Once you complete the prompts,
you can run the report and then view and edit it in the Report Viewer. You can also export a report, for example to Excel, save the report, add it
to your History List or subscribe to a report.
Report Process Flow
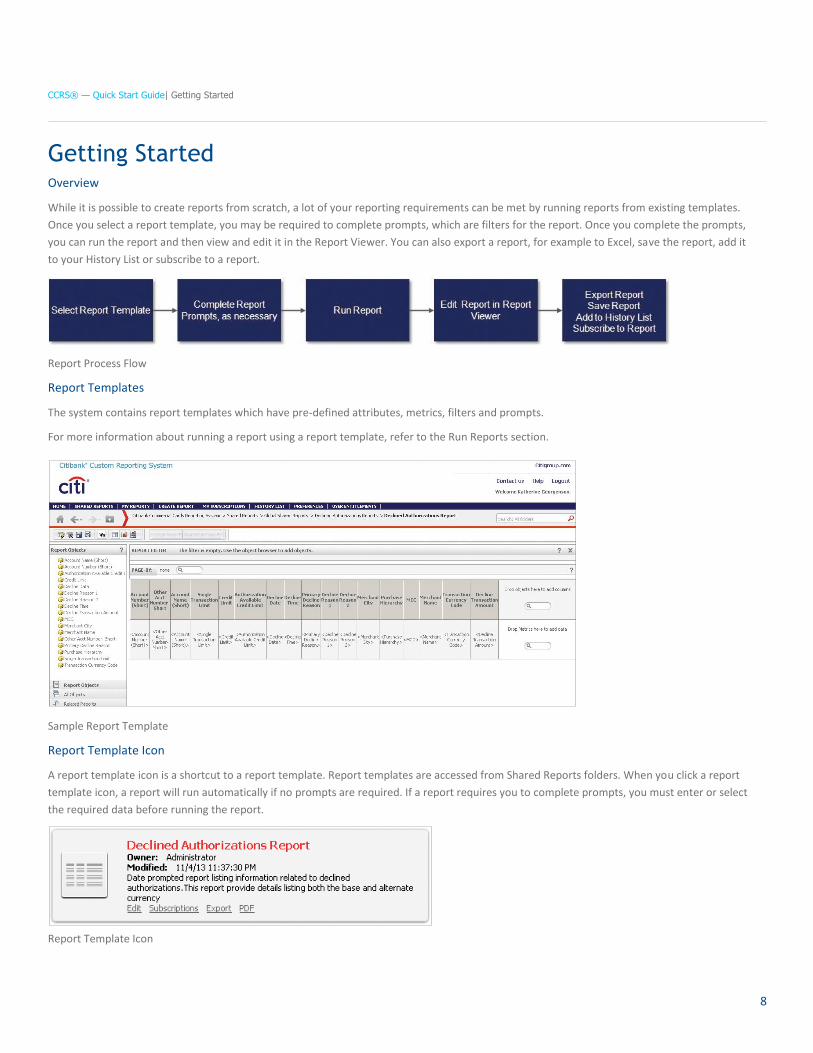
Report Templates
The system contains report templates which have pre-defined attributes, metrics, filters and prompts.
For more information about running a report using a report template, refer to the Run Reports section.
Sample Report Template
Report Template Icon
A report template icon is a shortcut to a report template. Report templates are accessed from Shared Reports folders. When you click a report
template icon, a report will run automatically if no prompts are required. If a report requires you to complete prompts, you must enter or select
the required data before running the report.
Report Template Icon
9
CCRS® — Quick Start Guide| Getting Started
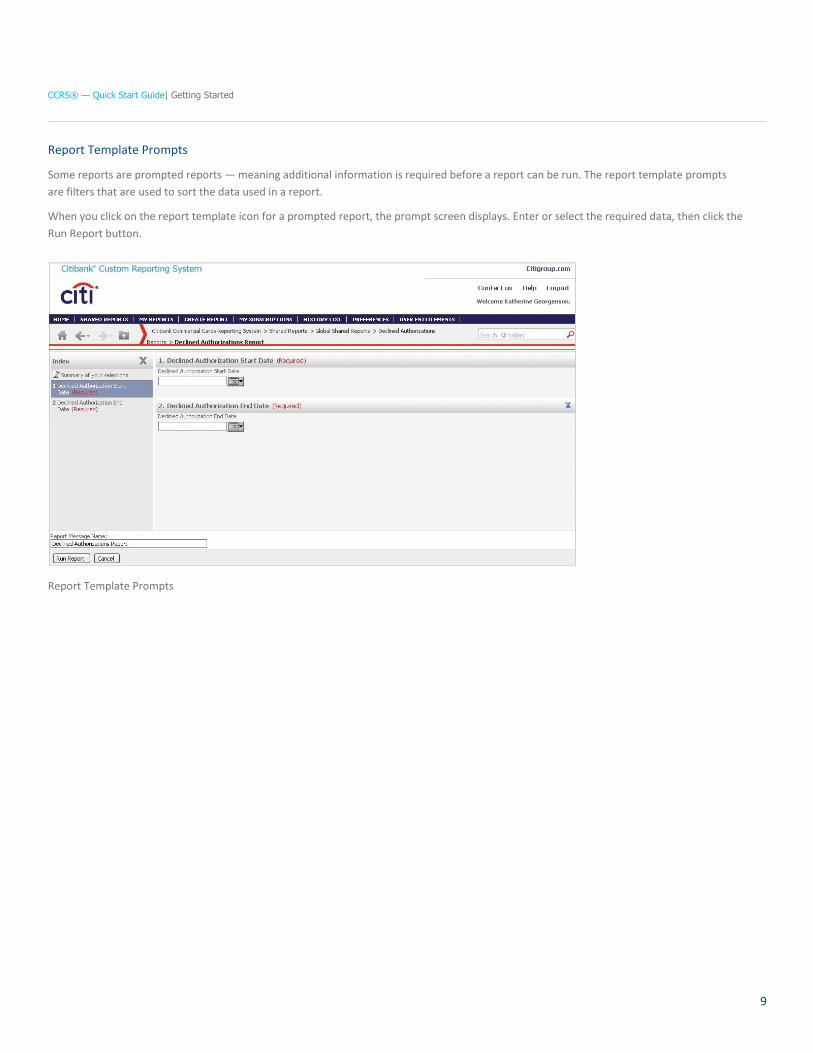
Report Template Prompts
Some reports are prompted reports — meaning additional information is required before a report can be run. The report template prompts
are filters that are used to sort the data used in a report.
When you click on the report template icon for a prompted report, the prompt screen displays. Enter or select the required data, then click the
Run Report button.
Report Template Prompts
CCRS® — Quick Start Guide| Getting Started
10
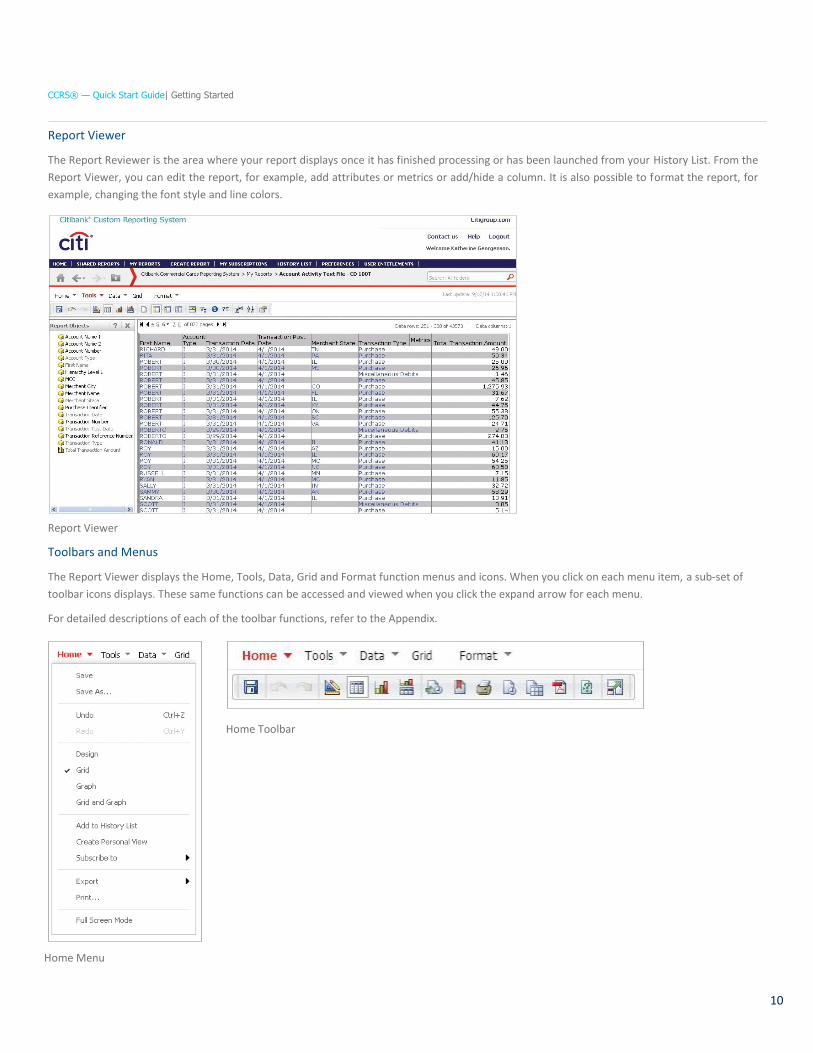
Report Viewer
The Report Reviewer is the area where your report displays once it has finished processing or has been launched from your History List. From the
Report Viewer, you can edit the report, for example, add attributes or metrics or add/hide a column. It is also possible to format the report, for
example, changing the font style and line colors.
Report Viewer
Toolbars and Menus
The Report Viewer displays the Home, Tools, Data, Grid and Format function menus and icons. When you click on each menu item, a sub-set of
toolbar icons displays. These same functions can be accessed and viewed when you click the expand arrow for each menu.
For detailed descriptions of each of the toolbar functions, refer to the Appendix.
Home Toolbar
Home Menu
CCRS® — Quick Start Guide| Getting Started
11
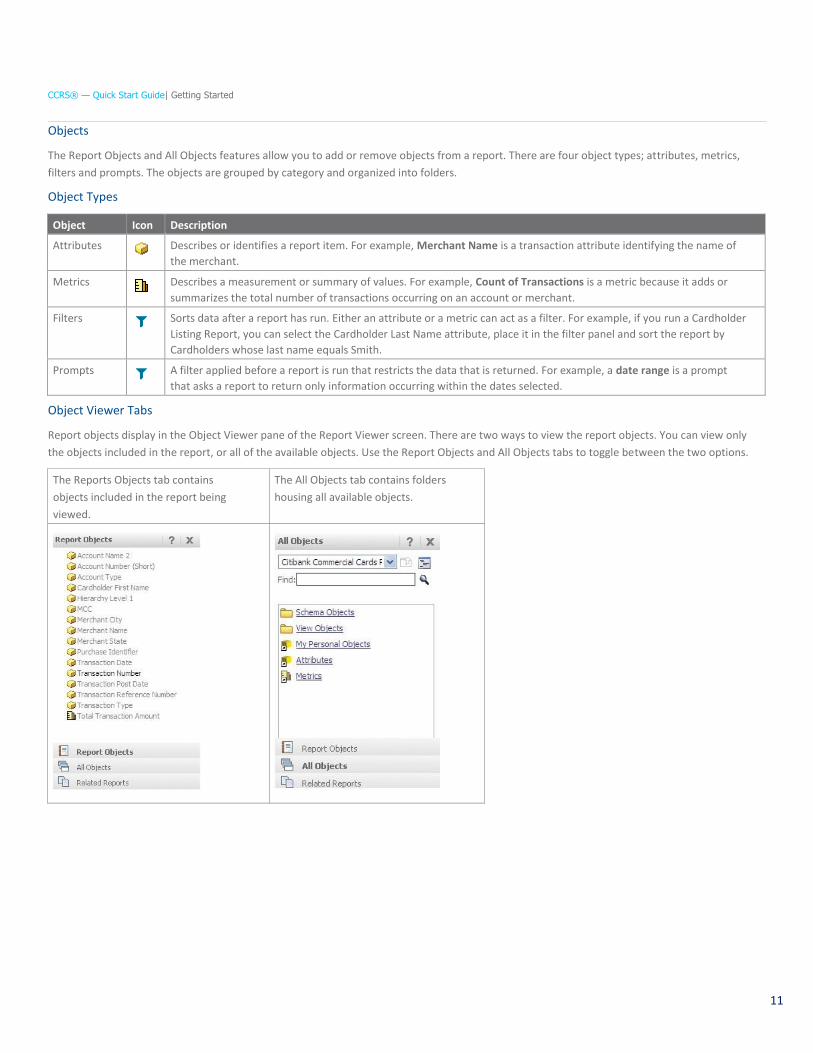
Objects
The Report Objects and All Objects features allow you to add or remove objects from a report. There are four object types; attributes, metrics,
filters and prompts. The objects are grouped by category and organized into folders.
Object Types
Object Icon Description
Attributes
Describes or identifies a report item. For example, Merchant Name is a transaction attribute identifying the name of
the merchant.
Metrics
Describes a measurement or summary of values. For example, Count of Transactions is a metric because it adds or
summarizes the total number of transactions occurring on an account or merchant.
Filters
Sorts data after a report has run. Either an attribute or a metric can act as a filter. For example, if you run a Cardholder
Listing Report, you can select the Cardholder Last Name attribute, place it in the filter panel and sort the report by
Cardholders whose last name equals Smith.
Prompts
A filter applied before a report is run that restricts the data that is returned. For example, a date range is a prompt
that asks a report to return only information occurring within the dates selected.
Object Viewer Tabs
Report objects display in the Object Viewer pane of the Report Viewer screen. There are two ways to view the report objects. You can view only
the objects included in the report, or all of the available objects. Use the Report Objects and All Objects tabs to toggle between the two options.
The Reports Objects tab contains
objects included in the report being
viewed.
The All Objects tab contains folders
housing all available objects.
CCRS® — Quick Start Guide | Access CCRS
12
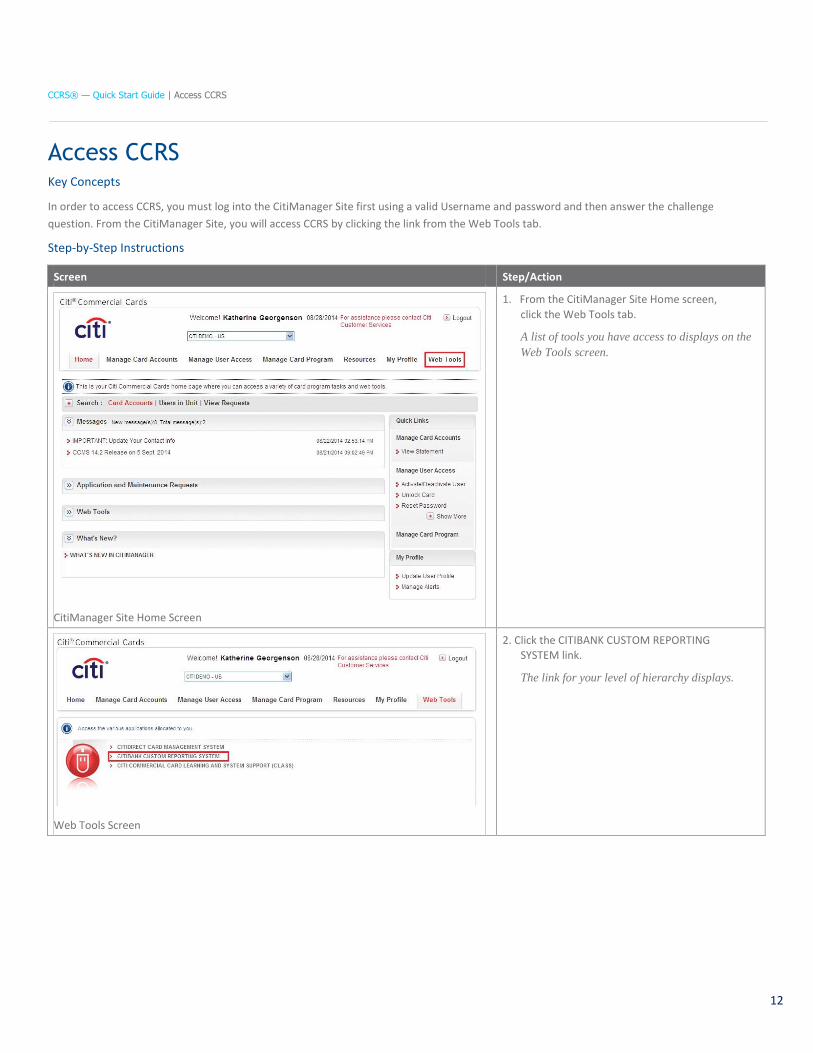
Access CCRS Key Concepts
In order to access CCRS, you must log into the CitiManager Site first using a valid Username and password and then answer the challenge
question. From the CitiManager Site, you will access CCRS by clicking the link from the Web Tools tab.
Step-by-Step Instructions
Screen Step/Action
CitiManager Site Home Screen
1. From the CitiManager Site Home screen,
click the Web Tools tab.
A list of tools you have access to displays on the
Web Tools screen.
Web Tools Screen
2. Click the CITIBANK CUSTOM REPORTING
SYSTEM link.
The link for your level of hierarchy displays.
CCRS® — Quick Start Guide | Access CCRS
13
Screen Step/Action
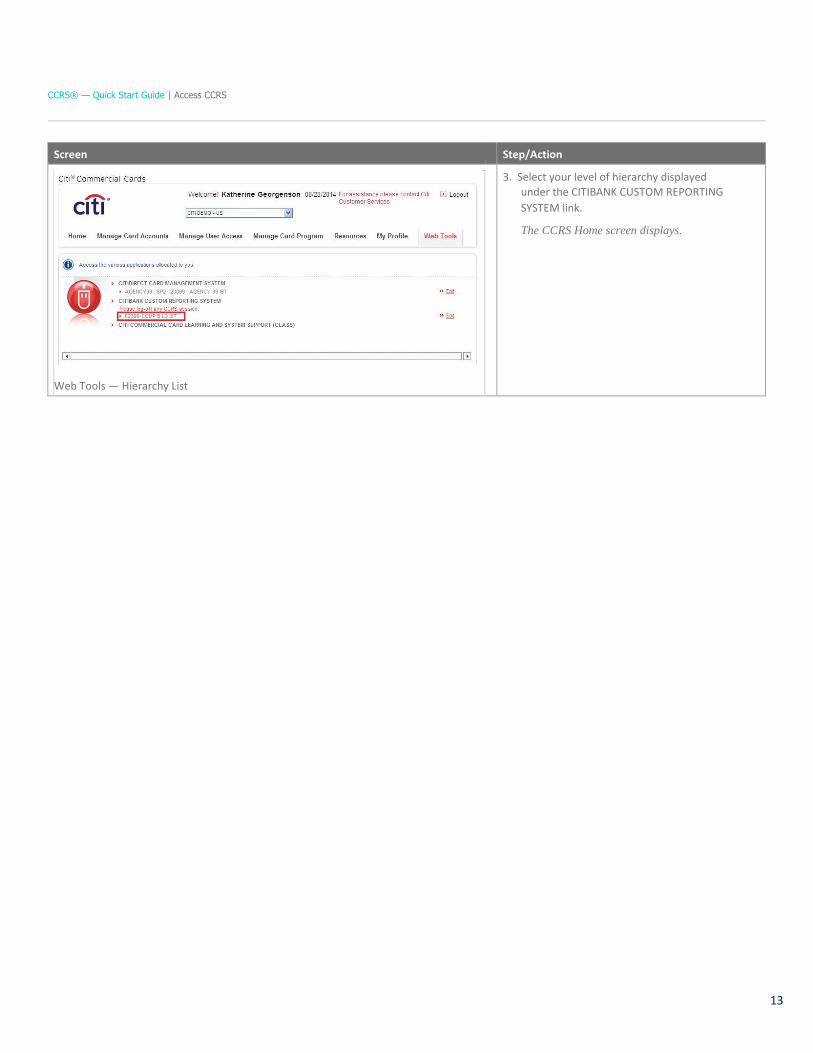
Web Tools — Hierarchy List
3. Select your level of hierarchy displayed
under the CITIBANK CUSTOM REPORTING
SYSTEM link.
The CCRS Home screen displays.
CCRS® — Quick Start Guide | Run Standard Reports Using a Template
14
Run Standard Reports Using a Template Key Concepts
The system contains report templates which have pre-defined attributes, metrics, filters and prompts.
Standard report templates can be accessed from the Shared Reports folder.
Citi Handlowy has created common report templates for all Client groups to use. These reports are available from the Global Shared Reports
folder.
The Organizational Shared Reports folder contains special report templates tailored to individual reporting needs of a company. These templates
will only be accessible to those in your company who have been granted access to CCRS.
Some reports require data element filtering to limit the data presented in the report. For these reports you will be prompted to select or enter
values before you run the report. A date range or hierarchy is an example of a common report prompt.
Not all reports require data element filtering. As an example, an Account Listing Report providing cardholder details does not require a prompt.
CCRS® — Quick Start Guide | Run Standard Reports Using a Template
15
Step-by-Step Instructions
Screen Step/Action
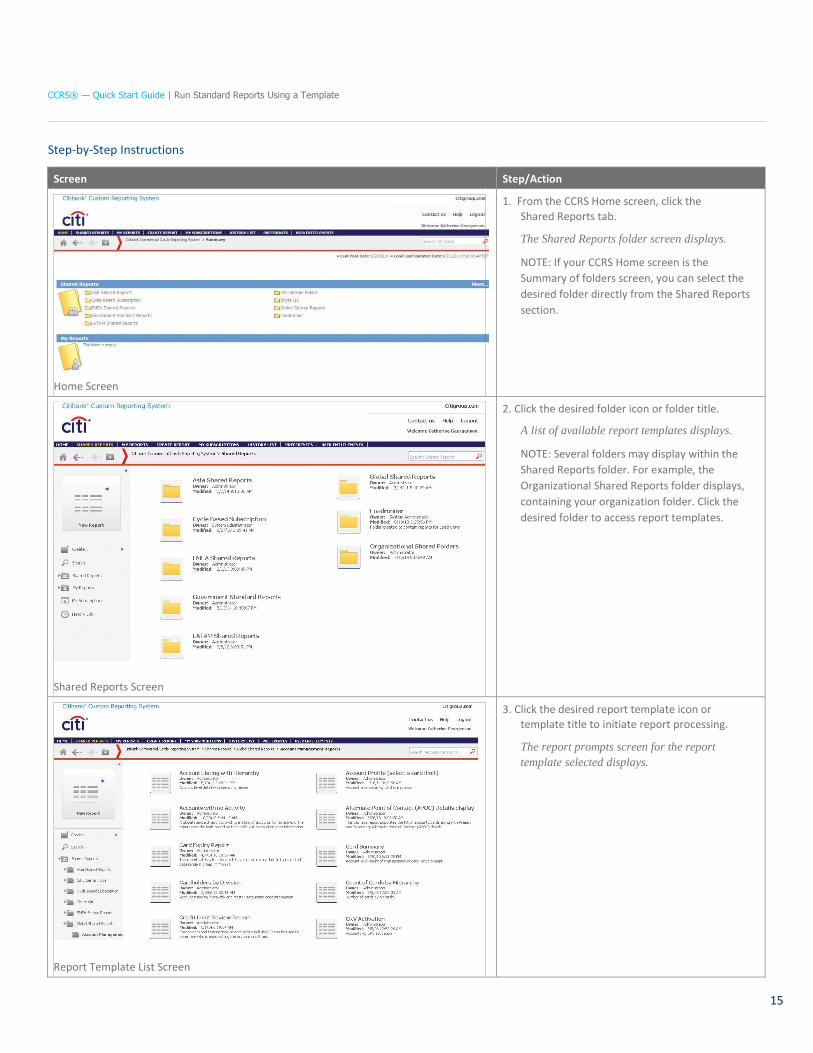
Home Screen
1. From the CCRS Home screen, click the
Shared Reports tab.
The Shared Reports folder screen displays.
NOTE: If your CCRS Home screen is the
Summary of folders screen, you can select the
desired folder directly from the Shared Reports
section.
Shared Reports Screen
2. Click the desired folder icon or folder title.
A list of available report templates displays.
NOTE: Several folders may display within the
Shared Reports folder. For example, the
Organizational Shared Reports folder displays,
containing your organization folder. Click the
desired folder to access report templates.
Report Template List Screen
3. Click the desired report template icon or
template title to initiate report processing.
The report prompts screen for the report
template selected displays.
CCRS® — Quick Start Guide | Run Standard Reports Using a Template
16
Screen Step/Action
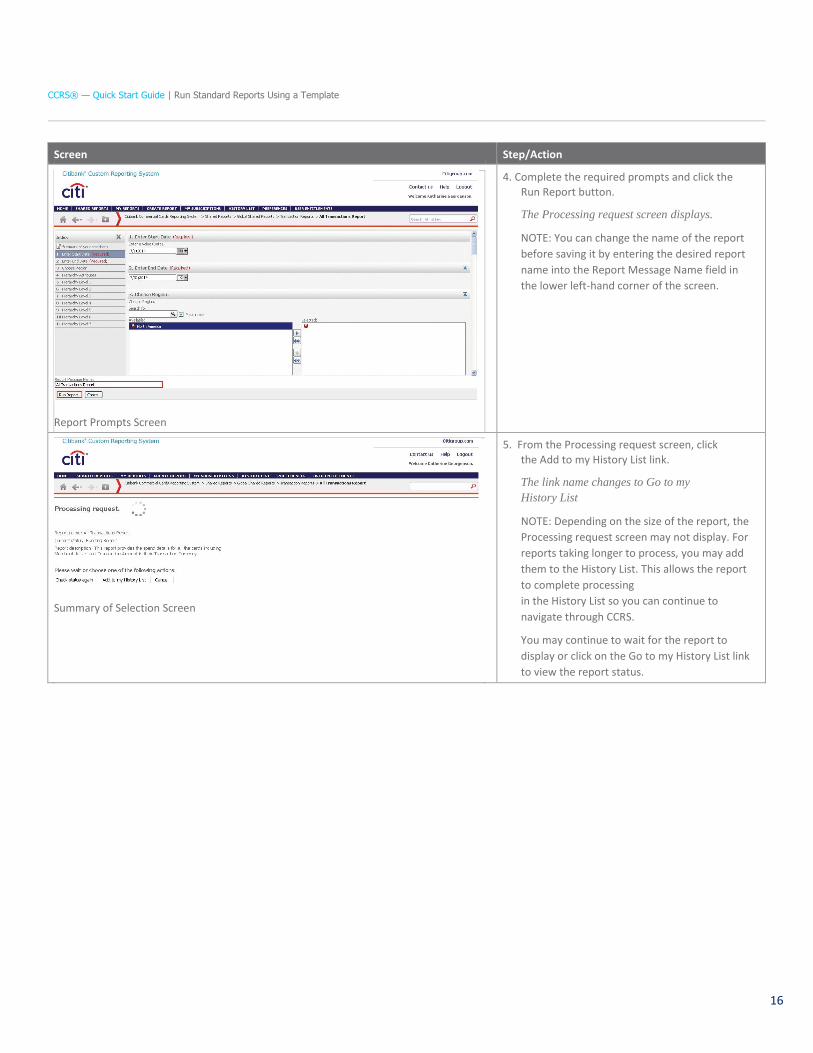
Report Prompts Screen
4. Complete the required prompts and click the
Run Report button.
The Processing request screen displays.
NOTE: You can change the name of the report
before saving it by entering the desired report
name into the Report Message Name field in
the lower left-hand corner of the screen.
Summary of Selection Screen
5. From the Processing request screen, click
the Add to my History List link.
The link name changes to Go to my
History List
NOTE: Depending on the size of the report, the
Processing request screen may not display. For
reports taking longer to process, you may add
them to the History List. This allows the report
to complete processing
in the History List so you can continue to
navigate through CCRS.
You may continue to wait for the report to
display or click on the Go to my History List link
to view the report status.
CCRS® — Quick Start Guide | Edit a Report from the Report Viewer
17
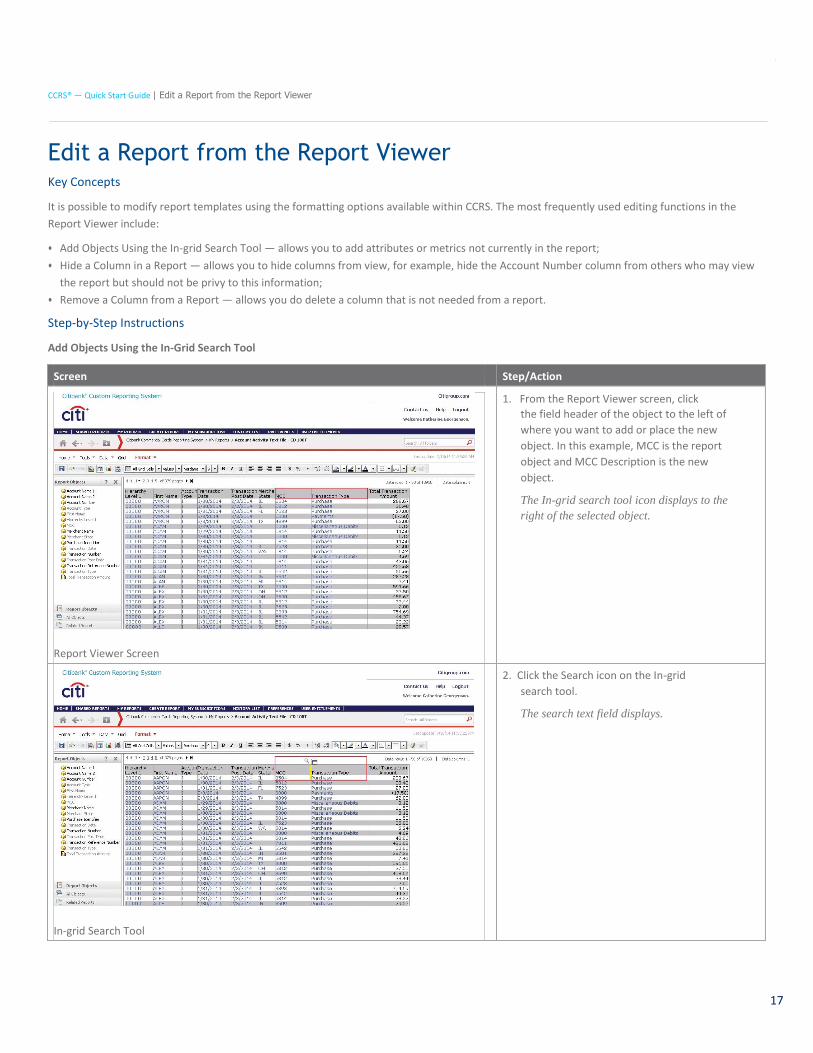
Edit a Report from the Report Viewer Key Concepts
It is possible to modify report templates using the formatting options available within CCRS. The most frequently used editing functions in the
Report Viewer include:
• Add Objects Using the In-grid Search Tool — allows you to add attributes or metrics not currently in the report;
• Hide a Column in a Report — allows you to hide columns from view, for example, hide the Account Number column from others who may view
the report but should not be privy to this information;
• Remove a Column from a Report — allows you do delete a column that is not needed from a report.
Step-by-Step Instructions
Add Objects Using the In-Grid Search Tool
Screen Step/Action
Report Viewer Screen
1. From the Report Viewer screen, click
the field header of the object to the left of
where you want to add or place the new
object. In this example, MCC is the report
object and MCC Description is the new
object.
The In-grid search tool icon displays to the
right of the selected object.
In-grid Search Tool
2. Click the Search icon on the In-grid
search tool.
The search text field displays.
CCRS® — Quick Start Guide | Edit a Report from the Report Viewer
18
Screen Step/Action
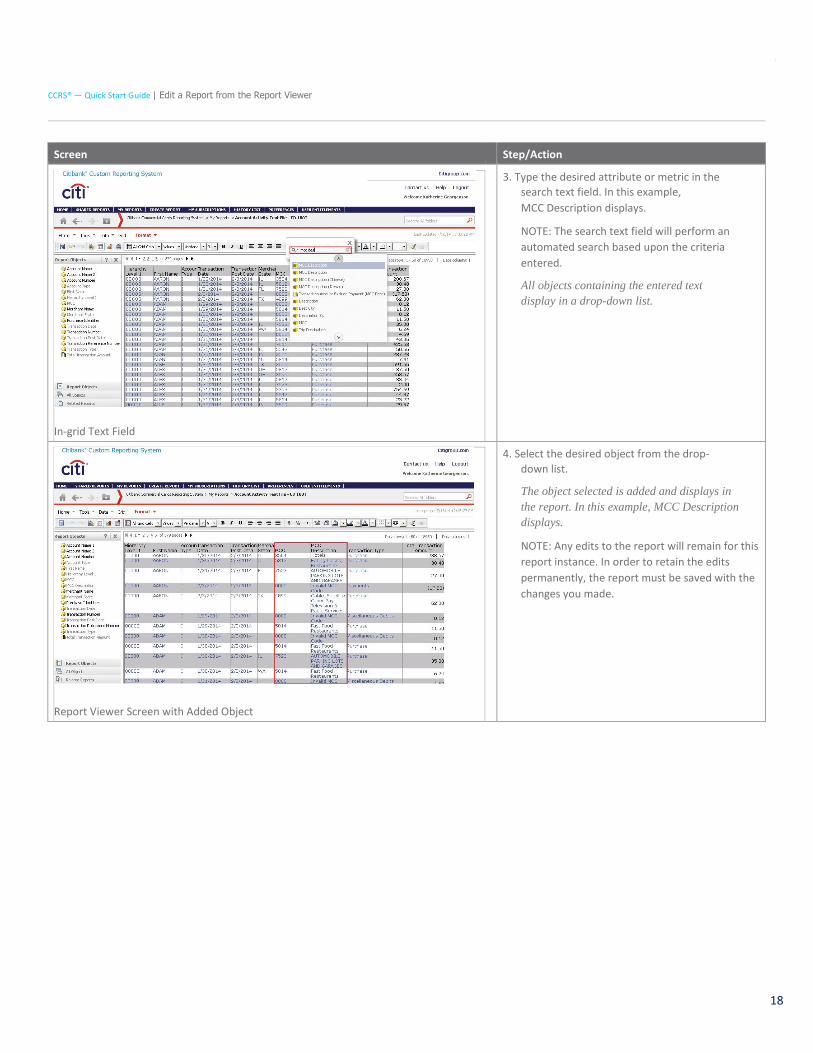
In-grid Text Field
3. Type the desired attribute or metric in the
search text field. In this example,
MCC Description displays.
NOTE: The search text field will perform an
automated search based upon the criteria
entered.
All objects containing the entered text
display in a drop-down list.
Report Viewer Screen with Added Object
4. Select the desired object from the drop-
down list.
The object selected is added and displays in
the report. In this example, MCC Description
displays.
NOTE: Any edits to the report will remain for this
report instance. In order to retain the edits
permanently, the report must be saved with the
changes you made.
CCRS® — Quick Start Guide | Edit a Report from the Report Viewer
19
Step-by-Step Instructions
Hide a Column in a Report or Remove it from a Report
Screen Step/Action
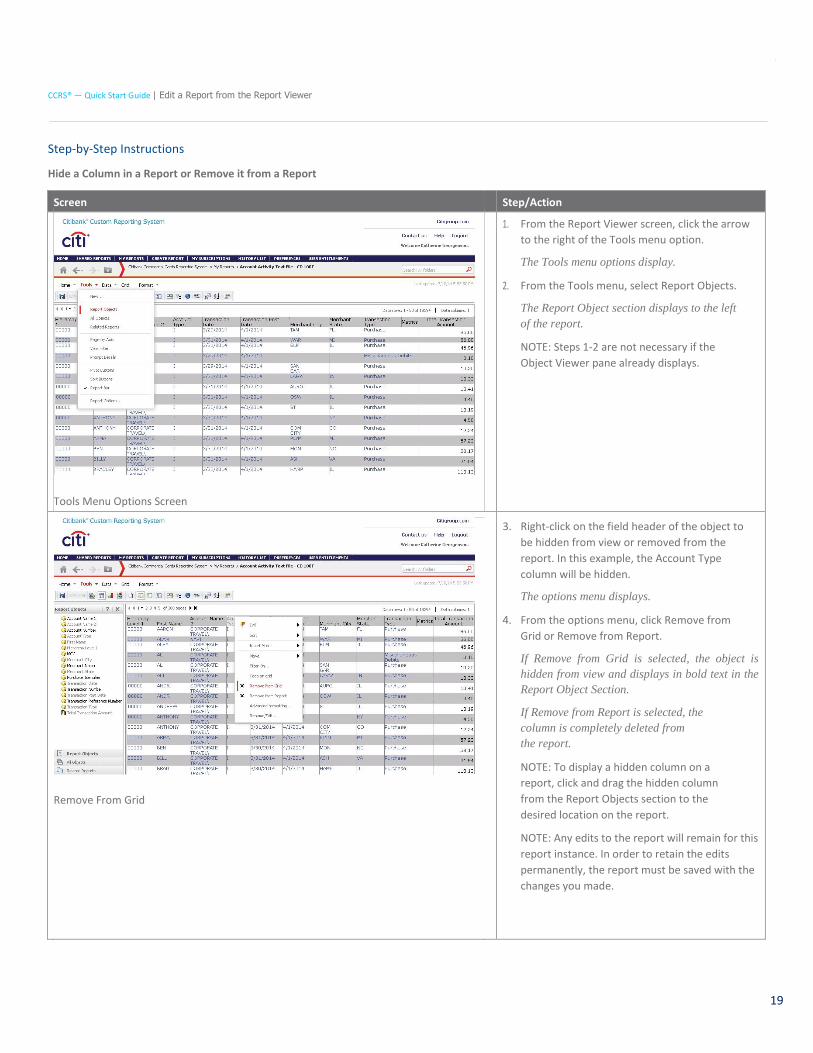
Tools Menu Options Screen
1. From the Report Viewer screen, click the arrow
to the right of the Tools menu option.
The Tools menu options display.
2. From the Tools menu, select Report Objects.
The Report Object section displays to the left
of the report.
NOTE: Steps 1-2 are not necessary if the
Object Viewer pane already displays.
Remove From Grid
3. Right-click on the field header of the object to
be hidden from view or removed from the
report. In this example, the Account Type
column will be hidden.
The options menu displays.
4. From the options menu, click Remove from
Grid or Remove from Report.
If Remove from Grid is selected, the object is
hidden from view and displays in bold text in the
Report Object Section.
If Remove from Report is selected, the
column is completely deleted from
the report.
NOTE: To display a hidden column on a
report, click and drag the hidden column
from the Report Objects section to the
desired location on the report.
NOTE: Any edits to the report will remain for this
report instance. In order to retain the edits
permanently, the report must be saved with the
changes you made.
CCRS® — Quick Start Guide | Export a Report
20
Export a Report Key Concepts
If you need to provide reports to individuals who do not have access to CCRS, you can export the report in a variety of formats including:
• Excel with plain text:
— allows you to export metric values as text,
— allows you to export headers as text.
• CSV file format:
— excel with formatting,
— allows you to remove extra columns from the grid report.
• HTML
• Plain text with a Delimiter
— Comma
— Tab
— Semicolon
— Space
— Tilde.
Exported reports can be saved to your computer. It’s possible to include filter details with each export.
Step-by-Step Instructions
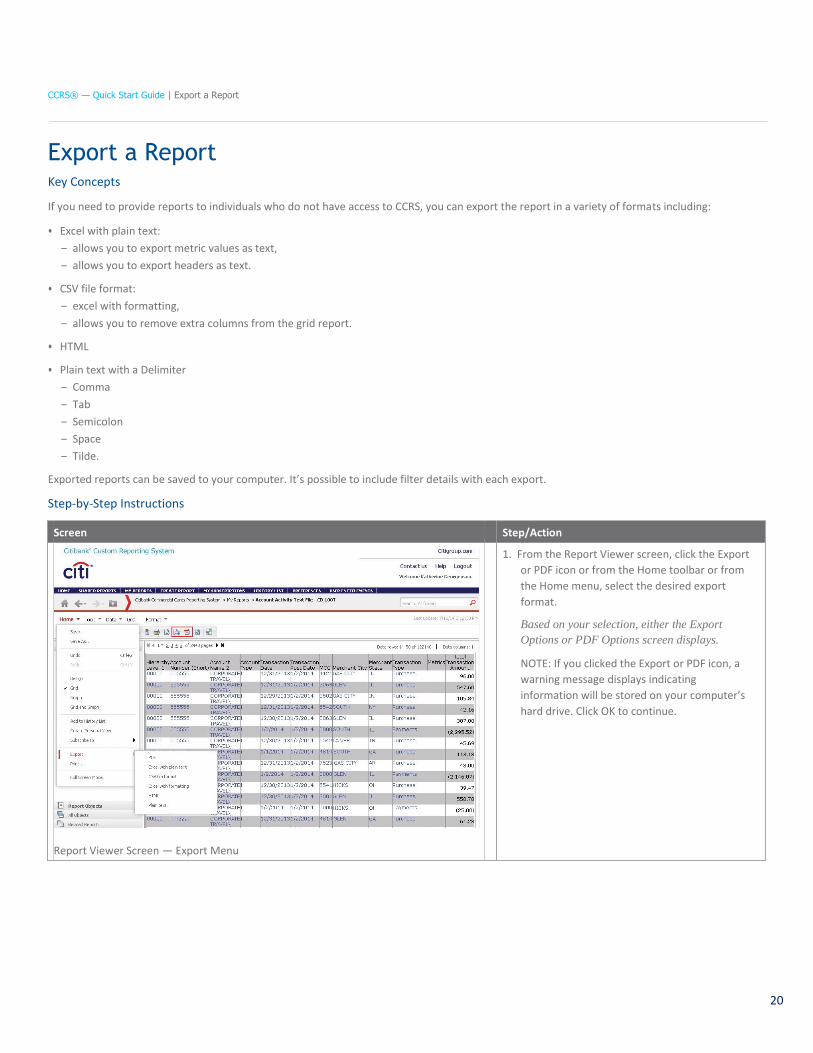
Screen Step/Action
Report Viewer Screen — Export Menu
1. From the Report Viewer screen, click the Export
or PDF icon or from the Home toolbar or from
the Home menu, select the desired export
format.
Based on your selection, either the Export
Options or PDF Options screen displays.
NOTE: If you clicked the Export or PDF icon, a
warning message displays indicating
information will be stored on your computer’s
hard drive. Click OK to continue.
CCRS® — Quick Start Guide | Export a Report
20
Screen Step/Action
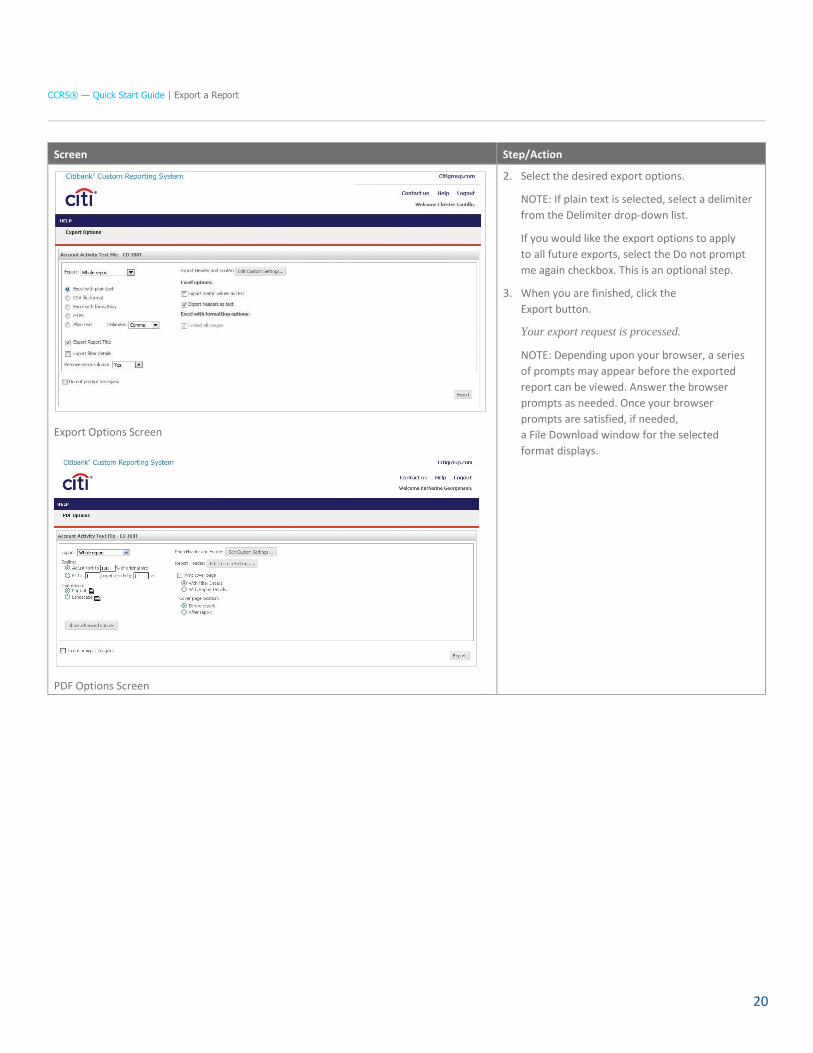
Export Options Screen
PDF Options Screen
2. Select the desired export options.
NOTE: If plain text is selected, select a delimiter
from the Delimiter drop-down list.
If you would like the export options to apply
to all future exports, select the Do not prompt
me again checkbox. This is an optional step.
3. When you are finished, click the
Export button.
Your export request is processed.
NOTE: Depending upon your browser, a series
of prompts may appear before the exported
report can be viewed. Answer the browser
prompts as needed. Once your browser
prompts are satisfied, if needed,
a File Download window for the selected
format displays.
CCRS® — Quick Start Guide | Add/View Report in the History List
21
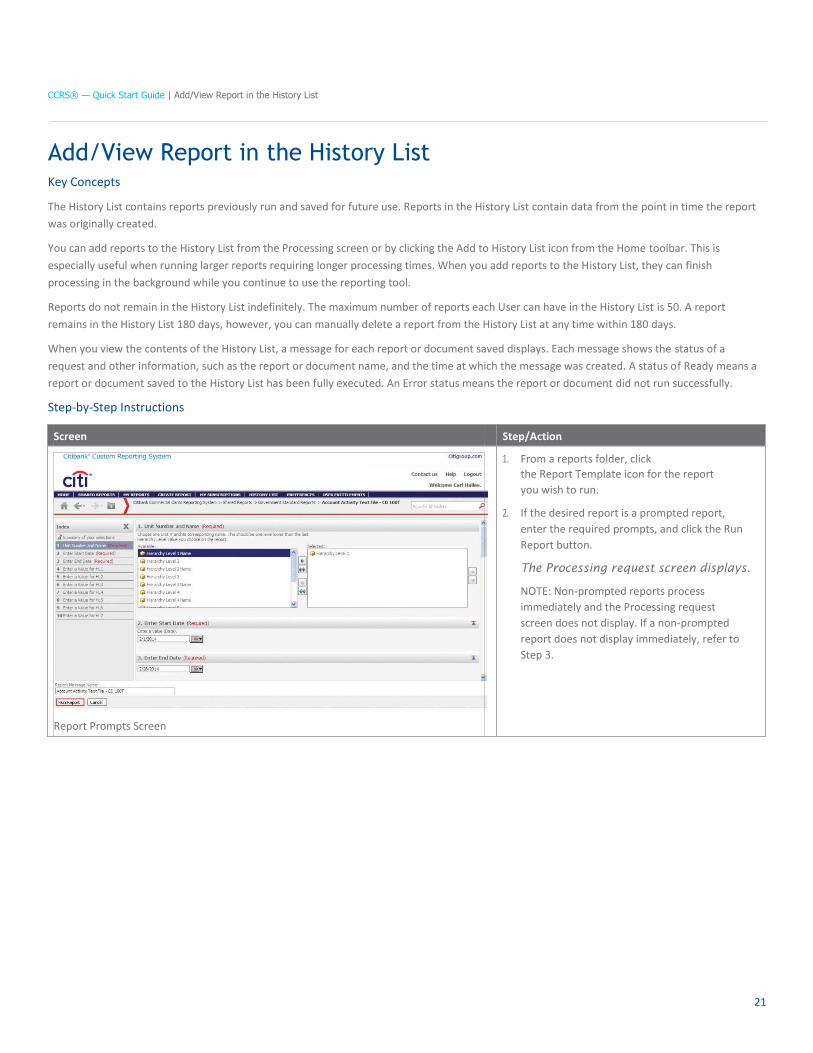
Add/View Report in the History List Key Concepts
The History List contains reports previously run and saved for future use. Reports in the History List contain data from the point in time the report
was originally created.
You can add reports to the History List from the Processing screen or by clicking the Add to History List icon from the Home toolbar. This is
especially useful when running larger reports requiring longer processing times. When you add reports to the History List, they can finish
processing in the background while you continue to use the reporting tool.
Reports do not remain in the History List indefinitely. The maximum number of reports each User can have in the History List is 50. A report
remains in the History List 180 days, however, you can manually delete a report from the History List at any time within 180 days.
When you view the contents of the History List, a message for each report or document saved displays. Each message shows the status of a
request and other information, such as the report or document name, and the time at which the message was created. A status of Ready means a
report or document saved to the History List has been fully executed. An Error status means the report or document did not run successfully.
Step-by-Step Instructions
Screen Step/Action
Report Prompts Screen
1. From a reports folder, click
the Report Template icon for the report
you wish to run.
2. If the desired report is a prompted report,
enter the required prompts, and click the Run
Report button.
The Processing request screen displays.
NOTE: Non-prompted reports process
immediately and the Processing request
screen does not display. If a non-prompted
report does not display immediately, refer to
Step 3.
CCRS® — Quick Start Guide | Add/View Report in the History List
22
Screen Step/Action
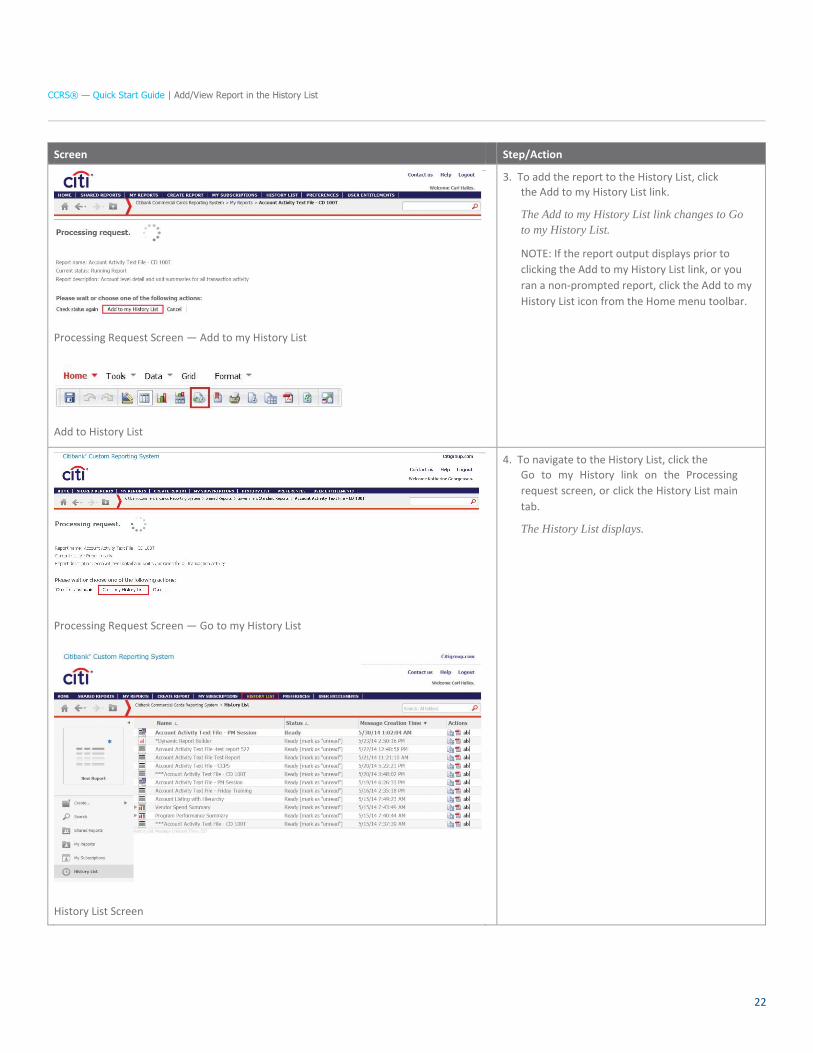
Processing Request Screen — Add to my History List
Add to History List
3. To add the report to the History List, click
the Add to my History List link.
The Add to my History List link changes to Go
to my History List.
NOTE: If the report output displays prior to
clicking the Add to my History List link, or you
ran a non-prompted report, click the Add to my
History List icon from the Home menu toolbar.
Processing Request Screen — Go to my History List
History List Screen
4. To navigate to the History List, click the
Go to my History link on the Processing
request screen, or click the History List main
tab.
The History List displays.
23
CCRS® — Quick Start Guide| Subscribe to a Report
Subscribe to a Report Key Concepts
It is possible to subscribe to reports so they run automatically based on a frequency you selected/defined.
When the report is finished running, an email will be sent to the email address provided indicating the report is ready to be viewed from the
History List.
Cycle-based subscriptions are available on some prompted reports. Cycle-based subscriptions generate a report containing transaction data
occurring only within a selected billing cycle.
Citi Handlowy does not recommend subscribing to a report requiring a date range unless a cycle-based subscription is available for that report.
This type of report returns the exact same data with each subscription.
You must be logged into CCRS in order to access the report.
Subscriptions can be modified or deleted from the My Subscriptions section. You can
subscribe to a report:
• from a report template,
• from the Report Viewer.
Step-by-Step Instructions
Subscribe to a Report from a Report Template
Screen Step/Action
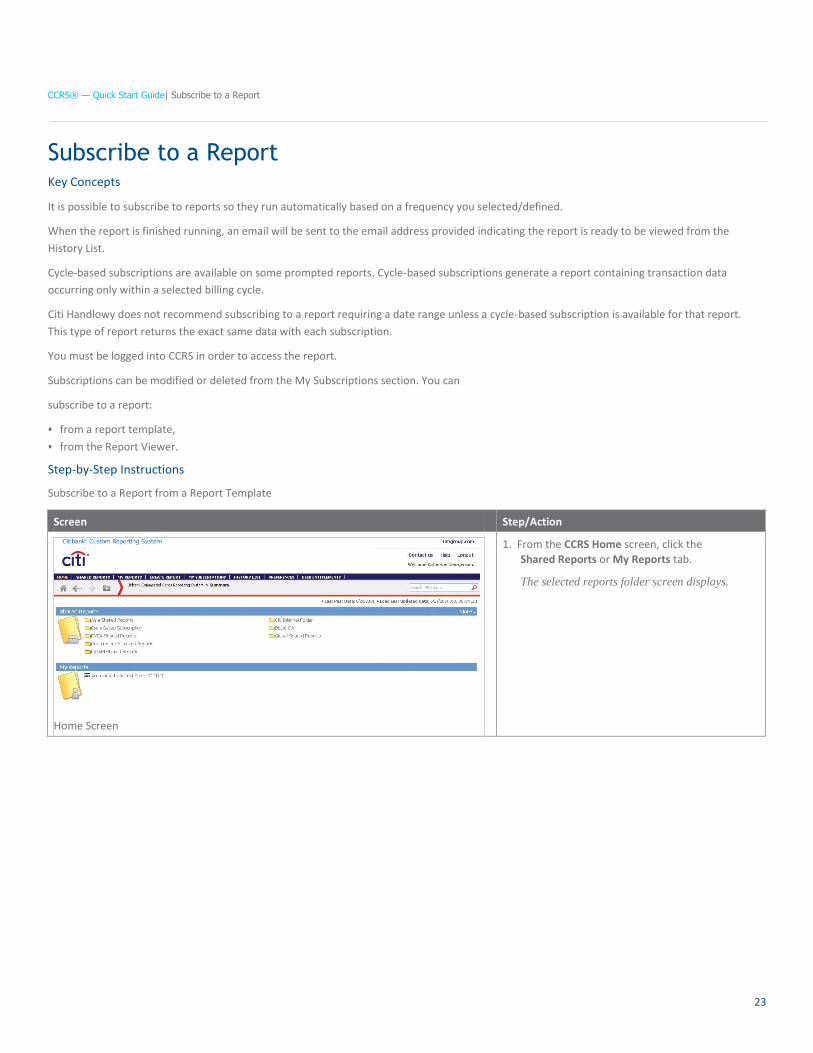
Home Screen
1. From the CCRS Home screen, click the
Shared Reports or My Reports tab.
The selected reports folder screen displays.
24
CCRS® — Quick Start Guide| Subscribe to a Report
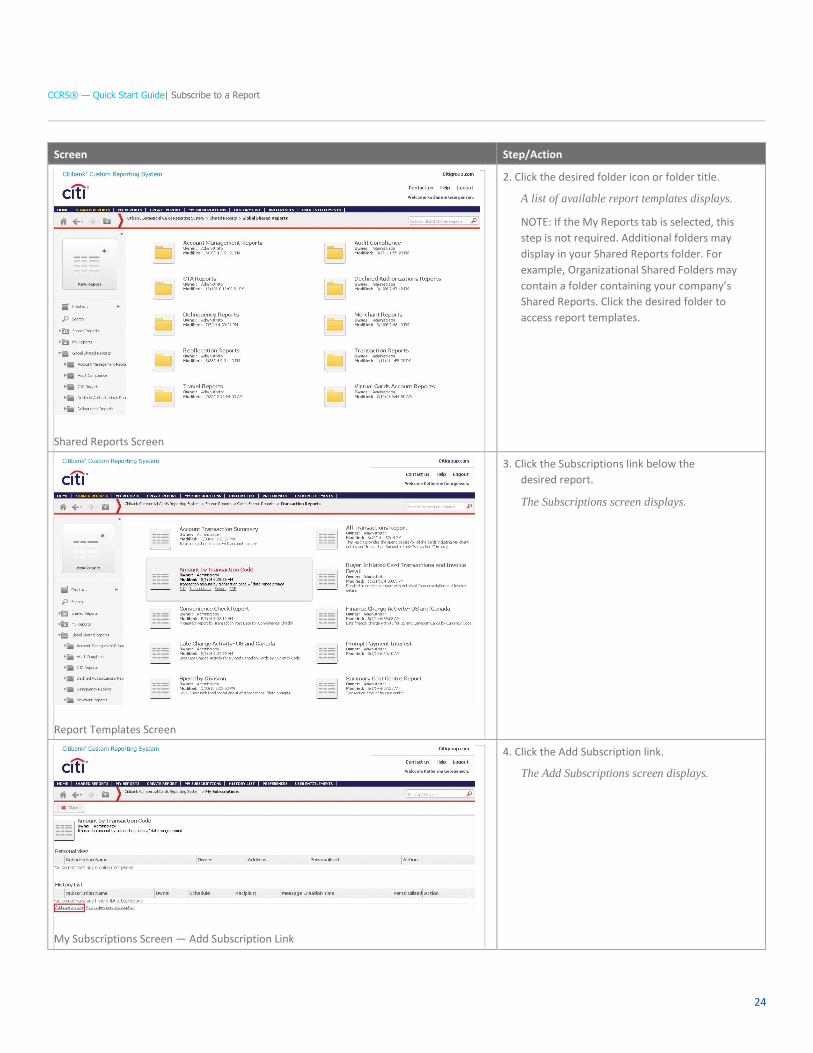
Screen Step/Action
Shared Reports Screen
2. Click the desired folder icon or folder title.
A list of available report templates displays.
NOTE: If the My Reports tab is selected, this
step is not required. Additional folders may
display in your Shared Reports folder. For
example, Organizational Shared Folders may
contain a folder containing your company’s
Shared Reports. Click the desired folder to
access report templates.
Report Templates Screen
3. Click the Subscriptions link below the
desired report.
The Subscriptions screen displays.
My Subscriptions Screen — Add Subscription Link
4. Click the Add Subscription link.
The Add Subscriptions screen displays.
25
CCRS® — Quick Start Guide| Subscribe to a Report
Screen Step/Action
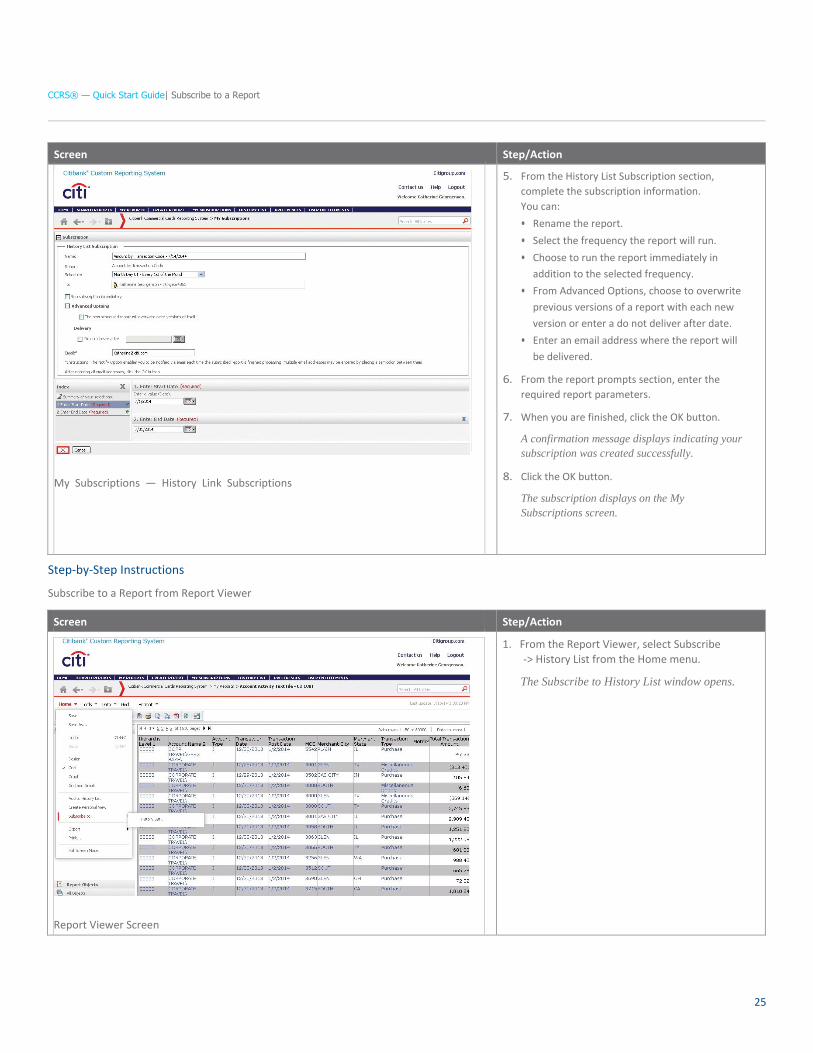
My Subscriptions — History Link Subscriptions
5. From the History List Subscription section,
complete the subscription information.
You can:
• Rename the report.
• Select the frequency the report will run.
• Choose to run the report immediately in
addition to the selected frequency.
• From Advanced Options, choose to overwrite
previous versions of a report with each new
version or enter a do not deliver after date.
• Enter an email address where the report will
be delivered.
6. From the report prompts section, enter the
required report parameters.
7. When you are finished, click the OK button.
A confirmation message displays indicating your
subscription was created successfully.
8. Click the OK button.
The subscription displays on the My
Subscriptions screen.
Step-by-Step Instructions
Subscribe to a Report from Report Viewer
Screen Step/Action
Report Viewer Screen
1. From the Report Viewer, select Subscribe
-> History List from the Home menu.
The Subscribe to History List window opens.
26
CCRS® — Quick Start Guide| Subscribe to a Report
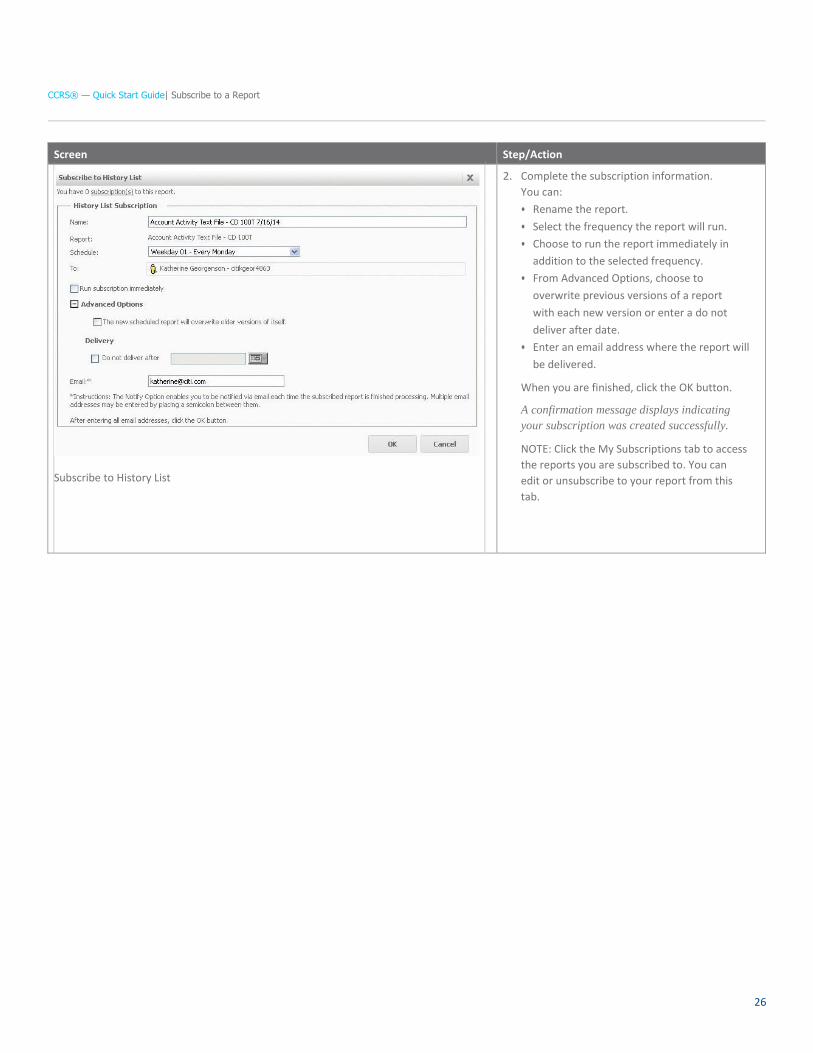
Screen Step/Action
Subscribe to History List
2. Complete the subscription information.
You can:
• Rename the report.
• Select the frequency the report will run.
• Choose to run the report immediately in
addition to the selected frequency.
• From Advanced Options, choose to
overwrite previous versions of a report
with each new version or enter a do not
deliver after date.
• Enter an email address where the report will
be delivered.
When you are finished, click the OK button.
A confirmation message displays indicating
your subscription was created successfully.
NOTE: Click the My Subscriptions tab to access
the reports you are subscribed to. You can
edit or unsubscribe to your report from this
tab.
27
CCRS® — Quick Start Guide | Save Report Templates — My Reports
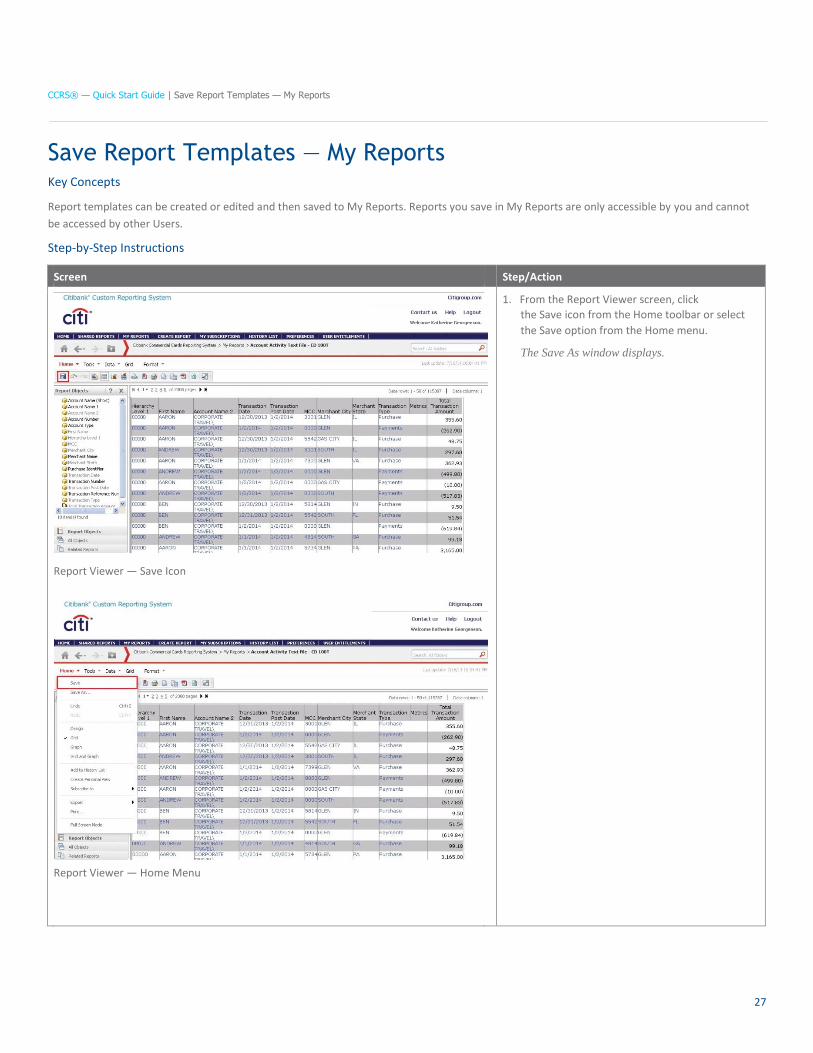
Save Report Templates — My Reports Key Concepts
Report templates can be created or edited and then saved to My Reports. Reports you save in My Reports are only accessible by you and cannot
be accessed by other Users.
Step-by-Step Instructions
Screen Step/Action
Report Viewer — Save Icon
Report Viewer — Home Menu
1. From the Report Viewer screen, click
the Save icon from the Home toolbar or select
the Save option from the Home menu.
The Save As window displays.
28
CCRS® — Quick Start Guide | Save Report Templates — My Reports
Screen Step/Action
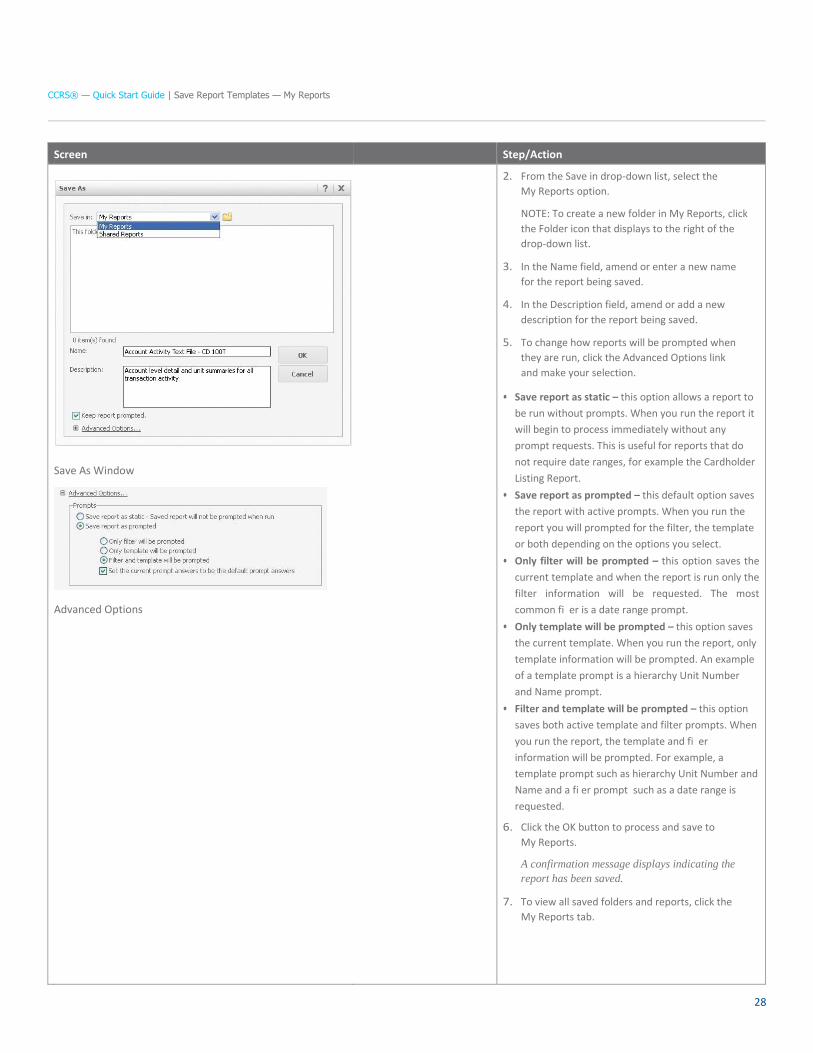
Save As Window
Advanced Options
2. From the Save in drop-down list, select the
My Reports option.
NOTE: To create a new folder in My Reports, click
the Folder icon that displays to the right of the
drop-down list.
3. In the Name field, amend or enter a new name
for the report being saved.
4. In the Description field, amend or add a new
description for the report being saved.
5. To change how reports will be prompted when
they are run, click the Advanced Options link
and make your selection.
• Save report as static – this option allows a report to
be run without prompts. When you run the report it
will begin to process immediately without any
prompt requests. This is useful for reports that do
not require date ranges, for example the Cardholder
Listing Report.
• Save report as prompted – this default option saves
the report with active prompts. When you run the
report you will prompted for the filter, the template
or both depending on the options you select.
• Only filter will be prompted – this option saves the
current template and when the report is run only the
filter information will be requested. The most
common fi er is a date range prompt.
• Only template will be prompted – this option saves
the current template. When you run the report, only
template information will be prompted. An example
of a template prompt is a hierarchy Unit Number
and Name prompt.
• Filter and template will be prompted – this option
saves both active template and filter prompts. When
you run the report, the template and fi er
information will be prompted. For example, a
template prompt such as hierarchy Unit Number and
Name and a fi er prompt such as a date range is
requested.
6. Click the OK button to process and save to
My Reports.
A confirmation message displays indicating the
report has been saved.
7. To view all saved folders and reports, click the
My Reports tab.
29
CCRS® — Quick Start Guide | Report Viewer Toolbars
Attachment
Report Viewer Toolbars Reports created or run in CCRS display in the Report Viewer. The Report Viewer contains Home, Tools, Data, Grid and Format function menus.
When you click on each menu item, a sub-set of toolbar icons displays. These same functions can be accessed and viewed when you click the
expand arrow for each menu.
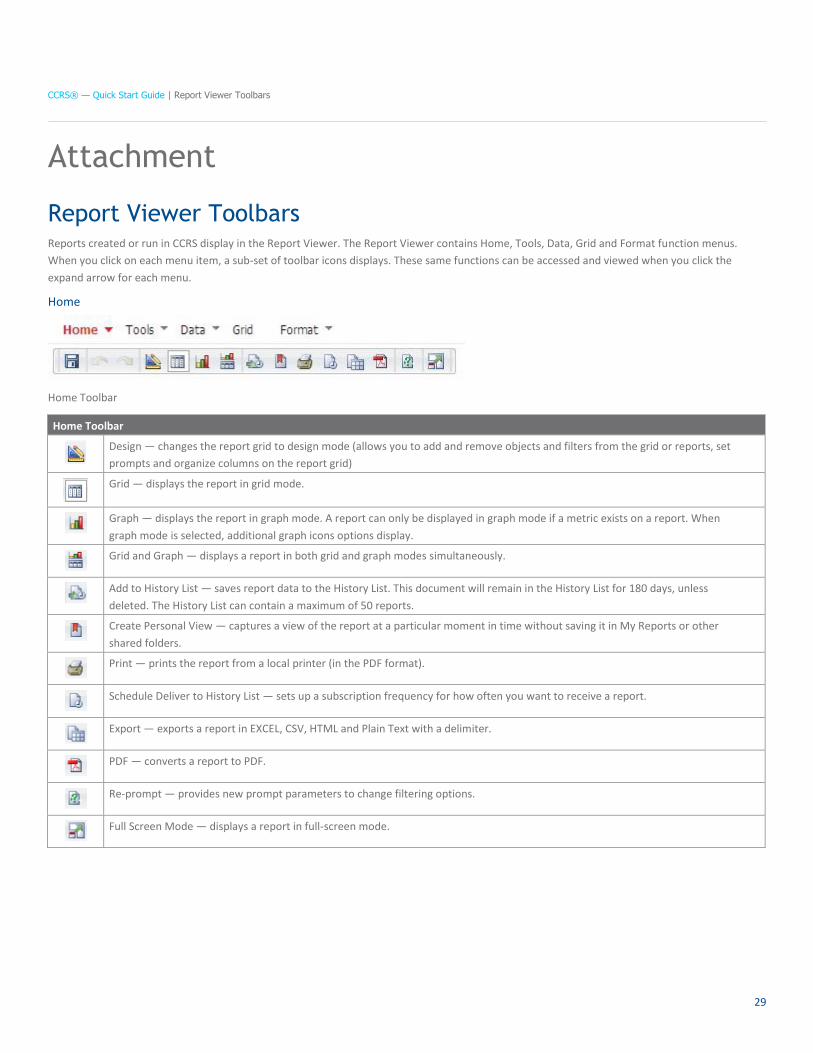
Home
Home Toolbar
Home Toolbar
Design — changes the report grid to design mode (allows you to add and remove objects and filters from the grid or reports, set
prompts and organize columns on the report grid)
Grid — displays the report in grid mode.
Graph — displays the report in graph mode. A report can only be displayed in graph mode if a metric exists on a report. When
graph mode is selected, additional graph icons options display.
Grid and Graph — displays a report in both grid and graph modes simultaneously.
Add to History List — saves report data to the History List. This document will remain in the History List for 180 days, unless
deleted. The History List can contain a maximum of 50 reports.
Create Personal View — captures a view of the report at a particular moment in time without saving it in My Reports or other
shared folders.
Print — prints the report from a local printer (in the PDF format).
Schedule Deliver to History List — sets up a subscription frequency for how often you want to receive a report.
Export — exports a report in EXCEL, CSV, HTML and Plain Text with a delimiter.
PDF — converts a report to PDF.
Re-prompt — provides new prompt parameters to change filtering options.
Full Screen Mode — displays a report in full-screen mode.
CCRS® — Quick Start Guide | Report Viewer Toolbars
30
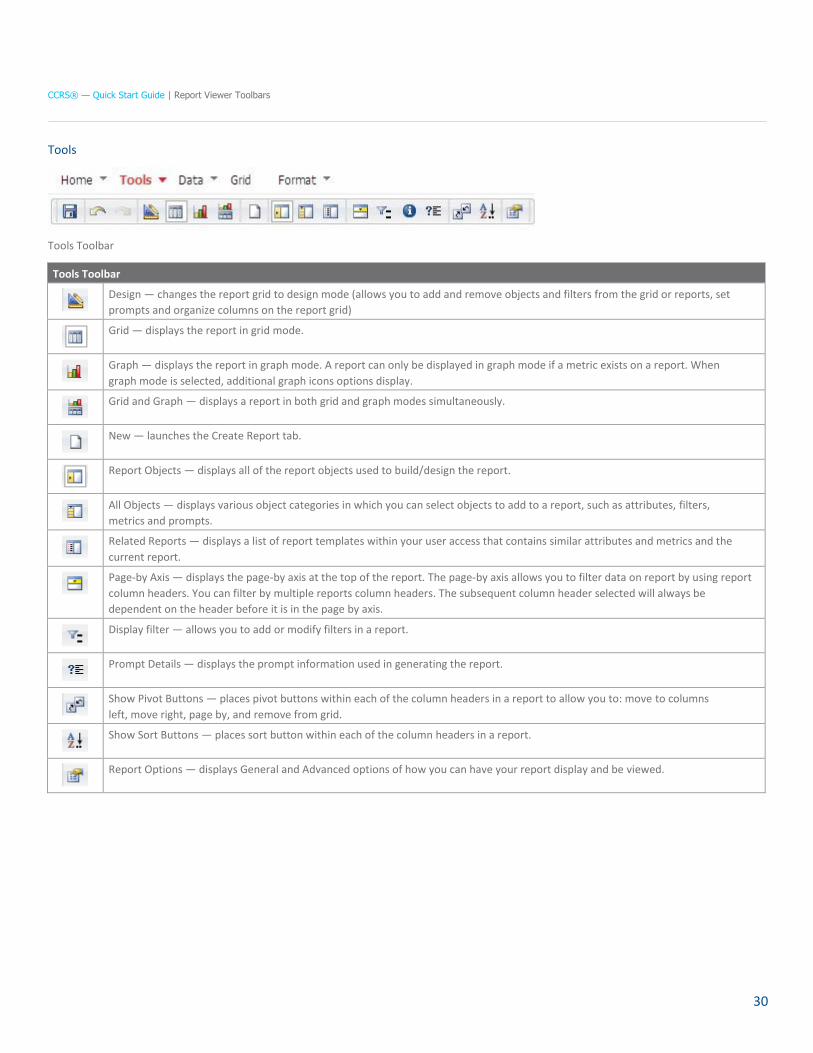
Tools
Tools Toolbar
Tools Toolbar
Design — changes the report grid to design mode (allows you to add and remove objects and filters from the grid or reports, set
prompts and organize columns on the report grid)
Grid — displays the report in grid mode.
Graph — displays the report in graph mode. A report can only be displayed in graph mode if a metric exists on a report. When
graph mode is selected, additional graph icons options display.
Grid and Graph — displays a report in both grid and graph modes simultaneously.
New — launches the Create Report tab.
Report Objects — displays all of the report objects used to build/design the report.
All Objects — displays various object categories in which you can select objects to add to a report, such as attributes, filters,
metrics and prompts.
Related Reports — displays a list of report templates within your user access that contains similar attributes and metrics and the
current report.
Page-by Axis — displays the page-by axis at the top of the report. The page-by axis allows you to filter data on report by using report
column headers. You can filter by multiple reports column headers. The subsequent column header selected will always be
dependent on the header before it is in the page by axis.
Display filter — allows you to add or modify filters in a report.
Prompt Details — displays the prompt information used in generating the report.
Show Pivot Buttons — places pivot buttons within each of the column headers in a report to allow you to: move to columns
left, move right, page by, and remove from grid.
Show Sort Buttons — places sort button within each of the column headers in a report.
Report Options — displays General and Advanced options of how you can have your report display and be viewed.
CCRS® — Quick Start Guide | Report Viewer Toolbars
31
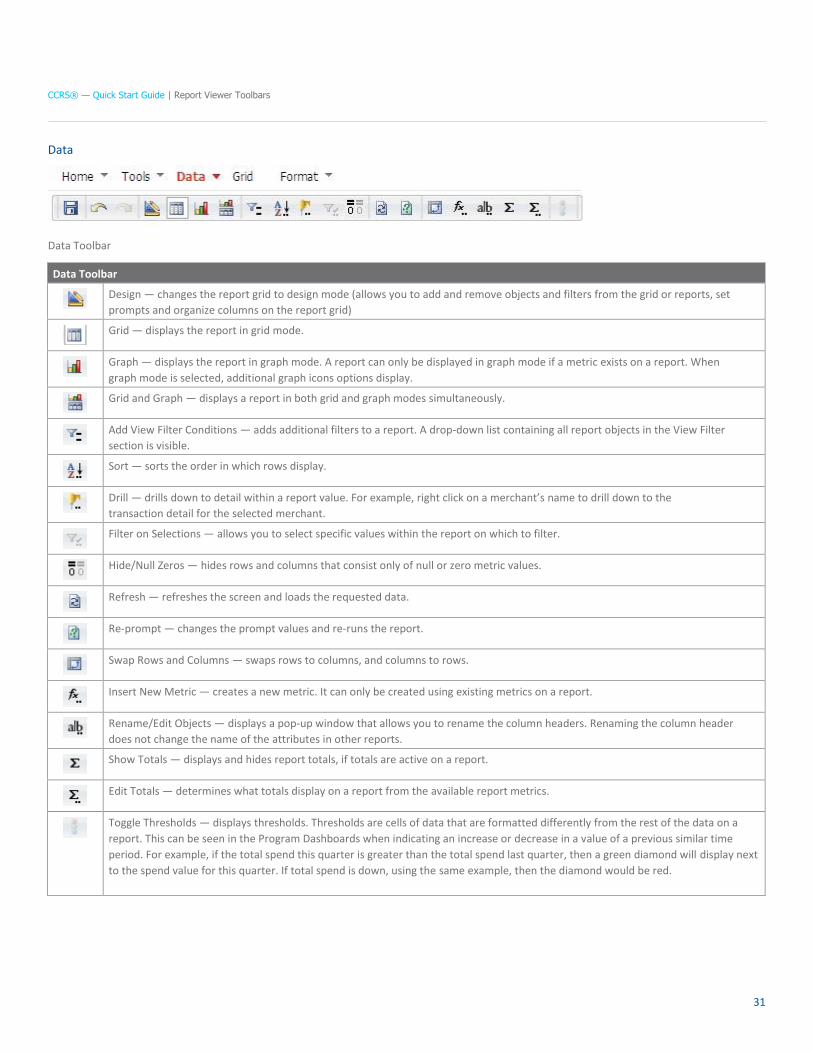
Data
Data Toolbar
Data Toolbar
Design — changes the report grid to design mode (allows you to add and remove objects and filters from the grid or reports, set
prompts and organize columns on the report grid)
Grid — displays the report in grid mode.
Graph — displays the report in graph mode. A report can only be displayed in graph mode if a metric exists on a report. When
graph mode is selected, additional graph icons options display.
Grid and Graph — displays a report in both grid and graph modes simultaneously.
Add View Filter Conditions — adds additional filters to a report. A drop-down list containing all report objects in the View Filter
section is visible.
Sort — sorts the order in which rows display.
Drill — drills down to detail within a report value. For example, right click on a merchant’s name to drill down to the
transaction detail for the selected merchant.
Filter on Selections — allows you to select specific values within the report on which to filter.
Hide/Null Zeros — hides rows and columns that consist only of null or zero metric values.
Refresh — refreshes the screen and loads the requested data.
Re-prompt — changes the prompt values and re-runs the report.
Swap Rows and Columns — swaps rows to columns, and columns to rows.
Insert New Metric — creates a new metric. It can only be created using existing metrics on a report.
Rename/Edit Objects — displays a pop-up window that allows you to rename the column headers. Renaming the column header
does not change the name of the attributes in other reports.
Show Totals — displays and hides report totals, if totals are active on a report.
Edit Totals — determines what totals display on a report from the available report metrics.
Toggle Thresholds — displays thresholds. Thresholds are cells of data that are formatted differently from the rest of the data on a
report. This can be seen in the Program Dashboards when indicating an increase or decrease in a value of a previous similar time
period. For example, if the total spend this quarter is greater than the total spend last quarter, then a green diamond will display next
to the spend value for this quarter. If total spend is down, using the same example, then the diamond would be red.
CCRS® — Quick Start Guide | Report Viewer Toolbars
32
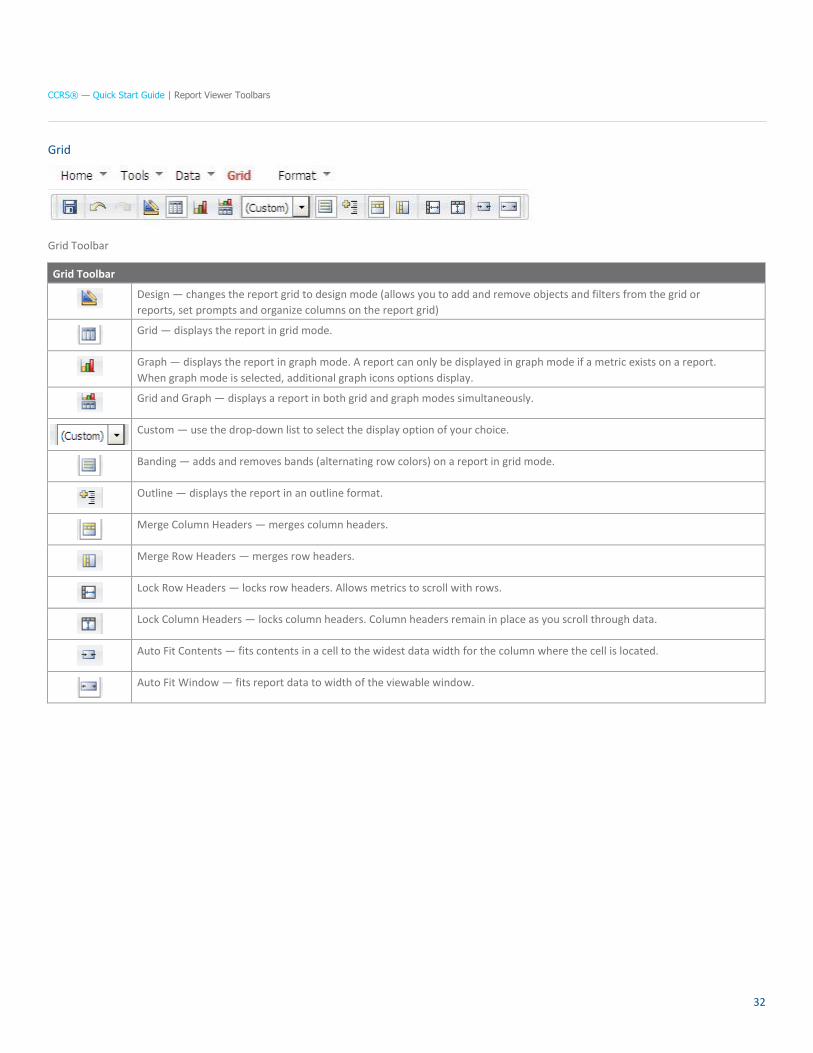
Grid
Grid Toolbar
Grid Toolbar
Design — changes the report grid to design mode (allows you to add and remove objects and filters from the grid or
reports, set prompts and organize columns on the report grid)
Grid — displays the report in grid mode.
Graph — displays the report in graph mode. A report can only be displayed in graph mode if a metric exists on a report.
When graph mode is selected, additional graph icons options display.
Grid and Graph — displays a report in both grid and graph modes simultaneously.
Custom — use the drop-down list to select the display option of your choice.
Banding — adds and removes bands (alternating row colors) on a report in grid mode.
Outline — displays the report in an outline format.
Merge Column Headers — merges column headers.
Merge Row Headers — merges row headers.
Lock Row Headers — locks row headers. Allows metrics to scroll with rows.
Lock Column Headers — locks column headers. Column headers remain in place as you scroll through data.
Auto Fit Contents — fits contents in a cell to the widest data width for the column where the cell is located.
Auto Fit Window — fits report data to width of the viewable window.
CCRS® — Quick Start Guide | Report Viewer Toolbars
33
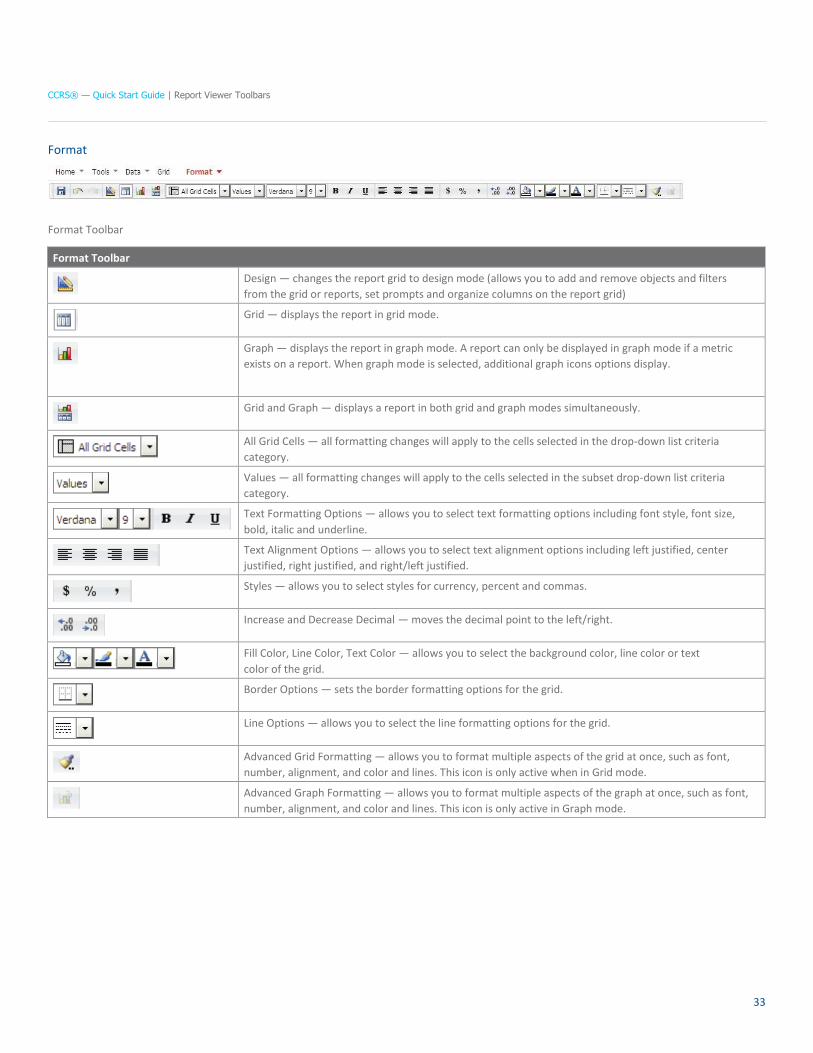
Format
Format Toolbar
Format Toolbar
Design — changes the report grid to design mode (allows you to add and remove objects and filters
from the grid or reports, set prompts and organize columns on the report grid)
Grid — displays the report in grid mode.
Graph — displays the report in graph mode. A report can only be displayed in graph mode if a metric
exists on a report. When graph mode is selected, additional graph icons options display.
Grid and Graph — displays a report in both grid and graph modes simultaneously.
All Grid Cells — all formatting changes will apply to the cells selected in the drop-down list criteria
category.
Values — all formatting changes will apply to the cells selected in the subset drop-down list criteria
category.
Text Formatting Options — allows you to select text formatting options including font style, font size,
bold, italic and underline.
Text Alignment Options — allows you to select text alignment options including left justified, center
justified, right justified, and right/left justified.
Styles — allows you to select styles for currency, percent and commas.
Increase and Decrease Decimal — moves the decimal point to the left/right.
Fill Color, Line Color, Text Color — allows you to select the background color, line color or text
color of the grid.
Border Options — sets the border formatting options for the grid.
Line Options — allows you to select the line formatting options for the grid.
Advanced Grid Formatting — allows you to format multiple aspects of the grid at once, such as font,
number, alignment, and color and lines. This icon is only active when in Grid mode.
Advanced Graph Formatting — allows you to format multiple aspects of the graph at once, such as font,
number, alignment, and color and lines. This icon is only active in Graph mode.
CCRS® — Quick Start Guide | Report Viewer Toolbars
34
Set User Preferences Overview
Some Users and Administrators are able to customize their User preferences in CCRS. User preferences are accessed from the Preferences tab.
The left side of the Preferences screen provides links to all categories of User preference parameters.
Applying Preference Changes
When you click the Apply button on any Preferences screen, the settings are applied differently, depending on which of the following options you
choose:
• Apply to all projects on the current server — the settings are applied to all projects, not just the one you are currently configuring. It is a
default option.
• Apply to current project — the settings are applied only to the current project.
Load Default Values
When you click the Load Default Values button, the Administrator’s default values for this section of preferences is loaded. These default values
are not saved until you click the Apply button.
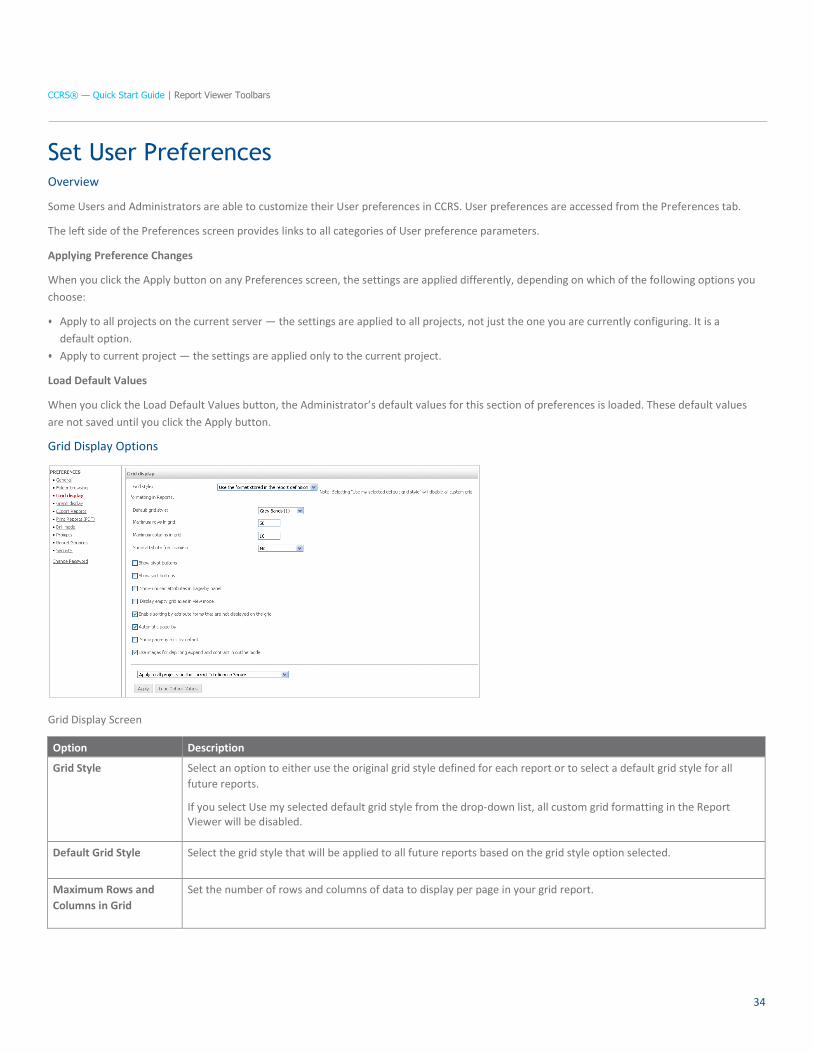
Grid Display Options
Grid Display Screen
Option Description
Grid Style Select an option to either use the original grid style defined for each report or to select a default grid style for all
future reports.
If you select Use my selected default grid style from the drop-down list, all custom grid formatting in the Report Viewer will be disabled.
Default Grid Style Select the grid style that will be applied to all future reports based on the grid style option selected.
Maximum Rows and
Columns in Grid
Set the number of rows and columns of data to display per page in your grid report.
CCRS® — Quick Start Guide | Report Viewer Toolbars
35
Option Description
Show Attribute Form
Names
You can use it to specify if attribute form names for attributes with multiple forms are displayed on reports. Select
Yes or No to either allow or prevent Users from viewing attribute form names on reports, regardless of whether the
display of form names is enabled on the reports. Select the Read from report option to show or hide attribute form
names on a report-by-report basis. With this option selected, attribute form names are only displayed for reports in
which the display of attribute form names is enabled.
Show Pivot and Sort
Buttons
You can select this option to show pivot buttons on all reports.
Enable Sorting by
Attribute Forms That
Are Not Displayed on
the Grid
You can select this option to sort according to attributes that are not displayed on the grid. For example, the
description form of Category, but not the ID form, is displayed on a report. Even though the ID is not present on the
report, you can still sort the report by the ID if this setting is enabled.
Automatic Page-by This option allows you determine if a new page of information displays immediately after you select a choice in a
page-by drop-down list. If this checkbox is not selected, you must click the Apply button to see the new information
after making a selection. Turning it off can be useful if there are multiple page-by drop-down lists and you want to
click the Apply button only once, after all of the selections have been made.
Use Images for
Depicting Expand
and Contract in
Outline Mode
This option is used primarily as a troubleshooting setting to adjust the expand + and contract — symbols in Outline
mode. If the expand and contract symbols images do not appear correctly in Outline mode, change this setting to
resolve the issue.
Apply When you click the Apply button on any Preferences screen, the settings are applied to the project
differently, depending on which of the following selections you choose from the drop-down list:
• Apply to all projects on the current server — the settings are applied to all projects, not just the one you are
currently configuring. It is a default option.
• Apply to current project — the settings are applied only to the current project.
Load Default Values When you click the Load Default Values button, the Administrator’s default values for this section of
preferences is loaded. These default values are not saved until you click the Apply button.
CCRS® — Quick Start Guide | Report Viewer Toolbars
36
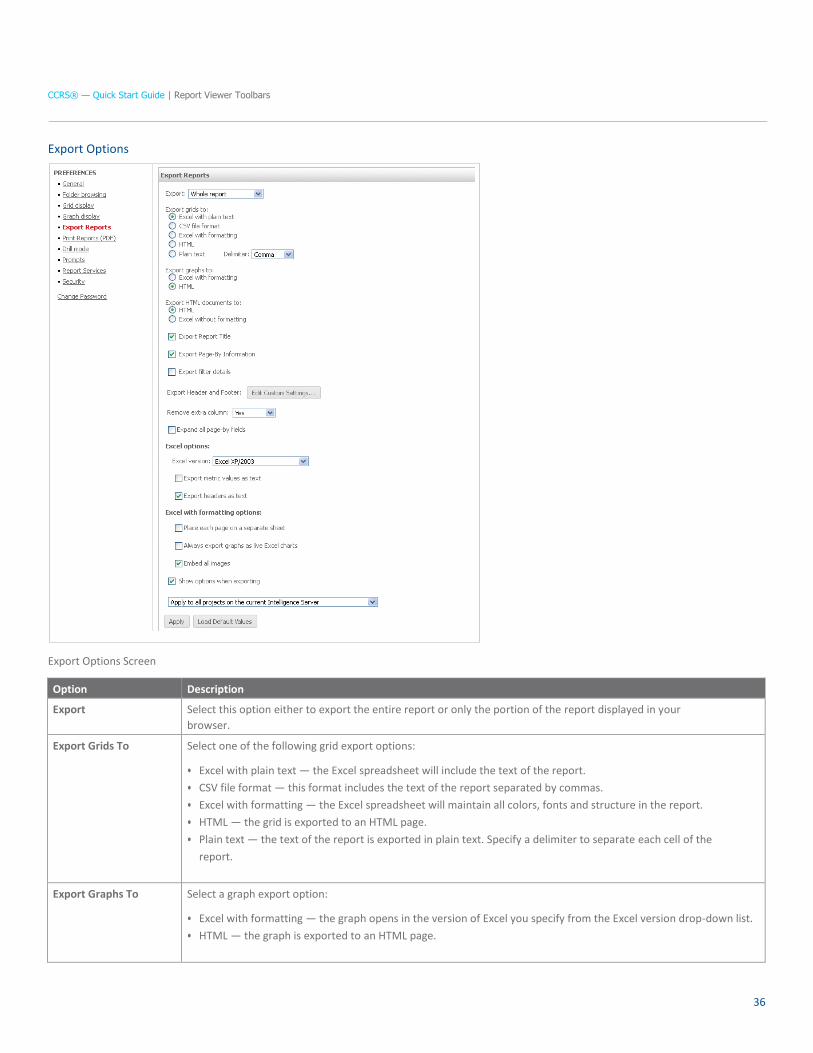
Export Options
Export Options Screen
Option Description
Export Select this option either to export the entire report or only the portion of the report displayed in your
browser.
Export Grids To Select one of the following grid export options:
• Excel with plain text — the Excel spreadsheet will include the text of the report.
• CSV file format — this format includes the text of the report separated by commas.
• Excel with formatting — the Excel spreadsheet will maintain all colors, fonts and structure in the report.
• HTML — the grid is exported to an HTML page.
• Plain text — the text of the report is exported in plain text. Specify a delimiter to separate each cell of the
report.
Export Graphs To Select a graph export option:
• Excel with formatting — the graph opens in the version of Excel you specify from the Excel version drop-down list.
• HTML — the graph is exported to an HTML page.
CCRS® — Quick Start Guide | Report Viewer Toolbars
37
Option Description
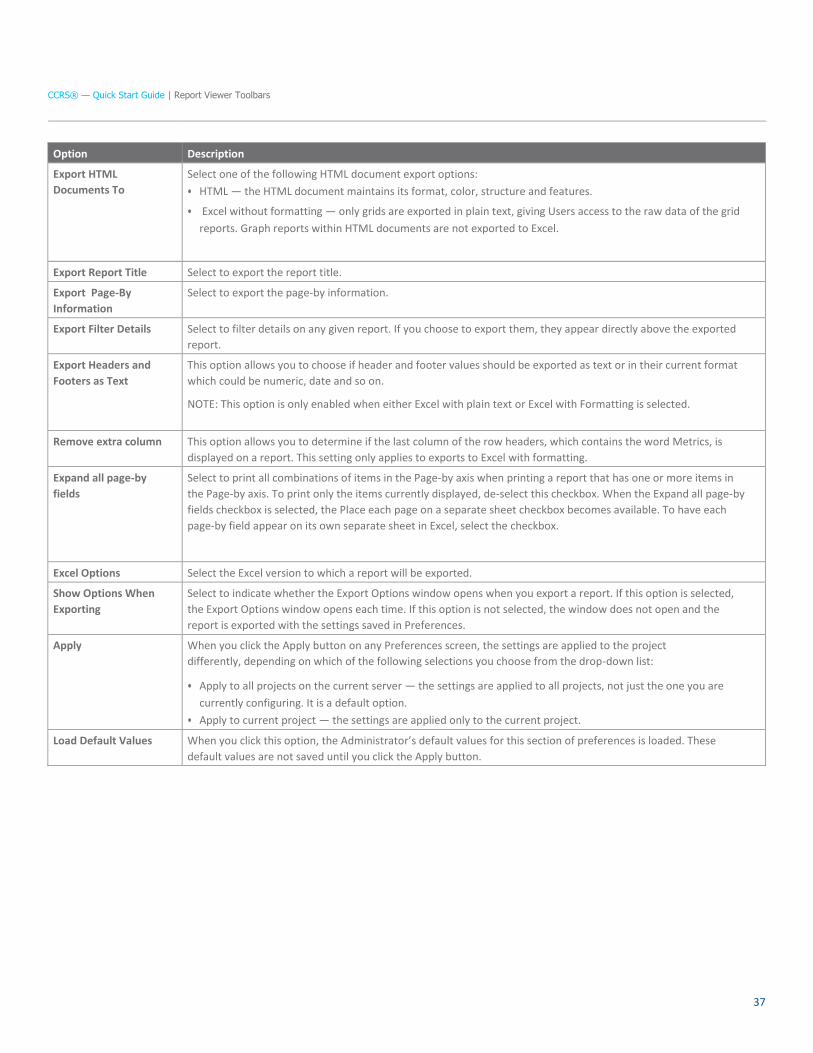
Export HTML
Documents To
Select one of the following HTML document export options:
• HTML — the HTML document maintains its format, color, structure and features.
• Excel without formatting — only grids are exported in plain text, giving Users access to the raw data of the grid
reports. Graph reports within HTML documents are not exported to Excel.
Export Report Title Select to export the report title.
Export Page-By
Information
Select to export the page-by information.
Export Filter Details Select to filter details on any given report. If you choose to export them, they appear directly above the exported
report.
Export Headers and
Footers as Text
This option allows you to choose if header and footer values should be exported as text or in their current format
which could be numeric, date and so on.
NOTE: This option is only enabled when either Excel with plain text or Excel with Formatting is selected.
Remove extra column This option allows you to determine if the last column of the row headers, which contains the word Metrics, is
displayed on a report. This setting only applies to exports to Excel with formatting.
Expand all page-by
fields
Select to print all combinations of items in the Page-by axis when printing a report that has one or more items in
the Page-by axis. To print only the items currently displayed, de-select this checkbox. When the Expand all page-by
fields checkbox is selected, the Place each page on a separate sheet checkbox becomes available. To have each
page-by field appear on its own separate sheet in Excel, select the checkbox.
Excel Options Select the Excel version to which a report will be exported.
Show Options When
Exporting
Select to indicate whether the Export Options window opens when you export a report. If this option is selected,
the Export Options window opens each time. If this option is not selected, the window does not open and the
report is exported with the settings saved in Preferences.
Apply When you click the Apply button on any Preferences screen, the settings are applied to the project
differently, depending on which of the following selections you choose from the drop-down list:
• Apply to all projects on the current server — the settings are applied to all projects, not just the one you are
currently configuring. It is a default option.
• Apply to current project — the settings are applied only to the current project.
Load Default Values When you click this option, the Administrator’s default values for this section of preferences is loaded. These
default values are not saved until you click the Apply button.

The Citi and Citi Handlowy are registered trademarks of Citigroup Inc., used under licence. Citigroup Inc. and its subsidiaries are also entitled to the use of certain other trademarks used herein. Bank Handlowy w Warszawie S.A. with its registered office in Warsaw at ul. Senatorska 16, 00-923 Warszawa, entered in the Register of Entrepreneurs of the National Court Register by the District Court for the capital city of Warsaw in Warsaw, 12th Commercial Division of the National Court Register, under No. KRS 000 000 1538; Tax ID No (NIP): 526-030-02-91; share capital of PLN 522,638,400; the capital has been fully paid up.