Embed Size (px)
Citation preview
CD-21-1 On the Quality of Opinion Surveys in Dutch Market Research
Abstract of a paper submitted for presentation at the International Conference on Quality
in Official Statistics
Harry van den Berg, Department of Research Methodology
Vrije Universiteit Amsterdam
De Boelelaan 1081-c 1081 HV Amsterdam
Email: [email protected] Market research constitutes an important branch of applied social research. Up till now, very little is known about the quality of market research. In order to improve this quality different aspects of the practice of market research have to be scrutinized such as the procedures used in developing questionnaires, the quality of questionnaires, the procedures used in processing answers of respondents and the quality of inferences from these answers. This paper is focussed on a specific type of question wording very often used in opinion surveys in the field of market research: the assertion. In this question form the respondent is asked to tell whether (s)he agrees or disagrees with an evaluative assertion about a specific topic. In the paper the main results of a methodological study concerning the use of assertions in opinion surveys will be presented. The study is focussed on the following research questions: 1) Which question forms are used in opinion surveys in the field of market research and
how important are statements as a question form? 2) To what extent do statements and the composition of questionnaires with statements
fulfil methodological criteria concerning the question wording of statements and the embedding of statements in a questionnaire?
3) To what extent are inferences from answers of respondents to statements - as reported by market researchers – justified according to methodological criteria?
4) Which procedures do market researchers use in designing questionnaires, selecting specific question forms such as statements, and constructing statements?
In order to be able to answer these questions, twenty market research organisations were selected to cooperate. They were asked to send a set of questionnaires and related research reports that could be viewed as representative examples of the kind of market research conducted by them. This request resulted in about fifty questionnaires that are analyzed in depth. Besides interviews were held with senior market researchers who are responsible for designing questionnaires. The results of the in-depth analysis of questionnaires, research reports and interviews with questionnaire designers are illuminating in several respects.
Firstly, the main methodological problems in the practice of designing questionnaires with statements could be identified. A remarkable result is that some of these problems are underestimated or even neglected in handbooks of survey methodology. Secondly, in reporting the outcome of opinion surveys based on questionnaires with statements, there is a general tendency to present different types of over-interpretations, i.e. conclusions that are insufficiently warranted by the data. Thirdly, the routines and procedures used by market researchers in designing questionnaires do not contain sufficient checks and possibilities for checking and testing questionnaires in order to prevent methodological weaknesses that constitute a severe validity-risk. A more general conclusion is that from it is important and fruitful to study the practice of applied social research in order to overcome the traditional cleavage between developments in the field of methodology and developments in the field of applied social research.
CD-21-2
Interviewers and survey's quality: error analysis and prevention
Maria Giuseppina Muratore
ISTAT, Via Ravà, 150 - 00142 Roma - e-mail: [email protected] Silvano Vitaletti
ISTAT, Via Ravà, 150 - 00142 Roma - e-mail: [email protected]
Abstract. The goal of this paper is to focus on the relationship between interviewers and survey quality, its positive and negative implications, the possibility to measure them and to strengthen or prevent them. In 1997- 98 the Italian Statistical Institute (Istat) carried out the first victimisation survey: "Citizen's Safety Survey". Data collection was centralised, because of the use of C.A.T.I. technique (50.000 telephone interviews were collected during 4 months). This was very useful for the continuos training strategy (Muratore, Quattrociocchi 1998), for the daily monitoring system (based on quality indicators) (Quattrociocchi, Sabbadini 1998, Muratore 2000) and, above all, for the deep relationship created between interviewers and researchers (Muratore, Sabbadini 1999). This framework, based on the motivation of interviewers, produced good results: households have been available to participate to the survey and the refusal rate was going down as long as the survey were being conducted. Therefore, it's essential to point out the interviewers' role, to analyse their behaviour and their influence on data collection phase. Different means are used to do this: 1. an evaluation survey gives us an important and substantial feedback about interviewers’ opinions and feelings on different aspects: the content and the instruments used for the training with reference to efficacy and effectiveness to achieve established aims, the difficulties met with the households and the interviewees, the relationships established with Istat staff, the feelings experienced. Above all these last aspects will be very useful to better the training schedule (the second Safety's Survey is planned for 2001-2002). 2. the textual analysis of open-ended questions, i.e. the interviewers' note and difficulties met in each interview, offers very important suggestions about the content and the interview's process. About the content is essential to check possible ex-post errors declared by interviewers and to understand better the performance of the questionnaire. About the process it's useful to be aware of the survey settings: households needs and lifestyle, which hours are better to interview them, which causes are indicated for the interruption or for the appointment. 3. quality indicators on each interviewer, and their evolution during the survey. The indicators are very different; response rate, refusal rate and indicators of non contact, too, vary very much among interviewers. A deeper analysis of these aspects is necessary to be aware of possible problems and to solve them. For instance, it's possible to automate some kind of telephonic outcomes or to know how an improvement in training could be effective on reducing the refusals. 4. analysis of the information produced by the preceding survey. This is implemented through the new theory of the symbolic objects, using the technique of symbolic marking. This technique permits, on the base of the first survey of "Citizen's Safety", to analyse and to plan soft check and hard check to limit interviewers’ discretionary power and to check the truthfulness of the interviewees answers. Keywords: survey's quality, CATI, fieldwork, interviewers
CD-21-2
1. Introduction Since the first edition of "Citizens' Safety Survey" (1997-1998) we began to project our survey
thinking about the fundamental role played by the interviewers. Their role is decisive to collect the interviewees’ stories, opinions, perceptions and remarks rightly; only the interviewer, in fact, can create an atmosphere inside which he enables the interviewees’ disconcealment. Lead by the surveying tools, the interviewer is able to understand the interviewee’s phenomenological reality interpreting and coding it as required. We considered the interviewer as an active part of the survey process and not just an anonymous addressee of notions and a passive performer (Muratore, Quattrociocchi, 1998; Gordon, 1999).
But, in spite of his/her importance and essentiality, he/she is also a source of error and information about the survey process, the methodology and the contents. He/she seems to represent a strange balance between a resource and a trouble, the many positive aspects and the less desirable ones.
The aim of this paper, therefore, is to focus on the interviewer’s role in determining the survey quality, in order to point out some methods useful to understand their reciprocal affection and their continuous relationship, to strengthen the positive issues and prevent their errors in an updating point of view. This means that the study of this relationship is particularly useful and meaningful in periodic surveys, as well as the Citizen's Safety Survey, in which, from time to time, (every now and then, about five years) new project phases are planned.
2. The interviewer's status and role The interviewer can be considered as a protagonist in several phases of the survey. He plays a
part: ! in the relationship with the interviewees: how to conquer the interview and how to carry out
it; ! in the administration of the questionnaire: the interviewer must have a knowledge in depth
of it, he must know the questions aim, their function and their peculiarity with reference to similar questions, their contents, their setting in the questionnaire, their formulation and the technical and methodological aspects of administering (how a question must be made, how many and what kind of answers must be expected, how to interpret and code every answer, how to behave with the interviewee’s silence, embarrassment, indecision, difficulties);
! in managing CATI, including how to cope with the non-contacts and contacts of the household before the interview, how to manage the answers and the automated questionnaire windows, how to help researchers to improve the interviewers’ technical abilities in order to obtain and conclude an interview correctly. And on each topic he/she can contribute positively or negatively to the quality of the survey.
Therefore, in the following paragraphs we are going to illustrate some interesting issues, in which the interviewers role could be considered strategic to understand survey quality and to project improvement in the new survey, too.
3. The context of the first Citizen's Safety Survey In 1997-1998 ISTAT Social Structures and Dynamics service carried out the first survey on
citizen’s safety1 concerning crimes against people and against property, the perception of safety in their
1 This survey belongs to the household multipurpose survey system, that aims at surveying everyday life social and affective aspects.
CD-21-2
environment and the safety measures adopted against the spread of criminality. This survey is done every five-year and it concerns people aged 14 and over, except for a section, devoted to sexual violence and harassment, addressed to the female population aged 14-59 years. The 50,000 interviews2 were carried out all over the country by external companies. The survey started in September 1997 and ended on January 1998, via CATI system which was helpful in process monitoring.
The keystone of our team has been the interviewer's motivation, in opposition to the company in which the interviewers were employed: we can't consider them unknown recipients of notions but an active part of the survey process.
Therefore the positive results we gained with our survey are not only due to the quality control methodology for Computer Assisted Telephone Interviewing Operations that we studied and implemented, but to the continuous training during the whole period of the survey, too.
Interviewers have to be supported and assisted during the training phase and also during the survey, owing to the peculiar nature of questions and subjects in the questionnaire.
They have a high quality task to perform. In fact interviewees have to open up and interviewers have to bear with uneasy situations, emotional distress and psychological pressure.
It's a difficult task teaching «measured sympathy» when you approach an interviewee, since interviewers have to try to get interviewees’ stories without making them feel deprived of their privacy and at the same time without acting as therapists.
So, the 200 interviewers were divided into groups composed of 20-25 people. Three-day briefings were organised; each session lasted 8 hours – with a lunch break – where survey theoretical issues were discussed. Issues concerned survey content, goals, methodology, types of relations and communications, as well as technical aspects. At the end of the briefing, after practising with the electronic questionnaire, each interviewer had to perform 10 trial telephone calls. And during the survey, debriefings were organised, as well as an internal help-desk and daily monitoring was carried on all the data collection phase.
4. Findings from the previous survey: the interviewers as resource
4.1. About the relationship with the interviewees and the training At the end of the survey, a final meeting was arranged where an evaluation questionnaire was
distributed to interviewers about the following topics: briefing activities, working approach adopted by ISTAT during the survey, difficulties and own impressions.
And in this context the interviewers’ contributes are very useful to understand the reason for and against concerning training and field setting.
An overall judgement on briefing Despite the time employed in training, only 25,6% of interviewers said that by the end of training
(theoretical lessons, practice, trial phone calls…) they were ready to start interviewing; 59,3% was fairly ready (84,9% total), while about 10% was scarcely ready or not ready at all. These data show that the work done has been positively assessed, though it could be still improved.
In fact, as a consequence of their opinions and of other alarm bells, to which we come back later, we are improving the timing, the contents and the methodologies of the training for the next victimization survey3. Above all we are planning several briefings during the survey, because of its overall length (4-5 months), and to use a new framework derived from the counselling approach. 2 The sample is a two stages random sample, stratified at first stage. 3 The new edition of the Citizen's Safety Survey will begin on September 2001 and will be finished by the end of February. The sample will be of 60.000 units.
CD-21-2
Last time, the type of briefing to which a lot of interviewers were exposed to was already an innovation, especially because telephone surveys are mainly carried out by profit organisations: 77,9% said that the ISTAT briefing was better than usual ones, 15,1% said it was the same as other briefings and 2,3% said they were worse.
About briefing contents Not all the different subjects of briefings had met the real needs of the survey, even if they have been
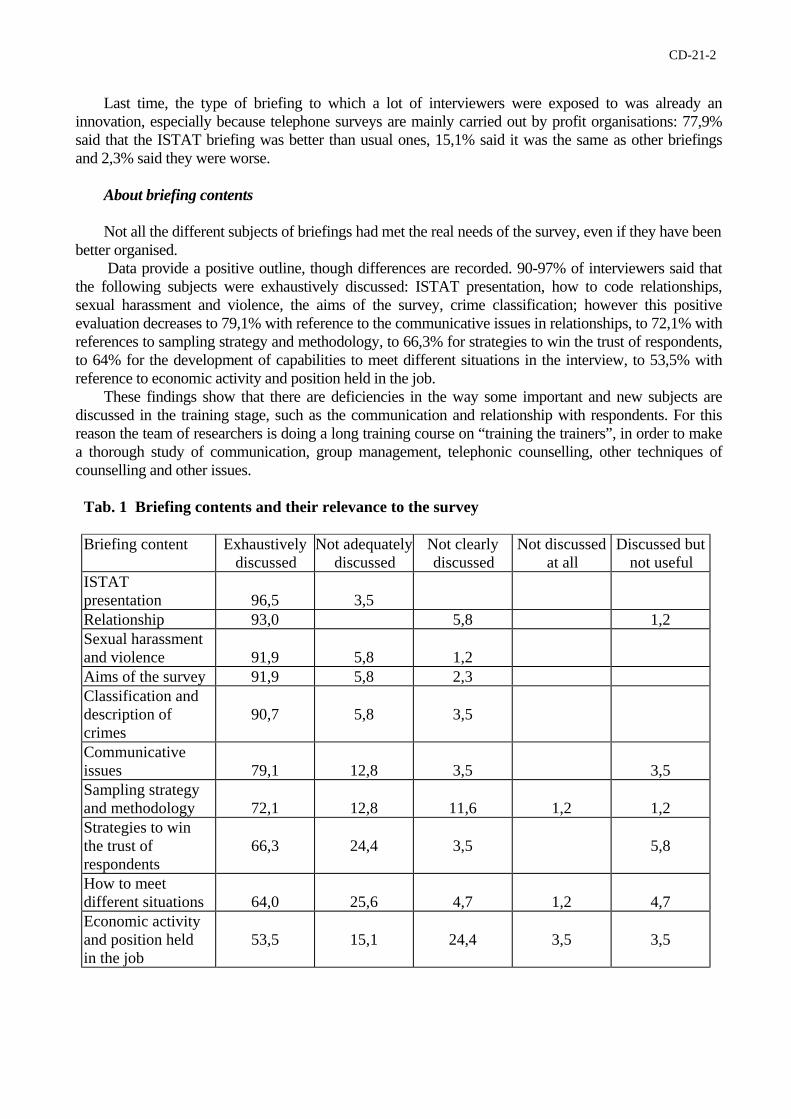
better organised. Data provide a positive outline, though differences are recorded. 90-97% of interviewers said that
the following subjects were exhaustively discussed: ISTAT presentation, how to code relationships, sexual harassment and violence, the aims of the survey, crime classification; however this positive evaluation decreases to 79,1% with reference to the communicative issues in relationships, to 72,1% with references to sampling strategy and methodology, to 66,3% for strategies to win the trust of respondents, to 64% for the development of capabilities to meet different situations in the interview, to 53,5% with reference to economic activity and position held in the job.
These findings show that there are deficiencies in the way some important and new subjects are discussed in the training stage, such as the communication and relationship with respondents. For this reason the team of researchers is doing a long training course on “training the trainers”, in order to make a thorough study of communication, group management, telephonic counselling, other techniques of counselling and other issues.
Tab. 1 Briefing contents and their relevance to the survey
Briefing content Exhaustively
discussed Not adequately
discussed Not clearly discussed
Not discussed at all
Discussed but not useful
ISTAT presentation
96,5
3,5
Relationship 93,0 5,8 1,2 Sexual harassment and violence
91,9
5,8
1,2
Aims of the survey 91,9 5,8 2,3 Classification and description of crimes
90,7
5,8
3,5
Communicative issues
79,1
12,8
3,5
3,5
Sampling strategy and methodology
72,1
12,8
11,6
1,2
1,2
Strategies to win the trust of respondents
66,3
24,4
3,5
5,8
How to meet different situations
64,0
25,6
4,7
1,2
4,7
Economic activity and position held in the job
53,5
15,1
24,4
3,5
3,5
CD-21-2
About briefing methods Besides the overall evaluation on the effectiveness of briefing contents, respondents (i.e.
interviewers) were required to express their opinion about tools and approaching way used in briefings. Practice and the communicative approach of trainers have been described as very effective (65% and 64% respectively), while the sequential reading of questionnaire, the use of transparencies and trial phone calls, theoretical and technical briefing, teamwork scored from 16% to 20% less. Different trainers seem comparatively useful, since only 36,1% of interviewers said it had been very effective.
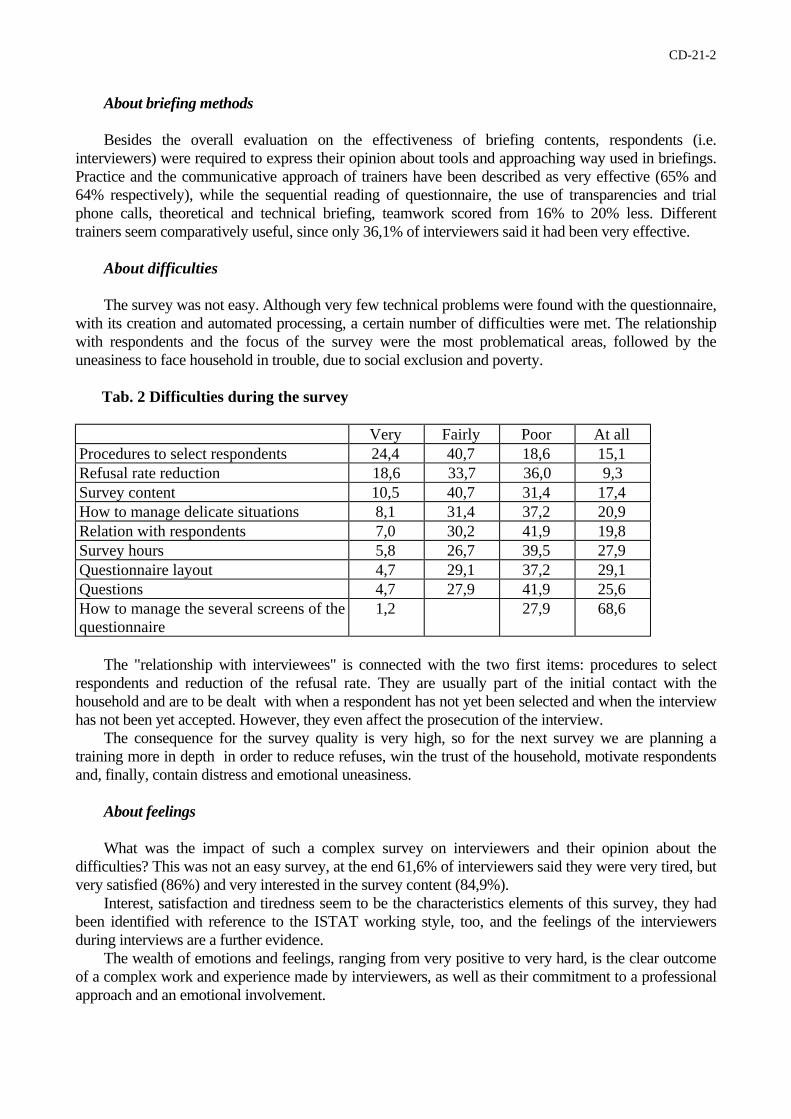
About difficulties The survey was not easy. Although very few technical problems were found with the questionnaire,
with its creation and automated processing, a certain number of difficulties were met. The relationship with respondents and the focus of the survey were the most problematical areas, followed by the uneasiness to face household in trouble, due to social exclusion and poverty.
Tab. 2 Difficulties during the survey Very Fairly Poor At all
Procedures to select respondents 24,4 40,7 18,6 15,1 Refusal rate reduction 18,6 33,7 36,0 9,3 Survey content 10,5 40,7 31,4 17,4 How to manage delicate situations 8,1 31,4 37,2 20,9 Relation with respondents 7,0 30,2 41,9 19,8 Survey hours 5,8 26,7 39,5 27,9 Questionnaire layout 4,7 29,1 37,2 29,1 Questions 4,7 27,9 41,9 25,6 How to manage the several screens of the questionnaire
1,2 27,9 68,6
The "relationship with interviewees" is connected with the two first items: procedures to select
respondents and reduction of the refusal rate. They are usually part of the initial contact with the household and are to be dealt with when a respondent has not yet been selected and when the interview has not been yet accepted. However, they even affect the prosecution of the interview.
The consequence for the survey quality is very high, so for the next survey we are planning a training more in depth in order to reduce refuses, win the trust of the household, motivate respondents and, finally, contain distress and emotional uneasiness.
About feelings What was the impact of such a complex survey on interviewers and their opinion about the
difficulties? This was not an easy survey, at the end 61,6% of interviewers said they were very tired, but very satisfied (86%) and very interested in the survey content (84,9%).
Interest, satisfaction and tiredness seem to be the characteristics elements of this survey, they had been identified with reference to the ISTAT working style, too, and the feelings of the interviewers during interviews are a further evidence.
The wealth of emotions and feelings, ranging from very positive to very hard, is the clear outcome of a complex work and experience made by interviewers, as well as their commitment to a professional approach and an emotional involvement.
CD-21-2
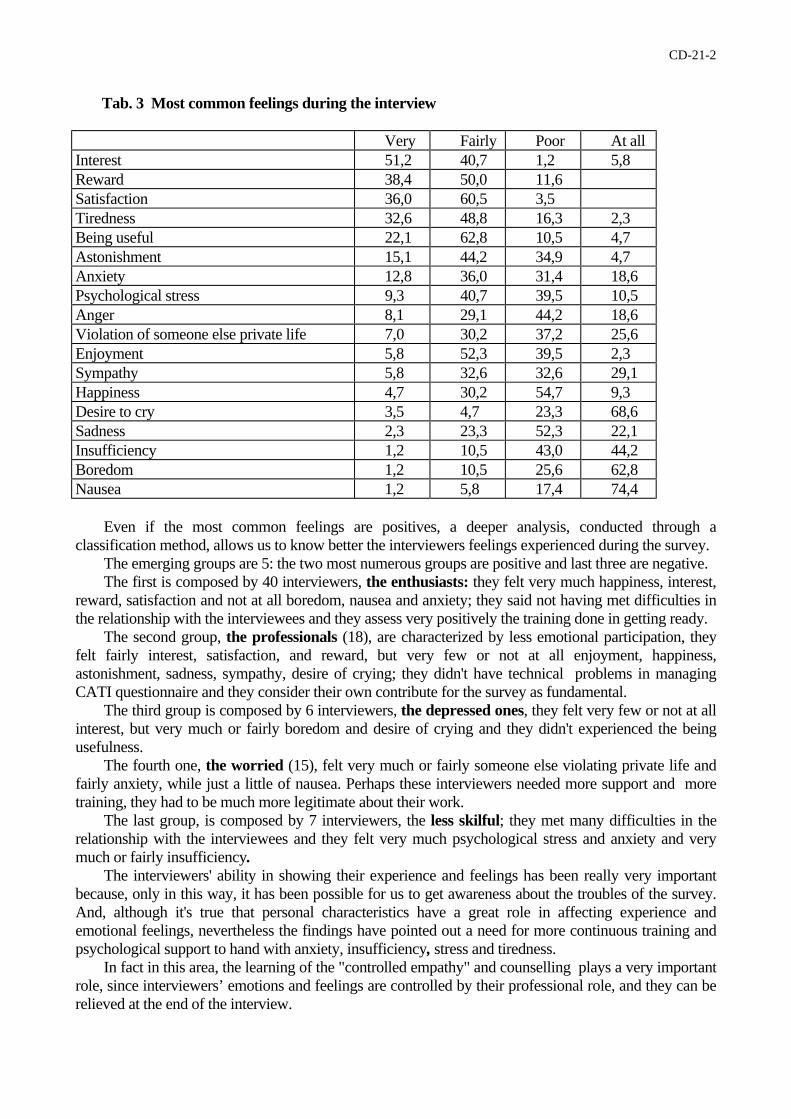
Tab. 3 Most common feelings during the interview Very Fairly Poor At all
Interest 51,2 40,7 1,2 5,8 Reward 38,4 50,0 11,6 Satisfaction 36,0 60,5 3,5 Tiredness 32,6 48,8 16,3 2,3 Being useful 22,1 62,8 10,5 4,7 Astonishment 15,1 44,2 34,9 4,7 Anxiety 12,8 36,0 31,4 18,6 Psychological stress 9,3 40,7 39,5 10,5 Anger 8,1 29,1 44,2 18,6 Violation of someone else private life 7,0 30,2 37,2 25,6 Enjoyment 5,8 52,3 39,5 2,3 Sympathy 5,8 32,6 32,6 29,1 Happiness 4,7 30,2 54,7 9,3 Desire to cry 3,5 4,7 23,3 68,6 Sadness 2,3 23,3 52,3 22,1 Insufficiency 1,2 10,5 43,0 44,2 Boredom 1,2 10,5 25,6 62,8 Nausea 1,2 5,8 17,4 74,4
Even if the most common feelings are positives, a deeper analysis, conducted through a
classification method, allows us to know better the interviewers feelings experienced during the survey. The emerging groups are 5: the two most numerous groups are positive and last three are negative. The first is composed by 40 interviewers, the enthusiasts: they felt very much happiness, interest,
reward, satisfaction and not at all boredom, nausea and anxiety; they said not having met difficulties in the relationship with the interviewees and they assess very positively the training done in getting ready.
The second group, the professionals (18), are characterized by less emotional participation, they felt fairly interest, satisfaction, and reward, but very few or not at all enjoyment, happiness, astonishment, sadness, sympathy, desire of crying; they didn't have technical problems in managing CATI questionnaire and they consider their own contribute for the survey as fundamental.
The third group is composed by 6 interviewers, the depressed ones, they felt very few or not at all interest, but very much or fairly boredom and desire of crying and they didn't experienced the being usefulness.
The fourth one, the worried (15), felt very much or fairly someone else violating private life and fairly anxiety, while just a little of nausea. Perhaps these interviewers needed more support and more training, they had to be much more legitimate about their work.
The last group, is composed by 7 interviewers, the less skilful; they met many difficulties in the relationship with the interviewees and they felt very much psychological stress and anxiety and very much or fairly insufficiency.
The interviewers' ability in showing their experience and feelings has been really very important because, only in this way, it has been possible for us to get awareness about the troubles of the survey. And, although it's true that personal characteristics have a great role in affecting experience and emotional feelings, nevertheless the findings have pointed out a need for more continuous training and psychological support to hand with anxiety, insufficiency, stress and tiredness.
In fact in this area, the learning of the "controlled empathy" and counselling plays a very important role, since interviewers’ emotions and feelings are controlled by their professional role, and they can be relieved at the end of the interview.
CD-21-2
4.2. About crimes classification and interview setting The interviewers represent a resource also during data collection phase, concerning both the
contents and the survey process. The hard analysis of open-ended questions is very important in order to revise the answers, e.g.
the kind of crime, and evaluate the process. The interviewers' note and difficulties in each interview gives, as well as the item "other (to specify)", essential suggestions about the content and the interview's process.
About the contents About the content is essential to check ex-post possible errors declared by interviewers and to
understand better the performance of the questionnaire. Their contribute concerned above all the revising of crimes classification. In fact, during the validation phase, the definition of about 400 crimes had been changed. The analysis of interviewers notes helped us to identify crimes classified in wrong categories.
Sometimes, in fact, information is not collected at the right moment for different reasons, but they arise in other part of the interview. In this way interviewers' notes supply to less precise information due to the quick reading of the questions, the misunderstanding of questionnaire and so on. As a consequence, some crimes have changed their definition: a pickpocket of a wallet lost on a table in a shop has been converted in a larceny without contact, or, for instance, a burglary in which the strength was used, has been converted in robbery, and theft without money lost were changed in attempts.
The interviewers information are also essential in planning the new edition of the survey, because we are oriented to prevent the discovered mistakes: coding them in advance as new answer's categories to fill in and automatically correct during the survey carrying on it-self; and deepen the study of crimes during the briefing.
About the process About the process it's useful to be aware of the survey settings: the households needs and
lifestyle, which hours are better to interview, which motives are indicated for the interruption or for the appointment. This information is very useful to plan an adaptive timetable and a better algorithm of CATI recalls.
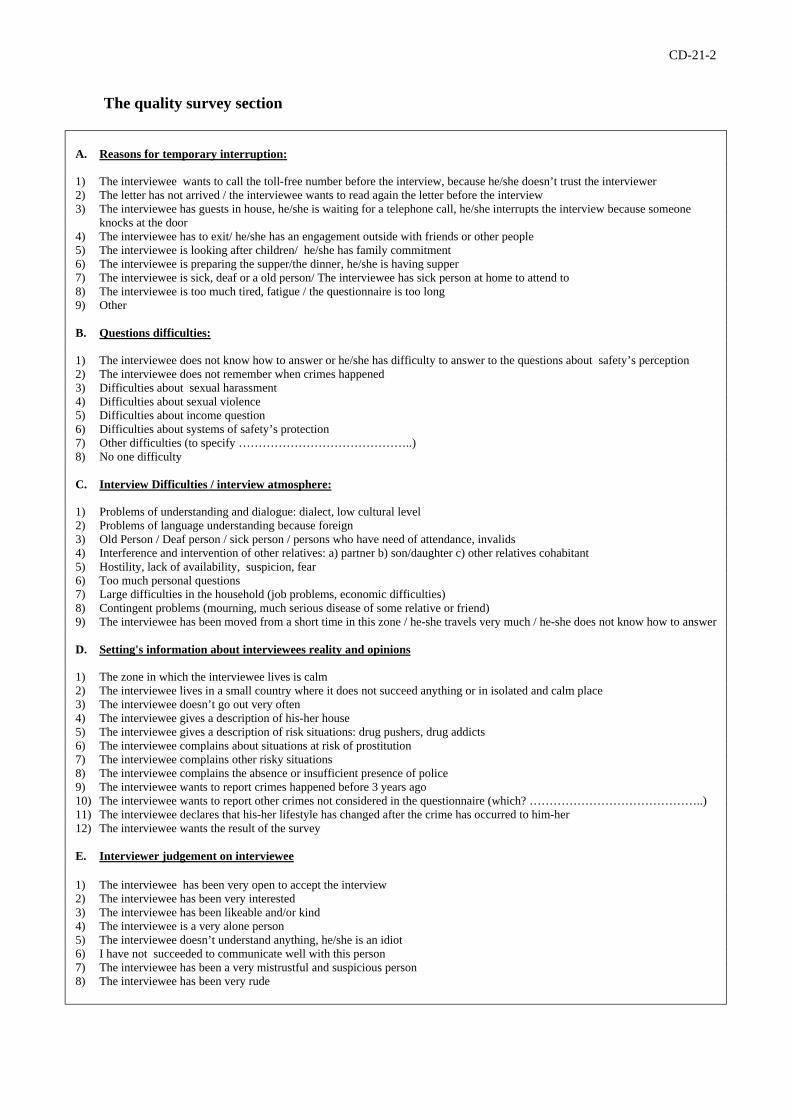
The findings concern the systematisation of the problems and the difficulties of interviews setting, due to the interviewees, the field peculiarities, the time and the focus of the survey, the relationship between interviewer and interviewee, the interviewer her-self. Consequently, the output is a quality section to put at the end of each interview, at the aim of: ! daily monitoring the interviews setting; ! improving, according to the interviewees' needs, some aspects of data collection phase, such as
the toll-free numbers, the text of the letter, the letter mailing, the appointment with the household;
! coping with the interviewer emotional and psychological stress through the creation of tools in the questionnaire at the aim of absorbing it;
! defining a better CATI algorithm.
CD-21-2
The quality survey section
A. Reasons for temporary interruption:
1) The interviewee wants to call the toll-free number before the interview, because he/she doesn’t trust the interviewer 2) The letter has not arrived / the interviewee wants to read again the letter before the interview 3) The interviewee has guests in house, he/she is waiting for a telephone call, he/she interrupts the interview because someone
knocks at the door 4) The interviewee has to exit/ he/she has an engagement outside with friends or other people 5) The interviewee is looking after children/ he/she has family commitment 6) The interviewee is preparing the supper/the dinner, he/she is having supper 7) The interviewee is sick, deaf or a old person/ The interviewee has sick person at home to attend to 8) The interviewee is too much tired, fatigue / the questionnaire is too long 9) Other
B. Questions difficulties:
1) The interviewee does not know how to answer or he/she has difficulty to answer to the questions about safety’s perception 2) The interviewee does not remember when crimes happened 3) Difficulties about sexual harassment 4) Difficulties about sexual violence 5) Difficulties about income question 6) Difficulties about systems of safety’s protection 7) Other difficulties (to specify ……………………………………..) 8) No one difficulty
C. Interview Difficulties / interview atmosphere: 1) Problems of understanding and dialogue: dialect, low cultural level 2) Problems of language understanding because foreign 3) Old Person / Deaf person / sick person / persons who have need of attendance, invalids 4) Interference and intervention of other relatives: a) partner b) son/daughter c) other relatives cohabitant 5) Hostility, lack of availability, suspicion, fear 6) Too much personal questions 7) Large difficulties in the household (job problems, economic difficulties) 8) Contingent problems (mourning, much serious disease of some relative or friend) 9) The interviewee has been moved from a short time in this zone / he-she travels very much / he-she does not know how to answer D. Setting's information about interviewees reality and opinions 1) The zone in which the interviewee lives is calm 2) The interviewee lives in a small country where it does not succeed anything or in isolated and calm place 3) The interviewee doesn’t go out very often 4) The interviewee gives a description of his-her house 5) The interviewee gives a description of risk situations: drug pushers, drug addicts 6) The interviewee complains about situations at risk of prostitution 7) The interviewee complains other risky situations 8) The interviewee complains the absence or insufficient presence of police 9) The interviewee wants to report crimes happened before 3 years ago 10) The interviewee wants to report other crimes not considered in the questionnaire (which? ……………………………………..) 11) The interviewee declares that his-her lifestyle has changed after the crime has occurred to him-her 12) The interviewee wants the result of the survey E. Interviewer judgement on interviewee 1) The interviewee has been very open to accept the interview 2) The interviewee has been very interested 3) The interviewee has been likeable and/or kind 4) The interviewee is a very alone person 5) The interviewee doesn’t understand anything, he/she is an idiot 6) I have not succeeded to communicate well with this person 7) The interviewee has been a very mistrustful and suspicious person 8) The interviewee has been very rude
CD-21-2
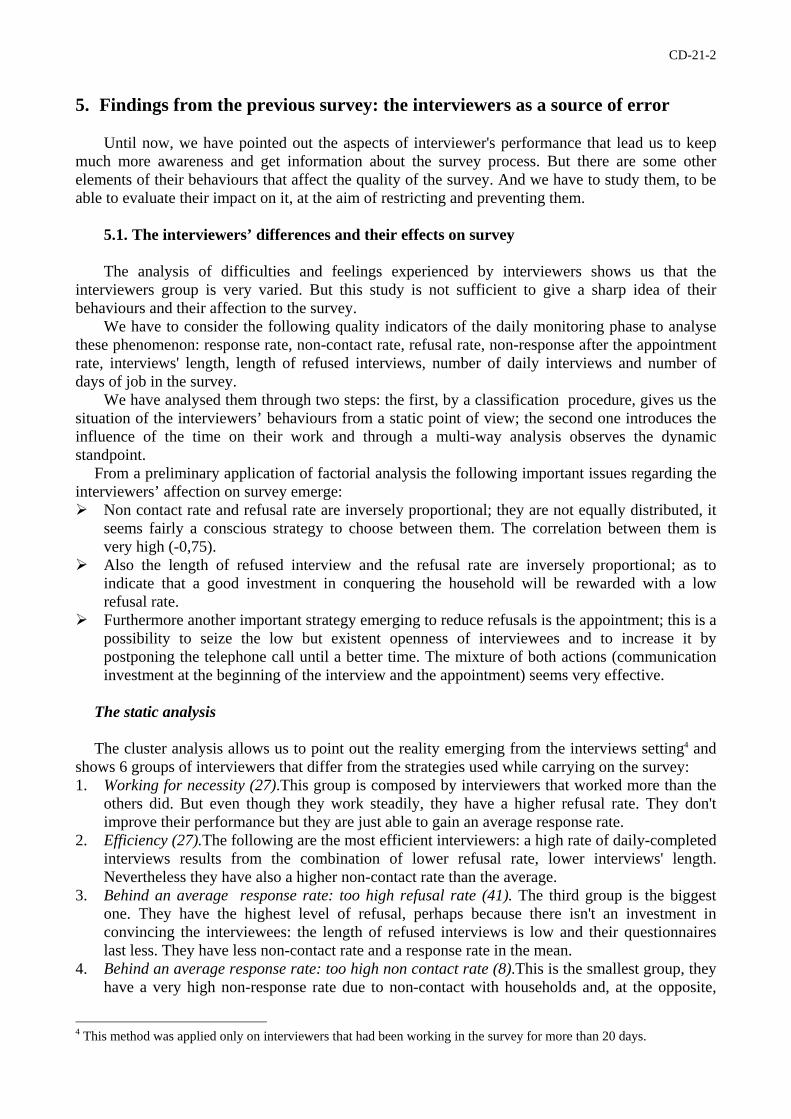
5. Findings from the previous survey: the interviewers as a source of error
Until now, we have pointed out the aspects of interviewer's performance that lead us to keep much more awareness and get information about the survey process. But there are some other elements of their behaviours that affect the quality of the survey. And we have to study them, to be able to evaluate their impact on it, at the aim of restricting and preventing them.
5.1. The interviewers’ differences and their effects on survey
The analysis of difficulties and feelings experienced by interviewers shows us that the
interviewers group is very varied. But this study is not sufficient to give a sharp idea of their behaviours and their affection to the survey.
We have to consider the following quality indicators of the daily monitoring phase to analyse these phenomenon: response rate, non-contact rate, refusal rate, non-response after the appointment rate, interviews' length, length of refused interviews, number of daily interviews and number of days of job in the survey.
We have analysed them through two steps: the first, by a classification procedure, gives us the situation of the interviewers’ behaviours from a static point of view; the second one introduces the influence of the time on their work and through a multi-way analysis observes the dynamic standpoint.
From a preliminary application of factorial analysis the following important issues regarding the interviewers’ affection on survey emerge: ! Non contact rate and refusal rate are inversely proportional; they are not equally distributed, it
seems fairly a conscious strategy to choose between them. The correlation between them is very high (-0,75).
! Also the length of refused interview and the refusal rate are inversely proportional; as to indicate that a good investment in conquering the household will be rewarded with a low refusal rate.
! Furthermore another important strategy emerging to reduce refusals is the appointment; this is a possibility to seize the low but existent openness of interviewees and to increase it by postponing the telephone call until a better time. The mixture of both actions (communication investment at the beginning of the interview and the appointment) seems very effective.
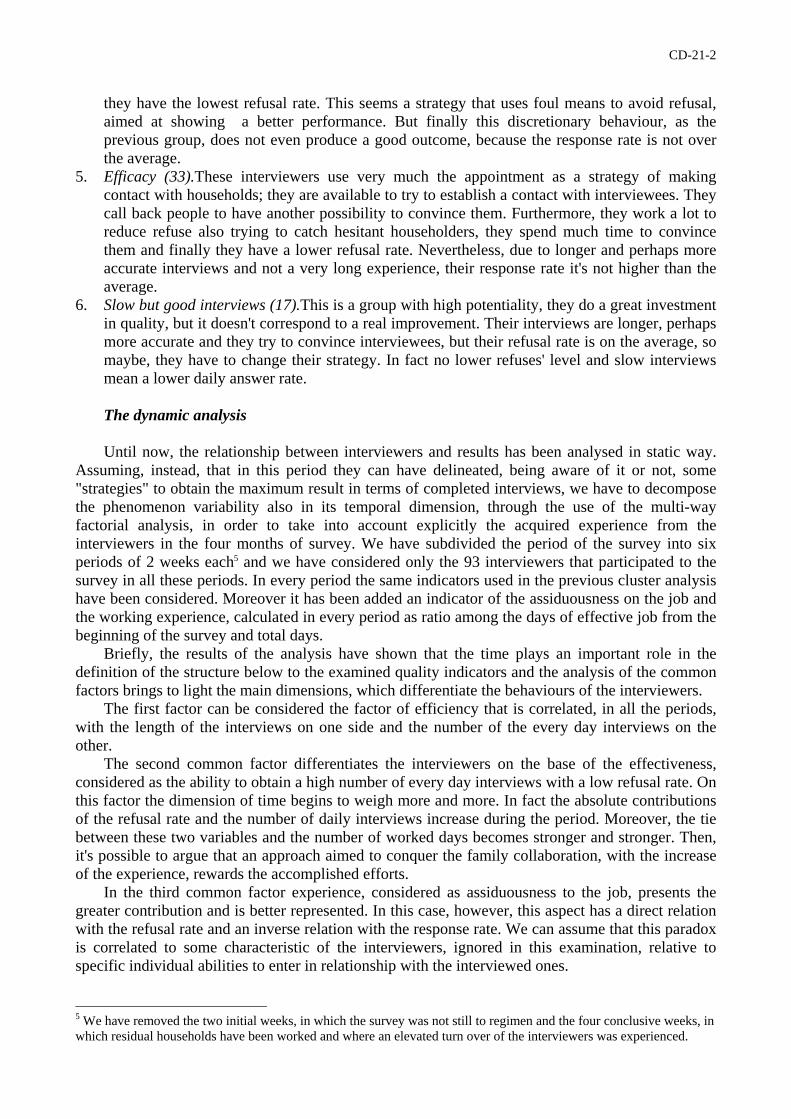
The static analysis The cluster analysis allows us to point out the reality emerging from the interviews setting4 and
shows 6 groups of interviewers that differ from the strategies used while carrying on the survey: 1. Working for necessity (27).This group is composed by interviewers that worked more than the
others did. But even though they work steadily, they have a higher refusal rate. They don't improve their performance but they are just able to gain an average response rate.
2. Efficiency (27).The following are the most efficient interviewers: a high rate of daily-completed interviews results from the combination of lower refusal rate, lower interviews' length. Nevertheless they have also a higher non-contact rate than the average.
3. Behind an average response rate: too high refusal rate (41). The third group is the biggest one. They have the highest level of refusal, perhaps because there isn't an investment in convincing the interviewees: the length of refused interviews is low and their questionnaires last less. They have less non-contact rate and a response rate in the mean.
4. Behind an average response rate: too high non contact rate (8).This is the smallest group, they have a very high non-response rate due to non-contact with households and, at the opposite,
4 This method was applied only on interviewers that had been working in the survey for more than 20 days.
CD-21-2
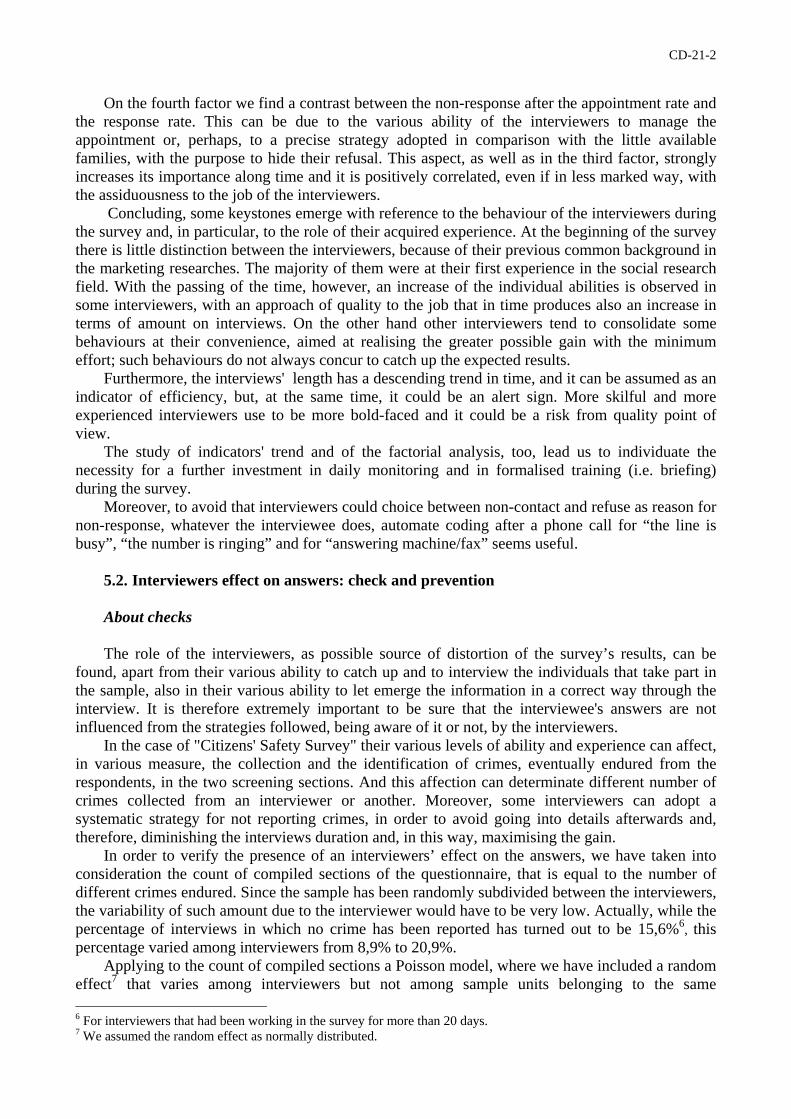
they have the lowest refusal rate. This seems a strategy that uses foul means to avoid refusal, aimed at showing a better performance. But finally this discretionary behaviour, as the previous group, does not even produce a good outcome, because the response rate is not over the average.
5. Efficacy (33).These interviewers use very much the appointment as a strategy of making contact with households; they are available to try to establish a contact with interviewees. They call back people to have another possibility to convince them. Furthermore, they work a lot to reduce refuse also trying to catch hesitant householders, they spend much time to convince them and finally they have a lower refusal rate. Nevertheless, due to longer and perhaps more accurate interviews and not a very long experience, their response rate it's not higher than the average.
6. Slow but good interviews (17).This is a group with high potentiality, they do a great investment in quality, but it doesn't correspond to a real improvement. Their interviews are longer, perhaps more accurate and they try to convince interviewees, but their refusal rate is on the average, so maybe, they have to change their strategy. In fact no lower refuses' level and slow interviews mean a lower daily answer rate.
The dynamic analysis Until now, the relationship between interviewers and results has been analysed in static way.
Assuming, instead, that in this period they can have delineated, being aware of it or not, some "strategies" to obtain the maximum result in terms of completed interviews, we have to decompose the phenomenon variability also in its temporal dimension, through the use of the multi-way factorial analysis, in order to take into account explicitly the acquired experience from the interviewers in the four months of survey. We have subdivided the period of the survey into six periods of 2 weeks each5 and we have considered only the 93 interviewers that participated to the survey in all these periods. In every period the same indicators used in the previous cluster analysis have been considered. Moreover it has been added an indicator of the assiduousness on the job and the working experience, calculated in every period as ratio among the days of effective job from the beginning of the survey and total days.
Briefly, the results of the analysis have shown that the time plays an important role in the definition of the structure below to the examined quality indicators and the analysis of the common factors brings to light the main dimensions, which differentiate the behaviours of the interviewers.
The first factor can be considered the factor of efficiency that is correlated, in all the periods, with the length of the interviews on one side and the number of the every day interviews on the other.
The second common factor differentiates the interviewers on the base of the effectiveness, considered as the ability to obtain a high number of every day interviews with a low refusal rate. On this factor the dimension of time begins to weigh more and more. In fact the absolute contributions of the refusal rate and the number of daily interviews increase during the period. Moreover, the tie between these two variables and the number of worked days becomes stronger and stronger. Then, it's possible to argue that an approach aimed to conquer the family collaboration, with the increase of the experience, rewards the accomplished efforts.
In the third common factor experience, considered as assiduousness to the job, presents the greater contribution and is better represented. In this case, however, this aspect has a direct relation with the refusal rate and an inverse relation with the response rate. We can assume that this paradox is correlated to some characteristic of the interviewers, ignored in this examination, relative to specific individual abilities to enter in relationship with the interviewed ones.
5 We have removed the two initial weeks, in which the survey was not still to regimen and the four conclusive weeks, in which residual households have been worked and where an elevated turn over of the interviewers was experienced.
CD-21-2
On the fourth factor we find a contrast between the non-response after the appointment rate and the response rate. This can be due to the various ability of the interviewers to manage the appointment or, perhaps, to a precise strategy adopted in comparison with the little available families, with the purpose to hide their refusal. This aspect, as well as in the third factor, strongly increases its importance along time and it is positively correlated, even if in less marked way, with the assiduousness to the job of the interviewers.
Concluding, some keystones emerge with reference to the behaviour of the interviewers during the survey and, in particular, to the role of their acquired experience. At the beginning of the survey there is little distinction between the interviewers, because of their previous common background in the marketing researches. The majority of them were at their first experience in the social research field. With the passing of the time, however, an increase of the individual abilities is observed in some interviewers, with an approach of quality to the job that in time produces also an increase in terms of amount on interviews. On the other hand other interviewers tend to consolidate some behaviours at their convenience, aimed at realising the greater possible gain with the minimum effort; such behaviours do not always concur to catch up the expected results.
Furthermore, the interviews' length has a descending trend in time, and it can be assumed as an indicator of efficiency, but, at the same time, it could be an alert sign. More skilful and more experienced interviewers use to be more bold-faced and it could be a risk from quality point of view.
The study of indicators' trend and of the factorial analysis, too, lead us to individuate the necessity for a further investment in daily monitoring and in formalised training (i.e. briefing) during the survey.
Moreover, to avoid that interviewers could choice between non-contact and refuse as reason for non-response, whatever the interviewee does, automate coding after a phone call for “the line is busy”, “the number is ringing” and for “answering machine/fax” seems useful.
5.2. Interviewers effect on answers: check and prevention
About checks The role of the interviewers, as possible source of distortion of the survey’s results, can be
found, apart from their various ability to catch up and to interview the individuals that take part in the sample, also in their various ability to let emerge the information in a correct way through the interview. It is therefore extremely important to be sure that the interviewee's answers are not influenced from the strategies followed, being aware of it or not, by the interviewers.
In the case of "Citizens' Safety Survey" their various levels of ability and experience can affect, in various measure, the collection and the identification of crimes, eventually endured from the respondents, in the two screening sections. And this affection can determinate different number of crimes collected from an interviewer or another. Moreover, some interviewers can adopt a systematic strategy for not reporting crimes, in order to avoid going into details afterwards and, therefore, diminishing the interviews duration and, in this way, maximising the gain.
In order to verify the presence of an interviewers’ effect on the answers, we have taken into consideration the count of compiled sections of the questionnaire, that is equal to the number of different crimes endured. Since the sample has been randomly subdivided between the interviewers, the variability of such amount due to the interviewer would have to be very low. Actually, while the percentage of interviews in which no crime has been reported has turned out to be 15,6%6, this percentage varied among interviewers from 8,9% to 20,9%.
Applying to the count of compiled sections a Poisson model, where we have included a random effect7 that varies among interviewers but not among sample units belonging to the same 6 For interviewers that had been working in the survey for more than 20 days. 7 We assumed the random effect as normally distributed.
CD-21-2
interviewer, we have obtained an intra-interviewer correlation coefficient equal to 0.07 which, according to the actual literature indications, denotes the presence of an interviewer’s effect on screening sections. Such result seems to be coherent with the specificity of the questions that, regarding aspects like having or not endured some crimes, can imply a judgement and therefore can activate psychological mechanisms related to social desirability.
About error prevention in CATI questionnaires On CATI surveys repeated over time, it is possible to prevent errors of interviewers and
interviewees. In fact, through the study in-depth of the answers and behaviours of the interviewees in a survey at time t, it is possible to guarantee a greater quality of data in a survey at time t+1.
The definition of routes of homogeneous answers, their translation into logical rules, and the consequent preparation of hard or soft controls to be put online, or to be used as performance indicators among the daily monitoring, represent a sure strategy for limiting the discretionary power of the interviewers and checking the truthfulness of the answers of the interviewees.
This is possible through the reference to the theory of symbolic objects and, in particular, to the symbolic marking technique, which makes it possible to identify a group of individuals similar in behaviour as a symbolic object.
The phases to be carried on are the following: 1. Representation of the questionnaire with the routing graph; 2. Elaboration with symbolic marking; 3. Creation of the soft controls.
The software used for the symbolic marking elaboration is SPAD48. The first step is to transform the qualitative variables into factorial co-ordinates, through the
Multiple Correspondence Analysis (CORMU procedure); the second step is to search the groups using a hierarchical classification algorithm, based on Ward’s criterion (RECIP procedure). The third step is to cut the dendrogram appropriately, identifying the best division into classes. The fourth is to identify the symbolic markings for the classes derived from the classification. The fifth step is to repeat the markings on the modes, having identified the most significant connections. Lastly, these markings are transformed into logical rules.
Considering, for example, sexual harassment, which represents the first question of a block, the markings for the two modes, YES and NO, and their transformation in if-then terms are the following:
inconsistent path:
Pr{ [harassment = {NO}] ⇒ [work situation = {EMPLOYED}] ∧ .... ∧ [age = {<=54}] } = 0.10
consistent path: Pr{ [harassment = {YES}] ⇒ [work condition = {EMPLOYED}] ∧[distribution = {CENTRE}] ∧[crime risk = FAIR}]
∧ [age = {<=44}] } = 0.90
The use of this technique is very useful in identifying homogeneous behaviours among groups
of interviewees and in obtaining logical rules and consistencies from these observations. In this way
8 In SPAD4 the identification of the markings takes place with the MSCLA and MSMOD procedures through the
analysis of three parameters that control all at once: · the homogeneity within the class C (rec) · the difference from the complement of C (debor) · the strength of the bond between C and the markings (V-test on the hypergeometric distribution)
CD-21-2
it is possible to help the interviewers to acquire a greater awareness of what goes on during the survey-taking phase.
For example, facing a recurrence such as: women less than 45 years old who lives in central Italy, in crime risk areas, and employed have
a 90% probability of having been molested, the interviewer who receives in these situations a «NO, I have not been molested», will activate
a soft edit that will say, «this situation is very rare because…». The interviewer is able to check the correct typing of the code, the correct formulation and presentation of the question to the interviewee or, vice versa, the interviewee’s understanding of the question or, lastly, arrives, after these checks, at confirming the code because it is an anomalous, but real and correct situation.
Nevertheless, the online use of a great number of immediate checks conflicts with the actual processing capacity of the computer resources, since CATI, in addition to manage the questionnaire, also regulates the flow of the dynamics of the telephone survey, governing a huge reservoir of telephone numbers at the same time.
For this reason, critical attention must be paid in the choice of edits to be put online and those to be observed daily in the quality monitoring. The last option only makes possible the ex-post checking of the interviewers’ behaviour, because, even during the survey-taking phase, there is no interaction with the interviewee.
6. Conclusions
During our work we tried to separate the positive and the negative aspects of interviewers behaviours, enhancing their mistakes and their positive contributes, identifying what is due to their behaviours and what depend on interviewees and, finally, what is due to researchers. But reality is much more complex and thinking to disentangle shared responsibilities sounds quite as an artifice.
We can only recognise interviewers strategic role: as a matter of fact they are essential for survey quality, as shown before, they can create a vicious as well as virtuous circle. And the researcher's responsibility and ability is played also at these levels, in developing and preparing the best circumstances to help the interviewer's work.
References
Arkhipoff O. (1996), La qualité de l'information et sa precision, Colloque de l'ISEOR.
Bailar B., Bailey L., Stevens J. (1977), Measures of interviewer bias and variance, Journal of Marketing Research, Vol. XIV p. 337-343
Balbi S., Balzano S. (in printing), Controlli logici per indagini ripetute: l’indagine sugli sbocchi occupazionali dei laureati di Economia a Napoli (“Federico II”), CAPTOR 2000, Padova.
Balbi S., Balzano S., Bruzzese D. (in printing), Controlli concettuali: un confronto tra reticoli di Galois e marcaggio simbolico, DUQUAL 2000, Milano.
Balbi S., Verde R. (1998), Structuring Questionnaires as Symbolic Objects: a New Tool for Improving Data Quality in Surveys, in: Third International Meeting on New Techniques and Technologies for Statistics – Sorrento.
Campanelli P. (1995), New programmes of nonresponse research at SCPR, London.
CD-21-2
De Leeuw E. (1995), The effect of the interviewer on cooperation in a survey of the elderly, Paper presented at the 6th International Workshop on Household Survey Nonresponse, Helsinki.
General Social Survey Analysis Series (1990), Patterns of Criminal Victimization in Canada, Statistics Canada.
Fabbris L. (1991), Abbinamenti tra fonti d'errore nella formazione dei dati e misure dell'effetto degli errori sulle stime, Bollettino SIS n. 22, 1991.
Gettler-Summa M. (1992), Factorial axis interpretation by symbolic objects, 3éme Journées Numérique Symbolique – Université Paris Dauphine.
Gettler-Summa M. (1998), MGS in SODAS: Marking and Generalization by Symbolic Objects in the Symbolic Official Data Analysis Software, Cahier9935, Université Dauphine LISE CEREMADE – Paris.
Gettler-Summa M., Perinel E., Ferraris J. (1994), New automatic aid to symbolic class interpretation – New approach in Classification and Data Analysis – Springer Verlag 1994.
Gordon G. (1999), Il leader efficace, Raffaello Cortina, Milano.
Grassia M.G., Muratore M.G. (in printing), I controlli nei questionari CATI dell’indagine ISTAT sulla sicurezza dei cittadini, CAPTOR 2000, Padova.
Groves R.M. et al. (1988), Telephone Survey Methodology, New York, Yohn Wiley.
Hox J.J., De Leeuw E.D., Kreft I.G.G. (1991), The effect of interviewer and respondent characteristics on the quality of survey data: a multilevel model, Measurement Errors in Surveys, Edited by Biemer, Groves, Lyberg, Mathiowetz and Sundman, p. 339-461
Kish L. (1962), Studies of interviewer variance for attitudinal variables, Journal of American Statistical Association, 57, p. 92-115
Mucchielli R. (1987), Apprendere il counselling, Centro Studi Erikson, Trento.
Muratore M.G., Quattrociocchi L. and Sabbadini L.L. (in printing), Indagini sociali telefoniche: metodologie ed esperienze della statistica ufficiale, Istat, «Metodi e norme» series.
Muratore M.G., Sabbadini L.L. (1999), Molestie e violenze sessuali nelle indagini dell'Istat: metodologia, organizzazione, principali risultati, in: Proceedings of the Conference, Le famiglie interrogano le politiche sociali, Bologna, 29-31 March 1999, published on CD-ROM.
Nicholls W.L., Baker R.P., Martin J. (1997), The effects of new data collection technologies on survey data quality, in Lyberg L. et al. (eds), Survey Measurement and Process Quality, J.Wiley & Sons, New York.
Willenborg, L.C.R.J. (1985), Recognition of Records with a Correct Routing Structure, Internal Report (Netherlands Central Bureau of Statistics).
CD-21-3
Quality management of closed questions in a survey among the elderly
J.H. Smit Department of Sociology and Social Gerontology and Department of Psychiatry
Vrije Universiteit Amsterdam The Netherlands
Acknowledgement: This study is based on data collected in the context of the Longitudinal Aging Study Amsterdam (LASA), which is funded largely by the Ministry of Welfare, Health and Sports of the Netherlands.
Correspondence: Dr J.H. Smit Faculty of SCW/LASA Van der Boechorststraat 7 1081 BT Amsterdam email: [email protected]
1
CD-21-3
Since 1990, the concept of Total Quality Management is slowly finding its way in
survey research. The view that survey research can be described in terms of a
production process enables us to divide the process in different phases, where each
phase should meet certain quality norms in order to produce high quality data at the
end of the process (Biemer& Caspar, 1997). When we roughly divide the process in:
(1) design (sampling and questionnaire construction), (2) fieldwork (data collection)
and (3) data analysis and report, it is clear that quality management in phase 2 is
rather difficult when the fieldwork consists of face to face interviews at the
respondent's residence.
An important expedient for quality management during such a fieldwork is
taping the interviews with the purpose to evaluate the interaction between interviewer
and respondent. By evaluating the tapes, the fieldwork staff may obtain an impression
of the overall performance of interviewers and of the questions that cause problems
for (certain) interviewers and respondents. An obstacle however, for using tapes as a
quality control measure for closed questions is the fact that questions of which
response alternatives are presented on a show card are common practice in survey
research.
A necessary condition for evaluation of the quality of interviews with tapes is
that some interaction between interviewer and respondent occurs. By using show
cards such interaction is suppressed. A show card may reduce interviewer-related
mistakes by making the task for the interviewer less complex, compared with reading
out the response alternatives. However, it also reduces the opportunities for
interviewers to get hints from the respondent that a question is not well understood
and the chosen response alternative might not be a valid indication of the real quantity
one is trying to measure. Furthermore it also leads to less opportunities for the
2
CD-21-3
fieldwork staff to evaluate interviewer behavior and ambiguity of question content
(Zouwen, & Dijkstra, 1995). Therefore using show cards with closed questions is
certainly a trade off in terms of quality management.
Within the framework of the Longitudinal Aging Study Amsterdam 2276
elderly respondents (58-88 years of age) were interviewed and permission was asked
to tape each interview. Also a split ballot experiment was carried out in order to
explore the differences between the two alternative ways of presenting response
alternatives (1159 respondents with response alternatives on show cards versus 1117
with response alternatives read out). Furthermore it was explored whether certain
populations at risk could be identified for the existence of a difference between the
two alternative ways of presenting the response alternatives. In particular we were
interested in two concepts that might be related to the quality of survey data collected
in older populations.
The first concept is depression. Depression has a high prevalence rate among
the elderly. Worldwide the prevalence rates vary between 10 and 16 percent. In the
Dutch elderly population prevalence rates of 14% of (mild) depressive complaints are
found (Beekman et al. 1996). Depressive symptoms are related to lack of
concentration and a lack of motivation of the person and it is not unlikely that those
aspects could be linked to data quality and the way the response alternatives are
presented.
The second concept is cognitive capacity. It is known that when people age
their cognitive capacities tend to decline (Smit, Deeg & Schmand, 1997). However, in
survey interviews cognitive aspects play a very important role in the process of data
collection (Tanur, 1992). Understanding of the question, retrieval of the right
information, judging the answer and translating the answer into one of the offered
3
CD-21-3
response categories are all related to cognitive capacities (Sirken, et al., 1998). So
especially in surveys in elderly populations cognitive capacities may play an
important role in the gathering of data of good quality (Andrews & Herzog, 1986;
Herzog & Dielman, 1985; Schwartz, et al., 1999). To sum up this paper focuses on
three research questions:
1) Explore the compliance with tape-recording the interview as a quality
device.
2) Investigate by means of a split ballot experiment if there are
differences between two way of presenting the answer alternatives in
relation to data quality.
3) Investigate whether there are differences between two way of
presenting the answer alternatives in relation to cognition and
depression as risk factors for data quality.
Methods
Sample
The Longitudinal Aging Study Amsterdam Cohort was originally recruited for
the study ‘Living Arrangements and Social networks of Older Adults’ (Broese van
Groenou, 1995) and included a stratified random sample of men and women,
weighted according to expected mortality at midterm (after 5 years of follow-up) in
six birth-year categories (1908-1912, 1913-1917, 1918-1922, 1923-1927, 1928-1932,
and 1933-1937) obtained from the registries of 11 municipalities in three geographical
areas in the west, northeast, and south of the Netherlands. The initial sample was
meant to be representative for the Dutch population (Deeg, Knipscheer & van Tilburg,
1993).
4
CD-21-3
Of the 3107 persons who participated in the baseline interview in 1992-1993,
2545 (81.9%) respondents participated in the main interview at the second data
collection wave in 1995-1996 (Smit & de Vries, 1995; Smit, de Vries & Poppelaars,
1998). In this study we restrict ourselves to 2284 respondents who had a complete
face to face interview (261 respondents were interviewed with a short version most of
then by telephone. The Ethical Review Board of the Vrije Universiteit, approved the
study protocol
Data collection
During the face to face interview, 33 trained lay interviewers from the same area as
the participants administered a questionnaire that ascertained basic demographics,
health status, physical activity, cognitive functioning, depressive symptoms and
assessed the split ballot experiment involving two different questions. Within area’s
respondents were randomly assigned to the interviewers. The interviewers received a
five-day training program, in which standard interviewer techniques including role-
playing and a test interview. Computer Assisted Personal Interviewing procedures
were used to collect the data. For the split ballot experiment a special software
procedure was written so that each condition within the experiment was randomly
assigned to a specific interview. Beforehand neither the interviewer nor the
respondent was aware of the condition that would come up in the specific part of the
interview.
Instruments
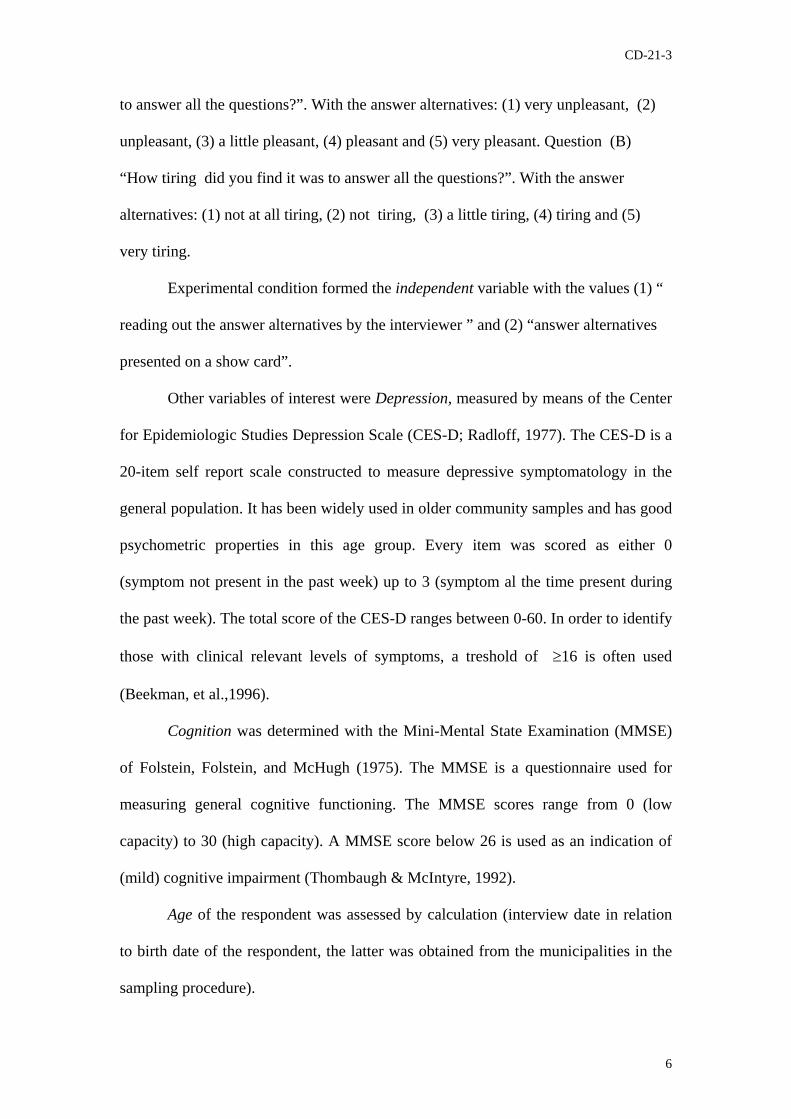
For de dependent variable the distribution of the responses of two questions that were
posed at the end of the interview were used: (A) “How enjoyable did you find it was
5
CD-21-3
to answer all the questions?”. With the answer alternatives: (1) very unpleasant, (2)
unpleasant, (3) a little pleasant, (4) pleasant and (5) very pleasant. Question (B)
“How tiring did you find it was to answer all the questions?”. With the answer
alternatives: (1) not at all tiring, (2) not tiring, (3) a little tiring, (4) tiring and (5)
very tiring.
Experimental condition formed the independent variable with the values (1) “
reading out the answer alternatives by the interviewer ” and (2) “answer alternatives
presented on a show card”.
Other variables of interest were Depression, measured by means of the Center
for Epidemiologic Studies Depression Scale (CES-D; Radloff, 1977). The CES-D is a
20-item self report scale constructed to measure depressive symptomatology in the
general population. It has been widely used in older community samples and has good
psychometric properties in this age group. Every item was scored as either 0
(symptom not present in the past week) up to 3 (symptom al the time present during
the past week). The total score of the CES-D ranges between 0-60. In order to identify
those with clinical relevant levels of symptoms, a treshold of ≥16 is often used
(Beekman, et al.,1996).
Cognition was determined with the Mini-Mental State Examination (MMSE)
of Folstein, Folstein, and McHugh (1975). The MMSE is a questionnaire used for
measuring general cognitive functioning. The MMSE scores range from 0 (low
capacity) to 30 (high capacity). A MMSE score below 26 is used as an indication of
(mild) cognitive impairment (Thombaugh & McIntyre, 1992).
Age of the respondent was assessed by calculation (interview date in relation
to birth date of the respondent, the latter was obtained from the municipalities in the
sampling procedure).
6
CD-21-3
Statistical Analyses
All analyses were conducted using SPSS software. The significance of differences
between the response distribution for the experimental conditions were tested using
analysis of variance (ANOVA). Possible interactions between the distributions and
condition and the other variables of interest were also tested with ANOVA were
interaction terms were included in the model.
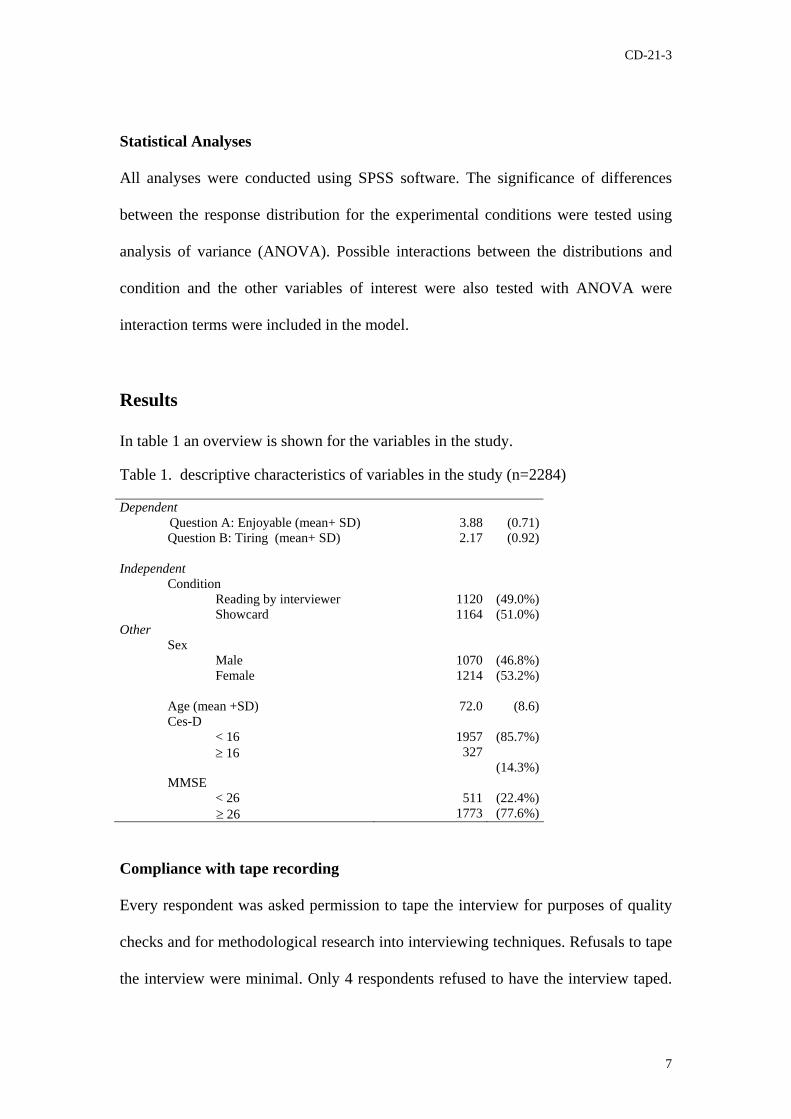
Results
In table 1 an overview is shown for the variables in the study. Table 1. descriptive characteristics of variables in the study (n=2284) Dependent Question A: Enjoyable (mean+ SD) 3.88 (0.71) Question B: Tiring (mean+ SD) 2.17 (0.92) Independent Condition Reading by interviewer 1120 (49.0%) Showcard 1164 (51.0%) Other Sex Male 1070 (46.8%) Female 1214 (53.2%) Age (mean +SD) 72.0 (8.6) Ces-D < 16 1957 (85.7%) ≥ 16 327
(14.3%) MMSE < 26 511 (22.4%) ≥ 26 1773 (77.6%)
Compliance with tape recording
Every respondent was asked permission to tape the interview for purposes of quality
checks and for methodological research into interviewing techniques. Refusals to tape
the interview were minimal. Only 4 respondents refused to have the interview taped.
7
CD-21-3
This figure has to be interpreted with some caution. The respondents were approached
in the context of a longitudinal study. The have been a participant in the study for
more than 5 years when approached for this particular data collection wave. Therefore
it is imaginable that these approached respondents have a very positive attitude
towards the research and its interviewers. Getting permission for taping the interview
is the first step for tapes to be a monitoring device for data quality. The second step is
to get tapes with good sound quality. In approximately 10 percent of the collected
tapes the sound quality was not good (background noise, too soft, technical failures).
Also, after an hour the interviewers should turn the tape in order to get the
second part of the interview also on tape (the interview lasted 1 hour and 45 minutes).
Interviewers tended to forget to turn the tape at an appropriate time so on a number of
tapes the first part of the interview finished abruptly in the middle of an assessment of
a specific instrument.
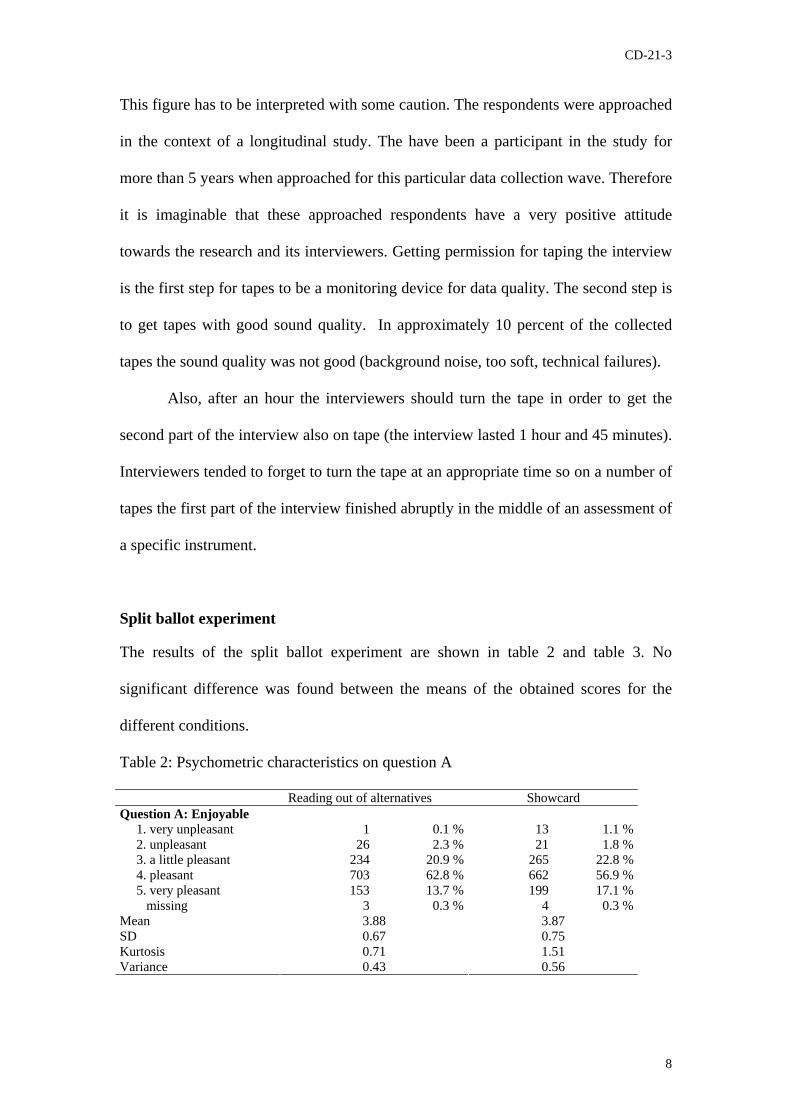
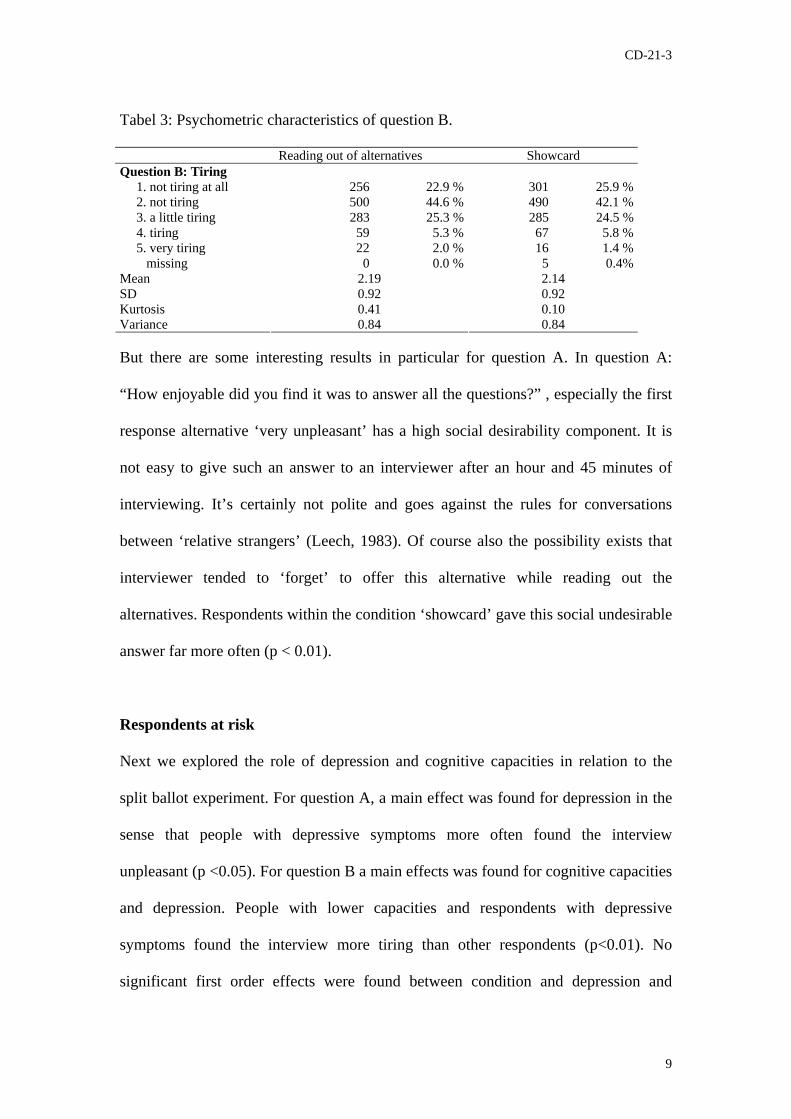
Split ballot experiment The results of the split ballot experiment are shown in table 2 and table 3. No
significant difference was found between the means of the obtained scores for the
different conditions.
Table 2: Psychometric characteristics on question A
Reading out of alternatives Showcard Question A: Enjoyable 1. very unpleasant 1 0.1 % 13 1.1 % 2. unpleasant 26 2.3 % 21 1.8 % 3. a little pleasant 234 20.9 % 265 22.8 % 4. pleasant 703 62.8 % 662 56.9 % 5. very pleasant 153 13.7 % 199 17.1 % missing 3 0.3 % 4 0.3 % Mean SD Kurtosis Variance
3.88 0.67 0.71 0.43
3.87 0.75 1.51 0.56
8
CD-21-3
Tabel 3: Psychometric characteristics of question B. Reading out of alternatives Showcard Question B: Tiring 1. not tiring at all 256 22.9 % 301 25.9 % 2. not tiring 500 44.6 % 490 42.1 % 3. a little tiring 283 25.3 % 285 24.5 % 4. tiring 59 5.3 % 67 5.8 % 5. very tiring 22 2.0 % 16 1.4 % missing 0 0.0 % 5 0.4% Mean SD Kurtosis Variance
2.19 0.92 0.41 0.84
2.14 0.92 0.10 0.84
But there are some interesting results in particular for question A. In question A:
“How enjoyable did you find it was to answer all the questions?” , especially the first
response alternative ‘very unpleasant’ has a high social desirability component. It is
not easy to give such an answer to an interviewer after an hour and 45 minutes of
interviewing. It’s certainly not polite and goes against the rules for conversations
between ‘relative strangers’ (Leech, 1983). Of course also the possibility exists that
interviewer tended to ‘forget’ to offer this alternative while reading out the
alternatives. Respondents within the condition ‘showcard’ gave this social undesirable
answer far more often (p < 0.01).
Respondents at risk
Next we explored the role of depression and cognitive capacities in relation to the
split ballot experiment. For question A, a main effect was found for depression in the
sense that people with depressive symptoms more often found the interview
unpleasant (p <0.05). For question B a main effects was found for cognitive capacities
and depression. People with lower capacities and respondents with depressive
symptoms found the interview more tiring than other respondents (p<0.01). No
significant first order effects were found between condition and depression and
9
CD-21-3
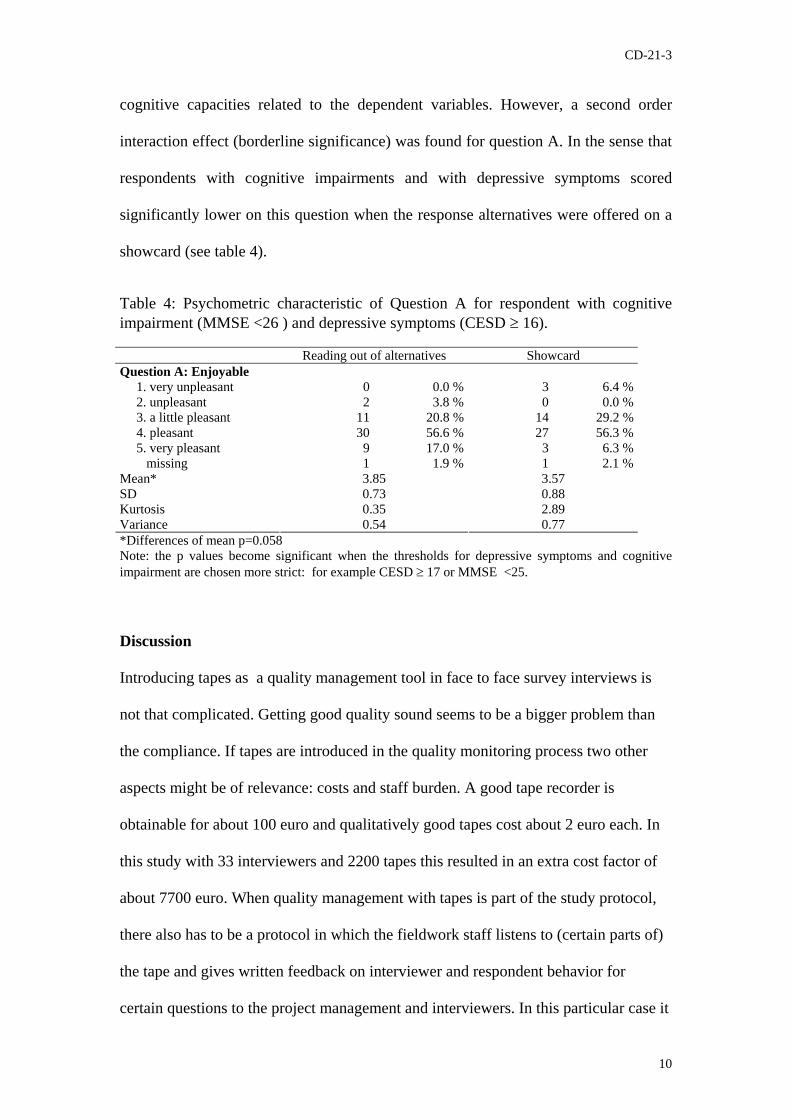
cognitive capacities related to the dependent variables. However, a second order
interaction effect (borderline significance) was found for question A. In the sense that
respondents with cognitive impairments and with depressive symptoms scored
significantly lower on this question when the response alternatives were offered on a
showcard (see table 4).
Table 4: Psychometric characteristic of Question A for respondent with cognitive impairment (MMSE <26 ) and depressive symptoms (CESD ≥ 16). Reading out of alternatives Showcard Question A: Enjoyable 1. very unpleasant 0 0.0 % 3 6.4 % 2. unpleasant 2 3.8 % 0 0.0 % 3. a little pleasant 11 20.8 % 14 29.2 % 4. pleasant 30 56.6 % 27 56.3 % 5. very pleasant 9 17.0 % 3 6.3 % missing 1 1.9 % 1 2.1 % Mean* SD Kurtosis Variance
3.85 0.73 0.35 0.54
3.57 0.88 2.89 0.77
*Differences of mean p=0.058 Note: the p values become significant when the thresholds for depressive symptoms and cognitive impairment are chosen more strict: for example CESD ≥ 17 or MMSE <25.
Discussion
Introducing tapes as a quality management tool in face to face survey interviews is
not that complicated. Getting good quality sound seems to be a bigger problem than
the compliance. If tapes are introduced in the quality monitoring process two other
aspects might be of relevance: costs and staff burden. A good tape recorder is
obtainable for about 100 euro and qualitatively good tapes cost about 2 euro each. In
this study with 33 interviewers and 2200 tapes this resulted in an extra cost factor of
about 7700 euro. When quality management with tapes is part of the study protocol,
there also has to be a protocol in which the fieldwork staff listens to (certain parts of)
the tape and gives written feedback on interviewer and respondent behavior for
certain questions to the project management and interviewers. In this particular case it
10
CD-21-3
meant the hiring of an extra (junior) fieldwork staff member for two days a week for 7
months.
With the split ballot experiment we investigated whether the trade off in
quality control when reading out the response alternatives versus the use of a
showcard was a matter of concern. Although previous studies have shown that
interviewers may manipulate the response alternatives they have to read out, are able
to help the respondents when problems with the questions or response alternatives
emerge. The data quality does not seem to be better when the fieldwork staff is able to
correct the interviewers by having access to the tapes. Probably the opposite is the
case, using showcards for presenting the response alternatives seem to result in data of
better quality especially when there is a social desirability bias in the response
categories.
Finally it showed that respondents with depressive symptoms and cognitive
impairment groups might be in risk of giving data of a different quality than others. It
is not yet possible to indicate whether the data quality is of better or worse. To have a
more appropriate indication of what is happening in the data gathering process for this
specific group we have to look at what exactly is happening in the interaction between
interviewer and respondent. Further research will focus on two approaches. First
extension of split ballot experiments in which more question with a different social
desirability bias are included. Second protocolising and behavior coding of the
question answer interactions for the group of respondents at risk in order to
investigate what is exactly going on while posing the questions.
11
CD-21-3
References
Andrews, F. M., & Herzog A. R.(1986). The quality of survey data as related to age
of respondent. Journal of the American Statistical Association. 81: 403-410.
Beekman ATF, Deeg DJH, Limbeek J van, Braam AW, Vries MZ de, Tilburg W van.
(1996). Criterion validity of the Center for Epidemiologic Studies Depression
scale (CES-D): results from a community based sample of older adults in the
Netherlands. Psychological Medicine, 27: 231-235.
Biemer, P., & Caspar, R. (1994). Continuous quality improvement for survey-
operations: Some general principals and applications. Journal of Offical
Statistics, 10 (3), 307-326
Broese van Groenou, M. I, Tilburg, T. G. van, Leeuw, E. D. de, Liefbroer A. C.
(1995). Data Collection. In: Knipscheer C. P. M, Jong-Gierveld, J. de, Tilburg,
T. G. van, Dijkstra P. A. (Eds). Living arrangements and social networks of
older adults. First results. Amsterdam: VU University Press,.
Deeg DJH, Knipscheer CPM, Tilburg W van. (1993). Autonomy and well-being in the
aging population. NIG overzichtsstudie nr.7. Bunnik: Netherlands Institute of
Gerontology
Folstein, M., Folstein, S., & Mchigh, P.R. (1975). Mini-Mental State: A practical
method for grading the cognitive state of patients for the clinician. Journal of
Psychiatric Research, 12, 189-198.
Herzog AR, Dielman L.(1985) Age differences in response accuracy for factual
survey questions. Journal of Gerontology: Psychological Sciences, 40: 350-357.
Leeach, G. (1983). The principles of pragmatics. London: Longman.
Radloff LS. (1977). The CES-D Scale: A self-report depression scale for research in
the general population. Applied Psychological Measurement, 3: 385-401.
12
CD-21-3
Rodgers WL, Herzog AR. (1987). Interviewing older adults: The accuracy of factual
information. Journal of Gerontology, 42: 387-394.
Schwarz, N., Park, D., Knauper, B., & Sudman, S. (1999). Cognition, aging and self-
reports. Sussex: Psychology Press.
Sirken, M. G., Herrmann, D. J., Schechter, S., Schwarz, N., Tanur K. M., &
Tourangeau. (1998). Cognition and Survey Research. New York: Wiley.
Smit J. H., Deeg D. J. H., & Schmand B. A. (1997). Asking the age question: a reverse
record check study. Journal of Gerontology: Psychological Sciences, 52b: 175-
177.
Smit, J. H., Vries MZ de, & Poppelaars, J.L. Data collection and fieldwork procedures.
(1998). In: Deeg D. J. H., Beekman A. T. F, Kriegsman D. M. W., &
Westendorp-de Serière, M. (Eds). Autonomy and well-being in the aging
population II. Amsterdam: VU University Press.
Smit J. H., & Vries M. Z. de. Procedures and results of the fieldwork. (1994). In: Deeg
D. J. H., Westendorp de Serière M (Eds). Autonomy and well-being in the aging
population. Amsterdam: VU University Press.
Tanur, J. M. (1992). Questions about questions: Inquiries into the cognitive bases of
surveys. New York: Russel Sage Foundation.
Tombough, T.N., & McIntyre, N.J. (1992). The Mini-Mental State Examination: A
comprehensive review. Journal of the American Geriatrics Society, 40, 922-
935.
Zouwen, J. van der., & Dijkstra, W. (1995). Trivial and non-trivial Question-answer
sequences: types, determinants and effect on data quality. Proceedings of the
international conference on survey Measurement and Process Quality, 81-86.
Alaxandria: American Statistical Association.
13
CD-21-3
Acknowledgement
The Longitudinal Aging study is primarily funded by the Department of Policies for
the Aging of The ministry of Health, Welfare and Sports, through a long term grant to
the Vrije Universiteit and Sports. LASA is conducted by the Department of Sociology
and Social Gerontology and the Department of Psychiatry at the Vrije Universiteit
14